what’s in a number? nps, effort and...
TRANSCRIPT
Customer feedback metrics - how to get the most from them Page 1
What’s in a number? NPS, Effort and CSAT
Customer feedback metrics - how they perform, what influences them (and what doesn’t), how best they can be applied and how to get the most from them.
Thomas Cowper Johnson, Director of Insight, ServiceTick
May 2014
Customer feedback metrics - how to get the most from them Page 2
Contents 1. Abstract 2. Acknowledgements 3. NPS, Effort and CSAT – a primer 4. The best metric for your business 5. Which metric is the most accurate? 6. Transactional vs relationship scores 7. Benchmarking 8. Combining feedback metrics and customer comments to prioritise actions 9. Payback - How feedback metrics can generate measurable return on investment 10. About ServiceTick This is one of a series of white papers about issues that companies encounter when they gather customer feedback. These papers are published on (and can be downloaded from) our website at www.servicetick.com.
If you have any questions, comments or suggestions for future white papers, please contact us on 01603 618326.
Customer feedback metrics - how to get the most from them Page 3
1. Abstract Business is increasingly focused on using customer feedback to improve customer experience. In pursuing this strategy companies have looked for a simple metric that can be deployed across the whole organisation. Net Promoter Score, Customer Effort and Customer Satisfaction all have their advocates who champion each metric in academic papers, publications and online fora.
Our contention is that this widespread debate has given rise to an excessive focus (often at board level) on the number itself with too little attention paid to what lies behind the number (the reasons why the number is high or low, goes up or down). In this paper we consider the factors that influence the measuring of NPS, Effort or CSAT and how to ensure consistency of data. We look at the issue of benchmarking and assess its value to an organisation. We identify the appropriate use of individual metrics and consider which is best for transactional and which is best for relationship scores. We conclude by focusing on how to generate maximum return on investment from the feedback process in three significant use cases: using customer feedback to support agent performance management; using key metrics to map and improve the customer journey process; using real-time feedback as the basis for effective customer recovery programmes.
2. Acknowledgements Thomas Cowper Johnson began his career in the research team of the London office of ad agency Doyle Dane Bernbach. After 14 years on the agency side of the fence he joined Norwich Union (now Aviva) where he established and ran their brand marketing team. He has since advised UK companies on their brand and customer strategies and is a founder director of ServiceTick Ltd.
ServiceTick is the leading solution for post-call IVR, web and email surveys in the UK, gathering immediate and actionable ‘voice of the customer’ feedback. ServiceTick is used many of Britain’s leading businesses to: gather objective feedback metrics that are used as the yardstick for call agent performance management and reward programmes; track and benchmark KPIs such as customer effort, NPS and customer satisfaction at key points of interaction on the customer journey; re-engage in real time with disenchanted customers to improve brand advocacy and reduce complaints.
Customer feedback metrics - how to get the most from them Page 4
3. NPS, Effort and CSAT – a primer
In this section we quickly recap the main points of NPS, Effort and CSAT. (If you’ve used these metrics in the past and understand how they work you can skip this section)
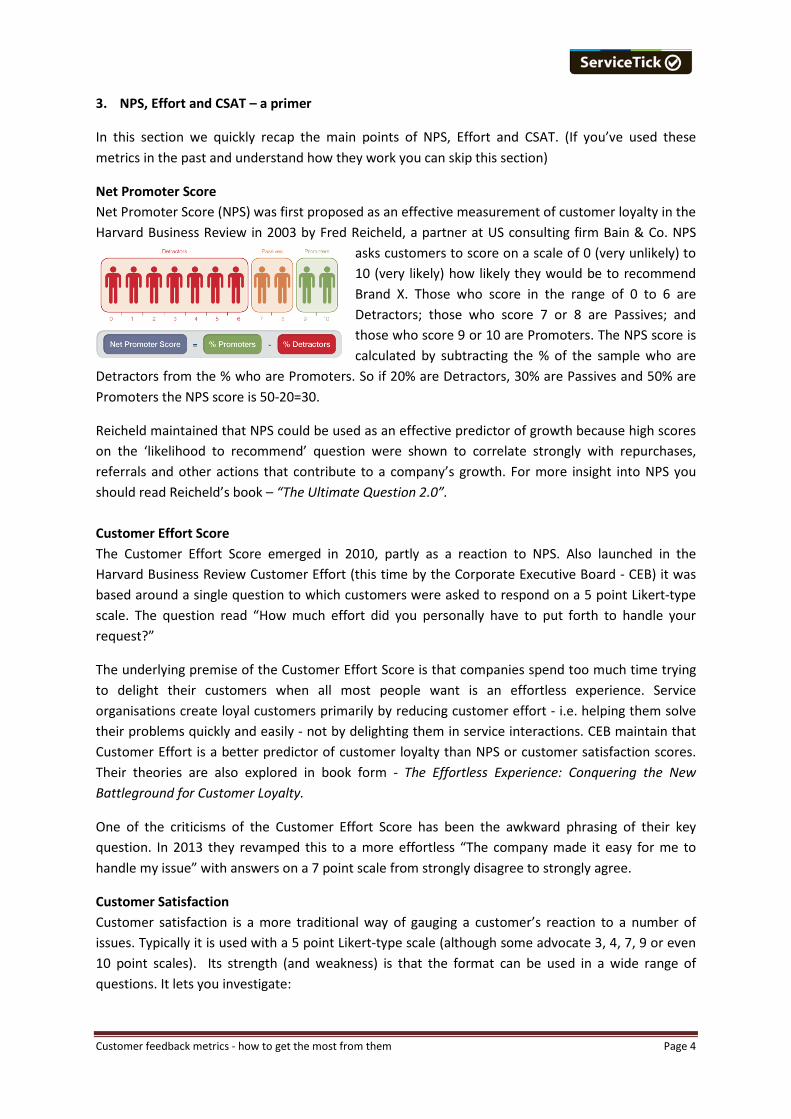
Net Promoter Score Net Promoter Score (NPS) was first proposed as an effective measurement of customer loyalty in the Harvard Business Review in 2003 by Fred Reicheld, a partner at US consulting firm Bain & Co. NPS
asks customers to score on a scale of 0 (very unlikely) to 10 (very likely) how likely they would be to recommend Brand X. Those who score in the range of 0 to 6 are Detractors; those who score 7 or 8 are Passives; and those who score 9 or 10 are Promoters. The NPS score is calculated by subtracting the % of the sample who are
Detractors from the % who are Promoters. So if 20% are Detractors, 30% are Passives and 50% are Promoters the NPS score is 50-20=30.
Reicheld maintained that NPS could be used as an effective predictor of growth because high scores on the ‘likelihood to recommend’ question were shown to correlate strongly with repurchases, referrals and other actions that contribute to a company’s growth. For more insight into NPS you should read Reicheld’s book – “The Ultimate Question 2.0”. Customer Effort Score The Customer Effort Score emerged in 2010, partly as a reaction to NPS. Also launched in the Harvard Business Review Customer Effort (this time by the Corporate Executive Board - CEB) it was based around a single question to which customers were asked to respond on a 5 point Likert-type scale. The question read “How much effort did you personally have to put forth to handle your request?”
The underlying premise of the Customer Effort Score is that companies spend too much time trying to delight their customers when all most people want is an effortless experience. Service organisations create loyal customers primarily by reducing customer effort - i.e. helping them solve their problems quickly and easily - not by delighting them in service interactions. CEB maintain that Customer Effort is a better predictor of customer loyalty than NPS or customer satisfaction scores. Their theories are also explored in book form - The Effortless Experience: Conquering the New Battleground for Customer Loyalty.
One of the criticisms of the Customer Effort Score has been the awkward phrasing of their key question. In 2013 they revamped this to a more effortless “The company made it easy for me to handle my issue” with answers on a 7 point scale from strongly disagree to strongly agree.
Customer Satisfaction Customer satisfaction is a more traditional way of gauging a customer’s reaction to a number of issues. Typically it is used with a 5 point Likert-type scale (although some advocate 3, 4, 7, 9 or even 10 point scales). Its strength (and weakness) is that the format can be used in a wide range of questions. It lets you investigate:
Customer feedback metrics - how to get the most from them Page 5
• Overall service experience – “How satisfied were you with your overall experience with Brand X?”
• Product – “How satisfied were you with Product Y?” • Pricing – “How satisfied were you with the prices you paid/were quoted?” • Personnel – “How satisfied were you with the way our agent treated you?” • Agent behaviours – “How satisfied were you with the knowledge of the agent you spoke to”
Unlike NPS or customer effort no one organisation owns Customer Satisfaction. It is a generic measurement tool that can be applied anywhere. For practitioners the key issue is which metric works best for your business.
4. The best metric for your business
Metrics such as Effort and CSAT and NPS have been developed to measure different aspects of customer experience and perception: Effort and CSAT have an obvious role to play in gauging customer response to a recent transaction or experience; NPS, recommending a brand, may take into account a much wider range of experience than just a recent transaction. Debating which of these is the best metric can be futile since each metric measures something different. Let me offer an example.
As a football fan I support Norwich City. I am loyal to the club. I go to watch them one Saturday, find it difficult to park, have to wait longer than usual for my half-time pie and the team turns in a dreadful performance. In this scenario my effort score would be low (prompted by the difficulty of parking and of getting my pie); my CSAT score would be low (because the team performed below expectations); but my NPS score would be high because I am fiercely loyal to the brand).
Many ServiceTick clients use a combination of NPS, Effort and CSAT to explore different aspects of the clients’ relationship with their brand.
Customer satisfaction – CSAT is best used when it is applied to a specific aspect of service. Questions like ‘How satisfied were you that the call agent was friendly & helpful/had the knowledge to help you/was able to resolve your query?’ can be used as the basis for measuring agent performance at individual level and rewarding agents accordingly. And questions like ‘How satisfied were you with the time you had to wait?’ can expose issues with process and provide quantified insight about what needs fixing.
Customer Effort – The effort question is great at surfacing issues with process. So if your brand relationship is heavily dependent on process and little else you should be measuring effort. This is why commoditised sectors such as financial services find it such a relevant measure. The only time we tend to think about our bank or insurance brand is when we transact with them; if they make that touchpoint difficult our view of the brand is impacted. So for us the question ‘How easy was it to do business with us/get your query resolved’ is a great way of mapping pinchpoints in the customer journey and identifying which processes need tackling first.
Customer feedback metrics - how to get the most from them Page 6
Net Promoter Score – NPS is a simple way of gauging the strength of the relationship between a customer and a brand. If someone is prepared to stake their own reputation with friends and family by recommending a brand it means they are well connected to it. But, as I’ve discussed earlier, as a number it’s pretty meaningless – you have to ask people to explain why they have given the score they have. That’s what drives the insight and allows you to react appropriately.
The key for any practitioner is to start with a clear set of objectives. Knowing what you want to measure will lead you to the right way to measure it:
• Use CSAT style questions to measure performance at agent level and identify process issues
• Use effort questions to iron out problems with delivery • Use NPS to gauge how warmly customers feel towards
your brand. 5. Which metric is the most accurate?
What characterises all these metrics is the drive to reduce the totality of customer experience to a single number. There is clearly benefit in a ‘one-number’ solution (easier for business-wide communication, employee engagement, board reporting) but there is also inherent risk. No matter how comprehensive the science behind the number it is still just a number and it encourages focus on a single score at the expense of the deeper and wider issues and trends behind the number.
The truth is anyone can create a higher NPS or Effort or CSAT score by manipulating the survey process, but CX professionals who chose to do this are only fooling themselves and their Board of Directors.
Feedback metrics (as with any research) are influenced by a range of different factors that can produce different results. These include: • Timing of the survey delivery - NPS in surveys delivered
immediately post call tends to be higher than in surveys delivered 48 hours after the transaction
• Survey methodology – you will get different results depending on whether you survey via IVR, email or SMS survey
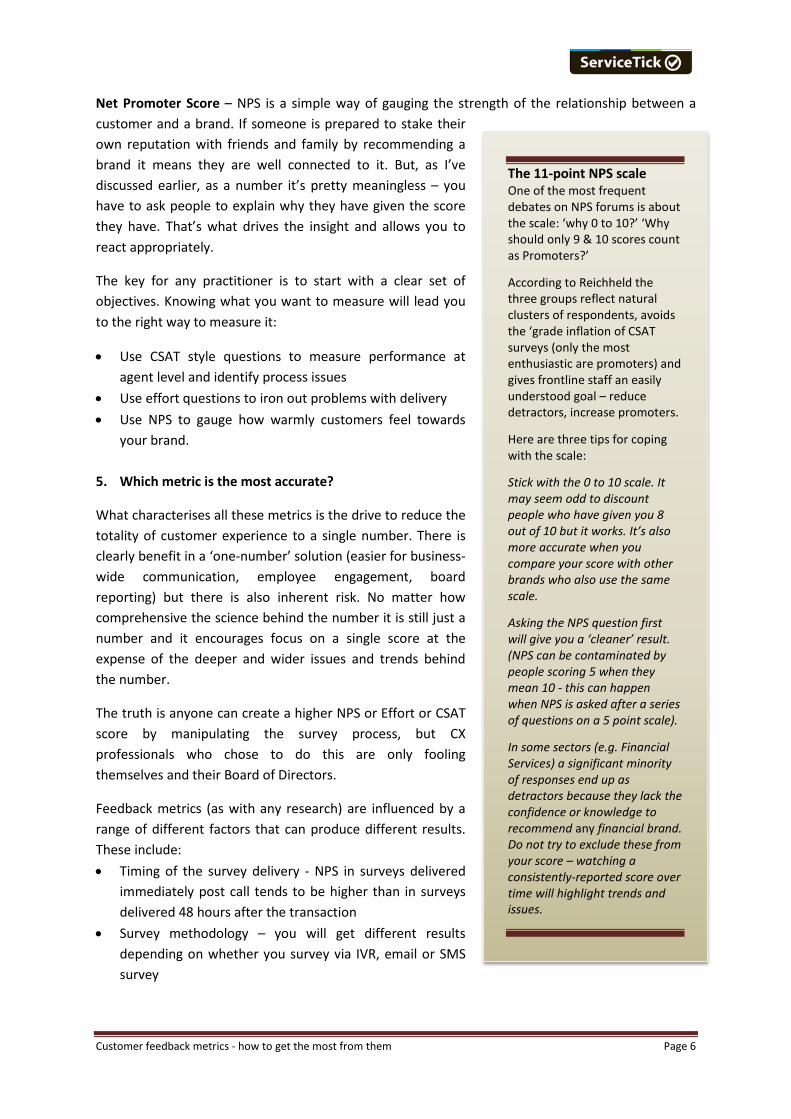
The 11-point NPS scale One of the most frequent debates on NPS forums is about the scale: ‘why 0 to 10?’ ‘Why should only 9 & 10 scores count as Promoters?’
According to Reichheld the three groups reflect natural clusters of respondents, avoids the ‘grade inflation of CSAT surveys (only the most enthusiastic are promoters) and gives frontline staff an easily understood goal – reduce detractors, increase promoters.
Here are three tips for coping with the scale:
Stick with the 0 to 10 scale. It may seem odd to discount people who have given you 8 out of 10 but it works. It’s also more accurate when you compare your score with other brands who also use the same scale.
Asking the NPS question first will give you a ‘cleaner’ result. (NPS can be contaminated by people scoring 5 when they mean 10 - this can happen when NPS is asked after a series of questions on a 5 point scale).
In some sectors (e.g. Financial Services) a significant minority of responses end up as detractors because they lack the confidence or knowledge to recommend any financial brand. Do not try to exclude these from your score – watching a consistently-reported score over time will highlight trends and issues.
Customer feedback metrics - how to get the most from them Page 7
• Survey structure – length of survey can influence the outcome as can the position of a question in a particular survey
• Wording of the question – it is possible to ‘lead’ a respondent to a more positive response
If this is the case, how can we tell which survey process will produce the most accurate response? The truth is that regardless of methodology or timing NPS scores are always accurate in that they accurately reflect the views of a customer using that channel at that particular point in time.
The key to getting the most out of any metric is to see it as a signpost, an indicator of how your brand, product, call centre team or call agent is performing over time. To do that you need both a consistent measurement process and to be able to identify the reasons why people have given the score they have. By measuring your key metric with the same question set, at the same point in the customer journey you will be able to accurately measure changes over time or differences between teams. And with an open-ended question you can swiftly identify why customers have given the scores they have. Armed with this information you can address the issues that need addressing and improve service performance and your key metrics.
6. Transactional vs Relationship surveys
We are often asked about the link between transactional and relationship surveys. First let’s clarify what we mean, using NPS as an example of a metric that might be measured by relationship or transactional surveys:
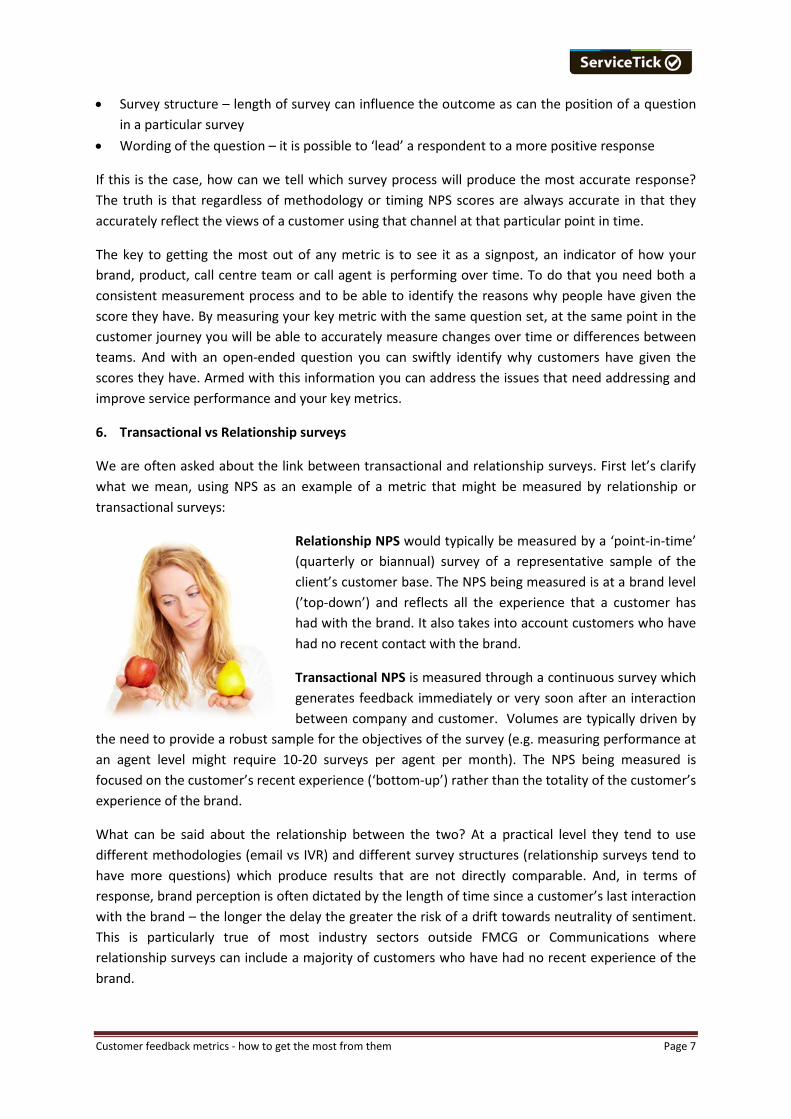
Relationship NPS would typically be measured by a ‘point-in-time’ (quarterly or biannual) survey of a representative sample of the client’s customer base. The NPS being measured is at a brand level (’top-down’) and reflects all the experience that a customer has had with the brand. It also takes into account customers who have had no recent contact with the brand.
Transactional NPS is measured through a continuous survey which generates feedback immediately or very soon after an interaction between company and customer. Volumes are typically driven by
the need to provide a robust sample for the objectives of the survey (e.g. measuring performance at an agent level might require 10-20 surveys per agent per month). The NPS being measured is focused on the customer’s recent experience (‘bottom-up’) rather than the totality of the customer’s experience of the brand.
What can be said about the relationship between the two? At a practical level they tend to use different methodologies (email vs IVR) and different survey structures (relationship surveys tend to have more questions) which produce results that are not directly comparable. And, in terms of response, brand perception is often dictated by the length of time since a customer’s last interaction with the brand – the longer the delay the greater the risk of a drift towards neutrality of sentiment. This is particularly true of most industry sectors outside FMCG or Communications where relationship surveys can include a majority of customers who have had no recent experience of the brand.
Customer feedback metrics - how to get the most from them Page 8
The key lies in the value that each of these surveys produces by way of actionable insight. We know (and have significant case-study evidence) that transactional surveys provide benefits of: • Immediacy – real-time feedback means you can fix issues swiftly or re-engage with dissatisfied
customers before they complain or spread negative word of mouth. You can also win back customers who might have decided to take their business elsewhere.
• Granularity – you can identify NPS at agent level and use it as an indicator of performance. This means you can benchmark service levels, identify top performers, clone best practice and even use it as the framework for reward and motivation
• Relevance - you get a hard measure of NPS based on recent experience of the brand • Tracking – you can see how your scores move in response to real-time events. For example an
insurance company scores would have been significantly different had they been probed just before the winter floods as opposed to just after.
By contrast Relationship survey responses are based on a perception of the brand that, for some respondents, has been eroded by the time elapsed since their last transaction. Relationship surveys do not offer the opportunity of real-time response to issues. Where these surveys come into their own is in building a complete view of your customers’ feedback. Because the sample tends to be representative of all customers it includes those with no recent experience. It is also easier to canvas views about competitor brands and derive benchmark scores for the sector.
7. Benchmarking – what constitutes good?
Benchmarks for key metrics are hard to come by. To our knowledge there are two organisations in the UK that publish scores across industries giving a snapshot of the state of NPS and CSAT in the UK and both offer headline data for free.
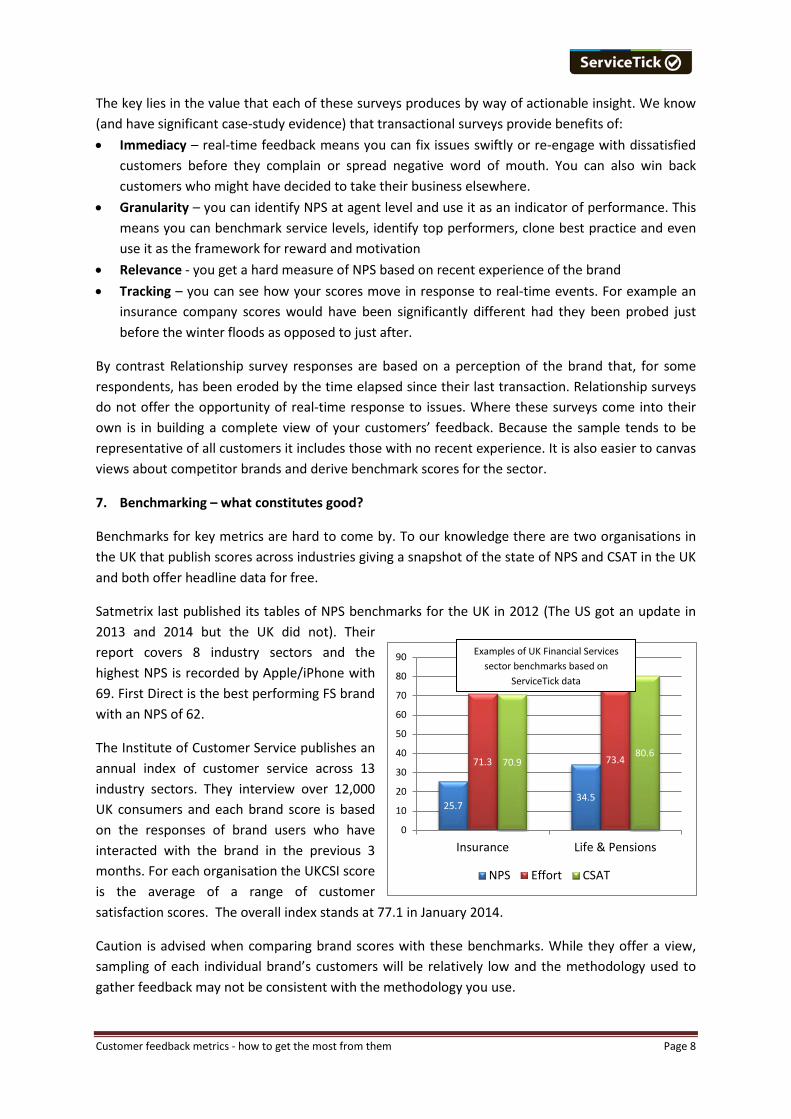
Satmetrix last published its tables of NPS benchmarks for the UK in 2012 (The US got an update in 2013 and 2014 but the UK did not). Their report covers 8 industry sectors and the highest NPS is recorded by Apple/iPhone with 69. First Direct is the best performing FS brand with an NPS of 62.
The Institute of Customer Service publishes an annual index of customer service across 13 industry sectors. They interview over 12,000 UK consumers and each brand score is based on the responses of brand users who have interacted with the brand in the previous 3 months. For each organisation the UKCSI score is the average of a range of customer satisfaction scores. The overall index stands at 77.1 in January 2014.
Caution is advised when comparing brand scores with these benchmarks. While they offer a view, sampling of each individual brand’s customers will be relatively low and the methodology used to gather feedback may not be consistent with the methodology you use.
25.7 34.5
71.3 73.4 70.9 80.6
0
10
20
30
40
50
60
70
80
90
Insurance Life & Pensions
NPS Effort CSAT
Examples of UK Financial Services sector benchmarks based on
ServiceTick data
Customer feedback metrics - how to get the most from them Page 9
ServiceTick produces a number of benchmarks for NPS, CSAT and Effort based on IVR and email surveys (the scores differ). In our experience an NPS score above 30 is OK (though there is always room for improvement); anything below 10 needs serious attention. For Effort a top-box score on a 5-point scale (i.e. the % of your sample saying ‘Very easy’) should be above 70% for best practice. Having said this, scores will differ depending on sector and journey touchpoint.
Of most benefit to any business is the tracking of its own scores over time and across touchpoints. Trends will highlight issues and improvements. By interrogating open-ended comments companies will quickly understand why customers have scored as they have. Only by understanding the reasons behind a particular score will you know what you can do about it.
8. Combining feedback metrics and customer comments to prioritise actions
One of the downsides of too much data is that companies become so focused on analysing the numbers that they fail to implement the obvious actions suggested by the research or feedback process. The issue can lie in the fact that those responsible for driving actions from insight are often seeking a ‘big’ solution from the ‘big’ data when ‘sweating the small stuff’ will provide immediate benefits and lead to a longer and deeper improvement. Here are some examples of the ways in which our clients strengthen the relationship with their customers by responding to feedback
Closing the feedback loop. Low scores and keywords in surveys can be used to trigger alerts directed to specified individuals in your company. By responding to these with a customer or service recovery initiative you can identify the root cause of customer frustration and reduce complaints, create advocates and win-back business. Customers appreciate the fact that their feedback has been heeded. In some industry sectors service expectations are so low that responding to negative feedback has a disproportionate effect on customer loyalty. One of our clients saw a 300% increase in brand advocacy among customers whose negative feedback was responded to. ‘Quantified qualitative’ research. One of the great benefits of newer research methodologies such as email or IVR surveys is their ability to combine qualitative and quantitative aspects of feedback. In the past qualitative research was carried out in a small number of focus groups where fewer than 100 respondents provided an in-depth view of issues. These would subsequently be ratified by large-sample surveys. With IVR and email surveys respondents give single-score and free-form responses in the same survey leading to significant volumes of free-form customer response. The free-form responses can be very detailed (I once read a 325 word response in an email survey) and by grouping them together by theme can offer a comprehensive view of issues that need to be addressed. Prioritising action from insight. Coding customer comments will give you a sense of the frequency of comment but this does not necessarily equate to the urgency with which these issues should be addressed. For example, your feedback programme may be telling you that a lot of your customers don’t like your call wait music and a few of your customers resent the IVR journey they have to make before talking to a live voice. Based on frequency of comment you would rightly believe that the call wait music is the issue that needs fixing most urgently. But by analysing the sentiment behind the numbers in your survey and indexing this with each type of comment you might discover that the people who complain about the music are not overly upset by it; whereas those who resent the IVR
Customer feedback metrics - how to get the most from them Page 10
find it so distasteful that they might end up taking their business elsewhere. In this scenario it is the IVR journey that needs fixing. Linking feedback data to actual customer behaviour. One of the great strengths of the new generation of feedback technologies is their ability to link each element of feedback to an individual customer. By cross-tabbing feedback scores with purchase data companies can place a financial value on the metrics they measure and analyse. Creating a link between feedback and behaviour strengthens the case for strategic initiatives that are identified as a result of the feedback. 9. Payback - How feedback metrics can generate measurable return on investment
In this final chapter we review some of the ways in which companies have used feedback to fundamentally influence business strategies and generate quantifiable return on investment. Agent performance. In recent years we have seen a number of high-profile cases of companies being fined for mis-selling of products. This has been driven by the practice of rewarding employees on the basis of the number of sales they make. Regulatory pressures (and, in some cases, enlightened business leaders) have pushed companies to seek alternative means of motivating their staff and many are switching to service-focused models using customer feedback to measure and reward agent performance. The low-cost and immediacy of post-call IVR surveys mean they are ideally suited to generating service performance scores at an individual agent level. Company-wide ‘voice of the customer’ programmes can gather sufficient volumes of feedback to ensure robust samples for each agent in any given month. Mapping the customer journey. Some companies use post-transaction surveys to map and identify process pinch-points across the customer journey. By building a ‘listening framework’ of channel-specific surveys they gather feedback at key points in the customer journey (new business, service, renewal, claims) and use the insight to map their performance from a customer perspective. This feedback allows them to plot the customer journey from a customer perspective, to identify where log-jams occur, to understand the reasons why they happen and prioritise the order in which they should be remedied.
The business value of responding to feedback
A number of our clients have shared with us the return on investment they make from their feedback programmes:
Client A increased their NPS by 130% following improvements implemented as a direct result of feedback.
Client B won-back a significant investment portfolio after they re-engaged with a customer who had failed to get the information they sought on first call and had left feedback highlighting the issue.
Client C estimates a multi-million pound return from changes in process as a direct result of using feedback to re-think skilling strategies and shift patterns.
Customer feedback metrics - how to get the most from them Page 11
Managing multi-channel strategies. Feedback surveys can help to identify the channels that customers use to interact with a brand. Simple questions about the number of times they have called or whether they went online first can be cross-tabbed with NPS and effort scores to identify major frustrations in the access process. Surveys can even be used to quantify the frustration caused by excessive call wait times, lengthy IVR processes or excruciating hold music! Modifying product strategies. Some of our clients use post-call IVR surveys to analyse the key drivers in product purchase and identify the most prevalent barriers to purchase. Data from feedback surveys has allowed them to put together a compelling business case that has led to changes in the way products are structured and marketed. When the numbers do matter. Sometimes the numbers really do matter. Sometimes companies are already aware of issues from anecdotal evidence but have no inkling of the scale or intensity of the issue from the customer perspective. Using feedback can add weight and credibility to product and process issues that move them from the fringe to centre-stage. More importantly the quantified data can prove to be the vital ingredient in the business case that leads to board-level visibility and engagement. Some useful links:
Customer Satisfaction Index www.instituteofcustomerservice.com/10560/UK-Customer-Satisfaction-Index---UKCSI.html NPS Benchmarks www.netpromoter.com/why-net-promoter/compare/
ServiceTick white papers www.servicetick.com/download/
Customer feedback metrics - how to get the most from them Page 12
About ServiceTick ServiceTick is the leading solution for post-call IVR, web and email surveys in the UK, gathering immediate and actionable ‘voice of the customer feedback’. ServiceTick is used many of Britain’s leading businesses to: • gather objective feedback metrics that are used as the yardstick for call agent performance
management programmes • track and benchmark KPIs such as customer effort, NPS and customer satisfaction at key points
of interaction on the customer journey • re-engage in real time with disenchanted customers to improve brand advocacy and reduce
complaints.
In 2014, ServiceTick was named in the Everline Future 50, the definitive list of the fifty most disruptive new British businesses that are triggering change in their markets.
Seebohm House, 2-4 Queen Street, Norwich, NR2 4SQ, UK +44(0)1603 618326 www.servicetick.com