what makes social responsibility financially valuable? · what makes social responsibility...
TRANSCRIPT
1
What Makes Social Responsibility Financially Valuable?
S. Katie Moon and Onur Kemal Tosun*
September 14, 2016
ABSTRACT We examine what aspect in socially responsible corporations makes those firms financially valuable.
We propose an explanation based on the influence of Socially Responsible Investment (SRI) funds
on the firms with higher Corporate Social Responsibility (CSR). We show that improvement only in
the labor relations area of a firm’s CSR is associated with the improvement of the firm’s
performance, only when SRI funds at the same time increase their ownership in the firm. Specifically,
we find that the increased influence of SRI funds over firms with good employee relation increases
ROA by 10.2%. Our findings are consistent with the enhanced employee motivation leading to the
real performance increase by the interplay with SRI funds’ involvement. We find the joint impact of
employee CSR and SRI influence on firm performance is more pronounced in human capital
intensive industries.
*The University Colorado Boulder, and the University of Warwick, respectively. Moon can be reached at
[email protected], and Tosun can be reached at [email protected]. We thank seminar participants at the
University of Warwick and 2016 Financial Management European Conference. Any remaining errors are ours alone.
2
1. Introduction Corporate social responsibility (CSR) refers to voluntary business actions by companies to improve
the economic, social, environmental conditions of local communities. In the age in which social
value is one of the most important concerns of consumers, CSR is often regarded as corporate
initiatives that draw consumers with strong CSR concerns to the business. However, recent examples
show that CSR is also related to various financial issues including financing strategy. For example,
an increasing number of companies in the U.S. have raised funds through crowdfunding1 over the
past few years. The crowfunding statistics indicate that such companies have more socially-positive
management and target markets that care about sustainability and social issues than traditional
companies. Socially-positive corporate agendas often present in younger companies, but are not
limited to them. A number of large and matured companies also have made CSR the core of their
operations. For example, Toms Shoes is a company with high CSR from the initiation of its business
that donates one pair of shoes to a child in need for every pair a customer purchases. Microsoft
Corporation is another notable example of a company with high CSR that especially focuses on
employee relations and believes its CSR efforts can attract talented workers. In their 2014 corporate
citizenship report, Microsoft reports “86 percent of employees polled said they would recommend
Microsoft as a great place to work. The percentage of women in our global workforce grew from 24
to 28 percent and the percentage of Microsoft senior executive women and minorities increased from
22 to 27 percent.” Importantly, these CSR practices are highly heterogeneous across firms and also
firm years, and thus provide good power to examine differential effects of the CSR on variable
financial variables.
1 Crowdfunding is the collection of finance from the “crowd” to fund an initiative and usually occurs on
internet platforms. The initiative could be a nonprofit, political, charitable, commercial or financing campaign
for a startup company.
3
Engaging in CSR practices often improves firm reputation and loyalty of socially conscious
stakeholders. Through the stronger relations with such stakeholders including customers, employees
and investors, either financial or real performance of socially responsible firms may increase.
Although there is an extensive literature that examines the possible link between CSR and firm
performance, the empirical result from the prior literature is mixed. Bragdon and Marlin (1972),
Parket and Eilbirt (1975), Cochran and Wood (1984), and McGuire, Sundgren, and Schneeweis
(1988) show a positive relation between CSR performance and accounting performance.2 Edmands
(2012) uses stock returns to explain the influence of CSR on firm value, and shows CSR increases
stock returns. Albuquerque, Durnev, and Koskinen (2014) model CSR activities as an investment in
customer loyalty and find that CSR practices increase firm value. Karakas, Dimson, and Li (2014)
focus on CSR engagements with U.S. public companies and find that after successful engagements
especially on environmental and social issues, firms experience positive abnormal stock returns and
improved accounting performance. Anderson, Hyun, and Warsame (2013) investigate relations
between CSR, earnings management and firm performance using a Panel Vector Auto Regression
model before and after the Sarbanes-Oxley (SOX) Act. Their findings indicate that there is no
relation between CSR and firm performance during the pre-SOX period, but a positive influence of
CSR on firm performance after SOX. Nelling and Webb (2009) examine the causal relation between
CSR and performance. They show that stock market performance leads to firm investment in CSR,
but CSR activities do not affect financial performance. Guili and Kostovetsky (2014) use political
views of firms’ stakeholders to explain firm CSR activities and show that CSR is negatively
associated with stock returns and accounting performance.
We note that the previous literature mainly focuses on the effect of overall degree of CSR by
each firm on the firm’s performance rather than the different effects of the different types of CSR.
2 The meta-analyses of Roman, Hayibor, and Agle (1999) and Margolis and Walsh (2003) show that majority
of academic work provide evidence for a positive relationship between CSR and financial performance.
4
Our study takes it into consideration that the key stakeholders for each CSR area are different and
thus the effect of each CSR on firm performance will vary. Baron (2008) and Edmands (2012) show
that good relations with employees improve employees’ motivation and contribution through which
firm productivity and value increase. Bauman and Skitka (2012) also examine how CSR impacts
employees, and in return how the affected employees contribute to the success of their company.
Based on these findings, we predict that improving “Employee Relations” of CSR, the key
stakeholders of which are the firm’s own important human capital, is more likely to be associated
with better performance of the firm than any other CSR area.
Although a corporate agenda for implementing better labor relations might be a necessary
condition for performance improvement, it would not be sufficient as long as those CSR practices do
not become a regular and essential schedule of the firm. Therefore, we further suggest that potential
thrust from external sources such as institutional monitoring from SRI funds will guarantee those
employee-related CSR becomes an abiding corporate culture or policy. Tosun (2015) shows that SRI
mutual funds with a focus on a specific CSR issue increase or decrease their ownership in firms
according to the firms’ CSR scores in that particular issue, and then monitor the firms via
shareholder advocacy and voting rights.3 Hence, we hypothesize and find that improved employee
relations in firms result in higher firm performance only when such CSR practices are properly
implemented under the watch of SRI funds with their increased influence on those firms.
Cheng, Hong, and Shue (2013), however, find that improved monitoring leads to a decline in
firm goodness implying that CSR can be viewed as a result of agency problem. While their model
and empirical analysis focus on monitoring and corporate governance in general, we particularly
focus on monitoring by socially responsible institutional investors and the effect of CSR on
3 Tosun (2015) shows that on average 80% of SRI mutual funds engage in shareholder advocacy and monitor
firm policies using a shareholder advocacy measure by Nofsinger and Varma (2014). We provide the detail of
shareholder advocacy by SRI mutual funds in our sample between 2003 and 2012 in Figure A.1 in Appendix.
5
performance under SRI influence. Consistent with Cheng, Hong, and Shue (2013), we find CRS
areas, except employee relations, can be unproductive CSR where managerial private benefits may
exist. Considering the employee relations, however, we find different evidence that it is productive
CSR, when monitoring by institutional investors who particularly seek to enhance employee
motivation as well accompanies.
We classify SRI funds into the following categories based on their investment policies: All,
Employee, Society, Environment, and Governance. Then, for each CSR area of interest, we measure
the impact of funds’ investment on the change in firm performance as measured by the return on
asset (ROA). We find a significant and positive improvement in firm performance only for the group
of firms with higher CSR scores in employee relations and increased SRI fund investment. When we
exclude potential monitoring effects from SRI funds by only considering the firm CSR score for each
area in our tests, we do not find any impact of CSR on firm performance, which is consistent with
the mixed findings in the previous literature.
We consider stock returns as another measure for firm performance. Supporting our results
on ROA, we find increased SRI influence via higher ownership in the firms with higher employee
relations is significantly associated with higher stock returns as well. We note that the increased SRI
ownership and the increased firm performance might be endogenous. Thus, we mitigate this concern
by a subsample analysis in which firms are carefully matched on firm characteristics in all observed
aspects but differ only in one dimension: whether there is an increase in SRI fund investment in the
firm. In this more refined test, our original results remain strong.
We also consider other possible factors that might influence firm performance. First, we
separately examine the period of the recent financial crisis from 2007 to 2009 for its possible effect
on firm performance. Second, we include other employee related factors such as the total number of
employees, the change in employee numbers, and the employee turnover in our analyses. Our results
are robust to considering these factors. In addition, we examine the influence of different industries
6
on the relationship between SRI, CSR and firm performance. We repeat our analysis for each of the
10 Fama-French industry sectors and show that the results are stronger in the industries where human
capital and thus, employee motivation plays an essential role in operations: Manufacturing
(particularly, high-tech manufacturing), Leisure, Construction, and Service industries.
Our paper makes several contributions. First, we show that not every CSR is financially
valueless, whereas not every CSR is financially valuable as well. We illustrate the specific area of
CSR (i.e. employee relations) that is associated with the potential firm performance improvement.
Second, we provide a new explanation to the effect of CSR on the firm performance through the lens
of SRI fund influence. SRI monitoring is one of the important factors that need to be considered to
analyse the relation between CSR and firm performance. Lastly, our paper contributes to
understanding in which specific industries CSR has more pronounced financial impact in addition to
its social impact.
The remainder of this paper proceeds as follows. In Section 2, we explain our data and
variables. Section 3 presents summary statistics and discusses univariate analyses. Section 4 presents
our empirical methodology for examining the effect of CSR and SRI mutual fund investment on firm
performance. Section 5 provides main results and further analyses for robustness. Section 6
concludes.
2. Data Selection and Variable Construction
2.1. Corporate Social Responsibility (CSR) Variables
We collect the data from the Kinder, Lydenberg, and Domini database (KLD) for the time period
between 2003 and 2012 because the coverage of the KLD database prior to 2003 is not complete.
KLD classifies its own CSR scores into seven major issue areas (Community, Corporate
Governance, Diversity, Employee Relations, Environment, Human Rights, Product) and six special
issue areas (Alcohol, Firearms, Gambling, Military, Nuclear Power, Tobacco). Each major area has
7
sub-criteria of either Strength or Concern. Each firm is assigned one point if the firm satisfies the
criterion, and zero point otherwise. There are 56 Strength and 59 Concern criteria in KLD.
In this paper, we focus on five groups of KLD areas. First, we combine all areas and create
“All KLD Level”, which is constructed by taking the difference of the total accumulated points for
CSR Strength and CSR Concern criteria. The second group, “Employee KLD Level” focuses on the
employee and human relations, which is the difference between the total points for CSR Strength and
CSR Concern in the KLD areas of Employee Relations and Human Rights combined. The next group
is a combination of four major areas in KLD: Community, Diversity, Employee Relations, and
Human Rights. We label this group as “Society KLD Level”. “Governance KLD Level” and
“Environment KLD Level” groups consider the corporate governance and environment areas of KLD,
respectively. All these groups are constructed analogously as previously described. Also, we use the
changes in these KLD Level measures over time. “Δ All KLD” is the difference between the values
of All KLD Level in a given year and the prior year. Similarly, we construct Δ Employee KLD, Δ
Society KLD, Δ Governance KLD, and Δ Environment KLD.
2.2. Socially Responsible Investments (SRI) Mutual Fund Variables
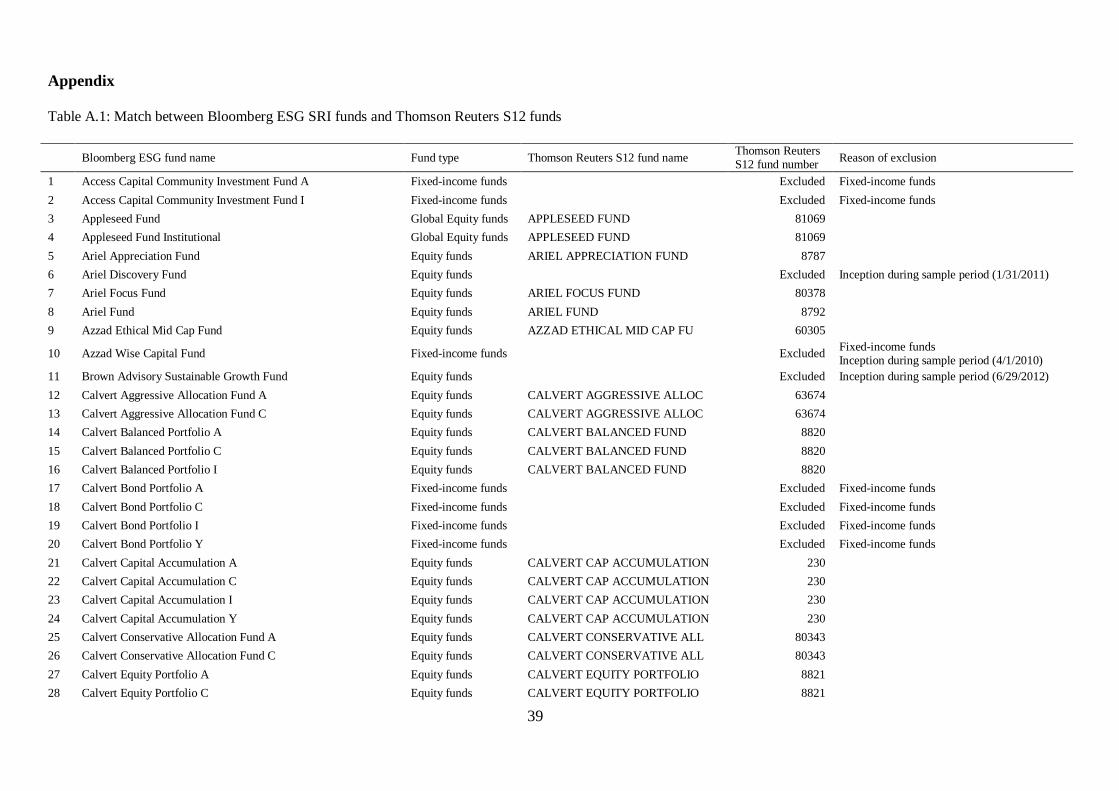
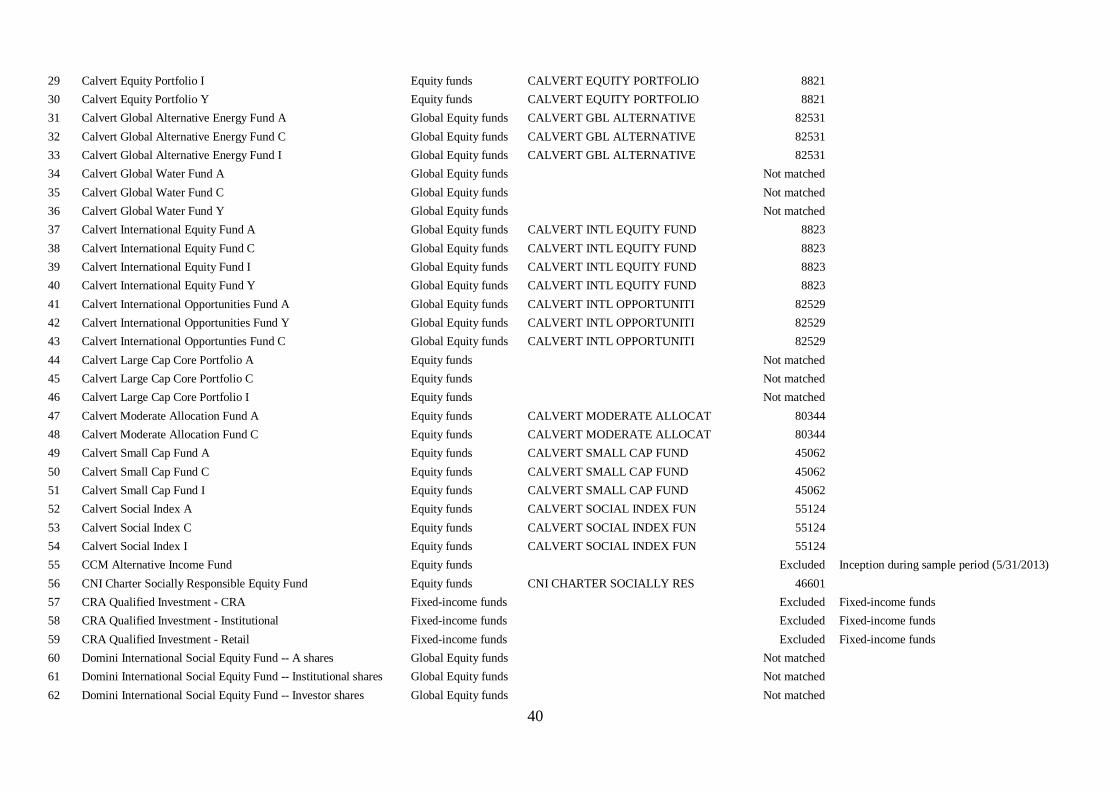
We collect SRI mutual fund data from the US SIF (The Forum for Sustainable and Responsible
Investment) website.4 The data for 146 SRI mutual funds on the website are originally provided by
the Bloomberg's Environmental, Social and Governance (ESG) Service. It lists the funds along with
their screening and advocacy criteria for investment. Each SRI mutual fund as a member of US SIF
is evaluated by those criteria. The survey is up-to-date as of December 2015, and it is backward
looking. We compare the sample of 146 SRI mutual funds to the Thomson Reuters’ S12 holding data,
and obtain 47 unique equity funds using fund names. We lose most of the funds due to our focus on
equity SRI funds only and redundant fund names in the SRI mutual fund list. Our final count of SRI 4 The website is available at http://charts.ussif.org/mfpc/.
8
mutual funds in our sample is 32, by merging the 47-fund sample to the CRSP fund returns data.5
As main independent variables of interest, we use the following five dummy variables. First,
we take the difference in a SRI fund's ownership in a firm between a given year and the prior year.6
Then for each firm in the given year, we take the sum of the ownership differences between the
given year and prior year by all investing SRI funds. Finally, we define “Ownership Increase
Dummy (OID)”, which equals one if the sum of the ownership differences is positive, and zero
otherwise. For “Increased Ownership-Employee Dummy (OID-Emp)”, we first determine the SRI
funds that are more responsive to the changes in that firm’s Employee KLD Level than to any other
KLD level changes.7 Then, we take the sum of the ownership differences only by those employee-
focused funds for each firm between a given year and the prior year. Increased Ownership-Employee
Dummy for the firm equals one if the sum is positive, and zero otherwise. Analogously, we calculate
“Increased Ownership-Society Dummy (OID-Soc)”, “Increased Ownership-Government Dummy
(OID-Gov)”, and “Increased Ownership-Environment Dummy (OID-Env)” with respect to the SRI
mutual funds’ responsiveness to these different CSR areas.
Another important variable is “Δ Fund Ownership”, which we use in a fixed effects panel
regression model that determines the SRI funds’ responsiveness to a specific CSR area. Δ Fund
Ownership is the difference of fund ownership for a firm between a given year and the prior year.
For fund-related control variables, we include “Fund Return” and “Fund Size” in our regression
analyses. Fund Return is the annual average of a fund’s monthly returns in percentage terms.
Monthly return is calculated by dividing the net asset value difference between a given month and
the prior month, by the net asset value of the prior month. Fund Size is the annual average of a fund’s
monthly net asset values in million dollars.
5 The detailed lists of Bloomberg ESG funds and our SRI funds after matching with Thomson Reuters S12 database are available in Appendix Table A.1. 6 The variable includes ownership changes from zero to positive or negative. 7 We explain how we define responsiveness of a given SRI fund to a specific CSR area in Section 4 in detail.
9
2.3. Firm Performance and Control Variables
We obtain our data for firm performance and firm control variables from COMPUSTAT and CRSP
databases. GDP and Nasdaq index return data are from the Bureau of Economic Analysis (BEA) and
CRSP, respectively. Firm performance is the return of assets (ROA) that is calculated as a ratio of
earnings before interest and taxes (EBIT) over total assets. We use the change in ROA between a
given year and the following year in our analyses. GDP Growth is the natural logarithm of real GDP
in a given year divided by its lagged value. For control variables, we use one year lagged value of the
following: Firm Size is the natural logarithm of total assets; Leverage is the ratio of the sum of debt
in current liabilities and long-term debt over total assets; M/B is the Market-to-Book ratio, calculated
via (Common shares outstanding * closing price) / total assets; CAPX/Sales is the ratio of capital
expenditures over sales; R&D/Sales is the ratio of research and development expenses over sales;
Cash/Assets is the net cash holdings over total assets; Return Volatility is the standard deviation of
monthly stock returns; Dividend is calculated via dividend payments / (Common shares outstanding
* closing price); HHI is the Herfindahl measure for industry concentration that is computed via the
Text-based Network Industry Classification method as suggested by Hoberg and Phillips (2010). To
better capture business cycle conditions, we include two frequently used macroeconomic variables,
GDP Growth and Nasdaq Return. Nasdaq Return is the annual return of the Nasdaq index using the
first and last months’ adjusted close prices in a given year.
2.4 Final Sample and Summary Statistics
Our final data sample expands from 2003 till 2012 and contains 32 SRI mutual funds. Our sample
has 3,157 firms and 15,772 firm-year observations. First, we construct our firm-year sample with
KLD scores based on different CSR areas, firm performance and control variables. Then, we obtain
our final sample by merging it with our fund data that have our estimates from the SRI fund
investment model and other fund control variables. We drop observations with any missing
10
variables. We also require firms to have positive values for total assets and gross capital expenditures.
Further, we restrict total assets to have a greater value than capital expenditures and total cash
holdings. Also, we drop the observations where the sum of long- and short-term debt is greater than
total assets. We winsorize all variables at the 1% and 99% levels to avoid outlier effects.
3. Summary Statistics and Univariate Analyses
3.1 Summary Statistics
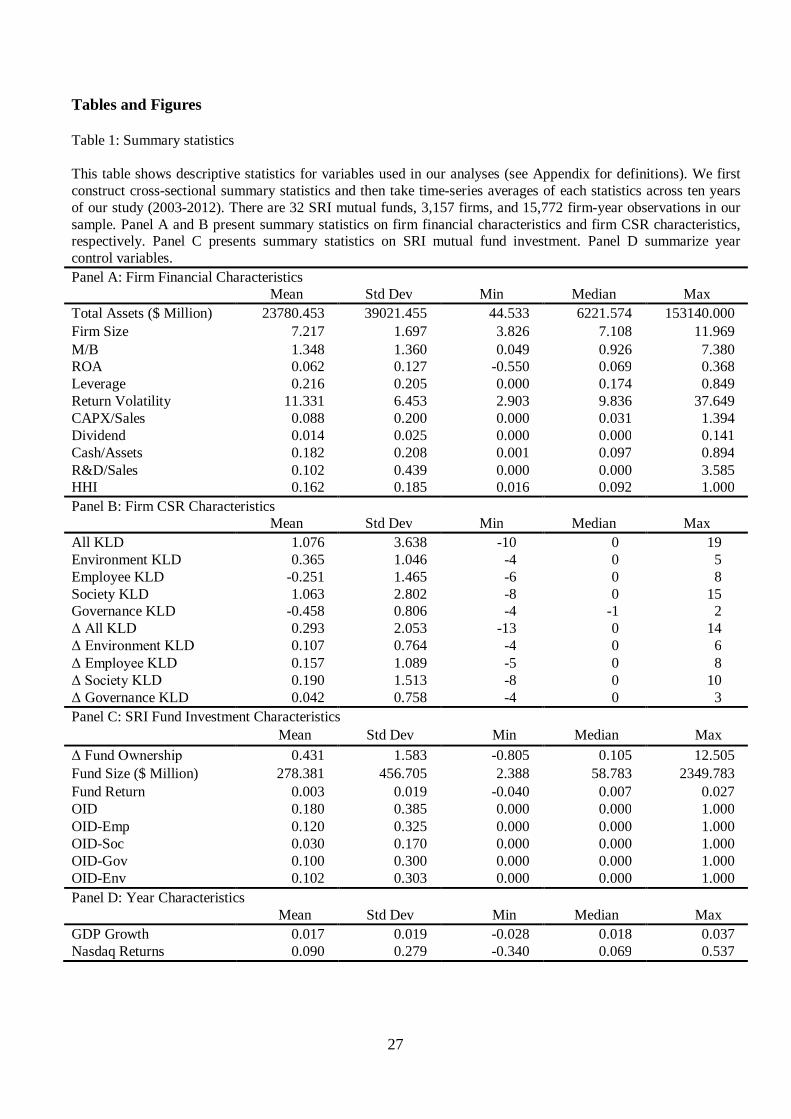
Table 1 reports the summary statistics. Panel A presents firm characteristics. Reported statistics are
consistent with prior studies. On average, the firm size is about $23.8 Billion due to several large
firms in the sample. The mean M/B is 1.35 and ROA is 6.2%, while firm leverage is 21.6% and
CAPX expenditure is 8.8% of total sales. Return volatility for firms in our sample is about 11.3%,
and firms pay about 1.4% of their market value as dividend. Companies on average invest 10.2% of
their total sales in R&D while their cash holdings are about 18.2% of their total assets. The mean
Herfindahl measure (HHI) is 0.162, which indicates firms in our sample operate in less competitive
industries.
[Insert Table 1 Here]
Panel B presents summary statistics on firms’ CSR characteristics. On average, firms have
positive KLD score levels in all different CSR areas, except Employee and Governance. The average
change in overall KLD level is 0.29. Employee and Society have largest change in KLD measure,
0.16 and 0.19, respectively. The KLD level changes in Governance and Environment areas are
relatively small with 0.04 and 0.11, respectively.
Panel C summarizes SRI fund investment characteristics. On average, SRI funds increase
their ownership in socially responsible corporations about 43% from 2003 to 2012. The distribution
of the fund ownership changes is right-skewed, which indicates that possibly large SRI mutual funds
in the sample significantly increase their ownership in socially responsibly corporations in our
11
sample. The monthly average of total net assets is about $278 Million, and they have an average
monthly return of 0.3%. Ownership Increase Dummy (OID) implies that on average 18% of the
firms in our sample have an overall increase in SRI fund ownership. 12% of the firms in our sample
have increased investments by SRI mutual funds that are more responsive to the improvements in
employee relations area of CSR. 3%, 10%, and 10% of the firms have increases in SRI fund
ownership whose focuses are more on society, governance and environment, respectively.
Panel D summarize our year control variables. The average log GDP growth and the annual
Nasdaq index return in our sample period are 1.7 and 9%, respectively.
3.2 Univariate Analyses
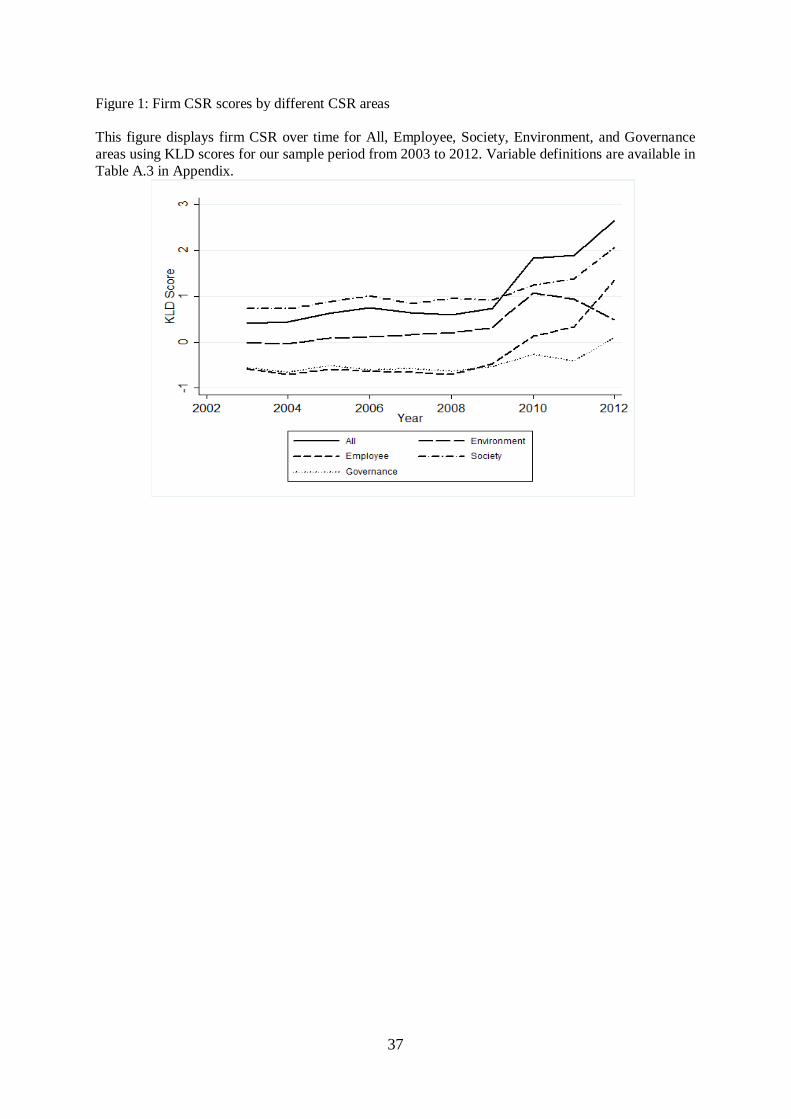
Figure 1 shows average firm CSR scores over time using the KLD scores for different CRS areas for
our sample period between 2003 and 2012.
[Insert Figure 1 Here]
Firms do not have significant changes in CSR until 2009. Starting in 2009, companies have increased
the KLD scores in all CRS areas indicating that there was a significant improvement in CSR in
recent years. Particularly, All KLD score increases by 2.0 points from 0.5 to 2.5 from 2009 till 2012.
Society and Governance KLD scores improve from 0.5 and 1.3 points, respectively for the same
period. The increasing trend of Environment KLD score, however, reverse in 2010 and the score
drops to 0.5 in 2012. Employee KLD score shows the largest increase from -0.5 to 1.5 from 2009 to
2012. This figure suggests an increasing CSR investment by firms in our sample over time,
specifically focusing on employee relations.
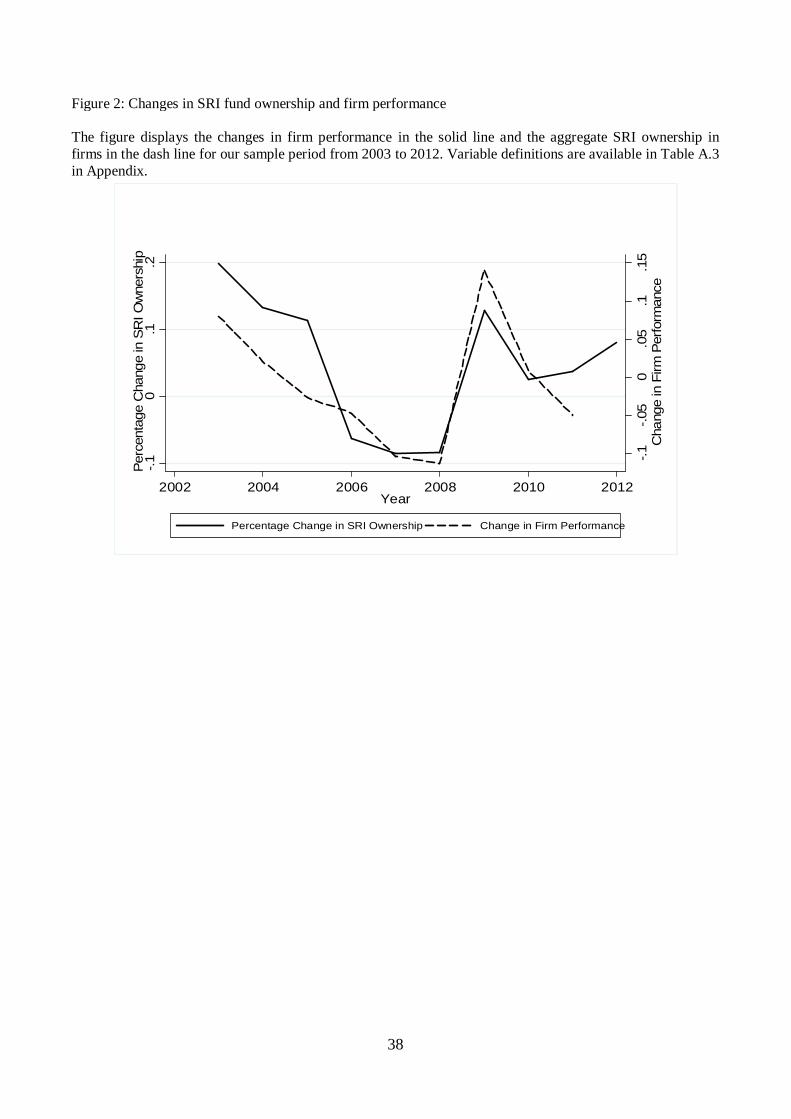
[Insert Figure 2 Here]
Figure 2 presents average changes in firm performance and aggregate SRI fund ownership in
firms in our sample for the sample period between 2003 and 2012. Both measures show similar
trends over time. When the change in aggregate fund investments in firms decreases from 20% to -10%
12
until 2008, those firms also perform poorly as the change in ROA drops from +0.05 to -0.10 by 2008.
There is a rapid increase in SRI mutual fund ownership in firms in our sample after 2008 and the
trend is followed by a sharp performance improvement in those firms from 2008 until 2012. This
figure indicates a potential positive relationship between SRI fund ownership and the real
performance of the firms invested by those SRI mutual funds.
[Insert Table 2 Here]
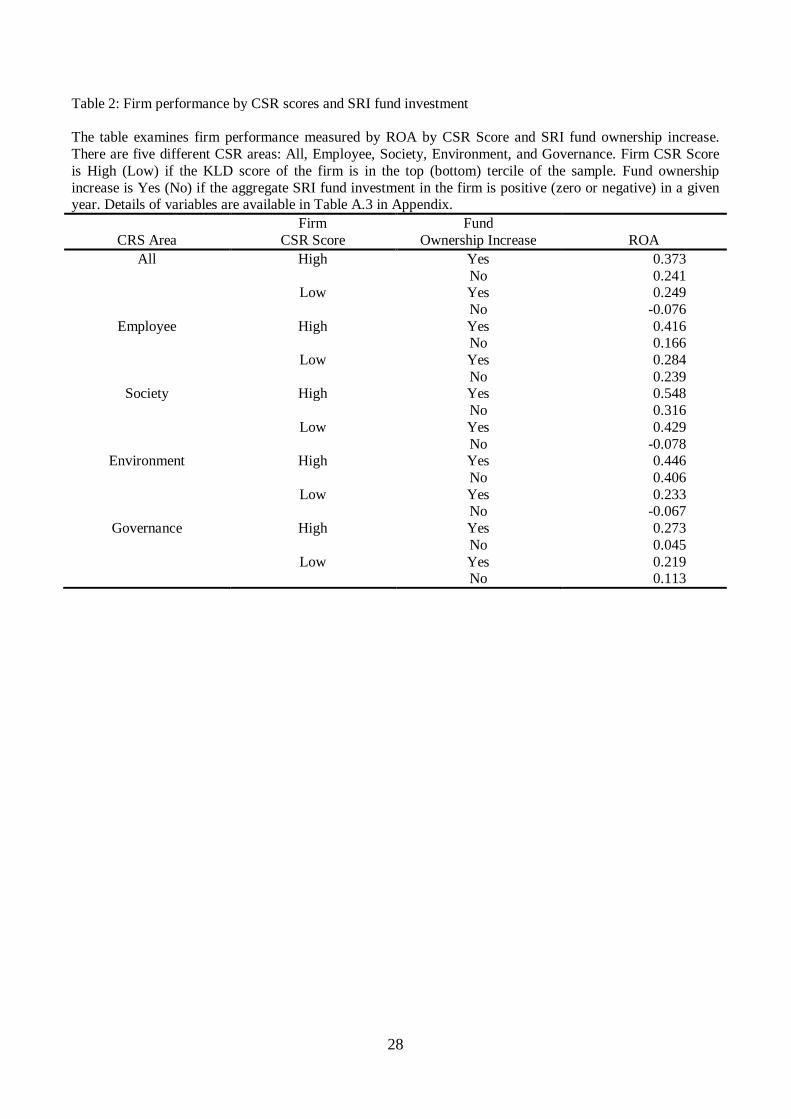
Table 2 presents the average firm performance measured by ROA by different levels of firm
CSR and SRI fund investment. In the first row of the table when firms have high overall CSR score
and increased SRI fund ownership, the average ROA of the group is 0.373. For the group of firms
with high overall CSR scores but no increased SRI funds ownership, the average ROA is 0.241.
Hence, the positive impact of fund ownership is estimated at approximately 13% (= 0.373 – 0.241).
In almost all cases, ROA is lower for the group of firms with low overall CSR score than the group
of firms with high overall CSR scores regardless of SRI fund investment. We find the effect of SRI
fund ownership on ROA for the firms with high CSR score is more profound particularly for
Employee area of CSR. The firms with high CSR scores in Employee area perform better by 25% (=
0.416 – 0.166) when SRI funds increase their ownership in those firms at the same time. The
differences in ROA due to the SRI ownership increase are estimated as 23% (= 0.548 – 0.316), 4%
(= 0.446 – 0.406), and 22% (= 0.271 – 0.045) in Society, Environment, and Governance areas,
respectively. Overall, the findings in Table 2 suggest that there is a potential link between firm
performance and SRI fund ownership increase. In general, firms have higher ROA when they are
socially conscious and perform even better when SRI funds increase their investment in those firms.
4. Empirical Methodology and Results
4.1 SRI Fund Responsiveness Betas
Our main variable of interest is the increase in total ownership in CSR firms by SRI funds with a
13
different focus on CSR areas. To know the different CSR-area focuses among SRI funds, we first
determine the type of each SRI mutual fund in terms of their responsiveness to the changes in
different CSR scores. For instance, some SRI funds may have a greater focus on employee related
issues, while other funds may be more concerned about environmental issues. Due to the
heterogeneous CSR-area focuses among SRI funds, the SRI investment will also differ according to
each firm’s improvement in each CSR area. Therefore, we conduct a series of fixed effects panel
regression analyses using fund-firm-year observations to determine each SRI fund’s responsiveness
to each CSR area. We regress the change in fund ownership for each firm on the change in the firm’s
KLD scores for each CSR area. Δ All KLD, Δ Employee KLD, Δ Society KLD, Δ Environment
KLD, and Δ Governance KLD are the independent variables, and Δ Fund Ownership is the
dependent variable in regressions. All other firm and fund controls are lagged for one year. The
model includes firm fixed effects along with year controls. The analysis is repeated for each
individual mutual fund in our sample. The model is specified as follows:
,
(1)
where Y is the change in SRI mutual fund ownership; Z is the change in KLD score for each CSR
area among the total five CSR areas including All, Employee, Society, Environment, and
Governance; the firm observation is j = 1, … , M; the entire period is t = 2003, … , 2012; the
number of firm control variables is l = 1, … , 9; the number of fund control variables is k = 1, 2; the
number of year control variables is n = 1, 2; and α, β, γ, δ, ω, μ are the coefficients of the constant
term, firm KLD score, firm controls, fund controls, year controls and error term, respectively.8
For each individual fund, we record the estimated beta coefficients (henceforth,
8 Our KLD scores are constructed as the difference between the total accumulated points for CSR strength and CSR concerns. Our results are robust to constructing the KLD scores based on either CRS strength or concerns separately.
tjn
ntn
kktjk
lltjltjtj
lsYearContro
lsFundControlsFirmControZY
,
2
1,
2
1,,
10
1,1,,,
*
**
14
responsiveness beta) for the five CSR areas. Then, we calculate the median value of these five beta
coefficients. Lastly, we classify a fund as responsive to a given CSR area if the corresponding beta
estimated for the given CSR area is greater than the median value. In this way, we can determine
each SRI fund’s preference for specific CSR practices.9
4.2 SRI Funds’ Ownership and Firm Performance
Next, we calculate the aggregate SRI fund ownership difference between a given year and the prior
year for each firm. We repeat this calculation for each CSR area using the funds that has a focus on
the specific area based on our previously estimated responsiveness betas. We construct a dummy
variable that equals one if the aggregate ownership difference is positive and zero otherwise.
Through this procedure, we create our main independent variables of interest: Ownership Increase
Dummy (OID), Ownership Increase Dummy in Employee (OID-Emp), Ownership Increase Dummy
in Society (OID-Soc), Ownership Increase Dummy in Environment (OID-Env), and Ownership
Increase Dummy in Government (OID-Gov).
In our first regression analysis for firm performance, we use the change in ROA between a
given year and the following year as a dependent variable. In our regression model, we control for
factors found to be important in prior studies examining firm performance, and those control
variables are lagged for one year. The main variables of interest are dummy variables for the
ownership increase by SRI funds with a specific CSR area focus. The model includes year control
variables and industry fixed effects using the three-digit SIC codes. Standard errors are robust and
adjusted for clustering within firms. The model is specified as follows:
tjn
ntnl
ltjltjtj lsYearControlsFirmControXY ,
2
1,
10
1,1,,, **
, (2)
9 See Appendix Table A.2 for the list of SRI funds with different CSR area focuses.
15
where Y is the change in ROA; X is the dummy variable for the aggregate ownership increase by
SRI funds with a specific CSR area focus; the firm observation is j = 1, … , M; the entire period is t
= 2003, … , 2012; the number of firm control variables is l = 1, … , 10; the number of year control
variables is n = 1, 2; and α, β, γ, ω, μ are the coefficients of the constant term, dummy for the
increase in SRI funds’ ownership, firm controls, year controls and error term, respectively.
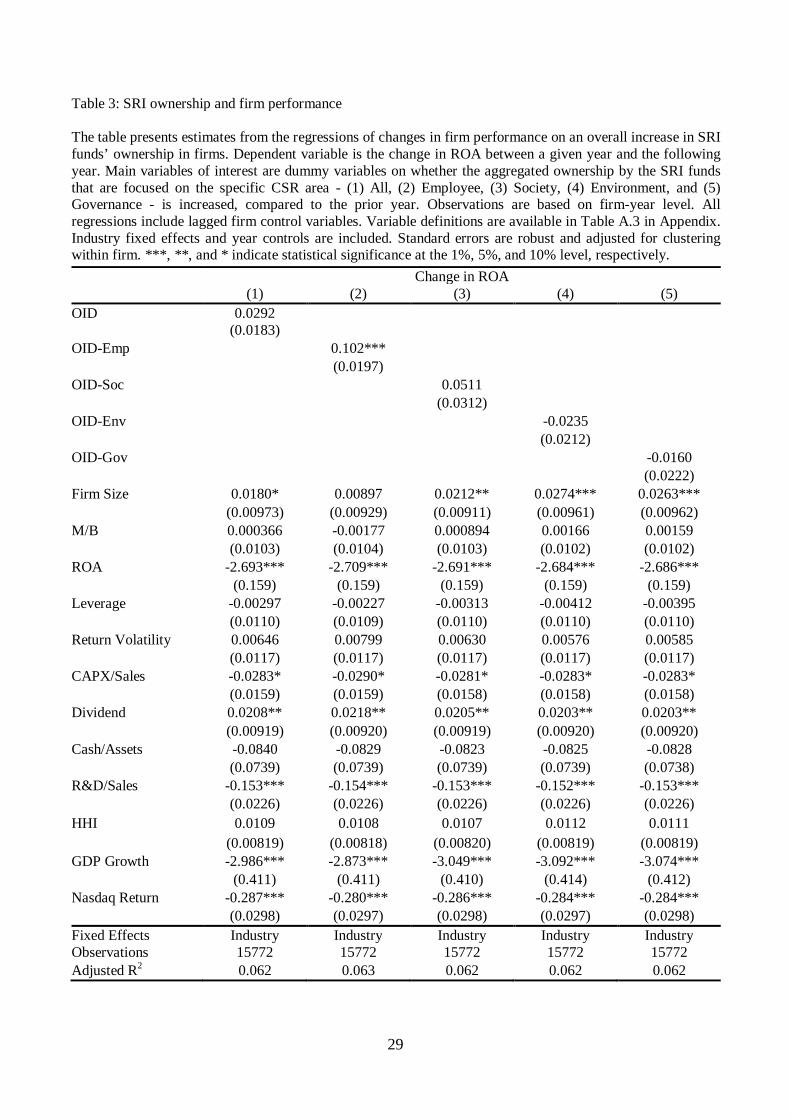
[Insert Table 3 Here]
Table 3 presents the regression results with the model. In Column 1, the coefficient for OID
is insignificant. This suggests that an increase in SRI fund ownership that has no specific CSR area
focus doesn’t affect firm performance. Similar to this finding, we note insignificant coefficient
estimates for IOD throughout Column 3 to Column 5 where we consider the ownership increase by
the SRI funds with Society, Environment, and Governance focus, respectively. In Table 3, only the
coefficient for IOD-Emp in Column 2 is significantly positive at the 1% level. When SRI funds with
an employee-relation focus increase their ownership in the firms with improved Employee CSR area,
the firms’ performance increases by 10.2% on average. This finding supports that an improvement in
employee relations results in better firm performance when SRI fund involvement is also increased
in that firm.10
In a separate analysis, we also examine the possible collective impacts of all four main
independent variables, by including OID-Emp, OID-Soc, OID-Gov, and OID-Env in the model at the
same time. The remainder of the model is the same as in (2):
tjn
ntnl
ltjli
itjitj lsYearControlsFirmControXY ,
2
1,
10
1,1,
4
1,,, ***
, (3)
where Y is the change in ROA; X is the dummy variable for the aggregate ownership increase by
SRI funds with a specific CSR area focus; the number of fund ownership dummy variables is i = 1,
10 In our unreported analyses, we examine the potential influence by non-SRI fund ownership chance in firm performance as well. The results show that overall increase in non-SRI funds in the CSR firms is associated with significant but negative change in ROA. This highlights the particular role of SRI funds in our context in contrast to that of non-SRI funds.
16
…, 4; the firm observation is j = 1, … , M; the entire period is t = 2003, … , 2012; the number of
firm control variables is l = 1, … , 10; the number of year control variables is n = 1, 2; and α, β, γ, ω,
μ are the coefficients of the constant term, dummy for the increase in SRI funds’ ownership, firm
controls, year controls, and error term, respectively.
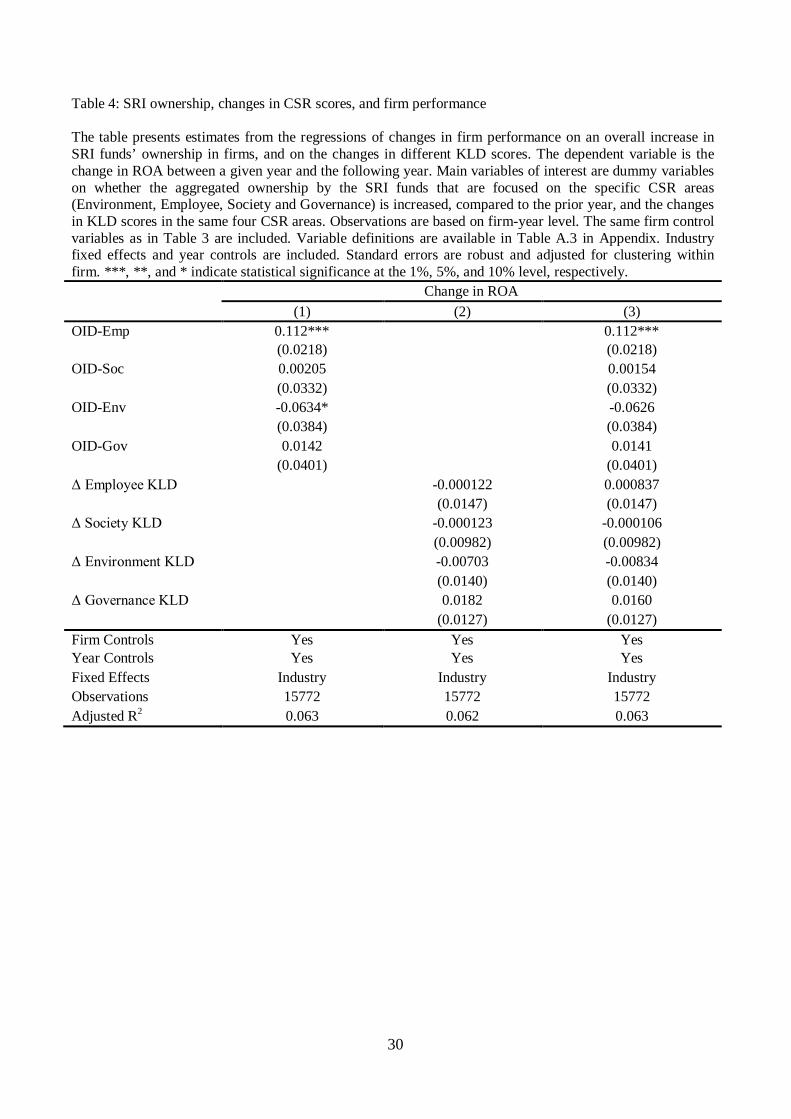
[Insert Table 4 Here]
Column 1 in Table 4 shows the results for the possible collective effects from all CSR areas.
The results in Column 1 show that except the employee relation area none of the CSR areas is
positively and significantly related to firm performance improvement. Controlling for other potential
influence coming from Society, Environment and Government CSR areas, we find with better
employee relations that firm ROA increases by 11.2% when SRI funds increase their influence on
the firms by owning more shares of the firms. In contrast, we separately highlight an interesting
correlation in column one regarding Environment CSR. We find that the estimated coefficient for
IOD-Env is significant and negative at the 10% level. This is consistent with the view that CSR can
be viewed as unproductive corporate investment that does not lead to performance improvement, and
thus, managerial private benefits exist (Cheng, Hong, and Shue, 2013).
In the prior studies, what is frequently examined for the effect of CSR on firm performance is
the relation between the changes in KLD scores and firm performance. The changes in firm KLD
scores potentially capture the direct improvement of the firms’ CSR policies in the specific CSR
areas. However, those measures only capture one of the measurable aspects of the firm CSR policies,
but not necessarily represent all aspects such as how firms implement those planned policies.
Therefore, as a comparison, we use an alternative model similar to the ones used in the literature that
examines the impact of firm CSR measured by only the changes in KLD scores on firm performance.
We consider the collective impacts of the changes in different CSR areas by including Δ Employee
KLD, Δ Society KLD, Δ Governance KLD, and Δ Environment KLD in the model at the same time.
The remainder of the model is the same as in (2):
17
tjn
ntnl
ltjlh
htjitj lsYearControlsFirmControZY ,
2
1,
10
1,1,
4
1,,, ***
,
(4)
where Y is the change in ROA; Z is the change in KLD score in different CSR areas; the number of
variables for KLD score change is h = 1, …, 4; the firm observation is j = 1, … , M; the entire period
is t = 2003, … , 2012; the number of firm control variables is l = 1, … , 10; the number of year
control variables is n = 1, 2; and α, λ, γ, ω, μ are the coefficients of the constant term, dummy for the
change in KLD scores, firm controls, year controls, and error term, respectively.
Column 2 in Table 4 presents the results. We find that all four variables for KLD score
changes in Employee, Society, Environment, Governance are insignificant, indicating that once the
influence from SRI ownership is excluded from the analysis, CSR score changes themselves cannot
explain firm performance sufficiently.
In Column 3, we consider a regression model that includes all four variables for SRI fund
ownership increase and all four variables for the changes in KLD scores (OID-Emp, OID-Soc, OID-
Gov, OID-Env, Δ Employee KLD, Δ Society KLD, Δ Governance KLD, and Δ Environment KLD).
The dependent variable is the change in ROA. The remainder of the model is the same as in (2):
Yj,t i * X j,t,ii1
4
i * Z j,t,hh1
4
l * FirmControls j,t1,ll1
10
n *YearControlst,nn1
2
j,t ,
(5)
where Y is the change in ROA; X is the dummy variable for the aggregate ownership increase by
SRI funds with a specific CSR area focus; Z is the change in KLD score in different CSR areas; the
number of fund ownership dummy variables is i = 1, …, 4; the number of variables for KLD score
change is h = 1, …, 4; the firm observation is j = 1, … , M; the entire period is t = 2003, … , 2012;
the number of firm control variables is l = 1, … , 10; the number of year control variables is n = 1, 2;
and α, β, λ, γ, ω, μ are the coefficients of the constant term, dummy for the increase in funds’
18
ownership, dummy for the change in KLD scores, firm controls, year controls, and error term,
respectively.
Column 3 shows that only the estimate for OID-Emp is still significantly positive after
controlling for all other collective influence by the changes in SRI fund ownership and KLD scores
in other CSR areas. Consistent with our previous findings, we note that an increase in SRI fund
ownership in firms improving their labor relations leads to a higher ROA by 11.2%.
Overall, evidence from our analyses suggests that the significant channel to increase firm
performance is to improve labor relations within firm under the greater influence of SRI mutual
funds with aligned CSR incentives. One possible explanation for this channel is that employee
satisfaction and real firm performance are closely related. Investing in other CSR areas, such as
society, governance and environment can bring social benefits and social reputation to the firm. But,
the direct link to real or financial firm performance is unclear, because it is more likely spending
corporate resources outside of the company. Thus, which economic effect dominates between
reputational benefits and spending resources outside of the firm is an empirical question. Our
findings suggest that the positive economic effect of CSR dominates only in the employee-relation
CSR due to the improved human capital.
Furthermore, we highlight that the influence by related SRI funds is also essential. If those
funds increase their ownership in a firm, they will engage more actively in various corporate policies
of the firm, especially in CSR policies consistent with their own focus. Such engagement can be
done through shareholder activism and monitoring. Better employee rights and improved work
conditions can be guaranteed with SRI funds involvement, thereby motivating employees in the firm
to work more effectively and perform better in their tasks. Hence, our findings suggest that both the
employee channel of CSR and involvement of SRI funds with an employee focus are necessary to
improve firm performance.
19
4.3 Endogeneity and Analyses with Propensity-Score Matched Sample
We recognize that SRI ownership increases might be endogenous decisions. Reverse causality may
be the first concern. SRI mutual funds could increase their ownership in a firm because the firm’s
performance improves. This is not the case in our analysis. In our regression model, SRI fund
ownership increase is calculated by taking the difference between a given year and the prior year,
while the change in ROA is the difference between the given and the following year. Hence, fund
investment should influence firm performance, if it does, and not the other way around. The second
concern comes from the omitted variables that may affect firm performance and SRI fund decisions
simultaneously. For example, those funds may have better information about firm performance and
correctly select a portfolio of firms expected to show higher performance in addition to maintaining
higher employee CSR scores. If that is the case, however, then all OID regardless of SRI’s specific
area focus should have shown significant and positive effects on the ROA change, assuming that all
SRI funds are equally influenced by the omitted variables regardless of their focus. We find the
significant and positive effect only in employee-focus SRI funds, and thus this concern is mitigated.
Nevertheless, we try to further address this concern by using a more refined firm sample
based on propensity-score matching in our next tests. In Table 5, we run the same regression model
(2), but refine our sample as follows. For each CSR area, we propensity-match firms with an increase
in SRI ownership with the same area focus (firms with OID equal to one) to their nearest neighbor in
the sample for firms without an increase in SRI ownership (firms with OID equal to zero). We exact-
match the two firms on their KLD scores in the given CSR area and propensity-match on the
characteristics known to affect firm performance, which are all firm and industry control variables in
Table 3. Table 5 provides the results.
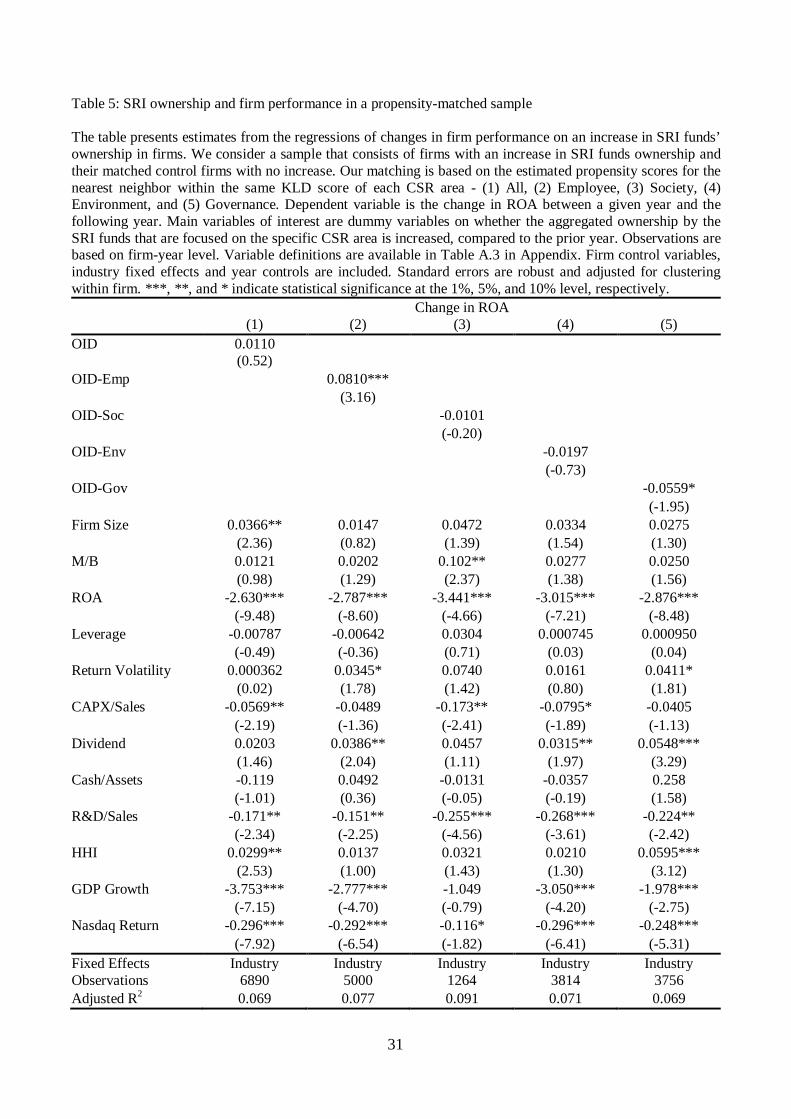
[Insert Table 5 Here]
Column 1 in Table 5 uses a refined sample with 3,445 firms with OID equal to one and 3,445
matched control firms with the exactly same ALL KLD score and similar firm characteristics but
20
OID equal to zero. The coefficient for OID is insignificant in Column 1. This is consistent with the
results in Column 1 in Table 3. Similarly, we also find insignificant coefficient estimates for IOD in
Column 3 and 4 where we consider the ownership increase by the SRI funds with Society and
Environment focuses. In Column 2, we find a significant and positive coefficient for IOD-Emp at the
1% level by using the refined propensity-matched sample. In particular, we have 2,500 firms OID-
Emp equal to one and 2,500 neighbor firms with the exactly same Employee KLD score and similar
firm characteristics but OID-Emp equal to zero. The performance improvement associated with
ownership increase by employee-focus SRI funds is estimated as 8.10% on average in this test. It is
worth noting that we find a significantly negative coefficient at the 10% level in Column 5 for the
Governance focus. This suggests that Governance CSR can be unproductive CRS area. Overall, we
find even in more stringent tests using refined matched firm samples that improvement in employee
relations interacted with increased SRI fund influence are strongly associated with a rise in firm
performance.
5. Robustness Check and Additional Analyses
5.1 Different Firm Performance Measure
Our previous analyses use ROA as the main measure for firm real performance. In our extended
tests, we examine the impact of SRI fund ownership increase on firm financial performance
measured by annual stock returns. Because CSR improvement and increased influence by SRI funds
are valuable especially in employee relations, our broader prediction is that such firms should have
higher stock returns. We test this prediction in Table 6. We use annual stock returns as the dependent
variable in this test. Panel A uses the whole sample and Panel B uses propensity-matched sample as
in Table 5.
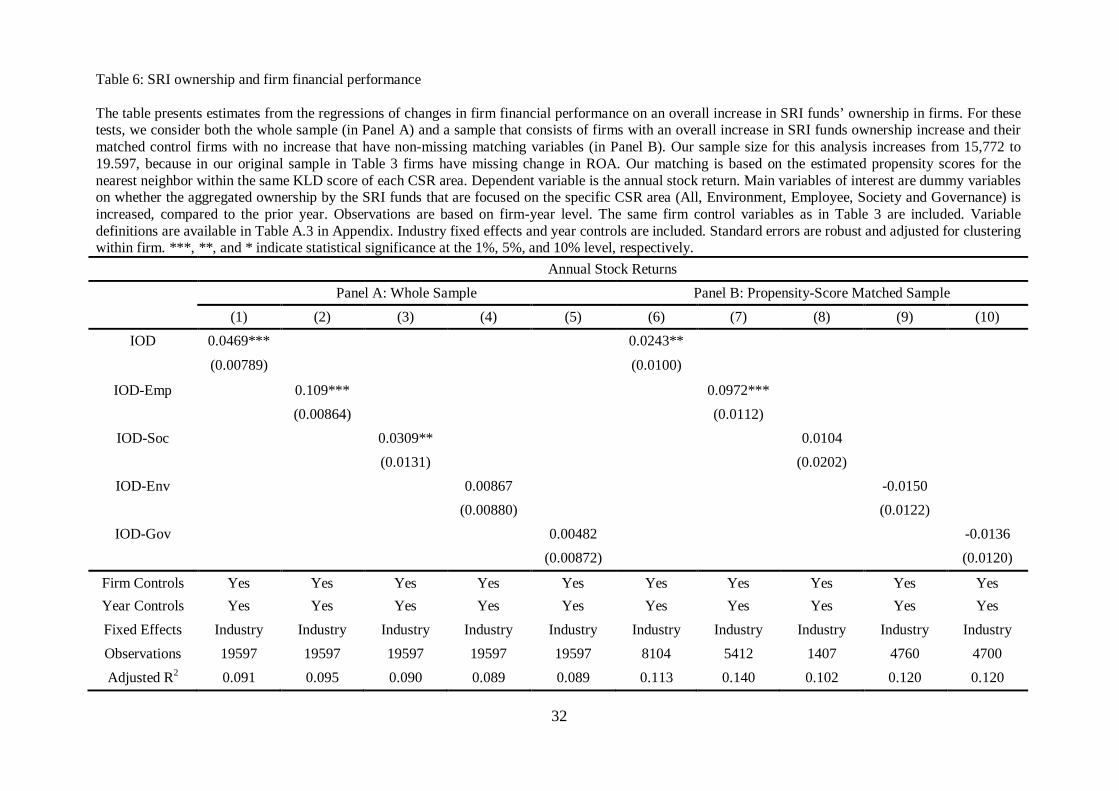
[Insert Table 6 Here]
21
Table 6 shows positive and significant results for OID-Emp in both Columns 2 and 7.
Consistent with our original findings, an increase in ownership of SRI funds mainly caring about
employee CSR improves firm financial performance significantly at the 1% level. More specifically,
annual stock return increases by approximately 11% and 9.7% in Columns 2 and 7, respectively.
Interestingly, Columns 1, 3, and 6 show that investment by SRI funds in general, as well as, with a
focus on the society area (only when the whole sample is used in Column 3) are also associated with
higher stock returns. Those CSR area, both overall and society, include employee relations as a
subset of their issues. Hence, the positive associations found in those two areas likely include the
positive effect in the employee area of CSR. Consistent with this interpretation, we find that the
estimated impacts on firm financial performance in overall and society areas are relatively weaker
compared to the effect in the employee area of CSR.
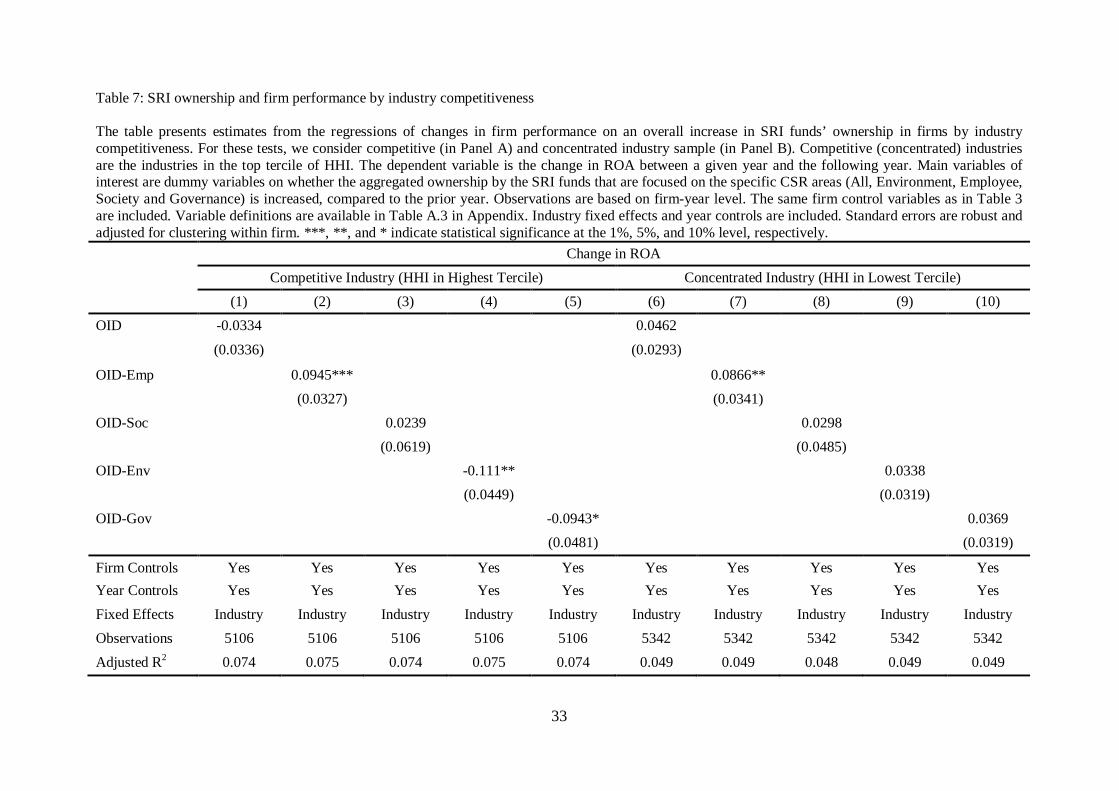
5.2 Industry Analysis
We examine the effects of firm CSR and SRI fund investment on firm performance for different
industry groups. First, we construct two subsamples based on industry concentration. Firms with
HHI less than 0.05 (the highest tercile of HHI) are assigned to the “Competitive Industry” sample,
and firms with HHI greater than 0.20 (the lowest tercile of HHI) are assigned the in “Concentrated
Industry” sample. We estimate the main regression model in (2) for each subsample. Table 7
provides the results.
[Insert Table 7 Here]
Consistent with our previous findings, the results show significant and positive coefficient
estimates for IOD-Emp only in Columns 2 and 7. Specifically, when firms operating in competitive
(concentrated) industries improve their labor relations and have an overall increase in SRI mutual
fund ownership, they experience an ROA increase by 9.45% (8.66%) on average. These results
imply that the level of competitiveness in industries doesn’t have differential influences on the
22
relation between firm performance and ownership increase by SRI funds that are more conscious of
employee relations. It is worth to note that there are negative effects on firm performance of SRI
funds that are focused on environment and governance CSR areas in Columns 4 and 5 (a decrease of
11.1% and 9.43%, respectively), when firms operate in competitive industries. This implies that
investing in CSR in environment and governance areas can be more unproductive when firms
experience higher competition, consistent with Hong, and Shue (2013).
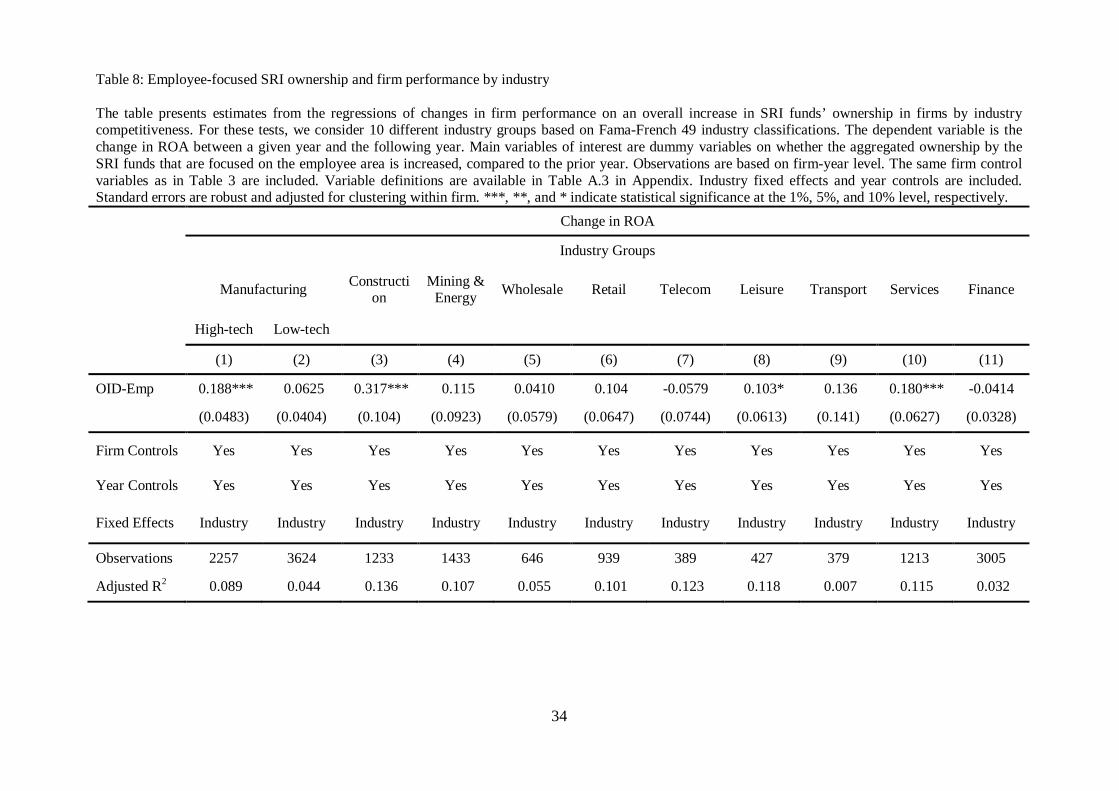
To further examine industries in detail, we construct 10 broad industry groups using Fama-
French 49 industry classification. The broad groups are Manufacturing, Construction, Mining &
Energy, Wholesale, Retail, Telecommunication, Leisure (i.e. hotels, restaurants, entertainment),
Transportation, Services, and Finance. We repeat the main analysis for each of these industry groups
separately. Table 8 presents the results.
[Insert Table 8 Here]
Significant and positive coefficient estimates for IOD-Emp in Columns 1, 3, 8, and 10
indicate that firms operating in manufacturing (specifically in high-tech), construction, leisure and
service industries show performance increase, when SRI funds that seek better labor relations within
firm increase their investment in those firms. These findings particularly support our employee
motivation channel. These industries are considered to heavily rely on human capital (e.g., high-tech
manufacturing industries) and labor work (e.g., construction and service industries). When firms in
those human-capital or labor intensive industries improve relations with their own employees, along
with effective monitoring by SRI funds, employee loyalty and motivation are more likely to improve,
which leads to better firm real performance.
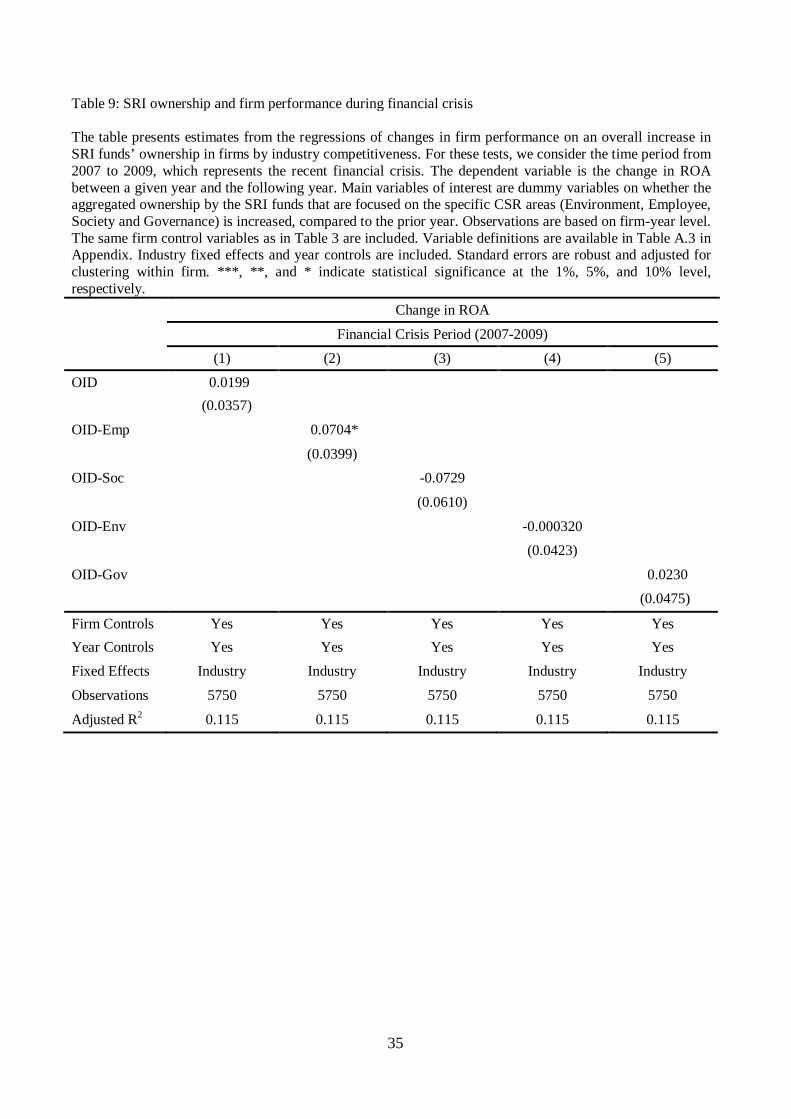
5.3 Financial Crisis Period
Our sample period comprises of 2007-2009 financial crisis. Unfavorable market conditions during
financial crisis are likely to have implications on SRI funds as well as firm CSR investment. Mutual
23
funds may decrease their investment amounts and prefer to hold less risky stocks. Similarly, firms
may delay their policies on CSR or engage in limited CSR actions. Financial crisis also has a direct
impact on firm real performance. To control for any potential influence by financial crisis on our
findings, we repeat the main analysis only for the crisis period.
[Insert Table 9 Here]
In Table 9, similar to our previous findings, we find significant and positive coefficient
estimate only for IOD-Emp. Even during the crisis time, firm performance increases by 7.04%,
compared to 10.2% in Table 3, when firms with better employee relations are invested by SRI funds
sharing a similar agenda. This finding suggests that the financial crisis does not have any significant
impact on the relation between SRI ownership increase and ROA of firms with better CSR practices
regarding employees.
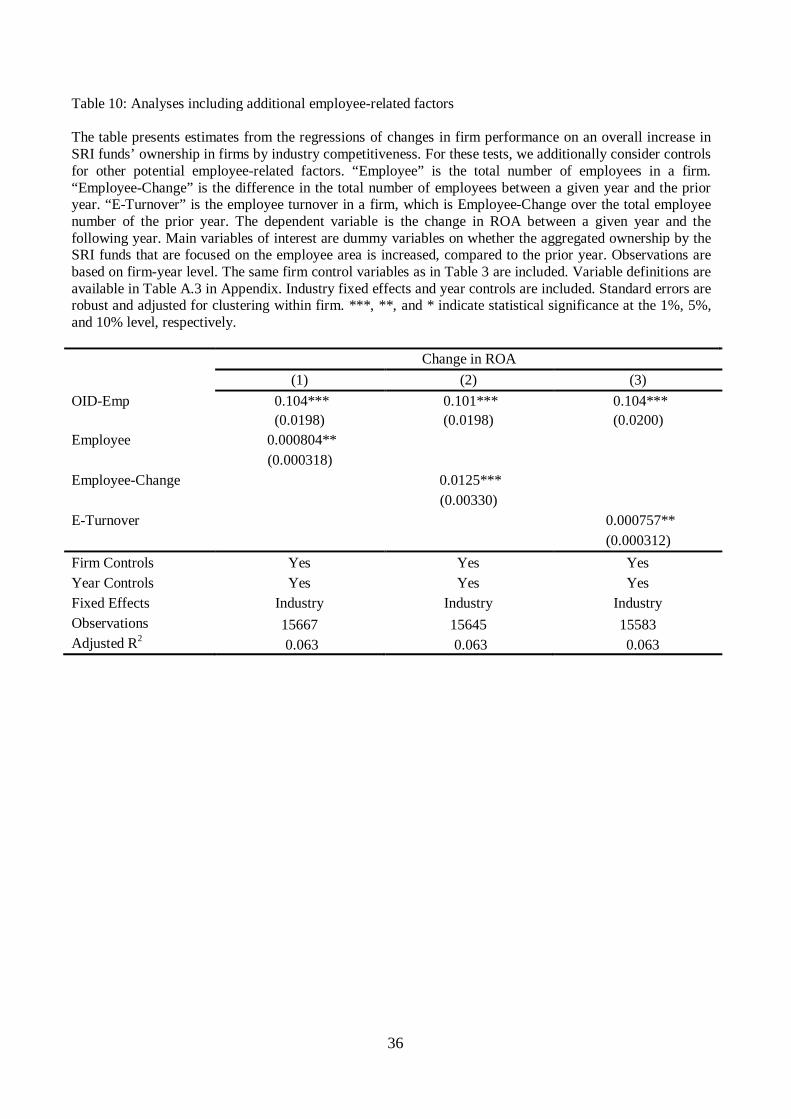
5.4. Other Employee Related Factors
Throughout our analyses, the employee relation area of CSR is the main channel that explains firm
performance improvement when SRI funds with a similar CSR focus increase their ownership in
firms. Hence, for robustness, we consider additional controls for other potential labor related factors.
Those factors include the total number of employees (“Employee”), change in the number of
employees(“Employee-Change”), and employee turnover (“E-Turnover”). We include these
variables individually as controls in our regression model (2) and particularly examine the effect of
IOD-Emp.
[Insert Table 10 Here]
Table 10 presents the results. We find positive and significant estimates for IOD-Emp
showing that our results are robust to controlling for other potential employee-related factors. Firm
performance still improves by 10% consistently in all columns 1 to 3, when employee-relation
focused SRI mutual funds increase their ownership in the firms with better labor relations.
24
6. Conclusion
In this paper, we explore the possible channels through which corporate social responsibility is
associated with firm performance. We find that firms perform better when they improve employee
relations and the implementation of such CSR policies are influenced by SRI funds through their
increased ownership in those firms. We differ from prior studies in the literature, by showing that
both the employee relation area of CSR and SRI ownership are important to have a sufficient impact
on firm performance. This relation holds in both concentrated and competitive industries. However,
CSR in environment and governance areas can be unproductive investment for concentrated
industries. The relation is more pronounced in the industries that are more human-capital or labor
intensive, such as (high-tech) manufacturing, construction, leisure, and service industries. We show
that our results are robust to including any potential effects of financial crisis and other employee
related factors such as the total number of employees and employee turnover.
Our paper adds to the SRI fund, CSR and firm performance literature by suggesting potential
channels through which firm performance is affected. This study may also provide a useful guidance
to SRI mutual fund managers and firm executives by showing how particular CSR practices make
firms financially valuable and which type of CSR areas firms should consider to invest.
25
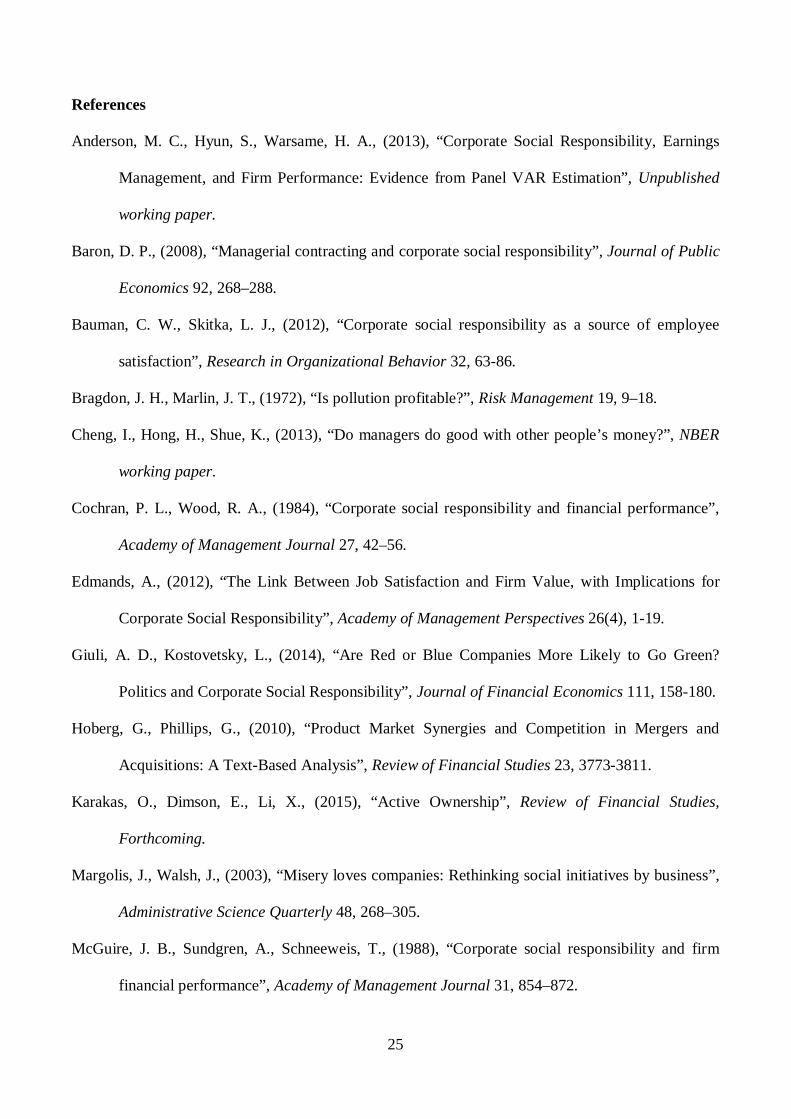
References
Anderson, M. C., Hyun, S., Warsame, H. A., (2013), “Corporate Social Responsibility, Earnings
Management, and Firm Performance: Evidence from Panel VAR Estimation”, Unpublished
working paper.
Baron, D. P., (2008), “Managerial contracting and corporate social responsibility”, Journal of Public
Economics 92, 268–288.
Bauman, C. W., Skitka, L. J., (2012), “Corporate social responsibility as a source of employee
satisfaction”, Research in Organizational Behavior 32, 63-86.
Bragdon, J. H., Marlin, J. T., (1972), “Is pollution profitable?”, Risk Management 19, 9–18.
Cheng, I., Hong, H., Shue, K., (2013), “Do managers do good with other people’s money?”, NBER
working paper.
Cochran, P. L., Wood, R. A., (1984), “Corporate social responsibility and financial performance”,
Academy of Management Journal 27, 42–56.
Edmands, A., (2012), “The Link Between Job Satisfaction and Firm Value, with Implications for
Corporate Social Responsibility”, Academy of Management Perspectives 26(4), 1-19.
Giuli, A. D., Kostovetsky, L., (2014), “Are Red or Blue Companies More Likely to Go Green?
Politics and Corporate Social Responsibility”, Journal of Financial Economics 111, 158-180.
Hoberg, G., Phillips, G., (2010), “Product Market Synergies and Competition in Mergers and
Acquisitions: A Text-Based Analysis”, Review of Financial Studies 23, 3773-3811.
Karakas, O., Dimson, E., Li, X., (2015), “Active Ownership”, Review of Financial Studies,
Forthcoming.
Margolis, J., Walsh, J., (2003), “Misery loves companies: Rethinking social initiatives by business”,
Administrative Science Quarterly 48, 268–305.
McGuire, J. B., Sundgren, A., Schneeweis, T., (1988), “Corporate social responsibility and firm
financial performance”, Academy of Management Journal 31, 854–872.
26
Nelling, E., Webb, E., (2009), “Corporate social responsibility and financial performance: the
‘virtuous circle’ revisited”, Review of Quantitative Finance and Accounting 32, 197-209.
Nofsinger, J., Varma, A., (2014), “Socially Responsible Funds and Market Crises”, Journal of
Banking & Finance 48, 180-193.
Parket, R., Eilbirt, H., (1975), “Social responsibility: The underlying factors”, Business Horizons 18,
5–10.
Roman, R., Hayibor, S., Agle, B., (1999), “The relationship between social and financial
performance: Repainting a portrait”, Business and Society 38, 109–125
Rui Albuquerque, R., Durnev, A., Koskinen, Y., (2014), “Corporate Social Responsibility and Firm
Risk: Theory and Empirical Evidence”, Unpublished working paper.
Tosun, O. K., (2015), “Is corporate social responsibility sufficient enough to explain the investment
by socially responsible funds?”, Review of Quantitative Finance and Accounting,
Forthcoming.
27
Tables and Figures Table 1: Summary statistics This table shows descriptive statistics for variables used in our analyses (see Appendix for definitions). We first construct cross-sectional summary statistics and then take time-series averages of each statistics across ten years of our study (2003-2012). There are 32 SRI mutual funds, 3,157 firms, and 15,772 firm-year observations in our sample. Panel A and B present summary statistics on firm financial characteristics and firm CSR characteristics, respectively. Panel C presents summary statistics on SRI mutual fund investment. Panel D summarize year control variables. Panel A: Firm Financial Characteristics
Mean Std Dev Min Median Max Total Assets ($ Million) 23780.453 39021.455 44.533 6221.574 153140.000 Firm Size 7.217 1.697 3.826 7.108 11.969 M/B 1.348 1.360 0.049 0.926 7.380 ROA 0.062 0.127 -0.550 0.069 0.368 Leverage 0.216 0.205 0.000 0.174 0.849 Return Volatility 11.331 6.453 2.903 9.836 37.649 CAPX/Sales 0.088 0.200 0.000 0.031 1.394 Dividend 0.014 0.025 0.000 0.000 0.141 Cash/Assets 0.182 0.208 0.001 0.097 0.894 R&D/Sales 0.102 0.439 0.000 0.000 3.585 HHI 0.162 0.185 0.016 0.092 1.000 Panel B: Firm CSR Characteristics Mean Std Dev Min Median Max All KLD 1.076 3.638 -10 0 19 Environment KLD 0.365 1.046 -4 0 5 Employee KLD -0.251 1.465 -6 0 8 Society KLD 1.063 2.802 -8 0 15 Governance KLD -0.458 0.806 -4 -1 2 Δ All KLD 0.293 2.053 -13 0 14 Δ Environment KLD 0.107 0.764 -4 0 6 Δ Employee KLD 0.157 1.089 -5 0 8 Δ Society KLD 0.190 1.513 -8 0 10 Δ Governance KLD 0.042 0.758 -4 0 3 Panel C: SRI Fund Investment Characteristics Mean Std Dev Min Median Max Δ Fund Ownership 0.431 1.583 -0.805 0.105 12.505 Fund Size ($ Million) 278.381 456.705 2.388 58.783 2349.783 Fund Return 0.003 0.019 -0.040 0.007 0.027 OID 0.180 0.385 0.000 0.000 1.000 OID-Emp 0.120 0.325 0.000 0.000 1.000 OID-Soc 0.030 0.170 0.000 0.000 1.000 OID-Gov 0.100 0.300 0.000 0.000 1.000 OID-Env 0.102 0.303 0.000 0.000 1.000 Panel D: Year Characteristics Mean Std Dev Min Median Max GDP Growth 0.017 0.019 -0.028 0.018 0.037 Nasdaq Returns 0.090 0.279 -0.340 0.069 0.537
28
Table 2: Firm performance by CSR scores and SRI fund investment The table examines firm performance measured by ROA by CSR Score and SRI fund ownership increase. There are five different CSR areas: All, Employee, Society, Environment, and Governance. Firm CSR Score is High (Low) if the KLD score of the firm is in the top (bottom) tercile of the sample. Fund ownership increase is Yes (No) if the aggregate SRI fund investment in the firm is positive (zero or negative) in a given year. Details of variables are available in Table A.3 in Appendix.
Firm Fund CRS Area CSR Score Ownership Increase ROA
All High Yes 0.373 No 0.241 Low Yes 0.249 No -0.076
Employee High Yes 0.416 No 0.166 Low Yes 0.284 No 0.239
Society High Yes 0.548 No 0.316 Low Yes 0.429 No -0.078
Environment High Yes 0.446 No 0.406 Low Yes 0.233 No -0.067
Governance High Yes 0.273 No 0.045 Low Yes 0.219 No 0.113
29
Table 3: SRI ownership and firm performance The table presents estimates from the regressions of changes in firm performance on an overall increase in SRI funds’ ownership in firms. Dependent variable is the change in ROA between a given year and the following year. Main variables of interest are dummy variables on whether the aggregated ownership by the SRI funds that are focused on the specific CSR area - (1) All, (2) Employee, (3) Society, (4) Environment, and (5) Governance - is increased, compared to the prior year. Observations are based on firm-year level. All regressions include lagged firm control variables. Variable definitions are available in Table A.3 in Appendix. Industry fixed effects and year controls are included. Standard errors are robust and adjusted for clustering within firm. ***, **, and * indicate statistical significance at the 1%, 5%, and 10% level, respectively.
Change in ROA (1) (2) (3) (4) (5)
OID 0.0292 (0.0183) OID-Emp 0.102*** (0.0197) OID-Soc 0.0511 (0.0312) OID-Env -0.0235 (0.0212) OID-Gov -0.0160 (0.0222) Firm Size 0.0180* 0.00897 0.0212** 0.0274*** 0.0263*** (0.00973) (0.00929) (0.00911) (0.00961) (0.00962) M/B 0.000366 -0.00177 0.000894 0.00166 0.00159 (0.0103) (0.0104) (0.0103) (0.0102) (0.0102) ROA -2.693*** -2.709*** -2.691*** -2.684*** -2.686*** (0.159) (0.159) (0.159) (0.159) (0.159) Leverage -0.00297 -0.00227 -0.00313 -0.00412 -0.00395 (0.0110) (0.0109) (0.0110) (0.0110) (0.0110) Return Volatility 0.00646 0.00799 0.00630 0.00576 0.00585 (0.0117) (0.0117) (0.0117) (0.0117) (0.0117) CAPX/Sales -0.0283* -0.0290* -0.0281* -0.0283* -0.0283* (0.0159) (0.0159) (0.0158) (0.0158) (0.0158) Dividend 0.0208** 0.0218** 0.0205** 0.0203** 0.0203** (0.00919) (0.00920) (0.00919) (0.00920) (0.00920) Cash/Assets -0.0840 -0.0829 -0.0823 -0.0825 -0.0828 (0.0739) (0.0739) (0.0739) (0.0739) (0.0738) R&D/Sales -0.153*** -0.154*** -0.153*** -0.152*** -0.153*** (0.0226) (0.0226) (0.0226) (0.0226) (0.0226) HHI 0.0109 0.0108 0.0107 0.0112 0.0111 (0.00819) (0.00818) (0.00820) (0.00819) (0.00819) GDP Growth -2.986*** -2.873*** -3.049*** -3.092*** -3.074*** (0.411) (0.411) (0.410) (0.414) (0.412) Nasdaq Return -0.287*** -0.280*** -0.286*** -0.284*** -0.284*** (0.0298) (0.0297) (0.0298) (0.0297) (0.0298) Fixed Effects Industry Industry Industry Industry Industry Observations 15772 15772 15772 15772 15772 Adjusted R2 0.062 0.063 0.062 0.062 0.062
30
Table 4: SRI ownership, changes in CSR scores, and firm performance The table presents estimates from the regressions of changes in firm performance on an overall increase in SRI funds’ ownership in firms, and on the changes in different KLD scores. The dependent variable is the change in ROA between a given year and the following year. Main variables of interest are dummy variables on whether the aggregated ownership by the SRI funds that are focused on the specific CSR areas (Environment, Employee, Society and Governance) is increased, compared to the prior year, and the changes in KLD scores in the same four CSR areas. Observations are based on firm-year level. The same firm control variables as in Table 3 are included. Variable definitions are available in Table A.3 in Appendix. Industry fixed effects and year controls are included. Standard errors are robust and adjusted for clustering within firm. ***, **, and * indicate statistical significance at the 1%, 5%, and 10% level, respectively. Change in ROA (1) (2) (3) OID-Emp 0.112*** 0.112*** (0.0218) (0.0218) OID-Soc 0.00205 0.00154 (0.0332) (0.0332) OID-Env -0.0634* -0.0626 (0.0384) (0.0384) OID-Gov 0.0142 0.0141 (0.0401) (0.0401) Δ Employee KLD -0.000122 0.000837 (0.0147) (0.0147) Δ Society KLD -0.000123 -0.000106 (0.00982) (0.00982) Δ Environment KLD -0.00703 -0.00834 (0.0140) (0.0140) Δ Governance KLD 0.0182 0.0160 (0.0127) (0.0127) Firm Controls Yes Yes Yes Year Controls Yes Yes Yes Fixed Effects Industry Industry Industry Observations 15772 15772 15772 Adjusted R2 0.063 0.062 0.063
31
Table 5: SRI ownership and firm performance in a propensity-matched sample The table presents estimates from the regressions of changes in firm performance on an increase in SRI funds’ ownership in firms. We consider a sample that consists of firms with an increase in SRI funds ownership and their matched control firms with no increase. Our matching is based on the estimated propensity scores for the nearest neighbor within the same KLD score of each CSR area - (1) All, (2) Employee, (3) Society, (4) Environment, and (5) Governance. Dependent variable is the change in ROA between a given year and the following year. Main variables of interest are dummy variables on whether the aggregated ownership by the SRI funds that are focused on the specific CSR area is increased, compared to the prior year. Observations are based on firm-year level. Variable definitions are available in Table A.3 in Appendix. Firm control variables, industry fixed effects and year controls are included. Standard errors are robust and adjusted for clustering within firm. ***, **, and * indicate statistical significance at the 1%, 5%, and 10% level, respectively.
Change in ROA (1) (2) (3) (4) (5)
OID 0.0110 (0.52) OID-Emp 0.0810*** (3.16) OID-Soc -0.0101 (-0.20) OID-Env -0.0197 (-0.73) OID-Gov -0.0559* (-1.95) Firm Size 0.0366** 0.0147 0.0472 0.0334 0.0275 (2.36) (0.82) (1.39) (1.54) (1.30) M/B 0.0121 0.0202 0.102** 0.0277 0.0250 (0.98) (1.29) (2.37) (1.38) (1.56) ROA -2.630*** -2.787*** -3.441*** -3.015*** -2.876*** (-9.48) (-8.60) (-4.66) (-7.21) (-8.48) Leverage -0.00787 -0.00642 0.0304 0.000745 0.000950 (-0.49) (-0.36) (0.71) (0.03) (0.04) Return Volatility 0.000362 0.0345* 0.0740 0.0161 0.0411* (0.02) (1.78) (1.42) (0.80) (1.81) CAPX/Sales -0.0569** -0.0489 -0.173** -0.0795* -0.0405 (-2.19) (-1.36) (-2.41) (-1.89) (-1.13) Dividend 0.0203 0.0386** 0.0457 0.0315** 0.0548*** (1.46) (2.04) (1.11) (1.97) (3.29) Cash/Assets -0.119 0.0492 -0.0131 -0.0357 0.258 (-1.01) (0.36) (-0.05) (-0.19) (1.58) R&D/Sales -0.171** -0.151** -0.255*** -0.268*** -0.224** (-2.34) (-2.25) (-4.56) (-3.61) (-2.42) HHI 0.0299** 0.0137 0.0321 0.0210 0.0595*** (2.53) (1.00) (1.43) (1.30) (3.12) GDP Growth -3.753*** -2.777*** -1.049 -3.050*** -1.978*** (-7.15) (-4.70) (-0.79) (-4.20) (-2.75) Nasdaq Return -0.296*** -0.292*** -0.116* -0.296*** -0.248*** (-7.92) (-6.54) (-1.82) (-6.41) (-5.31) Fixed Effects Industry Industry Industry Industry Industry Observations 6890 5000 1264 3814 3756 Adjusted R2 0.069 0.077 0.091 0.071 0.069
32
Table 6: SRI ownership and firm financial performance The table presents estimates from the regressions of changes in firm financial performance on an overall increase in SRI funds’ ownership in firms. For these tests, we consider both the whole sample (in Panel A) and a sample that consists of firms with an overall increase in SRI funds ownership increase and their matched control firms with no increase that have non-missing matching variables (in Panel B). Our sample size for this analysis increases from 15,772 to 19.597, because in our original sample in Table 3 firms have missing change in ROA. Our matching is based on the estimated propensity scores for the nearest neighbor within the same KLD score of each CSR area. Dependent variable is the annual stock return. Main variables of interest are dummy variables on whether the aggregated ownership by the SRI funds that are focused on the specific CSR area (All, Environment, Employee, Society and Governance) is increased, compared to the prior year. Observations are based on firm-year level. The same firm control variables as in Table 3 are included. Variable definitions are available in Table A.3 in Appendix. Industry fixed effects and year controls are included. Standard errors are robust and adjusted for clustering within firm. ***, **, and * indicate statistical significance at the 1%, 5%, and 10% level, respectively.
Annual Stock Returns Panel A: Whole Sample Panel B: Propensity-Score Matched Sample (1) (2) (3) (4) (5) (6) (7) (8) (9) (10)
IOD 0.0469*** 0.0243**
(0.00789) (0.0100)
IOD-Emp 0.109*** 0.0972*** (0.00864) (0.0112)
IOD-Soc 0.0309** 0.0104 (0.0131) (0.0202)
IOD-Env 0.00867 -0.0150 (0.00880) (0.0122)
IOD-Gov 0.00482 -0.0136 (0.00872) (0.0120)
Firm Controls Yes Yes Yes Yes Yes Yes Yes Yes Yes Yes Year Controls Yes Yes Yes Yes Yes Yes Yes Yes Yes Yes Fixed Effects Industry Industry Industry Industry Industry Industry Industry Industry Industry Industry Observations 19597 19597 19597 19597 19597 8104 5412 1407 4760 4700 Adjusted R2 0.091 0.095 0.090 0.089 0.089 0.113 0.140 0.102 0.120 0.120
33
Table 7: SRI ownership and firm performance by industry competitiveness The table presents estimates from the regressions of changes in firm performance on an overall increase in SRI funds’ ownership in firms by industry competitiveness. For these tests, we consider competitive (in Panel A) and concentrated industry sample (in Panel B). Competitive (concentrated) industries are the industries in the top tercile of HHI. The dependent variable is the change in ROA between a given year and the following year. Main variables of interest are dummy variables on whether the aggregated ownership by the SRI funds that are focused on the specific CSR areas (All, Environment, Employee, Society and Governance) is increased, compared to the prior year. Observations are based on firm-year level. The same firm control variables as in Table 3 are included. Variable definitions are available in Table A.3 in Appendix. Industry fixed effects and year controls are included. Standard errors are robust and adjusted for clustering within firm. ***, **, and * indicate statistical significance at the 1%, 5%, and 10% level, respectively. Change in ROA Competitive Industry (HHI in Highest Tercile) Concentrated Industry (HHI in Lowest Tercile) (1) (2) (3) (4) (5) (6) (7) (8) (9) (10) OID -0.0334 0.0462
(0.0336) (0.0293)
OID-Emp 0.0945*** 0.0866** (0.0327) (0.0341) OID-Soc 0.0239 0.0298 (0.0619) (0.0485) OID-Env -0.111** 0.0338 (0.0449) (0.0319) OID-Gov -0.0943* 0.0369 (0.0481) (0.0319)
Firm Controls Yes Yes Yes Yes Yes Yes Yes Yes Yes Yes Year Controls Yes Yes Yes Yes Yes Yes Yes Yes Yes Yes Fixed Effects Industry Industry Industry Industry Industry Industry Industry Industry Industry Industry Observations 5106 5106 5106 5106 5106 5342 5342 5342 5342 5342 Adjusted R2 0.074 0.075 0.074 0.075 0.074 0.049 0.049 0.048 0.049 0.049
34
Table 8: Employee-focused SRI ownership and firm performance by industry The table presents estimates from the regressions of changes in firm performance on an overall increase in SRI funds’ ownership in firms by industry competitiveness. For these tests, we consider 10 different industry groups based on Fama-French 49 industry classifications. The dependent variable is the change in ROA between a given year and the following year. Main variables of interest are dummy variables on whether the aggregated ownership by the SRI funds that are focused on the employee area is increased, compared to the prior year. Observations are based on firm-year level. The same firm control variables as in Table 3 are included. Variable definitions are available in Table A.3 in Appendix. Industry fixed effects and year controls are included. Standard errors are robust and adjusted for clustering within firm. ***, **, and * indicate statistical significance at the 1%, 5%, and 10% level, respectively.
Change in ROA
Industry Groups
Manufacturing Construction
Mining & Energy Wholesale Retail Telecom Leisure Transport Services Finance
High-tech Low-tech
(1) (2) (3) (4) (5) (6) (7) (8) (9) (10) (11)
OID-Emp 0.188*** 0.0625 0.317*** 0.115 0.0410 0.104 -0.0579 0.103* 0.136 0.180*** -0.0414
(0.0483) (0.0404) (0.104) (0.0923) (0.0579) (0.0647) (0.0744) (0.0613) (0.141) (0.0627) (0.0328)
Firm Controls Yes Yes Yes Yes Yes Yes Yes Yes Yes Yes Yes
Year Controls Yes Yes Yes Yes Yes Yes Yes Yes Yes Yes Yes
Fixed Effects Industry Industry Industry Industry Industry Industry Industry Industry Industry Industry Industry
Observations 2257 3624 1233 1433 646 939 389 427 379 1213 3005
Adjusted R2 0.089 0.044 0.136 0.107 0.055 0.101 0.123 0.118 0.007 0.115 0.032
35
Table 9: SRI ownership and firm performance during financial crisis The table presents estimates from the regressions of changes in firm performance on an overall increase in SRI funds’ ownership in firms by industry competitiveness. For these tests, we consider the time period from 2007 to 2009, which represents the recent financial crisis. The dependent variable is the change in ROA between a given year and the following year. Main variables of interest are dummy variables on whether the aggregated ownership by the SRI funds that are focused on the specific CSR areas (Environment, Employee, Society and Governance) is increased, compared to the prior year. Observations are based on firm-year level. The same firm control variables as in Table 3 are included. Variable definitions are available in Table A.3 in Appendix. Industry fixed effects and year controls are included. Standard errors are robust and adjusted for clustering within firm. ***, **, and * indicate statistical significance at the 1%, 5%, and 10% level, respectively. Change in ROA
Financial Crisis Period (2007-2009)
(1) (2) (3) (4) (5)
OID 0.0199 (0.0357)
OID-Emp 0.0704*
(0.0399) OID-Soc -0.0729
(0.0610)
OID-Env -0.000320 (0.0423)
OID-Gov 0.0230 (0.0475)
Firm Controls Yes Yes Yes Yes Yes Year Controls Yes Yes Yes Yes Yes Fixed Effects Industry Industry Industry Industry Industry
Observations 5750 5750 5750 5750 5750
Adjusted R2 0.115 0.115 0.115 0.115 0.115
36
Table 10: Analyses including additional employee-related factors The table presents estimates from the regressions of changes in firm performance on an overall increase in SRI funds’ ownership in firms by industry competitiveness. For these tests, we additionally consider controls for other potential employee-related factors. “Employee” is the total number of employees in a firm. “Employee-Change” is the difference in the total number of employees between a given year and the prior year. “E-Turnover” is the employee turnover in a firm, which is Employee-Change over the total employee number of the prior year. The dependent variable is the change in ROA between a given year and the following year. Main variables of interest are dummy variables on whether the aggregated ownership by the SRI funds that are focused on the employee area is increased, compared to the prior year. Observations are based on firm-year level. The same firm control variables as in Table 3 are included. Variable definitions are available in Table A.3 in Appendix. Industry fixed effects and year controls are included. Standard errors are robust and adjusted for clustering within firm. ***, **, and * indicate statistical significance at the 1%, 5%, and 10% level, respectively. Change in ROA (1) (2) (3) OID-Emp 0.104*** 0.101*** 0.104*** (0.0198) (0.0198) (0.0200) Employee 0.000804** (0.000318) Employee-Change 0.0125*** (0.00330) E-Turnover 0.000757** (0.000312) Firm Controls Yes Yes Yes Year Controls Yes Yes Yes Fixed Effects Industry Industry Industry Observations 15667 15645 15583 Adjusted R2 0.063 0.063 0.063
37
Figure 1: Firm CSR scores by different CSR areas This figure displays firm CSR over time for All, Employee, Society, Environment, and Governance areas using KLD scores for our sample period from 2003 to 2012. Variable definitions are available in Table A.3 in Appendix.
38
Figure 2: Changes in SRI fund ownership and firm performance The figure displays the changes in firm performance in the solid line and the aggregate SRI ownership in firms in the dash line for our sample period from 2003 to 2012. Variable definitions are available in Table A.3 in Appendix.
-.1-.0
50
.05
.1.1
5C
hang
e in
Firm
Per
form
ance
-.10
.1.2
Perc
enta
ge C
hang
e in
SR
I Ow
ners
hip
2002 2004 2006 2008 2010 2012Year
Percentage Change in SRI Ownership Change in Firm Performance
39
Appendix Table A.1: Match between Bloomberg ESG SRI funds and Thomson Reuters S12 funds
Bloomberg ESG fund name Fund type Thomson Reuters S12 fund name Thomson Reuters S12 fund number Reason of exclusion
1 Access Capital Community Investment Fund A Fixed-income funds Excluded Fixed-income funds 2 Access Capital Community Investment Fund I Fixed-income funds Excluded Fixed-income funds 3 Appleseed Fund Global Equity funds APPLESEED FUND 81069 4 Appleseed Fund Institutional Global Equity funds APPLESEED FUND 81069 5 Ariel Appreciation Fund Equity funds ARIEL APPRECIATION FUND 8787 6 Ariel Discovery Fund Equity funds Excluded Inception during sample period (1/31/2011) 7 Ariel Focus Fund Equity funds ARIEL FOCUS FUND 80378 8 Ariel Fund Equity funds ARIEL FUND 8792 9 Azzad Ethical Mid Cap Fund Equity funds AZZAD ETHICAL MID CAP FU 60305 10 Azzad Wise Capital Fund Fixed-income funds Excluded Fixed-income funds
Inception during sample period (4/1/2010) 11 Brown Advisory Sustainable Growth Fund Equity funds Excluded Inception during sample period (6/29/2012) 12 Calvert Aggressive Allocation Fund A Equity funds CALVERT AGGRESSIVE ALLOC 63674 13 Calvert Aggressive Allocation Fund C Equity funds CALVERT AGGRESSIVE ALLOC 63674 14 Calvert Balanced Portfolio A Equity funds CALVERT BALANCED FUND 8820 15 Calvert Balanced Portfolio C Equity funds CALVERT BALANCED FUND 8820 16 Calvert Balanced Portfolio I Equity funds CALVERT BALANCED FUND 8820 17 Calvert Bond Portfolio A Fixed-income funds Excluded Fixed-income funds 18 Calvert Bond Portfolio C Fixed-income funds Excluded Fixed-income funds 19 Calvert Bond Portfolio I Fixed-income funds Excluded Fixed-income funds 20 Calvert Bond Portfolio Y Fixed-income funds Excluded Fixed-income funds 21 Calvert Capital Accumulation A Equity funds CALVERT CAP ACCUMULATION 230 22 Calvert Capital Accumulation C Equity funds CALVERT CAP ACCUMULATION 230 23 Calvert Capital Accumulation I Equity funds CALVERT CAP ACCUMULATION 230 24 Calvert Capital Accumulation Y Equity funds CALVERT CAP ACCUMULATION 230 25 Calvert Conservative Allocation Fund A Equity funds CALVERT CONSERVATIVE ALL 80343 26 Calvert Conservative Allocation Fund C Equity funds CALVERT CONSERVATIVE ALL 80343 27 Calvert Equity Portfolio A Equity funds CALVERT EQUITY PORTFOLIO 8821 28 Calvert Equity Portfolio C Equity funds CALVERT EQUITY PORTFOLIO 8821
40
29 Calvert Equity Portfolio I Equity funds CALVERT EQUITY PORTFOLIO 8821 30 Calvert Equity Portfolio Y Equity funds CALVERT EQUITY PORTFOLIO 8821 31 Calvert Global Alternative Energy Fund A Global Equity funds CALVERT GBL ALTERNATIVE 82531 32 Calvert Global Alternative Energy Fund C Global Equity funds CALVERT GBL ALTERNATIVE 82531 33 Calvert Global Alternative Energy Fund I Global Equity funds CALVERT GBL ALTERNATIVE 82531 34 Calvert Global Water Fund A Global Equity funds Not matched 35 Calvert Global Water Fund C Global Equity funds Not matched 36 Calvert Global Water Fund Y Global Equity funds Not matched 37 Calvert International Equity Fund A Global Equity funds CALVERT INTL EQUITY FUND 8823 38 Calvert International Equity Fund C Global Equity funds CALVERT INTL EQUITY FUND 8823 39 Calvert International Equity Fund I Global Equity funds CALVERT INTL EQUITY FUND 8823 40 Calvert International Equity Fund Y Global Equity funds CALVERT INTL EQUITY FUND 8823 41 Calvert International Opportunities Fund A Global Equity funds CALVERT INTL OPPORTUNITI 82529 42 Calvert International Opportunities Fund Y Global Equity funds CALVERT INTL OPPORTUNITI 82529 43 Calvert International Opportunties Fund C Global Equity funds CALVERT INTL OPPORTUNITI 82529 44 Calvert Large Cap Core Portfolio A Equity funds Not matched 45 Calvert Large Cap Core Portfolio C Equity funds Not matched 46 Calvert Large Cap Core Portfolio I Equity funds Not matched 47 Calvert Moderate Allocation Fund A Equity funds CALVERT MODERATE ALLOCAT 80344 48 Calvert Moderate Allocation Fund C Equity funds CALVERT MODERATE ALLOCAT 80344 49 Calvert Small Cap Fund A Equity funds CALVERT SMALL CAP FUND 45062 50 Calvert Small Cap Fund C Equity funds CALVERT SMALL CAP FUND 45062 51 Calvert Small Cap Fund I Equity funds CALVERT SMALL CAP FUND 45062 52 Calvert Social Index A Equity funds CALVERT SOCIAL INDEX FUN 55124 53 Calvert Social Index C Equity funds CALVERT SOCIAL INDEX FUN 55124 54 Calvert Social Index I Equity funds CALVERT SOCIAL INDEX FUN 55124 55 CCM Alternative Income Fund Equity funds Excluded Inception during sample period (5/31/2013) 56 CNI Charter Socially Responsible Equity Fund Equity funds CNI CHARTER SOCIALLY RES 46601 57 CRA Qualified Investment - CRA Fixed-income funds Excluded Fixed-income funds 58 CRA Qualified Investment - Institutional Fixed-income funds Excluded Fixed-income funds 59 CRA Qualified Investment - Retail Fixed-income funds Excluded Fixed-income funds 60 Domini International Social Equity Fund -- A shares Global Equity funds Not matched 61 Domini International Social Equity Fund -- Institutional shares Global Equity funds Not matched 62 Domini International Social Equity Fund -- Investor shares Global Equity funds Not matched
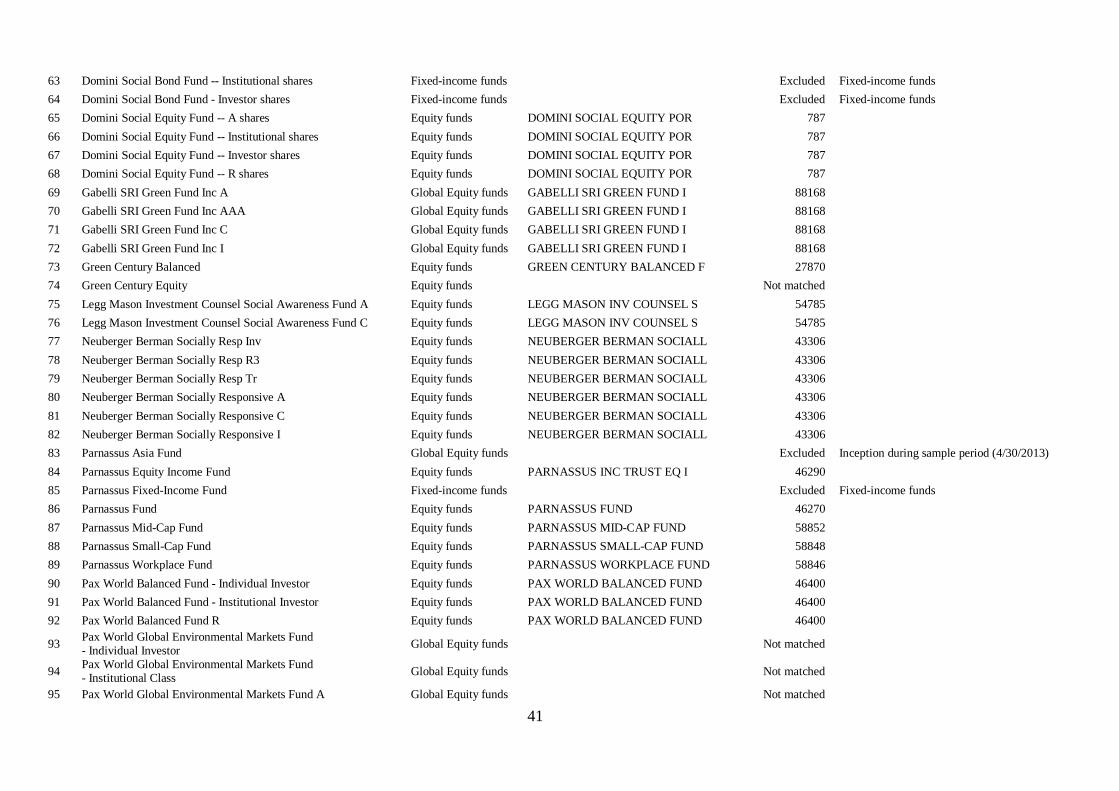
41
63 Domini Social Bond Fund -- Institutional shares Fixed-income funds Excluded Fixed-income funds 64 Domini Social Bond Fund - Investor shares Fixed-income funds Excluded Fixed-income funds 65 Domini Social Equity Fund -- A shares Equity funds DOMINI SOCIAL EQUITY POR 787 66 Domini Social Equity Fund -- Institutional shares Equity funds DOMINI SOCIAL EQUITY POR 787 67 Domini Social Equity Fund -- Investor shares Equity funds DOMINI SOCIAL EQUITY POR 787 68 Domini Social Equity Fund -- R shares Equity funds DOMINI SOCIAL EQUITY POR 787 69 Gabelli SRI Green Fund Inc A Global Equity funds GABELLI SRI GREEN FUND I 88168 70 Gabelli SRI Green Fund Inc AAA Global Equity funds GABELLI SRI GREEN FUND I 88168 71 Gabelli SRI Green Fund Inc C Global Equity funds GABELLI SRI GREEN FUND I 88168 72 Gabelli SRI Green Fund Inc I Global Equity funds GABELLI SRI GREEN FUND I 88168 73 Green Century Balanced Equity funds GREEN CENTURY BALANCED F 27870 74 Green Century Equity Equity funds Not matched 75 Legg Mason Investment Counsel Social Awareness Fund A Equity funds LEGG MASON INV COUNSEL S 54785 76 Legg Mason Investment Counsel Social Awareness Fund C Equity funds LEGG MASON INV COUNSEL S 54785 77 Neuberger Berman Socially Resp Inv Equity funds NEUBERGER BERMAN SOCIALL 43306 78 Neuberger Berman Socially Resp R3 Equity funds NEUBERGER BERMAN SOCIALL 43306 79 Neuberger Berman Socially Resp Tr Equity funds NEUBERGER BERMAN SOCIALL 43306 80 Neuberger Berman Socially Responsive A Equity funds NEUBERGER BERMAN SOCIALL 43306 81 Neuberger Berman Socially Responsive C Equity funds NEUBERGER BERMAN SOCIALL 43306 82 Neuberger Berman Socially Responsive I Equity funds NEUBERGER BERMAN SOCIALL 43306 83 Parnassus Asia Fund Global Equity funds Excluded Inception during sample period (4/30/2013) 84 Parnassus Equity Income Fund Equity funds PARNASSUS INC TRUST EQ I 46290 85 Parnassus Fixed-Income Fund Fixed-income funds Excluded Fixed-income funds 86 Parnassus Fund Equity funds PARNASSUS FUND 46270 87 Parnassus Mid-Cap Fund Equity funds PARNASSUS MID-CAP FUND 58852 88 Parnassus Small-Cap Fund Equity funds PARNASSUS SMALL-CAP FUND 58848 89 Parnassus Workplace Fund Equity funds PARNASSUS WORKPLACE FUND 58846 90 Pax World Balanced Fund - Individual Investor Equity funds PAX WORLD BALANCED FUND 46400 91 Pax World Balanced Fund - Institutional Investor Equity funds PAX WORLD BALANCED FUND 46400 92 Pax World Balanced Fund R Equity funds PAX WORLD BALANCED FUND 46400 93 Pax World Global Environmental Markets Fund
- Individual Investor Global Equity funds Not matched
94 Pax World Global Environmental Markets Fund - Institutional Class Global Equity funds Not matched
95 Pax World Global Environmental Markets Fund A Global Equity funds Not matched
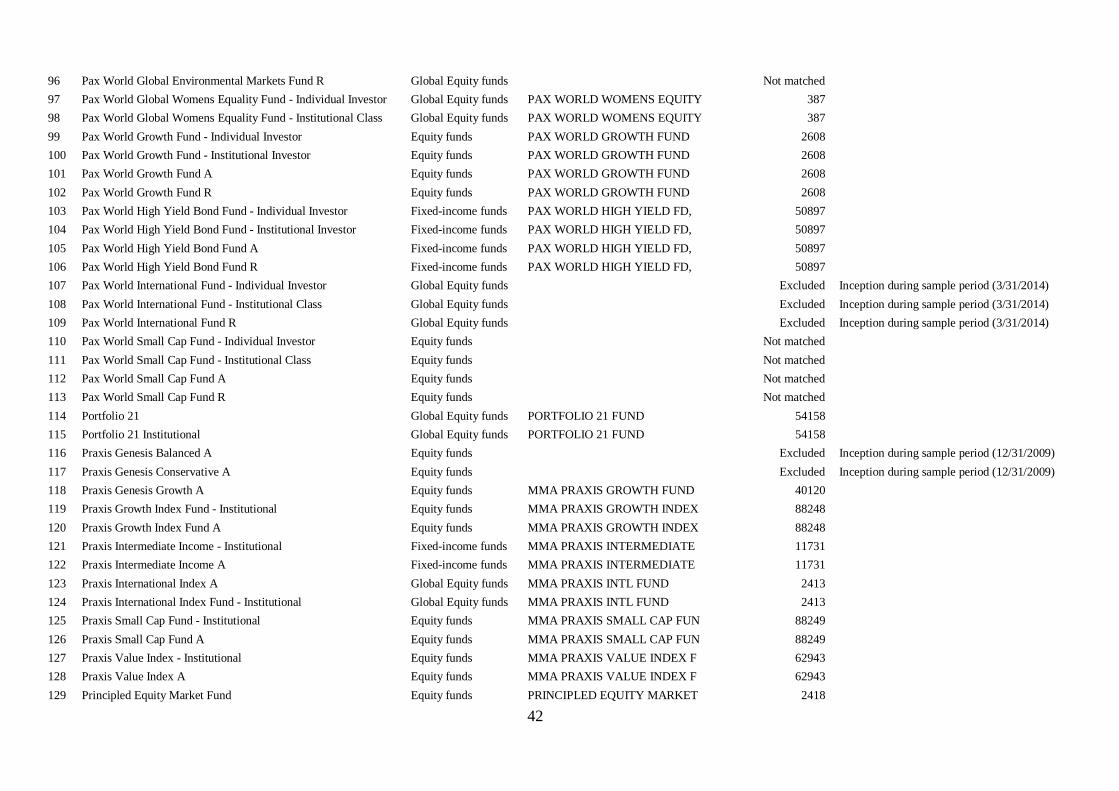
42
96 Pax World Global Environmental Markets Fund R Global Equity funds Not matched 97 Pax World Global Womens Equality Fund - Individual Investor Global Equity funds PAX WORLD WOMENS EQUITY 387 98 Pax World Global Womens Equality Fund - Institutional Class Global Equity funds PAX WORLD WOMENS EQUITY 387 99 Pax World Growth Fund - Individual Investor Equity funds PAX WORLD GROWTH FUND 2608 100 Pax World Growth Fund - Institutional Investor Equity funds PAX WORLD GROWTH FUND 2608 101 Pax World Growth Fund A Equity funds PAX WORLD GROWTH FUND 2608 102 Pax World Growth Fund R Equity funds PAX WORLD GROWTH FUND 2608 103 Pax World High Yield Bond Fund - Individual Investor Fixed-income funds PAX WORLD HIGH YIELD FD, 50897 104 Pax World High Yield Bond Fund - Institutional Investor Fixed-income funds PAX WORLD HIGH YIELD FD, 50897 105 Pax World High Yield Bond Fund A Fixed-income funds PAX WORLD HIGH YIELD FD, 50897 106 Pax World High Yield Bond Fund R Fixed-income funds PAX WORLD HIGH YIELD FD, 50897 107 Pax World International Fund - Individual Investor Global Equity funds Excluded Inception during sample period (3/31/2014) 108 Pax World International Fund - Institutional Class Global Equity funds Excluded Inception during sample period (3/31/2014) 109 Pax World International Fund R Global Equity funds Excluded Inception during sample period (3/31/2014) 110 Pax World Small Cap Fund - Individual Investor Equity funds Not matched 111 Pax World Small Cap Fund - Institutional Class Equity funds Not matched 112 Pax World Small Cap Fund A Equity funds Not matched 113 Pax World Small Cap Fund R Equity funds Not matched 114 Portfolio 21 Global Equity funds PORTFOLIO 21 FUND 54158 115 Portfolio 21 Institutional Global Equity funds PORTFOLIO 21 FUND 54158 116 Praxis Genesis Balanced A Equity funds Excluded Inception during sample period (12/31/2009) 117 Praxis Genesis Conservative A Equity funds Excluded Inception during sample period (12/31/2009) 118 Praxis Genesis Growth A Equity funds MMA PRAXIS GROWTH FUND 40120 119 Praxis Growth Index Fund - Institutional Equity funds MMA PRAXIS GROWTH INDEX 88248 120 Praxis Growth Index Fund A Equity funds MMA PRAXIS GROWTH INDEX 88248 121 Praxis Intermediate Income - Institutional Fixed-income funds MMA PRAXIS INTERMEDIATE 11731 122 Praxis Intermediate Income A Fixed-income funds MMA PRAXIS INTERMEDIATE 11731 123 Praxis International Index A Global Equity funds MMA PRAXIS INTL FUND 2413 124 Praxis International Index Fund - Institutional Global Equity funds MMA PRAXIS INTL FUND 2413 125 Praxis Small Cap Fund - Institutional Equity funds MMA PRAXIS SMALL CAP FUN 88249 126 Praxis Small Cap Fund A Equity funds MMA PRAXIS SMALL CAP FUN 88249 127 Praxis Value Index - Institutional Equity funds MMA PRAXIS VALUE INDEX F 62943 128 Praxis Value Index A Equity funds MMA PRAXIS VALUE INDEX F 62943 129 Principled Equity Market Fund Equity funds PRINCIPLED EQUITY MARKET 2418
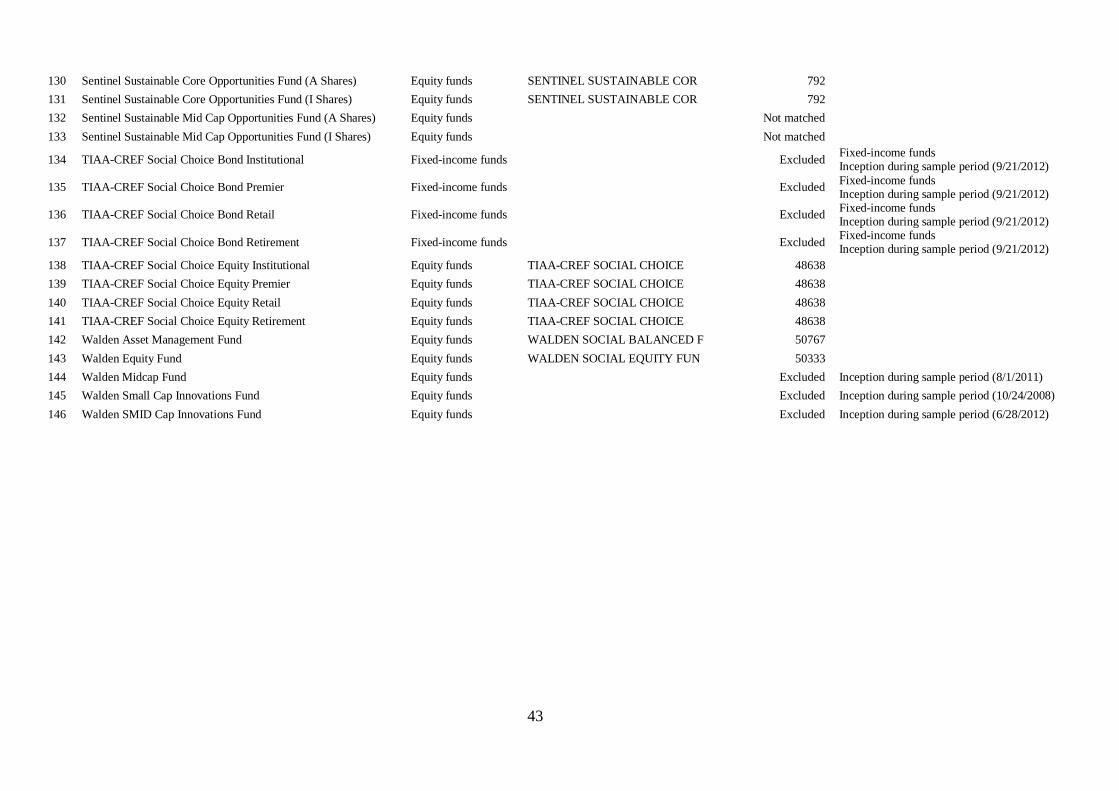
43
130 Sentinel Sustainable Core Opportunities Fund (A Shares) Equity funds SENTINEL SUSTAINABLE COR 792 131 Sentinel Sustainable Core Opportunities Fund (I Shares) Equity funds SENTINEL SUSTAINABLE COR 792 132 Sentinel Sustainable Mid Cap Opportunities Fund (A Shares) Equity funds Not matched 133 Sentinel Sustainable Mid Cap Opportunities Fund (I Shares) Equity funds Not matched 134 TIAA-CREF Social Choice Bond Institutional Fixed-income funds Excluded Fixed-income funds
Inception during sample period (9/21/2012)
135 TIAA-CREF Social Choice Bond Premier Fixed-income funds Excluded Fixed-income funds Inception during sample period (9/21/2012)
136 TIAA-CREF Social Choice Bond Retail Fixed-income funds Excluded Fixed-income funds Inception during sample period (9/21/2012)
137 TIAA-CREF Social Choice Bond Retirement Fixed-income funds Excluded Fixed-income funds Inception during sample period (9/21/2012)
138 TIAA-CREF Social Choice Equity Institutional Equity funds TIAA-CREF SOCIAL CHOICE 48638 139 TIAA-CREF Social Choice Equity Premier Equity funds TIAA-CREF SOCIAL CHOICE 48638 140 TIAA-CREF Social Choice Equity Retail Equity funds TIAA-CREF SOCIAL CHOICE 48638 141 TIAA-CREF Social Choice Equity Retirement Equity funds TIAA-CREF SOCIAL CHOICE 48638 142 Walden Asset Management Fund Equity funds WALDEN SOCIAL BALANCED F 50767 143 Walden Equity Fund Equity funds WALDEN SOCIAL EQUITY FUN 50333 144 Walden Midcap Fund Equity funds Excluded Inception during sample period (8/1/2011) 145 Walden Small Cap Innovations Fund Equity funds Excluded Inception during sample period (10/24/2008) 146 Walden SMID Cap Innovations Fund Equity funds Excluded Inception during sample period (6/28/2012)
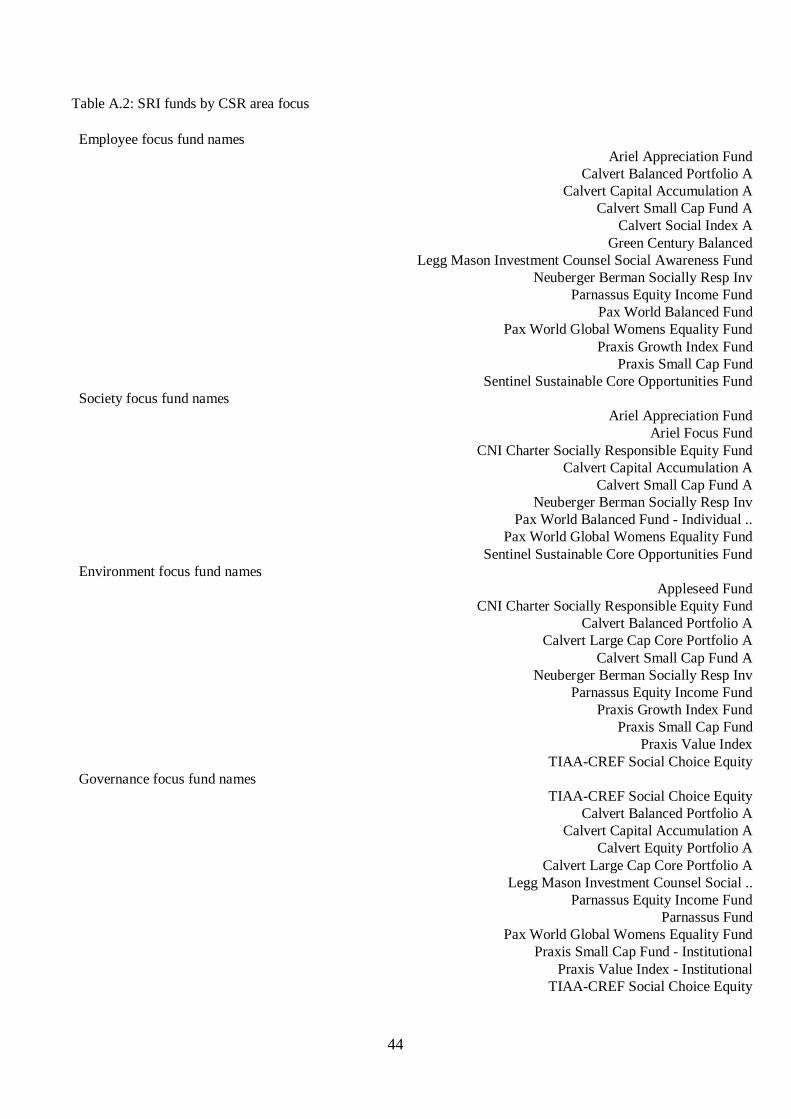
44
Table A.2: SRI funds by CSR area focus
Employee focus fund names Ariel Appreciation Fund
Calvert Balanced Portfolio A Calvert Capital Accumulation A
Calvert Small Cap Fund A Calvert Social Index A
Green Century Balanced Legg Mason Investment Counsel Social Awareness Fund
Neuberger Berman Socially Resp Inv Parnassus Equity Income Fund
Pax World Balanced Fund Pax World Global Womens Equality Fund
Praxis Growth Index Fund Praxis Small Cap Fund
Sentinel Sustainable Core Opportunities Fund Society focus fund names
Ariel Appreciation Fund Ariel Focus Fund
CNI Charter Socially Responsible Equity Fund Calvert Capital Accumulation A
Calvert Small Cap Fund A Neuberger Berman Socially Resp Inv
Pax World Balanced Fund - Individual .. Pax World Global Womens Equality Fund
Sentinel Sustainable Core Opportunities Fund Environment focus fund names
Appleseed Fund CNI Charter Socially Responsible Equity Fund
Calvert Balanced Portfolio A Calvert Large Cap Core Portfolio A
Calvert Small Cap Fund A Neuberger Berman Socially Resp Inv
Parnassus Equity Income Fund Praxis Growth Index Fund
Praxis Small Cap Fund Praxis Value Index
TIAA-CREF Social Choice Equity Governance focus fund names
TIAA-CREF Social Choice Equity Calvert Balanced Portfolio A
Calvert Capital Accumulation A Calvert Equity Portfolio A
Calvert Large Cap Core Portfolio A Legg Mason Investment Counsel Social ..
Parnassus Equity Income Fund Parnassus Fund
Pax World Global Womens Equality Fund Praxis Small Cap Fund - Institutional
Praxis Value Index - Institutional TIAA-CREF Social Choice Equity
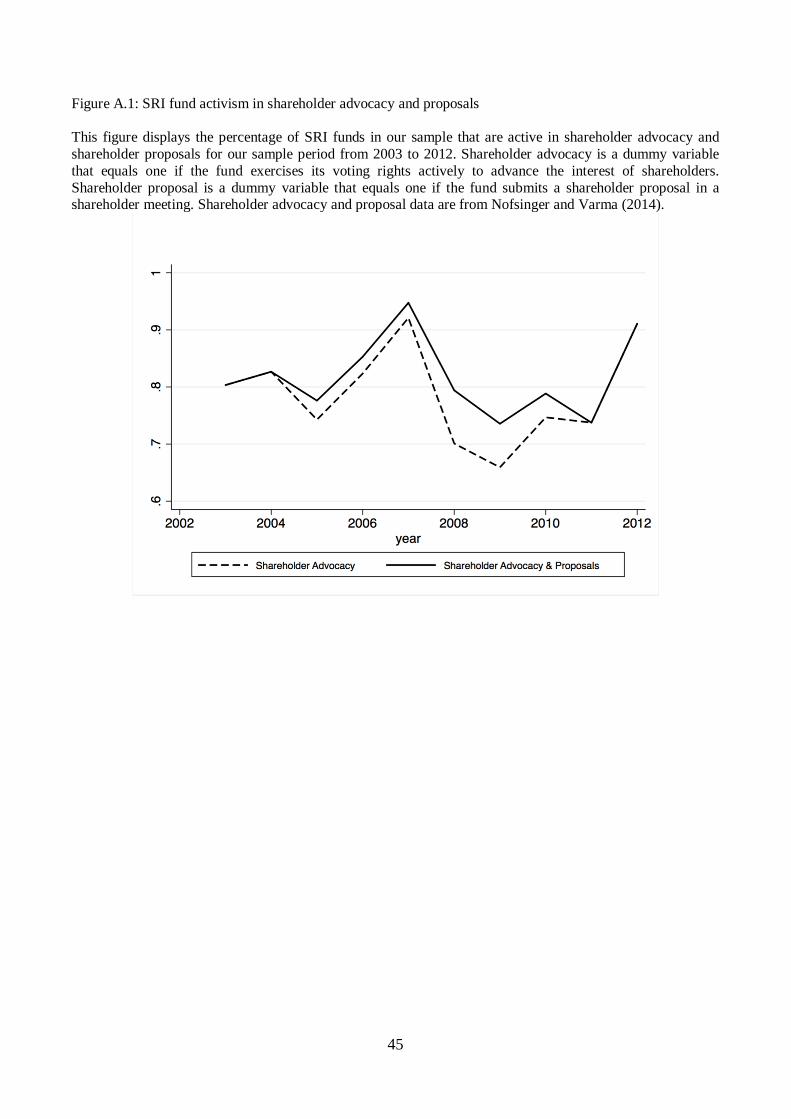
45
Figure A.1: SRI fund activism in shareholder advocacy and proposals This figure displays the percentage of SRI funds in our sample that are active in shareholder advocacy and shareholder proposals for our sample period from 2003 to 2012. Shareholder advocacy is a dummy variable that equals one if the fund exercises its voting rights actively to advance the interest of shareholders. Shareholder proposal is a dummy variable that equals one if the fund submits a shareholder proposal in a shareholder meeting. Shareholder advocacy and proposal data are from Nofsinger and Varma (2014).
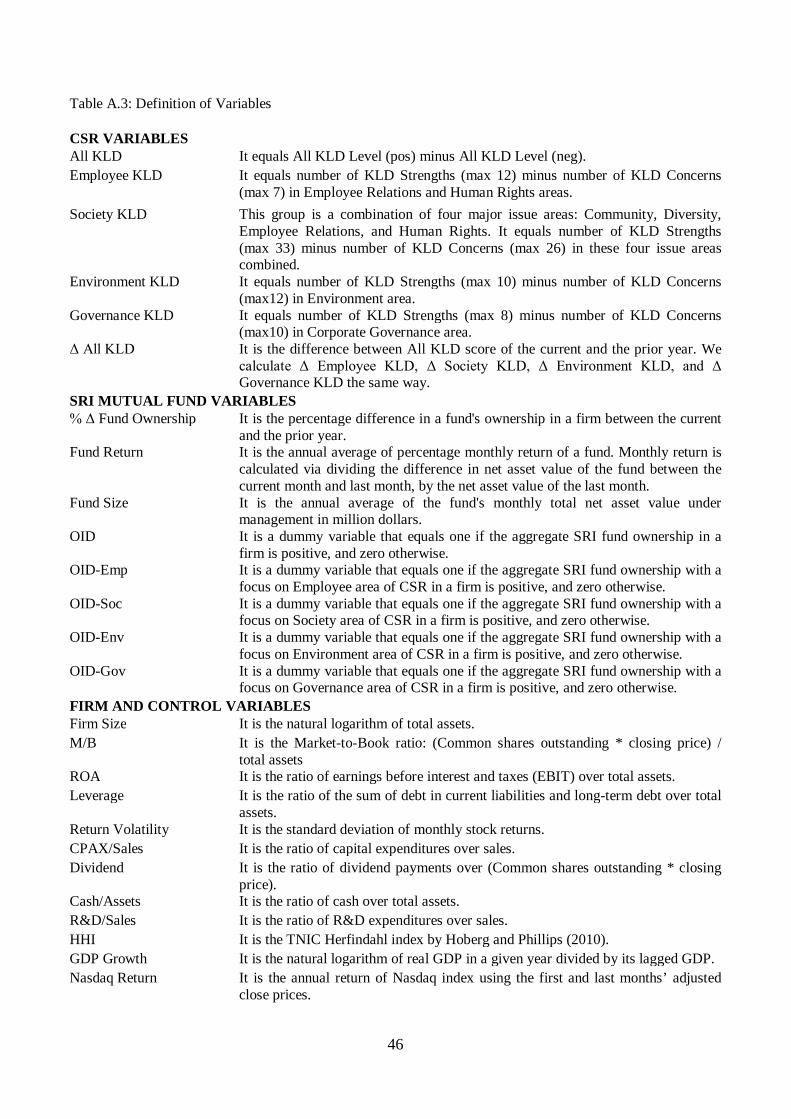
46
Table A.3: Definition of Variables CSR VARIABLES All KLD It equals All KLD Level (pos) minus All KLD Level (neg). Employee KLD It equals number of KLD Strengths (max 12) minus number of KLD Concerns
(max 7) in Employee Relations and Human Rights areas. Society KLD This group is a combination of four major issue areas: Community, Diversity,
Employee Relations, and Human Rights. It equals number of KLD Strengths (max 33) minus number of KLD Concerns (max 26) in these four issue areas combined.
Environment KLD
It equals number of KLD Strengths (max 10) minus number of KLD Concerns (max12) in Environment area.
Governance KLD It equals number of KLD Strengths (max 8) minus number of KLD Concerns (max10) in Corporate Governance area.
Δ All KLD It is the difference between All KLD score of the current and the prior year. We calculate Δ Employee KLD, Δ Society KLD, Δ Environment KLD, and Δ Governance KLD the same way.
SRI MUTUAL FUND VARIABLES % Δ Fund Ownership It is the percentage difference in a fund's ownership in a firm between the current
and the prior year. Fund Return It is the annual average of percentage monthly return of a fund. Monthly return is
calculated via dividing the difference in net asset value of the fund between the current month and last month, by the net asset value of the last month.
Fund Size It is the annual average of the fund's monthly total net asset value under management in million dollars.
OID It is a dummy variable that equals one if the aggregate SRI fund ownership in a firm is positive, and zero otherwise.
OID-Emp It is a dummy variable that equals one if the aggregate SRI fund ownership with a focus on Employee area of CSR in a firm is positive, and zero otherwise.
OID-Soc It is a dummy variable that equals one if the aggregate SRI fund ownership with a focus on Society area of CSR in a firm is positive, and zero otherwise.
OID-Env It is a dummy variable that equals one if the aggregate SRI fund ownership with a focus on Environment area of CSR in a firm is positive, and zero otherwise.
OID-Gov It is a dummy variable that equals one if the aggregate SRI fund ownership with a focus on Governance area of CSR in a firm is positive, and zero otherwise.
FIRM AND CONTROL VARIABLES Firm Size It is the natural logarithm of total assets. M/B It is the Market-to-Book ratio: (Common shares outstanding * closing price) /
total assets ROA It is the ratio of earnings before interest and taxes (EBIT) over total assets. Leverage It is the ratio of the sum of debt in current liabilities and long-term debt over total
assets. Return Volatility It is the standard deviation of monthly stock returns. CPAX/Sales It is the ratio of capital expenditures over sales. Dividend It is the ratio of dividend payments over (Common shares outstanding * closing
price). Cash/Assets It is the ratio of cash over total assets. R&D/Sales It is the ratio of R&D expenditures over sales. HHI It is the TNIC Herfindahl index by Hoberg and Phillips (2010). GDP Growth It is the natural logarithm of real GDP in a given year divided by its lagged GDP. Nasdaq Return It is the annual return of Nasdaq index using the first and last months’ adjusted
close prices.