what is a... geographicinformationsystemgis. ... a conceptual definition
Post on 21-Dec-2015
220 views
TRANSCRIPT
What is a ...
GeographicGeographic
InformationInformation
SystemSystem
GG
II
SS
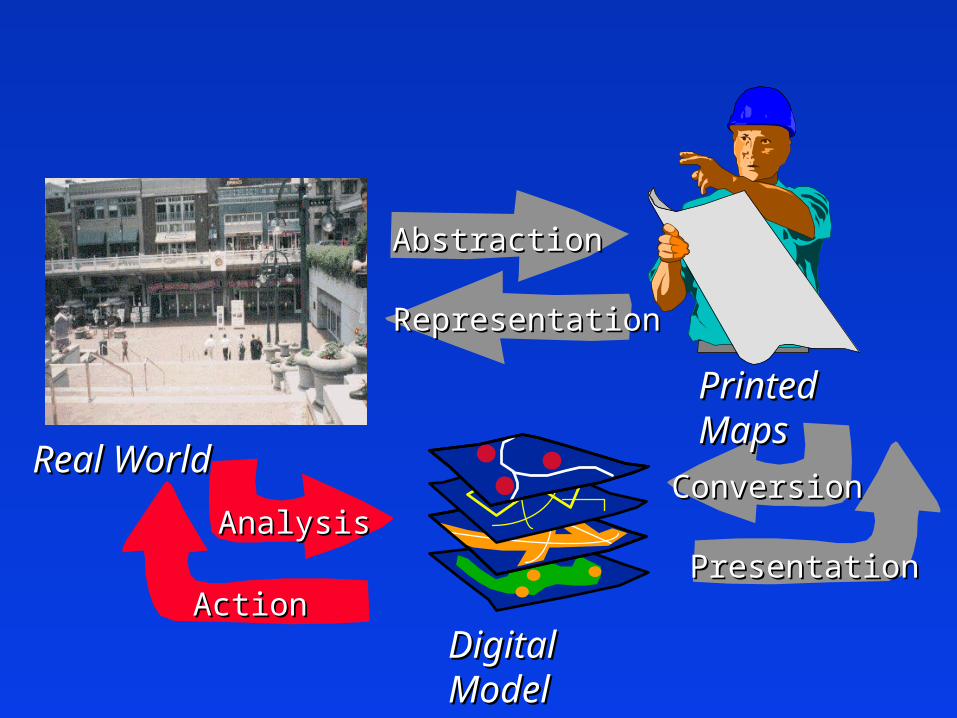
.. .. . a conceptual definition. a conceptual definition
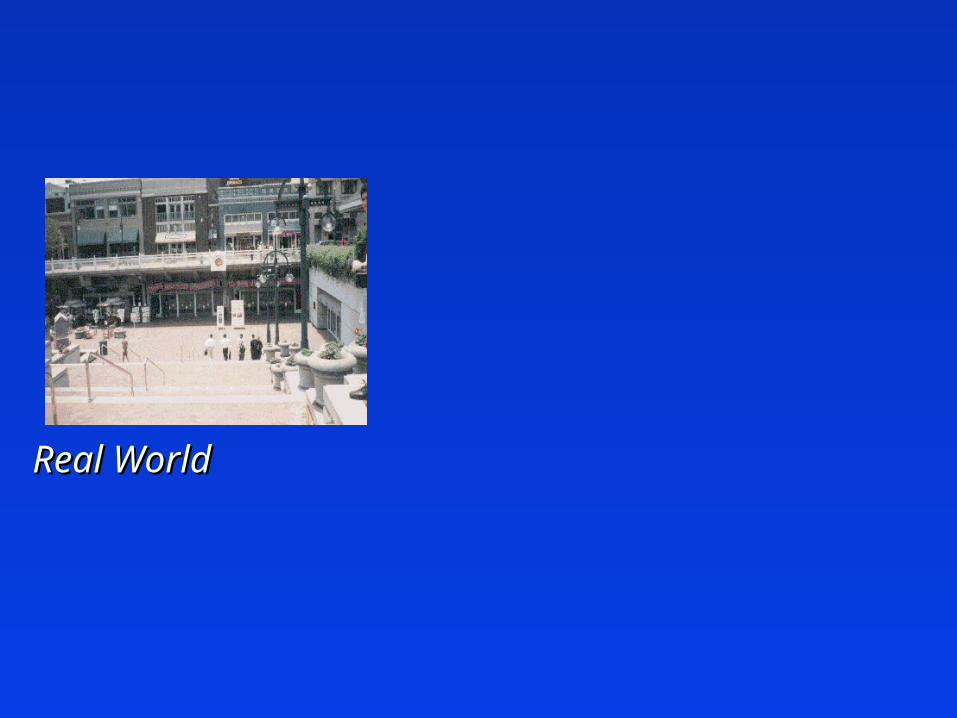
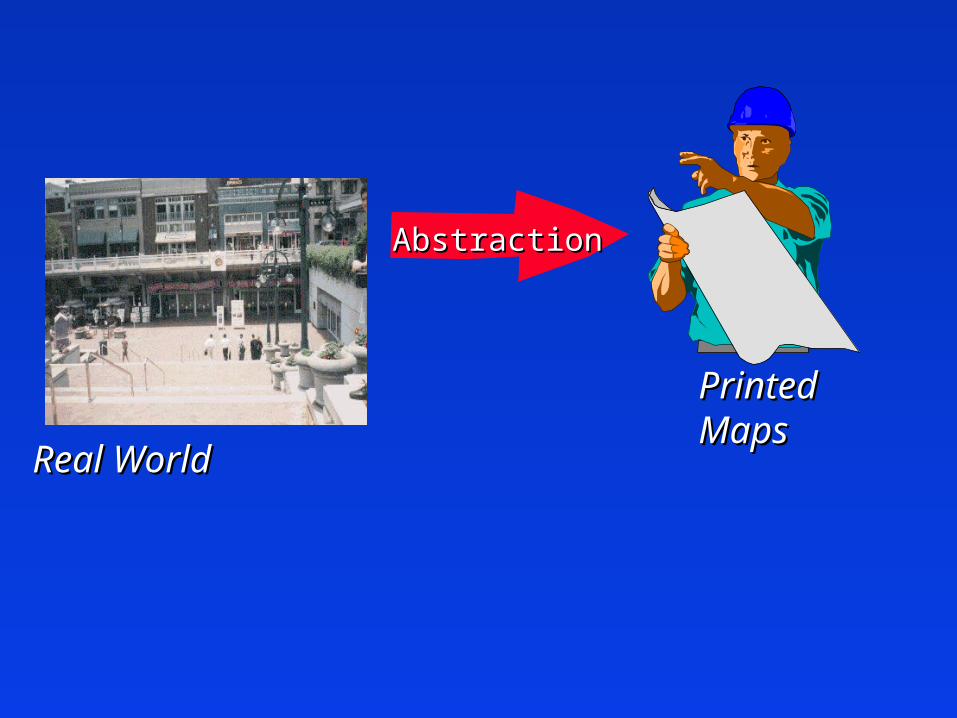
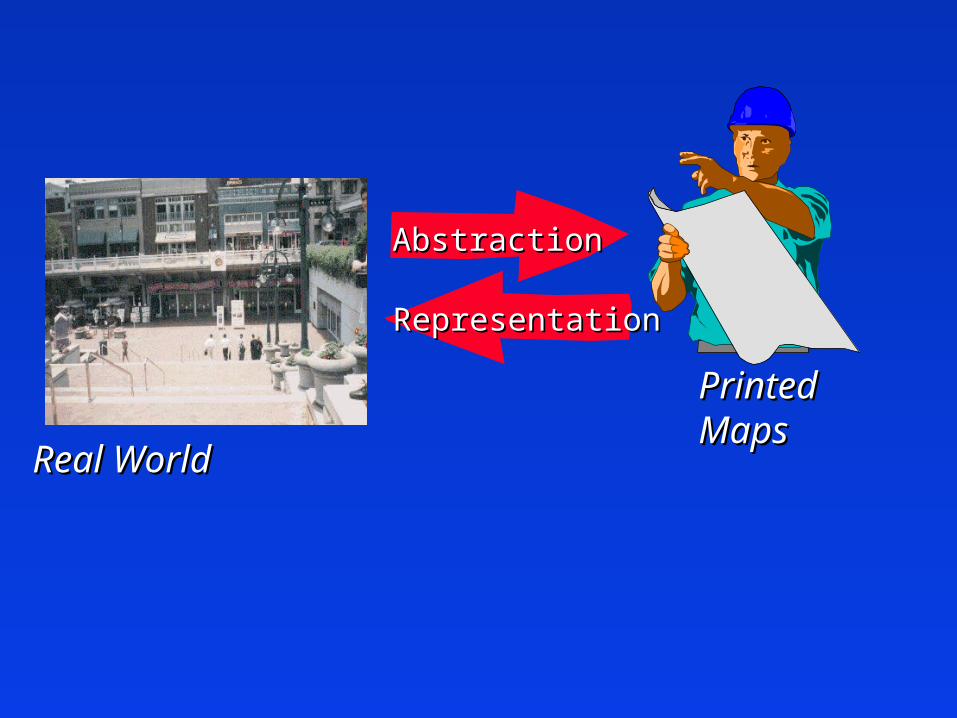
Real Real WorldWorld
Real Real WorldWorld
AbstractionAbstraction
Printed Printed MapsMaps
Real Real WorldWorld
AbstractionAbstraction
RepresentationRepresentation
Printed Printed MapsMaps
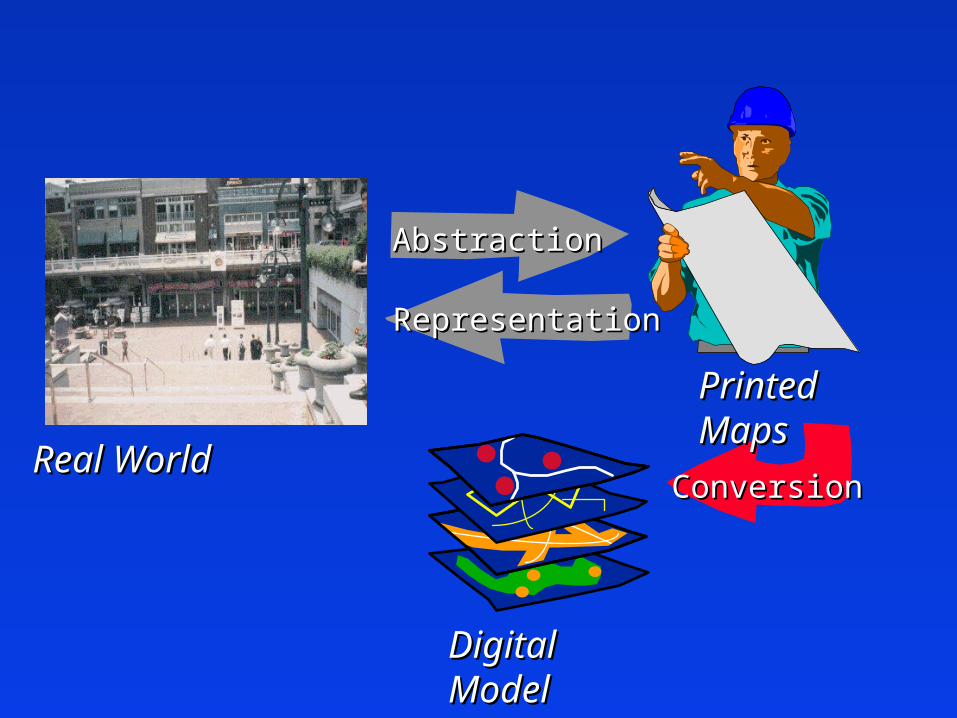
Real Real WorldWorld
AbstractionAbstraction
RepresentationRepresentation
ConversionConversion
Printed Printed MapsMaps
Digital Digital ModelModel
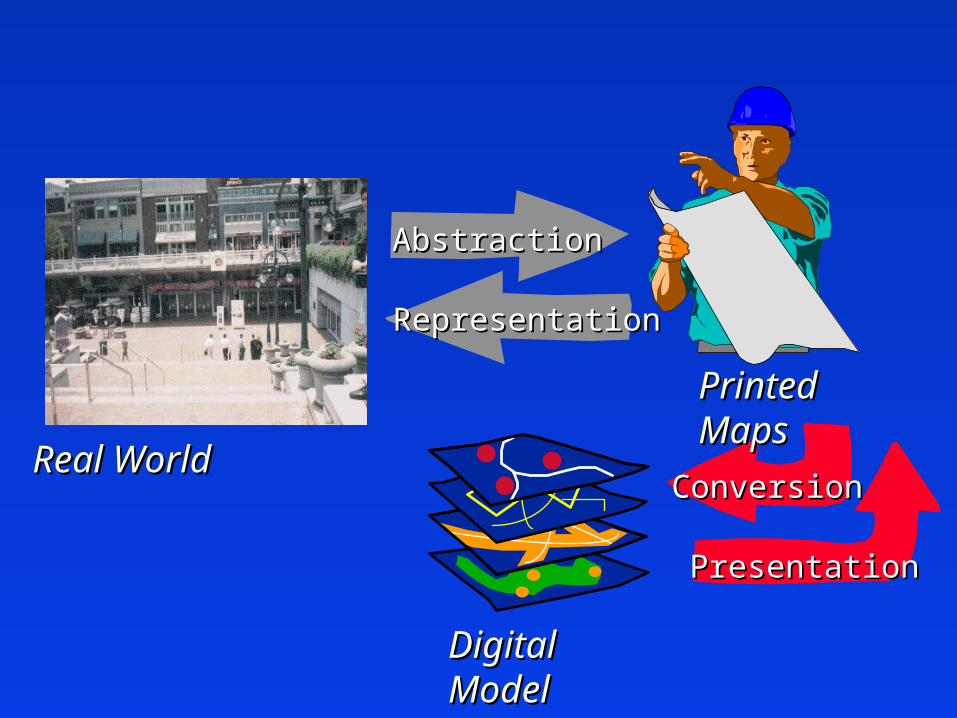
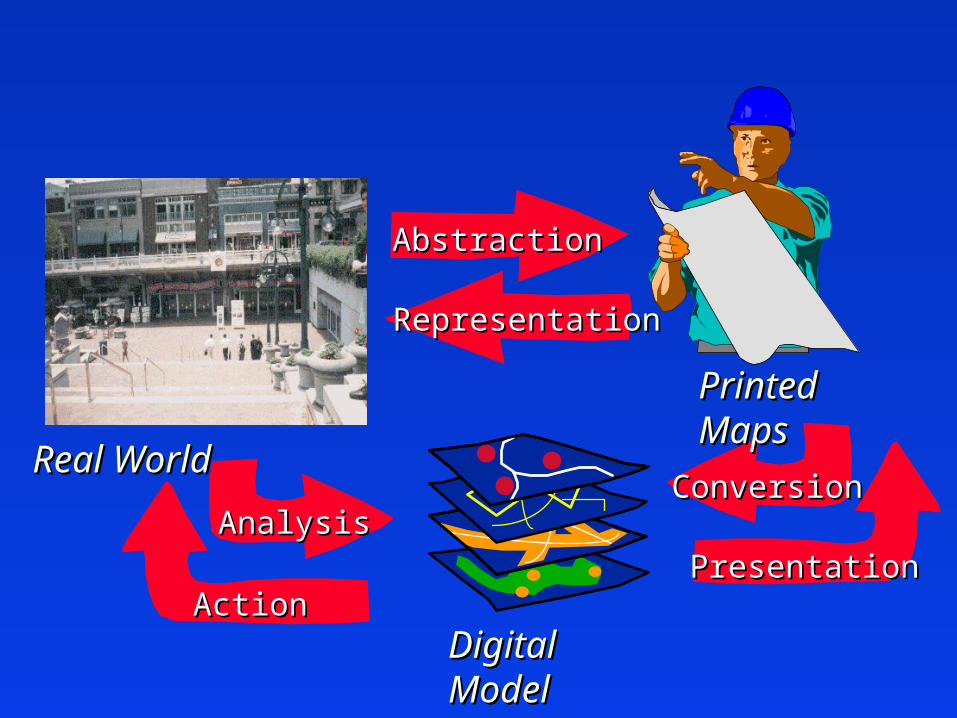
Real Real WorldWorld
AbstractionAbstraction
RepresentationRepresentation
ConversionConversion
PresentationPresentation
Printed Printed MapsMaps
Digital Digital ModelModel
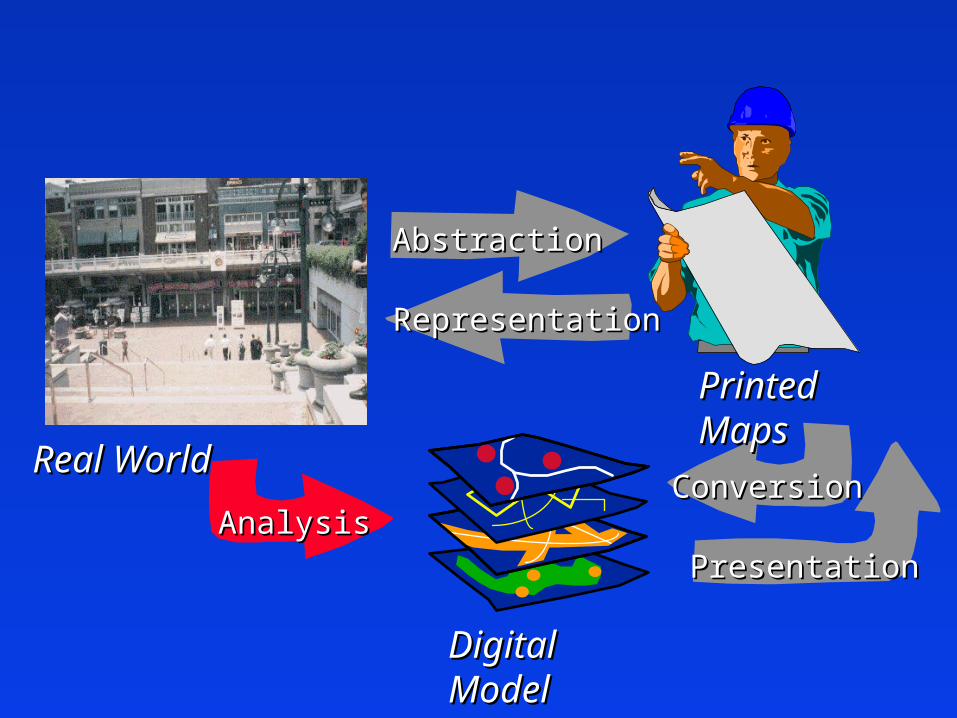
Real Real WorldWorld
AbstractionAbstraction
RepresentationRepresentation
AnalysisAnalysisConversionConversion
PresentationPresentation
Printed Printed MapsMaps
Digital Digital ModelModel
Real Real WorldWorld
AbstractionAbstraction
ActionAction
RepresentationRepresentation
AnalysisAnalysisConversionConversion
PresentationPresentation
Printed Printed MapsMaps
Digital Digital ModelModel
Real Real WorldWorld
AbstractionAbstraction
ActionAction
RepresentationRepresentation
AnalysisAnalysisConversionConversion
PresentationPresentation
Printed Printed MapsMaps
Digital Digital ModelModel
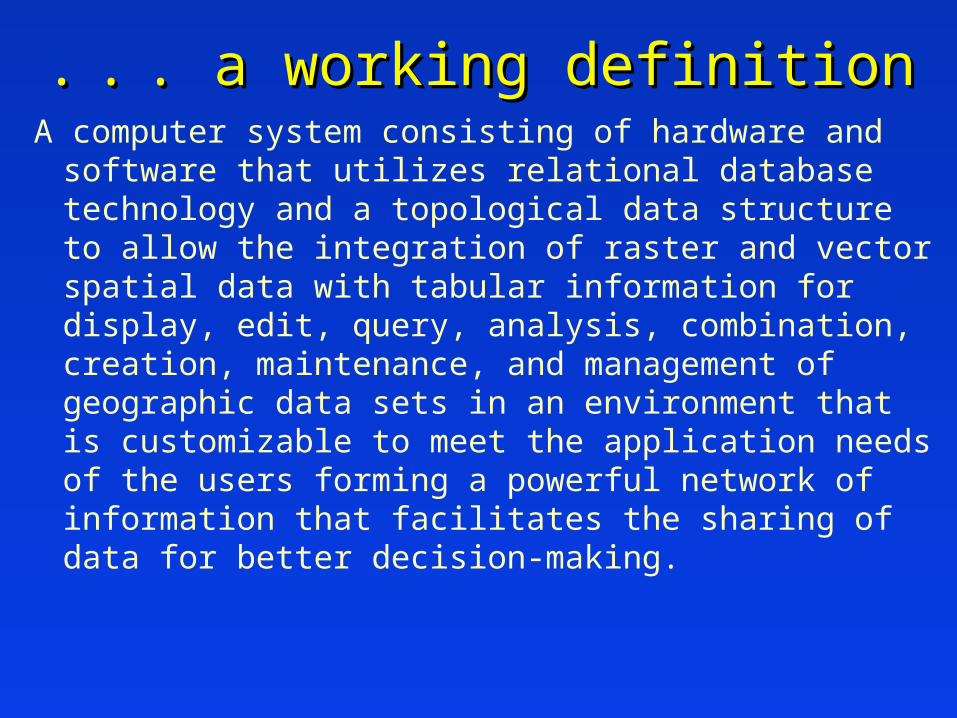
.. .. . a working definition. a working definitionA computer system consisting of hardware and software
that utilizes relational database technology and a topological data structure to allow the integration of raster and vector spatial data with tabular information for display, edit, query, analysis, combination, creation, maintenance, and management of geographic data sets in an environment that is customizable to meet the application needs of the users forming a powerful network of information that facilitates the sharing of data for better decision-making.
.. .. . an operational definition. an operational definition
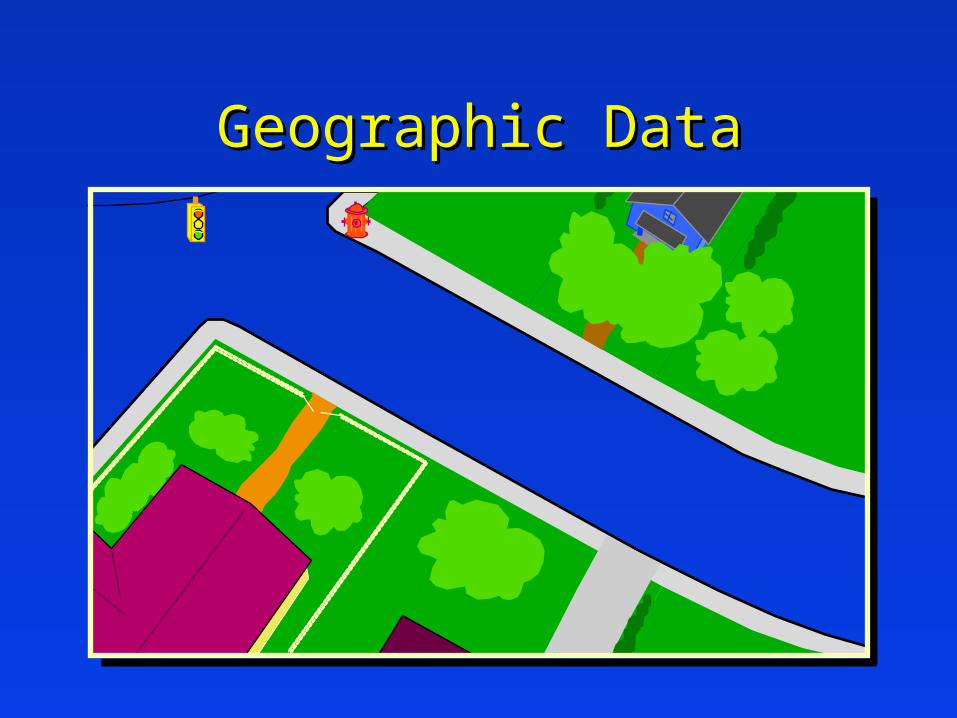
Geographic DataGeographic Data
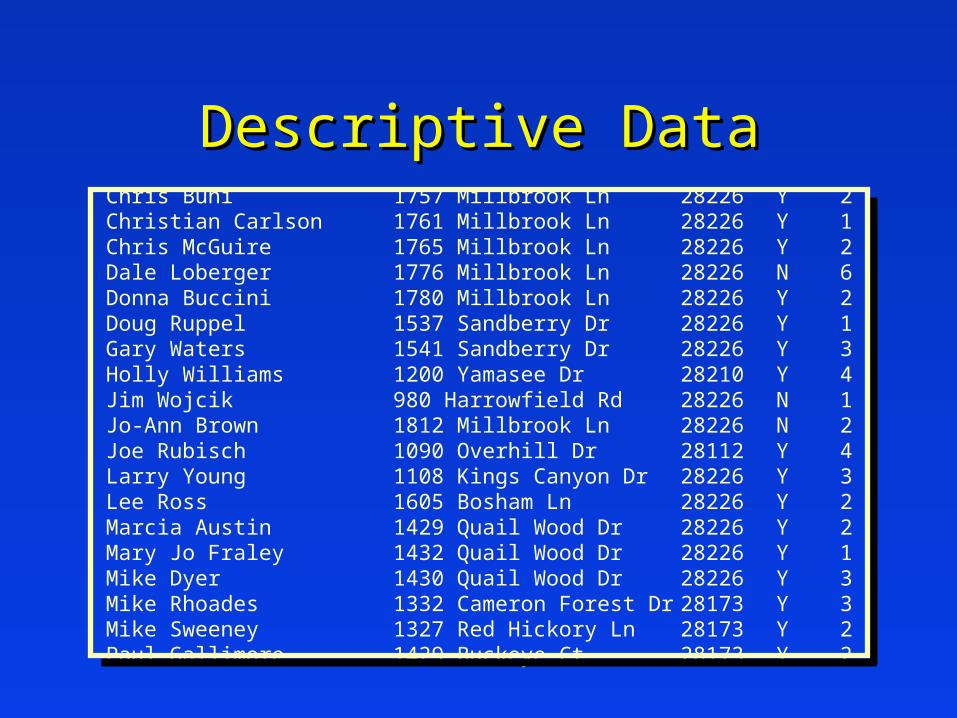
Chris Buhi 1757 Millbrook Ln 28226 Y 2Christian Carlson 1761 Millbrook Ln 28226 Y 1Chris McGuire 1765 Millbrook Ln 28226 Y 2Dale Loberger 1776 Millbrook Ln 28226 N 6Donna Buccini 1780 Millbrook Ln 28226 Y 2Doug Ruppel 1537 Sandberry Dr 28226 Y 1Gary Waters 1541 Sandberry Dr 28226 Y 3Holly Williams 1200 Yamasee Dr 28210 Y 4Jim Wojcik 980 Harrowfield Rd 28226 N 1Jo-Ann Brown 1812 Millbrook Ln 28226 N 2Joe Rubisch 1090 Overhill Dr 28112 Y 4Larry Young 1108 Kings Canyon Dr 28226 Y 3Lee Ross 1605 Bosham Ln 28226 Y 2Marcia Austin 1429 Quail Wood Dr 28226 Y 2Mary Jo Fraley 1432 Quail Wood Dr 28226 Y 1Mike Dyer 1430 Quail Wood Dr 28226 Y 3Mike Rhoades 1332 Cameron Forest Dr 28173 Y 3Mike Sweeney 1327 Red Hickory Ln 28173 Y 2Paul Gallimore 1429 Buckeye Ct 28173 Y 2
Descriptive DataDescriptive Data
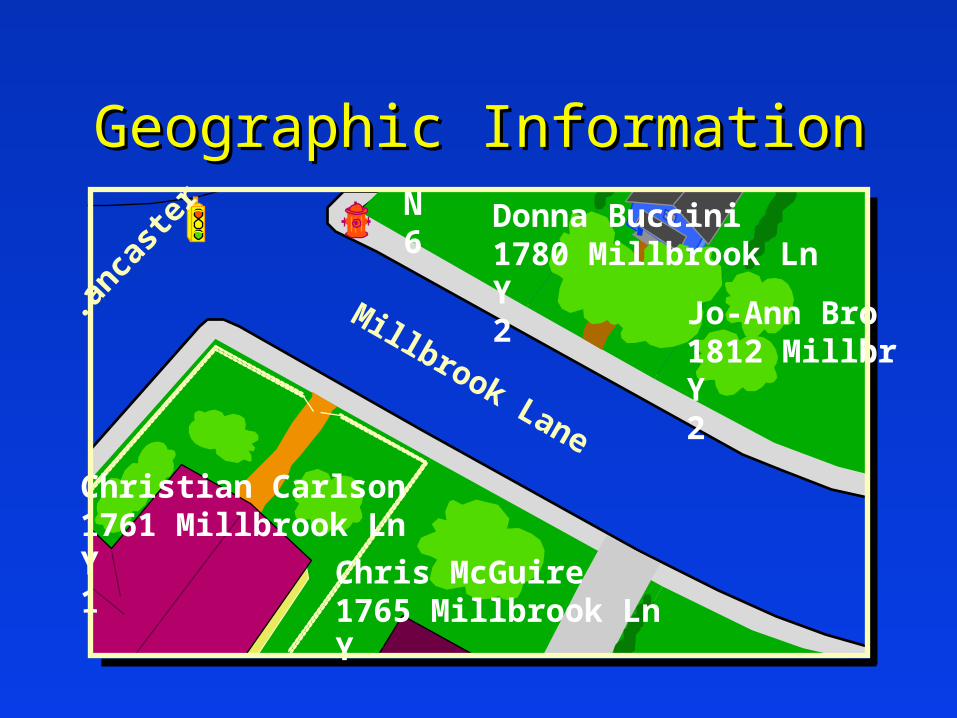
Geographic InformationGeographic Information
Christian Carlson1761 Millbrook LnY1
Jo-Ann Bro1812 MillbrY2
Chris McGuire1765 Millbrook LnY
Donna Buccini1780 Millbrook LnY2
N6
Millbrook Lane
.anca
ster

.anca
ster
POLYGONPOLYGON
POINTSPOINTS
NODESNODESANNOTATIONANNOTATION
LINESLINES
Spatial RepresentationsSpatial Representations
Millbrook Lane
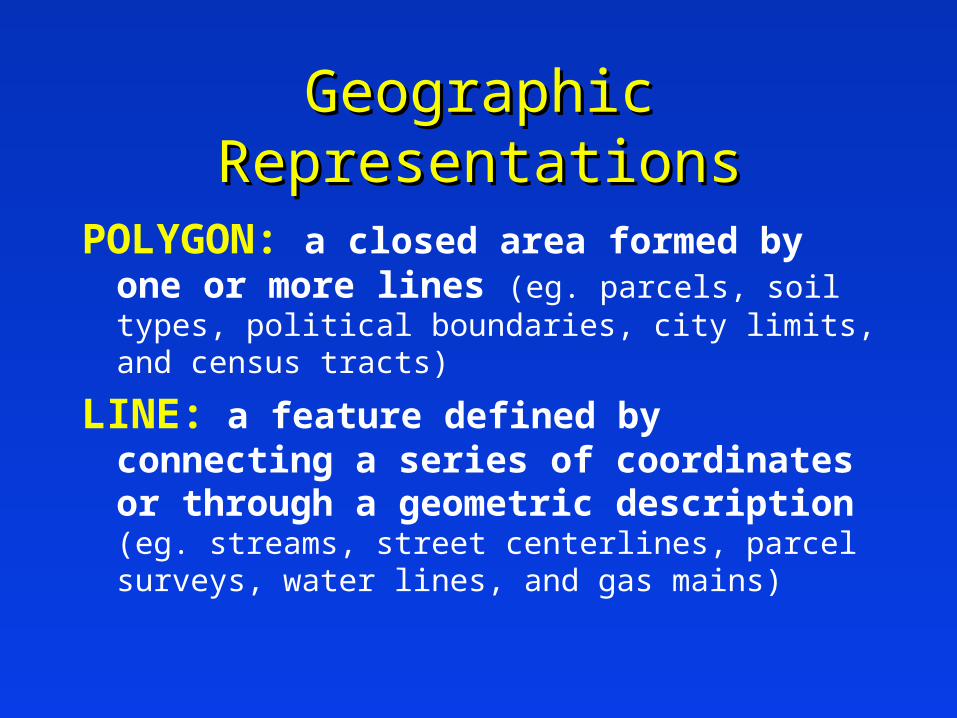
POLYGON: a closed area formed by one or more lines (eg. parcels, soil types, political boundaries, city limits, and census tracts)
LINE: a feature defined by connecting a series of coordinates or through a geometric description (eg. streams, street centerlines, parcel surveys, water lines, and gas mains)
Geographic RepresentationsGeographic Representations
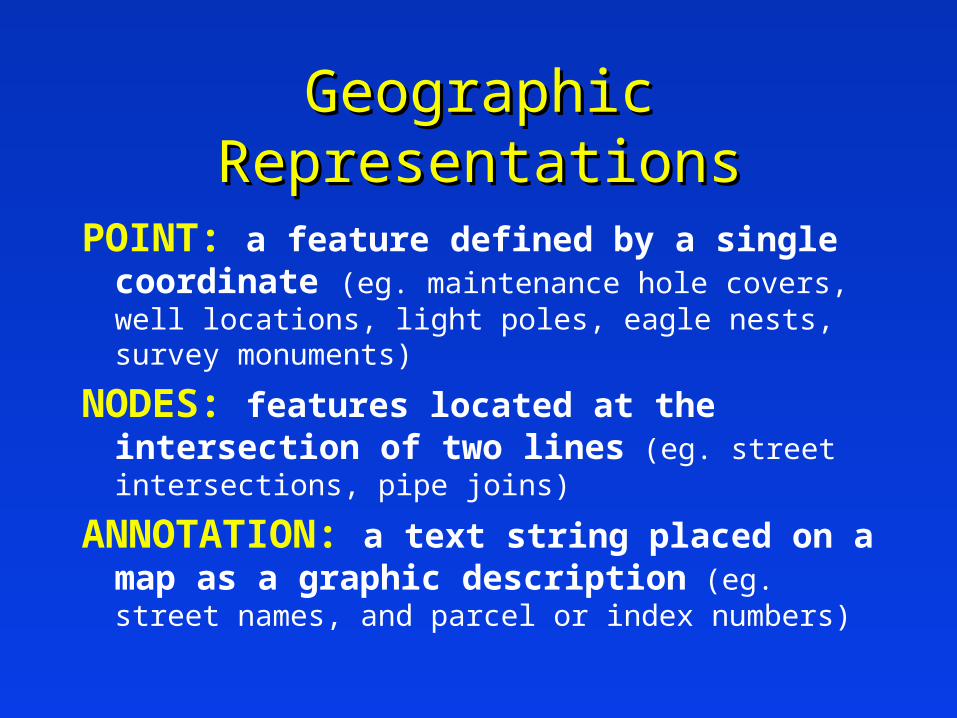
POINT: a feature defined by a single coordinate (eg. maintenance hole covers, well locations, light poles, eagle nests, survey monuments)
NODES: features located at the intersection of two lines (eg. street intersections, pipe joins)
ANNOTATION: a text string placed on a map as a graphic description (eg. street names, and parcel or index numbers)
Geographic RepresentationsGeographic Representations
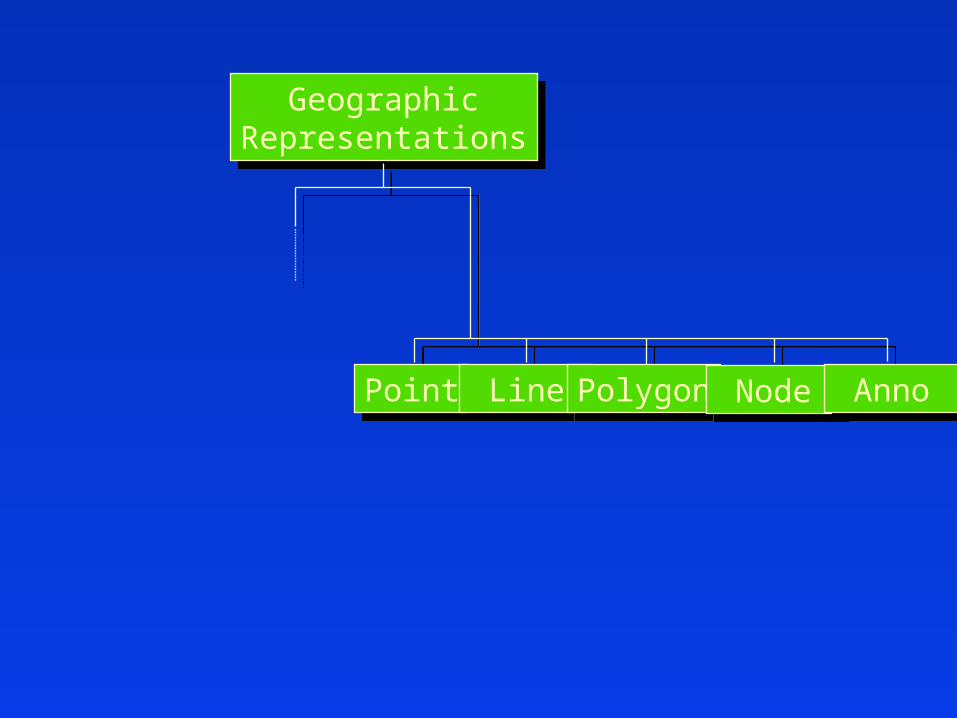
GeographicRepresentations
GeographicRepresentations
PointPoint Line Line PolygonPolygon Node Node Anno Anno
GeographicRepresentations
GeographicRepresentations
PointPoint Line Line PolygonPolygon Node Node
VectorVector
Anno Anno
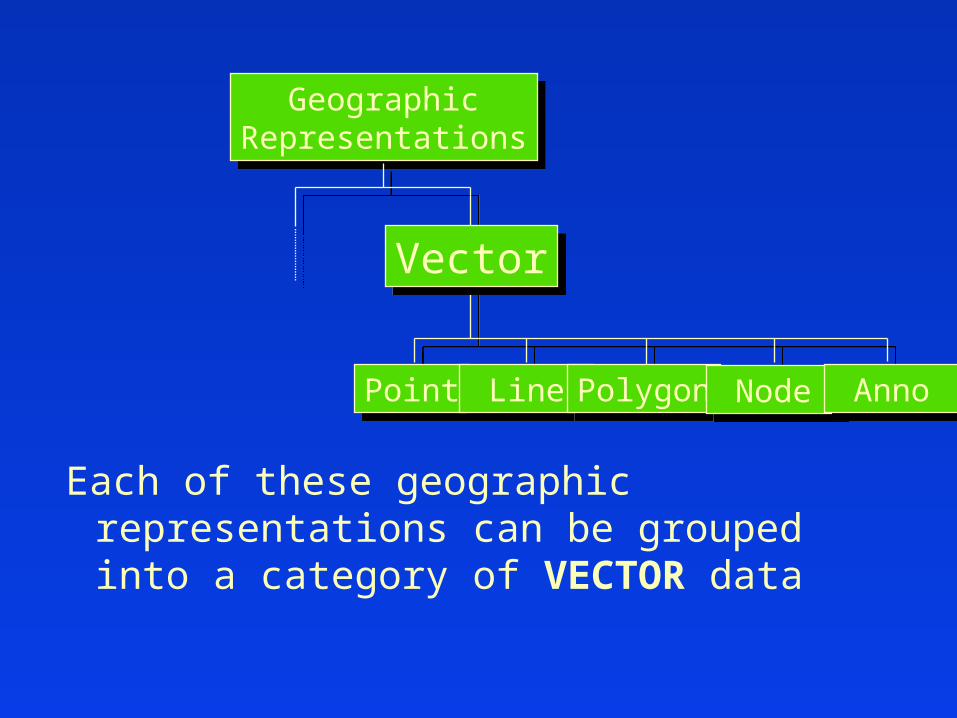
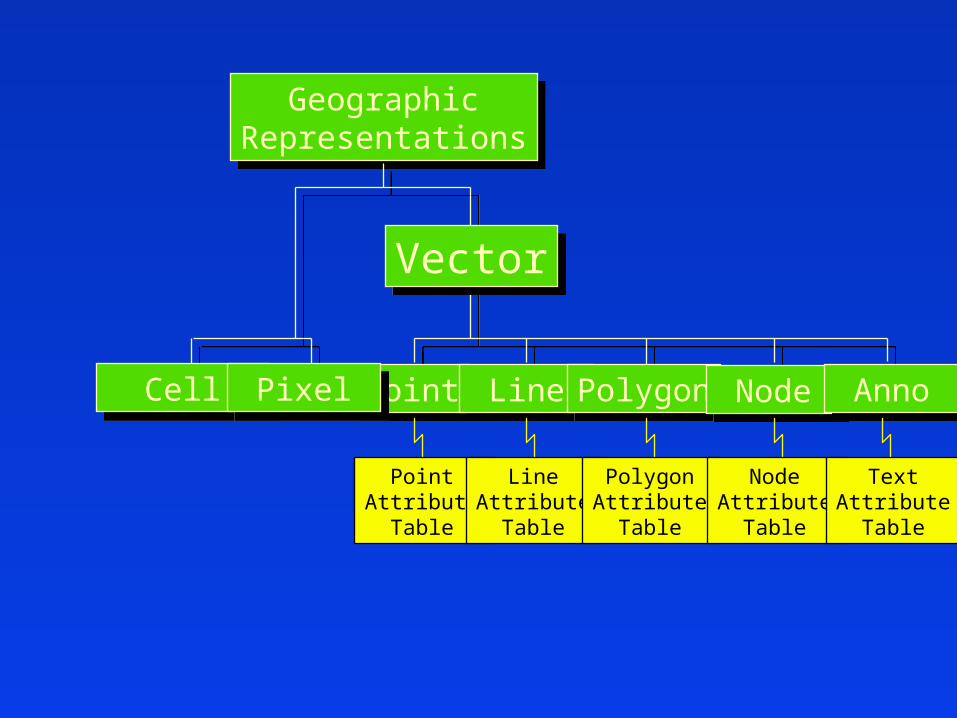
Each of these geographic representations can be grouped into a category of VECTOR data
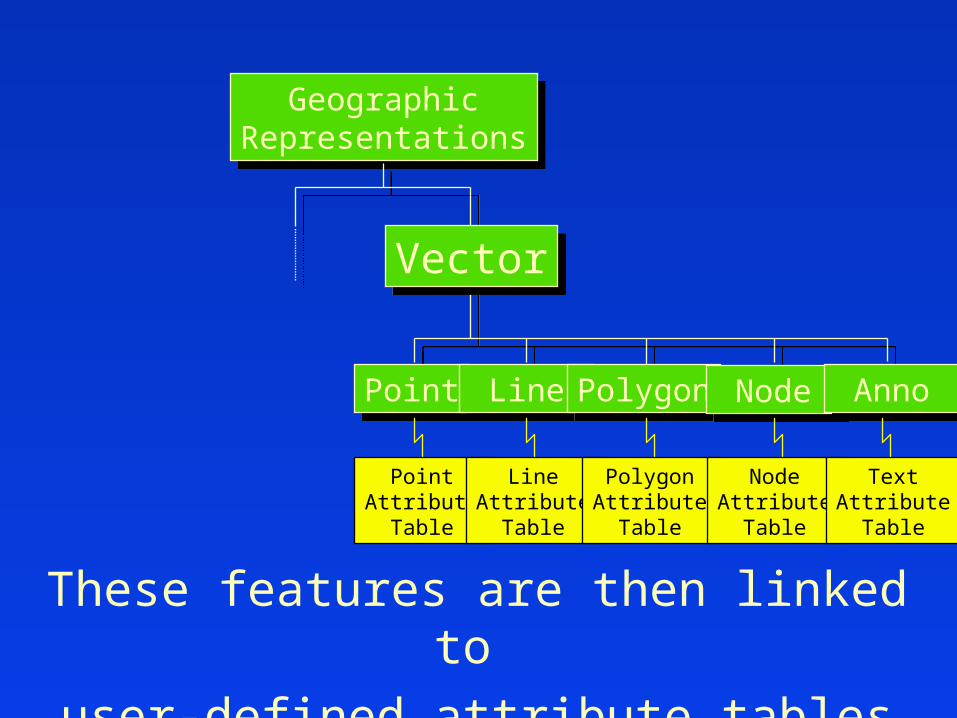
These features are then linked to user-defined attribute tables
GeographicRepresentations
GeographicRepresentations
PointPoint Line Line PolygonPolygon Node Node
PointAttributeTable
LineAttributeTable
PolygonAttributeTable
NodeAttributeTable
VectorVector
Anno Anno
TextAttributeTable
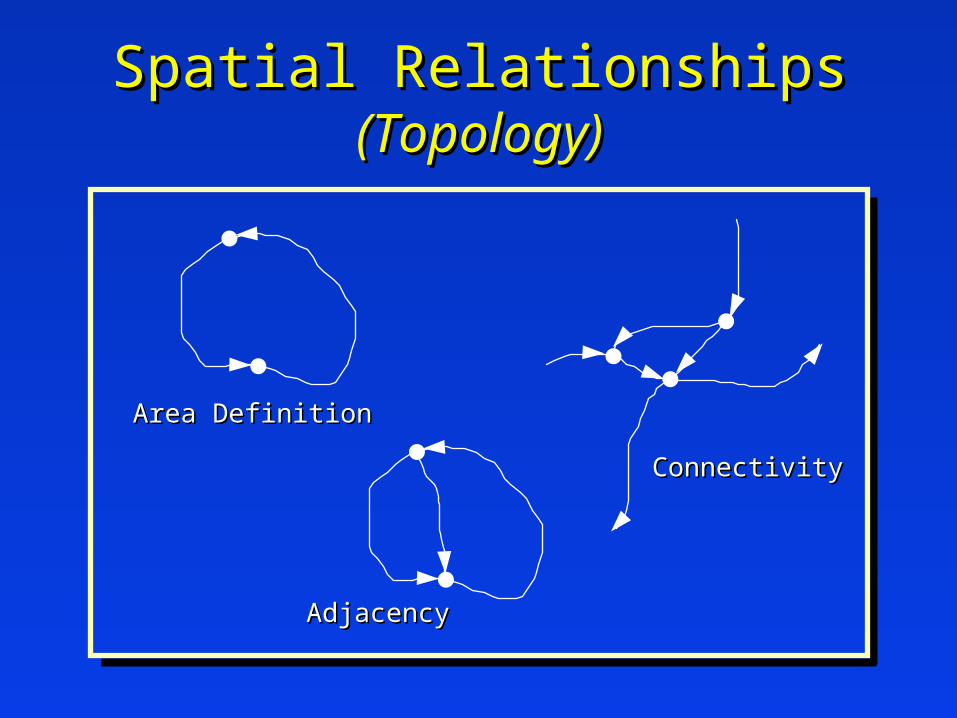
Spatial RelationshipsSpatial Relationships(Topology)(Topology)
Area DefinitionArea Definition
AdjacencyAdjacency
ConnectivityConnectivity
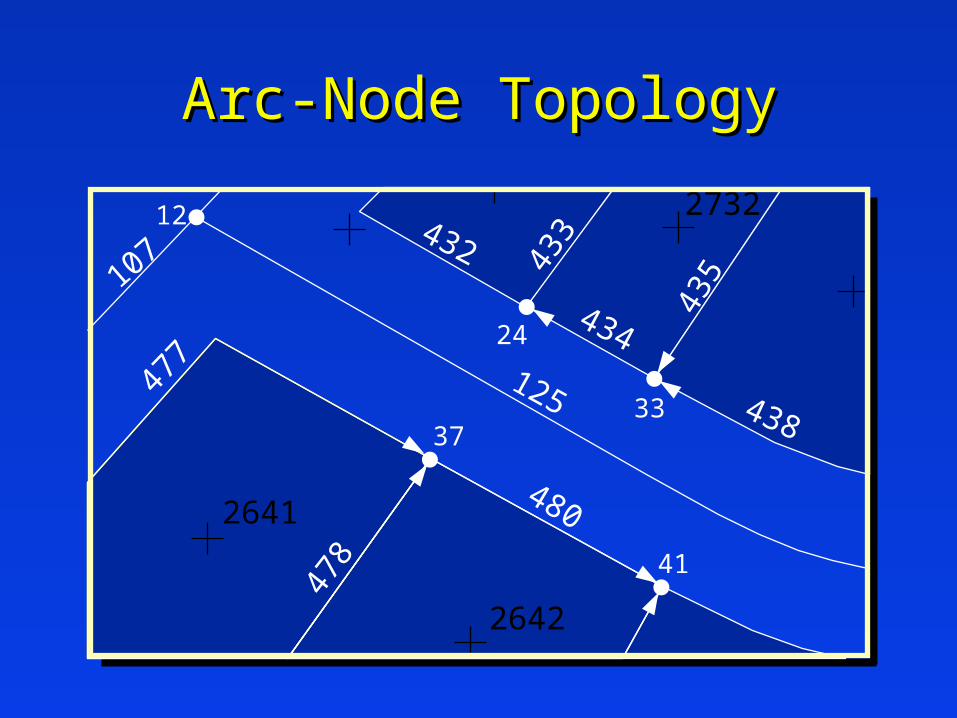
Arc-Node TopologyArc-Node Topology
2641
2642
273212
37
41
24
33
107
125
432 433
434
435
478
477
438
480
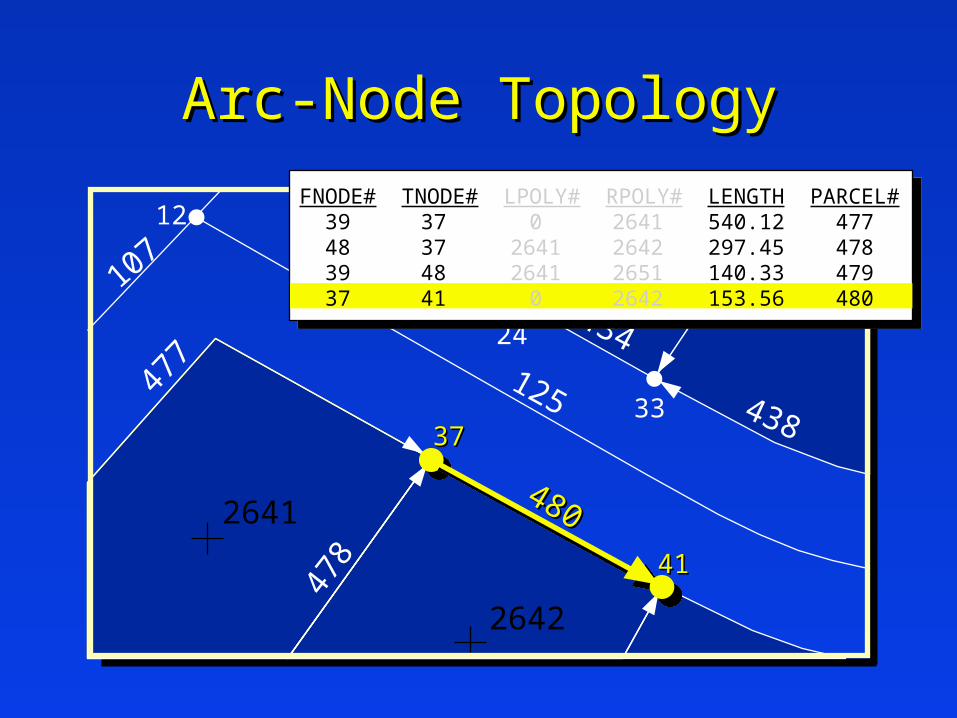
Arc-Node TopologyArc-Node Topology
2641
2642
273212
3737
4141
24
33
107
125
432 433
434
435
478
477
438
480480
FNODE# TNODE# LPOLY# RPOLY# LENGTH PARCEL# 39 37 0 2641 540.12 477 48 37 2641 2642 297.45 478 39 48 2641 2651 140.33 479 37 41 0 2642 153.56 480
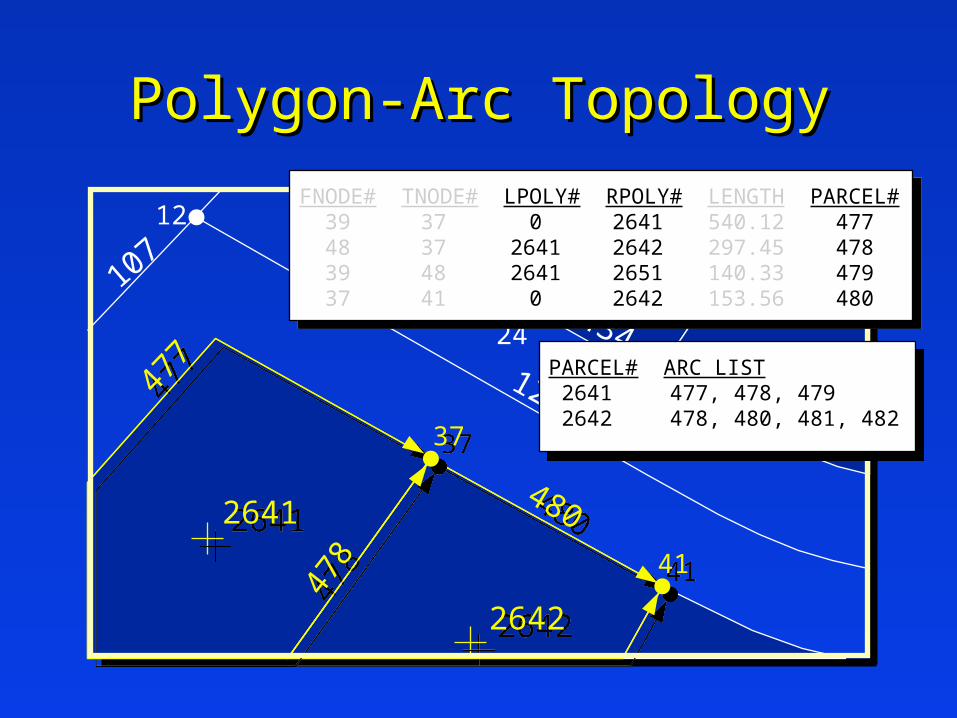
Polygon-Arc TopologyPolygon-Arc Topology
26412641
26422642
273212
3737
4141
24
33
107
125
432 433
434
435
478478
477477
438
480480
FNODE# TNODE# LPOLY# RPOLY# LENGTH PARCEL# 39 37 0 2641 540.12 477 48 37 2641 2642 297.45 478 39 48 2641 2651 140.33 479 37 41 0 2642 153.56 480
PARCEL# ARC LIST 2641 477, 478, 479 2642 478, 480, 481, 482
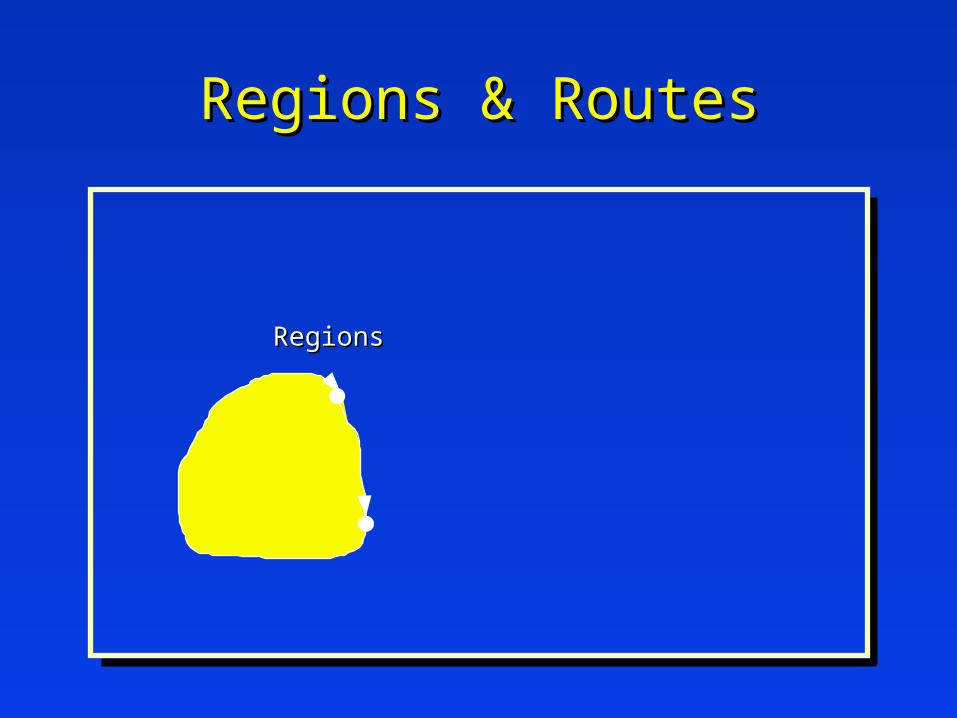
RegionsRegions
Regions & RoutesRegions & Routes
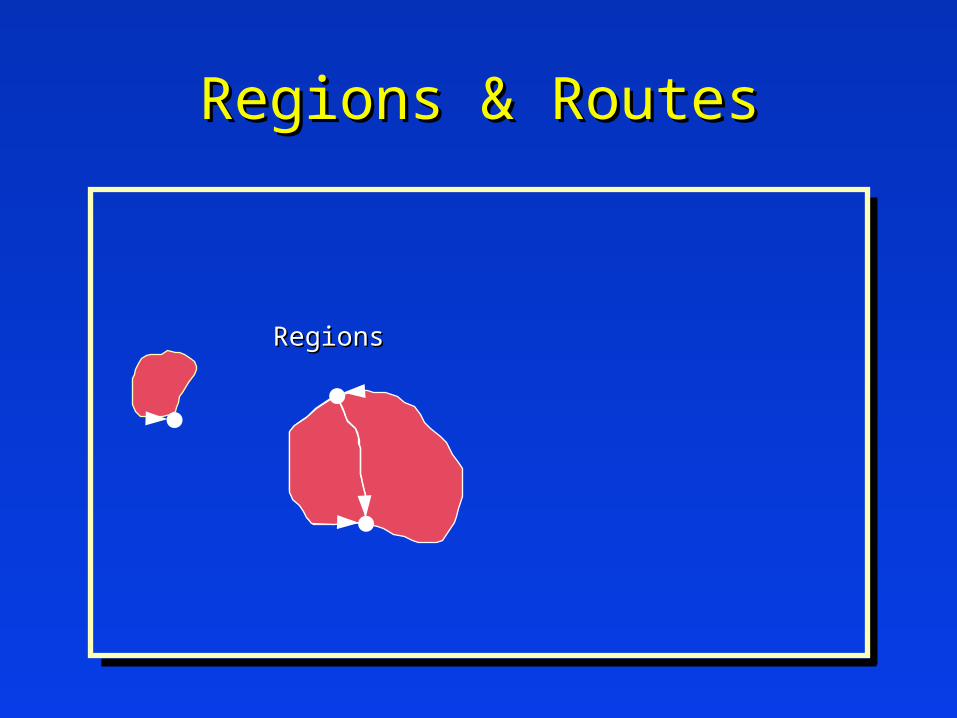
RegionsRegions
Regions & RoutesRegions & Routes
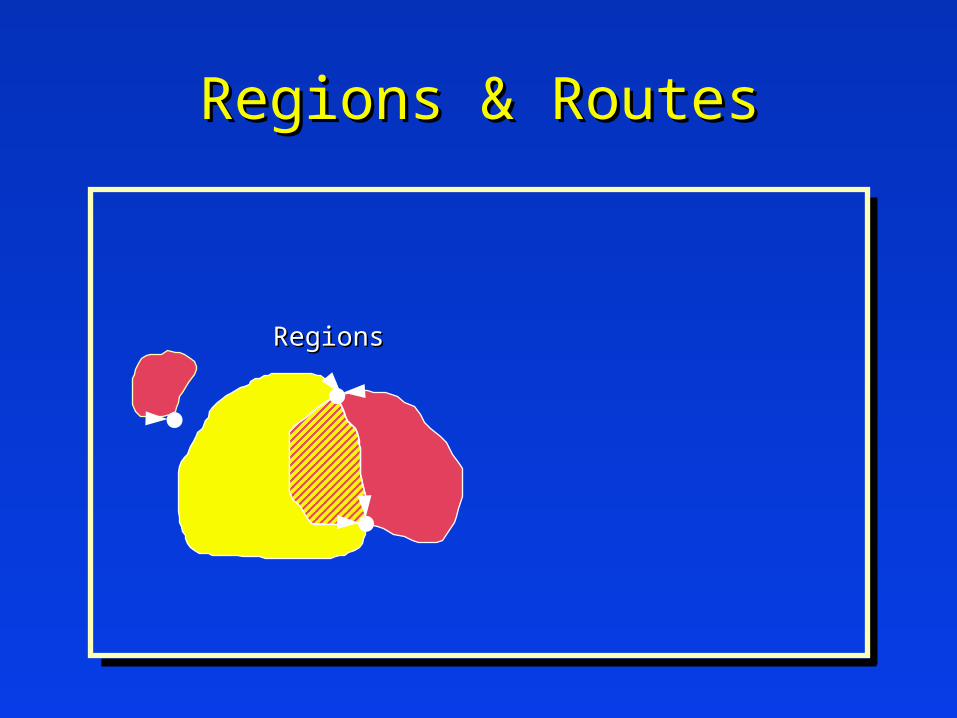
RegionsRegions
Regions & RoutesRegions & Routes

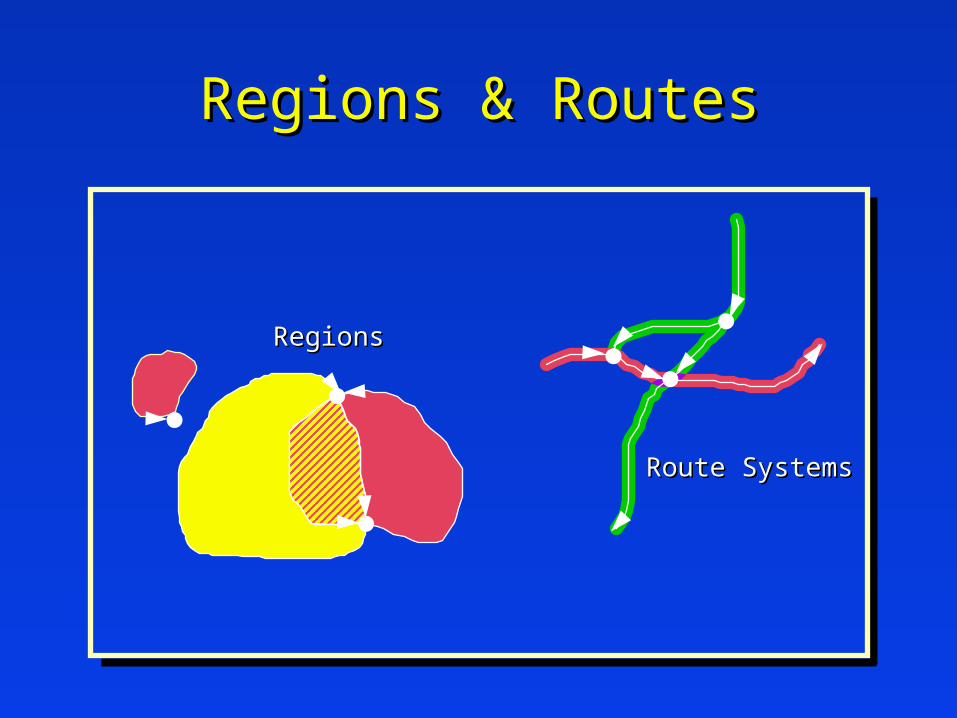
RegionsRegions
Route SystemsRoute Systems
Regions & RoutesRegions & Routes
RegionsRegions
Route SystemsRoute Systems
Regions & RoutesRegions & Routes
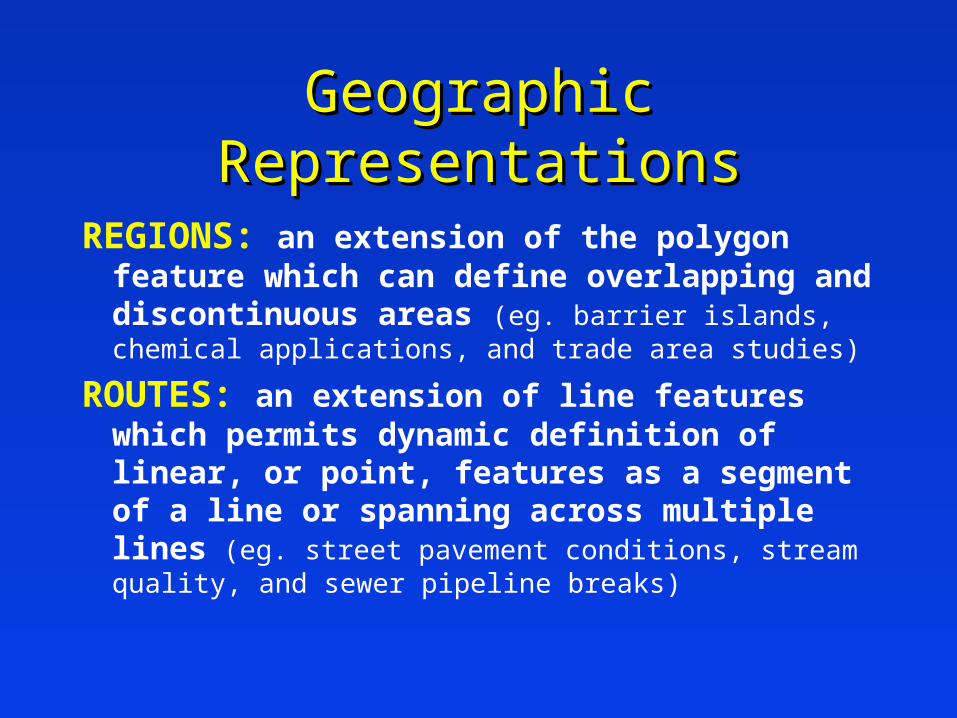
REGIONS: an extension of the polygon feature which can define overlapping and discontinuous areas (eg. barrier islands, chemical applications, and trade area studies)
ROUTES: an extension of line features which permits dynamic definition of linear, or point, features as a segment of a line or spanning across multiple lines (eg. street pavement conditions, stream quality, and sewer pipeline breaks)
Geographic RepresentationsGeographic Representations
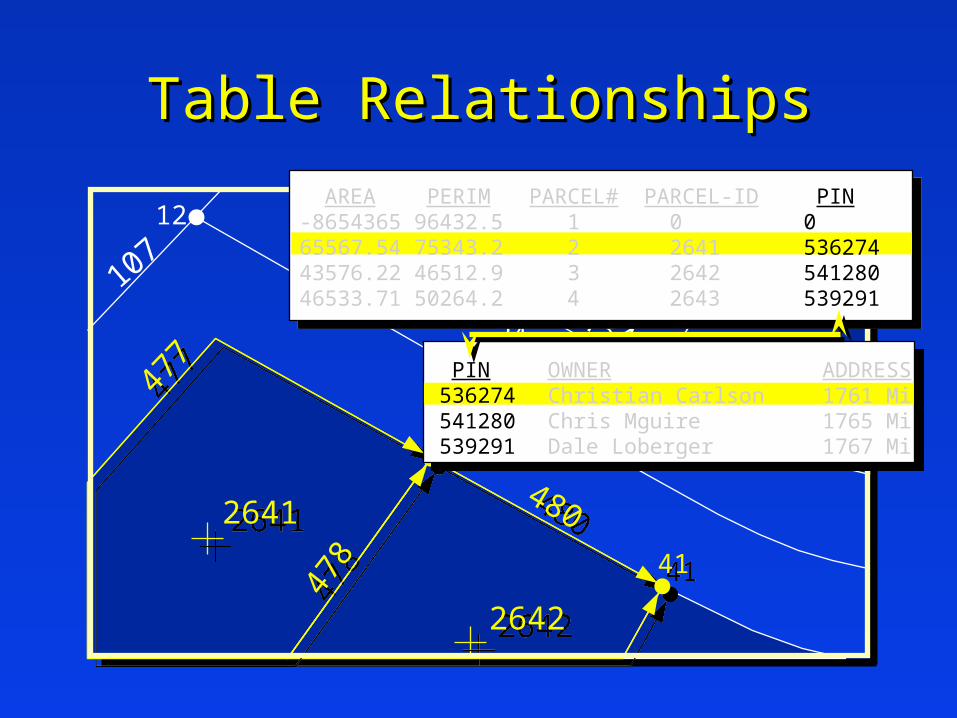
Table RelationshipsTable Relationships
26412641
26422642
273212
3737
4141
24
33
107
125
432 433
434
435
478478
477477
438
480480
AREA PERIM PARCEL# PARCEL-ID PIN-8654365 96432.5 1 0 065567.54 75343.2 2 2641 53627443576.22 46512.9 3 2642 541280 46533.71 50264.2 4 2643 539291
PIN OWNER ADDRESS536274 Christian Carlson 1761 Mi541280 Chris Mguire 1765 Mi539291 Dale Loberger 1767 Mi
maintains very accurate graphic representations of map features
maintains polygon data as a single attribute record
maintains discrete features for points, lines, polygons, nodes, and annotation
permits the combination of data layers while maintaining accurate graphic representation
Why Vector?Why Vector?
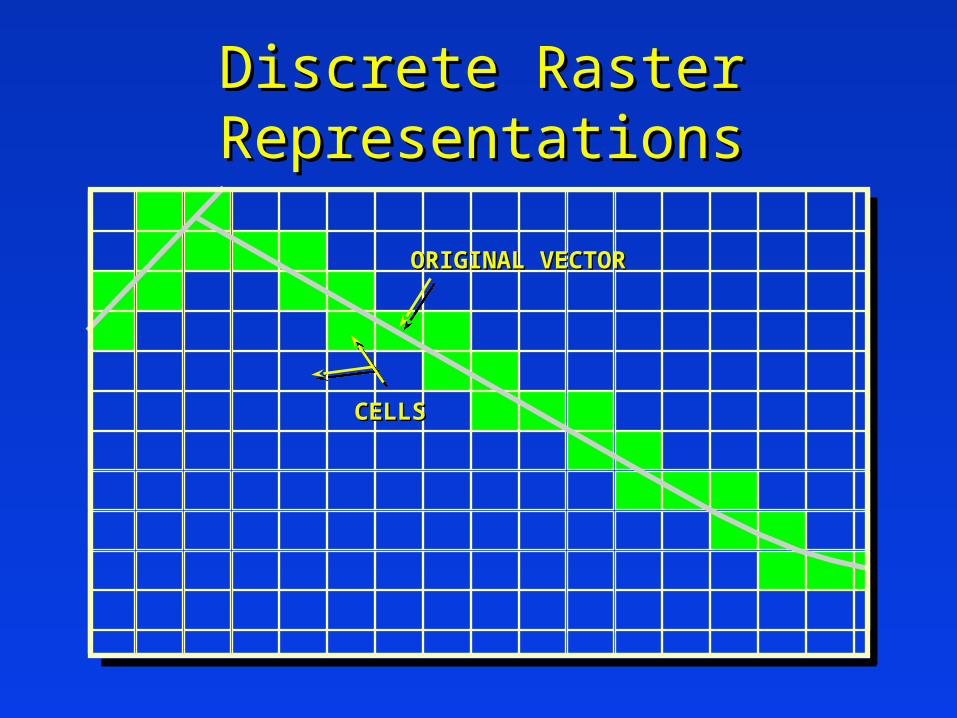
Discrete Raster Discrete Raster RepresentationsRepresentations
CELLSCELLS
ORIGINAL VECTORORIGINAL VECTOR
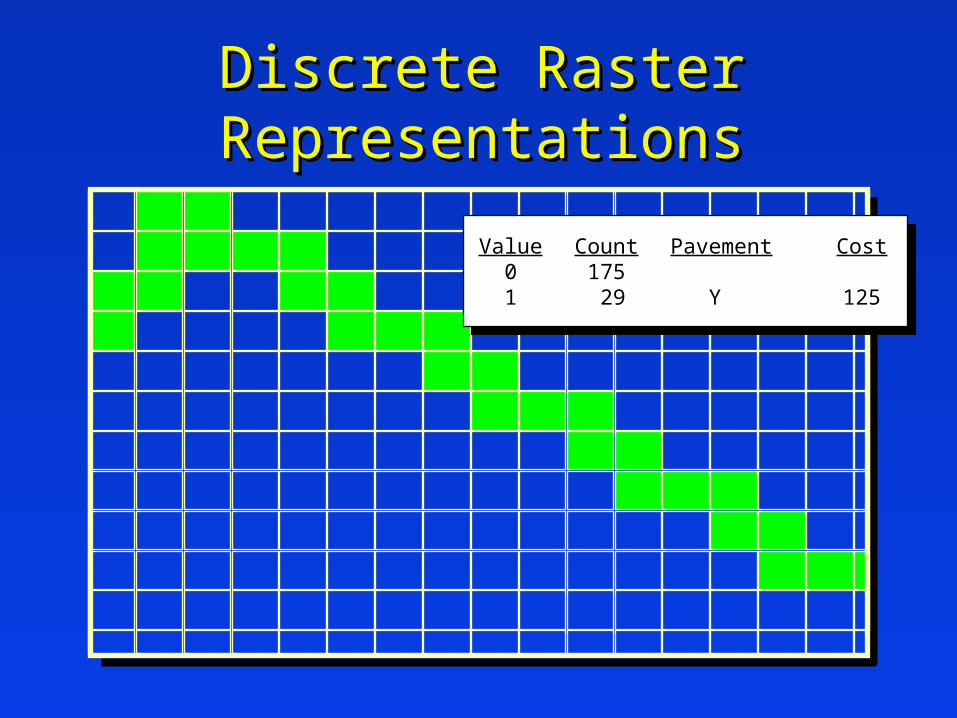
Discrete Raster Discrete Raster RepresentationsRepresentations
Value Count Pavement Cost 0 175 1 29 Y 125
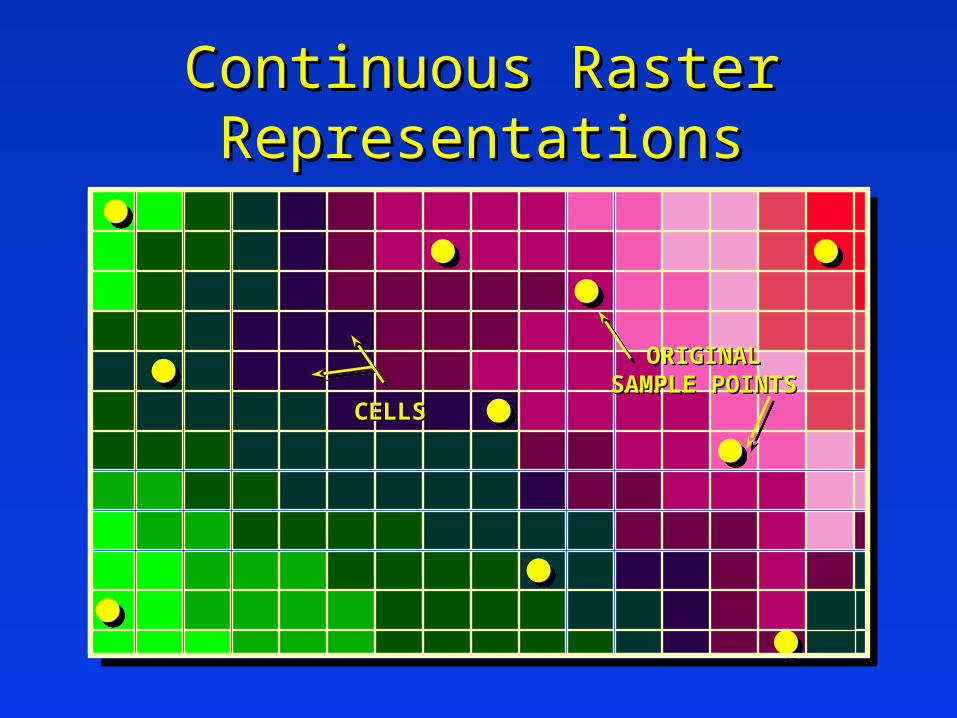
Continuous Raster Continuous Raster RepresentationsRepresentations
CELLSCELLS
ORIGINALORIGINALSAMPLE POINTSSAMPLE POINTS
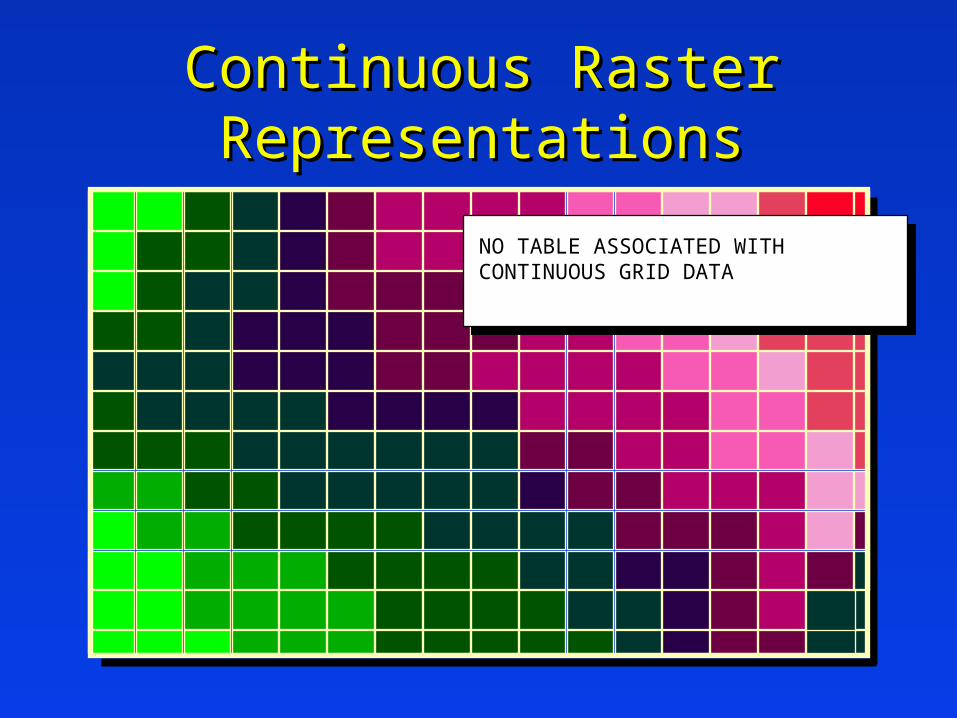
Continuous Raster Continuous Raster RepresentationsRepresentations
NO TABLE ASSOCIATED WITH CONTINUOUS GRID DATA
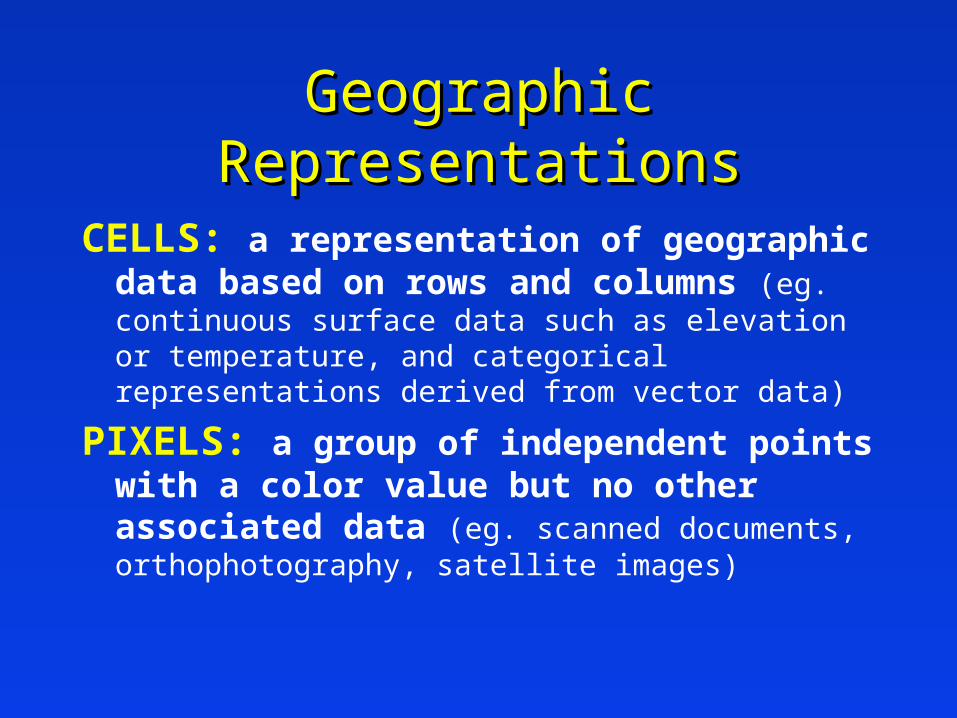
CELLS: a representation of geographic data based on rows and columns (eg. continuous surface data such as elevation or temperature, and categorical representations derived from vector data)
PIXELS: a group of independent points with a color value but no other associated data (eg. scanned documents, orthophotography, satellite images)
Geographic RepresentationsGeographic Representations
GeographicRepresentations
GeographicRepresentations
PointPoint Line Line PolygonPolygon Node Node Cell Cell Pixel Pixel
PointAttributeTable
LineAttributeTable
PolygonAttributeTable
NodeAttributeTable
VectorVector
Anno Anno
TextAttributeTable
GeographicRepresentations
GeographicRepresentations
PointPoint Line Line PolygonPolygon Node Node Cell Cell Pixel Pixel
PointAttributeTable
LineAttributeTable
PolygonAttributeTable
NodeAttributeTable
VectorVector
Anno Anno
TextAttributeTable
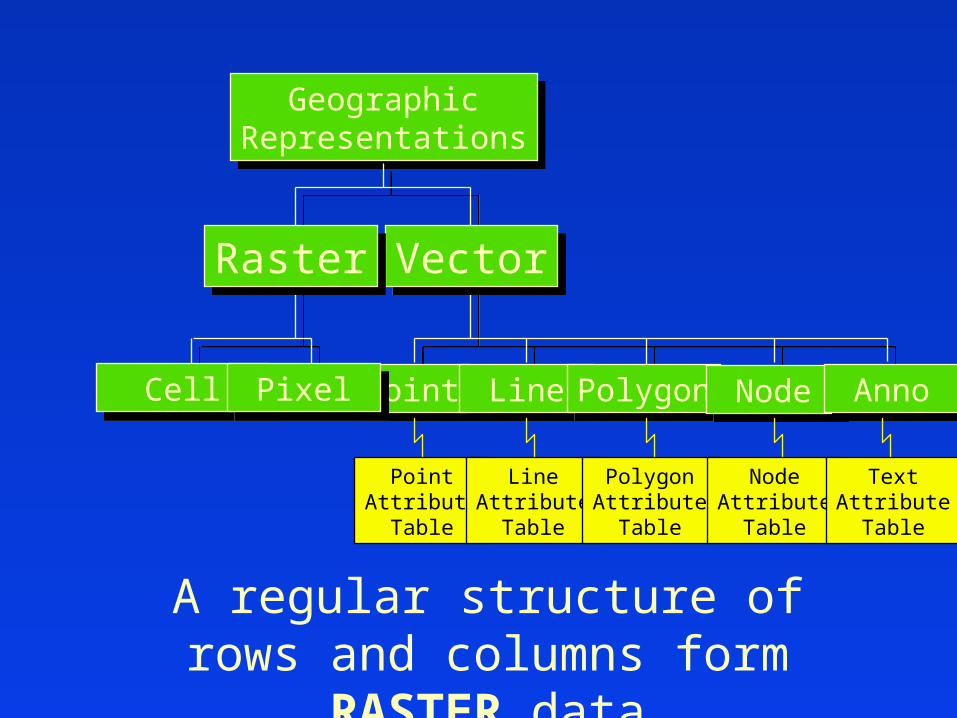
A regular structure of rows and columns form RASTER
data
RasterRaster
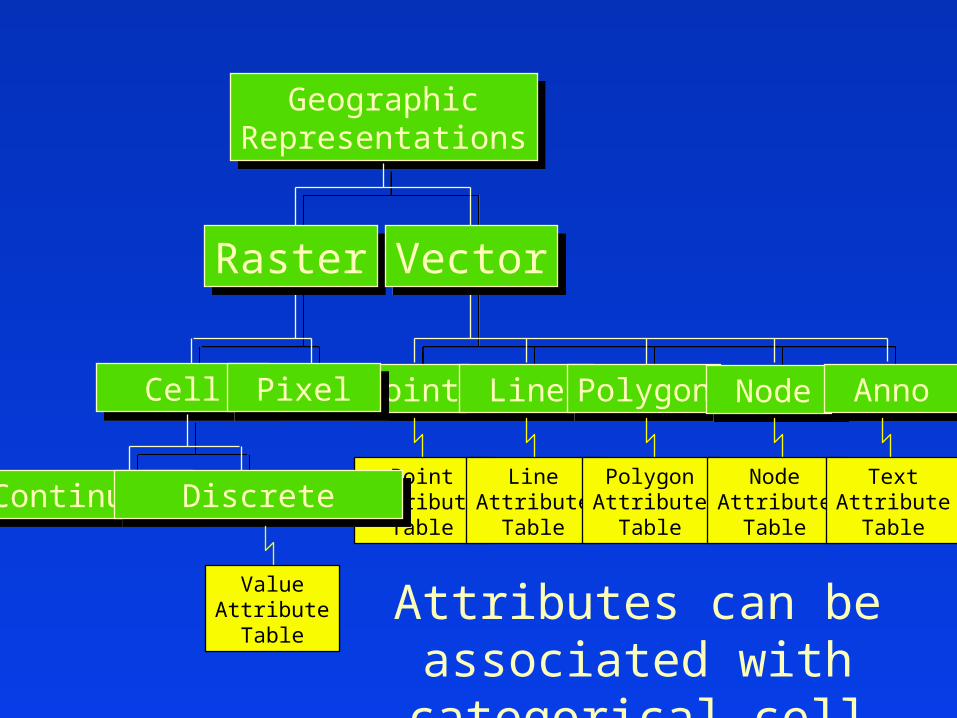
Attributes can be associated with categorical cell
groupings
GeographicRepresentations
GeographicRepresentations
PointPoint Line Line PolygonPolygon Node Node Cell Cell Pixel Pixel
RasterRaster
PointAttributeTable
LineAttributeTable
PolygonAttributeTable
NodeAttributeTable
VectorVector
ContinuousContinuous Discrete Discrete
ValueAttributeTable
Anno Anno
TextAttributeTable
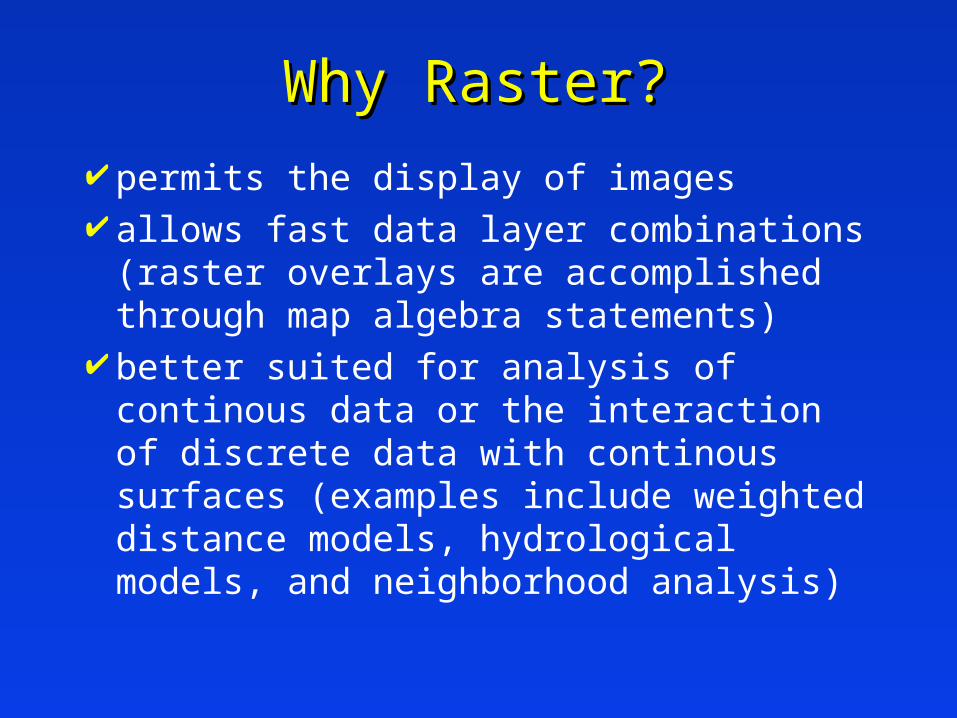
permits the display of images allows fast data layer combinations
(raster overlays are accomplished through map algebra statements)
better suited for analysis of continous data or the interaction of discrete data with continous surfaces (examples include weighted distance models, hydrological models, and neighborhood analysis)
Why Raster?Why Raster?
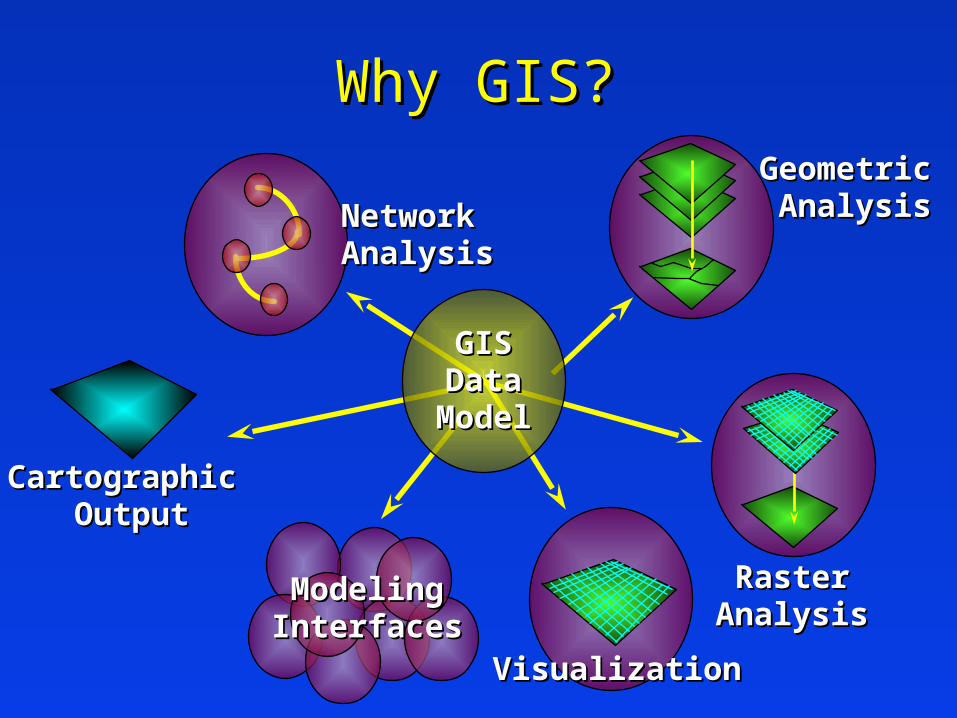
GISGISDataData
ModelModel
Network Network AnalysisAnalysis
Cartographic Cartographic OutputOutput
ModelingModelingInterfacesInterfaces
Raster Raster Analysis Analysis
Geometric Geometric AnalysisAnalysis
VisualizationVisualization
Why GIS?Why GIS?
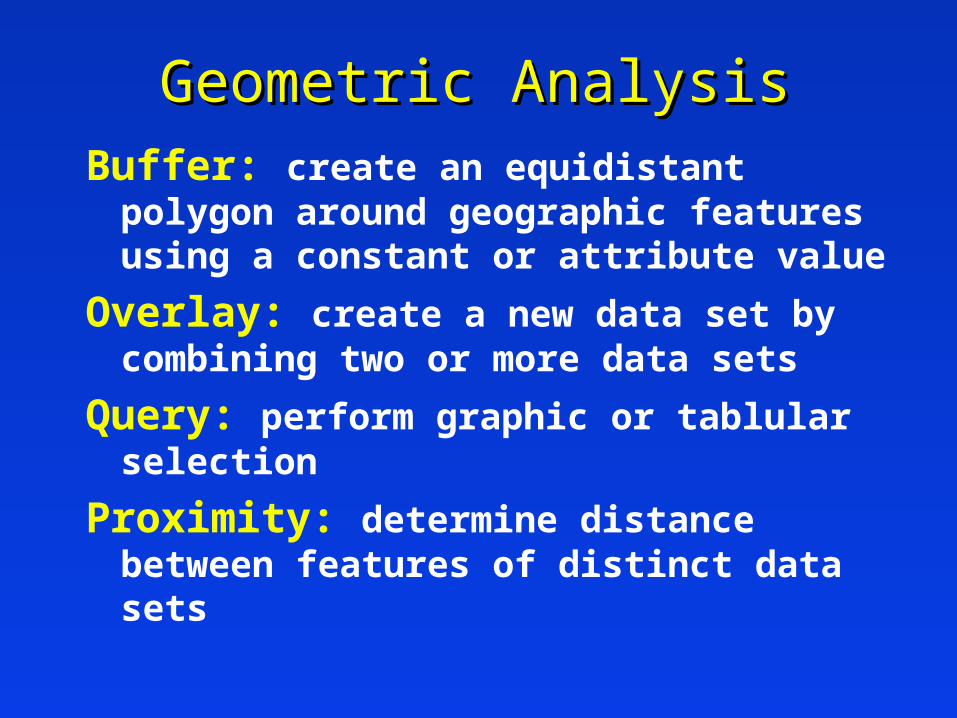
Buffer: create an equidistant polygon around geographic features using a constant or attribute value
Overlay: create a new data set by combining two or more data sets
Query: perform graphic or tablular selection
Proximity: determine distance between features of distinct data sets
Geometric AnalysisGeometric Analysis
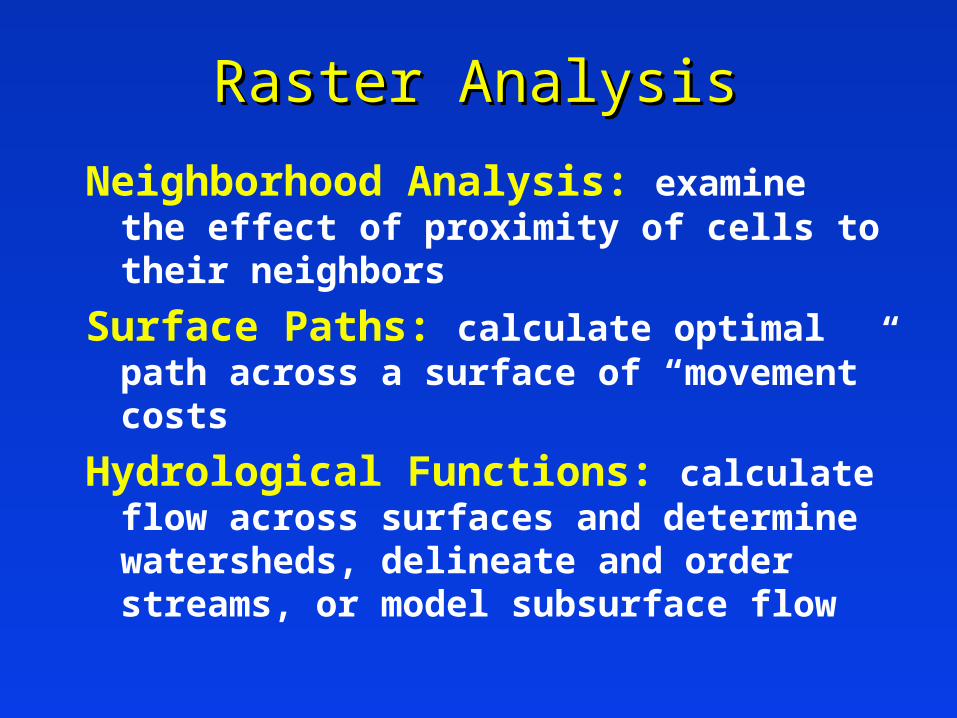
Neighborhood Analysis: examine the effect of proximity of cells to their neighbors
Surface Paths: calculate optimal path across a surface of “movement” costs
Hydrological Functions: calculate flow across surfaces and determine watersheds, delineate and order streams, or model subsurface flow
Raster AnalysisRaster Analysis
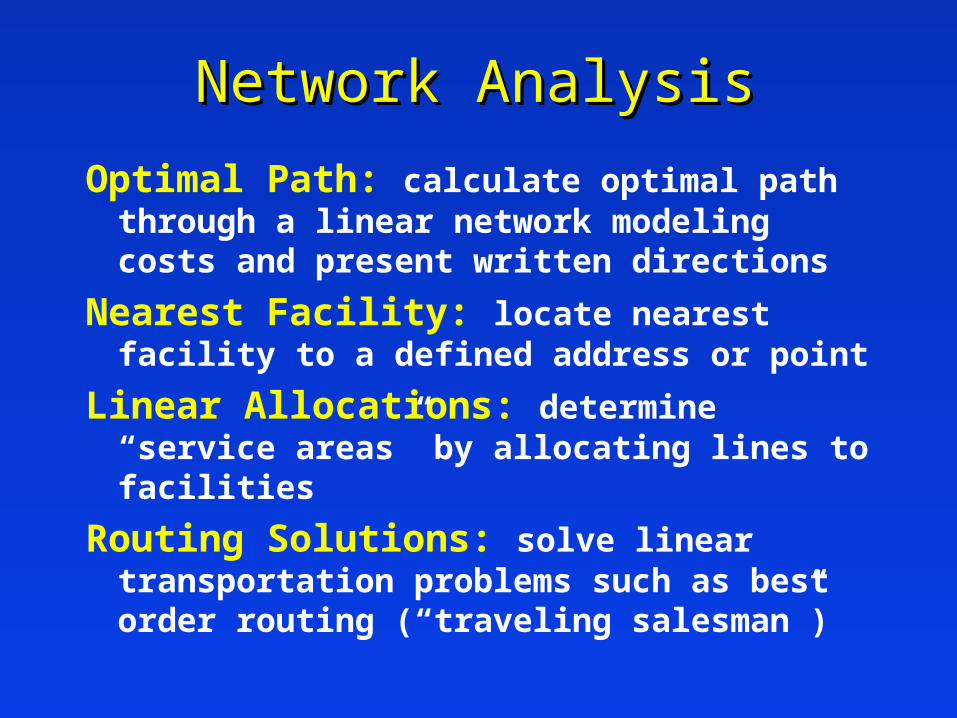
Optimal Path: calculate optimal path through a linear network modeling costs and present written directions
Nearest Facility: locate nearest facility to a defined address or point
Linear Allocations: determine “service areas” by allocating lines to facilities
Routing Solutions: solve linear transportation problems such as best order routing (“traveling salesman”)
Network AnalysisNetwork Analysis
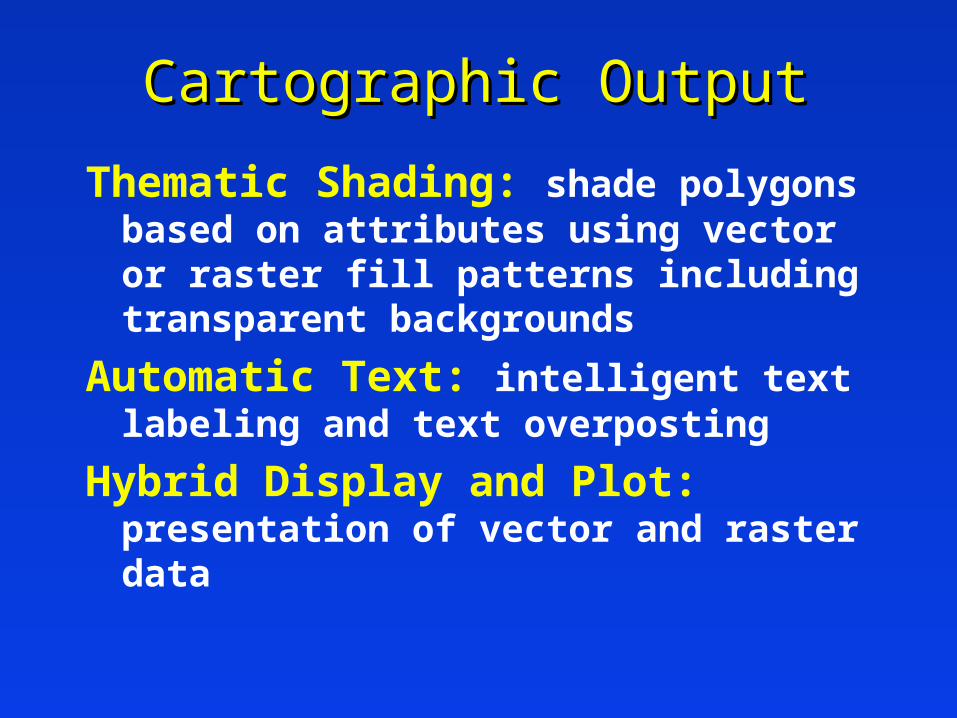
Thematic Shading: shade polygons based on attributes using vector or raster fill patterns including transparent backgrounds
Automatic Text: intelligent text labeling and text overposting
Hybrid Display and Plot: presentation of vector and raster data
Cartographic OutputCartographic Output
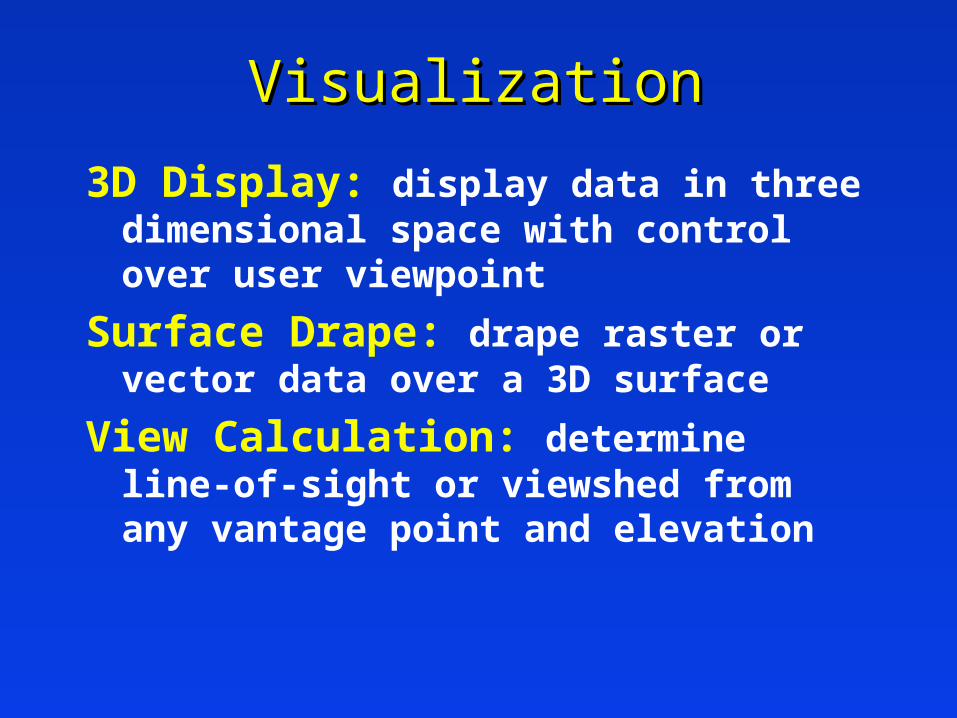
3D Display: display data in three dimensional space with control over user viewpoint
Surface Drape: drape raster or vector data over a 3D surface
View Calculation: determine line-of-sight or viewshed from any vantage point and elevation
VisualizationVisualization
Third Party Applications: access to the largest offering of third party applications for any GIS software
Modeling InterfacesModeling Interfaces
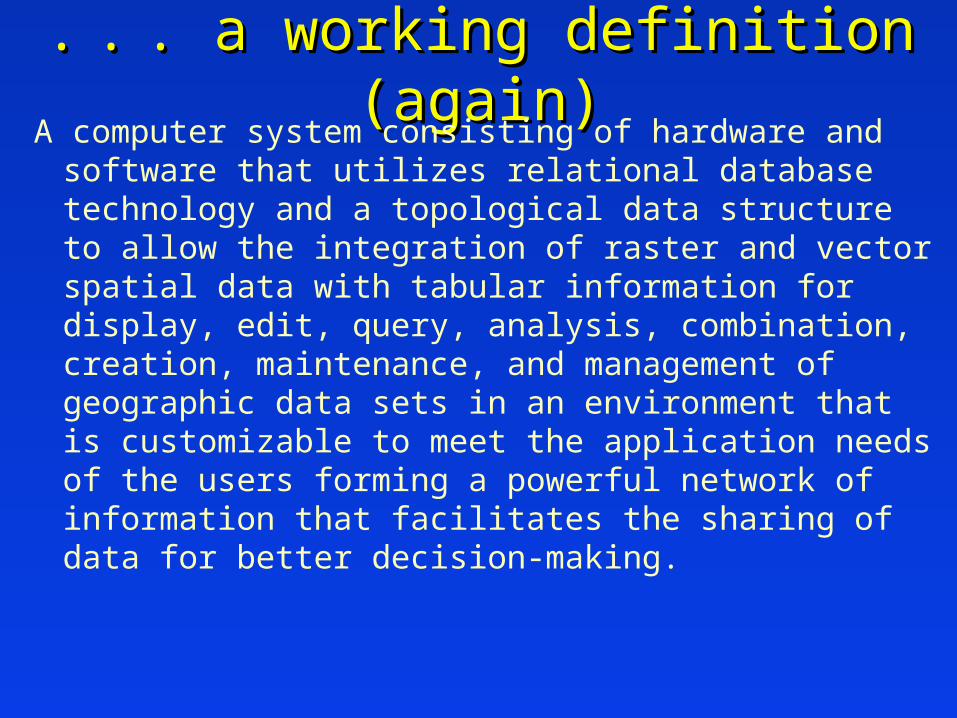
.. .. . a working definition . a working definition (again)(again)
A computer system consisting of hardware and software that utilizes relational database technology and a topological data structure to allow the integration of raster and vector spatial data with tabular information for display, edit, query, analysis, combination, creation, maintenance, and management of geographic data sets in an environment that is customizable to meet the application needs of the users forming a powerful network of information that facilitates the sharing of data for better decision-making.
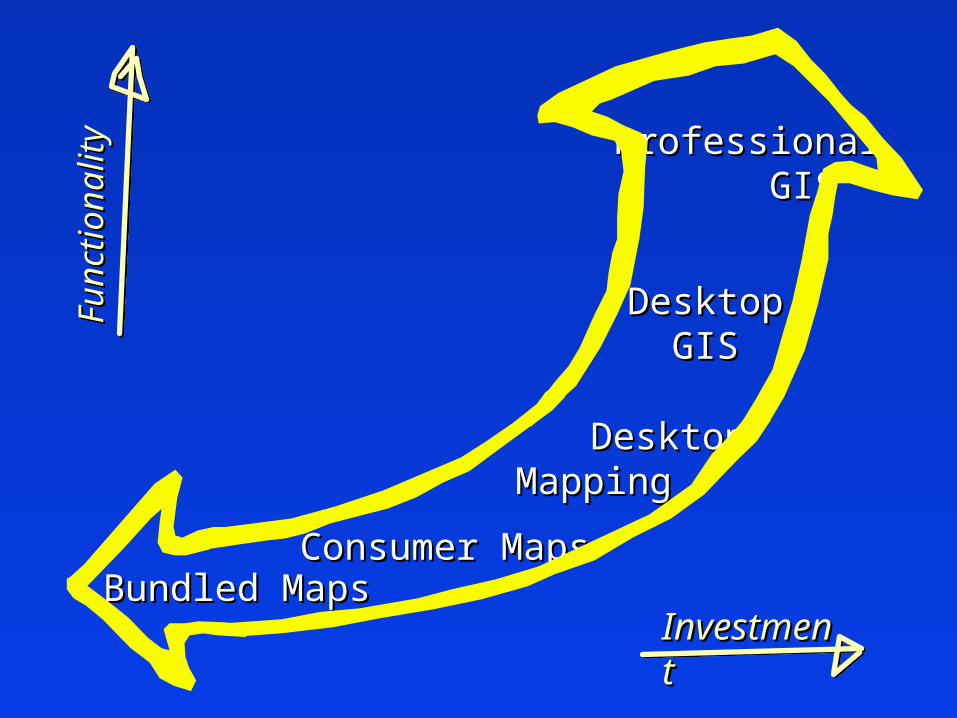
Bundled MapsBundled Maps
Desktop Desktop MappingMapping
ProfessionalProfessional GISGIS
Consumer MapsConsumer Maps
DesktopDesktop GISGIS
InvestmeInvestmentnt
Fun
ctio
nalit
Fun
ctio
nalit
yy