what difference does a constitutional amendment make? the 1994
TRANSCRIPT
What difference does a constitutional amendment make? The 1994 Panchayati Raj Act and the attempt to revitalize
rural local government in India
Shubham Chaudhuri Department of Economics
Columbia University ([email protected])
May 2003 (Preliminary and incomplete)
2
“If at the level of center-state relations the constitution gave us democracy, at the level of state-panchayat relations the constitution gave us bureaucracy.”
E.M.S. Namboodiripad (late) Former Chief Minister, Government of Kerala
1. Introduction
The passage of the 73rd and 74th constitutional amendments in 1994 has been hailed as a landmark in the evolution of local governments in India. The amendments provided rural and urban local governments with a constitutional status that they had previously lacked and reinforced this status by mandating regular elections to locally elected bodies. Further, the amendments mandated reservations of positions in these local bodies for women and for individuals from two traditionally disadvantaged (and constitutionally recognized) groups: Dalits (Scheduled Castes, i.e., castes at the bottom of, or more accurately, excluded from, the traditional Hindu caste hierarchy) and Adivasis (Scheduled Tribes, i.e., the indigenous populations of the Indian subcontinent). Beyond this, the amendments called on—but did not explicitly require—individual states, the highest tier of sub-national government within India’s federal setup, to enact legislation to devolve powers and resources to local bodies so as to enable the latter to function as institutions of self-government—to play a central role in the provision of public services, the creation and maintenance of local public goods, and the planning and implementation of developmental activities and programs to alleviate poverty and promote distributive equity.
At the national level, the ostensible aim of the constitutional amendments was clearly to
revitalize local government. This was seen as a means of promoting greater community participation and involvement in developmental efforts, thereby improving the dismal record of the Indian developmental state in the sphere of human development and public goods provision. In that the impetus for the amendments came from a widespread consensus regarding the failures of the bureaucratic and centralized apparatus of the Indian developmental state, supplemented, in certain circles, with a political agenda of democratic deepening, the attempt to revitalize local government in India mirrors attempts in other countries. But there are several key respects in which the Indian case stands out and these need to be highlighted at the outset.
First, because the Indian constitution assigns exclusive legislative domain over local governments to the states, unlike in many other countries where the impetus for decentralization originated at the national level and implementation responsibility also resided at the national level, in India, the final responsibility for the design and implementation of local government reforms lay with the states. Unsurprisingly, given the diversity in their historical trajectories and current sociopolitical and economic situations, across the states there has been tremendous variation in the design, scope and extent of devolution to local governments.
Second, and relatedly, the Indian case also differs from some others in that there have
been attempts in the past to empower local governments. Hence, the latest effort to revitalize local government is by no means a “greenfield" initiative. In particular, this means that the novelty of the reforms—the extent to which they represent a significant departure from the pre-1993 scenario—varies across the states. For instance, the provision mandating regular elections to rural local bodies clearly has different implications in the state of Bihar, where elections to rural local bodies were last held in 1978, than it does in the state of West Bengal where elections have been regularly held every five years since 1978.1 1It is important to recognize that this does not mean that this particular provision has no implications in the case of West Bengal because it does. By reducing the discretionary powers
3
Lastly, it should also be noted that whereas in some countries the impetus for
decentralization has come from external sources or has been triggered by an economic crisis, in India it was home-grown and there was no single precipitating event that led to the reform. That is not to say, however, that the pressure for reforms came from the grassroots. Instead, the reforms reflected the emergence of a remarkable consensus among India’s policy-making and intellectual elites.
In this paper I provide an overview of this large-scale, and in spirit at least, extremely ambitious initiative to revitalize local government in India. Because the specific design and implementation of the reforms was left to the discretion of individual states, the overview is naturally organized around and needs to consider the possibly divergent records of individual states. To keep the task manageable, I concentrate on the fourteen major Indian states, which, together accounted for over 93% of India’s population in 1991. The scope of the assessment is also inevitably limited by the information that is available. As a consequence the assessment primarily focuses on the extent to which devolution has been attempted. On certain fronts, not enough time has passed and in others, we simply do not know enough to say much about what the impacts of these reforms have been or are likely to be in the long run. Finally, as the title of the paper indicates, the assessment is limited to the efforts to revitalize rural local governments, which is to say that it is concerned primarily with the state-level responses to the 73rd amendment.
It should be noted as well that the overview provided in this paper is very much a mid-
term assessment, one that is likely to become outdated within the near future. That is because the reform initiative is an ongoing process in two essential respects: first, though nine years have passed since the amendments went into effect, individual states continue to pass legislation in this area and there continues to be a debate about the need for further formal institutional reform. Second, the dynamics and longer-term consequences of even the first set of reforms are still playing out.
I begin in the next section by detailing the key provisions of the 73rd amendment. The third section lays out the historical context for these amendments. The fourth section pulls together the available evidence on the design and scope of devolution at the level of individual states. I organize the discussion in this section along the three main dimensions of devolution: political devolution, administrative devolution, and financial devolution. I then construct a crude index aggregating these different dimensions into a single measure of the overall extent of devolution in each of the fourteen states. I use this index and a review of the available case-study evidence to identify some of the patterns that appear to be emerging. In the fifth section I present some basis statistics on the progress various states have made in terms of human development in the last decade. These statistics provide the basis for a very rudimentary attempt to trace the impact of devolution at the state-level. The sixth section lays out some of the insights that are suggested by the Indian case, both from a policy perspective and from a more academic perspective. The seventh section concludes with some thoughts on the future of the reforms. 2. The constitutional setting and the 73rd and 74th amendments
that state governments effectively enjoyed in the holding of elections to local bodies, the amendment takes away an option that the state government previously had though it chose not to exercise it. And in politics, as in finance, options have value even if not ultimately exercised.

4
India is a federal parliamentary democracy made up of 28 states and 7 union territories.2 At the national level, legislative authority rests with the two houses of the parliament: the Lok Sabha (House of the People), which consists of 545 members, all but two of whom are directly elected from single-member parliamentary constituencies distributed proportionally on the basis of population among the states and union territories; and to a lesser extent, the Rajya Sabha (Council of States), which has no more than 250 members, most of whom are indirectly elected by the members of the state legislative assemblies of the various states.3
The titular head of state is the President. Executive authority, however, resides with the national government—in particular, the Council of Ministers—headed by the Prime Minister who is the leader of the political party that is able to secure the support of the majority of the members of the Lok Sabha, either directly or through some form of coalitional agreement. Though the government enjoys broad powers and discretion in the design and implementation of programs and policies, it is ultimately answerable to the parliament.
The parliamentary structure at the national level is, with some exceptions, replicated at the level of individual states. Each state has a legislative assembly, members of which are directly elected from single-member constituencies organized on the basis of population. The titular head of each state is the Governor, who is appointed by the President. But, as at the national level, executive authority rests effectively with the state government headed by the Chief Minister, the leader of the political party with majority support in the state legislature.
Until the passage of the 73rd and 74th constitutional amendments, the states were the only sub-national units officially recognized by the Indian constitution.4 And the constitution grants individual states considerable legislative autonomy. Schedule Seven of the constitution explicitly demarcates the respective legislative domains of the state legislatures and the national parliament. The functional areas over which the national parliament has exclusive domain are specified in List I, also called the “Union List”. Items on this list include among other things, defense, foreign affairs, currency, income taxes, inter-state commerce, and key infrastructure. On the other hand, state legislatures have exclusive authority to enact legislation dealing with the items in List II, known as the “State List”. Included in this list are items such as law and order, public health, agriculture, wealth taxes, land tenure and land reforms, and most notably in the current context, functions of local governments. List III, the “Concurrent List” includes items such as electricity, newspapers, education, price controls, etc., over which the national parliament and the state legislatures share jurisdiction.
As mentioned earlier, the Indian constitution recognizes and makes special provisions for mandatory political representation—through reservation of seats in the legislative assemblies at both the state and the national levels—of two types of historically disadvantaged groups: Dalits and Adivasis.
The legislative origins of the 73rd and 74th constitutional amendments date back to the
the Constitution (64th Amendment) Bill, which was introduced in the parliament in July 1989 by 2 The number of states has increased over time, with various state re-organization initiatives. The latest occurred in 2000, when three new states were created: Chhattisgarh, by partitioning the state of Madhya Pradesh, Jharkand, from the state of Bihar, and Uttaranchal, from the state of Uttar Pradesh. 3 Two members of the Lok Sabha and 12 members of the Rajya Sabha are directly appointed by the President to represent, respectively, the small Anglo-Indian community and various fields of human endeavor such as literature, sciences, the arts and social service. 4 The constitution of India came into effect on January 26, 1950, just over two years after India attained its independence on August 15, 1947.
5
the government of the then Prime Minister Rajiv Gandhi. The introduction of this bill represented the first attempt to confer constitutional status on rural local governments. Though the bill’s broader aim of revitalizing rural local government was greeted favorably, some of the details were criticized and the bill was ultimately defeated in the Rajya Sabha. It is worth noting that the main criticism leveled against the bill was that it offered the states little discretion in the design of local government reforms.
The 73rd and 74th constitutional amendments were introduced in parliament in September, 1991 by the government of Prime Minister Narasimha Rao of the Congress(I) Party in the form of two separate bills: the 72nd Amendment Bill for rural local bodies (also known as panchayats) and the 73rd Amendment Bill for municipalities. They were referred to a Joint Select Committee of Parliament and were ultimately passed as the 73rd and 74th Amendment Bills in December, 1992.5 After the bills were ratified by the state assemblies of more than half the states, the President gave his assent on April 20, 1993. The amendments were then officially enacted through the issuance of government notifications. The Constitution (73rd Amendment) Act, 1992 (commonly referred to as the Panchayati Raj Act) went into effect on April 24, 1993, and the Constitution (74th Amendment) Act, 1992 (the Nagarpalika Act), on June 1, 1993.
With local governments being a state subject in Schedule Seven of the constitution, any legislation reforming the structure of local government has to, ultimately, be enacted at the state level. The first task of the states was therefore to pass conformity acts, which either introduced new legislation or amended existing legislation, to bring the state laws into line with the provisions of the amendment. Under the amendments, states had a year, from the date the amendment went into effect, to do so.
Because the amendments contain both mandatory and discretionary provisions, the
degree of flexibility afforded the states in this task varied with the provision in question. The distinction between mandatory and discretionary provisions is embodied in the specific language adopted in the acts and carried over into the newly inserted articles of the constitution. The mandatory provisions were those that contain the word “shall” in referring to the steps that individual states needed to take. In the discretionary provisions, on the other hand, the word “may” figures prominently. And so, while many of the discretionary provisions laid out a vision and created a space for individual states to legislatively innovate in reforming local government, ultimately, the design and scope of particular reforms was left to the discretion of individual state legislatures.
Of the mandatory provisions of the Panchayati Raj Act, the most critical are those that
strengthen the structure of representative democracy and political representation at the local level. The key mandatory provisions are:
• the establishment in every state (except those with populations below 2 million) of rural local bodies (panchayats) at the village, intermediate and district levels (Article 243B)
• direct elections to all seats in the panchayats at all levels (Article 243C) • compulsory elections to panchayats every five years with the elections being held before
the end of the term of the incumbent panchayat. In the event that a panchayat is dissolved prematurely, elections must be held within six months, with the newly elected members serving out the remainder of the five year term (Article 243E)
• mandatory reservation of seats in all panchayats at all levels for Dalits and Adivasis in proportion to their share of the panchayat population (Article 243D)
5 In the fifteen months between the time the bills were introduced and the time they were finally passed, the numbering changed.
6
• mandatory reservation of one-third of all seats in all panchayats at all levels for women, with the reservation for women applying to the seats reserved for Dalits and Adivasis as well (Article 243D)
• indirect elections to the position of panchayat chairperson at the intermediate and district levels (Article 243C)
• mandatory reservation of the position of panchayat chairperson at all levels for Dalits and Adivasis in proportion to their share in the state population (Article 243D)
• mandatory reservation of one-third of the positions of panchayat chairperson at all three levels for women (Article 243D)
In addition, the act mandates the constitution of two state-level commissions: an independent election commission to supervise and manage elections to local bodies, much as the Election Commission of India manages state assembly and parliamentary elections (Article 243K); and a state finance commission, established every five years, to review the financial position of local bodies and recommend the principles that should govern the allocation of funds and taxation authority to local bodies (Article 243I).
Among the discretionary provisions the two central ones, which in the opinion of many
observers are the core of the amendment, call upon the states to:
• endow the gram sabha—the electorate of a village panchayat—with powers and functions at the village level (Article 243A)
• devolve powers and authority to panchayats so as to enable them to function as institutions of self-government. In particular, the provision calls for devolution of powers and responsibilities for the preparation of plans and implementation of schemes for development and social justice dealing with an impressively wide range of items, which are listed in a new schedule, Schedule XI, of the constitution (Article 243G)
A further discretionary provision (Article 243H) authorizes states to pass legislation aimed at increasing the financial resources available to rural local bodies by increasing the latters’ statutory taxation powers and by providing for grants-in-aid from the state government The newly introduced Schedule XI of the constitution (shown in Table 1) contains a comprehensive list of functional items, ranging from agricultural extension, implementation of land reforms, poverty alleviation, and promotion of small-scale industries to health, primary and secondary education and family welfare. In fact there is considerable overlap between Schedule XI and the State List of Schedule VII of the constitution, with one of the notable omissions in Schedule XI being law and order.
Broad and impressive as the list of items in Schedule XI is, as D’Souza (2000) rightly points out, the language of the amendment itself indicates that the notion of local self-government is a fairly circumscribed one. While calling on states to empower panchayats to play a central role in planning and implementation of a variety of programs, the provision, despite the inclusion of the word “self-government,” makes no mention of transferring any legislative authority to rural local bodies. By omission therefore, certain spheres of policy implicitly remain outside the realm of local governments. Two other points need to be mentioned. The first is that while, for the most part, the 74th amendment act deals with urban local bodies, a key article contained in that amendment applies to rural local bodies as well. The article in question, Article 243ZD, mandates the constitution of District Planning Committees to consolidate the plans prepared by both rural and urban local bodies.
7
The second point is that the provisions of the 73rd amendment did not apply to what are known as Scheduled Areas, constitutionally recognized areas of the country with large Adivasi populations. The amendment did however contain a provison reserving the right of parliament to extend the amendments’ provisions regarding local bodies to Scheduled Areas at a later date without the need for a further constitutional amendment. Parallel provisions regarding local governments in Scheduled Areas were ultimately enacted through the Provisions of the Panchayats (Extension to the Scheduled Areas) Act of 1996. 2. Setting the context
The public debate and discussion that preceded the adoption of the 73rd and 74th constitutional amendments revolved almost entirely around the need to correct the multiple failures of the bureaucratic and centralized apparatus of the Indian developmental state—the failure to ensure the efficient and effective delivery of public services, to effectively provide and maintain key infrastructure essential for economic growth, to promote equity, and to eliminate the multiple deprivations associated with poverty.
The basic claim made by proponents of the amendments was that by devolving powers
to locally elected bodies the above-mentioned failures would be addressed. The fact that this claim was accepted, at least on the surface, by almost all participants in the public debate—differences of opinion remained on the details—is remarkable given the earlier more contested view of the virtues of localizing government in India’s public discourse.
To better understand the roots of this consensus, the scope of the constitutional reforms
at the national level, and in particular, the thinking behind the specific provisions of the amendment act, it helps to have a sense of the historical experience with local government, the political constraints imposed by India’s federal structure, and the functionings of the Indian developmental state, particularly in rural areas.
• Debates in the Constituent Assembly reflected contrasting positions of Gandhi and Ambedkar
on the desirability of decentralized governance structures • Phases in the history of panchayati raj in India and the associated committees: Balwantrai
Mehta Committee and the phase of ascendancy (1959-64); phase of stagnation (1965-69); phase of decline(1969-77); Ashoka Mehta Committee and the revival of panchayats but as political institutions in a few states
• elections to local governments frequently postponed at the discretion of the state
governments, or in many cases because of writ petitions to the courts • Over the years, rural development in the Indian context came to be characterized by a
proliferation of government schemes and programmes, staffed by civil servants who, at lower levels, were, at best, accountable only to their superiors in the administrative hierarchy of their respective agencies or line departments, and at upper levels, motivated largely by career concerns in which the responsiveness to state-level elected representatives figured prominently.
• Under the planning approach, preoccupation with narrow sectorally-specific physical targets,
little attention to integrated outcomes
8
• Inefficiencies, leakage, corruption associated with the plethora of government schemes; increasing flow of funds through panchayats in their role as implementing agencies for various schemes led to emergence of collusive networks connecting bureaucrats, local and higher-level elected representatives, and other members of dominant local elites. Undermined the legitimacy of the panchayats and wreaked havoc on the the performance of various schemes.
• in 1991, under the pressure of a severe balance of payments crisis, and through a
congruence of favorable political factors, the government then in power initiated a broad package of economic policy reforms, which subsequent governments have, for the most part, maintained and supplemented. Under the new economic policy regime, India’s notorious industrial licensing regime has been largely dismantled, domestic industry has been deregulated, trade liberalization measures have been implemented, and the economy has been opened up to foreign direct investment. Financial sector reforms have also been introduced at a slow but steady pace.
• The timing of 1991 trade and industrial policy reforms happens to roughly coincide with the
attempt to revitalize local government, but in terms of the initial impulse as well as the ultimate aim, these reforms are quite distinct. Trade and industrial policy reforms precipitated by balance of payments crisis and the poor performance in terms of economic growth. Aim was to reduce sphere of government influence and control. Consensus behind the need for local government reforms emerged more gradually, and was borne out of the failures of the Indian developmental state in terms of human development and poverty alleviation, particularly in rural areas. The aim was to reconfigure the structure of government.
• The Panchayati Raj amendment has been hailed as a landmark in the evolution of rural local
government in India. And they may well turn out to be so in the long run. But in many ways the provisions of the amendment represent a marginal or incremental reform in that they are specifically tailored to address some of the particular (perceived) problems with previous attempts to empower local government without radically reconstituting the balance of political power at the sub-national level. The clearest indication of this is the seeming gap between the mandatory provisions requiring regular elections to local bodies and the weaker discretionary nature of the other parts of the amendment.
4. Assessing the design and scope of devolution at the state level
The task of assessing any reform initiative can be subdivided into two stages: a first stage of documenting the extent and scope of the reforms, and a second of evaluating the effects of the reforms. Drawing causal inferences about the impact of particular changes in the policy environment is almost always difficult in the absence of policy experiments. With so-called stroke-of-the-pen reforms that are narrowly focused—for instance, a reduction in tariffs, or the removal of industrial licensing requirements—the first stage is typically relatively straightforward. But with reforms that are broader in scope, in particular those that aim to bring about fundamental changes in the institutional context and practice of government, even the apparently simple task of documenting the scope and extent of the reforms becomes difficult.
There are two reasons why this is so. The first is the fact that these reforms are intrinsically multidimensional in nature. An attempt to revitalize local government and institutionalize more decentralized and participatory forms of local governance necessitates reforms along multiple dimensions. The structure and status of institutions of representative democracy need to be altered. Administrative reforms transferring control over civil servants from line departments to local governments have to be initiated. The minutiae of administrative

9
procedures, governing recruitment, promotion, reporting structures, etc. have to be reworked. Functional responsibilities for a wide range of items have to be reassigned. The various aspects of the devolution of financial resources have to be worked out from changes in the assignment of taxes and the adoption of formulae for the transfer of funds to the relative shares of tied vs. untied grants. Keeping track of the changes in all these dimensions is difficult.
A second and more prosaic reason is simply the practical difficulties of empirically distinguishing de jure or nominal reform measures from substantive de facto steps that actually alter day-to-day practices. There is a real danger that too much emphasis is placed on easily recorded indicators of changes in legislative provisions and bureaucratic rules and processes, and insufficient attention paid to whether even clearly mandated changes are effected in practice. This is not to say that changes in the formal legislative and institutional environment are unimportant, only that in contexts where formal structures may be imperfectly applied/enforced, the ground-level reality may differ considerably. Changes in formal structures may well be important as necessary conditions, but are unlikely to prove sufficient.
A further important complication in the Indian context is one that I have already alluded to above. And that is the fact that though some provisions of the 73rd and 74th amendments were mandatory, the design and degree of implementation of many of the key reforms called for in these amendments were left to the discretion of individual states. Not surprisingly, that has led to considerable variation in the scope and extent of devolution across the Indian states. With these difficulties in mind, I document what rudimentary evidence there is, of the scope and extent of devolution along each of the three dimensions. The assessment is limited to the fourteen major states—states with populations exceeding 15 million that are not special category states. Where relevant (and possible), I also provide some indication of the aggregate India-wide picture as well.
Tables 2(a) and 2(b) provide a basic profile of the fourteen states. The sheer size of many of the states and the tremendous diversity among them, whatever the characteristic one is looking at, is striking. In 1991, the states ranged in population from a low of 16 million in Haryana to 139 million in Uttar Pradesh. West Bengal, with a population density of 767 per square kilometer was nearly six times more densely populated than Rajasthan. Punjab’s per-capita state domestic product of Rs.4336 (at constant 1980-81 prices) was over three times that of Bihar, the poorest state. There was tremendous variation in rural poverty as well, from a low of 6.2% in Punjab to a high of 48.6% in Bihar. In terms of human development, the state of Kerala stood well apart from the other states, a well-known fact that has received much attention in international development circles. The so-called BIMARU states, Bihar, Madhya Pradesh, Rajasthan and Uttar Pradesh lay at the opposite extreme.
These observable differences in key economic, demographic, and human development indicators stem from and are supplemented by less easily quantified differences in the states’ colonial histories, political culture, levels of social mobilization, and internal caste polarization. To the extent that the prospects for participatory local governance depend in part on a variety of enabling features of the contexts in which it is attempted, as many have argued, this diversity in the initial conditions across the Indian states clearly needs to be borne in mind in considering the design, scope and impact of state-level devolution efforts. 4.1. Political devolution: voice, autonomy and accountability
Of the various institutional reforms, both nominal and substantive, that individual states have initiated since 1993, perhaps the most easily verifiable are the steps taken to meet the

10
mandatory provisions of the constitutional amendment regarding the structure of political representation below the state level. And so I begin by reviewing the progress on this front.
The constitutional amendment mandated the creation of an uniform three-tier structure of local government institutions at the sub-state level.6 Immediately below the state are the district panchayats, below them, the block panchayats, and at the lowest level, the gram panchayats (village councils). Gram panchayats have existed in most states since at least the late 1950s (following the recommendations of the Balwantray Mehta Committee). However, in some states, there were no block panchayats (or their equivalent) or district panchayats and in these states, these higher tiers of sub-state local governments had to be created. The relevant states all enacted the necessary legislation to meet this requirement. Table 3(a) depicts the structure of representative democracy that resulted. From a single national parliament and 25 state legislative assemblies, India went to having 238, 682 additional constitutionally recognized representative bodies, 499 at the district level, 5905 at the block level, and 232,278 at the village level. And for the first time there exists an uniform three-tier structure of rural local governments in India. But as Table 3(a) indicates there remains considerable variation across states in the make-up of the three-tier structure, the details of which were left to the discretion of the states, and were in part determined by varied historical legacies. In particular, village panchayats in Kerala and West Bengal stand out in being considerably larger, in terms of population than village panchayats in other states.
Much of the rhetoric that accompanies initiatives to empower local governments highlights the need to downscale government, to bring “government closer to the people.” At least on one dimension, the “closeness” of the electorate to their elected representatives (as measured by the number of individuals represented by each elected representative), that is literally what the mandated creation of these locally elected bodies did. Before 1994, the elected representatives effectively closest to the voters were the state legislative assembly members (MLAs). As Table 3(b) indicates, on average, this meant a population of nearly 200,000 or more per MLA. After 1994, this number has, in principle, come down to a few hundred in most states with the village panchayat representative being closest to the population . Of course, these numbers overstate the contrast, since village panchayats did exist even prior to the amendment. But given the irregularity of local body elections in most states, it is not clear that panchayat members could reasonably be considered “elected” representatives. The larger point though is that by increasing the pool of constitutionally protected elected representatives some five hundredfold, the amendment brought about a dramatic broadening of the representative democratic base of India.
Of course, for this new structure to meaningfully increase the closeness of elected representative, elections have to be held regularly. Prior to 1994, with the exception of West Bengal since 1978, local body elections had not been held on a regular schedule in most states. In many cases elections were delayed as a result of writ petitions submitted to the courts by groups other than the state government. In others, state governments themselves unilaterally postponed elections, putting forward a variety of reasons for the postponement, from natural disasters to civil unrest to school holidays. By mandating regular elections to local government institutions, the constitutional amendment sought to restrict the discretionary authority of the state governments. The amendment even contains a provision (Article 243O) barring interference by the courts in electoral matters.
Have these provisions made a difference? The second column of Table 3(c) provides a
partial answer. Shown there are the dates of elections to village panchayats in the last ten years. Since the constitutional amendment calls for an uniform and unalterable term of five years, each state should have had two elections, and the period between elections should not have exceeded 6 Smaller states with populations below two million are exempt from this requirement.

11
five years. Table 3(c) indicates that the first standard has mostly been met. But less than half the states have met the second, constitutionally mandated standard. And in the case of Orissa and Uttar Pradesh, which did hold elections within five years, elections were held only as a result of court interventions overturning the state governments’ decision to postpone elections (Matthew (2001)).
Even when elections have been held, some states have failed to meet the provisions
regarding mandatory representation for women, Dalits, and Adivasis. Drawing on the most recent local body elections for which data are available, the second through eighth columns of Table 3(c) provide an indication of the extent to which this particular mandate was met. The constitutional provision mandated that a third of all seats at all levels be reserved for women. In most states this mandate was met, and some such as Karnataka, Tamil Nadu, and West Bengal, even exceeded it. However, in Punjab and Uttar Pradesh the mandate was not met. The fifth through eighth columns display the relative representation ratios of Dalits and Adivasis at the lowest and highest tiers of local government. The relative representation ratio of a group is defined as the ratio of the fraction of elected representatives from that group to that group’s share in the state’s population. By consitutional mandate, this ratio ought to be 1. That clearly is not the case in a number of states. The fact that the problem appears to be worse at the level of village panchayats is suggestive of the social and exclusionary dynamics operating in the villages of the states in question. At the district level, with fewer seats to fill in absolute terms, this appears to have been less of an issue, presumably because almost all the major political parties, for purely instrumental electoral reasons, have recruited some members from traditionally disadvantaged groups into their ranks.
Regular elections may ensure, albeit crudely, some degree of accountability and provide
some legitimacy to locally elected representatives, but they represent only one step in the process of political devolution. Equally important is the degree of political autonomy afforded locally elected bodies. On this front, there’s little variation across the states. Reviews of the various state conformity acts indicate that even at the statutory level—let alone in terms of actual practice—state governments have, against the spirit of the amendment, retained considerable powers over the rural local bodies. As Table 3(d) indicates, in all states, the state-level legislation vests various functionaries of the state government—for instance, the district collector (the chief civil servant at the district level)—with the authority to intervene in the functioning of rural local bodies. These provisions have been criticized by many proponents of local government, not because they do not recognize the need to have some accountability and oversight mechanisms in place, but because the provisions violate the separation of powers and such authority is better retained by the courts.
As indicated in the second column of Table 3(d), all the states also acknowledge a role
for elected representatives to higher levels of government, namely Members of Parliament and Members of Legislative Assembly in the two higher tiers of rural local government. Again, this has been criticized because of concerns about the disproportionate influence that MPs and MLAs are likely to enjoy.
The first column of Table 3(d) reveals the state-level variation in one aspect of the design of political devolution that is of particular concern in the Indian context. And that has to do with whether the village panchayat chairperson is selected through direct elections. Apart from Karnataka, Kerala, Maharashtra and West Bengal, all the states require direct elections. The inclusion of this feature of a presidential system of government has been decried by many who see in it the potential for perpetuating the status of panchayat chairperson as a “first among equals.” The concern regarding this provision stems from the experience of the last five decades
12
Lastly, by explicitly recognizing the gram sabha—the electorate of a village panchayat—the constitutional amendment envisioned a more direct channel through which citizens could exercise “voice” and participate in local governance. The hope was that the gram sabha, through regular meetings over the course of the year, could become the fulcrum of the community development process, playing a key role in both the planning and subsequent monitoring of development activities. The particular roles and functions entrusted to the gram sabha were however left to the discretion of state legislatures. The state-level legislation, in most states, does little more than mechanically list a variety of nominal functions and duties to be performed by gram sabhas. Only in Kerala, has there been an effort to seriously engage the gram sabha. I detail the Kerala experience in a later section. 4.2. Functional and financial devolution
Article 243G of the constitutional amendment, which calls upon state governments to devolve power, authority and responsibilities to rural local bodies so as to enable them to “functions as institutions of self-government,” captures the core ostensible aim of the constitutional reform. And that was to empower and enable rural local bodies to play the central role in the provision of public services, the creation and maintenance of local public goods, and the planning and implementation of developmental activities and programs to alleviate poverty and promote distributive equity.
At the time the constitutional amendments were introduced, the situation in most states
was almost farcically far from this ideal. The functional domain of rural local bodies was largely limited to the provision of some core services such as street lighting, water supply, sanitation, and local roads. To the extent that panchayats were involved in developmental activities, they played the role of implementing agencies at the local level for various schemes sponsored by either central government or state government departments. In this capacity, panchayats helped identify beneficiaries for a number of transfer schemes, and oversaw the management and implementation of various local infrastructure schemes funded through various state government departments.
The picture presented above is an aggregated one. There have been attempts at various points in time and in various states to enhance the role of local governments. At the national level, the initiative for community development following the Balwantray Mehta Committee has already been mentioned. The experience of a few selected states also bears mentioning. The western states of Gujarat and Maharashtra were early reformers, passing legislation in the 1960s transferring many activities, including primary health care and education to district panchayats. In both states, funds were devolved as well and a separate administrative service—the Panchayat Service in Gujarat and the Maharashtra Development Service in Maharashtra—was set up to facilitate the transfer (or deputation) of state-level civil servants to work with the district panchayats.
More recently, in the mid-1980s, the southern state of Karnataka undertook a significant
and in many respects, far-reaching devolution of functional responsibilities to the district panchayats. The Karnataka experience is described in some detail in Crook and Manor (1998). But as in the cases of Gujarat and Maharashtra, the original vision behind the decentralization effort has not been sustained.
Significant attempts to broaden the functional domain of village panchayats have been
rarer. West Bengal, since 1978, has made a concerted attempt to more directly involve village panchayats in the implementation of various programs.

13
To what extent has the passage of the constitutional amendments changed the situation? While a definitive response to this question is not possible without a detailed empirical study, which has yet to be done, of the institutional arrangements under which local governments operate on a day-to-day basis, anecdotal reports, media accounts and a myriad of case-studies suggest that, with perhaps a couple of exceptions, the progress by the states in genuine functional and financial devolution has been extremely limited.
At the statutory level, almost all the states have enacted new or amended previous
legislation to broaden the functional domain of panchayats. But, as Vijayanand (2001) points out, statutory provisions, unless they are extremely detailed, provide “only the skeletal framework and form” for the day-to-day workings of government and for the design and implementation of public programs. The “flesh and blood of administration,” in practice, comes from the myriad of administrative rules and procedures—procurement rules, reporting structures, compensation schemes, accounting systems, etc.—that are put in place by the executive branch of government.
A number of reports that review the state-level legislation indicate that, in most instances,
the statutes merely provide a “shopping list” of various activities and sectors for which panchayats would be newly responsible (Government of India (2001), World Bank (2000)). Little detail is provided in the legislation in terms of the specific roles and responsibilities of the different tiers of panchayats relative to the other tiers and to the existing line departments of the state governments.
Whether the lack of specificity and clarity in the state conformity legislation was strategic,
as some have argued, can be debated. State legislatures were under some pressure to enact the conformity legislation within a prescribed time frame. Articulating a detailed road map for administrative devolution may not have been feasible within this time frame. However, if that were the sole reason for the omission of details regarding the framework for functional devolution, one would expect to see, subsequent to the initial legislation, significant administrative steps being taken.
In ascertaining the extent of administrative devolution it is therefore necessary to go
beyond the legislative statutes and review whether the administrative steps—issuance of government orders and circulars, notification of changes in administrative rules and procedures—needed to fully operationalize the intent of any new legislation have in fact been taken. A thorough and direct review of the gamut of statutory and administrative measures that the major Indian states have undertaken is beyond the scope of this paper. I rely instead on a number of detailed studies to piece together an overall picture.
One such study is the Report of the Working Group on Decentralised Planning and Panchayati Raj Institutions (Government of India (2001)), a high-level task force of the central government. Table 4(a) displays the report’s findings, based upon information compiled by the Ministry of Rural Development, on the extent to which functions, funds, and functionaries have been transferred to rural local bodies. The second column displays the count of activities—of the 29 listed in Schedule XI of the constitution—that individual states have transferred to local governments. In several states all the functions appear to have been transferred though what exactly this means is unclear. But from the third and fourth columns it is clear that even when functions have been statutorily or even administratively transferred to panchayats, in most states, the funds and personnel necessary for meaningfully carrying out these functions remain under the administrative control of the state-level bureaucracy (departments of the state governments). Karnataka, Kerala, Maharashtra and West Bengal are the exceptions to this norm.
Yet another indicator of the failure of the states to make any serious efforts to implement
the spirit of the amendment comes from looking at the status of the District Planning Committees,
14
the constitution of which was mandated by Article 243ZD. As can be seen from the last two columns of Table 4(a), many states have yet to establish the District Planning Committee. The significance of this is that it indicates that funds for a variety of central and state-sponsored schemes are still being routed through the District Rural Development Agencies and line departments. It is also an indication that the rural local bodies are yet to be genuinely involved in the planning process. Even when the District Planning Committee has been constituted, in some states, contrary to the spirit of the amendment, it is headed by a state minister rather than the chairperson of the district panchayat. A central theme in the economic literature on decentralization is that the functional and fiscal domain—taxation and spending authority—of local governments should, to the extent possible, overlap. In a perverse sense the pre-amendment situation in most Indian states satisfied this basic tenet in that the severely circumscribed functional domain of panchayats described above was mirrored by an equally limited fiscal domain. In principle, panchayats, and in particular, village panchayats, did have powers to impose local taxes and assess a variety of fees. In practice, given the limited capacity and effective authority of village panchayats to enforce tax collection, and the even more limited incentives they had to do so under the prevailing system of transfers from the state and central governments, local revenue collection was negligible and revenue dependency—the share of panchayat total income that came from external sources—was in most states very high.
Panchayat revenues fall into two main categories: own revenues and transfers from higher levels of government.7 Own revenues, i.e., revenues that are collected locally, come from two sources: non-tax sources such as user fees for local public goods and commons, income from panchayat-owned properties, etc., and own tax revenues. Own taxes are those that are statutorily assigned to local bodies and collected by the local bodies. Typically own taxes have included items such as entertainment taxes, dwelling taxes, taxes on professions, levies on pumps, tractors, etc.
The other main category of revenues, intergovernmental transfers, can be sub-divided
into tax and non-tax components as well. The tax component consists of revenues from both assigned taxes—taxes statutorily assigned to local bodies but collected by the state government and transferred to the local body—and shared taxes—taxes assigned to the state and entirely collected by the state government but subsequently shared with local bodies. The non-tax component of intergovernmental transfers takes the form of grants from the central and state governments, tied in most cases to a variety of state-sponsored and centrally-sponsored development schemes.
On the expenditure side, because their effective functional domain was so limited, panchayats had few areas over which they have enjoyed discretionary decision-making authority and budgeting autonomy. The bulk of the expenditures that were incurred by—i.e., nominally routed through—the panchayats were financed by the tied grants linked to specific state and centrally-sponsored schemes. That panchayats lacked genuine spending authority for much of their expenditures is indicated by the restrictions that most states placed on the power of village panchayats to sanction expenditures above a pre-specified cap.
The second, fifth, and eigth columns of Tables 5(a) to 5(d) give some sense of the state
of panchayat finances in the years, from 1990 to 1995, immediately preceding and subsequent to the passage of the constitutional amendments, and before, presumably, any reforms had taken 7 Other potential sources of funds are loans from financial institutions, public and private, and voluntary contributions from panchayat residents. Historically these have been uniformly negligible though this may change with proposals to set up a Panchayat Finance Institution.
15
effect. A couple of disclaimers need to be made about the information presented in these tables. First, data on local government finances in India (and it must be said, in most poor developing economies) are extremely hard to come by and can be quite unreliable when they are available, which in itself is an indication of the status of local governments. The scale of the problem is reflected in the fact that the Eleventh Finance Commission, a statutory body at the national level that prescribes the rules for transfers between the national government and the state governments, specifically set aside funds to assist panchayats in the maintenance of accounts and to set up a database on local government finances (Government of India (2000)). The second caveat is simply that data on the flow of funds through panchayats, no matter how accurate, do not indicate which tier of government has ultimate decision-making authortity.
Table 5(a) clearly indicates the dismal record of rural local bodies in collecting revenues locally. On a per-capita basis, own revenues were laughably low. What revenues were derived locally were generally collected by the village panchayats with whom the statutory powers of taxation resided in most states. Village panchayats in ten of the fourteen states reported own revenues of less than Rs.10 per year on a per-capita basis. Given the relatively small populations of most village panchayats, these figures translate into aggregate own revenues—for instance, Rs.760 for Uttar Pradesh, or Rs. 11,310 for Tamil Nadu—that are insufficient to cover even minimal establishment costs. The only exceptions to this generally bleak picture were Haryana, Punjab and Kerala.
Not surprisingly given the low absolute levels of own revenues, revenue dependency
levels were high in most states, with Haryana, Kerala and Punjab again being the exceptions. The level of revenue dependency is a normalized measure that obscures differences in scale. From Table 5(b) it is clear that there were significant differences in the volume of revenues flowing through local governments in different states. Per-capita total revenues of all rural local bodies combined were highest—an order of magnitude higher than in some of the other states—in the states of Gujarat, Karnataka and Maharastra, reflecting their respective legacies of devolution to the district level.
Since own revenues were likely to be the sole source of funding for the discretionary
expenditures by village panchayats, the low levels of own revenues are mirrored, as one would expect, by low levels of expenditures on core services by village panchayats. This is apparent from Table 5(c). Somewhat surprising in light of the fact that the core services in question are truly local in nature is the fact that in a few states—Andhra Pradesh, Karnataka, Maharashtra, and Uttar Pradesh—there is a jump in reported expenditures on core services in going from the village panchayat to the higher tiers of local government.
To address the weak financial position of panchayats, in Article 243H, the constitutional
amendment authorizes states to pass legislation aimed at increasing the financial resources available to rural local bodies by increasing the latters’ statutory taxation powers and by providing for grants-in-aid from the state government. To assist the state governments in this process, the amendment mandates the constitution of a State Finance Commission every five years. Under this provision, the State Finance Commissions are charged with advising the state governments on the principles to be adopted in determining the allocation of funds to local bodies and the range of taxes to be devolved to local bodies.
The fourteen major states all constituted State Finance Commissions by the prescribed deadline, i.e., within a year of the amendment coming into effect. Thereafter, however, the record of individual states has varied significantly. It is worth spelling out the sources of this variation, not so much because the work of the State Finance Commissions represents a key element of the constitutional reforms, but rather because it provides yet another example of how, within India’s federal structure, even a mandatory constitutional provision can be ignored or deliberately
16
misimplemented. In four of the states, Bihar, Gujarat, Madhya Pradesh, and Orissa, the commission had to be reconstituted because the original commission was not, for a variety of reasons, able to submit its report. In most states, there were delays of two to three years before the commission was able to submit its report, often because the information on local government finances and needs was not readily available. There were further delays still, often over a year after the submission of the commission’s report, before the state government submitted an Action Taken Report to the state legislative assembly . And even then, only in some states, for instance Kerala, did the government accept and pledge to implement all of the recommendations made by the finance commission.
A number of studies have examined the reports of the State Finance Commissions in
some detail. These suggest that for the most part the finance commissions have attempted to balance the natural limits, both economic and political, to the tax base of local governments, the need for interjurisdictional equity given the heterogeneity in local economies and the need to preserve the incentives of local governments to raise revenue locally.
From an economic perspective, the natural tax base of local governments consists of
taxes on immovable property and user fees for local public goods and commons. In rural India the predominant form of property is agricultural land. There is a levy on agricultural land in most states—based not on the value of the land but on the potential income from it as determined by its productivity— but it is not seriously enforced.8 The “settlement rates”, i.e., the assessed productivity of the land used to calculate the levy, have been so rarely revised and updated that revenues from this particular source have become insignificant (Rajaraman (2000)). Perhaps anticipating the political constraints on doing so, none of the State Finance Commissions appear to have seriously considered proposals, such as that put forward by Rajaraman and Bhende (1998), to revive the land levy as a source of income for rural local bodies. Instead, the recommendations have largely been limited to reassignment of some minor taxes, e.g.,, imposition of surcharges and the like.
If indeed, as many claim, there are few elastic sources of local revenue for rural local bodies, the only real avenues that remain for enhancing the financial resources of rural local bodies, while ensuring some degree of budgeting autonomy, are on the one hand, to identify mechanisms for improving the tax effort—i.e., better collection and enforcement of existing taxes and fees—of local bodies, and on the other, to increase the transfer of untied block grants from the state governments. Concerns have been expressed about the incentive effects of a move towards untied block grants on the tax effort or more broadly, own resource mobilization efforts, of rural local bodies. These concerns are, in principle, legitimate but given the empirical evidence on the limited tax effort of rural local bodies even in the absence of untied grants, they seem misplaced. It is hard to see how tax effort could get any worse.
The way forward would therefore appear to be to consider increasing the use of untied
block grants while exploring ways of improving the tax effort of local bodies. The use of matching grants as incentive devices risks worsening cross-jurisdictional inequality. Matching grants, though ideally based on tax effort relative to the tax base, in practice, tend to be based on observed tax revenues because tax effort is difficult to directly ascertain. In settings where the tax bases of local bodies vary greatly because of inherited disparities in infrastructure and levels of economic activity, the use of these matching grants is clearly likely to exarcebate, rather than mitigate these existing disparities. The alternate route considered by some of the State Finance 8 The distinction between a tax on the value of land and a tax on the potential income from the land would be irrelevant with well-functioning land markets since the potential income stream from the land would be capitalized into the value of the land. In rural India, as in many poor agrarian economies,

17
Commissions was therefore to make “obligatory” the collection of certain taxes and fees and moreover to specify a floor on the minimum tax rates that local bodies could impose.
The State Finance Commission reports, even when they have been accepted in principle, do not of course, reveal the extent to which financial devolution has actually taken place. Again, without further detailed empirical research, it is impossible to say definitively what the situation is in individual states. But a sense of the overall trend can be obtained by returning to the data on panchayat finances presented in Tables 4(a) to 4(d). The third, sixth and ninth columns of these tables present summary statistics on local government finances at the state level for the most recent three years, 1995 to 1998, for which they are available. Table 4(b) indicates that in a few states, whether or not there was genuine financial devolution, there was at least a dramatic rise in the flow of funds to rural local bodies. Nationwide, per-capita total revenues of village panchayats rose by nearly 60% in the relatively short span of 5 years or so. In Kerala, Madhya Pradesh, Maharashtra, Rajasthan and Tamil Nadu the growth in village panchayat revenues exceeded the national rate, in the case of Kerala (217%), Maharashtra (114%) and Rajasthan (106%), by a considerable margin. In Kerala and Madhya Pradesh the total revenues of all rural local bodies combined also grew at a rate far exceeding the national average. The numbers for Madhya Pradesh suggest a bias in favor of district panchayats relative to village panchayats. In contrast, in the case of Maharashtra there appears to have been some movement towards redressing the previous focus on district panchayats. Rajasthan and Tamil Nadu are the only two other states where the recorded per-capita revenues of village panchayats grew at a faster rate than did the revenues of block and district panchayats. In terms of the impact of increased grants-in-aid to local bodies on the own revenues of local bodies, some of the worst fears seem to have been unfounded. Though measured levels of revenue dependency did increase in some of the states (e.g., Kerala and Madhya Pradesh) that had the highest rates of overall revenue growth, in absolute terms own revenues increased appreciably in the same states. Overall, the available information suggests that in most states there has been very limited progress in terms of administrative and financial devolution. What is one to make of this? Certainly it suggests a lack of political will and significant bureaucratic resistance. But to attribute it entirely to efforts to preserve “rents” would be to risk oversimplifying the nature of the problem.
A more nuanced perspective would also recognize that the process of transferring funds and functionaries can be quite complicated. In terms of transferring personnel, two sets of issues arise. The first is a practical one—the need to adequately address bureaucratic career concerns in order to retain and attract suitably qualified individuals to these positions. The smaller scale of the bureaucracies supporting local governments potentially limits the upward promotion possibilities for civil servants and practical ways have to be devised to get around these limits.
A second issue that arises is the tension between the need to, on the one hand, make
bureaucrats accountable to elected representatives, and on the other, ensure some degree of insulation for the bureaucracy from political pressures. The basic tension between bureaucratic accountability and autonomy does not of course exist only at the local level—see Krishnan and Somanathan (2001) for a lucid discussion of this point in the context of the Indian Administrative Service—but it does complicate the process of reconfiguring bureaucratic structures.
4.3. An aggregate index of devolution

18
Having provided a more disaggregated account of the scope and extent of devolution attempted (or not) by individual states along the various relevant dimensions of devolution, and at the risk of considerable oversimplification, in this section I make an admittedly crude and speculative attempt to partition the fourteen major states into categories based on the overall extent of devolution. I do this for two reasons. First, such a categorization provides an initial reference point, a sort of benchmark, through which the more detailed case-study investigations of the specifics of each state can be filtered in a way that facilitates cross-state comparisons. Second, without some degree of aggregation, the task of empirically assessing the impacts of devolution, even in a very exploratory fashion, becomes unmanageable. Needless to say the entire exercise is quite ad-hoc and others reviewing the same information may have arrived at a different way of organizing and categorizing it. And so, in the interests of transparency, Table 6 displays all the values that I assigned based on a review of the evidence. Table 6 also reports the comparative rankings that emerge from a couple of other multi-state studies. The first is a study by the Eleventh Finance Commission, which put together a state-level index of decentralization.9 This index was used by the Eleventh Finance Commission in its formula for allocating funds to the states. The second is a study sponsored by the World Bank looking intensively at the experiences in seven major states. The outcome of this crude exercise yields the following categorization of states. Kerala and West Bengal emerge as the only two states to have undertaken significant devolution. Maharashtra, Madhya Pradesh, Karnataka and Rajasthan come next as states with modest records of devolution. I aggregate the remaining states into a single third category of states that displayed minimal progress towards devolution. 4.4. Selected state-level initiatives Before I turn to a consideration of some of the broader patterns that appear to be emerging at the national level, I briefly describe three state-level initiatives that have received attention: Kerala, West Bengal, and Madhya Pradesh. Kerala—People’s Campaign for Decentralised Planning
In 1996, the Left Democratic Front (LDF) coalition returned to power in Kerala and the Communist Party of India–Marxist (CPM)—led government immediately fulfilled one of its most important campaign pledges by launching the “People’s Campaign for Decentralized Planning”. All 1,214 local governments in Kerala—municipalities and the three rural tiers of district, block and village panchayats—were given new functions and powers of decision-making, and were granted discretionary budgeting authority over 40% of the state’s developmental expenditures. The Campaign however went well beyond the devolution of governance functions. As structured by the implementing agency—the Kerala State Planning Board—the campaign was designed to create an active role for local citizens in shaping local development policy-making and budgeting. Thus, not only were local governments charged with designing and implementing their own development plans (which included designing and financing projects across the full range of 9 The index aggregates ten different design elements and implementation steps that states incorporated or undertook: enactment/amendment of state panchayat and municipal legislation; intervention/restriction in the functioning of the local bodies; assignment of functions to the local bodies by state legislation; actual transfer of functions to these bodies by way of rules, notifications and orders; assignment of powers of taxation to the local bodies and the extent of exercise of such powers; constitution of the SFCs and the extent of action taken on their reports; elections to the local bodies; and constitution of District Planning Committees as per the letter and spirit of article 243ZD.
19
development sectors), but were mandated to do so through an elaborate series of participatory exercises. The building block of this process was the holding of 2 annual Grama Sabhas (ward-level assemblies), one at the beginning of the planning cycle and one at the end of the budgeting process.
The first grama sabha serves as an open forum in which residents identify local
development problems, generate priorities and form sub-sector development seminars in which specific proposals first take shape. The Gram Sabhas are open meetings, presided by local elected officials, and facilitated by “key resource persons” trained by the State Planning Board. They are always held on weekdays, and in public buildings (usually schools). Preparations for the assemblies include extensive publicity, and the distribution of various planning documents. Minutes are kept, and each sub-sector group presents a report of its deliberations and produces a list of “felt needs”. These are in turn translated into specific projects by Task Forces and submitted to the elected Panchayat council for final budgetary approval. 10
Beyond its institutional design, there are two critical features of the campaign that need to
be highlighted. The first is that in addition to providing the fiscal resources, the procedural templates, the enabling regulations and laws, key oversight functions and administrative capacity, the Kerala state government—and specifically the SPB—also orchestrated a massive training exercise, described by one observer as “the largest non-formal education program ever undertaken in India.” In the first year, in seven rounds of training at state, district and local level, some 15,000 elected representatives, 25,000 officials and 75,000 volunteers were given training. About 600 state level trainees—called Key Resource Persons (KRP)—received nearly 20 days of training. Some 12,000 district level trainees—District Resource Persons (DRP)—received 10 days of training and at the local level more than a 100,000 persons received at least five days of training. In subsequent years these training programs were extended, and were more specifically targeted at women and Dalits and Adivasis.11 The second point is that at every stage of this process, a range of civil society organizations have played an active role. Most notable has been the role of the Kerala Sastra Sahitya Parishad (KSSP)—the Kerala People’s Science Movement. With its 50,000 strong membership recruited predominantly from the white-collar professions of civil servants and school teachers, the KSSP has an organized presence in almost every village in Kerala, and is by far the most active and influential non-party affiliated, secular organization in the state. In addition to playing an active role in the campaign itself (supplying for example many of the local Key Resource Persons) it is important to emphasize that in designing the campaign the SPB relied heavily on a stock of practical knowledge, ideas and experiences drawn from twenty-five years of local-level experiments in sustainable development conducted by the KSSP. Madhya Pradesh—Rajiv Gandhi Missions and Gram Swaraj West Bengal—land reforms and panchayati raj 4.4. Inter-state patterns in the scale and scope of devolution
Combining the picture of the inter-state variation that Table 6 suggests, with the various case studies that have been done looking at individual states, some preliminary observations may be made: 10 The design and politics of the campaign created a wide range of mechanisms that make elected panchayat councilors de facto—if not de jure—accountable to the Gram Sabha mandates. Needless to say, the degree of accountability varied widely, and calls for further research. However, previous field work, other research and some simple but significant aggregate shifts in expenditure leave little doubt that popular mandates significantly impacted budgetary outcomes. 11 As of the 1991 Census, Dalits and Adivasis represented 11.9% of Kerala’s rural population.

20
• Economic prosperity, far from being a facilitating contextual factor, may actually provide a
disincentive for devolution. Of the high and middle income states, only Maharashtra, West Bengal, Kerala and to a lesser extent, Karnataka appear to have attempted any meaningful measure of devolution. On the other hand, Madhya Pradesh and Rajasthan, usually lumped together with Bihar and Uttar Pradesh in the BIMARU group of underperforming states, have taken measureable steps towards devolution.
• Imperatives of electoral politics appear to figure prominently; in particular the combination of
a change of government within a bi-polar party system is a common feature of all instances but Maharashtra: CPIM in West Bengal in 1978 with Congress in opposition, Janata Party in Karnataka in 1983 with Congress in opposition, CPM in Kerala in 1995 with Congress in opposition, Congress in Madhya Pradesh in 1994 with BJP in opposition, BJP in Rajasthan in 1994 with Congress in opposition. Important to note however that this particular combination is at most a facilitating factor. Andhra Pradesh, Tamil Nadu and Gujarat are all exceptions.
• If we limit our focus to the states where there have been meaningful (if not entirely
successful) attempts at devolution, three separate approaches to devolution are evident:
• Phased or stepping-stone approach in West Bengal • Big bang approach in Kerala • Thematically-oriented demand-driven approach in Madhya Pradesh
• Increasing emphasis on participatory approaches often in the context of increasing involvement of non-governmental actors
6. Tracing the impact of the reforms
A growing literature in economics has used policy variation across political jurisdictions to econometrically estimate the effects of key policy innovations on various outcomes of interest.12 The typical approach involves the use of longitudinal data on outcomes for a panel of jurisdictions (e.g., states in India) coupled with data (often categorical) capturing the timing and magnitude of reforms. The basic intuition behind this approach—often labeled “difference-in-differences”—is that the difference between the changes (i.e., difference) over time in the outcome of interest in a jurisdiction that experienced a policy change and the changes in outcomes in a jurisdiction that did not, ought to, subject to some caveats and complications, provide a rough estimate of the impact of the policy change. In the Indian context, a number of papers have adopted this approach. These include, among others, Banerjee, Gertler and Ghatak (2002), who look at the efficiency effects of tenancy reform in the state of West Bengal, Besley and Burgess (2000), who consider the poverty-reducing and growth impacts of land reform legislation more broadly, and Pande (2002), who examines the effects of mandated political representation in state legislative assemblies for traditionally disadvantaged groups, on patterns of public expenditure.
For a number of reasons, all of which have been previously mentioned in other contexts, a formal implementation of this approach is not feasible in tracing the impact of the constitutional
12 A parallel and much more established (though still very active) literature uses microeconometric techniques to evaluate the effects of particular programs on a range of outcomes at the individual and household level. The literature on policy impacts at the aggregate level, using aggregate jurisdiction-level data, has increasingly drawn upon this literature in framing the analysis in terms of estimating “treatment” effects, and in taking the seriously the possibility that “treatments” may be endogenous.

21
amendments at the state-level. To begin with, given the paucity of information regarding the substantive reform measures adopted by individual states, even a crude assessment of the true extent of the devolution in individual states is difficult. In principle this problem can be gotten around by reframing the problem as one of estimating the reduced form effect of what is acknowledged to possibly be only a nominal reform effort, i.e., an estimate of the impact of the promulgation of a new policy that incorporates and reflects the possibility that the policy may have been imperfectly implemented.13 And in fact, a case can be made that this reduced form effect should be the object of inference since the impact of institutional reforms is inevitably mediated through the political and societal context within which they are attempted (Besley and Case (2002)).
However, even if a reduced form approach is adopted, other hurdles remain. One is the
multidimensional nature of the reforms; in particular, given the heterogeneity across the states in the scope of devolution along different dimensions, a complete overall ordering is simply not possible. Another is the relatively short time since the introduction of the reforms.
The task is complicated further by the fact that the panchayati raj initiative roughly
coincided with a major program of economic liberalization at the national level. The liberalization program initiated in 1991, by reducing the span of central government control, opened up the space for a variety of state-level initiatives to promote industrial development and economic growth, for instance, by offering tax incentives to attract private investment (Ahluwalia (2000)). This makes it yet more difficult to disentangle the impact of local government reforms from that of these other initiatives.
In light of these difficulties, what appears below can only be described as a highly
exploratory analysis, loosely motivated by the differences-in-differences intuition underlying more formal investigations. Basically, I focus on cross-state variation in the changes in a number of state-level indicators of development outcomes over a period spanning the passage of the constitutional amendment and the subsequent state-level reforms. I restrict the analysis to a subset of outcomes that are plausibly less directly influenced by changes in the trade and industrial policy regimes. The state-level outcomes I consider, along with the relevant dates at which they are observed, are:
• per-capita state domestic product from agriculture (1991-93 average, 1995-97 average) • mean rural per-capita expenditure (1993, 1999) • the rural headcount index of poverty (1993, 1999) • the fraction of households with electricity connections (1991, 2001) • the fraction of households living in permanent structures (1991, 2001) • the rural female literacy rate (1991, 2001) • the school attendance rate of school-age children (1992-93, 1998-99) • the fraction of pregnant women who receive ante-natal care (1992-93, 1998-99) • the under-five mortality rate (1992-93, 1998-99) • the percentage of children between 1 and 2-years old who are fully vaccinated ((i.e., who
have received vaccines for BCG, measles, and three doses of DPT and polio) (1992-93, 1998-99)
13 The analog in the program evaluation literature is the distinction between the “intention-to-treat” effect and the effect of “treatment-on-the-treated”. The former incorporates the possibility of selective compliance with the treatment and therefore provides, in some senses, a more robust estimate.
22
The first three measures, and in particular, the rural poverty rate, though certainly affected by the quality of governance in rural areas, are also obviously influenced by the overall economic conditions in the state and in the country. The remaining indicators, on the other hand, are likely to more directly reflect the quality of public service delivery.
Tables 7(a) and 7(b) display the basic data on the performance of the Indian states during the 1990s. For each of the variables, the first column displays the level of the variable in the early 1990s, prior to the passage of the constitutional amendment. This column basically reproduces the information from Table 2(b), which documented the diversity in the state of human development across India’s major states. The second column displays the level in the late 1990s (or in some cases, 2001), five years or more after the state conformity acts were enacted. The third column displays an index of the progress made by each state between the two dates.
For the two straight economic variables, per-capita state domestic product from
agriculture and rural per-capita expenditures, the index of progress is simply the percentage change between the two dates.
All the remaining variables admit of a natural target level, i.e., a maximum or minimum
attainable level, and for these variables the index of progress (between two dates) is defined as the proportionate reduction in the distance to the target. So, for instance, a reduction in the headcount index of poverty (for which the natural target level is 0) of five percentage points from 25% to 15% would translate into an index of progress of 40% (=100X(10/25)). Similarly, an increase in the school attendance rate from 50% to 60% translates into an index of progress of 20%. For aggregate welfare indicators that have a natural upper bound (or lower bound), defining the index of progress in this way avoids some of the conceptual difficulties that arise in simply measuring progress in terms of changes. For instance, in assessing progress in poverty reduction, if we adopt as our index, the percentage point difference in poverty rates at two dates, we would end up attributing greater progress in poverty reduction to a state where the poverty rate decreased by 10% points from 30% to 20% than we would a state where poverty was eradicated starting from an initial rate of 5%, and further reductions were simply not possible.
Tables 7(a) and 7(b) indicate that there was great variation in the progress made during
the 1990s, both across states for a given indicator, and across indicators, for a given state. The question then is can some of the variation across states be traced back to differences in the scope and extent of devolution? A very crude way of getting at this question is to overlay the pattern of deviations at the state level from the mean index of progress across the fourteen states with the crude categorization of states in terms of devolution in Table 6. The mean across the fourteen states controls for any common factors, e.g., increases or decreases in allocations for centrally sponsored schemes, that might influence the index of progress for a particular indicator. The deviation from this mean then captures the influence of any factors specific to the state, among them, the degree of devolution. Of course this is a very crude proxy for the actual extent of devolution. In particular, it is likely to be confounded by other state specific factors that are unrelated to the process of devolution, for instance, a variety of economic shocks, and so I also construct a set of adjusted deviations that account for growth in per-capita expenditures in the state. It should be noted that by examining deviations in the index of progress for an indicator, which is constructed from changes in the indicator across two points in time, I am implicitly controlling for any time-invariant state specific effects.
Figure 1 provides a sense of how the deviations are constructed. The indicator shown is
the school attendance rate, and the index of progress is calculated between the years 1992 and 1998. The unadjusted deviations are simply the vertical distances from each individual data point (representing a state) to the horizontal line set at the mean index of progress across the states. The adjusted deviations are the vertical distances between the data points and the regression line
23
predicting progress on school attendance rates in terms of per-capita expenditure growth. So, for instance, in the case of Haryana (HA), the unadjusted deviation is positive, but once we take account of the high rate of per-capita expenditure growth, the adjusted deviation turns out to be negative.
Figures 2(a) through 2(j) chart the deviations, state by state, for each of the ten
indicators. In each of the figures, the states are ordered by the crude index of overall devolution constructed in Table 6, with Bihar, which has the lowest value of this index, on the extreme left, and Kerala, with the highest value, on the extreme right. For obvious reasons, Figures 2(a) and 2(b), which depict the relative performance of individual states in terms of growth of per-capita SDP from agriculture and rural per-capita consumption expenditures respectively, show only the unadjusted deviations. The remaining figures show both the unadjusted (unshaded) and adjusted (shaded) deviations. Perhaps not surprisingly these figures do not indicate any clear and consistent patterns across the range of indicators.
7. Viewing the reforms through an analytic lens • The relative merits of the two approaches to reform—“big bang” vs. “stepping-stone”, “shock
therapy” vs. “gradualism”—can and have been debated, if not in the Indian context, certainly in the case of the reform programs in Eastern Europe and the former Soviet Union. The usual line is that, whatever the domain of the reforms, the choice between the two depends on the institutional and political context in which the reforms are being contemplated. At some level this claim obviously is right. But the Kerala approach suggests the intriguing possibility that what may be a more critical element in the long-term success of a reform process than the choice that is made at the outset, is the conscious recognition of the power of agency and the adoption of a learning-by-doing mentality. As Thomas Isaac, the principal architect of the Peoples’ Campaign describes it: “…in short, the pre-conditions for successful decentralization are to be created in the very process of decentralization.”(Isaac (2000)). Essentially this approach treats as central, the dynamic and contingent nature of directed institutional change. Similar themes are stressed in the literature on participatory democracy—participation inculcates the capacity for participation—and in a more recent literature on the constructability of collective capacities for change (Evans (..)).
• This point about the need to incorporate or at least recognize the dynamic and contingent
elements of the processes of institutional change carries over to the economic literature on decentralization. There are three separate strands of the literature, distinguished by the implicit or explicit view that is taken of the nature of state-society interactions. The literature on fiscal federalism, dating back to Tiebout and Oates, implicitly views government (and governmental actors, whether bureaucrats or politicians) as benevolent, if not omniscient, decision-makers, motivated only by the disinterested pursuit of economic efficiency, and limited only by informational constraints vis-à-vis the population at large. As Bardhan (2002) points out the realities of governance in most developing economies make this framework largely irrelevant in that context. A subsequent literature, Seabright () recognizes potential agency problems between the electorate and bureaucrats/politicians, for instance by viewing government as a set of elected representatives motivated by electoral imperatives. But this literature too is of limited relevance in the Indian context because it implicitly assumes reasonably well-functioning representative democracies in that the channels of political influence are limited to the act of voting and hence influence is equitably distributed. A third strand, Bardhan and Mookherjee (.) explicitly incorporates the possibility of uneven influence and capture by elites at both the local and higher level, and hence provides a much more useful framework for thinking about decentralization in developing countries. But even this strand of the literature ignores the possibility of dynamic agency.

24
• However, even if, as I suggest above, pre-existing conditions at the local level are less immutable than much of the current thinking presumes—which is to say that the possibility of local capture may itself be diminished and the prospects for participation enhanced through the process of decentralization—there are clearly contextual prerequisites at higher levels, of which the most important is the political will and capacity at the level of government contemplating decentralization. Put another way, while local context may be less important to the “normative” questions of how and whether to decentralize, the primacy of politics and the broader context manifests itself in the “positive” questions of “where” and “when” and “if” meaningful decentralization is attempted in the first place.
8. Looking ahead: is the glass a quarter full or three-quarters empty? With the slow progress that is evident in most Indian states on genuine functional devolution, and the many instances where pre-existing inequities and patterns of social exclusion and domination have thwarted even genuine attempts at devolution, some observers have worried that this latest initiative to revitalize local government will also fail. Clearly institutional reforms initiated through state-level legislation are not irreversible. The decline of panchayats in the 1970s and 1980s in most states, or the failure to sustain the Karnataka reforms, all attest to that.
The question then is whether the one element that thus far has distinguished this latest attempt to foster panchayati raj, the fact that it has constitutional backing, will make a difference in the long run. There is undoubtedly considerable uncertainly about how exactly events will unfold this time around. But constitutional reforms lie at the top of the reform hierarchy in terms of their purported impact and degree of irreversibility. And while it is true that, in practice, the Indian experience has revealed that the implementation of constitutional mandates remains vulnerable to various forms of “filibustering” because constitutional contracts are inevitably “incomplete,” it is also the case that they can be made more “complete” by more clearly outlining the consequences of non-compliance. And that increasingly is happening in the Indian context.
The courts have begun to play a more assertive role as witnessed by the intervention of the Supreme Court and the Andhra Pradesh High Court, respectively, in ensuring that panchayat elections went ahead as scheduled in Orissa and Andhra Pradesh. The Indian government too has begun considering introducing progress in devolution as a key element in the forumulae determining intergovernmental transfers.
Ultimately though, the main reasons for optimism are the scattered but numerous accounts of
developments at the community level, where the space created for participation is being occupied and contested by those previously excluded. If participatory democratization involves learning-by-doing, there is increasing evidence that the learning is taking place in disparate communities all over India. The learning may be slow and sporadic and much of rural India is still on the flat portion of the learning curve, but it does appear to be taking place. And just as the extension of the franchise and mandatory representation manifested itself, albeit with considerable lags, in the growing political participation of subordinate groups (other backward classes), there is the distinct possibility that just the sheer numbers of individuals, the 2 million plus locally elected representatives who now have a stake in the system will make a difference. In effect a new interest group has been created that potentially cuts across preexisting lines of division providing a new axis along which interests may align. The gathering of panchayat representatives in New Delhi in April 2002 is one early sign of the potential emergence of a new coalition.

25
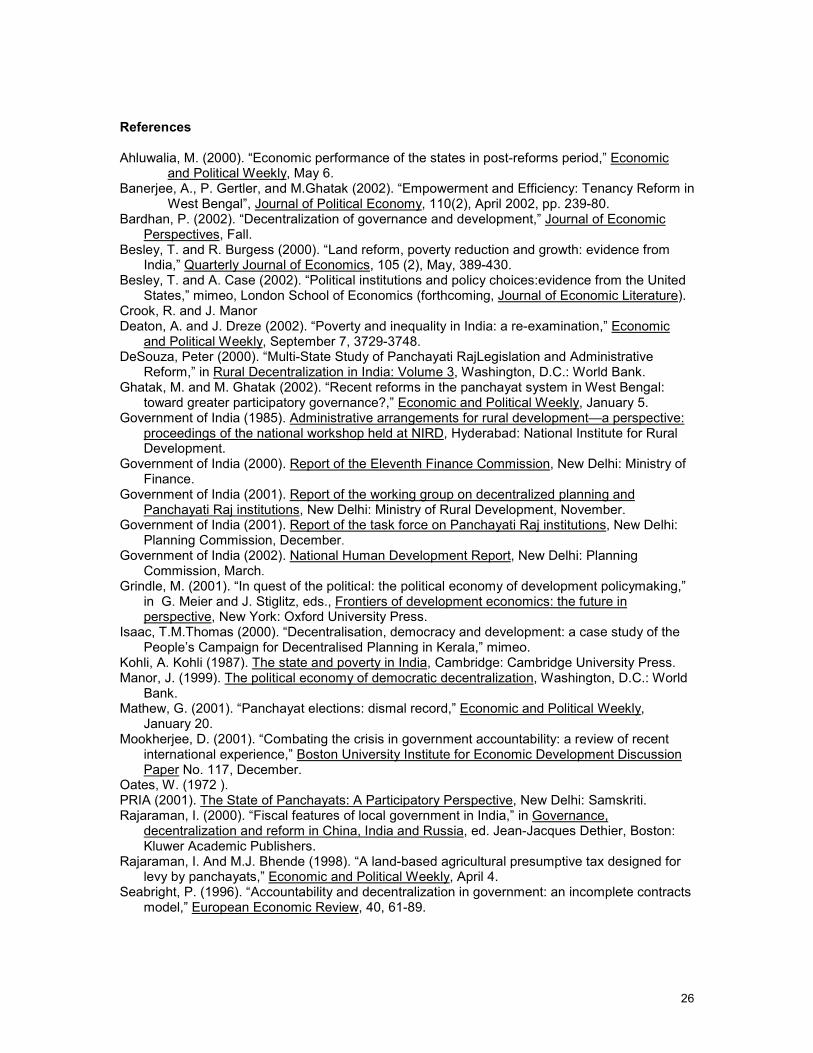
26
References Ahluwalia, M. (2000). “Economic performance of the states in post-reforms period,” Economic
and Political Weekly, May 6. Banerjee, A., P. Gertler, and M.Ghatak (2002). “Empowerment and Efficiency: Tenancy Reform in
West Bengal”, Journal of Political Economy, 110(2), April 2002, pp. 239-80. Bardhan, P. (2002). “Decentralization of governance and development,” Journal of Economic
Perspectives, Fall. Besley, T. and R. Burgess (2000). “Land reform, poverty reduction and growth: evidence from
India,” Quarterly Journal of Economics, 105 (2), May, 389-430. Besley, T. and A. Case (2002). “Political institutions and policy choices:evidence from the United
States,” mimeo, London School of Economics (forthcoming, Journal of Economic Literature). Crook, R. and J. Manor Deaton, A. and J. Dreze (2002). “Poverty and inequality in India: a re-examination,” Economic
and Political Weekly, September 7, 3729-3748. DeSouza, Peter (2000). “Multi-State Study of Panchayati RajLegislation and Administrative
Reform,” in Rural Decentralization in India: Volume 3, Washington, D.C.: World Bank. Ghatak, M. and M. Ghatak (2002). “Recent reforms in the panchayat system in West Bengal:
toward greater participatory governance?,” Economic and Political Weekly, January 5. Government of India (1985). Administrative arrangements for rural development—a perspective:
proceedings of the national workshop held at NIRD, Hyderabad: National Institute for Rural Development.
Government of India (2000). Report of the Eleventh Finance Commission, New Delhi: Ministry of Finance.
Government of India (2001). Report of the working group on decentralized planning and Panchayati Raj institutions, New Delhi: Ministry of Rural Development, November.
Government of India (2001). Report of the task force on Panchayati Raj institutions, New Delhi: Planning Commission, December.
Government of India (2002). National Human Development Report, New Delhi: Planning Commission, March.
Grindle, M. (2001). “In quest of the political: the political economy of development policymaking,” in G. Meier and J. Stiglitz, eds., Frontiers of development economics: the future in perspective, New York: Oxford University Press.
Isaac, T.M.Thomas (2000). “Decentralisation, democracy and development: a case study of the People’s Campaign for Decentralised Planning in Kerala,” mimeo.
Kohli, A. Kohli (1987). The state and poverty in India, Cambridge: Cambridge University Press. Manor, J. (1999). The political economy of democratic decentralization, Washington, D.C.: World
Bank. Mathew, G. (2001). “Panchayat elections: dismal record,” Economic and Political Weekly,
January 20. Mookherjee, D. (2001). “Combating the crisis in government accountability: a review of recent
international experience,” Boston University Institute for Economic Development Discussion Paper No. 117, December.
Oates, W. (1972 ). PRIA (2001). The State of Panchayats: A Participatory Perspective, New Delhi: Samskriti. Rajaraman, I. (2000). “Fiscal features of local government in India,” in Governance,
decentralization and reform in China, India and Russia, ed. Jean-Jacques Dethier, Boston: Kluwer Academic Publishers.
Rajaraman, I. And M.J. Bhende (1998). “A land-based agricultural presumptive tax designed for levy by panchayats,” Economic and Political Weekly, April 4.
Seabright, P. (1996). “Accountability and decentralization in government: an incomplete contracts model,” European Economic Review, 40, 61-89.

27
Tiebout, C. (1956). “A pure theory of local expenditures,” Journal of Political Economy, 64, 416-424.
Vijayanand, S.M. (2001). “Issues related to administrative decentralization and administering decentralization: lessons from the Kerala experience,” Workshop on Decentralisation, Institute for Social and Economic Change, Bangalore, May 31-June 1, 2001.

28
Table 1
Eleventh Schedule of the Constitution of India No. Description Category
1 Agriculture including agricultural extension Agriculture and allied 2 Land improvement, land reforms, land consolidation, soil conservation Agriculture and allied 3 Minor irrigation, water management, watershed development Agriculture and allied 4 Animal husbandry, dairy, poultry Agriculture and allied 5 Fisheries Agriculture and allied 6 Social forestry, farm foresty Agriculture and allied 7 Minor forest produce Agriculture and allied 8 Small scale industries Industries 9 Khadi, village, cottage industries Industries
10 Rural housing Welfare 11 Drinking water Core 12 Fuel and fodder Agriculture and allied 13 Roads, culverts, bridges, ferries, waterways Core 14 Rural electrification, electricity distribution Core 15 Non-conventional energy sources Welfare 16 Poverty alleviation programs Welfare 17 Education, including primary and secondary schools Welfare 18 Technical training and vocational education Welfare 19 Adult and non-formal education Welfare 20 Libraries Welfare 21 Cultural activities Welfare 22 Markets and fairs Agriculture and allied 23 Health and sanitation, hospitals, primary health centers, dispensaries Core 24 Family welfare Welfare 25 Women and child development Welfare 26 Social welfare, welfare of handicapped and mentally retarded Welfare 27 Welfare of weaker sections, Scheduled Castes and Tribes Welfare 28 Public distribution system Welfare 29 Maintenance of community assets Core
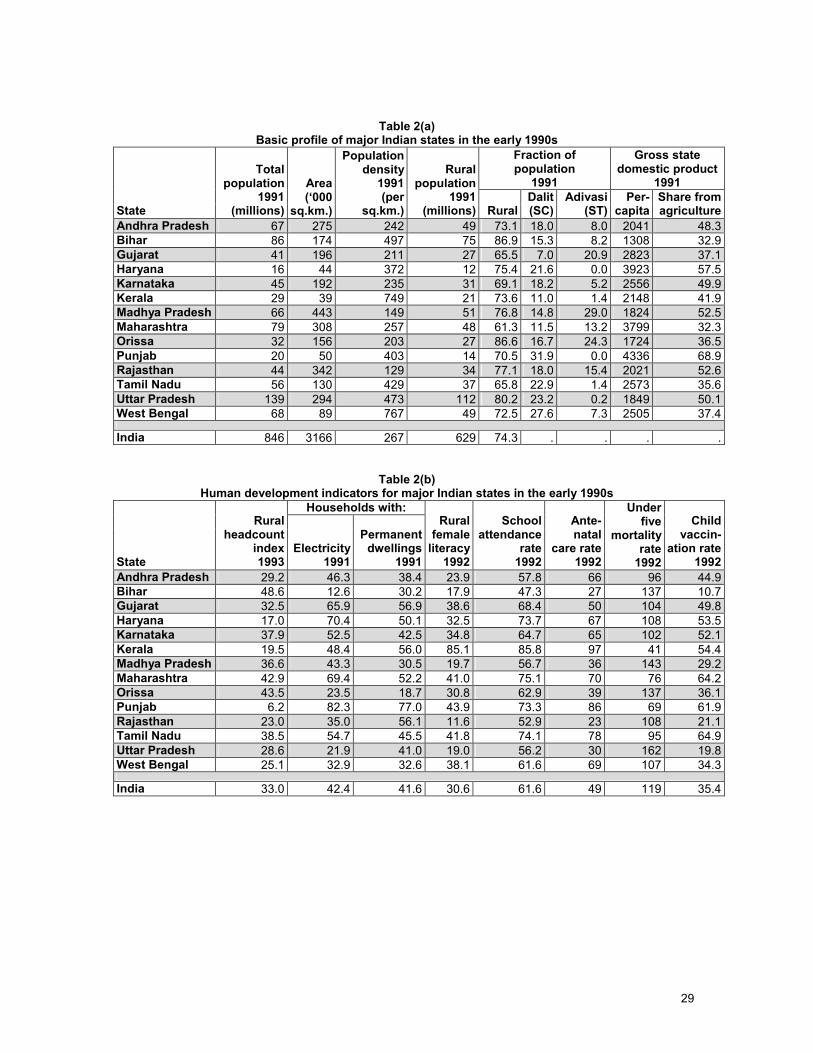
29
Table 2(a) Basic profile of major Indian states in the early 1990s
Fraction of population
1991
Gross state domestic product
1991
State
Total population
1991 (millions)
Area(‘000
sq.km.)
Population density
1991(per
sq.km.)
Rural population
1991(millions) Rural
Dalit(SC)
Adivasi (ST)
Per-capita
Share from agriculture
Andhra Pradesh 67 275 242 49 73.1 18.0 8.0 2041 48.3Bihar 86 174 497 75 86.9 15.3 8.2 1308 32.9Gujarat 41 196 211 27 65.5 7.0 20.9 2823 37.1Haryana 16 44 372 12 75.4 21.6 0.0 3923 57.5Karnataka 45 192 235 31 69.1 18.2 5.2 2556 49.9Kerala 29 39 749 21 73.6 11.0 1.4 2148 41.9Madhya Pradesh 66 443 149 51 76.8 14.8 29.0 1824 52.5Maharashtra 79 308 257 48 61.3 11.5 13.2 3799 32.3Orissa 32 156 203 27 86.6 16.7 24.3 1724 36.5Punjab 20 50 403 14 70.5 31.9 0.0 4336 68.9Rajasthan 44 342 129 34 77.1 18.0 15.4 2021 52.6Tamil Nadu 56 130 429 37 65.8 22.9 1.4 2573 35.6Uttar Pradesh 139 294 473 112 80.2 23.2 0.2 1849 50.1West Bengal 68 89 767 49 72.5 27.6 7.3 2505 37.4
India 846 3166 267 629 74.3 . . . .
Table 2(b) Human development indicators for major Indian states in the early 1990s
Households with:
State
Rural headcount
index 1993
Electricity1991
Permanent dwellings
1991
Rural female
literacy1992
School attendance
rate1992
Ante-natal
care rate 1992
Under five
mortality rate
1992
Child vaccin-
ation rate1992
Andhra Pradesh 29.2 46.3 38.4 23.9 57.8 66 96 44.9Bihar 48.6 12.6 30.2 17.9 47.3 27 137 10.7Gujarat 32.5 65.9 56.9 38.6 68.4 50 104 49.8Haryana 17.0 70.4 50.1 32.5 73.7 67 108 53.5Karnataka 37.9 52.5 42.5 34.8 64.7 65 102 52.1Kerala 19.5 48.4 56.0 85.1 85.8 97 41 54.4Madhya Pradesh 36.6 43.3 30.5 19.7 56.7 36 143 29.2Maharashtra 42.9 69.4 52.2 41.0 75.1 70 76 64.2Orissa 43.5 23.5 18.7 30.8 62.9 39 137 36.1Punjab 6.2 82.3 77.0 43.9 73.3 86 69 61.9Rajasthan 23.0 35.0 56.1 11.6 52.9 23 108 21.1Tamil Nadu 38.5 54.7 45.5 41.8 74.1 78 95 64.9Uttar Pradesh 28.6 21.9 41.0 19.0 56.2 30 162 19.8West Bengal 25.1 32.9 32.6 38.1 61.6 69 107 34.3
India 33.0 42.4 41.6 30.6 61.6 49 119 35.4
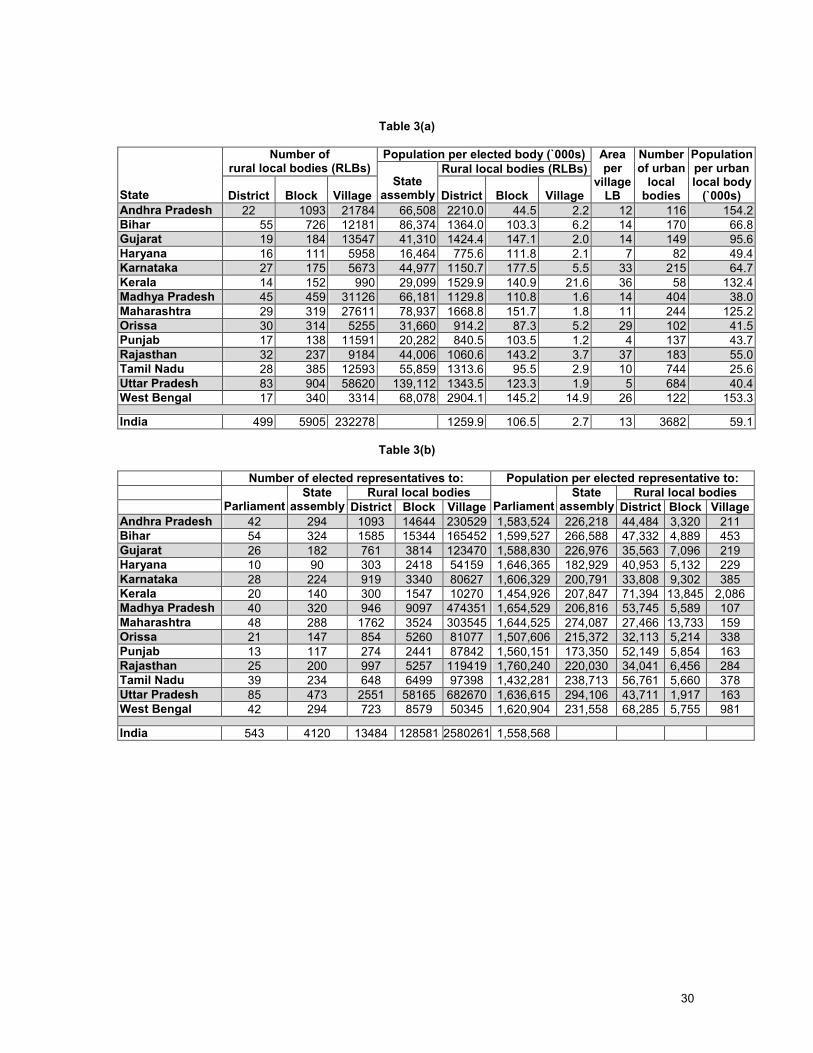
30
Table 3(a)
Population per elected body (`000s) Number of rural local bodies (RLBs) Rural local bodies (RLBs)
State District Block VillageState
assembly District Block Village
Area per
village LB
Number of urban
local bodies
Population per urban local body
(`000s) Andhra Pradesh 22 1093 21784 66,508 2210.0 44.5 2.2 12 116 154.2Bihar 55 726 12181 86,374 1364.0 103.3 6.2 14 170 66.8Gujarat 19 184 13547 41,310 1424.4 147.1 2.0 14 149 95.6Haryana 16 111 5958 16,464 775.6 111.8 2.1 7 82 49.4Karnataka 27 175 5673 44,977 1150.7 177.5 5.5 33 215 64.7Kerala 14 152 990 29,099 1529.9 140.9 21.6 36 58 132.4Madhya Pradesh 45 459 31126 66,181 1129.8 110.8 1.6 14 404 38.0Maharashtra 29 319 27611 78,937 1668.8 151.7 1.8 11 244 125.2Orissa 30 314 5255 31,660 914.2 87.3 5.2 29 102 41.5Punjab 17 138 11591 20,282 840.5 103.5 1.2 4 137 43.7Rajasthan 32 237 9184 44,006 1060.6 143.2 3.7 37 183 55.0Tamil Nadu 28 385 12593 55,859 1313.6 95.5 2.9 10 744 25.6Uttar Pradesh 83 904 58620 139,112 1343.5 123.3 1.9 5 684 40.4West Bengal 17 340 3314 68,078 2904.1 145.2 14.9 26 122 153.3
India 499 5905 232278 1259.9 106.5 2.7 13 3682 59.1
Table 3(b) Number of elected representatives to: Population per elected representative to: Rural local bodies Rural local bodies Parliament
State assembly District Block Village Parliament
State assembly District Block Village
Andhra Pradesh 42 294 1093 14644 230529 1,583,524 226,218 44,484 3,320 211 Bihar 54 324 1585 15344 165452 1,599,527 266,588 47,332 4,889 453 Gujarat 26 182 761 3814 123470 1,588,830 226,976 35,563 7,096 219 Haryana 10 90 303 2418 54159 1,646,365 182,929 40,953 5,132 229 Karnataka 28 224 919 3340 80627 1,606,329 200,791 33,808 9,302 385 Kerala 20 140 300 1547 10270 1,454,926 207,847 71,394 13,845 2,086 Madhya Pradesh 40 320 946 9097 474351 1,654,529 206,816 53,745 5,589 107 Maharashtra 48 288 1762 3524 303545 1,644,525 274,087 27,466 13,733 159 Orissa 21 147 854 5260 81077 1,507,606 215,372 32,113 5,214 338 Punjab 13 117 274 2441 87842 1,560,151 173,350 52,149 5,854 163 Rajasthan 25 200 997 5257 119419 1,760,240 220,030 34,041 6,456 284 Tamil Nadu 39 234 648 6499 97398 1,432,281 238,713 56,761 5,660 378 Uttar Pradesh 85 473 2551 58165 682670 1,636,615 294,106 43,711 1,917 163 West Bengal 42 294 723 8579 50345 1,620,904 231,558 68,285 5,755 981
India 543 4120 13484 128581 2580261 1,558,568
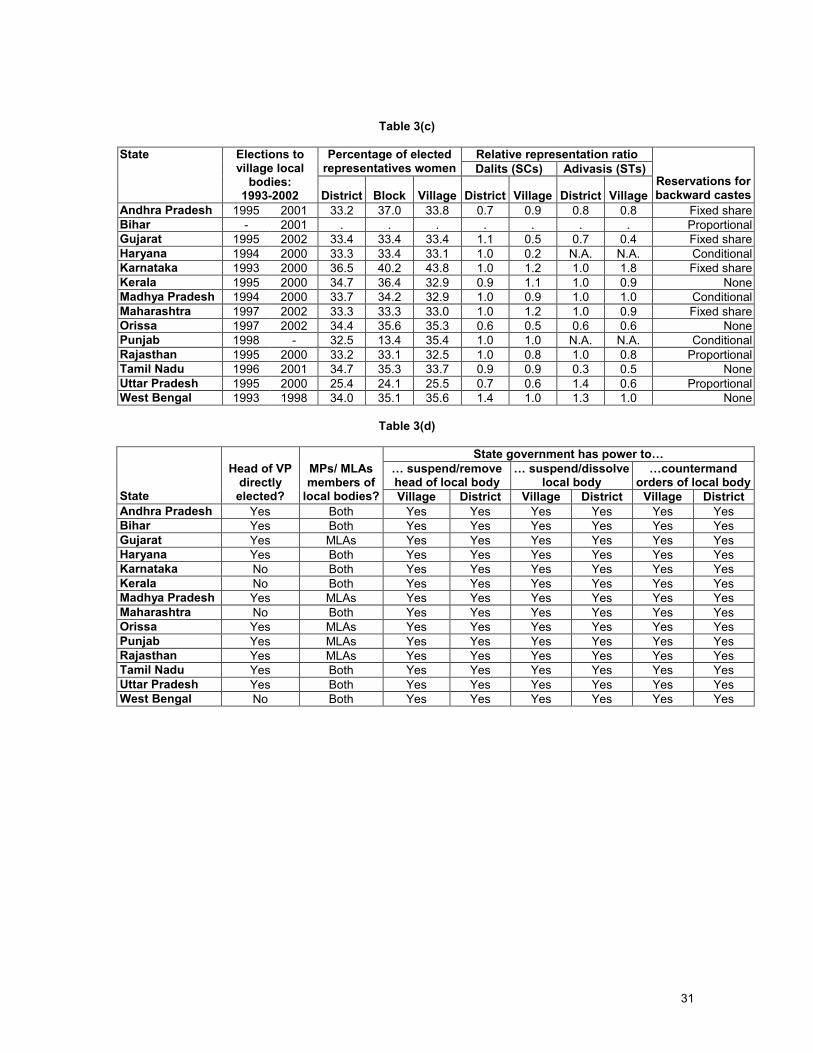
31
Table 3(c)
Relative representation ratio Percentage of elected representatives women Dalits (SCs) Adivasis (STs)
State Elections to village local
bodies: 1993-2002 District Block Village District Village District Village
Reservations for backward castes
Andhra Pradesh 1995 2001 33.2 37.0 33.8 0.7 0.9 0.8 0.8 Fixed share Bihar - 2001 . . . . . . . ProportionalGujarat 1995 2002 33.4 33.4 33.4 1.1 0.5 0.7 0.4 Fixed shareHaryana 1994 2000 33.3 33.4 33.1 1.0 0.2 N.A. N.A. ConditionalKarnataka 1993 2000 36.5 40.2 43.8 1.0 1.2 1.0 1.8 Fixed shareKerala 1995 2000 34.7 36.4 32.9 0.9 1.1 1.0 0.9 NoneMadhya Pradesh 1994 2000 33.7 34.2 32.9 1.0 0.9 1.0 1.0 ConditionalMaharashtra 1997 2002 33.3 33.3 33.0 1.0 1.2 1.0 0.9 Fixed shareOrissa 1997 2002 34.4 35.6 35.3 0.6 0.5 0.6 0.6 NonePunjab 1998 - 32.5 13.4 35.4 1.0 1.0 N.A. N.A. ConditionalRajasthan 1995 2000 33.2 33.1 32.5 1.0 0.8 1.0 0.8 ProportionalTamil Nadu 1996 2001 34.7 35.3 33.7 0.9 0.9 0.3 0.5 NoneUttar Pradesh 1995 2000 25.4 24.1 25.5 0.7 0.6 1.4 0.6 ProportionalWest Bengal 1993 1998 34.0 35.1 35.6 1.4 1.0 1.3 1.0 None
Table 3(d)
State government has power to… … suspend/remove head of local body
… suspend/dissolve local body
…countermand orders of local body
State
Head of VP directly elected?
MPs/ MLAs members of
local bodies? Village District Village District Village District Andhra Pradesh Yes Both Yes Yes Yes Yes Yes Yes Bihar Yes Both Yes Yes Yes Yes Yes Yes Gujarat Yes MLAs Yes Yes Yes Yes Yes Yes Haryana Yes Both Yes Yes Yes Yes Yes Yes Karnataka No Both Yes Yes Yes Yes Yes Yes Kerala No Both Yes Yes Yes Yes Yes Yes Madhya Pradesh Yes MLAs Yes Yes Yes Yes Yes Yes Maharashtra No Both Yes Yes Yes Yes Yes Yes Orissa Yes MLAs Yes Yes Yes Yes Yes Yes Punjab Yes MLAs Yes Yes Yes Yes Yes Yes Rajasthan Yes MLAs Yes Yes Yes Yes Yes Yes Tamil Nadu Yes Both Yes Yes Yes Yes Yes Yes Uttar Pradesh Yes Both Yes Yes Yes Yes Yes Yes West Bengal No Both Yes Yes Yes Yes Yes Yes
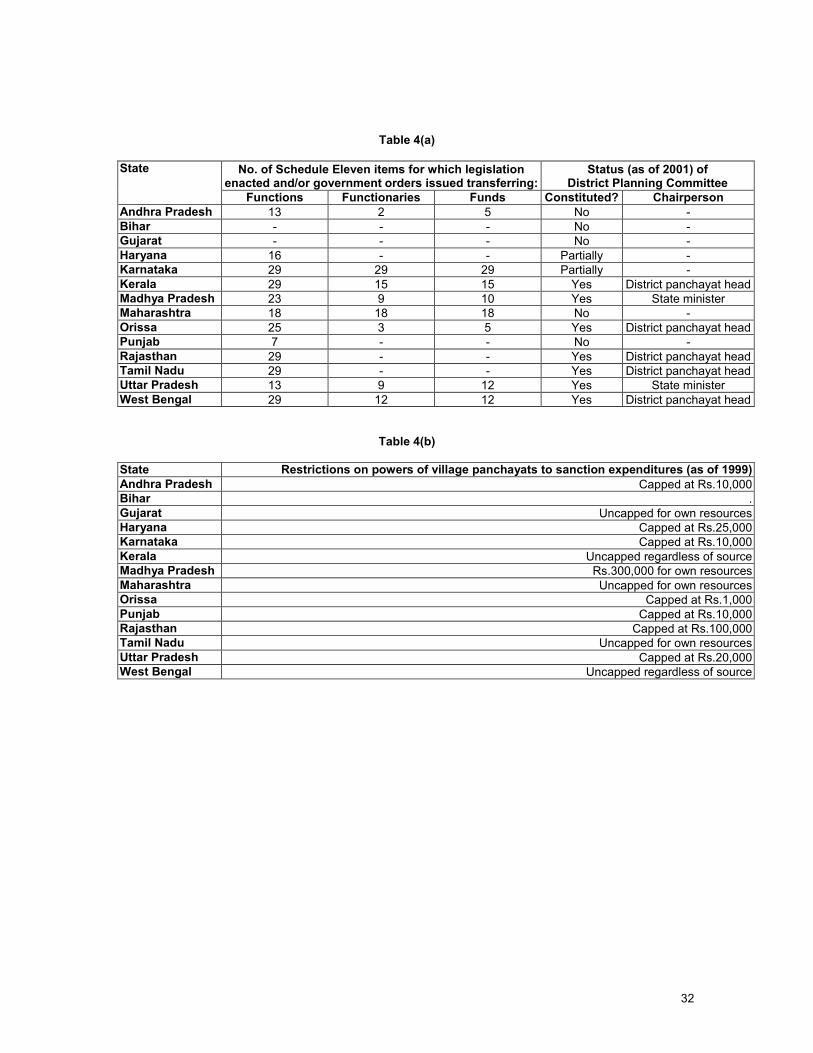
32
Table 4(a)
No. of Schedule Eleven items for which legislation
enacted and/or government orders issued transferring:Status (as of 2001) of
District Planning Committee State
Functions Functionaries Funds Constituted? Chairperson Andhra Pradesh 13 2 5 No - Bihar - - - No - Gujarat - - - No - Haryana 16 - - Partially - Karnataka 29 29 29 Partially - Kerala 29 15 15 Yes District panchayat headMadhya Pradesh 23 9 10 Yes State minister Maharashtra 18 18 18 No - Orissa 25 3 5 Yes District panchayat headPunjab 7 - - No - Rajasthan 29 - - Yes District panchayat headTamil Nadu 29 - - Yes District panchayat headUttar Pradesh 13 9 12 Yes State minister West Bengal 29 12 12 Yes District panchayat head
Table 4(b) State Restrictions on powers of village panchayats to sanction expenditures (as of 1999)Andhra Pradesh Capped at Rs.10,000Bihar .Gujarat Uncapped for own resourcesHaryana Capped at Rs.25,000Karnataka Capped at Rs.10,000Kerala Uncapped regardless of sourceMadhya Pradesh Rs.300,000 for own resourcesMaharashtra Uncapped for own resourcesOrissa Capped at Rs.1,000Punjab Capped at Rs.10,000Rajasthan Capped at Rs.100,000Tamil Nadu Uncapped for own resourcesUttar Pradesh Capped at Rs.20,000West Bengal Uncapped regardless of source
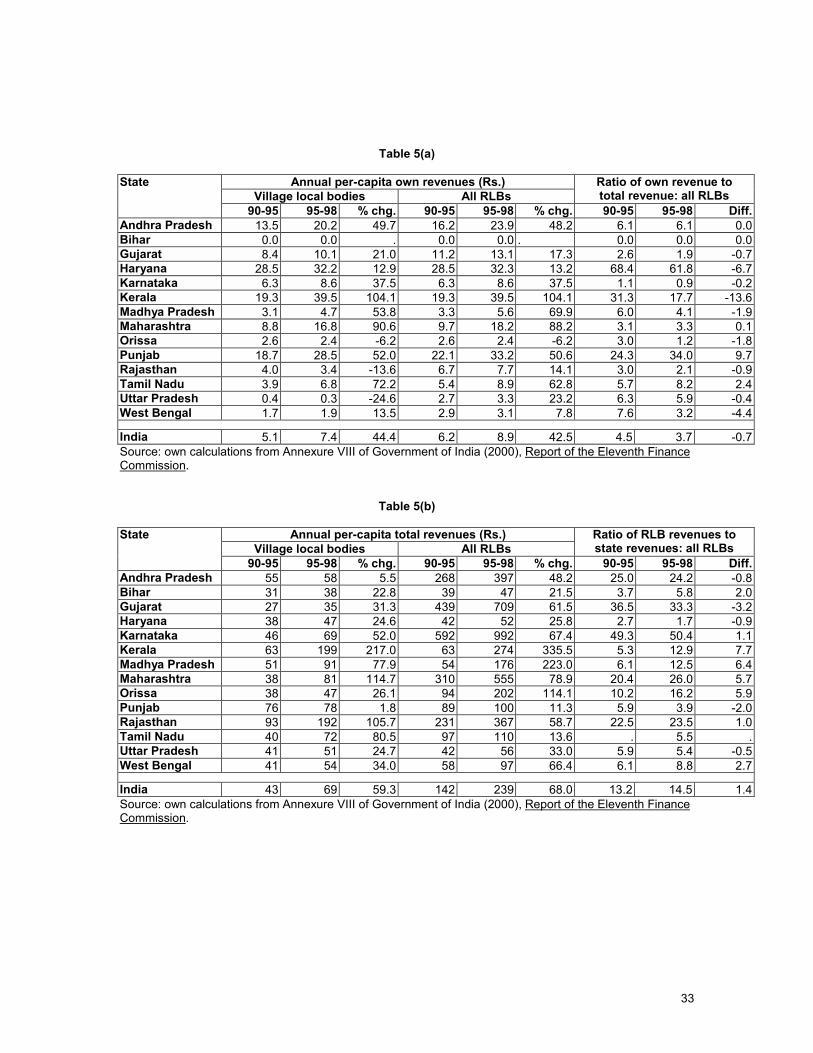
33
Table 5(a)
Annual per-capita own revenues (Rs.) Village local bodies All RLBs
Ratio of own revenue to total revenue: all RLBs
State
90-95 95-98 % chg. 90-95 95-98 % chg. 90-95 95-98 Diff.Andhra Pradesh 13.5 20.2 49.7 16.2 23.9 48.2 6.1 6.1 0.0Bihar 0.0 0.0 . 0.0 0.0 . 0.0 0.0 0.0Gujarat 8.4 10.1 21.0 11.2 13.1 17.3 2.6 1.9 -0.7Haryana 28.5 32.2 12.9 28.5 32.3 13.2 68.4 61.8 -6.7Karnataka 6.3 8.6 37.5 6.3 8.6 37.5 1.1 0.9 -0.2Kerala 19.3 39.5 104.1 19.3 39.5 104.1 31.3 17.7 -13.6Madhya Pradesh 3.1 4.7 53.8 3.3 5.6 69.9 6.0 4.1 -1.9Maharashtra 8.8 16.8 90.6 9.7 18.2 88.2 3.1 3.3 0.1Orissa 2.6 2.4 -6.2 2.6 2.4 -6.2 3.0 1.2 -1.8Punjab 18.7 28.5 52.0 22.1 33.2 50.6 24.3 34.0 9.7Rajasthan 4.0 3.4 -13.6 6.7 7.7 14.1 3.0 2.1 -0.9Tamil Nadu 3.9 6.8 72.2 5.4 8.9 62.8 5.7 8.2 2.4Uttar Pradesh 0.4 0.3 -24.6 2.7 3.3 23.2 6.3 5.9 -0.4West Bengal 1.7 1.9 13.5 2.9 3.1 7.8 7.6 3.2 -4.4
India 5.1 7.4 44.4 6.2 8.9 42.5 4.5 3.7 -0.7Source: own calculations from Annexure VIII of Government of India (2000), Report of the Eleventh Finance Commission.
Table 5(b)
Annual per-capita total revenues (Rs.) Village local bodies All RLBs
Ratio of RLB revenues to state revenues: all RLBs
State
90-95 95-98 % chg. 90-95 95-98 % chg. 90-95 95-98 Diff.Andhra Pradesh 55 58 5.5 268 397 48.2 25.0 24.2 -0.8Bihar 31 38 22.8 39 47 21.5 3.7 5.8 2.0Gujarat 27 35 31.3 439 709 61.5 36.5 33.3 -3.2Haryana 38 47 24.6 42 52 25.8 2.7 1.7 -0.9Karnataka 46 69 52.0 592 992 67.4 49.3 50.4 1.1Kerala 63 199 217.0 63 274 335.5 5.3 12.9 7.7Madhya Pradesh 51 91 77.9 54 176 223.0 6.1 12.5 6.4Maharashtra 38 81 114.7 310 555 78.9 20.4 26.0 5.7Orissa 38 47 26.1 94 202 114.1 10.2 16.2 5.9Punjab 76 78 1.8 89 100 11.3 5.9 3.9 -2.0Rajasthan 93 192 105.7 231 367 58.7 22.5 23.5 1.0Tamil Nadu 40 72 80.5 97 110 13.6 . 5.5 .Uttar Pradesh 41 51 24.7 42 56 33.0 5.9 5.4 -0.5West Bengal 41 54 34.0 58 97 66.4 6.1 8.8 2.7
India 43 69 59.3 142 239 68.0 13.2 14.5 1.4Source: own calculations from Annexure VIII of Government of India (2000), Report of the Eleventh Finance Commission.

34
Table 5(c) Annual per-capita expenditures on core services (Rs.) Village local bodies All RLBs
Ratio of core services to total expenditures: all RLBs
90-95 95-98 % chg. 90-95 95-98 % chg. 90-95 95-98 Diff.Andhra Pradesh 9.0 16.3 81.4 26.4 55.9 111.5 9.8 13.8 4.0Bihar . . . 0.0 0.0 . . . . Gujarat 4.0 5.0 25.2 4.0 5.0 25.2 0.8 0.7 -0.1Haryana . . . 0.0 0.0 . . . . Karnataka 8.4 15.9 89.1 53.8 96.2 78.9 9.9 10.0 0.1Kerala 18.0 24.2 34.5 18.0 27.8 54.6 28.4 12.0 -16.5Madhya Pradesh 1.9 4.1 115.5 2.4 8.7 261.5 4.4 6.1 1.7Maharashtra 8.1 14.2 76.6 30.6 59.9 95.9 6.9 8.1 1.2Orissa 1.6 1.5 -1.3 4.8 2.9 -39.6 5.8 1.5 -4.3Punjab 37.9 38.0 0.2 37.9 38.0 0.2 41.6 33.5 -8.1Rajasthan 0.0 0.0 . 0.9 2.8 218.7 0.4 0.8 0.4Tamil Nadu 16.3 26.4 61.8 19.4 33.4 72.0 30.5 30.7 0.1Uttar Pradesh 0.4 1.7 296.6 45.0 59.6 32.4 0.9 2.6 1.6West Bengal 0.1 0.1 -3.6 0.4 0.4 -4.9 0.7 0.4 -0.4
India 4.6 7.2 57.4 10.3 18.7 80.8 6.6 7.3 0.6
Table 5(d)
Annual per-capita total expenditures (Rs.) Village local bodies All RLBs
Ratio of RLB expenditures to state development
expenditures: all RLBs
State
90-95 95-98 % chg. 90-95 95-98 % chg. 90-95 95-98 Diff.Andhra Pradesh 50 55 9.8 268 398 48.3 30.5 27.8 -2.7Bihar 35 43 23.6 65 74 13.7 12.4 13.6 1.2Gujarat 13 17 33.2 477 687 44.1 39.5 36.7 2.8Haryana 61 82 34.5 66 89 35.4 5.5 4.8 -0.7Karnataka 43 68 60.3 538 968 79.7 54.4 61.1 6.7Kerala 64 156 143.6 64 235 268.0 6.9 14.6 7.7Madhya Pradesh 52 94 83.2 54 178 227.1 6.9 15.3 8.4Maharashtra 51 77 49.2 449 749 67.0 39.0 40.1 1.1Orissa 38 47 26.1 94 202 114.1 11.5 17.8 4.3Punjab 75 90 19.8 90 111 23.6 6.6 6.5 -0.1Rajasthan 94 196 109.5 230 369 60.2 22.8 26.0 3.2Tamil Nadu 34 57 67.0 63 109 71.2 . 6.3 .Uttar Pradesh 41 52 25.1 45 60 33.1 8.7 8.0 -0.7West Bengal 51 62 20.9 69 103 49.9 12.1 11.0 -1.1
India 45 69 52.5 154 256 66.2 17.7 19.6 1.9
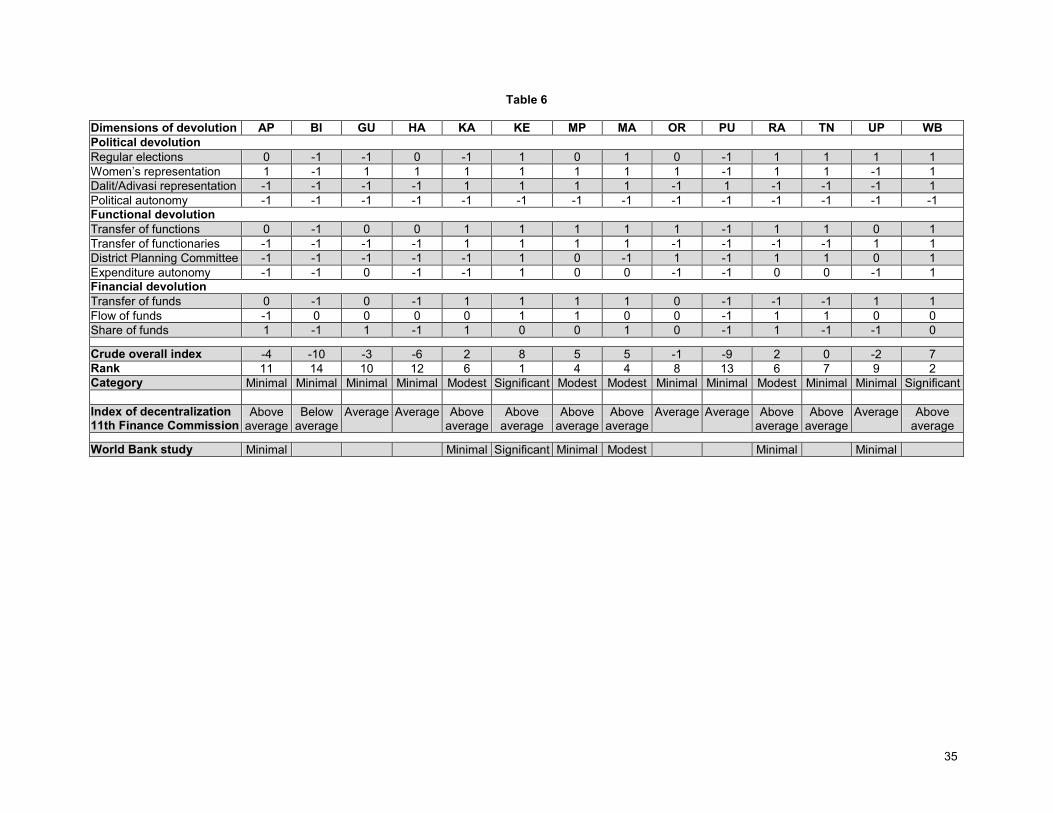
35
Table 6
Dimensions of devolution AP BI GU HA KA KE MP MA OR PU RA TN UP WB Political devolution Regular elections 0 -1 -1 0 -1 1 0 1 0 -1 1 1 1 1 Women’s representation 1 -1 1 1 1 1 1 1 1 -1 1 1 -1 1 Dalit/Adivasi representation -1 -1 -1 -1 1 1 1 1 -1 1 -1 -1 -1 1 Political autonomy -1 -1 -1 -1 -1 -1 -1 -1 -1 -1 -1 -1 -1 -1 Functional devolution Transfer of functions 0 -1 0 0 1 1 1 1 1 -1 1 1 0 1 Transfer of functionaries -1 -1 -1 -1 1 1 1 1 -1 -1 -1 -1 1 1 District Planning Committee -1 -1 -1 -1 -1 1 0 -1 1 -1 1 1 0 1 Expenditure autonomy -1 -1 0 -1 -1 1 0 0 -1 -1 0 0 -1 1 Financial devolution Transfer of funds 0 -1 0 -1 1 1 1 1 0 -1 -1 -1 1 1 Flow of funds -1 0 0 0 0 1 1 0 0 -1 1 1 0 0 Share of funds 1 -1 1 -1 1 0 0 1 0 -1 1 -1 -1 0
Crude overall index -4 -10 -3 -6 2 8 5 5 -1 -9 2 0 -2 7 Rank 11 14 10 12 6 1 4 4 8 13 6 7 9 2 Category Minimal Minimal Minimal Minimal Modest Significant Modest Modest Minimal Minimal Modest Minimal Minimal Significant Index of decentralization 11th Finance Commission
Above average
Below average
Average Average Above average
Above average
Above average
Above average
Average Average Above average
Above average
Average Above average
World Bank study Minimal Minimal Significant Minimal Modest Minimal Minimal
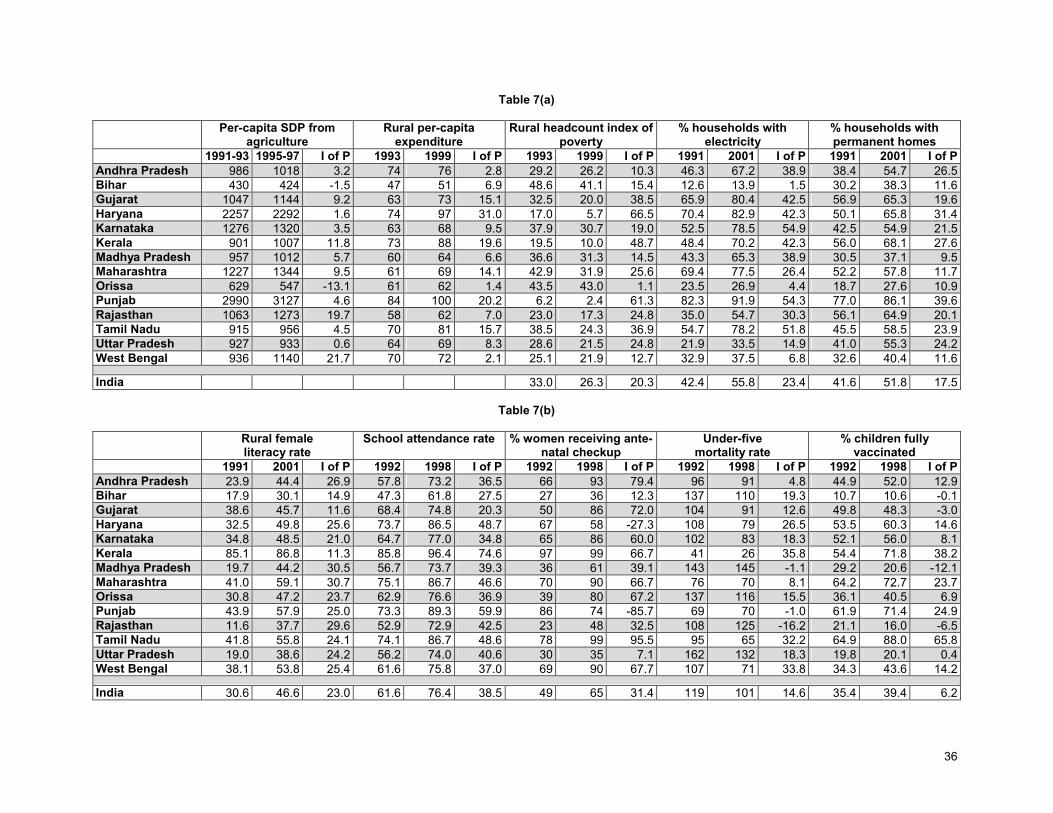
36
Table 7(a) Per-capita SDP from
agriculture Rural per-capita
expenditure Rural headcount index of
poverty % households with
electricity % households with permanent homes
1991-93 1995-97 I of P 1993 1999 I of P 1993 1999 I of P 1991 2001 I of P 1991 2001 I of PAndhra Pradesh 986 1018 3.2 74 76 2.8 29.2 26.2 10.3 46.3 67.2 38.9 38.4 54.7 26.5Bihar 430 424 -1.5 47 51 6.9 48.6 41.1 15.4 12.6 13.9 1.5 30.2 38.3 11.6Gujarat 1047 1144 9.2 63 73 15.1 32.5 20.0 38.5 65.9 80.4 42.5 56.9 65.3 19.6Haryana 2257 2292 1.6 74 97 31.0 17.0 5.7 66.5 70.4 82.9 42.3 50.1 65.8 31.4Karnataka 1276 1320 3.5 63 68 9.5 37.9 30.7 19.0 52.5 78.5 54.9 42.5 54.9 21.5Kerala 901 1007 11.8 73 88 19.6 19.5 10.0 48.7 48.4 70.2 42.3 56.0 68.1 27.6Madhya Pradesh 957 1012 5.7 60 64 6.6 36.6 31.3 14.5 43.3 65.3 38.9 30.5 37.1 9.5Maharashtra 1227 1344 9.5 61 69 14.1 42.9 31.9 25.6 69.4 77.5 26.4 52.2 57.8 11.7Orissa 629 547 -13.1 61 62 1.4 43.5 43.0 1.1 23.5 26.9 4.4 18.7 27.6 10.9Punjab 2990 3127 4.6 84 100 20.2 6.2 2.4 61.3 82.3 91.9 54.3 77.0 86.1 39.6Rajasthan 1063 1273 19.7 58 62 7.0 23.0 17.3 24.8 35.0 54.7 30.3 56.1 64.9 20.1Tamil Nadu 915 956 4.5 70 81 15.7 38.5 24.3 36.9 54.7 78.2 51.8 45.5 58.5 23.9Uttar Pradesh 927 933 0.6 64 69 8.3 28.6 21.5 24.8 21.9 33.5 14.9 41.0 55.3 24.2West Bengal 936 1140 21.7 70 72 2.1 25.1 21.9 12.7 32.9 37.5 6.8 32.6 40.4 11.6
India 33.0 26.3 20.3 42.4 55.8 23.4 41.6 51.8 17.5
Table 7(b) Rural female
literacy rate School attendance rate % women receiving ante-
natal checkup Under-five
mortality rate % children fully
vaccinated 1991 2001 I of P 1992 1998 I of P 1992 1998 I of P 1992 1998 I of P 1992 1998 I of PAndhra Pradesh 23.9 44.4 26.9 57.8 73.2 36.5 66 93 79.4 96 91 4.8 44.9 52.0 12.9Bihar 17.9 30.1 14.9 47.3 61.8 27.5 27 36 12.3 137 110 19.3 10.7 10.6 -0.1Gujarat 38.6 45.7 11.6 68.4 74.8 20.3 50 86 72.0 104 91 12.6 49.8 48.3 -3.0Haryana 32.5 49.8 25.6 73.7 86.5 48.7 67 58 -27.3 108 79 26.5 53.5 60.3 14.6Karnataka 34.8 48.5 21.0 64.7 77.0 34.8 65 86 60.0 102 83 18.3 52.1 56.0 8.1Kerala 85.1 86.8 11.3 85.8 96.4 74.6 97 99 66.7 41 26 35.8 54.4 71.8 38.2Madhya Pradesh 19.7 44.2 30.5 56.7 73.7 39.3 36 61 39.1 143 145 -1.1 29.2 20.6 -12.1Maharashtra 41.0 59.1 30.7 75.1 86.7 46.6 70 90 66.7 76 70 8.1 64.2 72.7 23.7Orissa 30.8 47.2 23.7 62.9 76.6 36.9 39 80 67.2 137 116 15.5 36.1 40.5 6.9Punjab 43.9 57.9 25.0 73.3 89.3 59.9 86 74 -85.7 69 70 -1.0 61.9 71.4 24.9Rajasthan 11.6 37.7 29.6 52.9 72.9 42.5 23 48 32.5 108 125 -16.2 21.1 16.0 -6.5Tamil Nadu 41.8 55.8 24.1 74.1 86.7 48.6 78 99 95.5 95 65 32.2 64.9 88.0 65.8Uttar Pradesh 19.0 38.6 24.2 56.2 74.0 40.6 30 35 7.1 162 132 18.3 19.8 20.1 0.4West Bengal 38.1 53.8 25.4 61.6 75.8 37.0 69 90 67.7 107 71 33.8 34.3 43.6 14.2
India 30.6 46.6 23.0 61.6 76.4 38.5 49 65 31.4 119 101 14.6 35.4 39.4 6.2
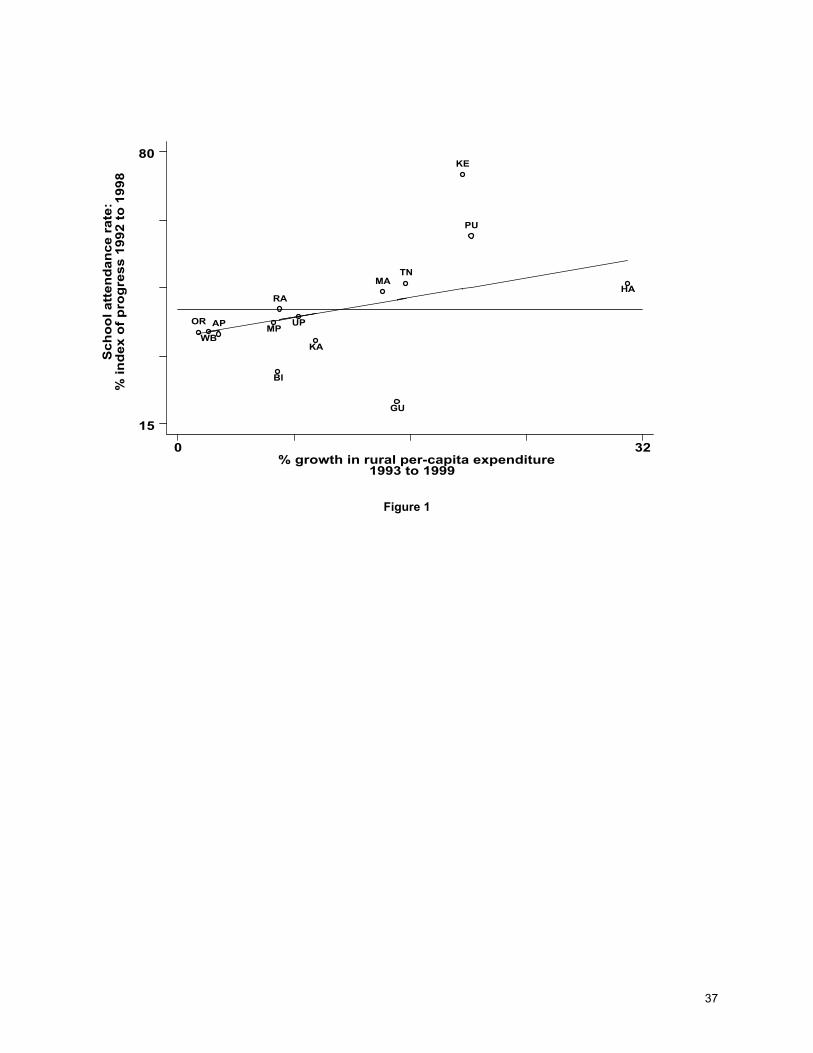
37
Figure 1
1993 to 1999% growth in rural per-capita expenditure
0 32
15
80
OR APWB
MP
BI
KA
RA
UP
MATN
GU
KE
PU
HA
% in
dex
of p
rogr
ess
1992
to 1
998
Sch
ool a
tten
danc
e ra
te:

38
Figure 2(a)Relative growth performance (1991-93 to 1995-97):
per-capita SDP from agriculture
-25-20-15-10
-505
101520
BI HA PU AP GU UP OR TN RA KA MP MA WB KE
Figure 2(b)Relative growth performance (1993 to 1999):
per-capita rural expenditures
-15-10
-505
10152025
BI HA PU AP GU UP OR TN RA KA MP MA WB KE
Figure 2(c)Relative index of progress (1993 to 1999):
rural headcount index of poverty
-40-30-20-10
01020304050
BI HA PU AP GU UP OR TN RA KA MP MA WB KE
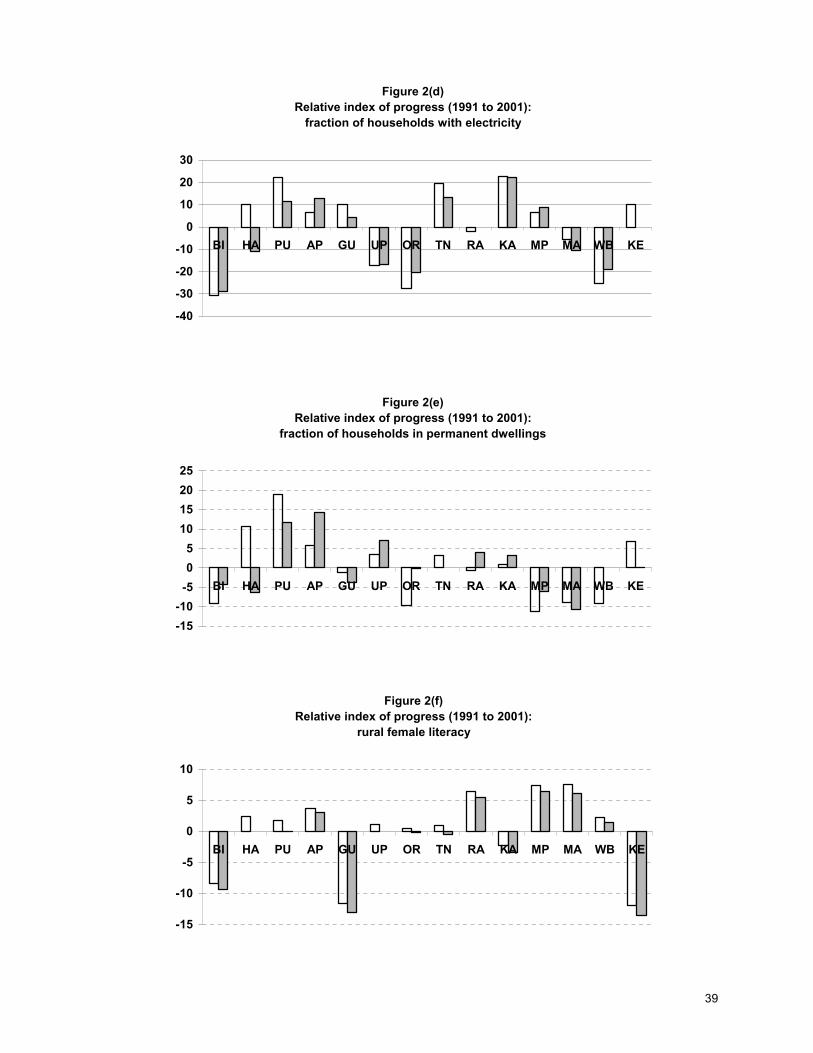
39
Figure 2(d)Relative index of progress (1991 to 2001):
fraction of households with electricity
-40
-30
-20
-10
0
10
20
30
BI HA PU AP GU UP OR TN RA KA MP MA WB KE
Figure 2(e)Relative index of progress (1991 to 2001):
fraction of households in permanent dwellings
-15-10
-505
10152025
BI HA PU AP GU UP OR TN RA KA MP MA WB KE
Figure 2(f)Relative index of progress (1991 to 2001):
rural female literacy
-15
-10
-5
0
5
10
BI HA PU AP GU UP OR TN RA KA MP MA WB KE
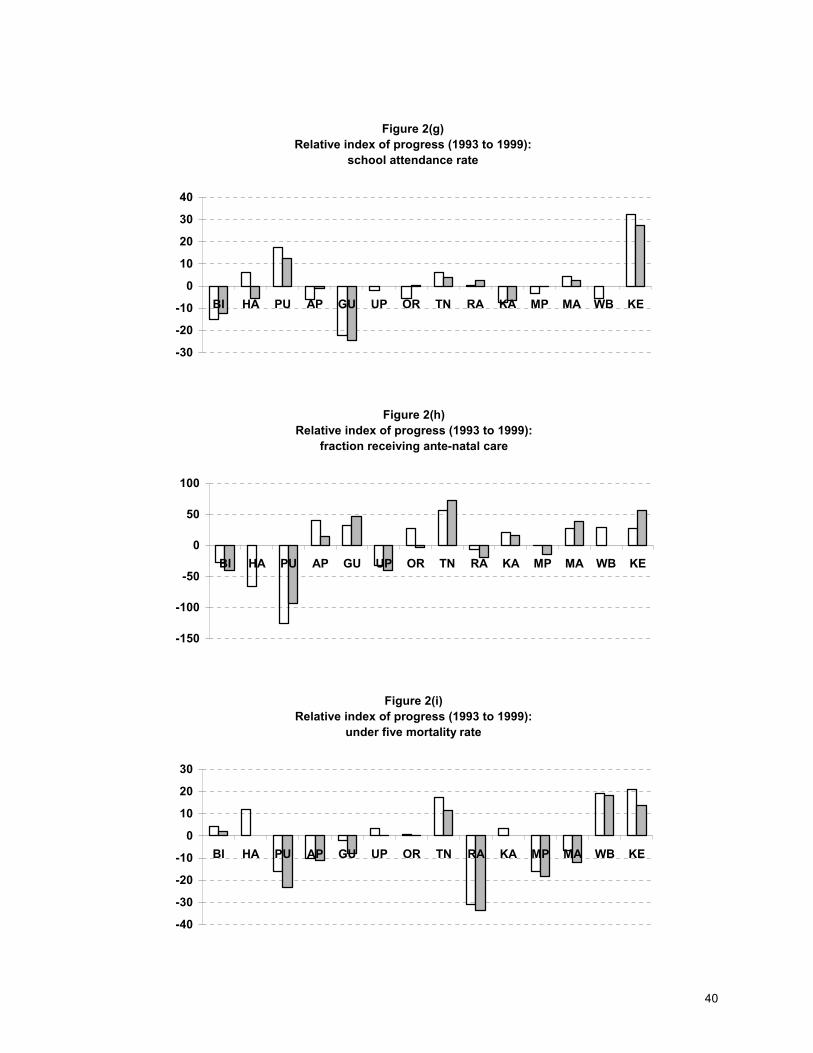
40
Figure 2(g)Relative index of progress (1993 to 1999):
school attendance rate
-30
-20
-10
0
10
20
30
40
BI HA PU AP GU UP OR TN RA KA MP MA WB KE
Figure 2(h)Relative index of progress (1993 to 1999):
fraction receiving ante-natal care
-150
-100
-50
0
50
100
BI HA PU AP GU UP OR TN RA KA MP MA WB KE
Figure 2(i)Relative index of progress (1993 to 1999):
under five mortality rate
-40
-30
-20
-10
0
10
20
30
BI HA PU AP GU UP OR TN RA KA MP MA WB KE

41
Figure 2(j)Relative index of progress (1993 to 1999):
% of children fully vaccinated
-30-20-10
0102030405060
BI HA PU AP GU UP OR TN RA KA MP MA WB KE