wetland delin rpt cover jackschool - washington … · 4 - 5 - wetland non-vascular plants ... (b1)...
TRANSCRIPT
APPENDIX B:
WETLAND DETERMINATION DATA FORMS
NE JACKSON SCHOOL ROAD (NE GRANT ST. - NW EVERGREEN RD.) PROJECT
WASHINGTON COUNTY, OREGON

2 -
3 -
4 -
5 - Wetland Non-Vascular Plants
Indicators of hydric soil and wetland hydrology mustbe present, unless disturbed or problematic.
Hydrophytic Vegetation Indicators:
Dominance Test is > 50%
Prevalence Index is ≤3.0 1
1
1
Morphological Adaptations (Provide supporting data in Remarks or on a separate sheet)
Problematic Hydrophytic Vegetation (Explain)
1
1
1 - Rapid Test for Hydrophytic Vegetation
SP01
5.2 3.0
Yes No
Yes No
Yes No
Yes No
Yes NoYes No
20
20
0
0
20
0
0
0
0
20
5
5
0
0
0
0
0
0
0
0
0
70
Yes No
Vegetation maintained as yard, landscaped.
250.0% UPL
50.0% FAC
40.0%
0.0%
50.0%40
100.0% FACU
0.0%
0.0% 0 00.0% 20 400.0% 25 75
25 10020
20 10066.7% FACW
90 31516.7% FACU
3.50016.7% FAC
0.0%
0.0%
0.0%
0.0%
0.0%
0.0%
0.0%
30
0.0%
0.0%
0
, or Hydrology
Prevalence Index = B/A =
1.2.3.4.
(A/B)
Project/Site:
Wetland Hydrology Present?
Applicant/Owner:
1.2.3.4.5.
Sampling Date:
Lat.: Long.:
Sampling Point:
Investigator(s):
= Total Cover
% Bare Ground in Herb Stratum:
Landform (hillslope, terrace, etc.):
T
Number of Dominant SpeciesThat are OBL, FACW, or FAC:
1.2.
Remarks:
OBL species
FACW species
FAC species
FACU species
UPL species
Column Totals:
x 1 =
x 2 =
x 3 =
x 4 =
x 5 =
(A)
(A)
Are Vegetation
(B)
Are "Normal Circumstances" present?
1.2.3.4.5.6.7.8.9.10.11.
Soil Map Unit Name:
Datum:
Are climatic/hydrologic conditions on the site typical for this time of year?
Hydrophytic Vegetation Present?
NWI classification:
Remarks:
Tree Stratum
Sapling/Shrub Stratum
*Indicator suffix = National status or professional decision assigned because Regional status not defined by FWS.
R
Absolute% Cover
Are Vegetation
Section, Township, Range: S
significantly disturbed?
Is the Sampled Area
within a Wetland?
Local relief (concave, convex, none):
naturally problematic?
Slope:
(If needed, explain any answers in Remarks.)
, Soil
Summary of Findings - Attach site map showing sampling point locations, transects, important features, etc.
% /
, Soil
Hydric Soil Present?
Western Mountains, Valleys, and Coast - Version 2.0
Woody Vine Stratum
(B)
Herb Stratum
= Total Cover
Subregion (LRR):
IndicatorStatus
°
= Total Cover
= Total Cover
HydrophyticVegetationPresent?
US Army Corps of Engineers
(If no, explain in Remarks.)
Dominance Test worksheet:
City/County:
Percent of dominant SpeciesThat Are OBL, FACW, or FAC:
Total Number of DominantSpecies Across All Strata:
Prevalence Index worksheet:
State:
Total % Cover of: Multiply by:
, or Hydrology
DominantSpecies?Rel.Strat.Cover
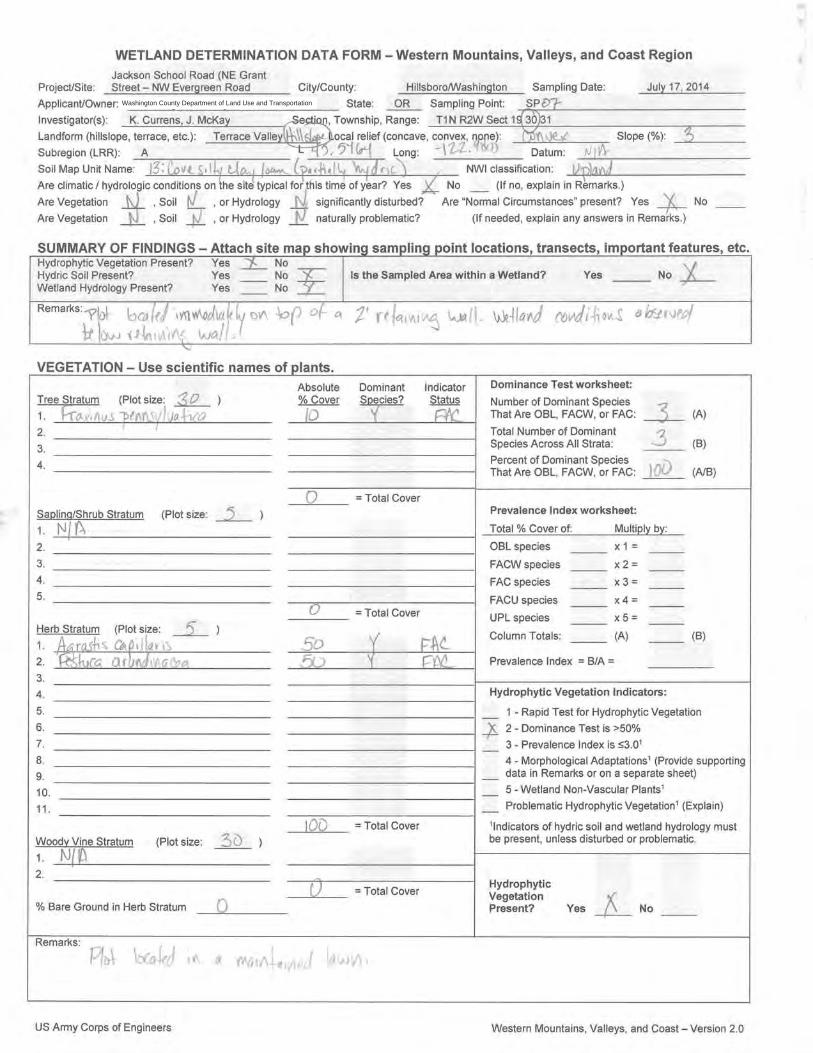
Plot located immediately north of the Unnamed Tributary #1 channel.
0 0.0%
WETLAND DETERMINATION DATA FORM - Western Mountains, Valleys, and Coast Region
17-Jul-14Jackson School Road (NE Grant Street - NW Evergreen Rd Hillsboro/Washington
Washington County Land Use and Transportation Oreg
2W1N30K. Currens, J. McKay
Valley concave
-122 58.774045 32.8084A
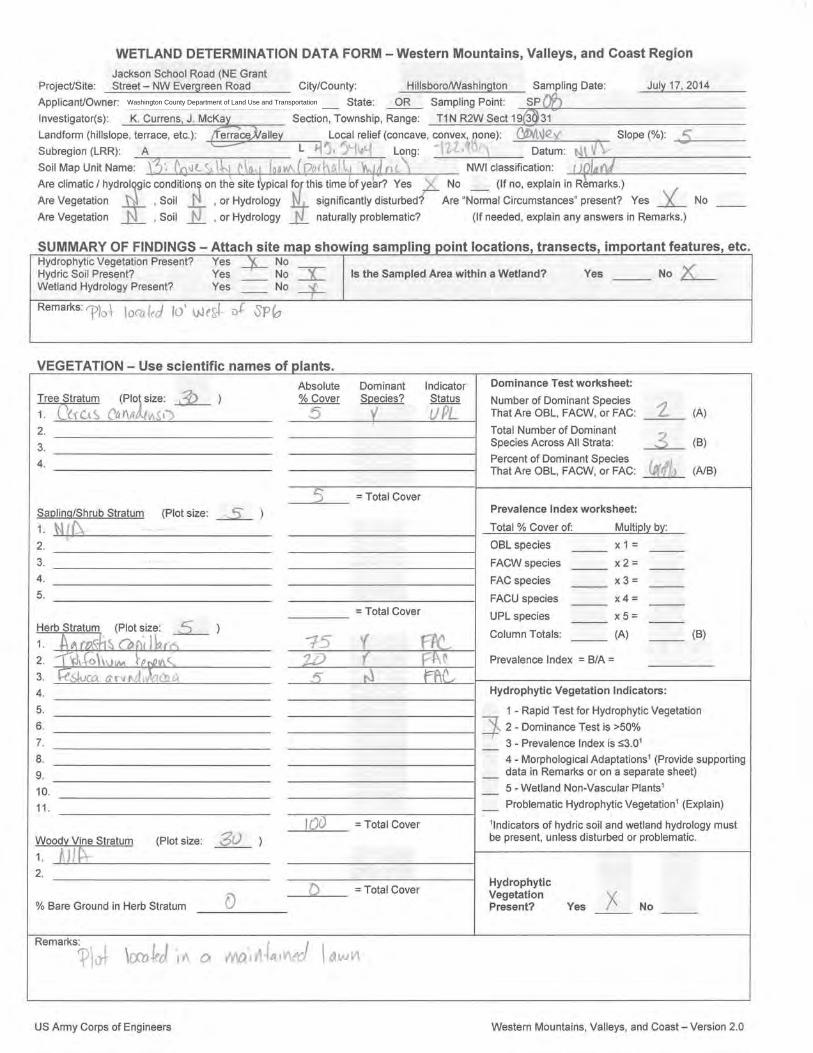
13: Cove silty clay loam (predominantly hydric) Upland
Libocedrus decurrens
Betula papyrifera
Rhododendron macrophyllum
Juncus bufonius
Polystichum munitum
Equisetum arvense
(Plot size: 30
(Plot size: 5
(Plot size: 5
(Plot size: 30
)
)
)
)
VEGETATION - Use scientific names of plants.
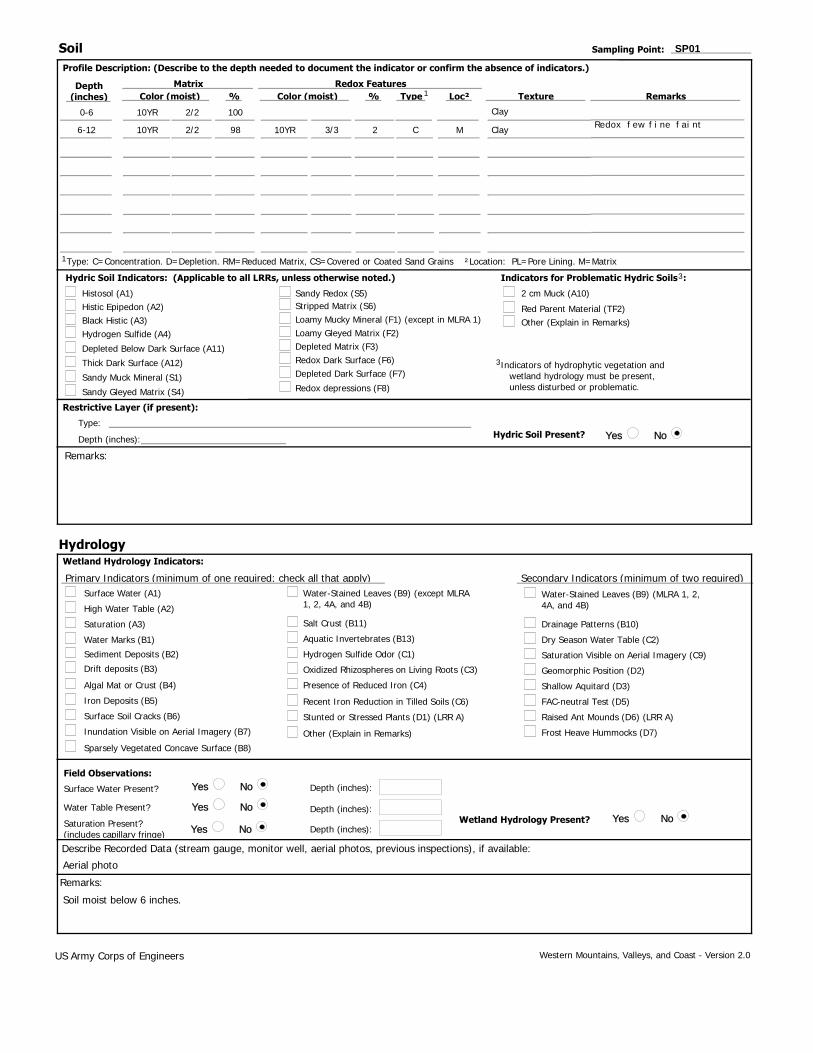
SP01
Soil moist below 6 inches.
Soil Sampling Point:
Profile Description: (Describe to the depth needed to document the indicator or confirm the absence of indicators.)
Type: C=Concentration. D=Depletion. RM=Reduced Matrix, CS=Covered or Coated Sand Grains ²Location: PL=Pore Lining. M=Matrix
Yes No
Yes No
Yes No
Yes NoYes No
Hydric Soil Indicators: (Applicable to all LRRs, unless otherwise noted.) Indicators for Problematic Hydric Soils :
Restrictive Layer (if present):
Hydric Soil Present?
Indicators of hydrophytic vegetation and wetland hydrology must be present, unless disturbed or problematic.
Histosol (A1)Histic Epipedon (A2)Black Histic (A3)Hydrogen Sulfide (A4)
Depleted Below Dark Surface (A11)
Thick Dark Surface (A12)
Sandy Muck Mineral (S1)
Sandy Redox (S5)Stripped Matrix (S6)Loamy Mucky Mineral (F1) (except in MLRA 1)Loamy Gleyed Matrix (F2)Depleted Matrix (F3)Redox Dark Surface (F6)Depleted Dark Surface (F7)
Redox depressions (F8)
2 cm Muck (A10)
Other (Explain in Remarks)
Type:
Depth (inches):
Hydrology
Remarks:
Surface Water (A1)
High Water Table (A2)
Saturation (A3)
Water Marks (B1)
Sediment Deposits (B2)
Drift deposits (B3)
Algal Mat or Crust (B4)
Iron Deposits (B5)
Inundation Visible on Aerial Imagery (B7)
Salt Crust (B11)
Dry Season Water Table (C2)Aquatic Invertebrates (B13)
Hydrogen Sulfide Odor (C1)
Oxidized Rhizospheres on Living Roots (C3)
Presence of Reduced Iron (C4)
Recent Iron Reduction in Tilled Soils (C6)
Other (Explain in Remarks)
Surface Soil Cracks (B6)
Sparsely Vegetated Concave Surface (B8)
Drainage Patterns (B10)
Frost Heave Hummocks (D7)
Stunted or Stressed Plants (D1) (LRR A)
Saturation Visible on Aerial Imagery (C9)
Geomorphic Position (D2)
FAC-neutral Test (D5)
Primary Indicators (minimum of one required; check all that apply)
Wetland Hydrology Indicators:
Field Observations:
Surface Water Present?
Water Table Present?
Saturation Present?(includes capillary fringe)
Depth (inches):
Depth (inches):
Depth (inches):Wetland Hydrology Present?
Describe Recorded Data (stream gauge, monitor well, aerial photos, previous inspections), if available:
Remarks:
US Army Corps of Engineers Western Mountains, Valleys, and Coast - Version 2.0
Secondary Indicators (minimum of two required)
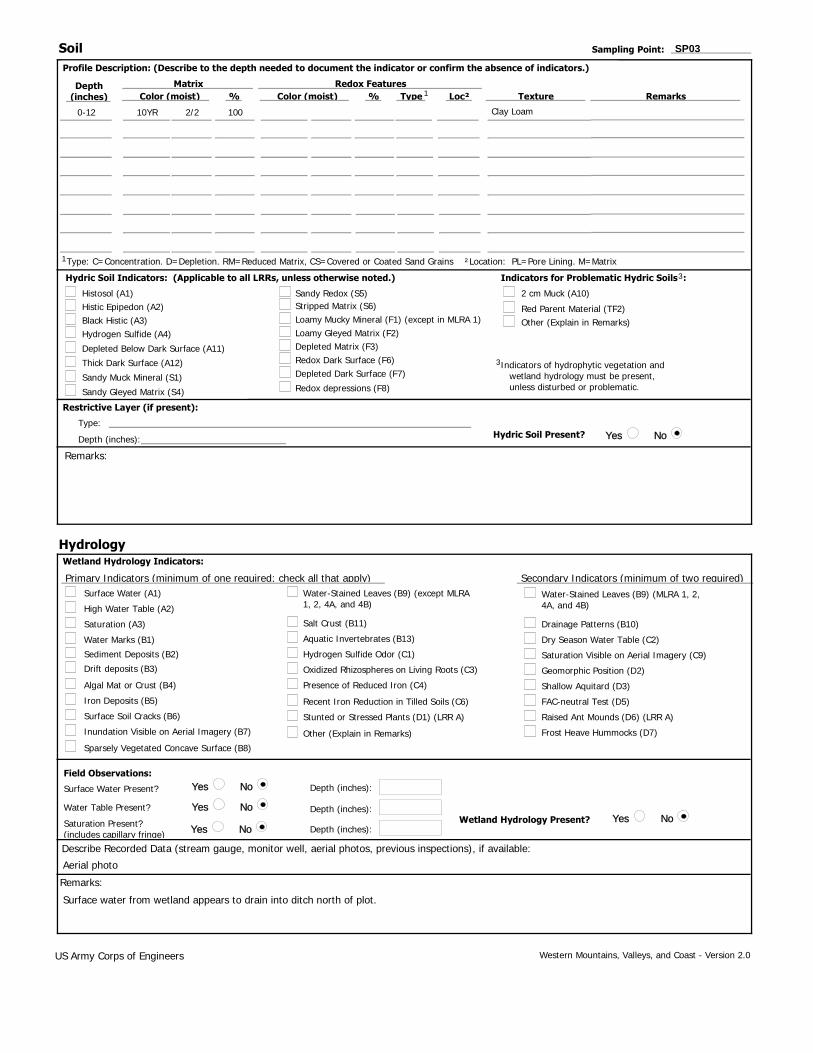
Aerial photo
Water-Stained Leaves (B9) (except MLRA 1, 2, 4A, and 4B)
Sandy Gleyed Matrix (S4)
Red Parent Material (TF2)
Water-Stained Leaves (B9) (MLRA 1, 2, 4A, and 4B)
Shallow Aquitard (D3)
Raised Ant Mounds (D6) (LRR A)
3
3
1
Profile Description: (Describe to the depth needed to document the indicator or confirm the absence of indicators.)
Depth(inches) Color (moist) Color (moist)
Matrix Redox Features% Loc² Texture RemarksType%
Redox few fine faint
1
0-6
6-12
10YR
10YR
2/2
2/2
100
98 10YR 3/3 2 C M Clay
Clay
2 -
3 -
4 -
5 - Wetland Non-Vascular Plants
Indicators of hydric soil and wetland hydrology mustbe present, unless disturbed or problematic.
Hydrophytic Vegetation Indicators:
Dominance Test is > 50%
Prevalence Index is ≤3.0 1
1
1
Morphological Adaptations (Provide supporting data in Remarks or on a separate sheet)
Problematic Hydrophytic Vegetation (Explain)
1
1
1 - Rapid Test for Hydrophytic Vegetation
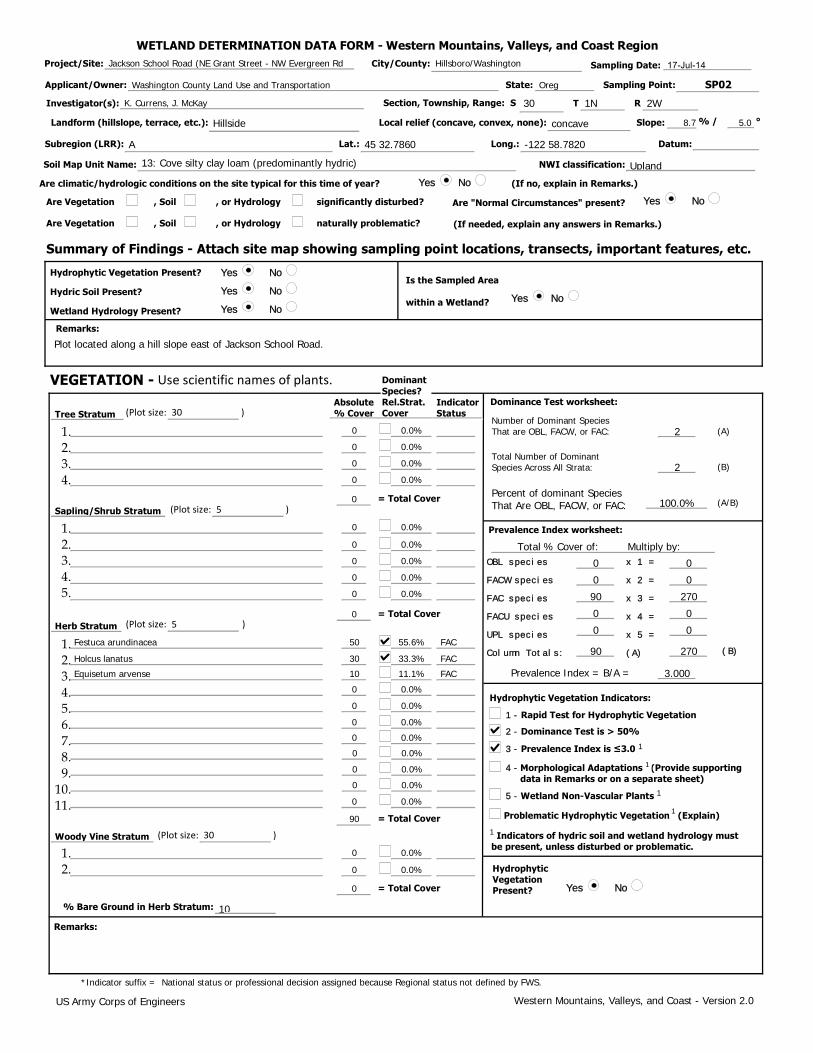
SP02
8.7 5.0
Yes No
Yes No
Yes No
Yes No
Yes NoYes No
0
0
0
0
0
0
0
0
0
50
30
10
0
0
0
0
0
0
0
0
0
10
Yes No
20.0%
0.0%
20.0%
0.0%
100.0%0
0.0%
0.0%
0.0% 0 00.0% 0 00.0% 90 270
0 00
0 055.6% FAC
90 27033.3% FAC
3.00011.1% FAC
0.0%
0.0%
0.0%
0.0%
0.0%
0.0%
0.0%
90
0.0%
0.0%
0
, or Hydrology
Prevalence Index = B/A =
1.2.3.4.
(A/B)
Project/Site:
Wetland Hydrology Present?
Applicant/Owner:
1.2.3.4.5.
Sampling Date:
Lat.: Long.:
Sampling Point:
Investigator(s):
= Total Cover
% Bare Ground in Herb Stratum:
Landform (hillslope, terrace, etc.):
T
Number of Dominant SpeciesThat are OBL, FACW, or FAC:
1.2.
Remarks:
OBL species
FACW species
FAC species
FACU species
UPL species
Column Totals:
x 1 =
x 2 =
x 3 =
x 4 =
x 5 =
(A)
(A)
Are Vegetation
(B)
Are "Normal Circumstances" present?
1.2.3.4.5.6.7.8.9.10.11.
Soil Map Unit Name:
Datum:
Are climatic/hydrologic conditions on the site typical for this time of year?
Hydrophytic Vegetation Present?
NWI classification:
Remarks:
Tree Stratum
Sapling/Shrub Stratum
*Indicator suffix = National status or professional decision assigned because Regional status not defined by FWS.
R
Absolute% Cover
Are Vegetation
Section, Township, Range: S
significantly disturbed?
Is the Sampled Area
within a Wetland?
Local relief (concave, convex, none):
naturally problematic?
Slope:
(If needed, explain any answers in Remarks.)
, Soil
Summary of Findings - Attach site map showing sampling point locations, transects, important features, etc.
% /
, Soil
Hydric Soil Present?
Western Mountains, Valleys, and Coast - Version 2.0
Woody Vine Stratum
(B)
Herb Stratum
= Total Cover
Subregion (LRR):
IndicatorStatus
°
= Total Cover
= Total Cover
HydrophyticVegetationPresent?
US Army Corps of Engineers
(If no, explain in Remarks.)
Dominance Test worksheet:
City/County:
Percent of dominant SpeciesThat Are OBL, FACW, or FAC:
Total Number of DominantSpecies Across All Strata:
Prevalence Index worksheet:
State:
Total % Cover of: Multiply by:
, or Hydrology
DominantSpecies?Rel.Strat.Cover
Plot located along a hill slope east of Jackson School Road.
0 0.0%
WETLAND DETERMINATION DATA FORM - Western Mountains, Valleys, and Coast Region
17-Jul-14Jackson School Road (NE Grant Street - NW Evergreen Rd Hillsboro/Washington
Washington County Land Use and Transportation Oreg
2W1N30K. Currens, J. McKay
Hillside concave
-122 58.782045 32.7860A
13: Cove silty clay loam (predominantly hydric) Upland
Festuca arundinacea
Holcus lanatus
Equisetum arvense
(Plot size: 30
(Plot size: 5
(Plot size: 5
(Plot size: 30
)
)
)
)
VEGETATION - Use scientific names of plants.

SP02
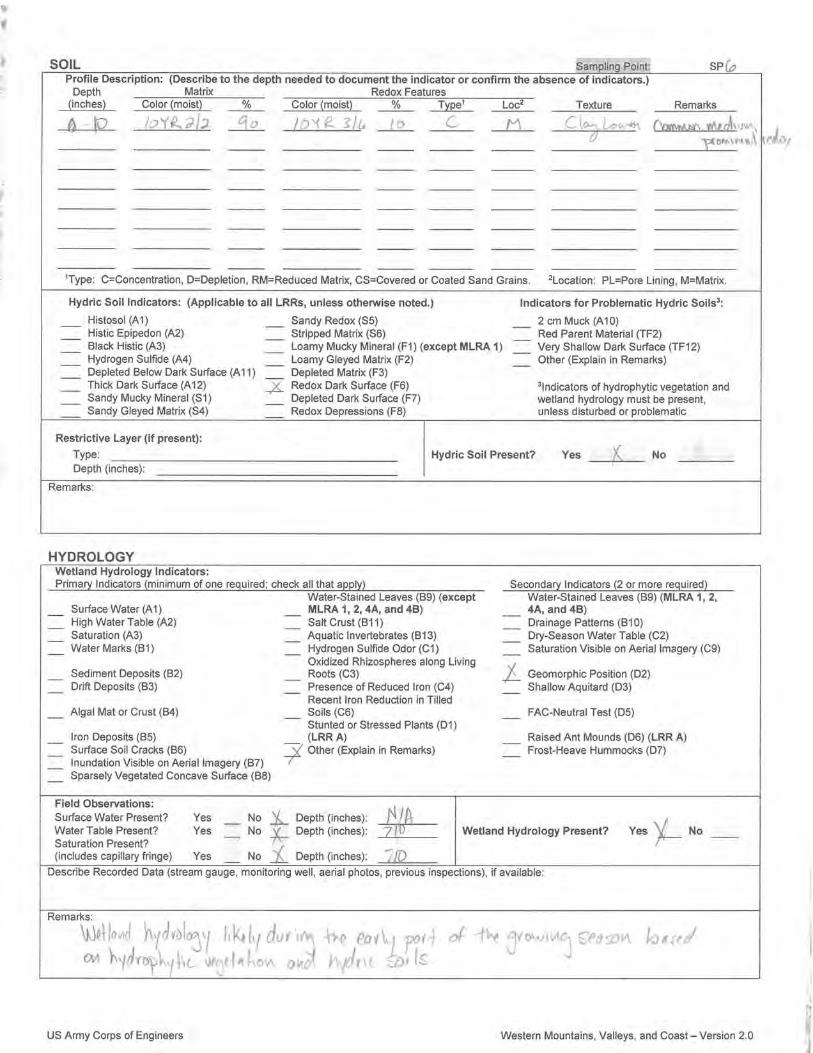
early season hydrology likely given hydrophytic vegetation and hydric soils.
Soil Sampling Point:
Profile Description: (Describe to the depth needed to document the indicator or confirm the absence of indicators.)
Type: C=Concentration. D=Depletion. RM=Reduced Matrix, CS=Covered or Coated Sand Grains ²Location: PL=Pore Lining. M=Matrix
Yes No
Yes No
Yes No
Yes NoYes No
Hydric Soil Indicators: (Applicable to all LRRs, unless otherwise noted.) Indicators for Problematic Hydric Soils :
Restrictive Layer (if present):
Hydric Soil Present?
Indicators of hydrophytic vegetation and wetland hydrology must be present, unless disturbed or problematic.
Histosol (A1)Histic Epipedon (A2)Black Histic (A3)Hydrogen Sulfide (A4)
Depleted Below Dark Surface (A11)
Thick Dark Surface (A12)
Sandy Muck Mineral (S1)
Sandy Redox (S5)Stripped Matrix (S6)Loamy Mucky Mineral (F1) (except in MLRA 1)Loamy Gleyed Matrix (F2)Depleted Matrix (F3)Redox Dark Surface (F6)Depleted Dark Surface (F7)
Redox depressions (F8)
2 cm Muck (A10)
Other (Explain in Remarks)
Type:
Depth (inches):
Hydrology
Remarks:
Surface Water (A1)
High Water Table (A2)
Saturation (A3)
Water Marks (B1)
Sediment Deposits (B2)
Drift deposits (B3)
Algal Mat or Crust (B4)
Iron Deposits (B5)
Inundation Visible on Aerial Imagery (B7)
Salt Crust (B11)
Dry Season Water Table (C2)Aquatic Invertebrates (B13)
Hydrogen Sulfide Odor (C1)
Oxidized Rhizospheres on Living Roots (C3)
Presence of Reduced Iron (C4)
Recent Iron Reduction in Tilled Soils (C6)
Other (Explain in Remarks)
Surface Soil Cracks (B6)
Sparsely Vegetated Concave Surface (B8)
Drainage Patterns (B10)
Frost Heave Hummocks (D7)
Stunted or Stressed Plants (D1) (LRR A)
Saturation Visible on Aerial Imagery (C9)
Geomorphic Position (D2)
FAC-neutral Test (D5)
Primary Indicators (minimum of one required; check all that apply)
Wetland Hydrology Indicators:
Field Observations:
Surface Water Present?
Water Table Present?
Saturation Present?(includes capillary fringe)
Depth (inches):
Depth (inches):
Depth (inches):Wetland Hydrology Present?
Describe Recorded Data (stream gauge, monitor well, aerial photos, previous inspections), if available:
Remarks:
US Army Corps of Engineers Western Mountains, Valleys, and Coast - Version 2.0
Secondary Indicators (minimum of two required)
Aerial photo
Water-Stained Leaves (B9) (except MLRA 1, 2, 4A, and 4B)
Sandy Gleyed Matrix (S4)
Red Parent Material (TF2)
Water-Stained Leaves (B9) (MLRA 1, 2, 4A, and 4B)
Shallow Aquitard (D3)
Raised Ant Mounds (D6) (LRR A)
3
3
1
Profile Description: (Describe to the depth needed to document the indicator or confirm the absence of indicators.)
Depth(inches) Color (moist) Color (moist)
Matrix Redox Features% Loc² Texture RemarksType% 1
0-12 10YR 2/1 95 10YR 3/4 5 C M Clay Loam

2 -
3 -
4 -
5 - Wetland Non-Vascular Plants
Indicators of hydric soil and wetland hydrology mustbe present, unless disturbed or problematic.
Hydrophytic Vegetation Indicators:
Dominance Test is > 50%
Prevalence Index is ≤3.0 1
1
1
Morphological Adaptations (Provide supporting data in Remarks or on a separate sheet)
Problematic Hydrophytic Vegetation (Explain)
1
1
1 - Rapid Test for Hydrophytic Vegetation
SP03
12.2 7.0
Yes No
Yes No
Yes No
Yes No
Yes NoYes No
40
20
0
0
0
0
0
0
0
30
0
0
0
0
0
0
0
0
0
0
0
70
Yes No
266.7% FACW
33.3% UPL
30.0%
0.0%
66.7%60
0.0%
0.0%
0.0% 0 00.0% 40 800.0% 30 90
0 00
20 100100.0% FAC
90 2700.0%
3.0000.0%
0.0%
0.0%
0.0%
0.0%
0.0%
0.0%
0.0%
30
0.0%
0.0%
0
, or Hydrology
Prevalence Index = B/A =
1.2.3.4.
(A/B)
Project/Site:
Wetland Hydrology Present?
Applicant/Owner:
1.2.3.4.5.
Sampling Date:
Lat.: Long.:
Sampling Point:
Investigator(s):
= Total Cover
% Bare Ground in Herb Stratum:
Landform (hillslope, terrace, etc.):
T
Number of Dominant SpeciesThat are OBL, FACW, or FAC:
1.2.
Remarks:
OBL species
FACW species
FAC species
FACU species
UPL species
Column Totals:
x 1 =
x 2 =
x 3 =
x 4 =
x 5 =
(A)
(A)
Are Vegetation
(B)
Are "Normal Circumstances" present?
1.2.3.4.5.6.7.8.9.10.11.
Soil Map Unit Name:
Datum:
Are climatic/hydrologic conditions on the site typical for this time of year?
Hydrophytic Vegetation Present?
NWI classification:
Remarks:
Tree Stratum
Sapling/Shrub Stratum
*Indicator suffix = National status or professional decision assigned because Regional status not defined by FWS.
R
Absolute% Cover
Are Vegetation
Section, Township, Range: S
significantly disturbed?
Is the Sampled Area
within a Wetland?
Local relief (concave, convex, none):
naturally problematic?
Slope:
(If needed, explain any answers in Remarks.)
, Soil
Summary of Findings - Attach site map showing sampling point locations, transects, important features, etc.
% /
, Soil
Hydric Soil Present?
Western Mountains, Valleys, and Coast - Version 2.0
Woody Vine Stratum
(B)
Herb Stratum
= Total Cover
Subregion (LRR):
IndicatorStatus
°
= Total Cover
= Total Cover
HydrophyticVegetationPresent?
US Army Corps of Engineers
(If no, explain in Remarks.)
Dominance Test worksheet:
City/County:
Percent of dominant SpeciesThat Are OBL, FACW, or FAC:
Total Number of DominantSpecies Across All Strata:
Prevalence Index worksheet:
State:
Total % Cover of: Multiply by:
, or Hydrology
DominantSpecies?Rel.Strat.Cover
Plot located along a hill slope east of Jackson School Road, 10 feet northeast of SP02
0 0.0%
WETLAND DETERMINATION DATA FORM - Western Mountains, Valleys, and Coast Region
17-Jul-14Jackson School Road (NE Grant Street - NW Evergreen Rd Hillsboro/Washington
Washington County Land Use and Transportation Oreg
2W1N30K. Currens, J. McKay
Hillside convex
-122 58.753545 32.7859A
13: Cove silty clay loam (predominantly hydric) Upland
Salix babylonica
Libocedrus decurrens
Festuca arundinacea
(Plot size: 30
(Plot size: 5
(Plot size: 5
(Plot size: 30
)
)
)
)
VEGETATION - Use scientific names of plants.
SP03
Surface water from wetland appears to drain into ditch north of plot.
Soil Sampling Point:
Profile Description: (Describe to the depth needed to document the indicator or confirm the absence of indicators.)
Type: C=Concentration. D=Depletion. RM=Reduced Matrix, CS=Covered or Coated Sand Grains ²Location: PL=Pore Lining. M=Matrix
Yes No
Yes No
Yes No
Yes NoYes No
Hydric Soil Indicators: (Applicable to all LRRs, unless otherwise noted.) Indicators for Problematic Hydric Soils :
Restrictive Layer (if present):
Hydric Soil Present?
Indicators of hydrophytic vegetation and wetland hydrology must be present, unless disturbed or problematic.
Histosol (A1)Histic Epipedon (A2)Black Histic (A3)Hydrogen Sulfide (A4)
Depleted Below Dark Surface (A11)
Thick Dark Surface (A12)
Sandy Muck Mineral (S1)
Sandy Redox (S5)Stripped Matrix (S6)Loamy Mucky Mineral (F1) (except in MLRA 1)Loamy Gleyed Matrix (F2)Depleted Matrix (F3)Redox Dark Surface (F6)Depleted Dark Surface (F7)
Redox depressions (F8)
2 cm Muck (A10)
Other (Explain in Remarks)
Type:
Depth (inches):
Hydrology
Remarks:
Surface Water (A1)
High Water Table (A2)
Saturation (A3)
Water Marks (B1)
Sediment Deposits (B2)
Drift deposits (B3)
Algal Mat or Crust (B4)
Iron Deposits (B5)
Inundation Visible on Aerial Imagery (B7)
Salt Crust (B11)
Dry Season Water Table (C2)Aquatic Invertebrates (B13)
Hydrogen Sulfide Odor (C1)
Oxidized Rhizospheres on Living Roots (C3)
Presence of Reduced Iron (C4)
Recent Iron Reduction in Tilled Soils (C6)
Other (Explain in Remarks)
Surface Soil Cracks (B6)
Sparsely Vegetated Concave Surface (B8)
Drainage Patterns (B10)
Frost Heave Hummocks (D7)
Stunted or Stressed Plants (D1) (LRR A)
Saturation Visible on Aerial Imagery (C9)
Geomorphic Position (D2)
FAC-neutral Test (D5)
Primary Indicators (minimum of one required; check all that apply)
Wetland Hydrology Indicators:
Field Observations:
Surface Water Present?
Water Table Present?
Saturation Present?(includes capillary fringe)
Depth (inches):
Depth (inches):
Depth (inches):Wetland Hydrology Present?
Describe Recorded Data (stream gauge, monitor well, aerial photos, previous inspections), if available:
Remarks:
US Army Corps of Engineers Western Mountains, Valleys, and Coast - Version 2.0
Secondary Indicators (minimum of two required)
Aerial photo
Water-Stained Leaves (B9) (except MLRA 1, 2, 4A, and 4B)
Sandy Gleyed Matrix (S4)
Red Parent Material (TF2)
Water-Stained Leaves (B9) (MLRA 1, 2, 4A, and 4B)
Shallow Aquitard (D3)
Raised Ant Mounds (D6) (LRR A)
3
3
1
Profile Description: (Describe to the depth needed to document the indicator or confirm the absence of indicators.)
Depth(inches) Color (moist) Color (moist)
Matrix Redox Features% Loc² Texture RemarksType% 1
0-12 10YR 2/2 100 Clay Loam
2 -
3 -
4 -
5 - Wetland Non-Vascular Plants
Indicators of hydric soil and wetland hydrology mustbe present, unless disturbed or problematic.
Hydrophytic Vegetation Indicators:
Dominance Test is > 50%
Prevalence Index is ≤3.0 1
1
1
Morphological Adaptations (Provide supporting data in Remarks or on a separate sheet)
Problematic Hydrophytic Vegetation (Explain)
1
1
1 - Rapid Test for Hydrophytic Vegetation
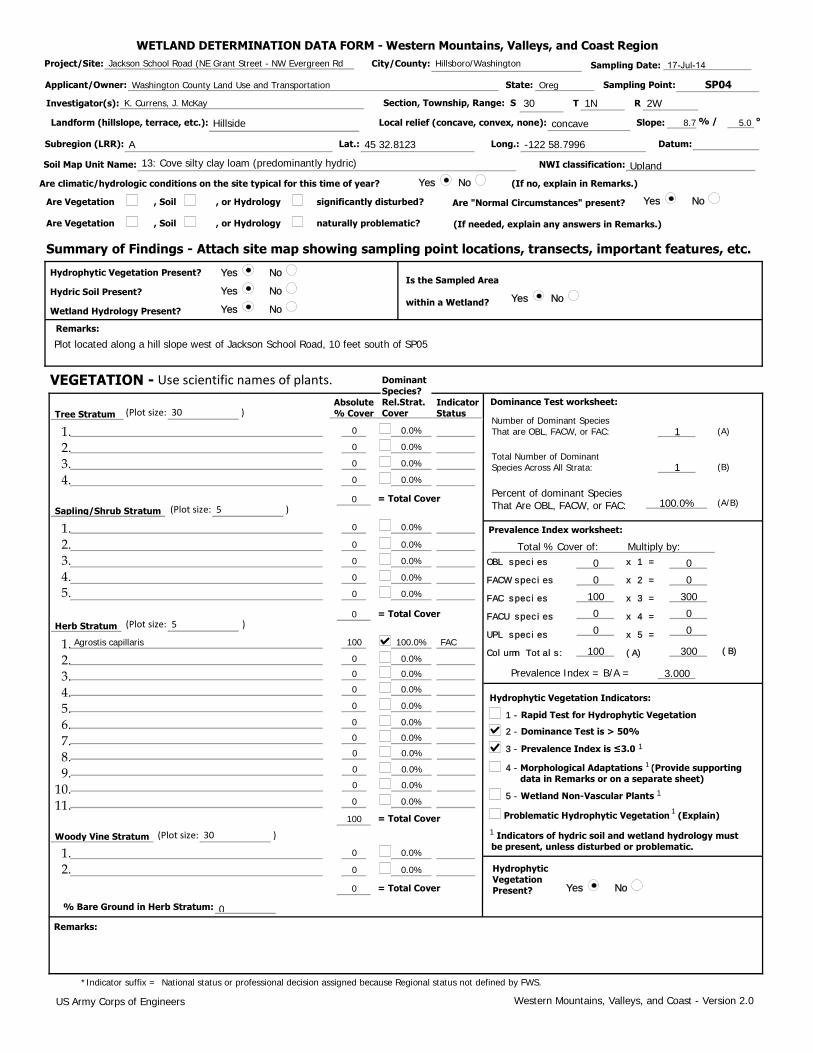
SP04
8.7 5.0
Yes No
Yes No
Yes No
Yes No
Yes NoYes No
0
0
0
0
0
0
0
0
0
100
0
0
0
0
0
0
0
0
0
0
0
0
Yes No
10.0%
0.0%
10.0%
0.0%
100.0%0
0.0%
0.0%
0.0% 0 00.0% 0 00.0% 100 300
0 00
0 0100.0% FAC
100 3000.0%
3.0000.0%
0.0%
0.0%
0.0%
0.0%
0.0%
0.0%
0.0%
100
0.0%
0.0%
0
, or Hydrology
Prevalence Index = B/A =
1.2.3.4.
(A/B)
Project/Site:
Wetland Hydrology Present?
Applicant/Owner:
1.2.3.4.5.
Sampling Date:
Lat.: Long.:
Sampling Point:
Investigator(s):
= Total Cover
% Bare Ground in Herb Stratum:
Landform (hillslope, terrace, etc.):
T
Number of Dominant SpeciesThat are OBL, FACW, or FAC:
1.2.
Remarks:
OBL species
FACW species
FAC species
FACU species
UPL species
Column Totals:
x 1 =
x 2 =
x 3 =
x 4 =
x 5 =
(A)
(A)
Are Vegetation
(B)
Are "Normal Circumstances" present?
1.2.3.4.5.6.7.8.9.10.11.
Soil Map Unit Name:
Datum:
Are climatic/hydrologic conditions on the site typical for this time of year?
Hydrophytic Vegetation Present?
NWI classification:
Remarks:
Tree Stratum
Sapling/Shrub Stratum
*Indicator suffix = National status or professional decision assigned because Regional status not defined by FWS.
R
Absolute% Cover
Are Vegetation
Section, Township, Range: S
significantly disturbed?
Is the Sampled Area
within a Wetland?
Local relief (concave, convex, none):
naturally problematic?
Slope:
(If needed, explain any answers in Remarks.)
, Soil
Summary of Findings - Attach site map showing sampling point locations, transects, important features, etc.
% /
, Soil
Hydric Soil Present?
Western Mountains, Valleys, and Coast - Version 2.0
Woody Vine Stratum
(B)
Herb Stratum
= Total Cover
Subregion (LRR):
IndicatorStatus
°
= Total Cover
= Total Cover
HydrophyticVegetationPresent?
US Army Corps of Engineers
(If no, explain in Remarks.)
Dominance Test worksheet:
City/County:
Percent of dominant SpeciesThat Are OBL, FACW, or FAC:
Total Number of DominantSpecies Across All Strata:
Prevalence Index worksheet:
State:
Total % Cover of: Multiply by:
, or Hydrology
DominantSpecies?Rel.Strat.Cover
Plot located along a hill slope west of Jackson School Road, 10 feet south of SP05
0 0.0%
WETLAND DETERMINATION DATA FORM - Western Mountains, Valleys, and Coast Region
17-Jul-14Jackson School Road (NE Grant Street - NW Evergreen Rd Hillsboro/Washington
Washington County Land Use and Transportation Oreg
2W1N30K. Currens, J. McKay
Hillside concave
-122 58.799645 32.8123A
13: Cove silty clay loam (predominantly hydric) Upland
Agrostis capillaris
(Plot size: 30
(Plot size: 5
(Plot size: 5
(Plot size: 30
)
)
)
)
VEGETATION - Use scientific names of plants.
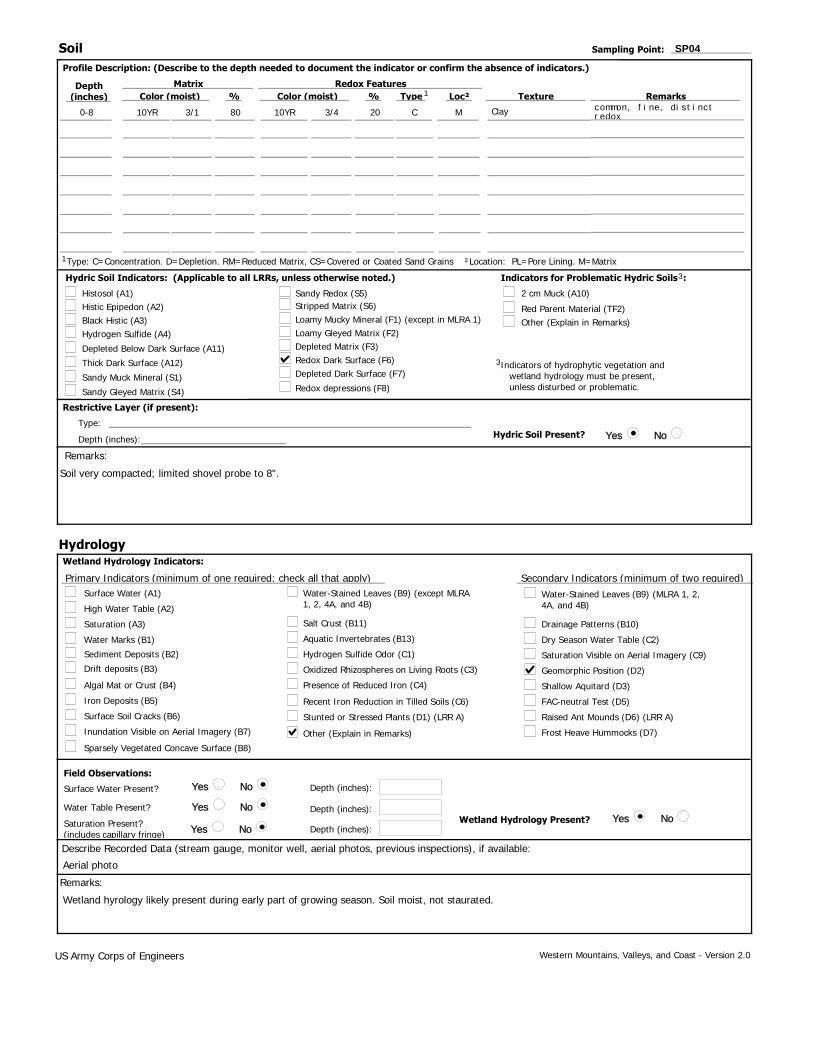
Soil very compacted; limited shovel probe to 8".
SP04
Wetland hyrology likely present during early part of growing season. Soil moist, not staurated.
Soil Sampling Point:
Profile Description: (Describe to the depth needed to document the indicator or confirm the absence of indicators.)
Type: C=Concentration. D=Depletion. RM=Reduced Matrix, CS=Covered or Coated Sand Grains ²Location: PL=Pore Lining. M=Matrix
Yes No
Yes No
Yes No
Yes NoYes No
Hydric Soil Indicators: (Applicable to all LRRs, unless otherwise noted.) Indicators for Problematic Hydric Soils :
Restrictive Layer (if present):
Hydric Soil Present?
Indicators of hydrophytic vegetation and wetland hydrology must be present, unless disturbed or problematic.
Histosol (A1)Histic Epipedon (A2)Black Histic (A3)Hydrogen Sulfide (A4)
Depleted Below Dark Surface (A11)
Thick Dark Surface (A12)
Sandy Muck Mineral (S1)
Sandy Redox (S5)Stripped Matrix (S6)Loamy Mucky Mineral (F1) (except in MLRA 1)Loamy Gleyed Matrix (F2)Depleted Matrix (F3)Redox Dark Surface (F6)Depleted Dark Surface (F7)
Redox depressions (F8)
2 cm Muck (A10)
Other (Explain in Remarks)
Type:
Depth (inches):
Hydrology
Remarks:
Surface Water (A1)
High Water Table (A2)
Saturation (A3)
Water Marks (B1)
Sediment Deposits (B2)
Drift deposits (B3)
Algal Mat or Crust (B4)
Iron Deposits (B5)
Inundation Visible on Aerial Imagery (B7)
Salt Crust (B11)
Dry Season Water Table (C2)Aquatic Invertebrates (B13)
Hydrogen Sulfide Odor (C1)
Oxidized Rhizospheres on Living Roots (C3)
Presence of Reduced Iron (C4)
Recent Iron Reduction in Tilled Soils (C6)
Other (Explain in Remarks)
Surface Soil Cracks (B6)
Sparsely Vegetated Concave Surface (B8)
Drainage Patterns (B10)
Frost Heave Hummocks (D7)
Stunted or Stressed Plants (D1) (LRR A)
Saturation Visible on Aerial Imagery (C9)
Geomorphic Position (D2)
FAC-neutral Test (D5)
Primary Indicators (minimum of one required; check all that apply)
Wetland Hydrology Indicators:
Field Observations:
Surface Water Present?
Water Table Present?
Saturation Present?(includes capillary fringe)
Depth (inches):
Depth (inches):
Depth (inches):Wetland Hydrology Present?
Describe Recorded Data (stream gauge, monitor well, aerial photos, previous inspections), if available:
Remarks:
US Army Corps of Engineers Western Mountains, Valleys, and Coast - Version 2.0
Secondary Indicators (minimum of two required)
Aerial photo
Water-Stained Leaves (B9) (except MLRA 1, 2, 4A, and 4B)
Sandy Gleyed Matrix (S4)
Red Parent Material (TF2)
Water-Stained Leaves (B9) (MLRA 1, 2, 4A, and 4B)
Shallow Aquitard (D3)
Raised Ant Mounds (D6) (LRR A)
3
3
1
Profile Description: (Describe to the depth needed to document the indicator or confirm the absence of indicators.)
Depth(inches) Color (moist) Color (moist)
Matrix Redox Features% Loc² Texture RemarksType%
common, fine, distinct redox
1
0-8 10YR 3/1 80 10YR 3/4 20 C M Clay
2 -
3 -
4 -
5 - Wetland Non-Vascular Plants
Indicators of hydric soil and wetland hydrology mustbe present, unless disturbed or problematic.
Hydrophytic Vegetation Indicators:
Dominance Test is > 50%
Prevalence Index is ≤3.0 1
1
1
Morphological Adaptations (Provide supporting data in Remarks or on a separate sheet)
Problematic Hydrophytic Vegetation (Explain)
1
1
1 - Rapid Test for Hydrophytic Vegetation
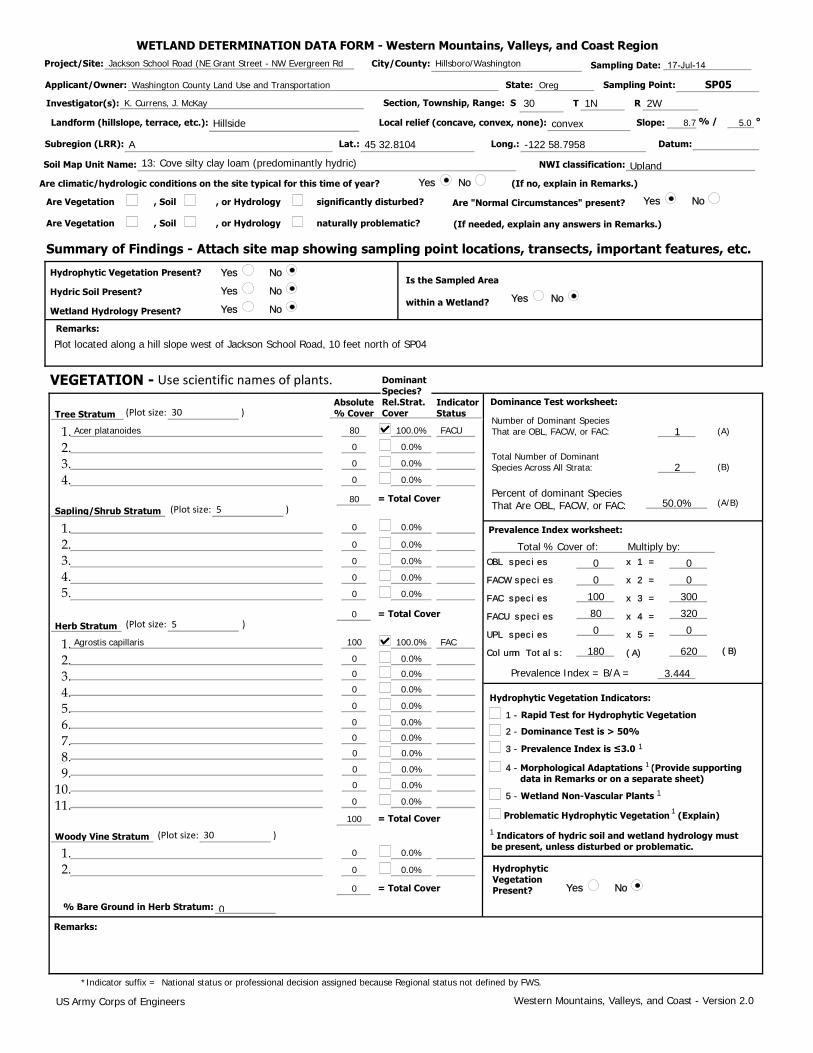
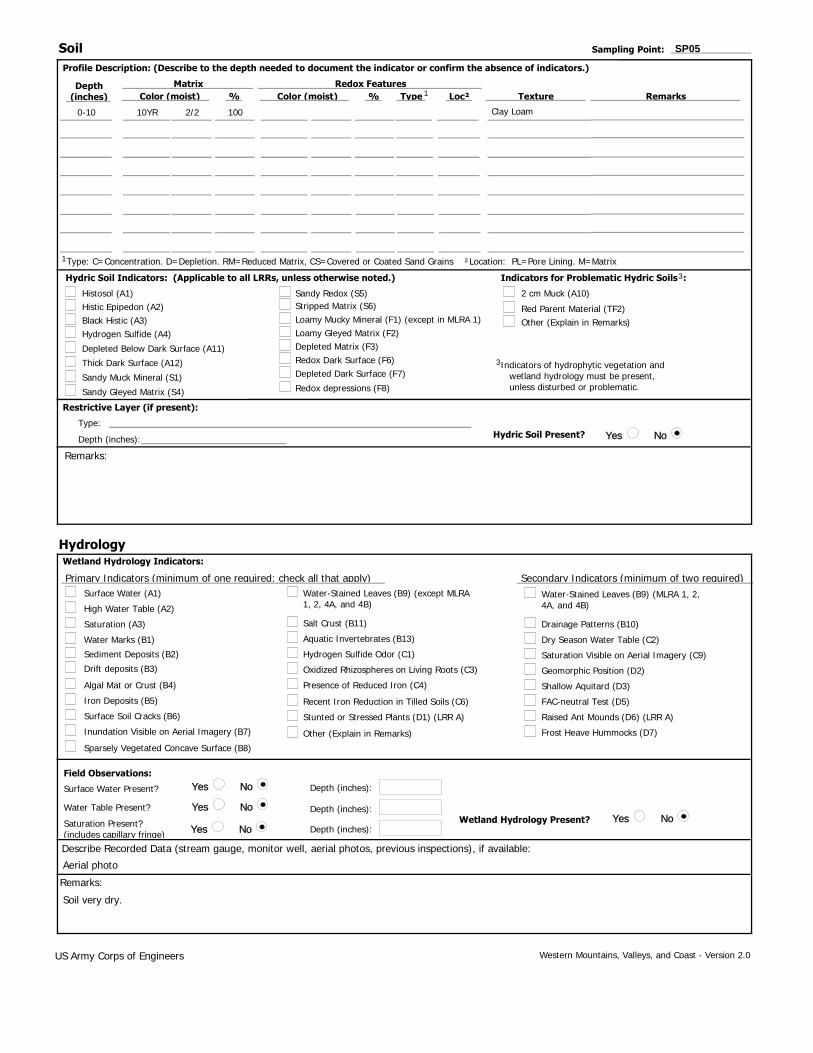
SP05
8.7 5.0
Yes No
Yes No
Yes No
Yes No
Yes NoYes No
80
0
0
0
0
0
0
0
0
100
0
0
0
0
0
0
0
0
0
0
0
0
Yes No
1100.0% FACU
0.0%
20.0%
0.0%
50.0%80
0.0%
0.0%
0.0% 0 00.0% 0 00.0% 100 300
80 3200
0 0100.0% FAC
180 6200.0%
3.4440.0%
0.0%
0.0%
0.0%
0.0%
0.0%
0.0%
0.0%
100
0.0%
0.0%
0
, or Hydrology
Prevalence Index = B/A =
1.2.3.4.
(A/B)
Project/Site:
Wetland Hydrology Present?
Applicant/Owner:
1.2.3.4.5.
Sampling Date:
Lat.: Long.:
Sampling Point:
Investigator(s):
= Total Cover
% Bare Ground in Herb Stratum:
Landform (hillslope, terrace, etc.):
T
Number of Dominant SpeciesThat are OBL, FACW, or FAC:
1.2.
Remarks:
OBL species
FACW species
FAC species
FACU species
UPL species
Column Totals:
x 1 =
x 2 =
x 3 =
x 4 =
x 5 =
(A)
(A)
Are Vegetation
(B)
Are "Normal Circumstances" present?
1.2.3.4.5.6.7.8.9.10.11.
Soil Map Unit Name:
Datum:
Are climatic/hydrologic conditions on the site typical for this time of year?
Hydrophytic Vegetation Present?
NWI classification:
Remarks:
Tree Stratum
Sapling/Shrub Stratum
*Indicator suffix = National status or professional decision assigned because Regional status not defined by FWS.
R
Absolute% Cover
Are Vegetation
Section, Township, Range: S
significantly disturbed?
Is the Sampled Area
within a Wetland?
Local relief (concave, convex, none):
naturally problematic?
Slope:
(If needed, explain any answers in Remarks.)
, Soil
Summary of Findings - Attach site map showing sampling point locations, transects, important features, etc.
% /
, Soil
Hydric Soil Present?
Western Mountains, Valleys, and Coast - Version 2.0
Woody Vine Stratum
(B)
Herb Stratum
= Total Cover
Subregion (LRR):
IndicatorStatus
°
= Total Cover
= Total Cover
HydrophyticVegetationPresent?
US Army Corps of Engineers
(If no, explain in Remarks.)
Dominance Test worksheet:
City/County:
Percent of dominant SpeciesThat Are OBL, FACW, or FAC:
Total Number of DominantSpecies Across All Strata:
Prevalence Index worksheet:
State:
Total % Cover of: Multiply by:
, or Hydrology
DominantSpecies?Rel.Strat.Cover
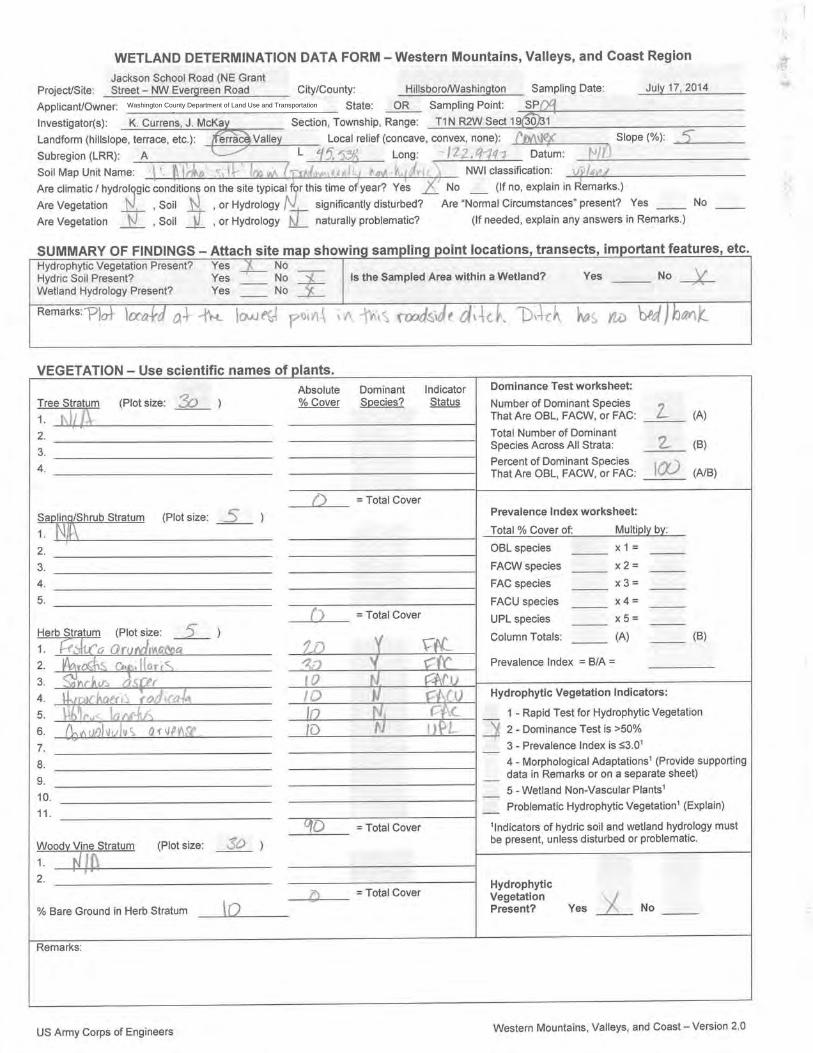
Plot located along a hill slope west of Jackson School Road, 10 feet north of SP04
0 0.0%
WETLAND DETERMINATION DATA FORM - Western Mountains, Valleys, and Coast Region
17-Jul-14Jackson School Road (NE Grant Street - NW Evergreen Rd Hillsboro/Washington
Washington County Land Use and Transportation Oreg
2W1N30K. Currens, J. McKay
Hillside convex
-122 58.795845 32.8104A
13: Cove silty clay loam (predominantly hydric) Upland
Acer platanoides
Agrostis capillaris
(Plot size: 30
(Plot size: 5
(Plot size: 5
(Plot size: 30
)
)
)
)
VEGETATION - Use scientific names of plants.
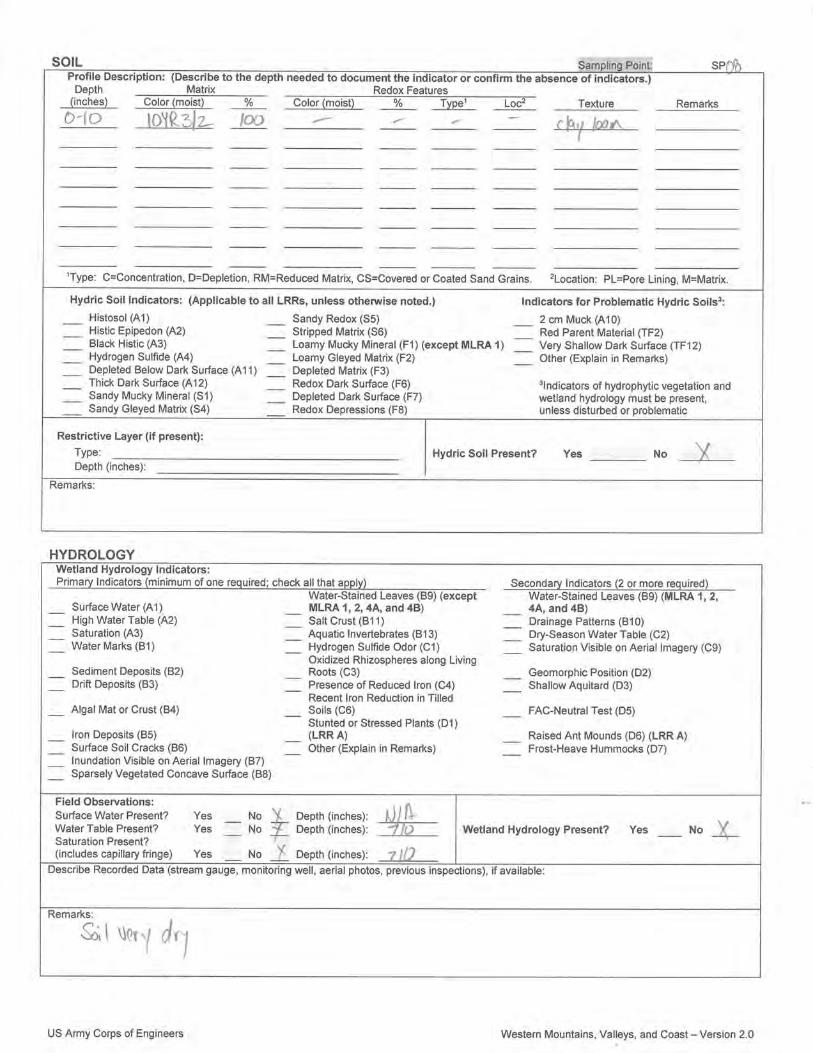
SP05
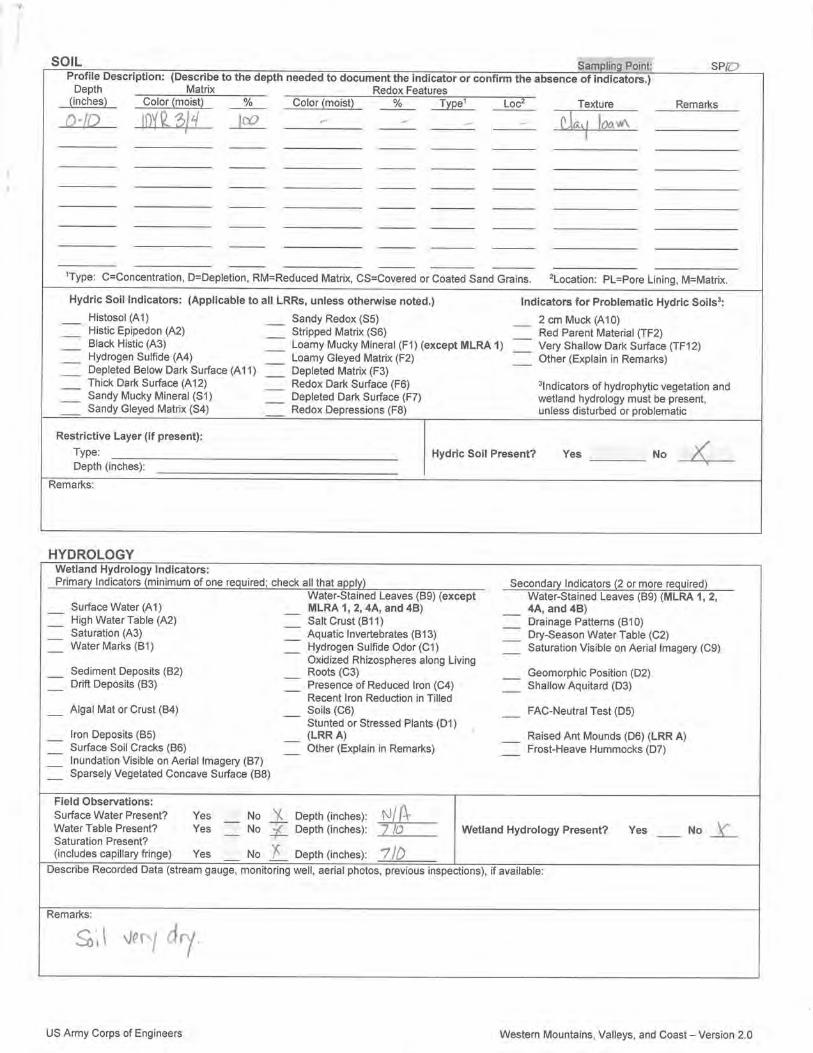
Soil very dry.
Soil Sampling Point:
Profile Description: (Describe to the depth needed to document the indicator or confirm the absence of indicators.)
Type: C=Concentration. D=Depletion. RM=Reduced Matrix, CS=Covered or Coated Sand Grains ²Location: PL=Pore Lining. M=Matrix
Yes No
Yes No
Yes No
Yes NoYes No
Hydric Soil Indicators: (Applicable to all LRRs, unless otherwise noted.) Indicators for Problematic Hydric Soils :
Restrictive Layer (if present):
Hydric Soil Present?
Indicators of hydrophytic vegetation and wetland hydrology must be present, unless disturbed or problematic.
Histosol (A1)Histic Epipedon (A2)Black Histic (A3)Hydrogen Sulfide (A4)
Depleted Below Dark Surface (A11)
Thick Dark Surface (A12)
Sandy Muck Mineral (S1)
Sandy Redox (S5)Stripped Matrix (S6)Loamy Mucky Mineral (F1) (except in MLRA 1)Loamy Gleyed Matrix (F2)Depleted Matrix (F3)Redox Dark Surface (F6)Depleted Dark Surface (F7)
Redox depressions (F8)
2 cm Muck (A10)
Other (Explain in Remarks)
Type:
Depth (inches):
Hydrology
Remarks:
Surface Water (A1)
High Water Table (A2)
Saturation (A3)
Water Marks (B1)
Sediment Deposits (B2)
Drift deposits (B3)
Algal Mat or Crust (B4)
Iron Deposits (B5)
Inundation Visible on Aerial Imagery (B7)
Salt Crust (B11)
Dry Season Water Table (C2)Aquatic Invertebrates (B13)
Hydrogen Sulfide Odor (C1)
Oxidized Rhizospheres on Living Roots (C3)
Presence of Reduced Iron (C4)
Recent Iron Reduction in Tilled Soils (C6)
Other (Explain in Remarks)
Surface Soil Cracks (B6)
Sparsely Vegetated Concave Surface (B8)
Drainage Patterns (B10)
Frost Heave Hummocks (D7)
Stunted or Stressed Plants (D1) (LRR A)
Saturation Visible on Aerial Imagery (C9)
Geomorphic Position (D2)
FAC-neutral Test (D5)
Primary Indicators (minimum of one required; check all that apply)
Wetland Hydrology Indicators:
Field Observations:
Surface Water Present?
Water Table Present?
Saturation Present?(includes capillary fringe)
Depth (inches):
Depth (inches):
Depth (inches):Wetland Hydrology Present?
Describe Recorded Data (stream gauge, monitor well, aerial photos, previous inspections), if available:
Remarks:
US Army Corps of Engineers Western Mountains, Valleys, and Coast - Version 2.0
Secondary Indicators (minimum of two required)
Aerial photo
Water-Stained Leaves (B9) (except MLRA 1, 2, 4A, and 4B)
Sandy Gleyed Matrix (S4)
Red Parent Material (TF2)
Water-Stained Leaves (B9) (MLRA 1, 2, 4A, and 4B)
Shallow Aquitard (D3)
Raised Ant Mounds (D6) (LRR A)
3
3
1
Profile Description: (Describe to the depth needed to document the indicator or confirm the absence of indicators.)
Depth(inches) Color (moist) Color (moist)
Matrix Redox Features% Loc² Texture RemarksType% 1
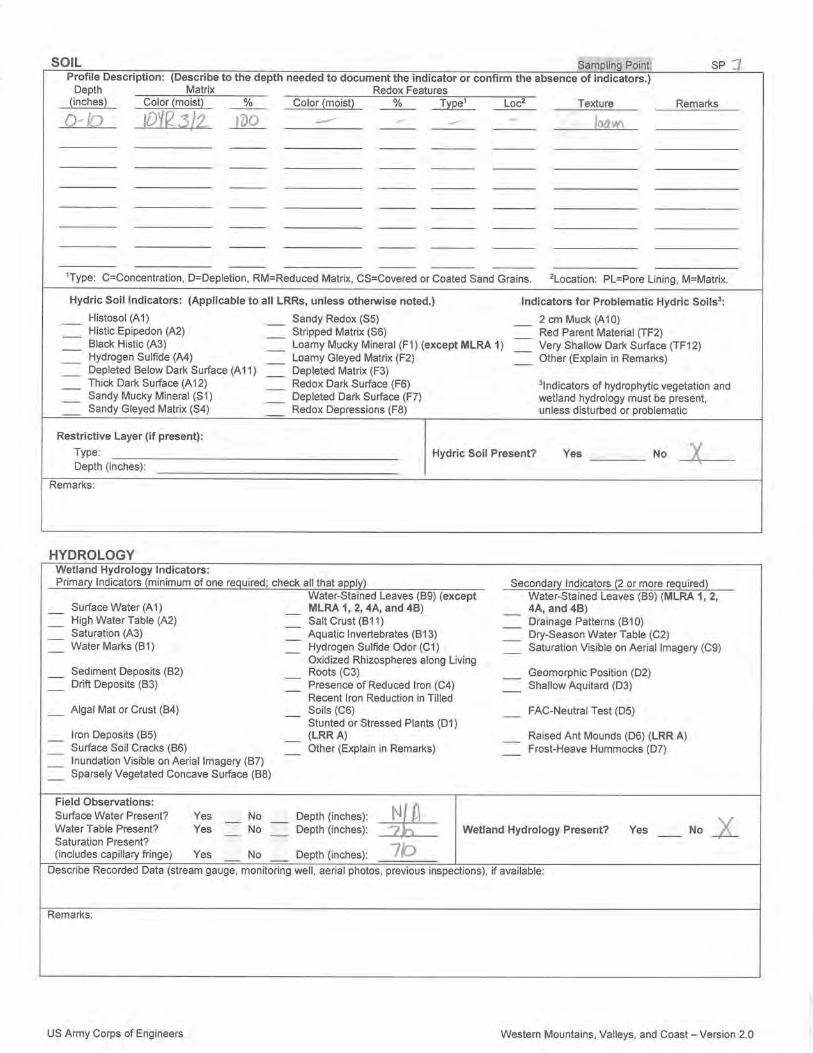
0-10 10YR 2/2 100 Clay Loam

Washington County Department of Land Use and Transportation
Washington County Department of Land Use and Transportation
Washington County Department of Land Use and Transportation
Washington County Department of Land Use and Transportation
Washington County Department of Land Use and Transportation
2 -
3 -
4 -
5 - Wetland Non-Vascular Plants
Indicators of hydric soil and wetland hydrology mustbe present, unless disturbed or problematic.
Hydrophytic Vegetation Indicators:
Dominance Test is > 50%
Prevalence Index is ≤3.0 1
1
1
Morphological Adaptations (Provide supporting data in Remarks or on a separate sheet)
Problematic Hydrophytic Vegetation (Explain)
1
1
1 - Rapid Test for Hydrophytic Vegetation
SP11
8.7 5.0
Yes No
Yes No
Yes No
Yes No
Yes NoYes No
0
0
0
0
0
0
0
0
0
80
10
5
5
0
0
0
0
0
0
0
0
0
Yes No
10.0%
0.0%
10.0%
0.0%
100.0%0
0.0%
0.0%
0.0% 0 00.0% 5 100.0% 95 285
0 00
0 080.0% FAC
100 29510.0% FAC
2.9505.0% FACW
5.0% FAC
0.0%
0.0%
0.0%
0.0%
0.0%
0.0%
100
0.0%
0.0%
0
, or Hydrology
Prevalence Index = B/A =
1.2.3.4.
(A/B)
Project/Site:
Wetland Hydrology Present?
Applicant/Owner:
1.2.3.4.5.
Sampling Date:
Lat.: Long.:
Sampling Point:
Investigator(s):
= Total Cover
% Bare Ground in Herb Stratum:
Landform (hillslope, terrace, etc.):
T
Number of Dominant SpeciesThat are OBL, FACW, or FAC:
1.2.
Remarks:
OBL species
FACW species
FAC species
FACU species
UPL species
Column Totals:
x 1 =
x 2 =
x 3 =
x 4 =
x 5 =
(A)
(A)
Are Vegetation
(B)
Are "Normal Circumstances" present?
1.2.3.4.5.6.7.8.9.10.11.
Soil Map Unit Name:
Datum:
Are climatic/hydrologic conditions on the site typical for this time of year?
Hydrophytic Vegetation Present?
NWI classification:
Remarks:
Tree Stratum
Sapling/Shrub Stratum
*Indicator suffix = National status or professional decision assigned because Regional status not defined by FWS.
R
Absolute% Cover
Are Vegetation
Section, Township, Range: S
significantly disturbed?
Is the Sampled Area
within a Wetland?
Local relief (concave, convex, none):
naturally problematic?
Slope:
(If needed, explain any answers in Remarks.)
, Soil
Summary of Findings - Attach site map showing sampling point locations, transects, important features, etc.
% /
, Soil
Hydric Soil Present?
Western Mountains, Valleys, and Coast - Version 2.0
Woody Vine Stratum
(B)
Herb Stratum
= Total Cover
Subregion (LRR):
IndicatorStatus
°
= Total Cover
= Total Cover
HydrophyticVegetationPresent?
US Army Corps of Engineers
(If no, explain in Remarks.)
Dominance Test worksheet:
City/County:
Percent of dominant SpeciesThat Are OBL, FACW, or FAC:
Total Number of DominantSpecies Across All Strata:
Prevalence Index worksheet:
State:
Total % Cover of: Multiply by:
, or Hydrology
DominantSpecies?Rel.Strat.Cover
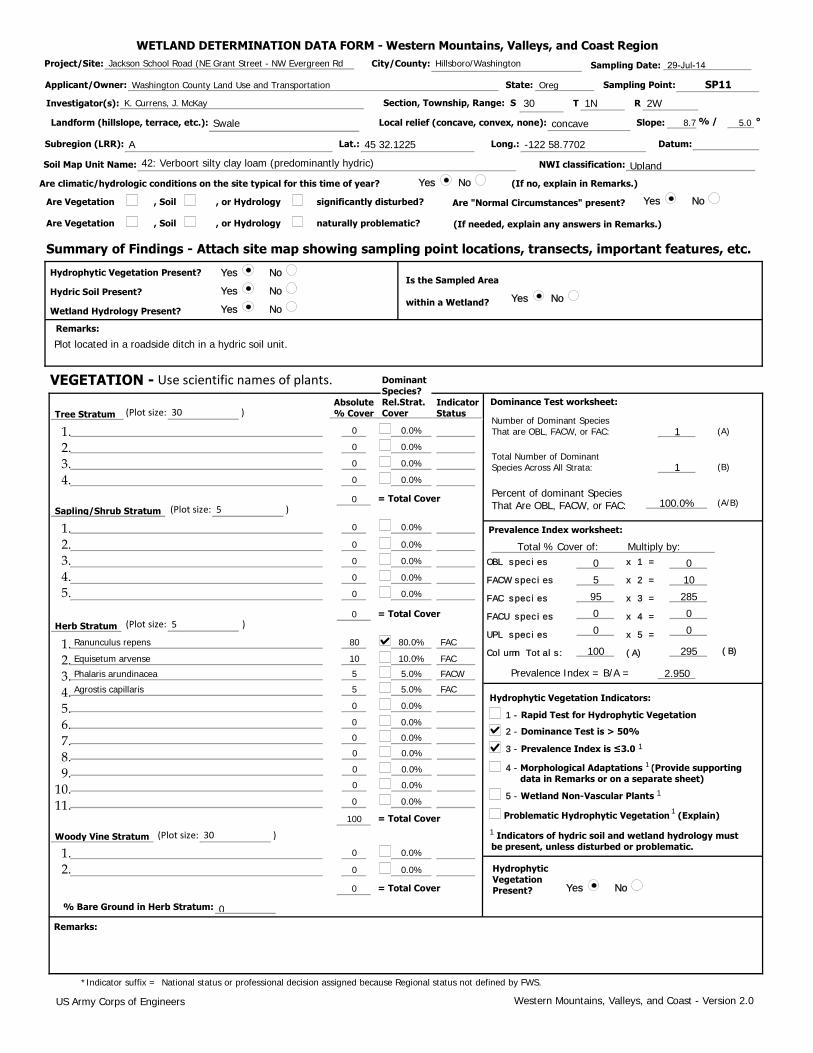
Plot located in a roadside ditch in a hydric soil unit.
0 0.0%
WETLAND DETERMINATION DATA FORM - Western Mountains, Valleys, and Coast Region
29-Jul-14Jackson School Road (NE Grant Street - NW Evergreen Rd Hillsboro/Washington
Washington County Land Use and Transportation Oreg
2W1N30K. Currens, J. McKay
Swale concave
-122 58.770245 32.1225A
42: Verboort silty clay loam (predominantly hydric) Upland
Ranunculus repens
Equisetum arvense
Phalaris arundinacea
Agrostis capillaris
(Plot size: 30
(Plot size: 5
(Plot size: 5
(Plot size: 30
)
)
)
)
VEGETATION - Use scientific names of plants.
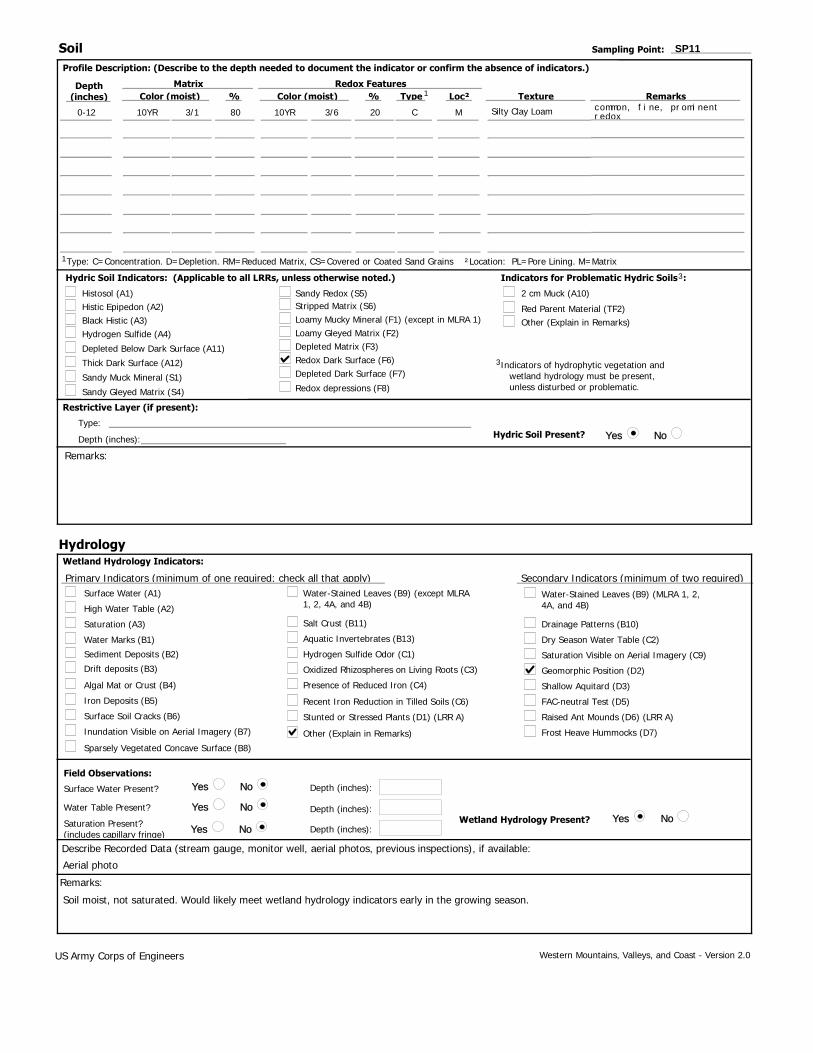
SP11
Soil moist, not saturated. Would likely meet wetland hydrology indicators early in the growing season.
Soil Sampling Point:
Profile Description: (Describe to the depth needed to document the indicator or confirm the absence of indicators.)
Type: C=Concentration. D=Depletion. RM=Reduced Matrix, CS=Covered or Coated Sand Grains ²Location: PL=Pore Lining. M=Matrix
Yes No
Yes No
Yes No
Yes NoYes No
Hydric Soil Indicators: (Applicable to all LRRs, unless otherwise noted.) Indicators for Problematic Hydric Soils :
Restrictive Layer (if present):
Hydric Soil Present?
Indicators of hydrophytic vegetation and wetland hydrology must be present, unless disturbed or problematic.
Histosol (A1)Histic Epipedon (A2)Black Histic (A3)Hydrogen Sulfide (A4)
Depleted Below Dark Surface (A11)
Thick Dark Surface (A12)
Sandy Muck Mineral (S1)
Sandy Redox (S5)Stripped Matrix (S6)Loamy Mucky Mineral (F1) (except in MLRA 1)Loamy Gleyed Matrix (F2)Depleted Matrix (F3)Redox Dark Surface (F6)Depleted Dark Surface (F7)
Redox depressions (F8)
2 cm Muck (A10)
Other (Explain in Remarks)
Type:
Depth (inches):
Hydrology
Remarks:
Surface Water (A1)
High Water Table (A2)
Saturation (A3)
Water Marks (B1)
Sediment Deposits (B2)
Drift deposits (B3)
Algal Mat or Crust (B4)
Iron Deposits (B5)
Inundation Visible on Aerial Imagery (B7)
Salt Crust (B11)
Dry Season Water Table (C2)Aquatic Invertebrates (B13)
Hydrogen Sulfide Odor (C1)
Oxidized Rhizospheres on Living Roots (C3)
Presence of Reduced Iron (C4)
Recent Iron Reduction in Tilled Soils (C6)
Other (Explain in Remarks)
Surface Soil Cracks (B6)
Sparsely Vegetated Concave Surface (B8)
Drainage Patterns (B10)
Frost Heave Hummocks (D7)
Stunted or Stressed Plants (D1) (LRR A)
Saturation Visible on Aerial Imagery (C9)
Geomorphic Position (D2)
FAC-neutral Test (D5)
Primary Indicators (minimum of one required; check all that apply)
Wetland Hydrology Indicators:
Field Observations:
Surface Water Present?
Water Table Present?
Saturation Present?(includes capillary fringe)
Depth (inches):
Depth (inches):
Depth (inches):Wetland Hydrology Present?
Describe Recorded Data (stream gauge, monitor well, aerial photos, previous inspections), if available:
Remarks:
US Army Corps of Engineers Western Mountains, Valleys, and Coast - Version 2.0
Secondary Indicators (minimum of two required)
Aerial photo
Water-Stained Leaves (B9) (except MLRA 1, 2, 4A, and 4B)
Sandy Gleyed Matrix (S4)
Red Parent Material (TF2)
Water-Stained Leaves (B9) (MLRA 1, 2, 4A, and 4B)
Shallow Aquitard (D3)
Raised Ant Mounds (D6) (LRR A)
3
3
1
Profile Description: (Describe to the depth needed to document the indicator or confirm the absence of indicators.)
Depth(inches) Color (moist) Color (moist)
Matrix Redox Features% Loc² Texture RemarksType%
common, fine, prominent redox
1
0-12 10YR 3/1 80 10YR 3/6 20 C M Silty Clay Loam
2 -
3 -
4 -
5 - Wetland Non-Vascular Plants
Indicators of hydric soil and wetland hydrology mustbe present, unless disturbed or problematic.
Hydrophytic Vegetation Indicators:
Dominance Test is > 50%
Prevalence Index is ≤3.0 1
1
1
Morphological Adaptations (Provide supporting data in Remarks or on a separate sheet)
Problematic Hydrophytic Vegetation (Explain)
1
1
1 - Rapid Test for Hydrophytic Vegetation
SP12
17.6 10.0
Yes No
Yes No
Yes No
Yes No
Yes NoYes No
10
0
0
0
0
0
0
0
0
60
20
10
0
0
0
0
0
0
0
0
0
10
Yes No
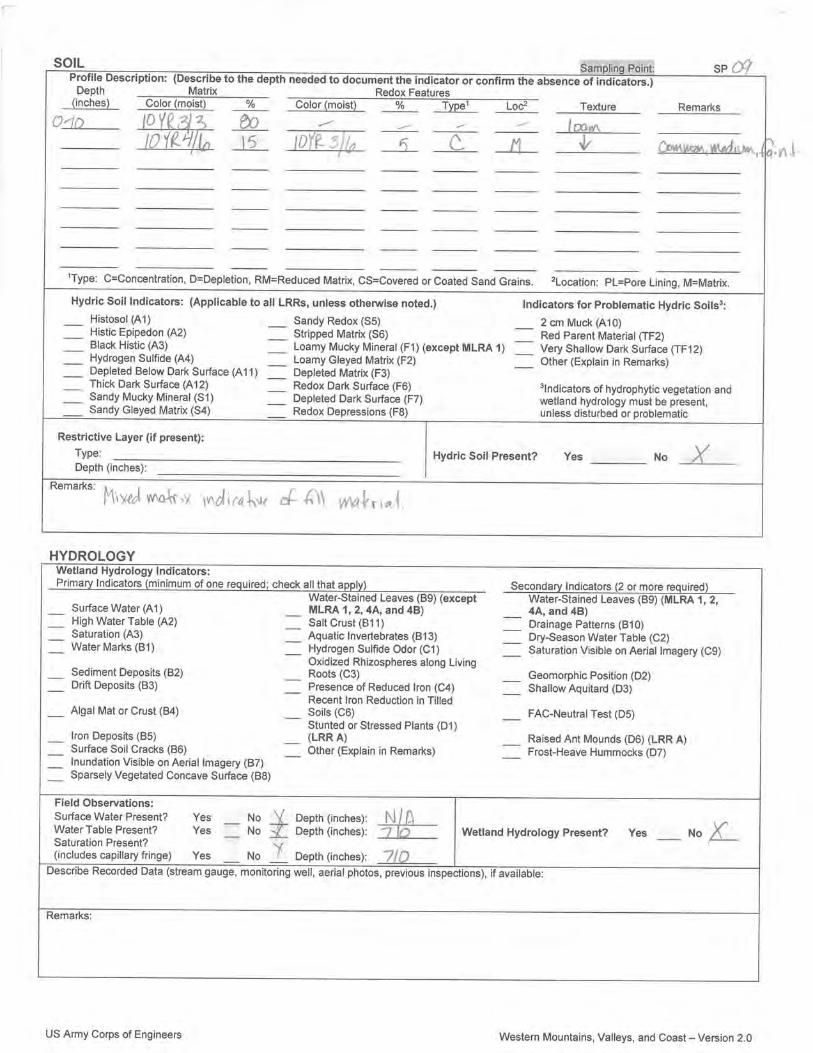
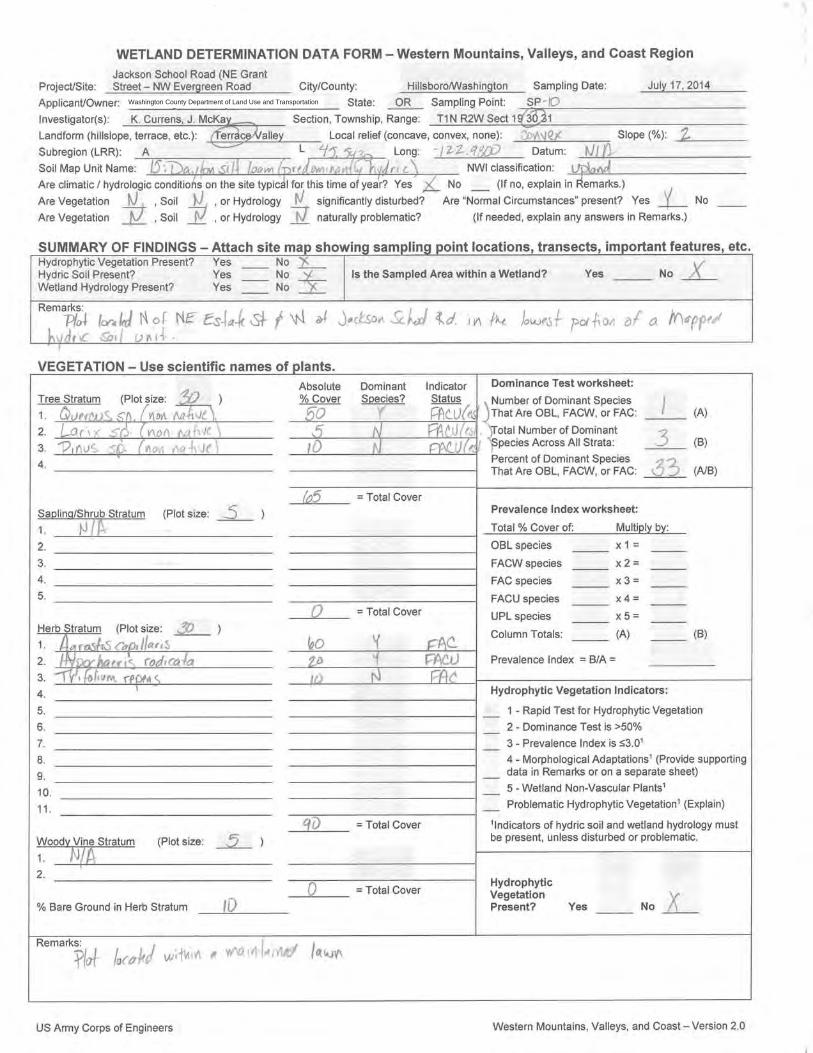
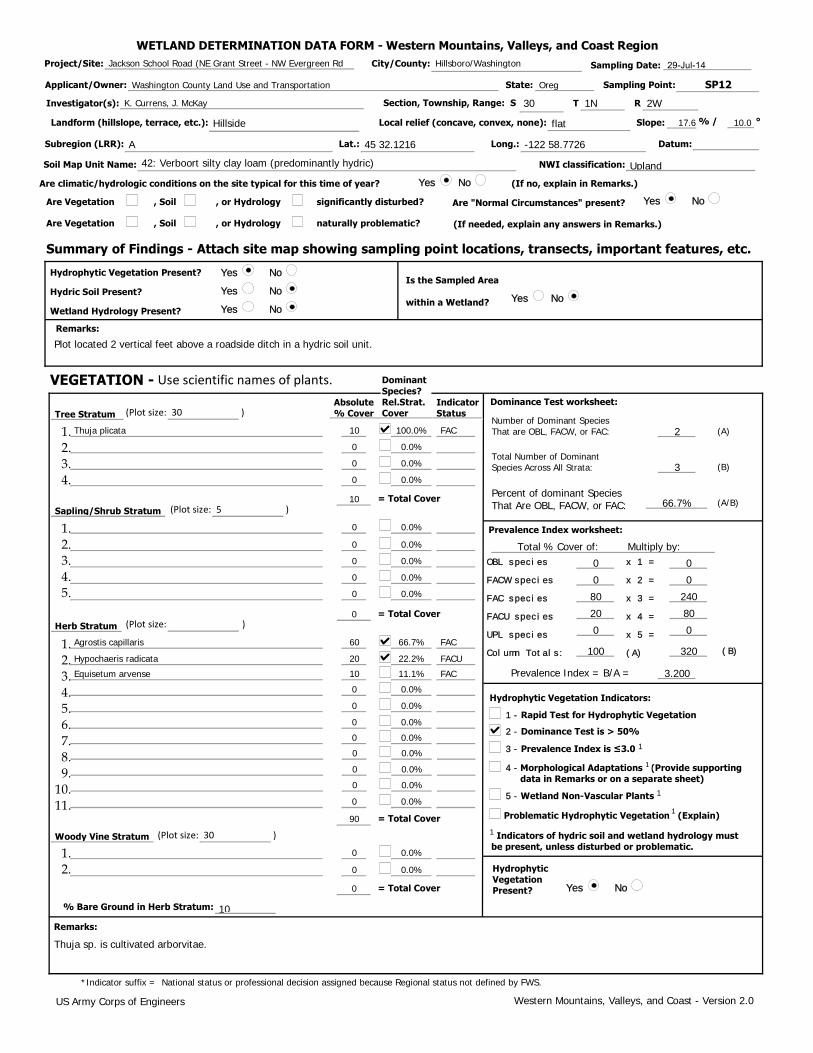
Thuja sp. is cultivated arborvitae.
2100.0% FAC
0.0%
30.0%
0.0%
66.7%10
0.0%
0.0%
0.0% 0 00.0% 0 00.0% 80 240
20 800
0 066.7% FAC
100 32022.2% FACU
3.20011.1% FAC
0.0%
0.0%
0.0%
0.0%
0.0%
0.0%
0.0%
90
0.0%
0.0%
0
, or Hydrology
Prevalence Index = B/A =
1.2.3.4.
(A/B)
Project/Site:
Wetland Hydrology Present?
Applicant/Owner:
1.2.3.4.5.
Sampling Date:
Lat.: Long.:
Sampling Point:
Investigator(s):
= Total Cover
% Bare Ground in Herb Stratum:
Landform (hillslope, terrace, etc.):
T
Number of Dominant SpeciesThat are OBL, FACW, or FAC:
1.2.
Remarks:
OBL species
FACW species
FAC species
FACU species
UPL species
Column Totals:
x 1 =
x 2 =
x 3 =
x 4 =
x 5 =
(A)
(A)
Are Vegetation
(B)
Are "Normal Circumstances" present?
1.2.3.4.5.6.7.8.9.10.11.
Soil Map Unit Name:
Datum:
Are climatic/hydrologic conditions on the site typical for this time of year?
Hydrophytic Vegetation Present?
NWI classification:
Remarks:
Tree Stratum
Sapling/Shrub Stratum
*Indicator suffix = National status or professional decision assigned because Regional status not defined by FWS.
R
Absolute% Cover
Are Vegetation
Section, Township, Range: S
significantly disturbed?
Is the Sampled Area
within a Wetland?
Local relief (concave, convex, none):
naturally problematic?
Slope:
(If needed, explain any answers in Remarks.)
, Soil
Summary of Findings - Attach site map showing sampling point locations, transects, important features, etc.
% /
, Soil
Hydric Soil Present?
Western Mountains, Valleys, and Coast - Version 2.0
Woody Vine Stratum
(B)
Herb Stratum
= Total Cover
Subregion (LRR):
IndicatorStatus
°
= Total Cover
= Total Cover
HydrophyticVegetationPresent?
US Army Corps of Engineers
(If no, explain in Remarks.)
Dominance Test worksheet:
City/County:
Percent of dominant SpeciesThat Are OBL, FACW, or FAC:
Total Number of DominantSpecies Across All Strata:
Prevalence Index worksheet:
State:
Total % Cover of: Multiply by:
, or Hydrology
DominantSpecies?Rel.Strat.Cover
Plot located 2 vertical feet above a roadside ditch in a hydric soil unit.
0 0.0%
WETLAND DETERMINATION DATA FORM - Western Mountains, Valleys, and Coast Region
29-Jul-14Jackson School Road (NE Grant Street - NW Evergreen Rd Hillsboro/Washington
Washington County Land Use and Transportation Oreg
2W1N30K. Currens, J. McKay
Hillside flat
-122 58.772645 32.1216A
42: Verboort silty clay loam (predominantly hydric) Upland
Thuja plicata
Agrostis capillaris
Hypochaeris radicata
Equisetum arvense
(Plot size: 30
(Plot size: 5
(Plot size:
(Plot size: 30
)
)
)
)
VEGETATION - Use scientific names of plants.

SP12Soil Sampling Point:
Profile Description: (Describe to the depth needed to document the indicator or confirm the absence of indicators.)
Type: C=Concentration. D=Depletion. RM=Reduced Matrix, CS=Covered or Coated Sand Grains ²Location: PL=Pore Lining. M=Matrix
Yes No
Yes No
Yes No
Yes NoYes No
Hydric Soil Indicators: (Applicable to all LRRs, unless otherwise noted.) Indicators for Problematic Hydric Soils :
Restrictive Layer (if present):
Hydric Soil Present?
Indicators of hydrophytic vegetation and wetland hydrology must be present, unless disturbed or problematic.
Histosol (A1)Histic Epipedon (A2)Black Histic (A3)Hydrogen Sulfide (A4)
Depleted Below Dark Surface (A11)
Thick Dark Surface (A12)
Sandy Muck Mineral (S1)
Sandy Redox (S5)Stripped Matrix (S6)Loamy Mucky Mineral (F1) (except in MLRA 1)Loamy Gleyed Matrix (F2)Depleted Matrix (F3)Redox Dark Surface (F6)Depleted Dark Surface (F7)
Redox depressions (F8)
2 cm Muck (A10)
Other (Explain in Remarks)
Type:
Depth (inches):
Hydrology
Remarks:
Surface Water (A1)
High Water Table (A2)
Saturation (A3)
Water Marks (B1)
Sediment Deposits (B2)
Drift deposits (B3)
Algal Mat or Crust (B4)
Iron Deposits (B5)
Inundation Visible on Aerial Imagery (B7)
Salt Crust (B11)
Dry Season Water Table (C2)Aquatic Invertebrates (B13)
Hydrogen Sulfide Odor (C1)
Oxidized Rhizospheres on Living Roots (C3)
Presence of Reduced Iron (C4)
Recent Iron Reduction in Tilled Soils (C6)
Other (Explain in Remarks)
Surface Soil Cracks (B6)
Sparsely Vegetated Concave Surface (B8)
Drainage Patterns (B10)
Frost Heave Hummocks (D7)
Stunted or Stressed Plants (D1) (LRR A)
Saturation Visible on Aerial Imagery (C9)
Geomorphic Position (D2)
FAC-neutral Test (D5)
Primary Indicators (minimum of one required; check all that apply)
Wetland Hydrology Indicators:
Field Observations:
Surface Water Present?
Water Table Present?
Saturation Present?(includes capillary fringe)
Depth (inches):
Depth (inches):
Depth (inches):Wetland Hydrology Present?
Describe Recorded Data (stream gauge, monitor well, aerial photos, previous inspections), if available:
Remarks:
US Army Corps of Engineers Western Mountains, Valleys, and Coast - Version 2.0
Secondary Indicators (minimum of two required)
Aerial photo
Water-Stained Leaves (B9) (except MLRA 1, 2, 4A, and 4B)
Sandy Gleyed Matrix (S4)
Red Parent Material (TF2)
Water-Stained Leaves (B9) (MLRA 1, 2, 4A, and 4B)
Shallow Aquitard (D3)
Raised Ant Mounds (D6) (LRR A)
3
3
1
Profile Description: (Describe to the depth needed to document the indicator or confirm the absence of indicators.)
Depth(inches) Color (moist) Color (moist)
Matrix Redox Features% Loc² Texture RemarksType% 1
0-12 10YR 4/4 100 Silty Clay Loam
2 -
3 -
4 -
5 - Wetland Non-Vascular Plants
Indicators of hydric soil and wetland hydrology mustbe present, unless disturbed or problematic.
Hydrophytic Vegetation Indicators:
Dominance Test is > 50%
Prevalence Index is ≤3.0 1
1
1
Morphological Adaptations (Provide supporting data in Remarks or on a separate sheet)
Problematic Hydrophytic Vegetation (Explain)
1
1
1 - Rapid Test for Hydrophytic Vegetation
SP13
17.6 10.0
Yes No
Yes No
Yes No
Yes No
Yes NoYes No
40
20
10
0
0
0
0
0
0
30
20
10
10
0
0
0
0
0
0
0
0
30
Yes No
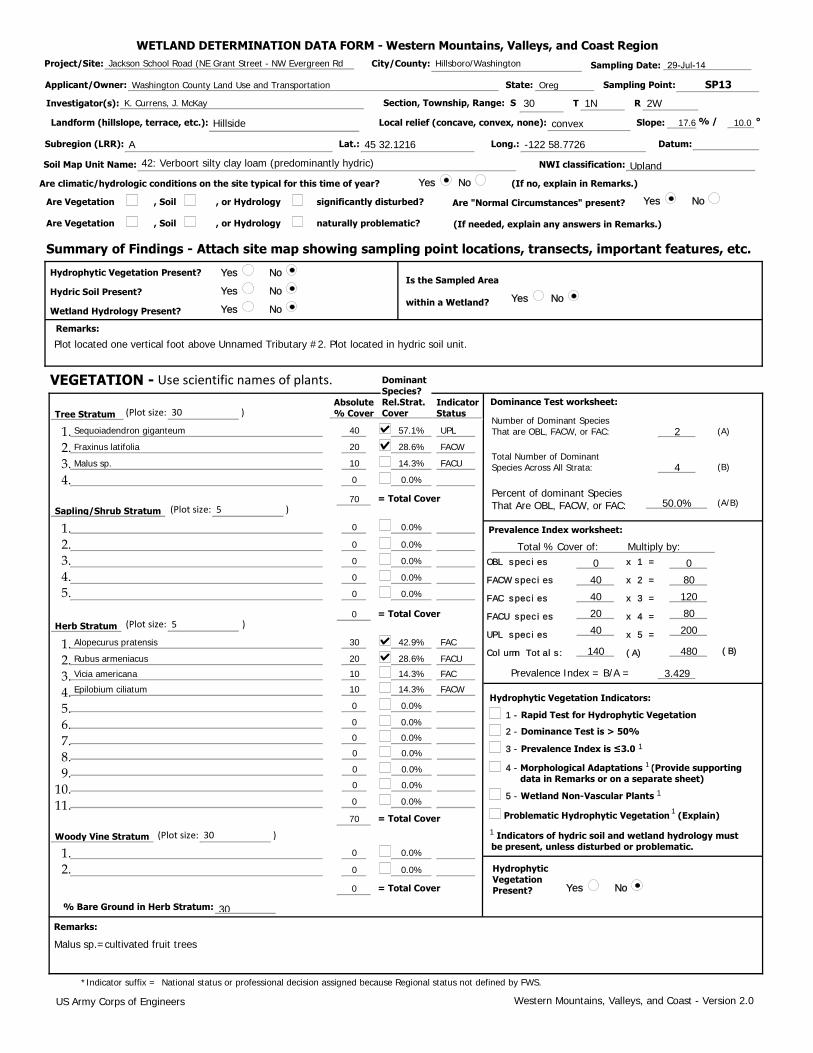
Malus sp.=cultivated fruit trees
257.1% UPL
28.6% FACW
414.3% FACU
0.0%
50.0%70
0.0%
0.0%
0.0% 0 00.0% 40 800.0% 40 120
20 800
40 20042.9% FAC
140 48028.6% FACU
3.42914.3% FAC
14.3% FACW
0.0%
0.0%
0.0%
0.0%
0.0%
0.0%
70
0.0%
0.0%
0
, or Hydrology
Prevalence Index = B/A =
1.2.3.4.
(A/B)
Project/Site:
Wetland Hydrology Present?
Applicant/Owner:
1.2.3.4.5.
Sampling Date:
Lat.: Long.:
Sampling Point:
Investigator(s):
= Total Cover
% Bare Ground in Herb Stratum:
Landform (hillslope, terrace, etc.):
T
Number of Dominant SpeciesThat are OBL, FACW, or FAC:
1.2.
Remarks:
OBL species
FACW species
FAC species
FACU species
UPL species
Column Totals:
x 1 =
x 2 =
x 3 =
x 4 =
x 5 =
(A)
(A)
Are Vegetation
(B)
Are "Normal Circumstances" present?
1.2.3.4.5.6.7.8.9.10.11.
Soil Map Unit Name:
Datum:
Are climatic/hydrologic conditions on the site typical for this time of year?
Hydrophytic Vegetation Present?
NWI classification:
Remarks:
Tree Stratum
Sapling/Shrub Stratum
*Indicator suffix = National status or professional decision assigned because Regional status not defined by FWS.
R
Absolute% Cover
Are Vegetation
Section, Township, Range: S
significantly disturbed?
Is the Sampled Area
within a Wetland?
Local relief (concave, convex, none):
naturally problematic?
Slope:
(If needed, explain any answers in Remarks.)
, Soil
Summary of Findings - Attach site map showing sampling point locations, transects, important features, etc.
% /
, Soil
Hydric Soil Present?
Western Mountains, Valleys, and Coast - Version 2.0
Woody Vine Stratum
(B)
Herb Stratum
= Total Cover
Subregion (LRR):
IndicatorStatus
°
= Total Cover
= Total Cover
HydrophyticVegetationPresent?
US Army Corps of Engineers
(If no, explain in Remarks.)
Dominance Test worksheet:
City/County:
Percent of dominant SpeciesThat Are OBL, FACW, or FAC:
Total Number of DominantSpecies Across All Strata:
Prevalence Index worksheet:
State:
Total % Cover of: Multiply by:
, or Hydrology
DominantSpecies?Rel.Strat.Cover
Plot located one vertical foot above Unnamed Tributary #2. Plot located in hydric soil unit.
0 0.0%
WETLAND DETERMINATION DATA FORM - Western Mountains, Valleys, and Coast Region
29-Jul-14Jackson School Road (NE Grant Street - NW Evergreen Rd Hillsboro/Washington
Washington County Land Use and Transportation Oreg
2W1N30K. Currens, J. McKay
Hillside convex
-122 58.772645 32.1216A
42: Verboort silty clay loam (predominantly hydric) Upland
Sequoiadendron giganteum
Fraxinus latifolia
Malus sp.
Alopecurus pratensis
Rubus armeniacus
Vicia americana
Epilobium ciliatum
(Plot size: 30
(Plot size: 5
(Plot size: 5
(Plot size: 30
)
)
)
)
VEGETATION - Use scientific names of plants.

SP13Soil Sampling Point:
Profile Description: (Describe to the depth needed to document the indicator or confirm the absence of indicators.)
Type: C=Concentration. D=Depletion. RM=Reduced Matrix, CS=Covered or Coated Sand Grains ²Location: PL=Pore Lining. M=Matrix
Yes No
Yes No
Yes No
Yes NoYes No
Hydric Soil Indicators: (Applicable to all LRRs, unless otherwise noted.) Indicators for Problematic Hydric Soils :
Restrictive Layer (if present):
Hydric Soil Present?
Indicators of hydrophytic vegetation and wetland hydrology must be present, unless disturbed or problematic.
Histosol (A1)Histic Epipedon (A2)Black Histic (A3)Hydrogen Sulfide (A4)
Depleted Below Dark Surface (A11)
Thick Dark Surface (A12)
Sandy Muck Mineral (S1)
Sandy Redox (S5)Stripped Matrix (S6)Loamy Mucky Mineral (F1) (except in MLRA 1)Loamy Gleyed Matrix (F2)Depleted Matrix (F3)Redox Dark Surface (F6)Depleted Dark Surface (F7)
Redox depressions (F8)
2 cm Muck (A10)
Other (Explain in Remarks)
Type:
Depth (inches):
Hydrology
Remarks:
Surface Water (A1)
High Water Table (A2)
Saturation (A3)
Water Marks (B1)
Sediment Deposits (B2)
Drift deposits (B3)
Algal Mat or Crust (B4)
Iron Deposits (B5)
Inundation Visible on Aerial Imagery (B7)
Salt Crust (B11)
Dry Season Water Table (C2)Aquatic Invertebrates (B13)
Hydrogen Sulfide Odor (C1)
Oxidized Rhizospheres on Living Roots (C3)
Presence of Reduced Iron (C4)
Recent Iron Reduction in Tilled Soils (C6)
Other (Explain in Remarks)
Surface Soil Cracks (B6)
Sparsely Vegetated Concave Surface (B8)
Drainage Patterns (B10)
Frost Heave Hummocks (D7)
Stunted or Stressed Plants (D1) (LRR A)
Saturation Visible on Aerial Imagery (C9)
Geomorphic Position (D2)
FAC-neutral Test (D5)
Primary Indicators (minimum of one required; check all that apply)
Wetland Hydrology Indicators:
Field Observations:
Surface Water Present?
Water Table Present?
Saturation Present?(includes capillary fringe)
Depth (inches):
Depth (inches):
Depth (inches):Wetland Hydrology Present?
Describe Recorded Data (stream gauge, monitor well, aerial photos, previous inspections), if available:
Remarks:
US Army Corps of Engineers Western Mountains, Valleys, and Coast - Version 2.0
Secondary Indicators (minimum of two required)
Aerial photo
Water-Stained Leaves (B9) (except MLRA 1, 2, 4A, and 4B)
Sandy Gleyed Matrix (S4)
Red Parent Material (TF2)
Water-Stained Leaves (B9) (MLRA 1, 2, 4A, and 4B)
Shallow Aquitard (D3)
Raised Ant Mounds (D6) (LRR A)
3
3
1
Profile Description: (Describe to the depth needed to document the indicator or confirm the absence of indicators.)
Depth(inches) Color (moist) Color (moist)
Matrix Redox Features% Loc² Texture RemarksType% 1
0-12 10YR 2/2 100 Silty Clay Loam
2 -
3 -
4 -
5 - Wetland Non-Vascular Plants
Indicators of hydric soil and wetland hydrology mustbe present, unless disturbed or problematic.
Hydrophytic Vegetation Indicators:
Dominance Test is > 50%
Prevalence Index is ≤3.0 1
1
1
Morphological Adaptations (Provide supporting data in Remarks or on a separate sheet)
Problematic Hydrophytic Vegetation (Explain)
1
1
1 - Rapid Test for Hydrophytic Vegetation
SP14
17.6 10.0
Yes No
Yes No
Yes No
Yes No
Yes NoYes No
80
5
0
0
0
0
0
0
0
30
10
10
0
0
0
0
0
0
0
0
0
50
Yes No
494.1% FACW
5.9% FACU
40.0%
0.0%
100.0%85
0.0%
0.0%
0.0% 0 00.0% 120 2400.0% 10 30
5 200
0 060.0% FACW
135 29020.0% FAC
2.14820.0% FACW
0.0%
0.0%
0.0%
0.0%
0.0%
0.0%
0.0%
50
0.0%
0.0%
0
, or Hydrology
Prevalence Index = B/A =
1.2.3.4.
(A/B)
Project/Site:
Wetland Hydrology Present?
Applicant/Owner:
1.2.3.4.5.
Sampling Date:
Lat.: Long.:
Sampling Point:
Investigator(s):
= Total Cover
% Bare Ground in Herb Stratum:
Landform (hillslope, terrace, etc.):
T
Number of Dominant SpeciesThat are OBL, FACW, or FAC:
1.2.
Remarks:
OBL species
FACW species
FAC species
FACU species
UPL species
Column Totals:
x 1 =
x 2 =
x 3 =
x 4 =
x 5 =
(A)
(A)
Are Vegetation
(B)
Are "Normal Circumstances" present?
1.2.3.4.5.6.7.8.9.10.11.
Soil Map Unit Name:
Datum:
Are climatic/hydrologic conditions on the site typical for this time of year?
Hydrophytic Vegetation Present?
NWI classification:
Remarks:
Tree Stratum
Sapling/Shrub Stratum
*Indicator suffix = National status or professional decision assigned because Regional status not defined by FWS.
R
Absolute% Cover
Are Vegetation
Section, Township, Range: S
significantly disturbed?
Is the Sampled Area
within a Wetland?
Local relief (concave, convex, none):
naturally problematic?
Slope:
(If needed, explain any answers in Remarks.)
, Soil
Summary of Findings - Attach site map showing sampling point locations, transects, important features, etc.
% /
, Soil
Hydric Soil Present?
Western Mountains, Valleys, and Coast - Version 2.0
Woody Vine Stratum
(B)
Herb Stratum
= Total Cover
Subregion (LRR):
IndicatorStatus
°
= Total Cover
= Total Cover
HydrophyticVegetationPresent?
US Army Corps of Engineers
(If no, explain in Remarks.)
Dominance Test worksheet:
City/County:
Percent of dominant SpeciesThat Are OBL, FACW, or FAC:
Total Number of DominantSpecies Across All Strata:
Prevalence Index worksheet:
State:
Total % Cover of: Multiply by:
, or Hydrology
DominantSpecies?Rel.Strat.Cover
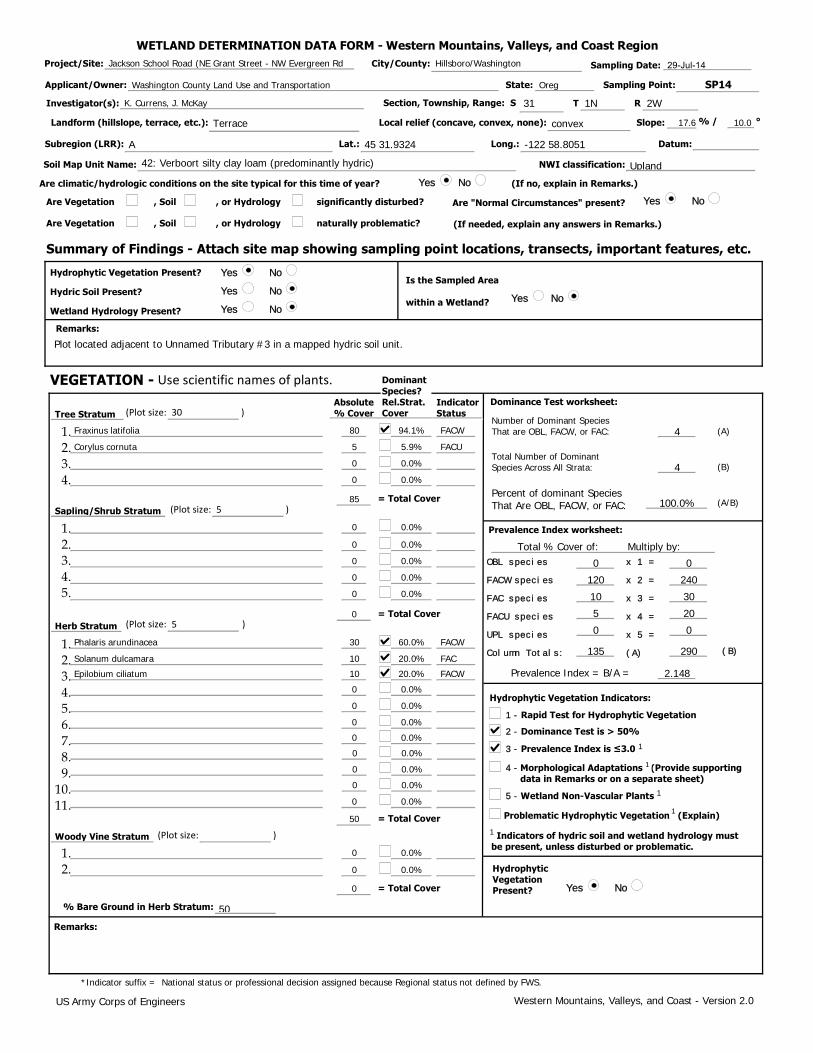
Plot located adjacent to Unnamed Tributary #3 in a mapped hydric soil unit.
0 0.0%
WETLAND DETERMINATION DATA FORM - Western Mountains, Valleys, and Coast Region
29-Jul-14Jackson School Road (NE Grant Street - NW Evergreen Rd Hillsboro/Washington
Washington County Land Use and Transportation Oreg
2W1N31K. Currens, J. McKay
Terrace convex
-122 58.805145 31.9324A
42: Verboort silty clay loam (predominantly hydric) Upland
Fraxinus latifolia
Corylus cornuta
Phalaris arundinacea
Solanum dulcamara
Epilobium ciliatum
(Plot size: 30
(Plot size: 5
(Plot size: 5
(Plot size:
)
)
)
)
VEGETATION - Use scientific names of plants.

SP14Soil Sampling Point:
Profile Description: (Describe to the depth needed to document the indicator or confirm the absence of indicators.)
Type: C=Concentration. D=Depletion. RM=Reduced Matrix, CS=Covered or Coated Sand Grains ²Location: PL=Pore Lining. M=Matrix
Yes No
Yes No
Yes No
Yes NoYes No
Hydric Soil Indicators: (Applicable to all LRRs, unless otherwise noted.) Indicators for Problematic Hydric Soils :
Restrictive Layer (if present):
Hydric Soil Present?
Indicators of hydrophytic vegetation and wetland hydrology must be present, unless disturbed or problematic.
Histosol (A1)Histic Epipedon (A2)Black Histic (A3)Hydrogen Sulfide (A4)
Depleted Below Dark Surface (A11)
Thick Dark Surface (A12)
Sandy Muck Mineral (S1)
Sandy Redox (S5)Stripped Matrix (S6)Loamy Mucky Mineral (F1) (except in MLRA 1)Loamy Gleyed Matrix (F2)Depleted Matrix (F3)Redox Dark Surface (F6)Depleted Dark Surface (F7)
Redox depressions (F8)
2 cm Muck (A10)
Other (Explain in Remarks)
Type:
Depth (inches):
Hydrology
Remarks:
Surface Water (A1)
High Water Table (A2)
Saturation (A3)
Water Marks (B1)
Sediment Deposits (B2)
Drift deposits (B3)
Algal Mat or Crust (B4)
Iron Deposits (B5)
Inundation Visible on Aerial Imagery (B7)
Salt Crust (B11)
Dry Season Water Table (C2)Aquatic Invertebrates (B13)
Hydrogen Sulfide Odor (C1)
Oxidized Rhizospheres on Living Roots (C3)
Presence of Reduced Iron (C4)
Recent Iron Reduction in Tilled Soils (C6)
Other (Explain in Remarks)
Surface Soil Cracks (B6)
Sparsely Vegetated Concave Surface (B8)
Drainage Patterns (B10)
Frost Heave Hummocks (D7)
Stunted or Stressed Plants (D1) (LRR A)
Saturation Visible on Aerial Imagery (C9)
Geomorphic Position (D2)
FAC-neutral Test (D5)
Primary Indicators (minimum of one required; check all that apply)
Wetland Hydrology Indicators:
Field Observations:
Surface Water Present?
Water Table Present?
Saturation Present?(includes capillary fringe)
Depth (inches):
Depth (inches):
Depth (inches):Wetland Hydrology Present?
Describe Recorded Data (stream gauge, monitor well, aerial photos, previous inspections), if available:
Remarks:
US Army Corps of Engineers Western Mountains, Valleys, and Coast - Version 2.0
Secondary Indicators (minimum of two required)
Aerial photo
Water-Stained Leaves (B9) (except MLRA 1, 2, 4A, and 4B)
Sandy Gleyed Matrix (S4)
Red Parent Material (TF2)
Water-Stained Leaves (B9) (MLRA 1, 2, 4A, and 4B)
Shallow Aquitard (D3)
Raised Ant Mounds (D6) (LRR A)
3
3
1
Profile Description: (Describe to the depth needed to document the indicator or confirm the absence of indicators.)
Depth(inches) Color (moist) Color (moist)
Matrix Redox Features% Loc² Texture RemarksType% 1
0-10 10YR 4/3 100 Sandy Clay Loam
2 -
3 -
4 -
5 - Wetland Non-Vascular Plants
Indicators of hydric soil and wetland hydrology mustbe present, unless disturbed or problematic.
Hydrophytic Vegetation Indicators:
Dominance Test is > 50%
Prevalence Index is ≤3.0 1
1
1
Morphological Adaptations (Provide supporting data in Remarks or on a separate sheet)
Problematic Hydrophytic Vegetation (Explain)
1
1
1 - Rapid Test for Hydrophytic Vegetation
SP15
8.7 5.0
Yes No
Yes No
Yes No
Yes No
Yes NoYes No
20
0
0
0
0
0
0
0
0
35
35
15
15
0
0
0
0
0
0
0
0
0
Yes No
2100.0% FAC
0.0%
30.0%
0.0%
66.7%20
0.0%
0.0%
0.0% 0 00.0% 0 00.0% 55 165
65 2600
0 035.0% FACU
120 42535.0% FAC
3.54215.0% FACU
15.0% FACU
0.0%
0.0%
0.0%
0.0%
0.0%
0.0%
100
0.0%
0.0%
0
, or Hydrology
Prevalence Index = B/A =
1.2.3.4.
(A/B)
Project/Site:
Wetland Hydrology Present?
Applicant/Owner:
1.2.3.4.5.
Sampling Date:
Lat.: Long.:
Sampling Point:
Investigator(s):
= Total Cover
% Bare Ground in Herb Stratum:
Landform (hillslope, terrace, etc.):
T
Number of Dominant SpeciesThat are OBL, FACW, or FAC:
1.2.
Remarks:
OBL species
FACW species
FAC species
FACU species
UPL species
Column Totals:
x 1 =
x 2 =
x 3 =
x 4 =
x 5 =
(A)
(A)
Are Vegetation
(B)
Are "Normal Circumstances" present?
1.2.3.4.5.6.7.8.9.10.11.
Soil Map Unit Name:
Datum:
Are climatic/hydrologic conditions on the site typical for this time of year?
Hydrophytic Vegetation Present?
NWI classification:
Remarks:
Tree Stratum
Sapling/Shrub Stratum
*Indicator suffix = National status or professional decision assigned because Regional status not defined by FWS.
R
Absolute% Cover
Are Vegetation
Section, Township, Range: S
significantly disturbed?
Is the Sampled Area
within a Wetland?
Local relief (concave, convex, none):
naturally problematic?
Slope:
(If needed, explain any answers in Remarks.)
, Soil
Summary of Findings - Attach site map showing sampling point locations, transects, important features, etc.
% /
, Soil
Hydric Soil Present?
Western Mountains, Valleys, and Coast - Version 2.0
Woody Vine Stratum
(B)
Herb Stratum
= Total Cover
Subregion (LRR):
IndicatorStatus
°
= Total Cover
= Total Cover
HydrophyticVegetationPresent?
US Army Corps of Engineers
(If no, explain in Remarks.)
Dominance Test worksheet:
City/County:
Percent of dominant SpeciesThat Are OBL, FACW, or FAC:
Total Number of DominantSpecies Across All Strata:
Prevalence Index worksheet:
State:
Total % Cover of: Multiply by:
, or Hydrology
DominantSpecies?Rel.Strat.Cover
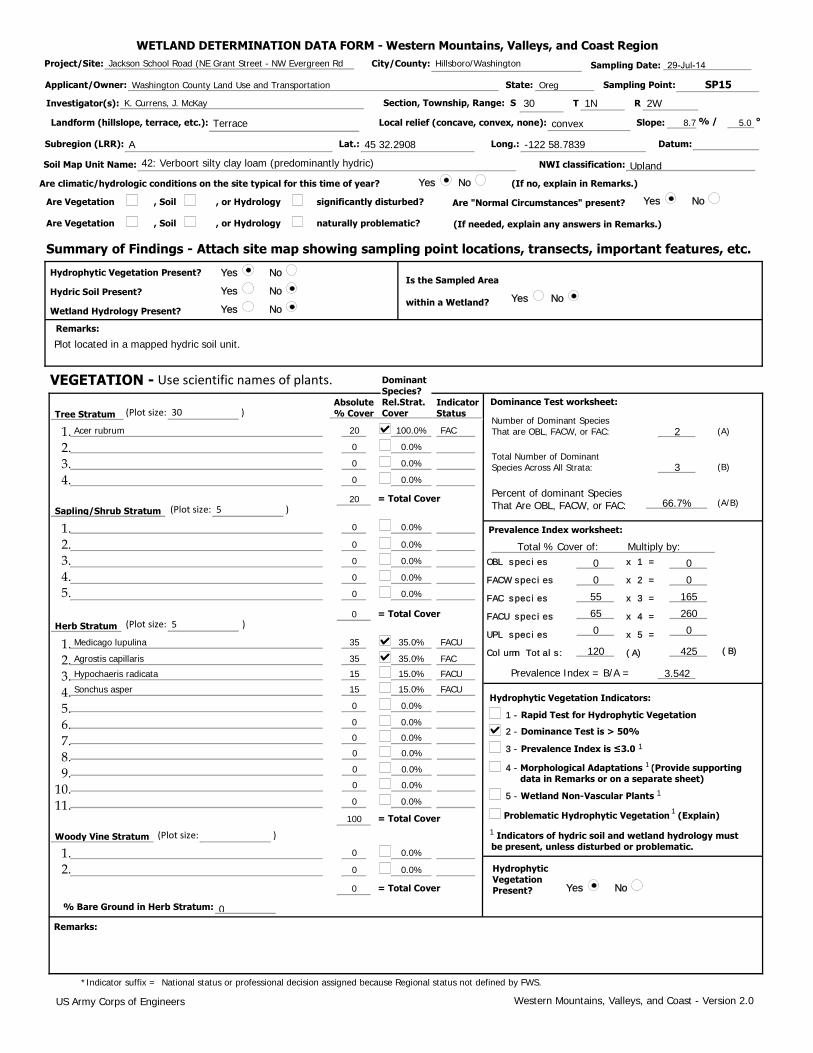
Plot located in a mapped hydric soil unit.
0 0.0%
WETLAND DETERMINATION DATA FORM - Western Mountains, Valleys, and Coast Region
29-Jul-14Jackson School Road (NE Grant Street - NW Evergreen Rd Hillsboro/Washington
Washington County Land Use and Transportation Oreg
2W1N30K. Currens, J. McKay
Terrace convex
-122 58.783945 32.2908A
42: Verboort silty clay loam (predominantly hydric) Upland
Acer rubrum
Medicago lupulina
Agrostis capillaris
Hypochaeris radicata
Sonchus asper
(Plot size: 30
(Plot size: 5
(Plot size: 5
(Plot size:
)
)
)
)
VEGETATION - Use scientific names of plants.
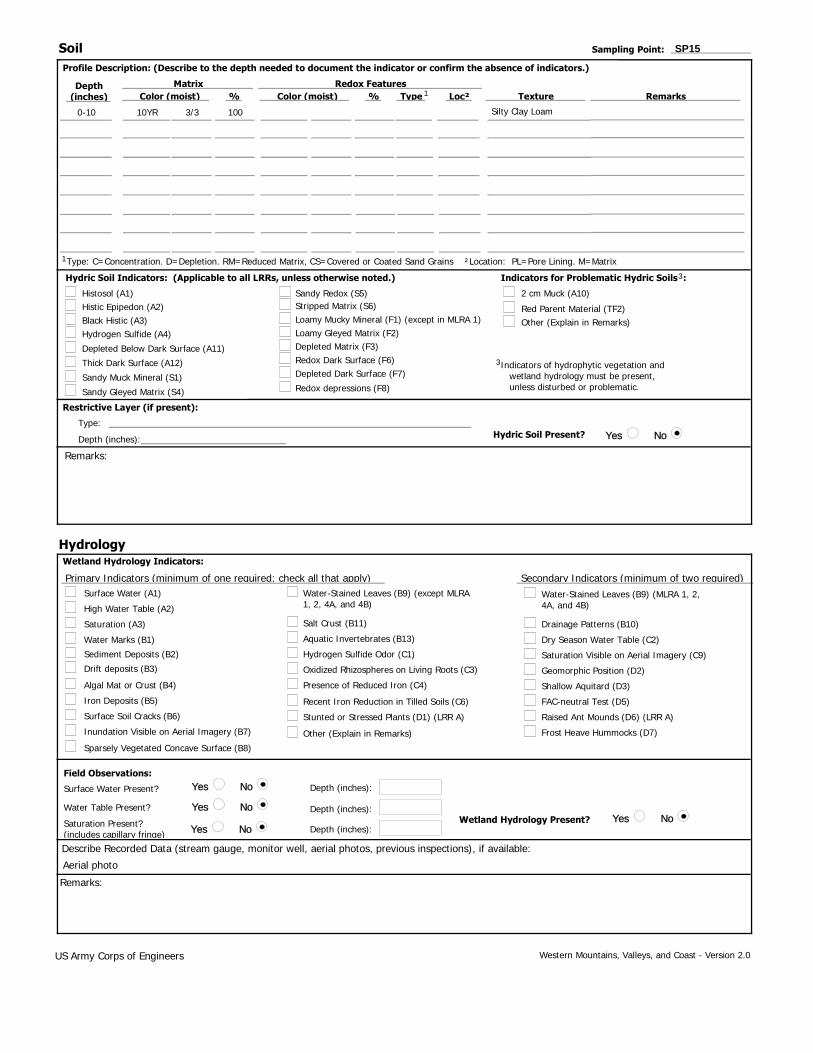
SP15Soil Sampling Point:
Profile Description: (Describe to the depth needed to document the indicator or confirm the absence of indicators.)
Type: C=Concentration. D=Depletion. RM=Reduced Matrix, CS=Covered or Coated Sand Grains ²Location: PL=Pore Lining. M=Matrix
Yes No
Yes No
Yes No
Yes NoYes No
Hydric Soil Indicators: (Applicable to all LRRs, unless otherwise noted.) Indicators for Problematic Hydric Soils :
Restrictive Layer (if present):
Hydric Soil Present?
Indicators of hydrophytic vegetation and wetland hydrology must be present, unless disturbed or problematic.
Histosol (A1)Histic Epipedon (A2)Black Histic (A3)Hydrogen Sulfide (A4)
Depleted Below Dark Surface (A11)
Thick Dark Surface (A12)
Sandy Muck Mineral (S1)
Sandy Redox (S5)Stripped Matrix (S6)Loamy Mucky Mineral (F1) (except in MLRA 1)Loamy Gleyed Matrix (F2)Depleted Matrix (F3)Redox Dark Surface (F6)Depleted Dark Surface (F7)
Redox depressions (F8)
2 cm Muck (A10)
Other (Explain in Remarks)
Type:
Depth (inches):
Hydrology
Remarks:
Surface Water (A1)
High Water Table (A2)
Saturation (A3)
Water Marks (B1)
Sediment Deposits (B2)
Drift deposits (B3)
Algal Mat or Crust (B4)
Iron Deposits (B5)
Inundation Visible on Aerial Imagery (B7)
Salt Crust (B11)
Dry Season Water Table (C2)Aquatic Invertebrates (B13)
Hydrogen Sulfide Odor (C1)
Oxidized Rhizospheres on Living Roots (C3)
Presence of Reduced Iron (C4)
Recent Iron Reduction in Tilled Soils (C6)
Other (Explain in Remarks)
Surface Soil Cracks (B6)
Sparsely Vegetated Concave Surface (B8)
Drainage Patterns (B10)
Frost Heave Hummocks (D7)
Stunted or Stressed Plants (D1) (LRR A)
Saturation Visible on Aerial Imagery (C9)
Geomorphic Position (D2)
FAC-neutral Test (D5)
Primary Indicators (minimum of one required; check all that apply)
Wetland Hydrology Indicators:
Field Observations:
Surface Water Present?
Water Table Present?
Saturation Present?(includes capillary fringe)
Depth (inches):
Depth (inches):
Depth (inches):Wetland Hydrology Present?
Describe Recorded Data (stream gauge, monitor well, aerial photos, previous inspections), if available:
Remarks:
US Army Corps of Engineers Western Mountains, Valleys, and Coast - Version 2.0
Secondary Indicators (minimum of two required)
Aerial photo
Water-Stained Leaves (B9) (except MLRA 1, 2, 4A, and 4B)
Sandy Gleyed Matrix (S4)
Red Parent Material (TF2)
Water-Stained Leaves (B9) (MLRA 1, 2, 4A, and 4B)
Shallow Aquitard (D3)
Raised Ant Mounds (D6) (LRR A)
3
3
1
Profile Description: (Describe to the depth needed to document the indicator or confirm the absence of indicators.)
Depth(inches) Color (moist) Color (moist)
Matrix Redox Features% Loc² Texture RemarksType% 1
0-10 10YR 3/3 100 Silty Clay Loam