west cambridge residential survey/media/files/cdd/... · west cambridge. residential survey. ......
TRANSCRIPT

1
West CambridgeResidential Survey
Prepared by Opinion Dynamics Corporation
October 2004

2
• The survey was conducted from June 24th to June 30th.• 400 residents of West Cambridge were surveyed over the telephone, using a random-digit
dialing method to ensure fair representation of the populace.• The margin of error on the full, 400-member sample is +/- 4.9% at the mid-range of the
95% confidence interval. That is, when conducting 100 such surveys, 95 of them will yield results that are-at worst-4.9 points on either side of a given percentage.
• Nearly two thirds of respondents (64%) are homeowners; 35% are renters.
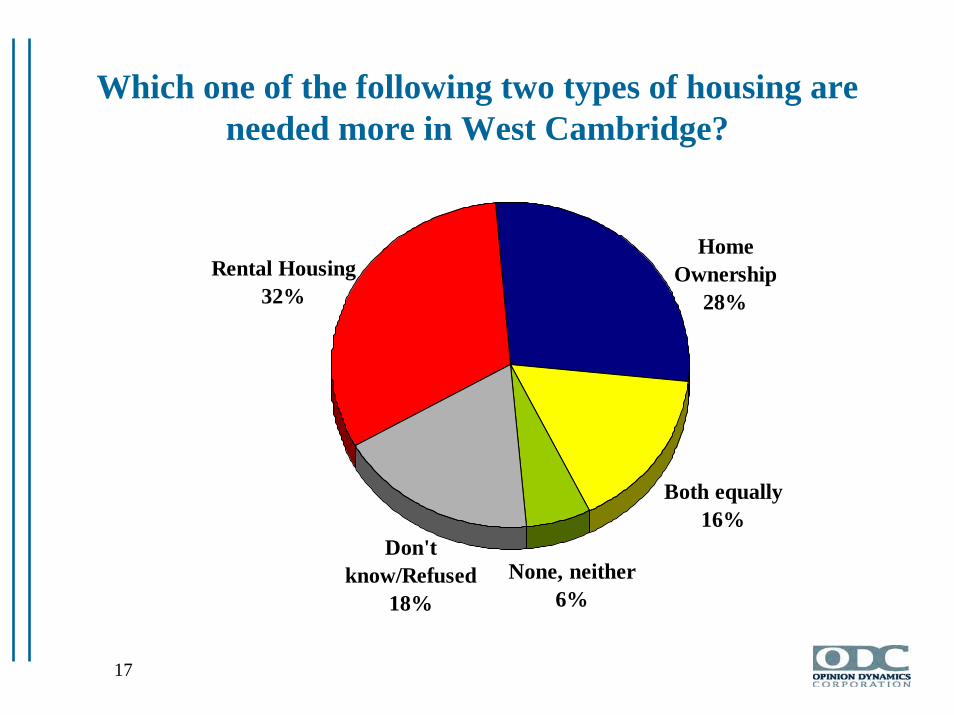
• Most (79%) would support low and moderate income housing. Respondents saw an equal need for more rental housing (32%) and more home ownership (28%) in Cambridge, 16% saw the need for both .
• Less than ten percent (8%) of the respondents believe that West Cambridge is a worse place to live than it was five years ago or that the quality of life will worsen five years from now (9%).
• Traffic (24%) and expense of living (18%) were listed as the aspects residents liked least about living in West Cambridge.
• Convenience to shops and resources (35%) and the parks and greenery (31%) were listed as the aspects residents liked most about living in West Cambridge.
• Seventy-one percent of respondents believe that West Cambridge is a good (37%) or excellent (34%) place to raise a child.
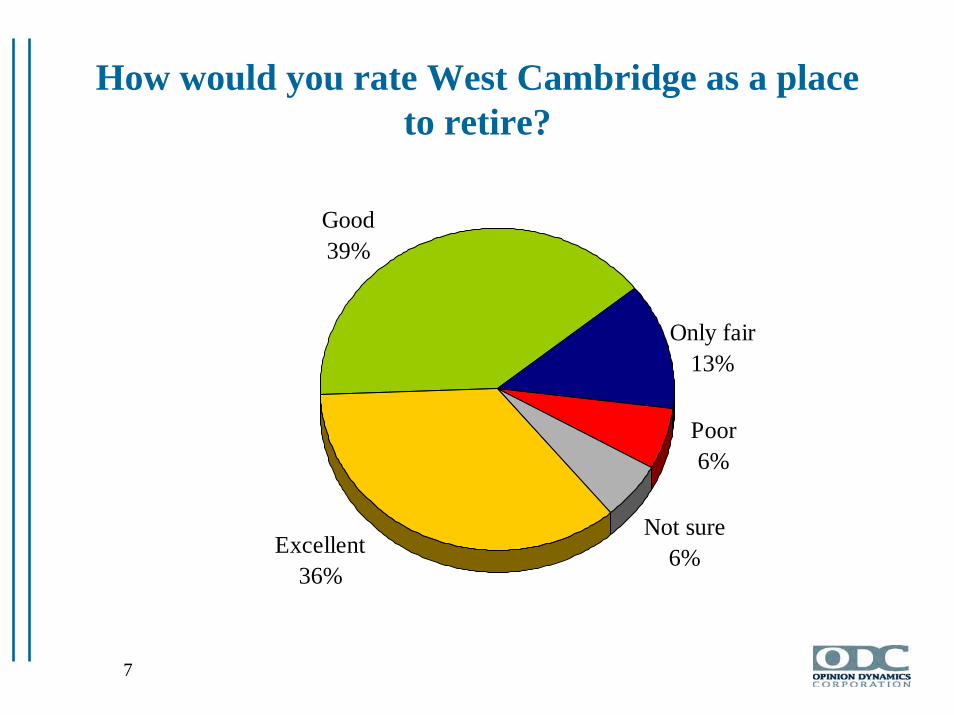
• Seventy-five percent of respondents believe that West Cambridge is a good (39%) or excellent (36%) place to retire.
• Seventy-two percent of renters, if they could buy a home anywhere, would buy a home in West Cambridge.
Executive summary

3
Methodology and Demographics
Employment Status HouseholdFull-time 52% Couple without children 34%Retired 24 Single, living alone 29Part-time 10 Couple with children 26Full-time student 6 Living with roommates 5Homemaker 4 Single parent 2Unemployed 3
School Completed Race/EthnicitySome high school 2% White/Caucasian 90%Graduated high school 7 Asian/Pacific Islander 5Some college/technical school 6 Black 2College/technical school degree 34 Latin/Hispanic 1 Post graduate or professional degree 50 Not sure/refused 3
AgeUnder 20 1%20 to 34 2035 to 44 1445 to 54 1355 to 64 2065 or older 29

4
How long have you lived in West Cambridge?
1 to 4 years24%
11 to 20 years17%
5 to 10 years22%
Less than 1 year4%
21 years or more33%

5
Compared with five years ago, how would you rate West Cambridge as a place to live?
Don't know12%
A worse place to live today
8%
About the same57%
A better place to live today
23%

6
How would you rate West Cambridge as a place to raise children?
Poor2%
Good37% Only fair
12%
Excellent34%
Not sure15%
7
How would you rate West Cambridge as a place to retire?
Poor6%
Good39%
Only fair13%
Excellent36%
Not sure6%

8
In the next five years, do you expect the quality of life in West Cambridge to improve greatly,
improve somewhat, stay the same or get worse?
Get worse9%
Improve somewhat
23%
Stay the same57%
Improve greatly4%
Don't know7%

9
10%
11%
15%
15%
18%
35%
21%
Public transportation
Proximity to Boston
Proximity to Harvard/Harvard Square
Q uiet
Friendly/good community
Parks/greenery
Convenient to shops/resources
What do you like most about living in West Cambridge?(multiple response)

10
4%
4%
4%
4%
6%
24%
18%
Sidewalk/roadconditions
Not enoughrestaurants/shops
People/not friendly
Less diversity
Noisy
Too expensive
Traffic/Parking
What do you like least about living in West Cambridge? (multiple response)
11
35%
38%
26%
24%
35%
30%
52%
46%
36%
44%
57%
34%
44%
45%
31%
34%
24%
27%
24%
21%
20%
17%
15%
34%
31%
29%
39%
19%
35%
42%
36%
32%
37%
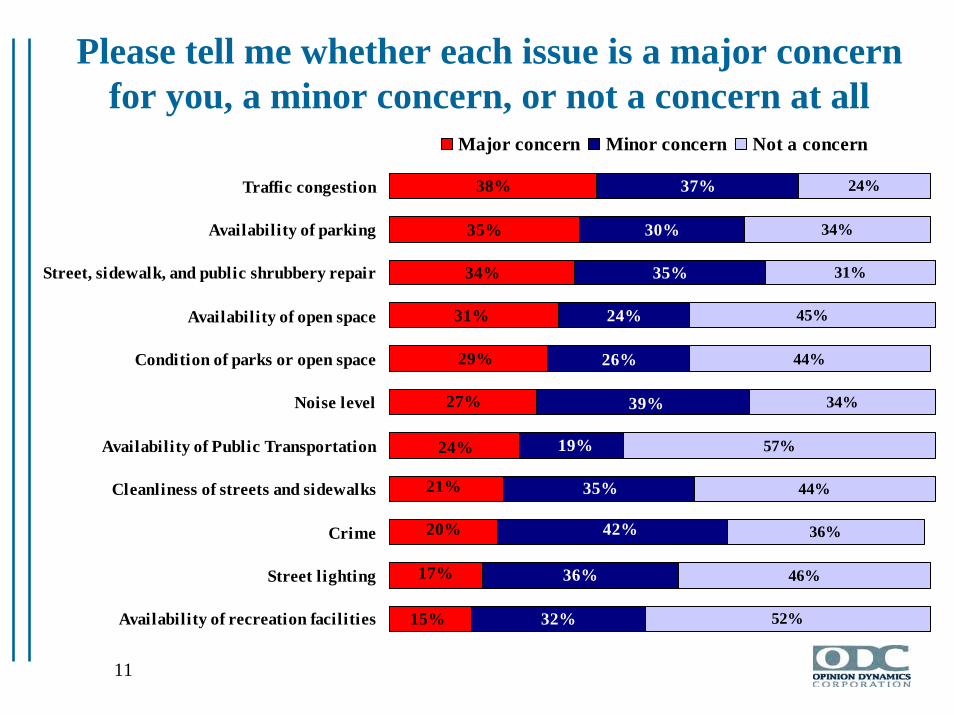
Availability of recreation facilities
Street lighting
Crime
Cleanliness of streets and sidewalks
Availability of Public Transportation
Noise level
Condition of parks or open space
Availability of open space
Street, sidewalk, and public shrubbery repair
Availability of parking
Traffic congestion
Major concern Minor concern Not a concern
Please tell me whether each issue is a major concern for you, a minor concern, or not a concern at all

12
Positive(31%) Negative(8%) No effect(30%)Too far away/Hasn’t affected me 2% 3% 50% New jobs/Contributes to taxes 35 3 --Improved underdeveloped/depressed area 16 -- --Overdevelopment -- 41 --Positive comments(general) 9 -- --Drives up property values/costs 3 15 --Nice looking 6 -- --Increases diversity 5 3 --More housing 6 -- --Traffic/Parking -- 18 --More shops/restaurants/resources 5 -- --Negative comments -- 9 --Other 6 9 2Don’t know/refused 24 18 43
Specifically, why do you feel new commercial developments in Cambridge have had a positive/negative effect on West
Cambridge?
3550%
1641
15
18

13
Where do you shop for groceries most often?
Mt. Auburn Street Star Market 31%
Fresh Pond Whole Foods 30
Porter Square Star Market 8
Huron Village (Huron Market and/or Formaggio’s) 6
Shaw’s 4
Market Basket 3
Trader Joe’s 3
Stop & Shop 2
Other 6
Don’t know 2
31%
30

14
Where do you shop and perform other errands most often?
Harvard Square 42%
Watertown and Belmont 16
Porter Square 11
Huron Village 4
Fresh Pond Mall 4
Boston 1
Burlington Mall 1
Central Square 1
Cambridgeside Galleria 1
Other 10
Don’t know 8
42%

15
4%
2%
7%
30%
56%
O ther/Don't know
Ride a bike
Publictransportation
Walk
Car
How do you run errands and go shopping?

16
Don't know/Refused
1%
Own64% Rent
35%
Do you own or rent your home?
17
Both equally16%
Don't know/Refused
18%None, neither
6%
Rental Housing32%
Home Ownership
28%
Which one of the following two types of housing are needed more in West Cambridge?

18
Don't know9%
Yes79%
No12%
Would you support additional housing in West Cambridge for people with lower incomes?

19
Don't know5%
Yes72%
No23%
(Renters only) If you could afford to buy a home anywhere, would you buy it in Cambridge?

20
Somewhere else27%
Other3%
Cambridge48%
Boston22%
Do you currently work or attend school in Cambridge, Boston, or somewhere else?
21
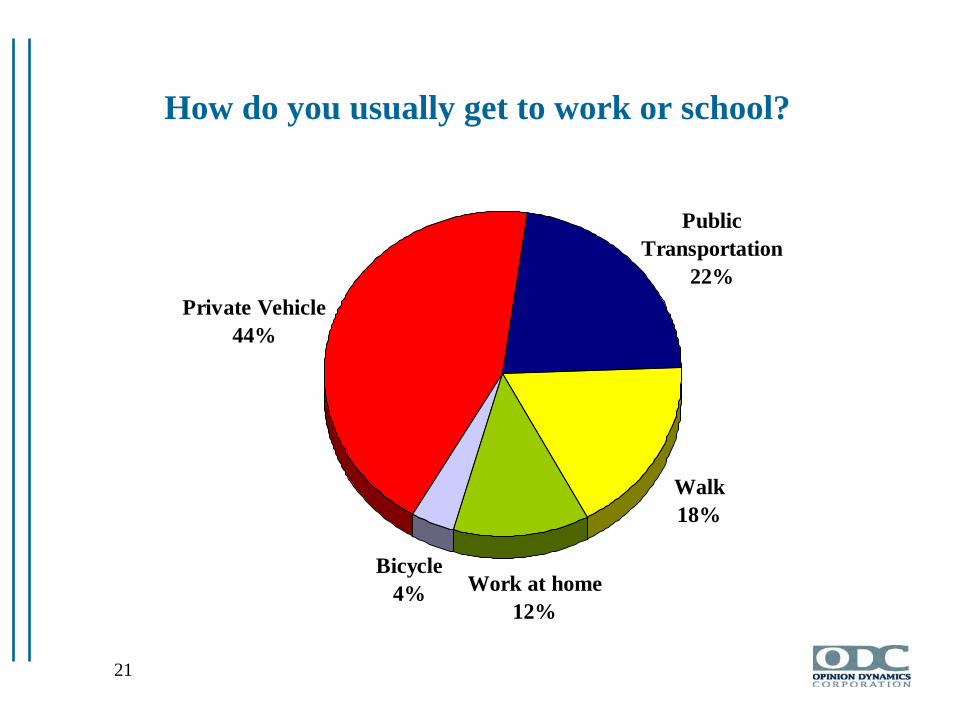
Walk18%
Bicycle4% Work at home
12%
Private Vehicle44%
Public Transportation
22%
How do you usually get to work or school?

22
Please rate how effective you think each of the following methods are for keeping you informed about development plans for your
neighborhood.
55%28%
41%43%
32%46%
32%49%
38%50%
38%57%
23%63%
18%77%
17%79%
Cambridge Community TV, orother cable access
Meetings at City Hall
City of Cambridge website
Direct E-mail notice fromCambridge City government
Community meetings
Word-of-mouth communications
Neighborhood newsletters
Newspaper articles
Flyers in the mail
Very/Somewhateffective
Not very/Noteffective at all

23
Please rate how effective you think each of the following methods are for keeping you informed about development plans for your
neighborhood. (Computers and younger demographic)
30%
19%
42%
31%
City of Cambridgewebsite
Direct E-mail noticefrom Cambridge City
government
Very effective-Overall respondents
Very effective-Respondents younger than 44 years old