west broadway neighbourhood profile final · 1 west broadway neighbourhood profile the...
TRANSCRIPT
1
West Broadway Neighbourhood Profile The Neighbourhood Profile is a document intended to provide context to the West Broadway Community Plan. It looks at data from a variety of sources to provide an introduction to the history of the neighbourhood, to the people who currently live here, and to the area’s physical assets. Some of the key sources referenced in this profile include the Canada Census and the Canada Mortgage and Housing Corporation (CMHC).
Contents
1. History of West Broadway .................................................................................................. 2
2. West Broadway’s location in Winnipeg ................................................................................ 3
3. Population Demographics ................................................................................................... 4
a. Growth over past 25 years .............................................................................................. 4
b. Population by age .......................................................................................................... 5
c. Ethnic origin .................................................................................................................. 7
d. Immigration ................................................................................................................ 10
e. Citizenship ................................................................................................................... 12
f. Education .................................................................................................................... 13
g. Labour Force Activity ................................................................................................... 14
h. Mode of transportation ................................................................................................ 15
i. Household & Family Structure ....................................................................................... 16
j. Income ........................................................................................................................ 18
k. Incidence of low income ............................................................................................... 21
l. Dwellings .................................................................................................................... 23
m. Housing Affordability & Availability ............................................................................... 27
n. Mobility ...................................................................................................................... 31
o. Crime & Criminal Activity .............................................................................................. 31
p. Community Health ....................................................................................................... 33
4. Commercial Activity & Community Services ....................................................................... 36
2
1. History of West Broadway
A History of West Broadway: from the West Broadway Development Corporation Housing Plan 2001‐2003
Built at the turn of the 20th century, West Broadway is one of the City’s oldest neighbourhoods. The central location close to downtown helped to establish the neighbourhood by middle and upper class families, resulting in a wealth of architecturally significant houses and apartment buildings in the Queen Anne, Neo-Georgian and Modern styles.
The Granite Curling Club and the Osborne Stadium and Amphitheatre offered residents recreational, social and cultural entertainment within walking distance of both work and home. Stately homes and spacious three story apartment buildings, many of which were designed by prominent local architects, were constructed between 1905 and 1930. Quality construction and a variety of architectural styles drove the price of new housing anywhere from $3,000 to $5,000 compared to neighbourhoods north of Portage Avenue where homes were built for between $150 and $3,000 (Basham, 2000).
Closure of the Shea’s Brewery and the relocation of the University of Manitoba and the Osborne Stadium, plus reductions in family size, greater influence of the automobile and resulting changes to the City’s transportation systems all helped to encourage an exodus of established families from the neighbourhood to newly developed subdivisions in the late 1940s / 1950s.
Demolition of turn of the century homes to make way for corporate expansion, the extension of Broadway to Portage Avenue and the conversion of Sherbrook and Maryland to one-way street systems isolated parts of the residential neighbourhood from its centre.
In the 1960s homeowners began to move to newer suburban developments and there was an out-migration of high and medium income residents. Loss of local owner-occupied buildings, and costs associated with repairs to aging structures led to a decline in property conditions and market values. Larger homes were sold and converted to rooming houses and by the late 1980s West Broadway had a level of unemployment four times that of the rest of the city.
The situation escalated with arsons, accidental house fires and worsening crime statistics. In the mid 1990s much of the housing stock was in a poor state by the City’s minimum inspection standards. For the over 100 rooming houses in West Broadway, the high density of residents per house and buildings themselves became a concern, but these buildings offered one of the most affordable options for the poor. The issue of rooming houses was further exacerbated by poor property maintenance and management, high resident turnover, safety, and security issues.

3
For the apartment buildings, the situation was no better. The City reported that the number of minor and major repairs needed to increase accommodations to acceptable standards was significant (City of Winnipeg, 2000). Some buildings had deteriorated so badly that many of them were facing multiple building repair orders in the courts. The City was overwhelmed by the sheer number of repair orders; a shortage of staff could not keep up with inspections. Landlords who could not afford to meet repair orders ignored court orders and the City could not collect court awarded fees for non-compliance (City of Winnipeg 2000). As a result, these landlords fell into tax arrears and the City began establishing an extensive property inventory.
Absentee landlords as far away as Vancouver had become the norm and investment in the housing stock and real estate prices were at an all time low (City of Winnipeg). In the case of smaller family-owned older apartment buildings, the years of neglect showed on every building on every street. Landlords would rather accept a number of suite closures or even building closure, and worse yet a boarded up situation rather than reinvest in a losing proposition (City of Winnipeg, 2000).
Social and economic circumstances of the economic recession in the late 1980s and early 1990s led to an increase in poverty rates. Reports across the country and (in West Broadway) by a variety of social and housing agencies showed that a greater number of families and individuals were falling through the social safety net, resulting in an increasing number of people living in costly housing accommodations that were substandard and unhealthy (CHRA). The situation worsened with deteriorating housing stock combined with high levels of people experiencing poverty, and lacking resources and supports to address their situation.
Locally residents and community groups began to organize themselves through the West Broadway Alliance, which formed the West Broadway Development Corporation (WBDC) in 1997. WBDC has served to act as a catalyst for and to coordinate neighbourhood revitalization in West Broadway (such as education and training, a job resource centre, recreation programming, etc). WBDC has supported the housing revitalization initiated by groups such as the Lion’s Club and Westminster Housing Society’s who have acquired, renovated and in some cases, built new housing.
2. West Broadway’s location in Winnipeg
Geographically, West Broadway is situated west of downtown Winnipeg. Its physical boundaries are Portage Avenue (north), Maryland Street (west), the Assiniboine River and Cornish Street (south), and Colony Street (east). Adjacent neighbourhoods include downtown, Wolseley, Osborne Village and Spence. This location offers walking access to many city amenities: Osborne Village, Downtown, the Forks, Misericordia Health Centre, the Assiniboine River trails, the Winnipeg Art Gallery, the University of Winnipeg and many restaurants and shops. Likewise, countless bus routes, regular taxi cab traffic and the Trans

4
Canada Highway passing through the heart of West Broadway make the neighbourhood extremely easy to travel to and from.
There are 5,325 people living in West Broadway, within 170 acres. One of the distinguishing characteristics of the neighbourhood is its density; in West Broadway there are 7,896 people per square kilometre compared to the City’s average density of 1,365 people/km2. This can be attributed to the fact that over 85% of West Broadway residents live in apartment buildings while in Winnipeg as a whole that number is closer to 30%. West Broadway, like many of Winnipeg’s older neighbourhoods, is characterized by its tree-
lined streets. The southeast corner of the neighbourhood, along with a small southwest corner, borders the Assiniboine River for approximately 500 metres, providing an interesting natural feature with summer boating traffic and a winter river trail.
3. Population Demographics
Statistically, West Broadway is a unique neighbourhood with several demographic characteristics that vary significantly from City averages. Population density, income levels, residential mobility and many other defining features paint a picture of the neighbourhood that is cause for both celebration and concern. We must be careful when looking at West Broadway in broad terms and recognize that while certain characteristics suggest a potential for difficulty, they can just as easily be recognized as strengths.
Perspective and analysis are subjective and while the following observations of West Broadway’s demographics are important to note, we should bear in mind the generalities and limitations inherent in statistical overviews.
a. Growth over past 25 years
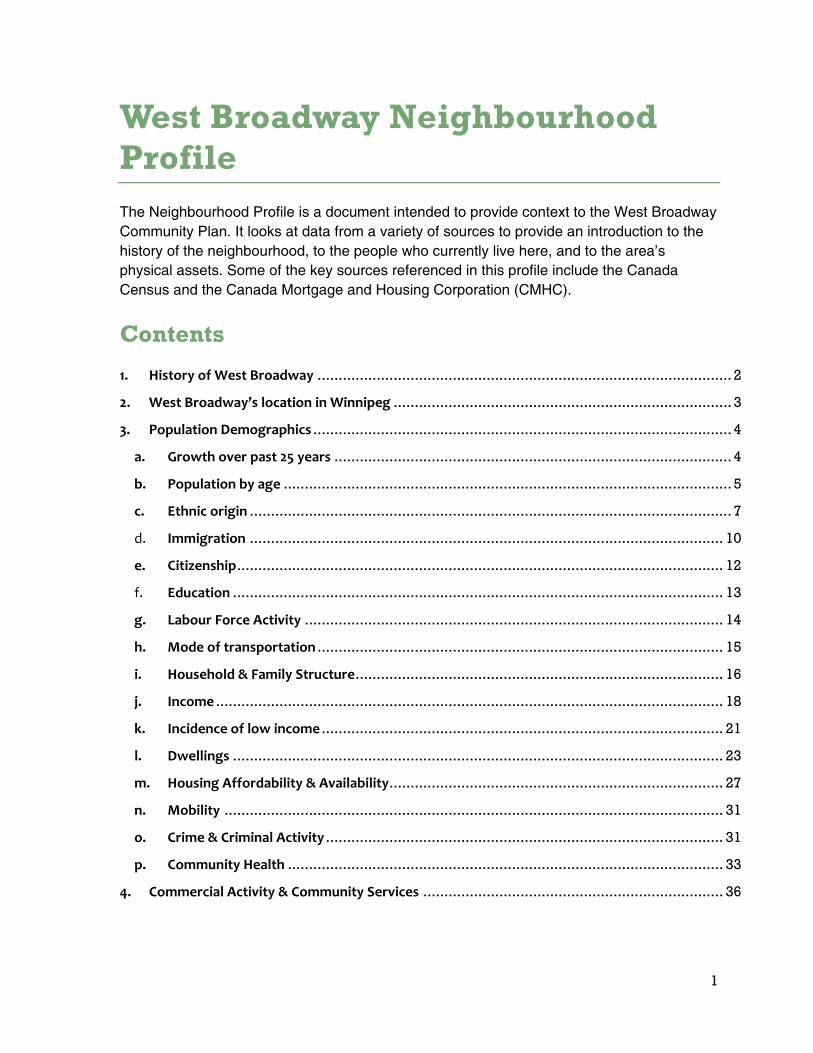
The population of West Broadway has seen changes over the past 25 years. From 1971 to 2006, the population of West Broadway decreased from 6,745 to 5,325, or by -21.1%. This was not, however, a steady decline as can be seen in the graph below. The population decreased dramatically in 1976 (-22.9%) before increasing just as dramatically in 1986 (+24.9%). This was followed by another dramatic decrease in 1991 (-16.7%). Since then, increases and decreases have been modest (from -4.9% to 5.6%).
West Broadway’s location in central Winnipeg (map from Google Earth)
5
In contrast, the City of Winnipeg’s population increased from 535,100 to 633,451, or 18.4%, over the same period (1971 to 2006). This has been a fairly steady increase, with change over each five year period ranging from 0.2% to 5.3%.
While its overall population may have decreased relative to the City’s, West Broadway’s population density is still almost six times higher than the City of Winnipeg’s, with 7,896 people per square kilometre in West Broadway compared to the City’s average density of 1,365 people per square kilometre.
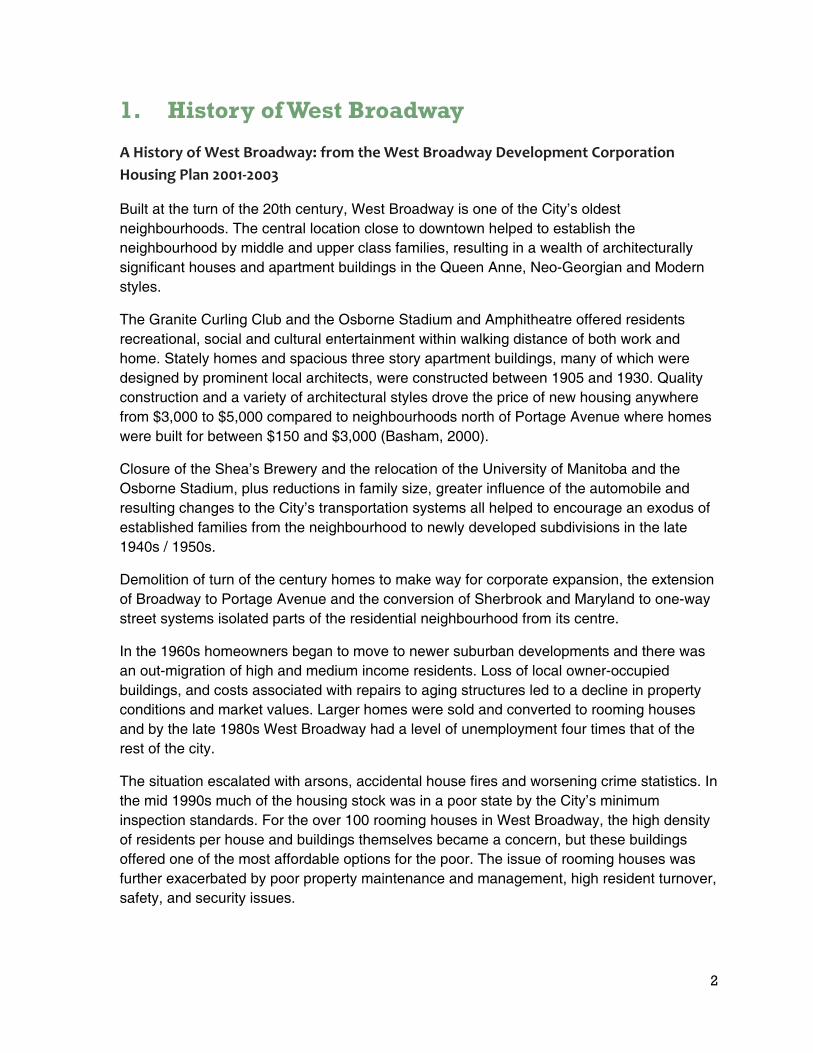
Population by age
The population by age group for both West Broadway and Winnipeg is shown below. The most striking difference is in the 20-29 age group; 26.6% of West Broadway’s population falls into this group whereas this group represents 14.3% of Winnipeg’s total population. 20-24 year olds in particular made up 14% of the neighbourhood, double that of the 7% City average (Winnipeg, 2006).
In fact, 45.7% of all West Broadway residents are under the age of thirty compared to 38.9% of all Winnipeggers under thirty.
6,745
5,200 5,240
6,545
5,4555,190
5,0455,325
4,000
4,500
5,000
5,500
6,000
6,500
7,000
1971 1976 1981 1986 1991 1996 2001 2006
West Broadway Population Change
6
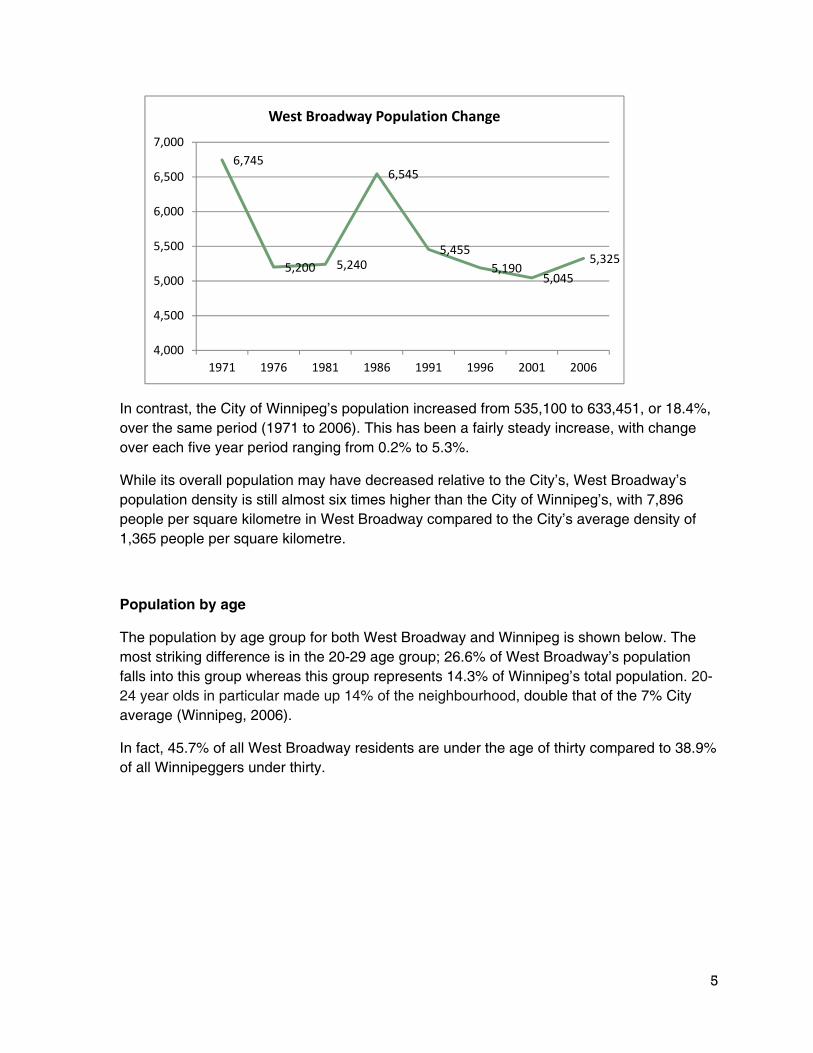
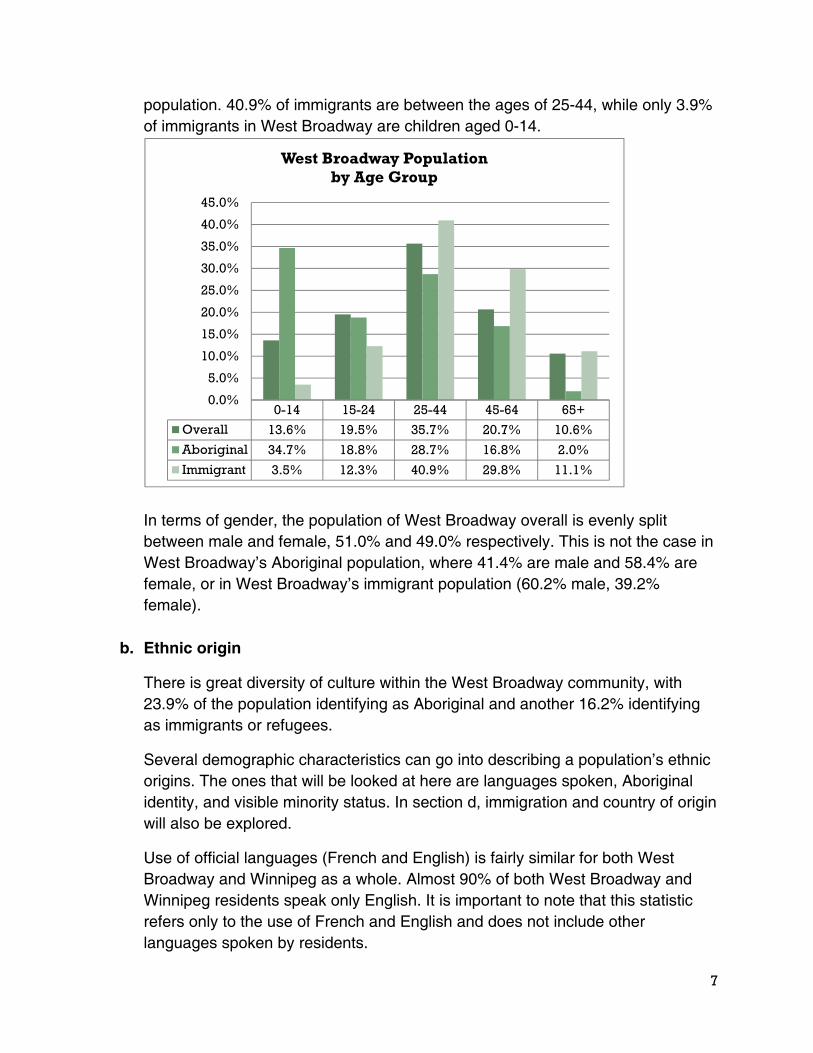
Data specifically regarding Aboriginal and Immigrant populations is available in slightly different age groupings: 0-14, 15-24, 25-44, 45-64, and 65+. Looking at the overall population using these age groupings, we can make the following comparisons between the populations of West Broadway and Winnipeg:
Using these groupings, we can still see the higher proportion of young people aged 15-44 in West Broadway, but the distribution is less clear. Looking at Aboriginal and Immigrant residents separately however, we can see variations from the overall West Broadway population. A high proportion of West Broadway’s Aboriginal population is children aged 0-14, while people over the age of 65 make up a smaller proportion of West Broadway’s Aboriginal
0.0%
5.0%
10.0%
15.0%
20.0%
25.0%
30.0%
under19
20‐29 30‐39 40‐49 50‐59 60‐69 70‐79 80+
Population by Age Group
West Broadway
Winnipeg
0.0%
5.0%
10.0%
15.0%
20.0%
25.0%
30.0%
35.0%
40.0%
45.0%
0-14 15-24 25-44 45-64 65+
Population by Age Group
West Broadway
Winnipeg
7
population. 40.9% of immigrants are between the ages of 25-44, while only 3.9% of immigrants in West Broadway are children aged 0-14.
In terms of gender, the population of West Broadway overall is evenly split between male and female, 51.0% and 49.0% respectively. This is not the case in West Broadway’s Aboriginal population, where 41.4% are male and 58.4% are female, or in West Broadway’s immigrant population (60.2% male, 39.2% female).
b. Ethnic origin
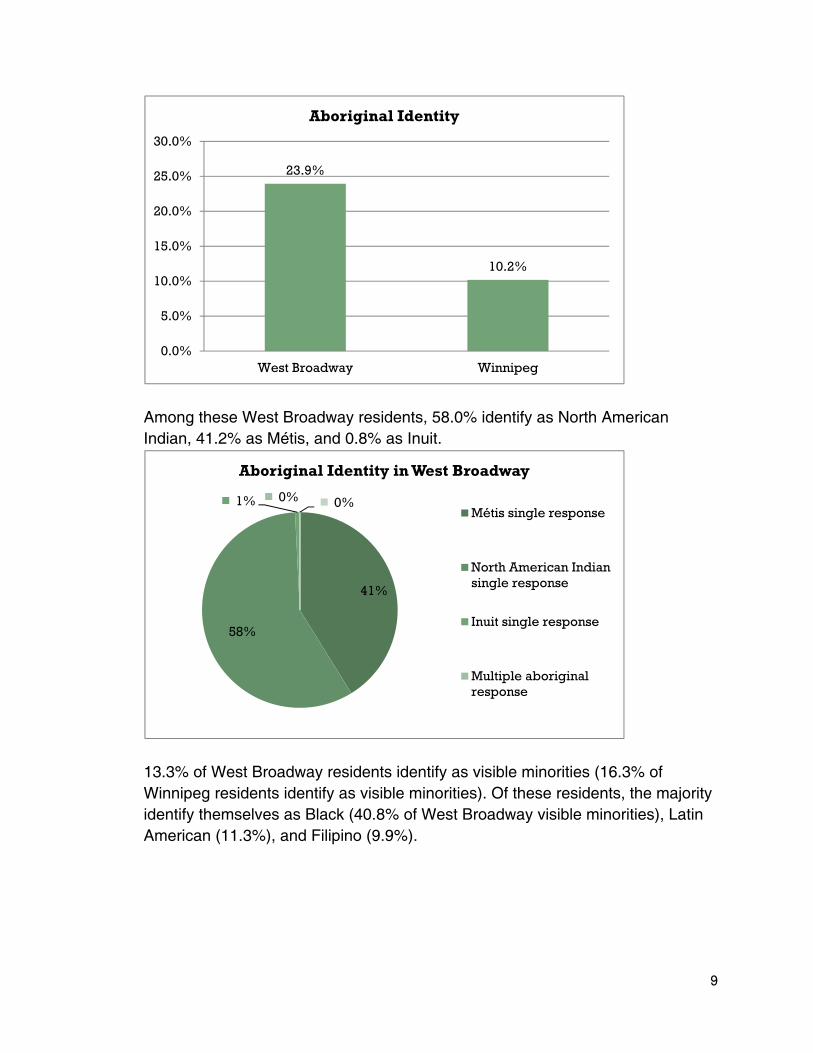
There is great diversity of culture within the West Broadway community, with 23.9% of the population identifying as Aboriginal and another 16.2% identifying as immigrants or refugees.
Several demographic characteristics can go into describing a population’s ethnic origins. The ones that will be looked at here are languages spoken, Aboriginal identity, and visible minority status. In section d, immigration and country of origin will also be explored.
Use of official languages (French and English) is fairly similar for both West Broadway and Winnipeg as a whole. Almost 90% of both West Broadway and Winnipeg residents speak only English. It is important to note that this statistic refers only to the use of French and English and does not include other languages spoken by residents.
0-14 15-24 25-44 45-64 65+
Overall 13.6% 19.5% 35.7% 20.7% 10.6%
Aboriginal 34.7% 18.8% 28.7% 16.8% 2.0%
Immigrant 3.5% 12.3% 40.9% 29.8% 11.1%
0.0%
5.0%
10.0%
15.0%
20.0%
25.0%
30.0%
35.0%
40.0%
45.0%
West Broadway Populationby Age Group

8
In terms of other languages, 32.4% of West Broadway residents speak another language in addition to French or English, compared to 28.8% of Winnipeggers generally. The top 10 other languages spoken in West Broadway are Spanish (spoken by 3.9% of West Broadway residents, or 12.9% of those who speak a language other than French or English), German, Romanian, Arabic, Ojibway, Tagalog, Cree, Amharic, Ukrainian, and Greek.
23.2% of West Broadway residents identify themselves as Aboriginal (compared with 10.2% of Winnipeg residents).
12%
10%
6%
5%
5%
4%3%
3%3%
3%
46%
Languages spoken in West Broadway
Spanish
German
Arabic
Ojibway
Chinese
Tagalog
Cree
Amharic
Ukrainian
Greek
Other
Among the 32.4% of West Broadway residents who speak a language other than French or
9
Among these West Broadway residents, 58.0% identify as North American Indian, 41.2% as Métis, and 0.8% as Inuit.
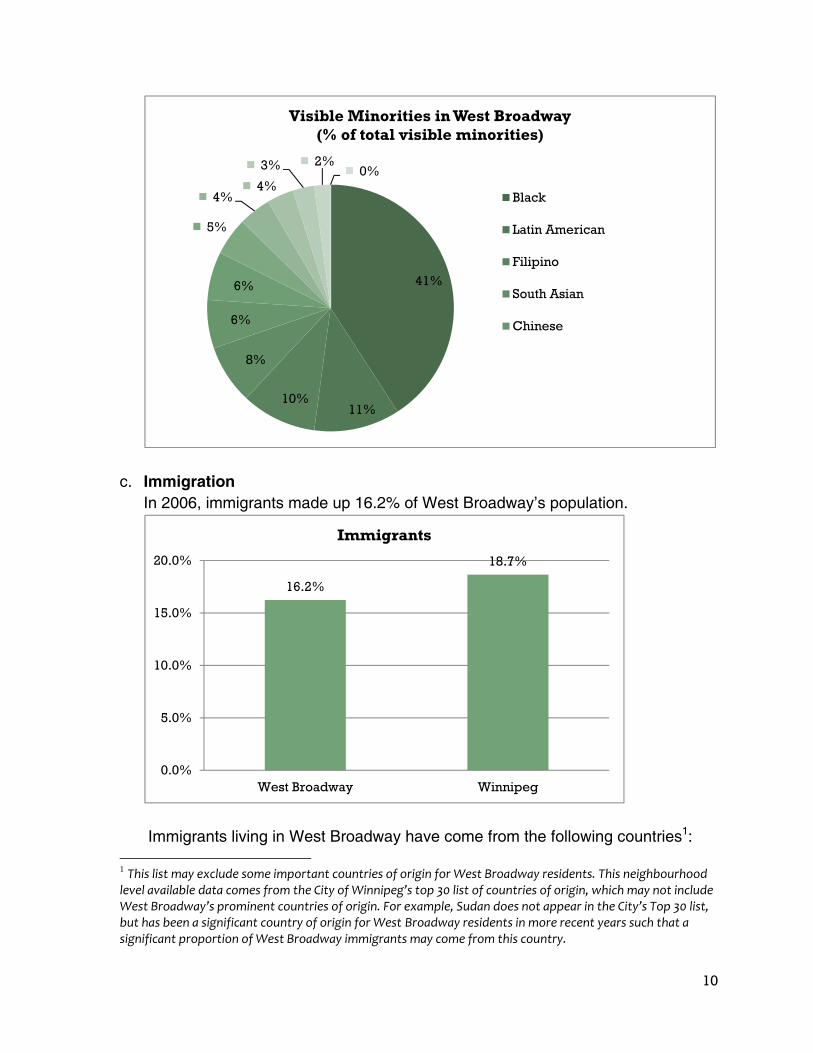
13.3% of West Broadway residents identify as visible minorities (16.3% of Winnipeg residents identify as visible minorities). Of these residents, the majority identify themselves as Black (40.8% of West Broadway visible minorities), Latin American (11.3%), and Filipino (9.9%).
23.9%
10.2%
0.0%
5.0%
10.0%
15.0%
20.0%
25.0%
30.0%
West Broadway Winnipeg
Aboriginal Identity
41%
58%
1% 0% 0%
Aboriginal Identity in West Broadway
Métis single response
North American Indiansingle response
Inuit single response
Multiple aboriginalresponse
10
c. Immigration In 2006, immigrants made up 16.2% of West Broadway’s population.
Immigrants living in West Broadway have come from the following countries1:
1 This list may exclude some important countries of origin for West Broadway residents. This neighbourhood level available data comes from the City of Winnipeg’s top 30 list of countries of origin, which may not include West Broadway’s prominent countries of origin. For example, Sudan does not appear in the City’s Top 30 list, but has been a significant country of origin for West Broadway residents in more recent years such that a significant proportion of West Broadway immigrants may come from this country.
41%
11%10%
8%
6%
6%
5%
4%4%
3% 2%0%
Visible Minorities in West Broadway(% of total visible minorities)
Black
Latin American
Filipino
South Asian
Chinese
16.2%
18.7%
0.0%
5.0%
10.0%
15.0%
20.0%
West Broadway Winnipeg
Immigrants
11
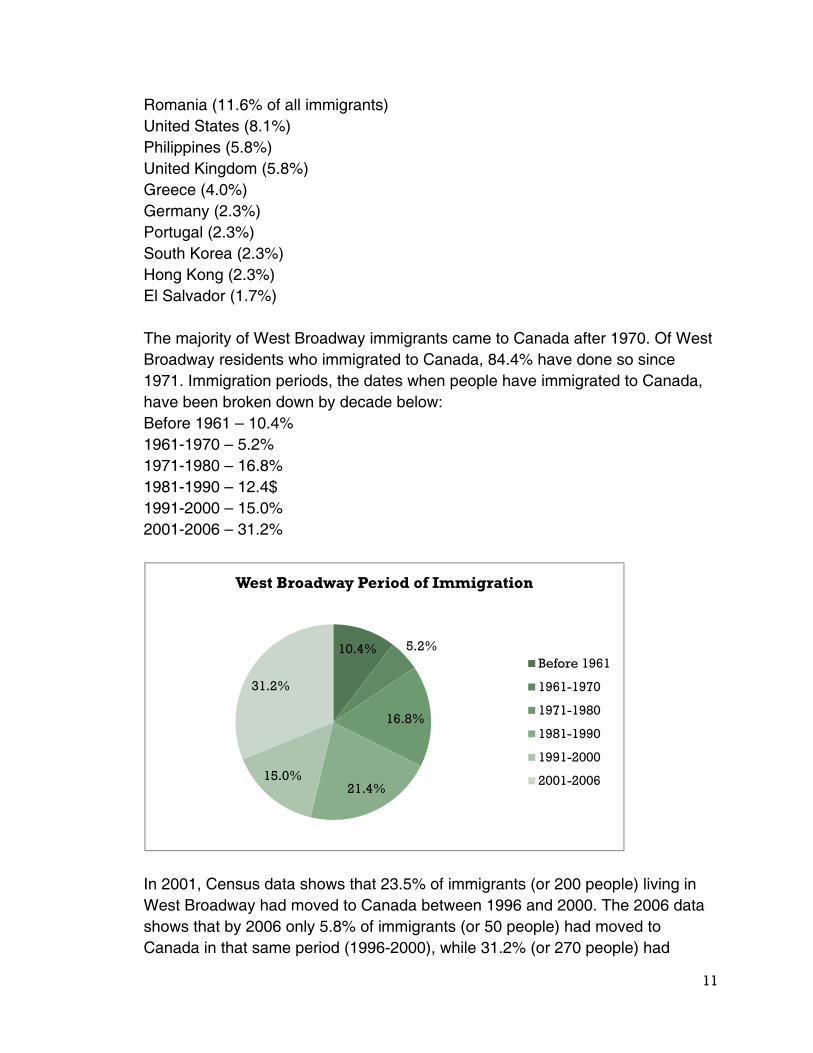
Romania (11.6% of all immigrants) United States (8.1%) Philippines (5.8%) United Kingdom (5.8%) Greece (4.0%) Germany (2.3%) Portugal (2.3%) South Korea (2.3%) Hong Kong (2.3%) El Salvador (1.7%) The majority of West Broadway immigrants came to Canada after 1970. Of West Broadway residents who immigrated to Canada, 84.4% have done so since 1971. Immigration periods, the dates when people have immigrated to Canada, have been broken down by decade below: Before 1961 – 10.4% 1961-1970 – 5.2% 1971-1980 – 16.8% 1981-1990 – 12.4$ 1991-2000 – 15.0% 2001-2006 – 31.2%
In 2001, Census data shows that 23.5% of immigrants (or 200 people) living in West Broadway had moved to Canada between 1996 and 2000. The 2006 data shows that by 2006 only 5.8% of immigrants (or 50 people) had moved to Canada in that same period (1996-2000), while 31.2% (or 270 people) had
10.4% 5.2%
16.8%
21.4%15.0%
31.2%
West Broadway Period of Immigration
Before 1961
1961-1970
1971-1980
1981-1990
1991-2000
2001-2006

12
moved to Canada between 2001-2006. This suggests that the majority of new immigrants to the neighbourhood leave within a relatively short period of time. While there are many potential reasons for this, it is in keeping with the general mobility of the population in West Broadway (discussed further in section n). Immigrants living in West Broadway, who have arrived in Canada in the past five years, emigrated primarily from the following countries: Sudan (17.9% of immigrants who arrived in Canada in the past five years) Romania (16.1%) Iraq (12.5%) Ethiopia (7.1%) South Africa (7.1%) United States (3.6%) Pakistan (3.6%) Iran (3.6%) Bulgaria (3.6%)
d. Citizenship The 2006 Census divides citizenship into “Canada” and “Other.” The rates of citizenship are quite similar between West Broadway and the City as a whole. West Broadway - Canada 92%, Other 8%
17.9%
16.1%
12.5%
7.1%7.1%3.6%
3.6%
3.6%
3.6%
25.0%
Recent Immigrants living in West Broadway(country of origin)
Sudan
Romania
Iraq
Ethiopia
South Africa, Republicof
United States ofAmerica
Pakistan
13
Winnipeg – Canada 94%, Other 6%
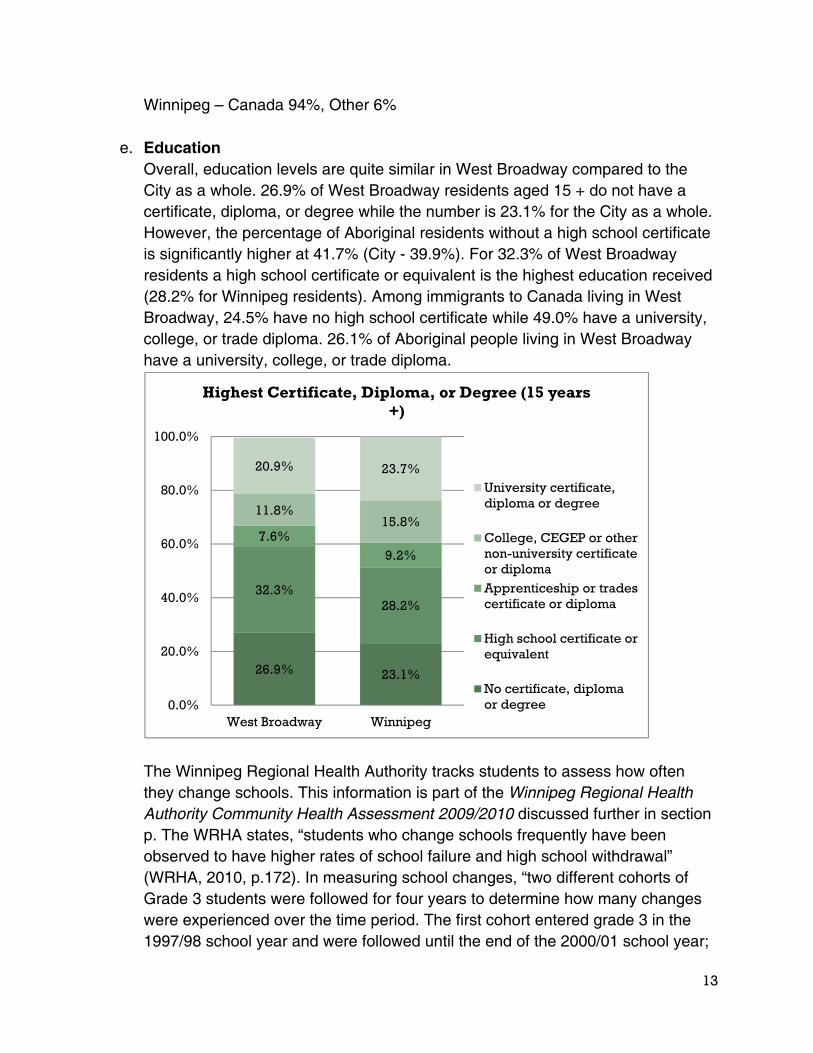
e. Education Overall, education levels are quite similar in West Broadway compared to the City as a whole. 26.9% of West Broadway residents aged 15 + do not have a certificate, diploma, or degree while the number is 23.1% for the City as a whole. However, the percentage of Aboriginal residents without a high school certificate is significantly higher at 41.7% (City - 39.9%). For 32.3% of West Broadway residents a high school certificate or equivalent is the highest education received (28.2% for Winnipeg residents). Among immigrants to Canada living in West Broadway, 24.5% have no high school certificate while 49.0% have a university, college, or trade diploma. 26.1% of Aboriginal people living in West Broadway have a university, college, or trade diploma.
The Winnipeg Regional Health Authority tracks students to assess how often they change schools. This information is part of the Winnipeg Regional Health Authority Community Health Assessment 2009/2010 discussed further in section p. The WRHA states, “students who change schools frequently have been observed to have higher rates of school failure and high school withdrawal” (WRHA, 2010, p.172). In measuring school changes, “two different cohorts of Grade 3 students were followed for four years to determine how many changes were experienced over the time period. The first cohort entered grade 3 in the 1997/98 school year and were followed until the end of the 2000/01 school year;
26.9% 23.1%
32.3%28.2%
7.6%
9.2%
11.8%15.8%
20.9% 23.7%
0.0%
20.0%
40.0%
60.0%
80.0%
100.0%
West Broadway Winnipeg
Highest Certificate, Diploma, or Degree (15 years +)
University certificate,diploma or degree
College, CEGEP or othernon-university certificateor diploma
Apprenticeship or tradescertificate or diploma
High school certificate orequivalent
No certificate, diplomaor degree
14
the second cohort entered grade 3 in 2002/03 and were followed until 2005/06. Students who moved away from Manitoba were excluded, and changes that were expected (e.g., moving from primary to middle school) were not counted as school changes” (WRHA, 2010, p.172). The assessment found that in the Downtown community area (which includes West Broadway), 63.0% of students in the 2002/03 cohort did not change schools. In the Downtown East neighbourhood cluster (the smaller area that includes West Broadway), the number was closer to 55% (WRHA, 2010, p.172). This compares with 77.8% of students in the 2002/03 cohort from across the Winnipeg RHA.
f. Labour Force Activity
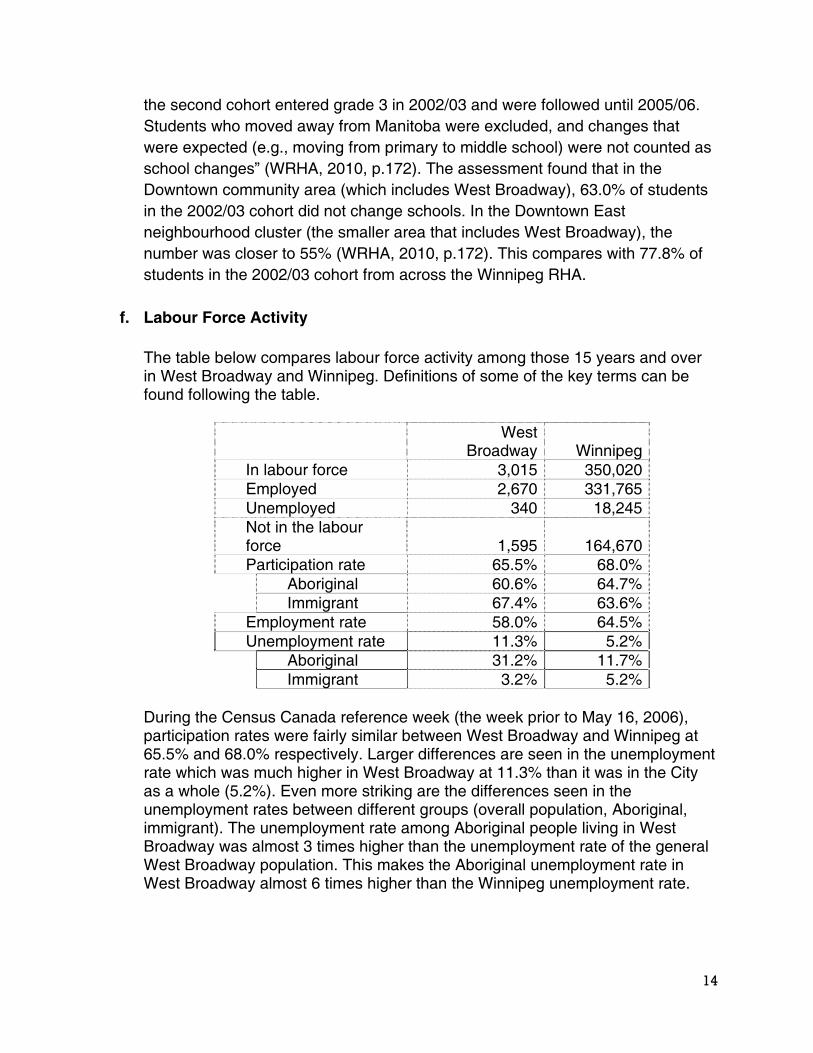
The table below compares labour force activity among those 15 years and over in West Broadway and Winnipeg. Definitions of some of the key terms can be found following the table.
West Broadway Winnipeg
In labour force 3,015 350,020 Employed 2,670 331,765 Unemployed 340 18,245 Not in the labour force 1,595 164,670 Participation rate 65.5% 68.0%
Aboriginal 60.6% 64.7% Immigrant 67.4% 63.6%
Employment rate 58.0% 64.5% Unemployment rate 11.3% 5.2%
Aboriginal 31.2% 11.7% Immigrant 3.2% 5.2%
During the Census Canada reference week (the week prior to May 16, 2006), participation rates were fairly similar between West Broadway and Winnipeg at 65.5% and 68.0% respectively. Larger differences are seen in the unemployment rate which was much higher in West Broadway at 11.3% than it was in the City as a whole (5.2%). Even more striking are the differences seen in the unemployment rates between different groups (overall population, Aboriginal, immigrant). The unemployment rate among Aboriginal people living in West Broadway was almost 3 times higher than the unemployment rate of the general West Broadway population. This makes the Aboriginal unemployment rate in West Broadway almost 6 times higher than the Winnipeg unemployment rate.
15
The following definitions come from Canada's Changing Labour Force, 2006 Census: Definitions and notes (http://www12.statcan.ca/census-recensement/2006/as-sa/97-559/note-eng.cfm).
The labour force “refers to persons who were either employed or unemployed during the reference week (Sunday to Saturday) prior to Census Day (May 16, 2006). Labour force = Employed + Unemployed” (p.32).
Employed refers to “Persons who, during the reference week (Sunday to Saturday) prior to Census Day (May 16, 2006): 1. did any work at all for pay or in self-employment or without pay in a family
farm, business or professional practice 2. were absent from their job or business, with or without pay, for the entire
week because of a vacation, an illness, a labour dispute at their place of work, or any other reasons” (p.32).
Unemployed refers to “Persons who, during the reference week (Sunday to Saturday) prior to Census Day (May 16, 2006), were without paid work or without self-employment work and were available for work and either: 1. had actively looked for paid work in the past four weeks; or 2. were on temporary lay-off and expected to return to their job; or 3. had definite arrangements to start a new job in four weeks or less” (p.32).
Participation rate: “The labour force participation rate for a particular group (age, sex, marital status, geographic area, etc.) is the total labour force in that group, expressed as a percentage of the total population, in that particular group” (p.32).
Employment rate: “The employment rate for a particular group (age, sex, marital status, geographic area, etc.) is the number of persons employed in the week (Sunday to Saturday) prior to Census Day (May 16, 2006), expressed as a percentage of the total population, in that particular group” (p.32).
Unemployment rate: “The unemployment rate for a particular group (age, sex, marital status, geographic area, etc.) is the unemployed in that group, expressed as a percentage of the labour force in that group, in the week (Sunday to Saturday) prior to Census Day (May 16, 2006)” (p.32).
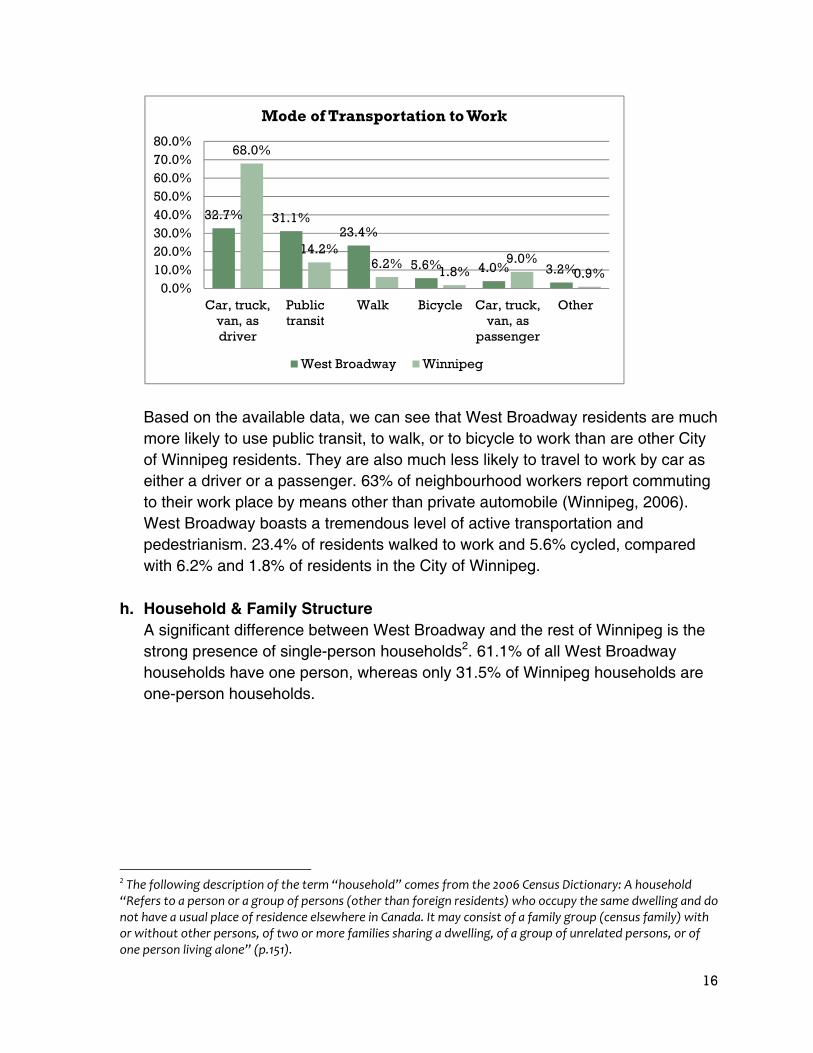
g. Mode of transportation The Census asks respondents what mode of transportation they use to get to work if they are 15 years and over and employed. This means that the transportation data does not necessarily reflect all neighbourhood residents’ most common mode of transportation.
16
Based on the available data, we can see that West Broadway residents are much more likely to use public transit, to walk, or to bicycle to work than are other City of Winnipeg residents. They are also much less likely to travel to work by car as either a driver or a passenger. 63% of neighbourhood workers report commuting to their work place by means other than private automobile (Winnipeg, 2006). West Broadway boasts a tremendous level of active transportation and pedestrianism. 23.4% of residents walked to work and 5.6% cycled, compared with 6.2% and 1.8% of residents in the City of Winnipeg.
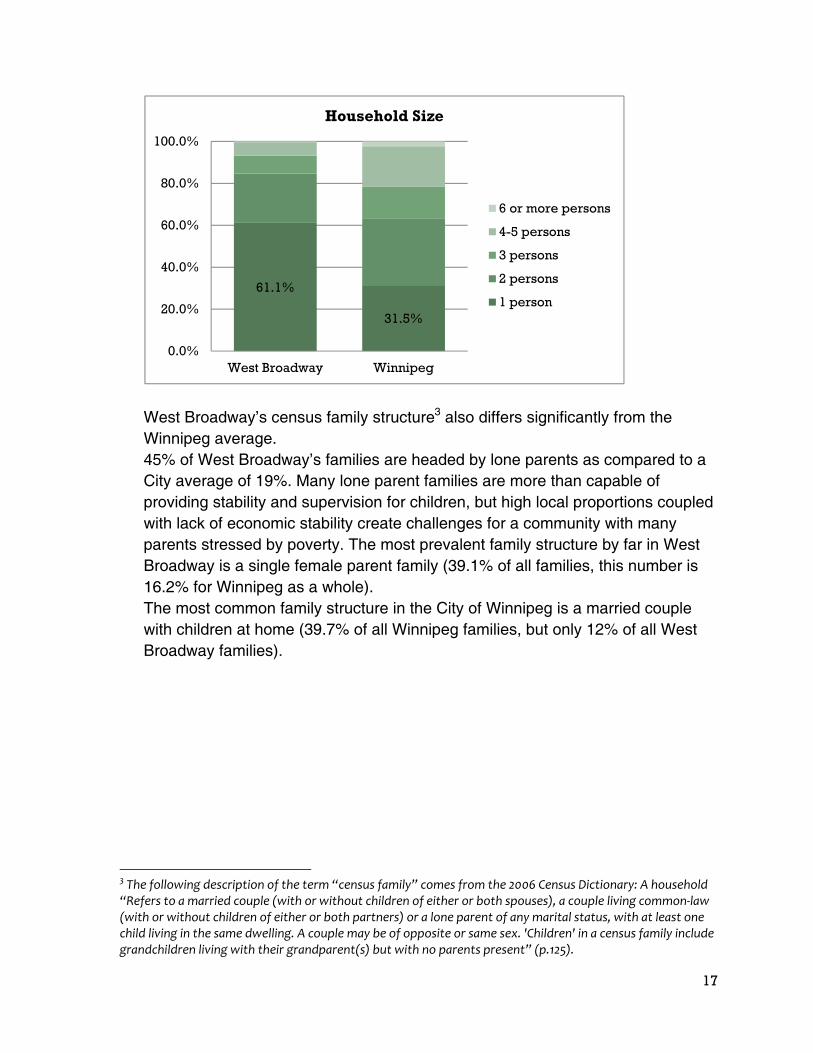
h. Household & Family Structure A significant difference between West Broadway and the rest of Winnipeg is the strong presence of single-person households2. 61.1% of all West Broadway households have one person, whereas only 31.5% of Winnipeg households are one-person households.
2 The following description of the term “household” comes from the 2006 Census Dictionary: A household “Refers to a person or a group of persons (other than foreign residents) who occupy the same dwelling and do not have a usual place of residence elsewhere in Canada. It may consist of a family group (census family) with or without other persons, of two or more families sharing a dwelling, of a group of unrelated persons, or of one person living alone” (p.151).
32.7% 31.1%23.4%
5.6% 4.0% 3.2%
68.0%
14.2%6.2%
1.8%9.0%
0.9%0.0%
10.0%20.0%30.0%40.0%50.0%60.0%70.0%80.0%
Car, truck,van, asdriver
Publictransit
Walk Bicycle Car, truck,van, as
passenger
Other
Mode of Transportation to Work
West Broadway Winnipeg
17
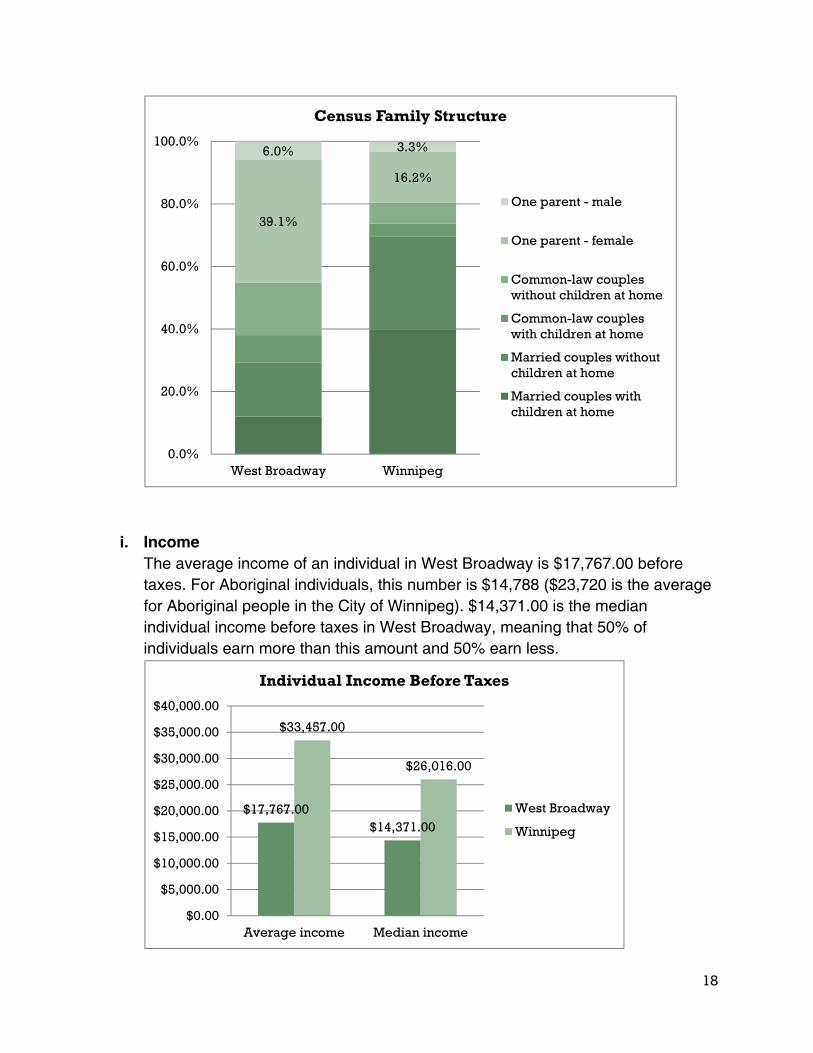
West Broadway’s census family structure3 also differs significantly from the Winnipeg average. 45% of West Broadway’s families are headed by lone parents as compared to a City average of 19%. Many lone parent families are more than capable of providing stability and supervision for children, but high local proportions coupled with lack of economic stability create challenges for a community with many parents stressed by poverty. The most prevalent family structure by far in West Broadway is a single female parent family (39.1% of all families, this number is 16.2% for Winnipeg as a whole). The most common family structure in the City of Winnipeg is a married couple with children at home (39.7% of all Winnipeg families, but only 12% of all West Broadway families).
3 The following description of the term “census family” comes from the 2006 Census Dictionary: A household “Refers to a married couple (with or without children of either or both spouses), a couple living common‐law (with or without children of either or both partners) or a lone parent of any marital status, with at least one child living in the same dwelling. A couple may be of opposite or same sex. 'Children' in a census family include grandchildren living with their grandparent(s) but with no parents present” (p.125).
61.1%
31.5%
0.0%
20.0%
40.0%
60.0%
80.0%
100.0%
West Broadway Winnipeg
Household Size
6 or more persons
4-5 persons
3 persons
2 persons
1 person
18
i. Income The average income of an individual in West Broadway is $17,767.00 before taxes. For Aboriginal individuals, this number is $14,788 ($23,720 is the average for Aboriginal people in the City of Winnipeg). $14,371.00 is the median individual income before taxes in West Broadway, meaning that 50% of individuals earn more than this amount and 50% earn less.
39.1%
16.2%
6.0% 3.3%
0.0%
20.0%
40.0%
60.0%
80.0%
100.0%
West Broadway Winnipeg
Census Family Structure
One parent - male
One parent - female
Common-law coupleswithout children at home
Common-law coupleswith children at home
Married couples withoutchildren at home
Married couples withchildren at home
$17,767.00$14,371.00
$33,457.00
$26,016.00
$0.00
$5,000.00
$10,000.00
$15,000.00
$20,000.00
$25,000.00
$30,000.00
$35,000.00
$40,000.00
Average income Median income
Individual Income Before Taxes
West Broadway
Winnipeg
19
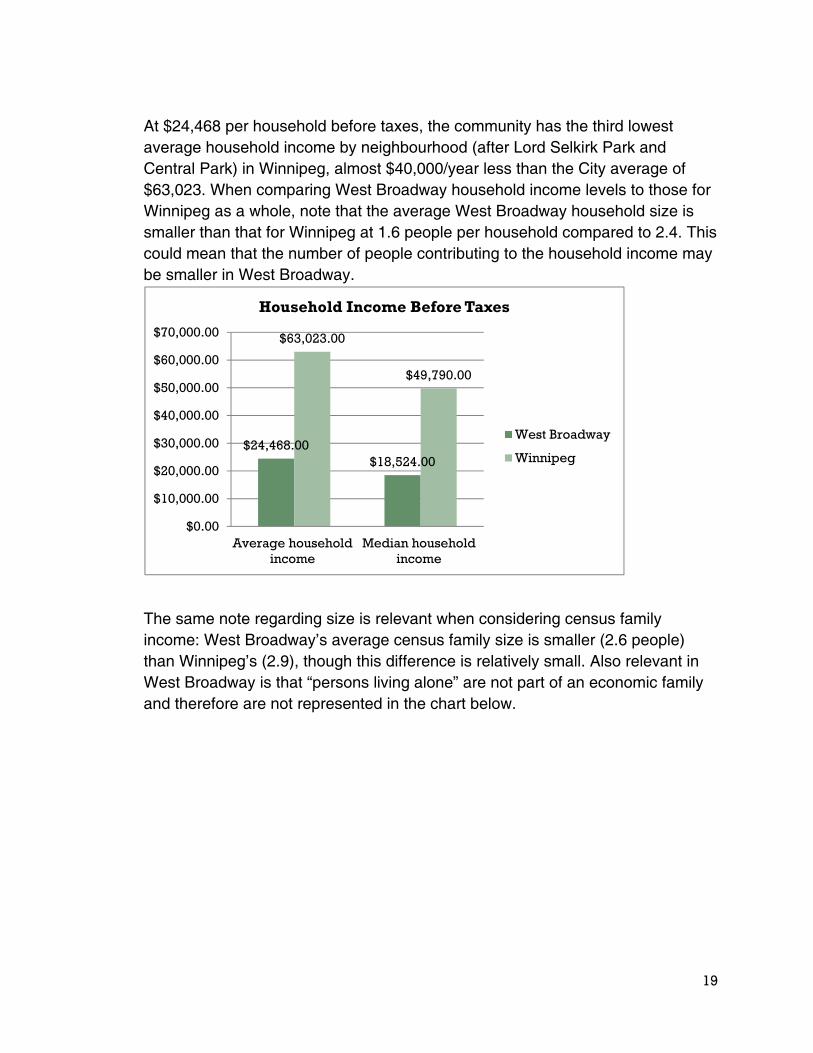
At $24,468 per household before taxes, the community has the third lowest average household income by neighbourhood (after Lord Selkirk Park and Central Park) in Winnipeg, almost $40,000/year less than the City average of $63,023. When comparing West Broadway household income levels to those for Winnipeg as a whole, note that the average West Broadway household size is smaller than that for Winnipeg at 1.6 people per household compared to 2.4. This could mean that the number of people contributing to the household income may be smaller in West Broadway.
The same note regarding size is relevant when considering census family income: West Broadway’s average census family size is smaller (2.6 people) than Winnipeg’s (2.9), though this difference is relatively small. Also relevant in West Broadway is that “persons living alone” are not part of an economic family and therefore are not represented in the chart below.
$24,468.00$18,524.00
$63,023.00
$49,790.00
$0.00
$10,000.00
$20,000.00
$30,000.00
$40,000.00
$50,000.00
$60,000.00
$70,000.00
Average householdincome
Median householdincome
Household Income Before Taxes
West Broadway
Winnipeg
20
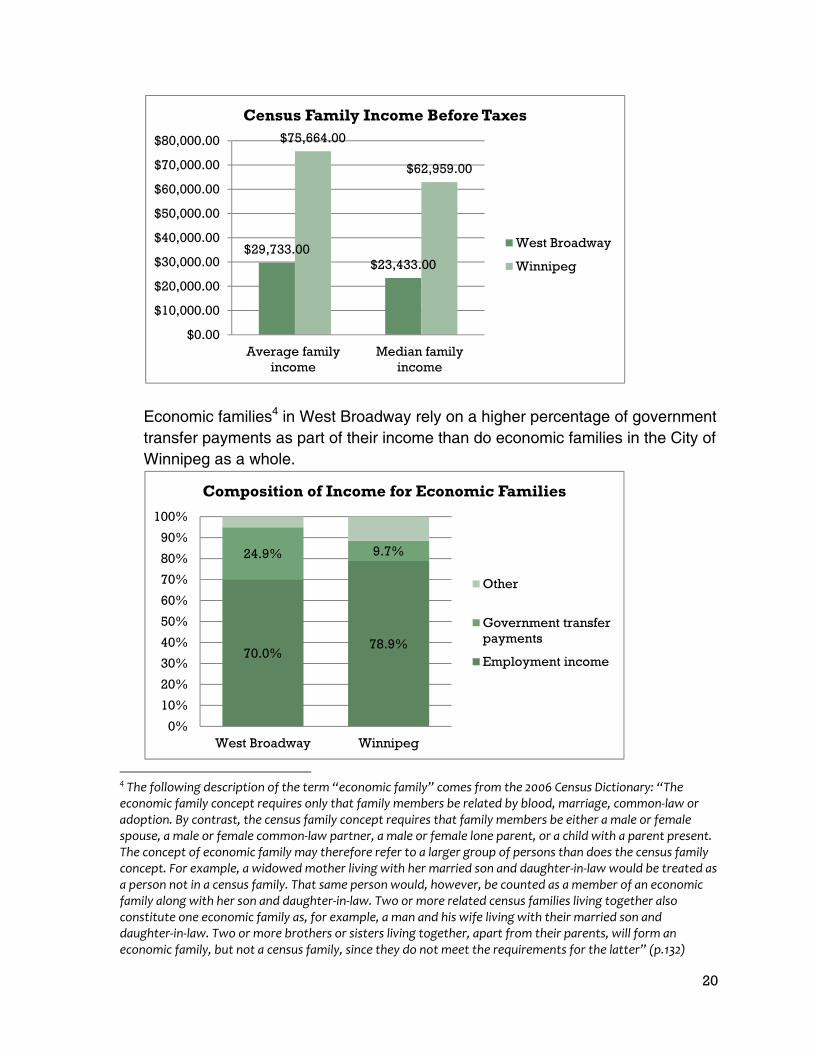
Economic families4 in West Broadway rely on a higher percentage of government transfer payments as part of their income than do economic families in the City of Winnipeg as a whole.
4 The following description of the term “economic family” comes from the 2006 Census Dictionary: “The economic family concept requires only that family members be related by blood, marriage, common‐law or adoption. By contrast, the census family concept requires that family members be either a male or female spouse, a male or female common‐law partner, a male or female lone parent, or a child with a parent present. The concept of economic family may therefore refer to a larger group of persons than does the census family concept. For example, a widowed mother living with her married son and daughter‐in‐law would be treated as a person not in a census family. That same person would, however, be counted as a member of an economic family along with her son and daughter‐in‐law. Two or more related census families living together also constitute one economic family as, for example, a man and his wife living with their married son and daughter‐in‐law. Two or more brothers or sisters living together, apart from their parents, will form an economic family, but not a census family, since they do not meet the requirements for the latter” (p.132)
$29,733.00$23,433.00
$75,664.00
$62,959.00
$0.00
$10,000.00
$20,000.00
$30,000.00
$40,000.00
$50,000.00
$60,000.00
$70,000.00
$80,000.00
Average familyincome
Median familyincome
Census Family Income Before Taxes
West Broadway
Winnipeg
70.0%78.9%
24.9% 9.7%
0%
10%
20%
30%
40%
50%
60%
70%
80%
90%
100%
West Broadway Winnipeg
Composition of Income for Economic Families
Other
Government transferpayments
Employment income
21
j. Incidence of low income
LICO Statistics Canada provides a measurement of low income known as low income cut-offs (LICO). When this measurement was introduced in the 1960s, “expenditure patterns indicated that Canadian families spent about 50% of their total income on food, shelter and clothing. It was arbitrarily estimated that families spending 70% or more of their income (20 percentage points more than the average) on these basic necessities would be in 'straitened' circumstances” (From Statistics Canada – Catalogue no. 92-566-X “2006 Census Dictionary”, p. 142 http://www12.statcan.gc.ca/census-recensement/2006/ref/dict/pdf/92-566-eng.pdf). Over the years, low income cut-off points have been revised and are now given for 7 family sizes and five areas of residence (based on the size of city in which a person lives). Since 1991, low income cut-offs have been available for both after-tax and before-tax incomes. It is important to note that,
“Since their initial publication, Statistics Canada has clearly and consistently emphasized that the LICOs are not measures of poverty. Rather, LICOs reflect a consistent and well-defined methodology that identifies those who are substantially worse off than average. These measures have enabled Statistics Canada to report important trends, such as the changing composition of those below the LICOs over time. The choice of using before or after-tax income cut-offs depends upon the analysis undertaken. The after-tax income cut-offs will take into account the reduced spending power of families because of income taxes paid.” (p.144)
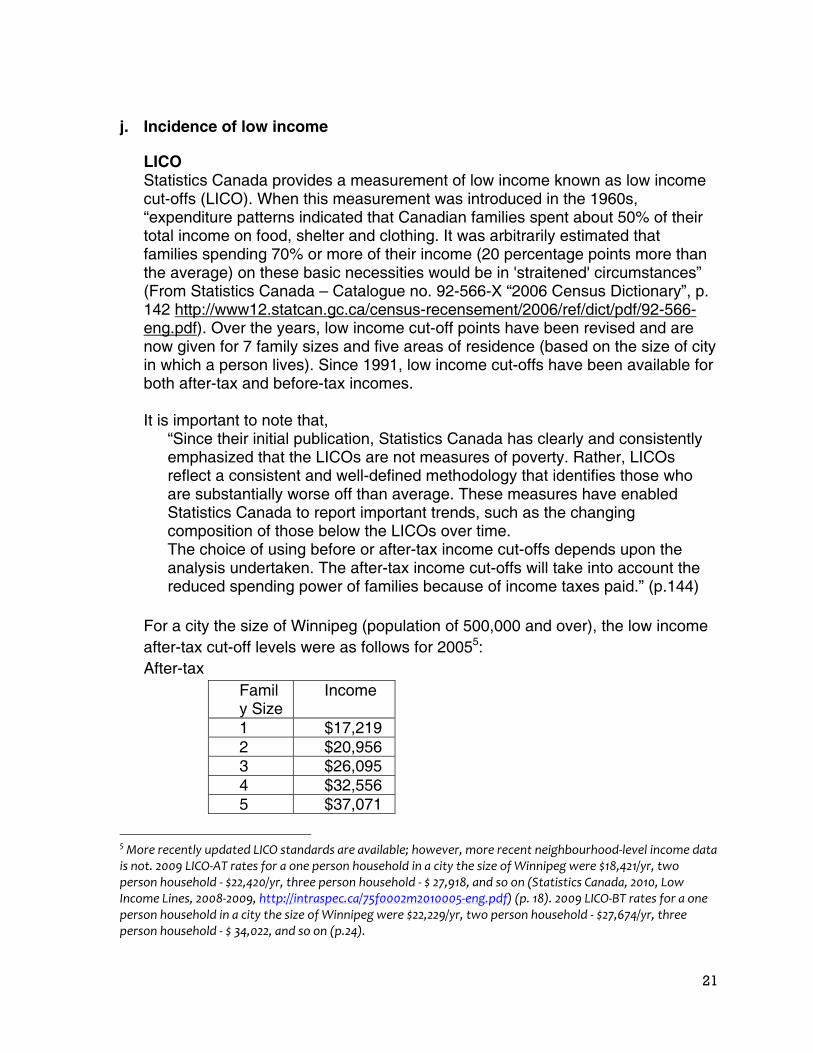
For a city the size of Winnipeg (population of 500,000 and over), the low income after-tax cut-off levels were as follows for 20055: After-tax
Family Size
Income
1 $17,219 2 $20,956 3 $26,095 4 $32,556 5 $37,071
5 More recently updated LICO standards are available; however, more recent neighbourhood‐level income data is not. 2009 LICO‐AT rates for a one person household in a city the size of Winnipeg were $18,421/yr, two person household ‐ $22,420/yr, three person household ‐ $ 27,918, and so on (Statistics Canada, 2010, Low Income Lines, 2008‐2009, http://intraspec.ca/75f0002m2010005‐eng.pdf) (p. 18). 2009 LICO‐BT rates for a one person household in a city the size of Winnipeg were $22,229/yr, two person household ‐ $27,674/yr, three person household ‐ $ 34,022, and so on (p.24).
22
6 $41,113 7+ $45,155
Before-tax
Family Size
Income
1 20,778 2 25,867 3 31,801 4 38,610 5 43,791 6 49,389 7+ 54,987
Census information indicates that West Broadway has a much higher proportion of citizens living below low income after-tax cut-off (LICO-AT) standards than the City as a whole: 52.4% of economic families and 60.4% of unattached individuals compared to 11.1% and 34.8% respectively for Winnipeg.
Additionally, 86.8% of all West Broadway children under the age of 6 are living in households below LICO-AT standards (city-wide: 25.9%). 49.1% of all people in West Broadway over the age of 65 also find themselves in this position (city-wide: 10.8%).
Aboriginal – 77.6% (39.3% city)
Market Basket Measure (MBM) Another method by which the incidence of low income can be measured is the market basket measure (MBM), developed by Human Resources and Skills Development Canada. The MBM describes a person with low income as “someone whose disposable family income falls below the cost of the goods and services in the Market Basket in their community or community size” (http://www.hrsdc.gc.ca/eng/publications_resources/research/categories/inclusion/2008/sp-864-10-2008/sp_864_10_08e.pdf, p.7). Rates of low income as measured by the MBM are not available at neighbourhood-level; however, given that the median household income in West Broadway is $18,524, more than 50% fall below the $26,555 threshold identified for Winnipeg for 2006 (http://www.hrsdc.gc.ca/eng/publications_resources/research/categories/inclusion/2008/sp-864-10-2008/sp_864_10_08e.pdf, p.81). The MBM also measures the

23
depth6 and persistence7 of low income. This data is also not available at neighbourhood-level. Depth of low income in Manitoba for 2000-2006 was measured at 35.5% for all persons and at 41.0% for all families (p.49).
k. Dwellings Housing and accommodation is a major topic of discussion in the West Broadway neighbourhood. Dwelling types, dwelling tenure, dwelling condition & age, and dwelling costs will all be examined in this section. Dwelling types As mentioned earlier when discussing population density, West Broadway has a large proportion of apartment units. While 59.4% of all Winnipeg dwellings are single-detached houses, this dwelling type makes up only 6.0% of the West Broadway housing mix (175 out of 2925 private dwellings). It is worth highlighting again that over 85% of West Broadway dwellings are apartments, while this is true of only just over 30% of Winnipeg dwellings. The largest numbers are found in the category “apartment, building with fewer than five storeys” with 2000 dwellings out of the 2925 total.
6 The depth of low income is defined as “the average gap between the disposable income of all economic families in low income and their low‐income thresholds expressed as a percentage” (p.ii)
7 In the MBM measure, “Persons are said to be in persistent low income if the total income of their family over a period of years falls below the combined low‐income thresholds for the families in which they resided over that period of years” (p.1).
6.0%
59.4%
86.5%
31.2%
7.5% 9.4%
0.0%
20.0%
40.0%
60.0%
80.0%
100.0%
West Broadway Winnipeg
Dwelling Types
Other
Apartment
Single-detached house
24
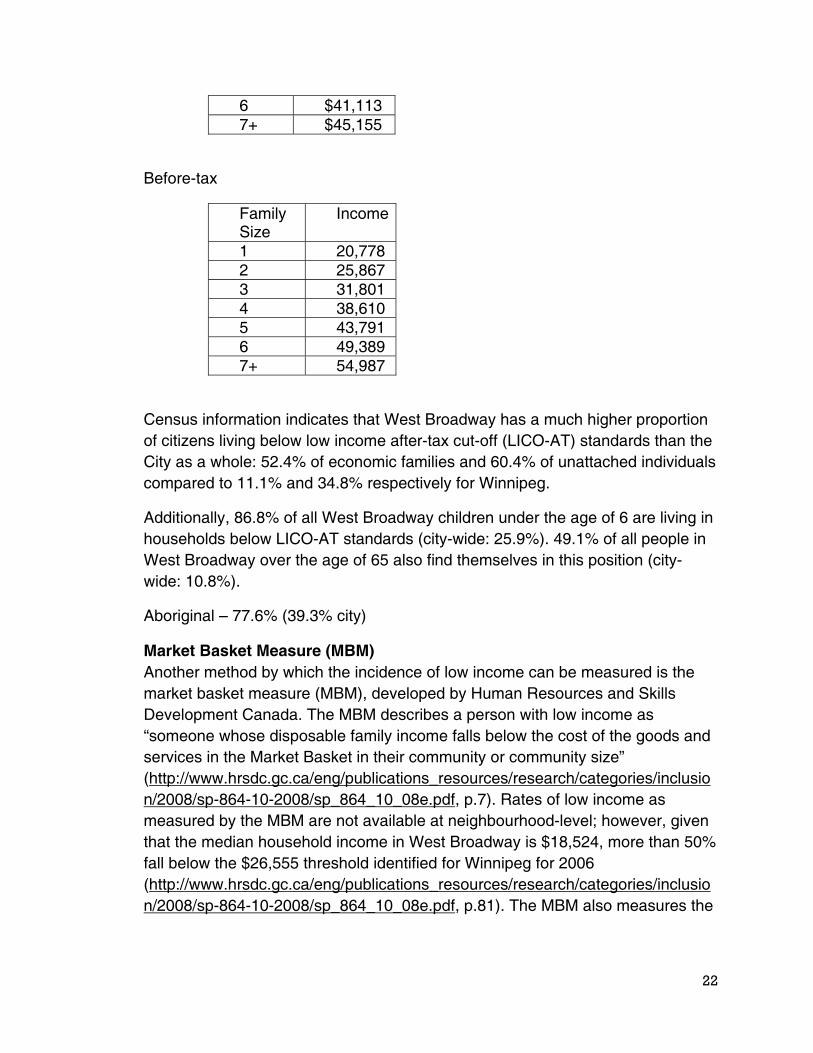
Dwelling tenure Dwellings in West Broadway are much more likely to be tenant-occupied than owner-occupied. 92.8% of West Broadway residents are renters, compared with 34.9% of all Winnipeggers. In West Broadway, just over 7%, or 210, of the 2925 dwelling units in the neighbourhood are owner-occupied.
Dwelling tenure # of units % of total housing
stock Owner-occupied units (incl. houses, condos)
210 7.20%
Rented units 2,705 92.80%
Market rate rental units 742 25.45% Subsidized rental units 1,963 67.34%
Condominiums in West Broadway
Location Number of Units % of total housing
stock 650 Westminster 11 134 Langside 9 251 Furby 11 185 Spence (under construction) 7 Total 38 1.30%
Among owner-occupied dwellings, 51% are single-detached houses and 24.4% are in apartment buildings with fewer than five storeys. Among rented dwellings, the majority are in apartment buildings with fewer than five storeys (72.2%).
7%
93%
West Broadway Dwelling Tenure
Owned
Rented65%
35%
Winnipeg Dwelling Tenure
25
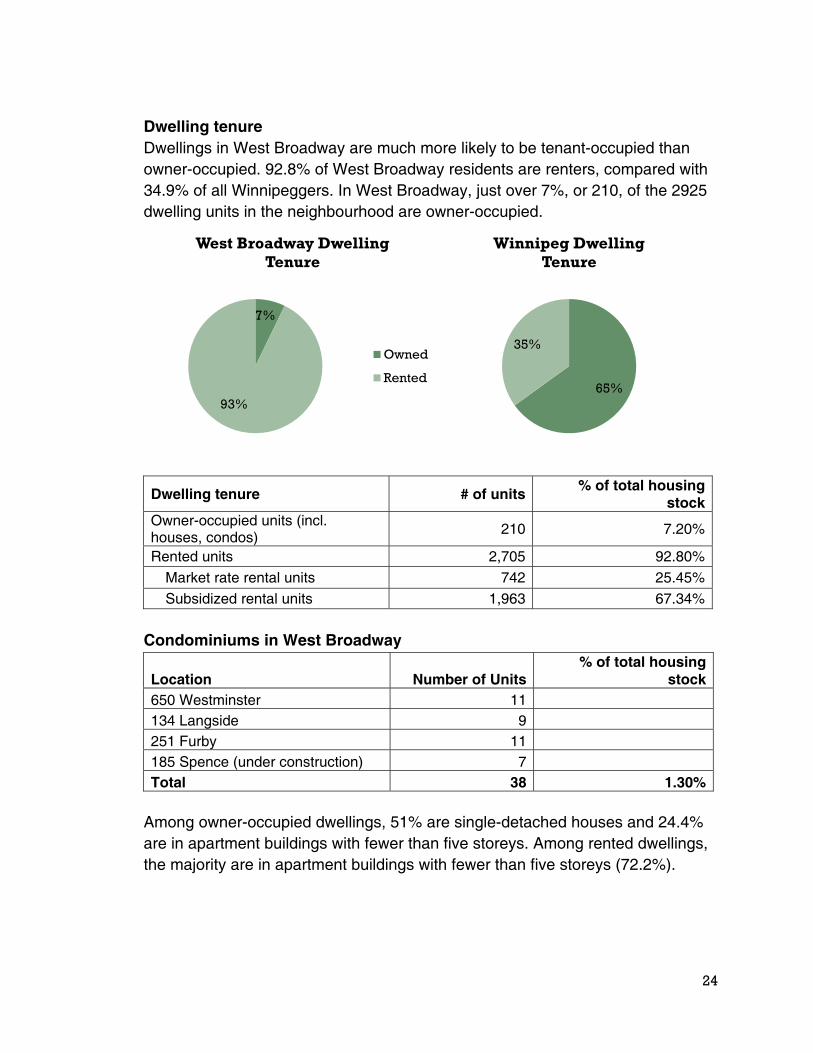
Dwelling condition & age West Broadway dwellings are more likely to be in need of major or minor repairs than dwellings in most other parts of the city. This could be related to the fact that 59.8% of West Broadway dwellings were built before 1946 (19.5% of Winnipeg dwellings were built before 1946) and may be due for more extensive repairs.
Among dwellings in West Broadway, 31.4% of all single-detached houses are in need of major repairs (55 out of 175 houses), along with 60.0% all semi-detached houses, 28.6% of apartment duplexes, and 16.5% of apartments in buildings with fewer than five storeys.
Dwelling costs
51.2%
34.0%
14.8%
62.4%
29.1%
8.5%
0.0%
10.0%
20.0%
30.0%
40.0%
50.0%
60.0%
70.0%
In need ofregular
maintenanceonly
In need ofminor repairs
In need ofmajor repairs
Dwelling Condition
West Broadway
Winnipeg
Before
1946
1946to
1960
1961to
1970
1971to
1980
1981to
1985
1986to
1990
1991to
1995
1996to
2000
2001to
2006
West Broadway 59.8% 13.4% 9.2% 9.9% 1.2% 3.1% 2.7% 0.7% 0.0%
Winnipeg 19.5% 20.3% 16.8% 19.5% 7.3% 7.1% 3.3% 2.5% 3.6%
0.0%
10.0%
20.0%
30.0%
40.0%
50.0%
60.0%
70.0%
Dwelling Period of Construction
26
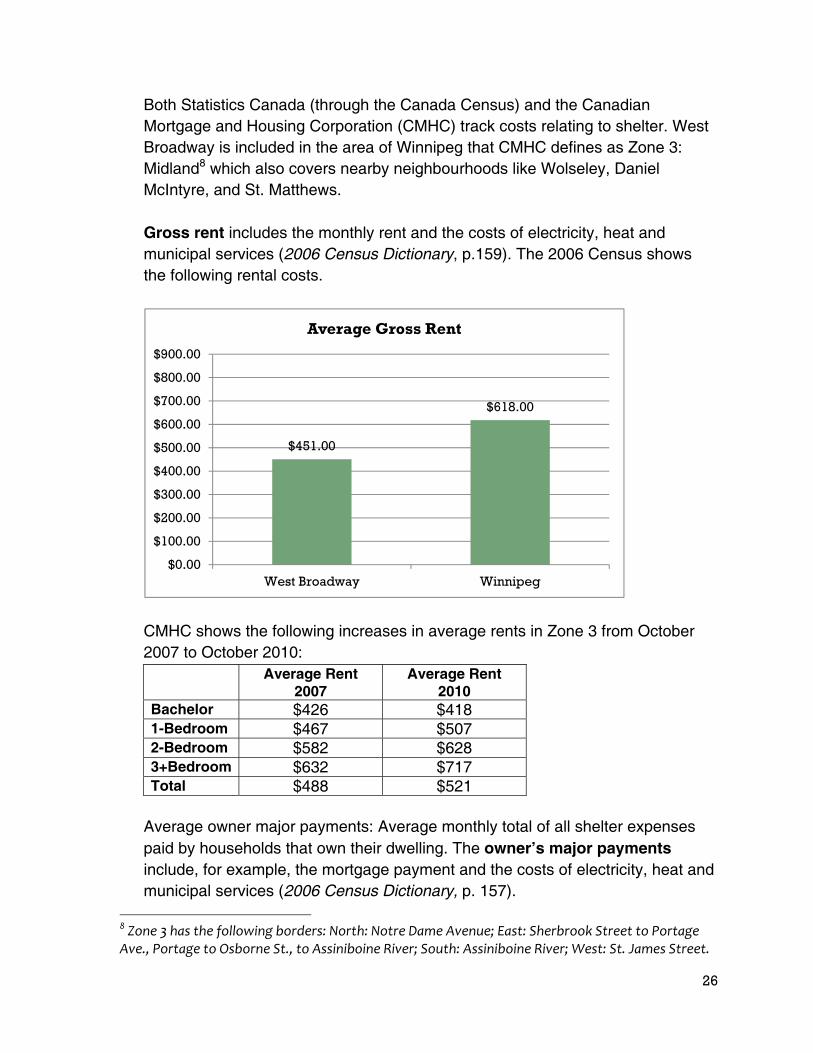
Both Statistics Canada (through the Canada Census) and the Canadian Mortgage and Housing Corporation (CMHC) track costs relating to shelter. West Broadway is included in the area of Winnipeg that CMHC defines as Zone 3: Midland8 which also covers nearby neighbourhoods like Wolseley, Daniel McIntyre, and St. Matthews. Gross rent includes the monthly rent and the costs of electricity, heat and municipal services (2006 Census Dictionary, p.159). The 2006 Census shows the following rental costs.
CMHC shows the following increases in average rents in Zone 3 from October 2007 to October 2010:
Average Rent 2007
Average Rent 2010
Bachelor $426 $418 1-Bedroom $467 $507 2-Bedroom $582 $628 3+Bedroom $632 $717 Total $488 $521
Average owner major payments: Average monthly total of all shelter expenses paid by households that own their dwelling. The owner’s major payments include, for example, the mortgage payment and the costs of electricity, heat and municipal services (2006 Census Dictionary, p. 157).
8 Zone 3 has the following borders: North: Notre Dame Avenue; East: Sherbrook Street to Portage Ave., Portage to Osborne St., to Assiniboine River; South: Assiniboine River; West: St. James Street.
$451.00
$618.00
$0.00
$100.00
$200.00
$300.00
$400.00
$500.00
$600.00
$700.00
$800.00
$900.00
West Broadway Winnipeg
Average Gross Rent

27
l. Housing Affordability & Availability In recent years, comparatively low housing prices (Winnipeg, 2006) have made the West Broadway neighbourhood popular amongst real-estate investors and home buyers seeking the best value for their money. Relatively low property taxes, the availability of large character homes, and the resurgent popularity of urban, pedestrian lifestyles have also encouraged the transformation of many rooming houses, duplexes and triplexes into single family units or higher-income rental suites. While this trend has meant a renewal of aging housing stock and the arrival of many caring and invested homeowners to the neighbourhood, it has also exacerbated the local impact of extremely low vacancy rates amongst rental units citywide (Canada Mortgage and Housing Corporation, 2009) Over the past 10 years more than 54% of housing units in area apartment buildings have been exempted from rent controls, resulting in rent increases of 10-15% on average. This has impacted residential mobility as people are forced to move when they cannot afford the new, higher rents. In short, many renters, particularly those in low income brackets have found it increasingly difficult to maintain stable accommodations in West Broadway. Affordability According to the CMHC, core housing refers to “households (that) are unable to afford shelter that meets adequacy, suitability, and affordability norms. The norms have been adjusted over time to reflect the housing expectations of Canadians” (CMHC, 2010, http://www.cmhc-schl.gc.ca/en/corp/faq/faq_002.cfm#4). Among these norms, affordability is tracked by both CMHC and the Census. The CMHC puts forward this description: “Affordability, one of the elements used to determine core housing need, is
$814.00 $838.00
$0.00
$100.00
$200.00
$300.00
$400.00
$500.00
$600.00
$700.00
$800.00
$900.00
West Broadway Winnipeg
Average Owner Major Payment
28
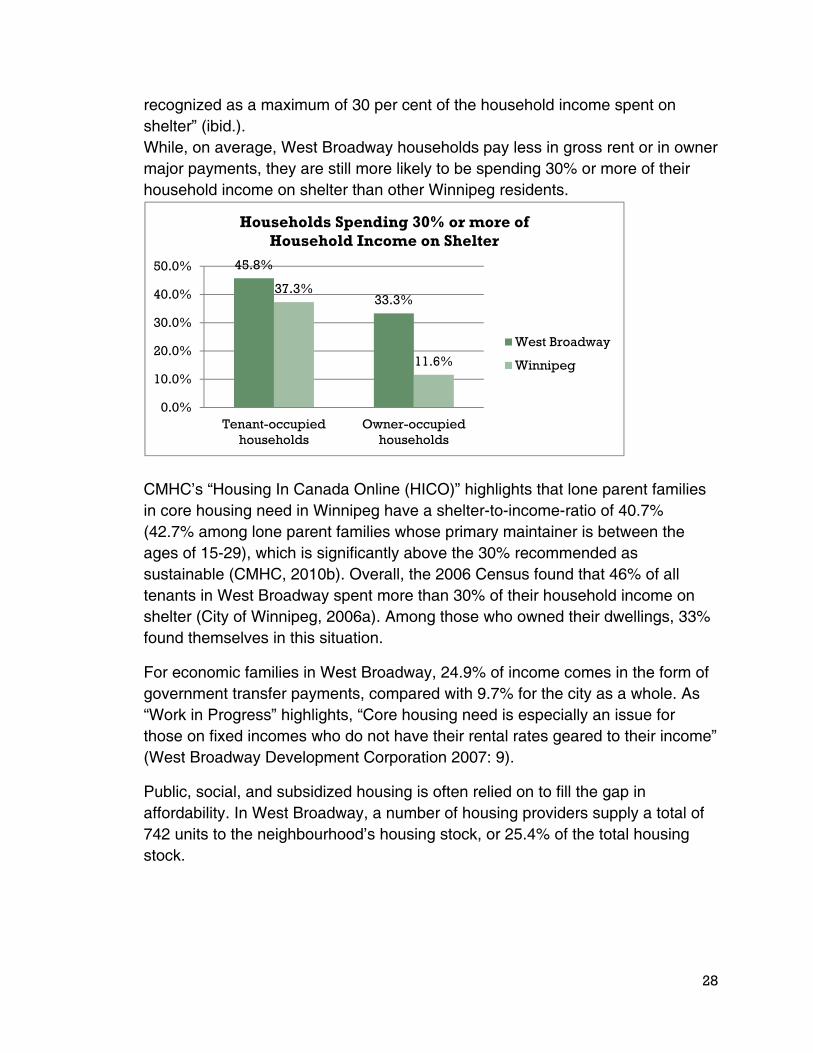
recognized as a maximum of 30 per cent of the household income spent on shelter” (ibid.). While, on average, West Broadway households pay less in gross rent or in owner major payments, they are still more likely to be spending 30% or more of their household income on shelter than other Winnipeg residents.
CMHC’s “Housing In Canada Online (HICO)” highlights that lone parent families in core housing need in Winnipeg have a shelter-to-income-ratio of 40.7% (42.7% among lone parent families whose primary maintainer is between the ages of 15-29), which is significantly above the 30% recommended as sustainable (CMHC, 2010b). Overall, the 2006 Census found that 46% of all tenants in West Broadway spent more than 30% of their household income on shelter (City of Winnipeg, 2006a). Among those who owned their dwellings, 33% found themselves in this situation.
For economic families in West Broadway, 24.9% of income comes in the form of government transfer payments, compared with 9.7% for the city as a whole. As “Work in Progress” highlights, “Core housing need is especially an issue for those on fixed incomes who do not have their rental rates geared to their income” (West Broadway Development Corporation 2007: 9).
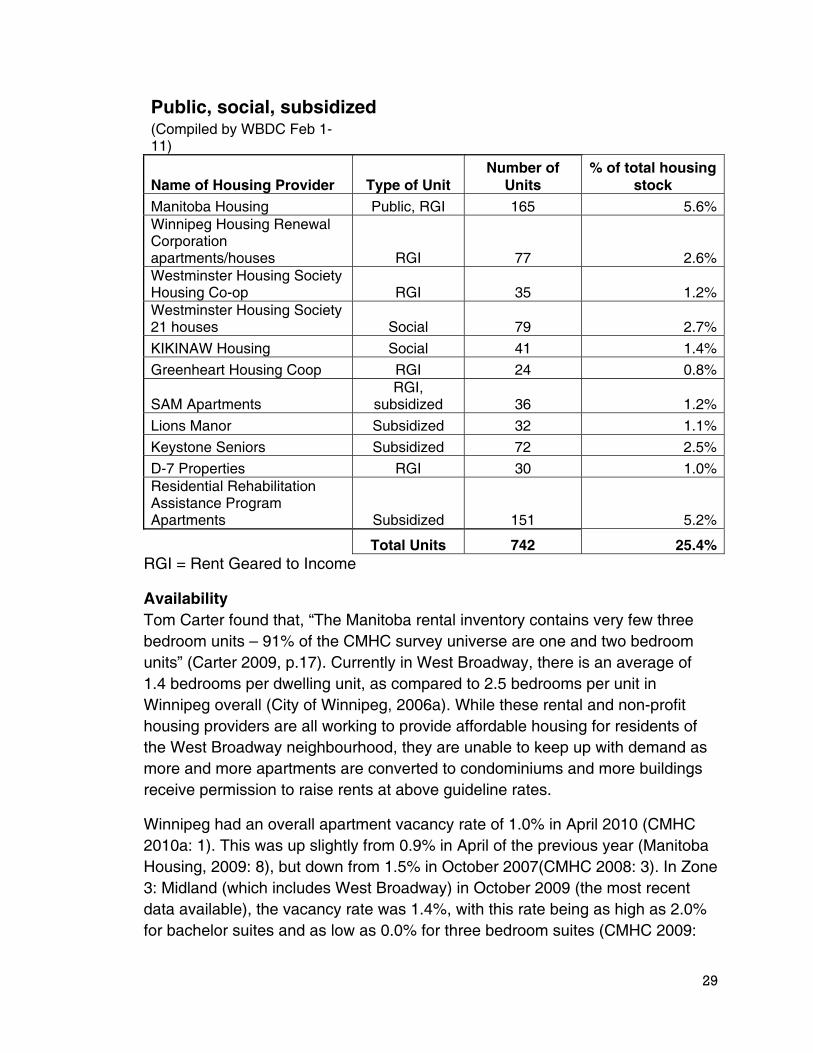
Public, social, and subsidized housing is often relied on to fill the gap in affordability. In West Broadway, a number of housing providers supply a total of 742 units to the neighbourhood’s housing stock, or 25.4% of the total housing stock.
45.8%
33.3%37.3%
11.6%
0.0%
10.0%
20.0%
30.0%
40.0%
50.0%
Tenant-occupiedhouseholds
Owner-occupiedhouseholds
Households Spending 30% or more of Household Income on Shelter
West Broadway
Winnipeg
29
Public, social, subsidized (Compiled by WBDC Feb 1-11)
Name of Housing Provider Type of Unit Number of
Units % of total housing
stock Manitoba Housing Public, RGI 165 5.6% Winnipeg Housing Renewal Corporation apartments/houses RGI 77 2.6% Westminster Housing Society Housing Co-op RGI 35 1.2% Westminster Housing Society 21 houses Social 79 2.7%
KIKINAW Housing Social 41 1.4%
Greenheart Housing Coop RGI 24 0.8%
SAM Apartments RGI,
subsidized 36 1.2%
Lions Manor Subsidized 32 1.1%
Keystone Seniors Subsidized 72 2.5%
D-7 Properties RGI 30 1.0% Residential Rehabilitation Assistance Program Apartments Subsidized 151 5.2%
Total Units 742 25.4% RGI = Rent Geared to Income
Availability Tom Carter found that, “The Manitoba rental inventory contains very few three bedroom units – 91% of the CMHC survey universe are one and two bedroom units” (Carter 2009, p.17). Currently in West Broadway, there is an average of 1.4 bedrooms per dwelling unit, as compared to 2.5 bedrooms per unit in Winnipeg overall (City of Winnipeg, 2006a). While these rental and non-profit housing providers are all working to provide affordable housing for residents of the West Broadway neighbourhood, they are unable to keep up with demand as more and more apartments are converted to condominiums and more buildings receive permission to raise rents at above guideline rates.
Winnipeg had an overall apartment vacancy rate of 1.0% in April 2010 (CMHC 2010a: 1). This was up slightly from 0.9% in April of the previous year (Manitoba Housing, 2009: 8), but down from 1.5% in October 2007(CMHC 2008: 3). In Zone 3: Midland (which includes West Broadway) in October 2009 (the most recent data available), the vacancy rate was 1.4%, with this rate being as high as 2.0% for bachelor suites and as low as 0.0% for three bedroom suites (CMHC 2009:
30
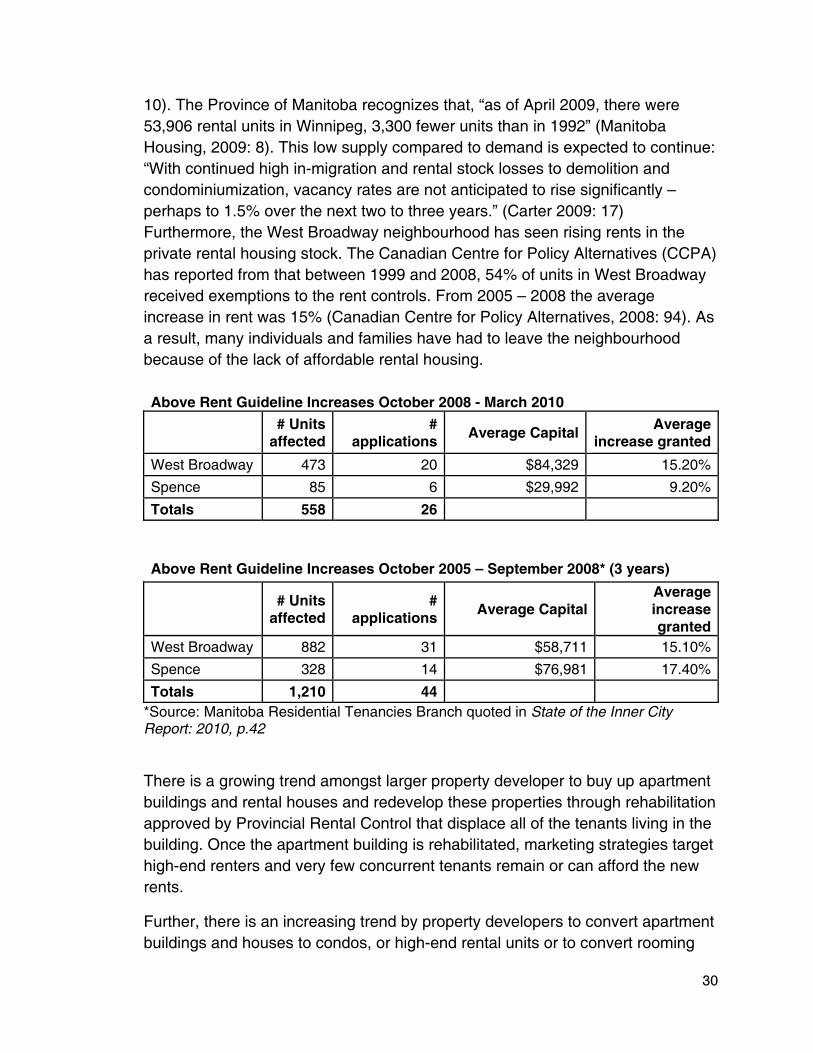
10). The Province of Manitoba recognizes that, “as of April 2009, there were 53,906 rental units in Winnipeg, 3,300 fewer units than in 1992” (Manitoba Housing, 2009: 8). This low supply compared to demand is expected to continue: “With continued high in-migration and rental stock losses to demolition and condominiumization, vacancy rates are not anticipated to rise significantly – perhaps to 1.5% over the next two to three years.” (Carter 2009: 17) Furthermore, the West Broadway neighbourhood has seen rising rents in the private rental housing stock. The Canadian Centre for Policy Alternatives (CCPA) has reported from that between 1999 and 2008, 54% of units in West Broadway received exemptions to the rent controls. From 2005 – 2008 the average increase in rent was 15% (Canadian Centre for Policy Alternatives, 2008: 94). As a result, many individuals and families have had to leave the neighbourhood because of the lack of affordable rental housing.
Above Rent Guideline Increases October 2008 - March 2010
# Units
affected #
applications Average Capital
Average increase granted
West Broadway 473 20 $84,329 15.20%
Spence 85 6 $29,992 9.20%
Totals 558 26
Above Rent Guideline Increases October 2005 – September 2008* (3 years)
# Units
affected #
applications Average Capital
Average increase granted
West Broadway 882 31 $58,711 15.10%
Spence 328 14 $76,981 17.40%
Totals 1,210 44 *Source: Manitoba Residential Tenancies Branch quoted in State of the Inner City Report: 2010, p.42
There is a growing trend amongst larger property developer to buy up apartment buildings and rental houses and redevelop these properties through rehabilitation approved by Provincial Rental Control that displace all of the tenants living in the building. Once the apartment building is rehabilitated, marketing strategies target high-end renters and very few concurrent tenants remain or can afford the new rents.
Further, there is an increasing trend by property developers to convert apartment buildings and houses to condos, or high-end rental units or to convert rooming
31
house to single family dwellings or duplexes or triplexes. The condo conversion trend will reduce the total number of available and affordable rental units in West Broadway. Currently, there is no City by laws to reduce condo conversions of apartment buildings.
m. Mobility
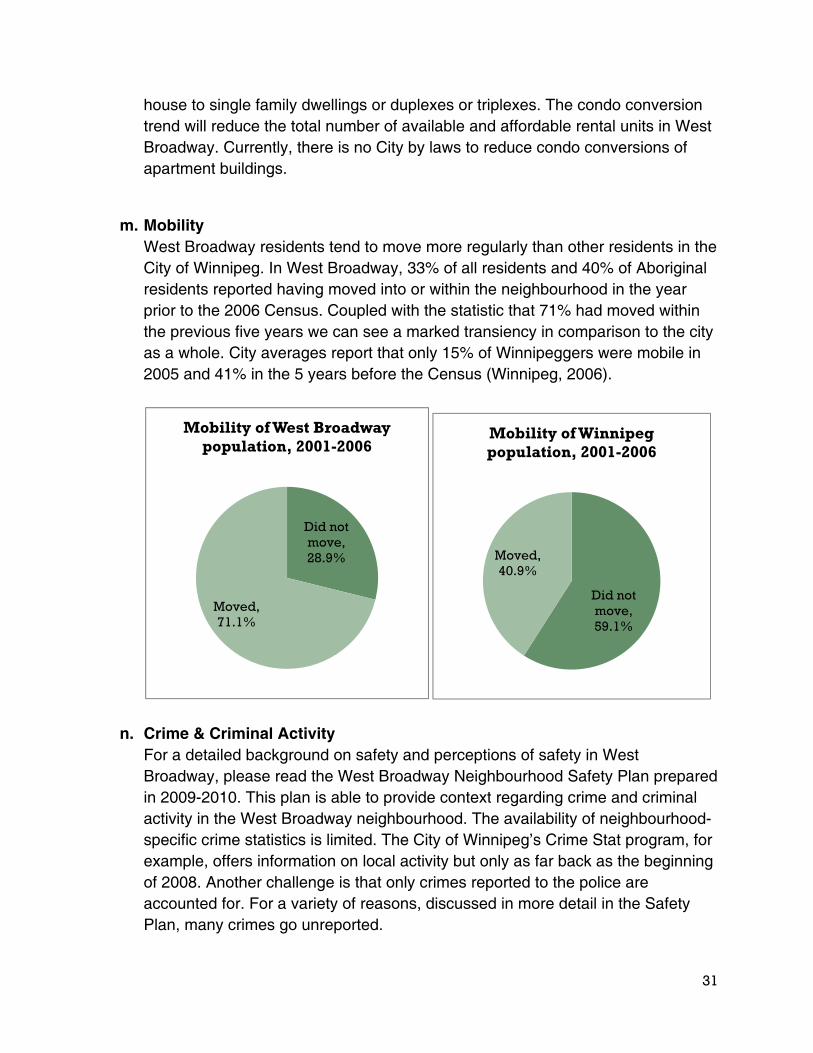
West Broadway residents tend to move more regularly than other residents in the City of Winnipeg. In West Broadway, 33% of all residents and 40% of Aboriginal residents reported having moved into or within the neighbourhood in the year prior to the 2006 Census. Coupled with the statistic that 71% had moved within the previous five years we can see a marked transiency in comparison to the city as a whole. City averages report that only 15% of Winnipeggers were mobile in 2005 and 41% in the 5 years before the Census (Winnipeg, 2006).
n. Crime & Criminal Activity For a detailed background on safety and perceptions of safety in West Broadway, please read the West Broadway Neighbourhood Safety Plan prepared in 2009-2010. This plan is able to provide context regarding crime and criminal activity in the West Broadway neighbourhood. The availability of neighbourhood-specific crime statistics is limited. The City of Winnipeg’s Crime Stat program, for example, offers information on local activity but only as far back as the beginning of 2008. Another challenge is that only crimes reported to the police are accounted for. For a variety of reasons, discussed in more detail in the Safety Plan, many crimes go unreported.
Did not move, 28.9%
Moved, 71.1%
Mobility of West Broadway population, 2001-2006
Did not move, 59.1%
Moved, 40.9%
Mobility of Winnipeg population, 2001-2006

T1frre
NcreDcin“Uvstovre
That said, it 3, 2010 Werom the samesidential b
Note – It shoommon conegarding th
Domestic viorime statist
n recent yeaUnknown” oiewed sepaexual assao go to a seiewed with eality.
can certainest Broadwme date in 2break & ente
ould also bencern for me Safety Plolence is notics becausars for sepaoffender searately in Cult is the sa
eparate plac regular sta
nly be takenway had see2008. At theers and com
e recognizemany comm
lan is not reotably diffice it is not rearating sex
exual assaurime Stat, wame whethece online to
atistics, sug
n as a positen an overae same timmmercial/fin
ed that domunity membepresented cult to measeported as ual assault lts. “Known
which potener the perpeo find this ingesting the
tive indicatoall 20% dec
me, certain cnancial rob
mestic violenbers throug on the tabsure and is often. Crim statistics in
n offender sntially confuetrator is knnformation ere are less
or that as orease in cri
crime typesberies, saw
nce, thoughghout discule above. not capture
me Stat has nto “Knownsexual assauses the issnown or nomeans it is
s sexual ass
of Novembeiminal activ
s, like w an increas
h cited as assions
ed as often been critic
n” and aults” must sue – clear
ot. Also, hav not being saults than
32
er vity
se.
a
n in cized
be ly a ving
in
o. CTnc
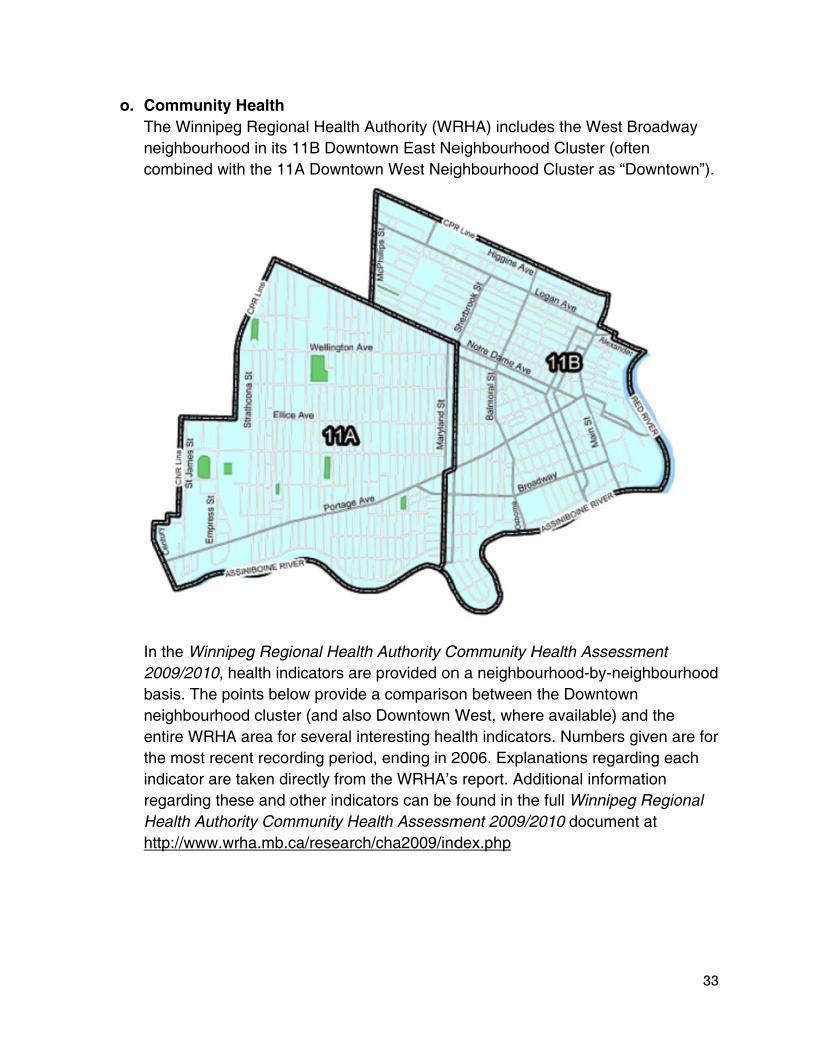
In2bnethinreHh
CommunityThe Winnipe
eighbourhoombined w
n the Winnip2009/2010,
asis. The peighbourhontire WRHAhe most recndicator areegarding th
Health Authttp://www.w
y Health eg Regionaood in its 11
with the 11A
ipeg Regionhealth indic
points belowood cluster A area for scent recordie taken direese and otority Comm
wrha.mb.ca
al Health Au1B Downtow
A Downtown
nal Health Acators are pw provide a (and also Dseveral inteing period,
ectly from thher indicato
munity Heala/research/c
uthority (WRwn East Nen West Neig
Authority Cprovided on comparisoDowntown Weresting hea ending in 2he WRHA’sors can be flth Assessmcha2009/ind
RHA) includeighbourhooghbourhood
Community Hn a neighboon between West, wheralth indicato2006. Explas report. Adfound in the
ment 2009/2dex.php
des the Weod Cluster d Cluster as
Health Assourhood-by- the Downtre availableors. Numbeanations regditional infoe full Winni2010 docum
est Broadwa(often s “Downtow
essment -neighbourhtown e) and the ers given argarding eacormation ipeg Regionment at
33
ay
wn”).
hood
re for ch
nal
34
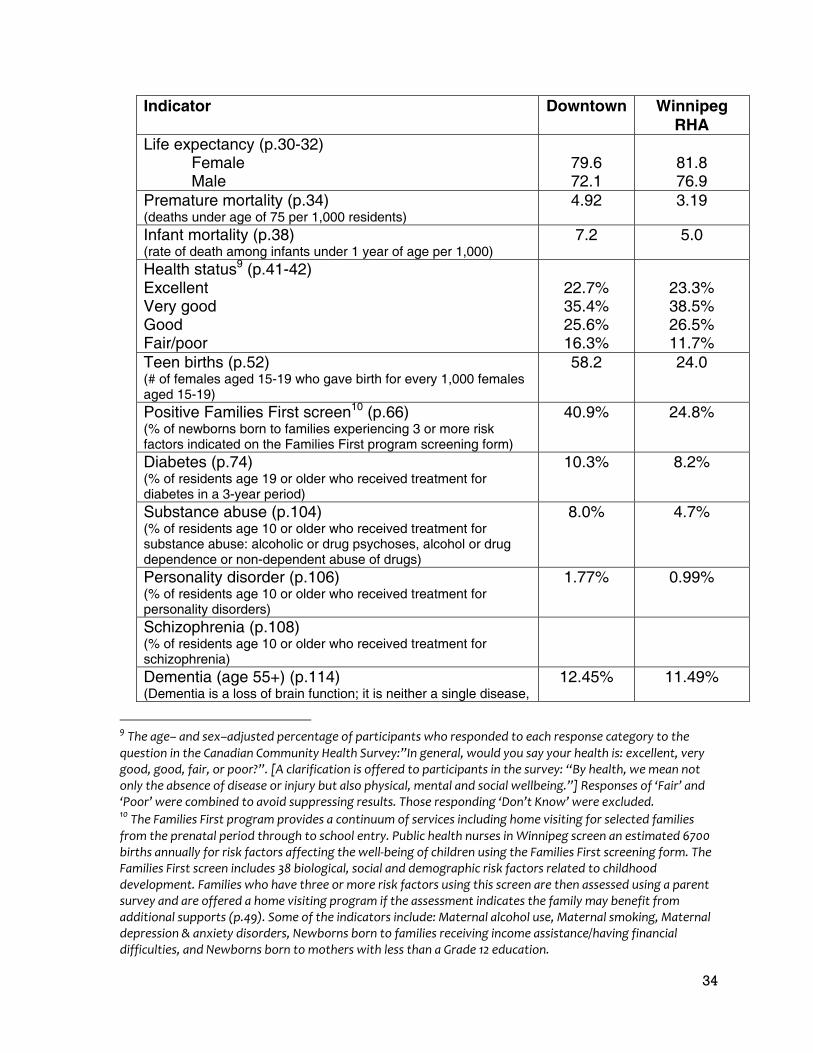
Indicator Downtown Winnipeg RHA
Life expectancy (p.30-32) Female Male
79.6 72.1
81.8 76.9
Premature mortality (p.34) (deaths under age of 75 per 1,000 residents)
4.92 3.19
Infant mortality (p.38) (rate of death among infants under 1 year of age per 1,000)
7.2 5.0
Health status9 (p.41-42) Excellent Very good Good Fair/poor
22.7% 35.4% 25.6% 16.3%
23.3% 38.5% 26.5% 11.7%
Teen births (p.52) (# of females aged 15-19 who gave birth for every 1,000 females aged 15-19)
58.2 24.0
Positive Families First screen10 (p.66) (% of newborns born to families experiencing 3 or more risk factors indicated on the Families First program screening form)
40.9% 24.8%
Diabetes (p.74) (% of residents age 19 or older who received treatment for diabetes in a 3-year period)
10.3% 8.2%
Substance abuse (p.104) (% of residents age 10 or older who received treatment for substance abuse: alcoholic or drug psychoses, alcohol or drug dependence or non-dependent abuse of drugs)
8.0% 4.7%
Personality disorder (p.106) (% of residents age 10 or older who received treatment for personality disorders)
1.77% 0.99%
Schizophrenia (p.108) (% of residents age 10 or older who received treatment for schizophrenia)
Dementia (age 55+) (p.114) (Dementia is a loss of brain function; it is neither a single disease,
12.45% 11.49%
9 The age– and sex–adjusted percentage of participants who responded to each response category to the question in the Canadian Community Health Survey:”In general, would you say your health is: excellent, very good, good, fair, or poor?”. [A clarification is offered to participants in the survey: “By health, we mean not only the absence of disease or injury but also physical, mental and social wellbeing.”] Responses of ‘Fair’ and ‘Poor’ were combined to avoid suppressing results. Those responding ‘Don’t Know’ were excluded. 10 The Families First program provides a continuum of services including home visiting for selected families from the prenatal period through to school entry. Public health nurses in Winnipeg screen an estimated 6700 births annually for risk factors affecting the well‐being of children using the Families First screening form. The Families First screen includes 38 biological, social and demographic risk factors related to childhood development. Families who have three or more risk factors using this screen are then assessed using a parent survey and are offered a home visiting program if the assessment indicates the family may benefit from additional supports (p.49). Some of the indicators include: Maternal alcohol use, Maternal smoking, Maternal depression & anxiety disorders, Newborns born to families receiving income assistance/having financial difficulties, and Newborns born to mothers with less than a Grade 12 education.
35
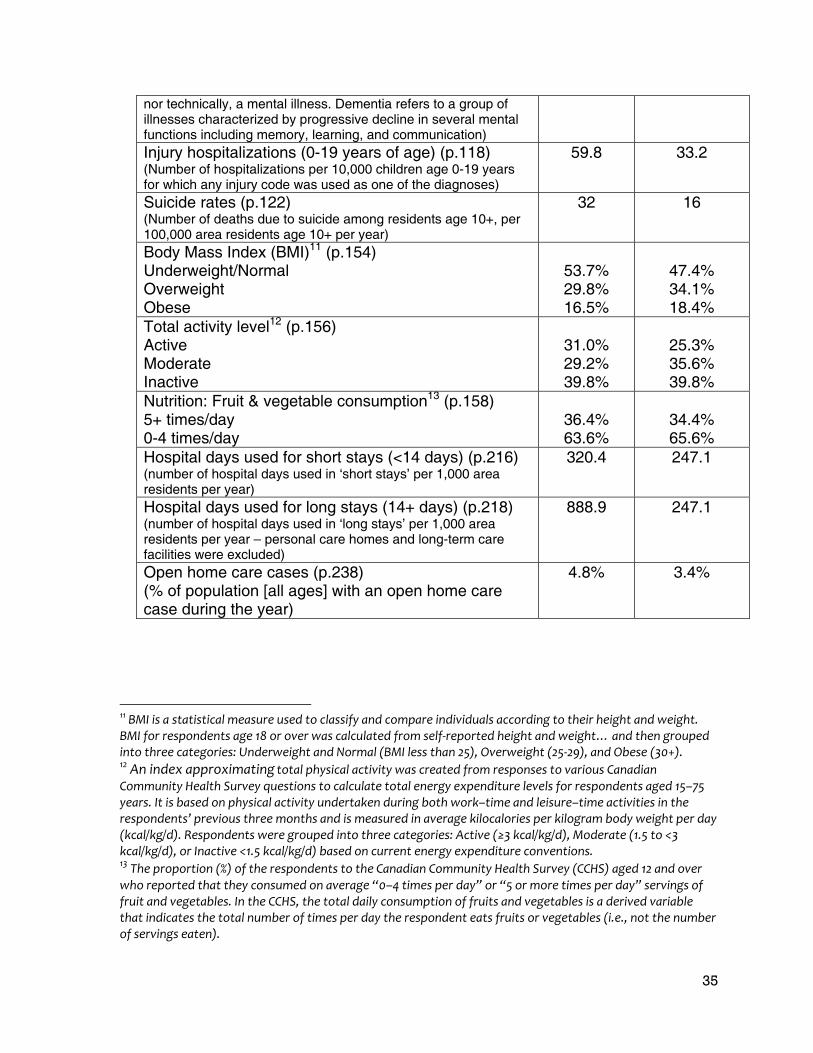
nor technically, a mental illness. Dementia refers to a group of illnesses characterized by progressive decline in several mental functions including memory, learning, and communication) Injury hospitalizations (0-19 years of age) (p.118) (Number of hospitalizations per 10,000 children age 0-19 years for which any injury code was used as one of the diagnoses)
59.8 33.2
Suicide rates (p.122) (Number of deaths due to suicide among residents age 10+, per 100,000 area residents age 10+ per year)
32 16
Body Mass Index (BMI)11 (p.154) Underweight/Normal Overweight Obese
53.7% 29.8% 16.5%
47.4% 34.1% 18.4%
Total activity level12 (p.156) Active Moderate Inactive
31.0% 29.2% 39.8%
25.3% 35.6% 39.8%
Nutrition: Fruit & vegetable consumption13 (p.158) 5+ times/day 0-4 times/day
36.4% 63.6%
34.4% 65.6%
Hospital days used for short stays (<14 days) (p.216) (number of hospital days used in ‘short stays’ per 1,000 area residents per year)
320.4 247.1
Hospital days used for long stays (14+ days) (p.218) (number of hospital days used in ‘long stays’ per 1,000 area residents per year – personal care homes and long-term care facilities were excluded)
888.9 247.1
Open home care cases (p.238) (% of population [all ages] with an open home care case during the year)
4.8% 3.4%
11 BMI is a statistical measure used to classify and compare individuals according to their height and weight. BMI for respondents age 18 or over was calculated from self‐reported height and weight… and then grouped into three categories: Underweight and Normal (BMI less than 25), Overweight (25‐29), and Obese (30+). 12 An index approximating total physical activity was created from responses to various Canadian Community Health Survey questions to calculate total energy expenditure levels for respondents aged 15–75 years. It is based on physical activity undertaken during both work–time and leisure–time activities in the respondents’ previous three months and is measured in average kilocalories per kilogram body weight per day (kcal/kg/d). Respondents were grouped into three categories: Active (≥3 kcal/kg/d), Moderate (1.5 to <3 kcal/kg/d), or Inactive <1.5 kcal/kg/d) based on current energy expenditure conventions. 13 The proportion (%) of the respondents to the Canadian Community Health Survey (CCHS) aged 12 and over who reported that they consumed on average “0–4 times per day” or “5 or more times per day” servings of fruit and vegetables. In the CCHS, the total daily consumption of fruits and vegetables is a derived variable that indicates the total number of times per day the respondent eats fruits or vegetables (i.e., not the number of servings eaten).
36
Notes about Downtown East neighbourhood specifically: Health status: In Downtown East, the % of those reporting “Excellent” health status was below 20%, while the % of those reporting their status as “Fair/Poor” was more than 20% (p.42). Teen births: In Downtown East, the rate of teen births was closer to 75 (p.53). In both the Downtown and the Winnipeg RHA teen births decreased by about 20% from the previous 5 year period. Positive Families First screen: Alcohol use among expectant mothers was found to be higher in Downtown at 16.7%, compare with 12.1% across the Winnipeg RHA in 2006 (p.56). Substance Abuse: While the prevalence of substance abuse declined across the Winnipeg RHA (-7.9%), the rate increased by 6.8% in Downtown and reached a rate of almost 10% in Downtown East (p.105). Personality Disorder: Prevalence of treatment for personality disorders was more than 2% in Downtown East (p.107). Schizophrenia: In Downtown East, 3.26% of residents received treatment for schizophrenia (p.109). Suicide Rates: Suicide rates in Downtown increased 32.8% over the previous 5 year period (compared with an increase of 8.4% across the Winnipeg RHA).
4. Commercial Activity & Community Services Commercial activity and community services in West Broadway are concentrated around Sherbrook Street and Broadway. The West Broadway Business Improvement Zone is active in the neighbourhood, representing over one hundred businesses.
i. Types of Businesses and Services The neighbourhood is fortunate to have a bank branch as well as several grocers. Bank branch Assiniboine Credit Union (640 Broadway) Grocers AM Foodfare (115 Maryland Street) Shell Food Store (229 Sherbrook Street) D’s Market (591 Broadway) Helen Grocery (635 Westminster Avenue) Korner Stop Foods (83-E Sherbrook Street) Pal’s Supermarket (619 Broadway) Halal Meat Centre (206 Maryland)
37
Young Food Mart (96 Young Street) Legal Services Downtown Legal Action (586 Broadway)
ii. Community agencies West Broadway also has numerous community service organizations providing important programs and services in the neighbourhood. Community Service Little Red Spirit Aboriginal Head Start Program (185 Young Street) Art City (616 Broadway)
• Drop-in studio: Monday-Friday 4:00-8:00PM Broadway Neighbourhood Centre (185 Young Street)
• Drop-in: Monday-Friday 4:00-8:00PM Clubhouse (172 Sherbrook Street) The Clubhouse is a Mental Health rehabilitation agency funded by the Winnipeg Regional Health Authority. We assist adults in their recovery from major mental illnesses by providing a range of work, educational, social and recreational opportunities. As people participate, learn life and work skills and become more confident, they become better prepared for successful and independent community living.
• Drop-in hours for members only: Monday-Thursday 8:00AM-3:00PM, Friday 8:00AM-5:00PM
Creative Retirement Manitoba (270 Sherbrook Street)
• Office hours: Monday-Friday 8:30am-4:30 pm Crisis Pregnancy Centre (650 Broadway) Crossways in Common (222 Furby Street) Klinic Community Health Centre (545 Broadway)
• Health programming and counselling, drop-in counselling hours: Mondays & Wednesdays Noon – 7:00PM; Tuesdays, Fridays & Saturdays Noon – 4:00PM

38
Mulvey School Housing Registry (http://housing.wsd1.org/) Nine Circles Community Health Centre (705 Broadway)
• Drop-in, safe and confidential HIV/STI testing, treatment and referral, every Wednesday 1:00 - 7:00PM
RAY (Resource Assistance for Youth) (125 Sherbrook Street)
• Drop-in hours: Monday-Friday 1:00-3:00PM, Wednesday-Friday 5:00-9:00PM, Saturday 12:00-4:00PM
The 595 Prevention Team (595 Broadway) West Broadway Development Corporation (608 Broadway)
• Neighbourhood renewal organization, office hours: Monday-Friday 9:00AM-5:00PM
West Broadway BIZ A BIZ is a “group of businesses joined together, to market their business district, to sponsor events which enhance the area, and improve physical amenities. The BIZ is also a voice in the political sphere on issues of concern to the area. Every retail, commercial and professional business in the zone is automatically a contributing member. The BIZ is funded by a special levy on business taxes and it provides the funds to do things that businesses in the zone feel are important” (http://www.westbroadwaybiz.com/pages/about.html) The boundaries of the West Broadway Business Improvement Zone (BIZ) are Canora Street to the west, Osborne Street N. to the east, Portage Avenue to the north, and the Assiniboine River to the south. West Broadway Youth Outreach (203-222 Furby Street)
• Drop-in: Monday-Thursday 3:40-8:30PM Wolseley Family Place (Lower Level, 691 Wolseley Avenue) Villa Rosa (784 Wolseley Avenue) Child Care Day Nursery – Crossways (103 - 222 Furby Street)
• 44 licensed spaces (8 infant & 36 preschool), hours of operation: Monday-Friday 7:30AM - 6:00PM

39
Cornish Child Care Centre (25 Furby Street)
• 45 licensed spaces (8 infant & 37 preschool), hours of operation: Monday-Friday 7:00AM - 5:30PM
Wolseley Family Place Playroom (Lower Level, 691 Wolseley Avenue)
• 18 licensed spaces, hours of operation vary
Just outside the boundaries of West Broadway: Provincial Employee Day Care / Osborne (208 Osborne Street N)
• 48 licensed spaces, hours of operation: Monday-Friday 7:00AM - 5:30PM
Westminster Children's Care Centre (745 Westminster Avenue)
• 50 licensed spaces (12 preschool & 38 school age), hours of operation: Monday-Friday 7:30AM - 5:30PM
iii. Recreation centres
Broadway Neighbourhood Centre (185 Young Street), the local recreational facility, features a gym, a public computer area, a skating rink, a soccer field, and a wading pool with spray features. The Centre also offers diverse recreational program for residents of all ages.
iv. Green spaces Broadway Neighbourhood Centre (185 Young Street) Spirit Park & Butterfly Park (tot lot) (200 Young Street) Sherbrook Street Community Garden (198 Sherbrook Street) Boulder Park (152 Langside Street) Urban Agriculture site at Klinic (545 Broadway) Kids’ Garden (615 Westminster Avenue) Great West Life Green Space (Balmoral Street) Mostyn Park Place (40 Mostyn Place) River Trail (Assiniboine River) Base of Sherbrook/Maryland Bridges
v. Community facilities Crossways in Common (222 Furby Street) houses several church groups, a day care, a drop-in, and meeting spaces.
vi. Health Centres
40
Misericordia Health Centre (99 Cornish Avenue) is in the West Broadway neighbourhood and in addition to its buildings and clinics, there are several other health-related centres including: Four Rivers Medical Clinic (647 Broadway) Centre For Natural Pain Solutions (578 Broadway) Easy Street Misericordia Health Centre (25 Sherbrook Street) Jain Medical Centre (83-A Sherbrook Street) Manitoba Breast Screening Program (2-25 Sherbrook Street) South Sherbrook Health Centre (88 Sherbrook Street) The Aches & Pains Clinic (62 Sherbrook Street) Lotus House of Integrated Wellness (130 Sherbrook Street) Westminster Chiropractic Clinic (98 Sherbrook Street) Associations Canadian Cancer Society (193 Sherbrook Street) Dental Broadway Dental Centre (640 Broadway) Dr. Vijay K. Pruthi, Periodontist (606 Broadway) Orotech Orthodontics (206-83 Sherbrook Street) Sherbrook Heights Dental Centre (204-83 Sherbrook Street) Massage Therapy Alan Hare (201-670 Broadway) Andrew Chabidon (202-670 Broadway) Bodhi Massage Therapy (62 Sherbrook Street) Centre For Natural Pain Solutions (578 Broadway) Pharmacy Broadway Pharmacy (618 Broadway) Four Rivers Pharmacy (647 Broadway) South Sherbrook Pharmacy (88 Sherbrook Street) Rexall Pharmacy (676 Portage Avenue)
vii. Library The Cornish Library (20 West Gate) is just outside the West Broadway neighbourhood. It is currently open five days a week: Monday, Tuesday, and Thursday from 1:00-8:30pm and on Friday and Saturday from 10:00am-5:00pm.
viii. Police West Broadway is in District 1. The Community Service Centre and District Station are located in the Public Safety Building at 151 Princess (Downtown).

41
ix. Schools
Two public schools are just outside the boundaries of the West Broadway neighbourhood; these are the schools that many West Broadway children attend. Mulvey School (750 Wolseley Avenue) offers programs for Nursery-Grade 6. Gordon Bell (3 Borrowman Place) students are in Grades 7-12. Mulvey and Gordon Bell are in the Inner City District of the Winnipeg One school division. Westgate Mennonite Collegiate (also just outside the neighbourhood at 86 West Gate) is a private school offering Grades 7-12. Balmoral Hall (in the West Broadway neighbourhood at 630 Westminster Avenue) is a private all-girls school for Kindergarten to Grade 12. Balmoral Hall also provides child care for 2 & 3 year old girls.
x. Senior’s care Lions Personal Care Centre (just outside West Broadway at 320 Sherbrook Street) Misericordia Place (44 Furby Street) Misericordia Health Centre (99 Cornish Avenue)
xi. Transport West Broadway’s central location makes it quite convenient for travel around the city. Many bus routes service the neighbourhood, with several running along Portage to the north and more along Osborne to the east. Sherbrook, Maryland, Broadway, Wolseley, Westminster, and Balmoral all have some bus traffic. Sherbrook and Maryland as well as St. Mary’s and York are identified as part of the City’s Active Transportation Network and feature painted bike lanes and sharrow symbols. The Assiniboine Bikeway ends just east of the neighbourhood. Wolseley Ave. is closed to car traffic west of Maryland on Sundays in the summer, as is Wellington Cres. across the Sherbrook/Maryland Bridges to the southwest of West Broadway.