werner weiss, aee – institute for sustainable technologies ... · by vienna university of...
TRANSCRIPT
Werner Weiss, AEE – Institute for Sustainable TechnologiesPeter Biermayr, Vienna University of Technology
Potential of Solar Thermal in Europe
This report was prepared within the framework of the EU-funded project RESTMAC, TREN/05/FP6EN/S07.58365/020185
Reproduction allowed provided the source is acknowledged
The Solar Thermal Partner in the RESTMAC Project is:
European Solar Thermal Industry Federation Federation (ESTIF) Renewable Energy House Rue d'Arlon 63-67 B-1040 Bruxelles Belgium Tel: +32 2 546 19 38 Fax: +32 2546 19 39 E-mail: [email protected]: www.estif.org
Authors:
AEE - Institute for Sustainable Technologies Feldgasse 19 A-8200 Gleisdorf Austria Tel: +43 3112 5886 17 Fax: +43 3112 5886 18 E-Mail: [email protected]
Vienna University of Technology Energy Economics Group 1040 Vienna Tel: +43 1 58801 357118 Fax: +43 1 58801 35799 E-Mail: [email protected]
Potential of Solar Thermal in Europe 5
Table of Contents
1� BACKGROUND ..................................................................................... 7�
2� OVERALL ENERGY DEMAND IN THE EU-27 .......................................... 9�
2.1� Energy Consumption and Breakdown by Sectors ............................ 9�
3� REFERENCE COUNTRIES AND SECTORS ENERGY DEMAND ................ 13�
3.1� Energy Related Characteristics of the Reference Countries .......... 13�3.2� Current Heat Demand in the Reference Countries ........................ 16�3.2.1� Country Study: Austria ............................................................ 17�3.2.2� Country Study: Germany ......................................................... 20�3.2.3� Country Study: Denmark.......................................................... 23�3.2.4� Country Study: Spain .............................................................. 26�3.2.5� Country Study: Poland ............................................................. 28�3.3� Heating and Cooling by Sector ...................................................... 31�3.3.1� Households Sector ................................................................... 31�3.3.2� Services Sector ....................................................................... 34�3.3.3� Industry Sector ....................................................................... 35�
4� SOLAR THERMAL MARKETS ............................................................... 37�
4.1� Installed Capacity Worldwide ....................................................... 37�4.1.1� Market Development ................................................................ 38�4.1.2� Contribution from solar collectors to the supply of energy ............. 39�4.2� Installed Capacity Europe ............................................................. 39�4.2.1� Breakdown by Application ......................................................... 40�4.3� Solar Thermal Market in the Reference Countries ......................... 41�4.3.1� Market Development in Austria ................................................. 43�4.3.2� Market Development in Denmark ............................................... 44�4.3.3� Market Development in Germany ............................................... 44�4.3.4� Market Development in Poland .................................................. 45�4.3.5� Market Development in Spain ................................................... 45�
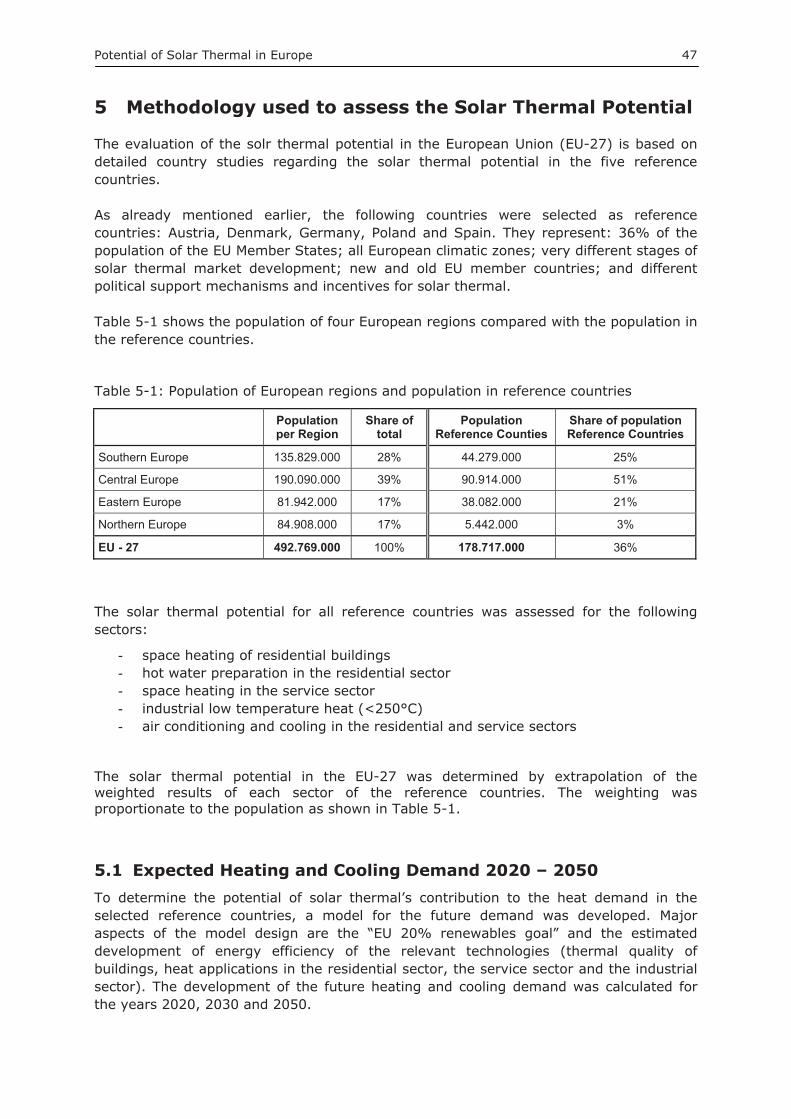
5� METHODOLOGY USED TO ASSESS THE SOLAR THERMAL POTENTIAL 47�
5.1� Expected Heating and Cooling Demand 2020 – 2050 .................... 47�5.1.1� Development of Space Heating .................................................. 48�5.1.2� Development of Air Conditioning and Cooling .............................. 51�5.1.3� Development of Industrial Heat ................................................. 52�5.2� Limiting Factors for the Installation of Solar Thermal Systems .... 53�5.2.1� Availability of key components .................................................. 53�5.2.2� Availability of space for the installation of solar thermal collectors .. 53�5.3� Scenarios ...................................................................................... 54�5.3.1� Business as Usual (BAU) .......................................................... 54�5.3.2� Advanced Market Deployment (AMD) ......................................... 54�5.3.3� Full R&D and Policy Scenario (RDP) ............................................ 54
Potential of Solar Thermal in Europe 6
6� SOLAR THERMAL POTENTIAL IN THE REFERENCE COUNTRIES .......... 56�
6.1� Austrian Solar Thermal Potential .................................................. 57�6.1.1� The short-term potential - 2020 ................................................ 58�6.1.2� The medium-term potential - 2030 ............................................ 60�6.1.3� The long-term potential - 2050 ................................................. 60�6.1.4� Availability of suitable roof, facade and land area ......................... 63�6.1.5� Impact on employment ............................................................ 64�6.2� Danish Solar Thermal Potential .................................................... 65�6.2.1� The short-term potential - 2020 ................................................ 67�6.2.2� The medium-term potential - 2030 ............................................ 68�6.2.3� The long-term potential - 2050 ................................................. 68�6.2.4� Availability of suitable roof, facade and land area ......................... 71�6.2.5� Impact on employment ............................................................ 72�6.3� German Solar Thermal Potential ................................................... 73�6.3.1� The short-term potential - 2020 ................................................ 74�6.3.2� The medium-term potential - 2030 ............................................ 76�6.3.3� The long-term potential - 2050 ................................................. 76�6.3.4� Availability of suitable roof, facade and land area ......................... 79�6.3.5� Impact on employment ............................................................ 80�6.4� Polish Solar Thermal Potential ...................................................... 81�6.4.1� The short-term potential - 2020 ................................................ 83�6.4.2� The medium-term potential - 2030 ............................................ 84�6.4.3� The long-term potential - 2050 ................................................. 84�6.4.4� Availability of suitable roof, facade and land area ......................... 87�6.4.5� Impact on employment ............................................................ 87�6.5� Spanish Solar Thermal Potential ................................................... 88�6.5.1� The short-term potential - 2020 ................................................ 90�6.5.2� The medium-term potential - 2030 ............................................ 91�6.5.3� The long-term potential - 2050 ................................................. 91�6.5.4� Availability of suitable roof, facade and land area ......................... 94�6.5.5� Impact on employment ............................................................ 95�
7� SOLAR THERMAL POTENTIAL FOR THE EUROPEAN UNION ................ 96�
7.1� The European short-term potential - 2020 ................................... 98�7.2� The European medium-term potential - 2030 ............................... 99�7.3� The European long-term potential - 2050 ................................... 100�7.4� Economic Impact ........................................................................ 103�7.4.1� Impact on employment .......................................................... 103�7.4.2� Investments 2006 - 2020 ....................................................... 104�7.5� Reduction of Energy Dependency and Environmental Impact ..... 105�
8� REFERENCES ................................................................................... 107�
Potential of Solar Thermal in Europe 7
1 Background
In March 2007, the European Council agreed for the very first time on an “integrated climate and energy policy” including an ‘Energy Action Plan’ (EAP) for the years 2007-2009. Although historically energy issues always played a major role within the European Union, leading up to the treaties of Paris (1951) and Rome (1957) specific institutional provisions were only made for the coal and nuclear industries (resulting in the EURATOM treaty in 1957). With regard to oil, gas and renewable energy sources, each EU Member State was free to set their own national energy policies.
Based on the agreement of March 2007, the European Commission on 23 January 2008 put forward for the first time a far-reaching package of proposals that would deliver on the European Union's ambitious commitments to fight climate change and promote renewable energy up to 2020 and beyond. In December 2008, both the European Parliament and Council reached an agreement on the package that would help transform Europe into a low-carbon economy and increase its energy security.
The EU is committed to reducing its overall emissions to at least 20% below 1990 levels by 2020, and is prepared to scale up this reduction to as much as 30% under a new global climate change agreement if other developed countries make comparable efforts.
The EU has also set the target for increasing the share of renewables in energy use to 20% by 2020. The "climate action and renewable energy package" sets out the contribution expected from each Member State to meeting these targets. The national renewable energy targets proposed for each Member State will contribute to achieving emissions reductions and will also decrease the European Union's dependence on foreign energy sources.
As heat accounts for 49% of the overall European Union final energy demand, the renewable heating sector will have to make a major contribution in order to reach the renewable energy target. Since there are only three renewable sources available (biomass, geothermal and solar) to provide heat, it is essential to show the potential and the areas of application for these renewable energy sources.
In order to provide the European Commission and the Member States with substantiated information on the potential contribution solar thermal energy could make to the 20% renewable energy target, a study on the “Potential of Solar Thermal in Europe” by Vienna University of Technology and AEE - Institute for Sustainable Technologies (AEE INTEC) was commissioned by the European Solar Thermal Industry Federation (ESTIF).
Based on detailed investigations of the solar thermal potential for a representative sample of five European countries an extrapolation was made of the overall solar thermal potential in the EU-27 countries. Both the technical and the economic potential for solar thermal technologies are addressed and investigated for different applications below.
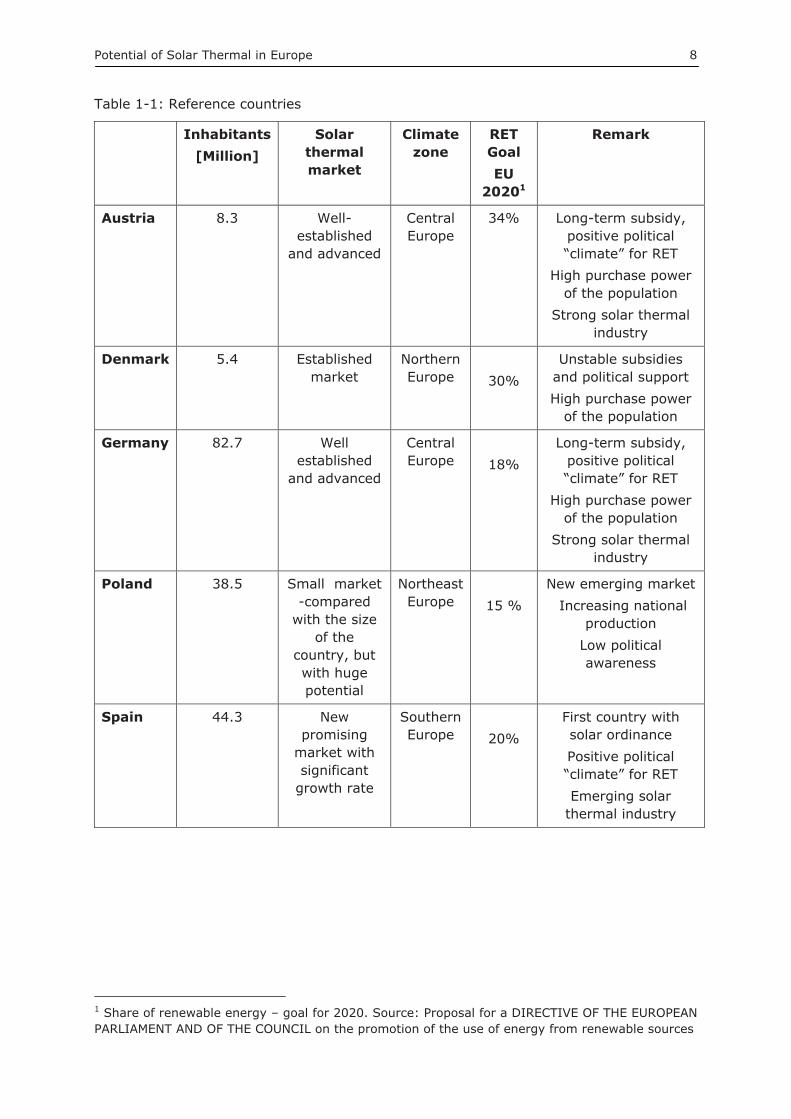
Selection of countries The following countries were selected for detailed investigation: Austria, Denmark, Germany, Poland and Spain. They represent 36% of the population of the EU Member States; all European climatic zones; very different stages of solar thermal market development; new and old EU member countries; and different political support mechanisms and incentives for solar thermal.
Potential of Solar Thermal in Europe 8
Table 1-1: Reference countries
Inhabitants [Million]
Solar thermalmarket
Climatezone
RETGoal EU
20201
Remark
Austria 8.3 Well-established
and advanced
Central Europe
34% Long-term subsidy, positive political “climate” for RET
High purchase power of the population
Strong solar thermal industry
Denmark 5.4 Established market
NorthernEurope 30%
Unstable subsidies and political support High purchase power
of the population
Germany 82.7 Well established
and advanced
Central Europe 18%
Long-term subsidy, positive political “climate” for RET
High purchase power of the population
Strong solar thermal industry
Poland 38.5 Small market -compared
with the size of the
country, but with huge potential
Northeast Europe 15 %
New emerging market Increasing national
productionLow political awareness
Spain 44.3 New promising
market with significant
growth rate
Southern Europe 20%
First country with solar ordinance Positive political “climate” for RET Emerging solar
thermal industry
1 Share of renewable energy – goal for 2020. Source: Proposal for a DIRECTIVE OF THE EUROPEAN PARLIAMENT AND OF THE COUNCIL on the promotion of the use of energy from renewable sources
Potential of Solar Thermal in Europe 9
2 Overall Energy Demand in the EU-27
This chapter describes the overall energy consumption and the current renewable energy consumption in the EU-27 countries.
2.1 Energy Consumption and Breakdown by Sectors The gross inland energy consumption of the EU-27 was 21,227 TWh in the year 2006. In this year, the EU-27 consumed 15.97% of the gross world energy consumption. Between 1990 and 2006, the absolute energy consumption of the EU-27 energy consumption increased by 9.94%; while the share has been steadily decreasing since 1990 (see Figure 2-1). Table 2-1 below shows the development of gross energy consumption of the world, the EU-27 and other selected countries.
Table 2-1: Gross energy consumption worldwide, the EU-27 and reference countries, source: EU 2008
year Gross Inland Energy Consumption By Region/Country (TWh)
World United States EU-27 China Russia India Japan
1990 101.852 22.416 19.307 10.163 10.214 3.720 5.169 1991 102.562 22.604 19.350 10.093 9.848 3.867 5.233 1992 102.666 23.051 18.944 10.450 9.020 4.023 5.349 1993 103.836 23.524 18.929 11.066 8.695 4.112 5.382 1994 104.647 23.997 18.863 11.558 7.598 4.269 5.674 1995 107.269 24.307 19.334 12.345 7.308 4.506 5.805 1996 110.277 24.928 19.991 12.797 7.236 4.656 5.967 1997 111.346 25.188 19.814 12.845 6.921 4.838 6.036 1998 111.988 25.418 20.022 12.869 6.761 4.944 5.959 1999 114.248 26.082 19.889 12.931 7.013 5.244 6.044 2000 116.639 26.826 20.037 13.035 7.140 5.345 6.136 2001 117.087 26.280 20.497 13.024 7.226 5.422 6.041 2002 119.717 26.630 20.443 14.092 7.185 5.568 6.046 2003 123.706 26.549 20.967 16.016 7.439 5.707 5.993 2004 129.507 27.081 21.209 18.609 7.461 6.054 6.190 2005 132.976 27.218 21.233 20.181 7.521 6.249 6.169 2006 21.227
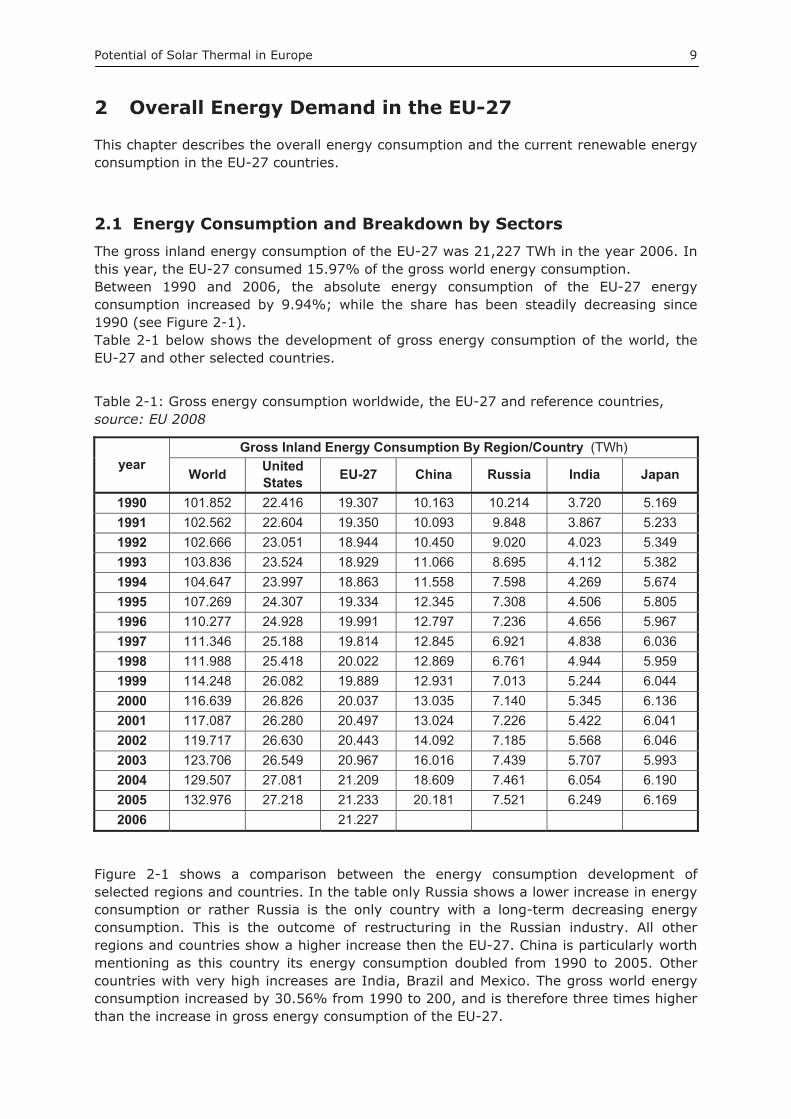
Figure 2-1 shows a comparison between the energy consumption development of selected regions and countries. In the table only Russia shows a lower increase in energy consumption or rather Russia is the only country with a long-term decreasing energy consumption. This is the outcome of restructuring in the Russian industry. All other regions and countries show a higher increase then the EU-27. China is particularly worth mentioning as this country its energy consumption doubled from 1990 to 2005. Other countries with very high increases are India, Brazil and Mexico. The gross world energy consumption increased by 30.56% from 1990 to 200, and is therefore three times higher than the increase in gross energy consumption of the EU-27.
Potential of Solar Thermal in Europe 10
0,60
0,80
1,00
1,20
1,40
1,60
1,80
2,00
1990 1991 1992 1993 1994 1995 1996 1997 1998 1999 2000 2001 2002 2003 2004 2005 2006
WorldUnited StatesEU-27ChinaRussiaIndiaJapanCanadaBrazilMexico
Figure 2-1: Development of gross inland energy consumption of selected regions and countries related to the consumption in the year 1990 (1990=1), source: EU 2008
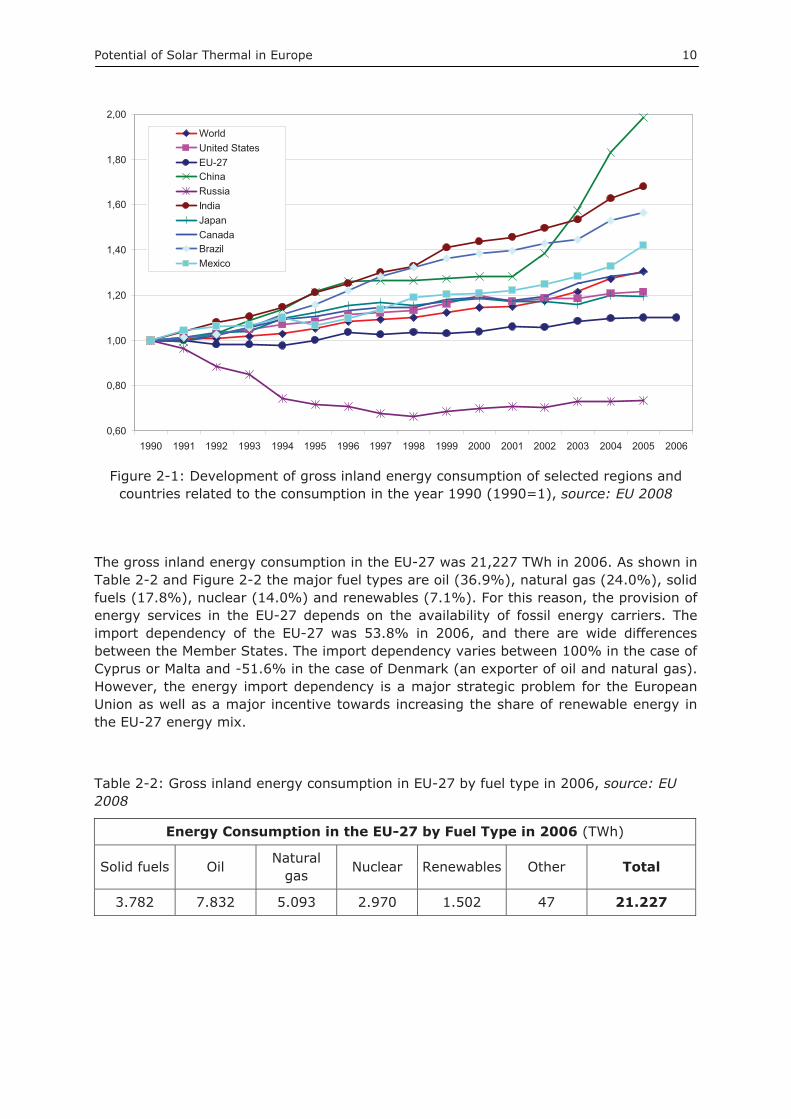
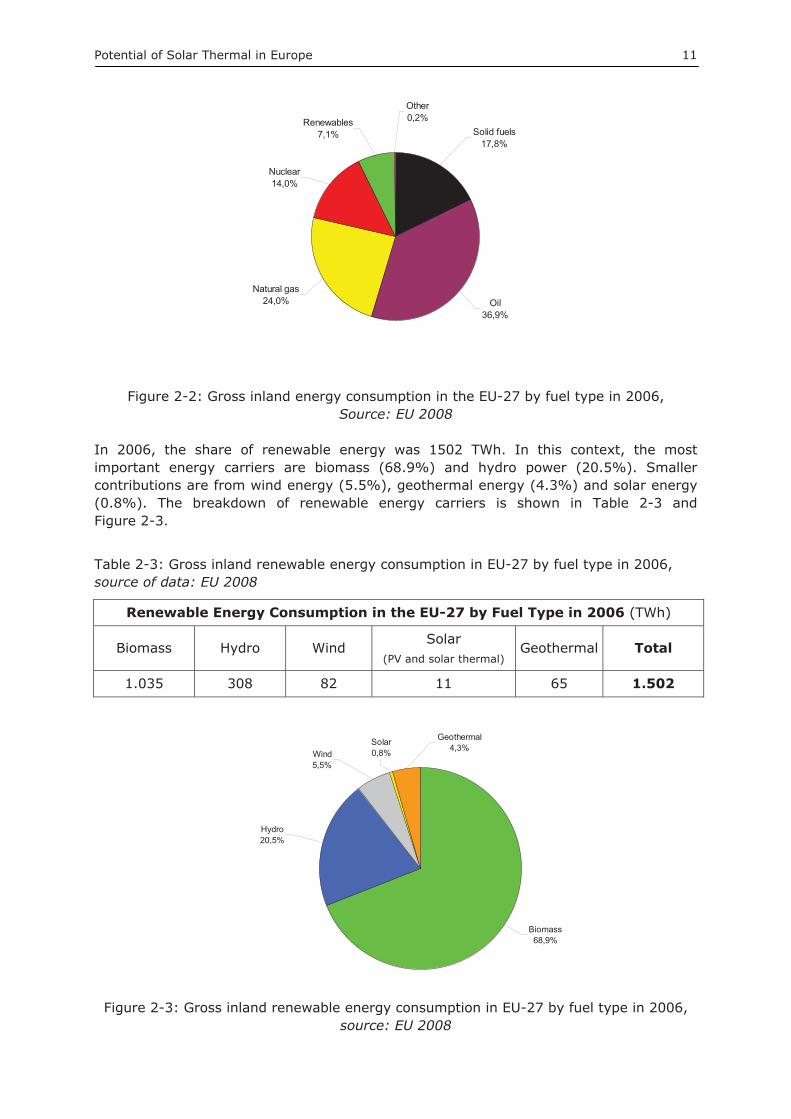
The gross inland energy consumption in the EU-27 was 21,227 TWh in 2006. As shown in Table 2-2 and Figure 2-2 the major fuel types are oil (36.9%), natural gas (24.0%), solid fuels (17.8%), nuclear (14.0%) and renewables (7.1%). For this reason, the provision of energy services in the EU-27 depends on the availability of fossil energy carriers. The import dependency of the EU-27 was 53.8% in 2006, and there are wide differences between the Member States. The import dependency varies between 100% in the case of Cyprus or Malta and -51.6% in the case of Denmark (an exporter of oil and natural gas). However, the energy import dependency is a major strategic problem for the European Union as well as a major incentive towards increasing the share of renewable energy in the EU-27 energy mix.
Table 2-2: Gross inland energy consumption in EU-27 by fuel type in 2006, source: EU 2008
Energy Consumption in the EU-27 by Fuel Type in 2006 (TWh)
Solid fuels Oil Natural gas Nuclear Renewables Other Total
3.782 7.832 5.093 2.970 1.502 47 21.227
Potential of Solar Thermal in Europe 11
Renewables7,1%
Other0,2%
Natural gas24,0%
Nuclear14,0%
Oil36,9%
Solid fuels17,8%
Figure 2-2: Gross inland energy consumption in the EU-27 by fuel type in 2006, Source: EU 2008
In 2006, the share of renewable energy was 1502 TWh. In this context, the most important energy carriers are biomass (68.9%) and hydro power (20.5%). Smaller contributions are from wind energy (5.5%), geothermal energy (4.3%) and solar energy (0.8%). The breakdown of renewable energy carriers is shown in Table 2-3 and Figure 2-3.
Table 2-3: Gross inland renewable energy consumption in EU-27 by fuel type in 2006, source of data: EU 2008
Renewable Energy Consumption in the EU-27 by Fuel Type in 2006 (TWh)
Biomass Hydro Wind Solar
(PV and solar thermal) Geothermal Total
1.035 308 82 11 65 1.502
Solar0,8%Wind
5,5%
Hydro20,5%
Biomass68,9%
Geothermal4,3%
Figure 2-3: Gross inland renewable energy consumption in EU-27 by fuel type in 2006, source: EU 2008
Potential of Solar Thermal in Europe 12
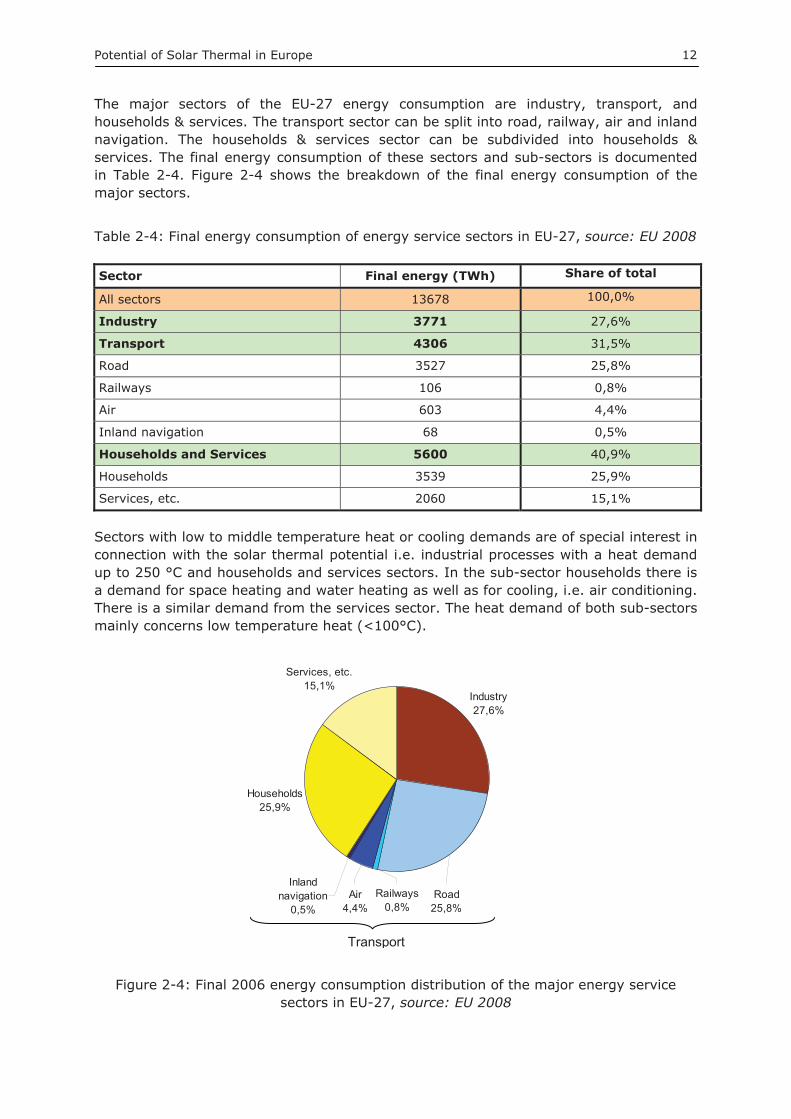
The major sectors of the EU-27 energy consumption are industry, transport, and households & services. The transport sector can be split into road, railway, air and inland navigation. The households & services sector can be subdivided into households & services. The final energy consumption of these sectors and sub-sectors is documented in Table 2-4. Figure 2-4 shows the breakdown of the final energy consumption of the major sectors.
Table 2-4: Final energy consumption of energy service sectors in EU-27, source: EU 2008
Sector Final energy (TWh) Share of total
All sectors 13678 100,0%
Industry 3771 27,6%
Transport 4306 31,5%
Road 3527 25,8%
Railways 106 0,8%
Air 603 4,4%
Inland navigation 68 0,5%
Households and Services 5600 40,9%
Households 3539 25,9%
Services, etc. 2060 15,1%
Sectors with low to middle temperature heat or cooling demands are of special interest in connection with the solar thermal potential i.e. industrial processes with a heat demand up to 250 °C and households and services sectors. In the sub-sector households there is a demand for space heating and water heating as well as for cooling, i.e. air conditioning. There is a similar demand from the services sector. The heat demand of both sub-sectors mainly concerns low temperature heat (<100°C).
Industry27,6%
Households25,9%
Services, etc.15,1%
Road25,8%
Air4,4%
Railways0,8%
Inland navigation
0,5%
Figure 2-4: Final 2006 energy consumption distribution of the major energy service sectors in EU-27, source: EU 2008
Transport
Potential of Solar Thermal in Europe 13
3 Reference Countries and Sectors Energy Demand
3.1 Energy Related Characteristics of the Reference Countries In this chapter, the reference countries Austria, Denmark, Germany, Poland, Spain and the EU-27 countries are described according to their structure, economy, energy supply and energy consumption with a special focus on renewable energy. The five reference countries cover a range of standard characteristics-climatic conditions, country size, fuel mix in energy supply and aspects of political support for renewable energy. Important general data are documented in Table 3-1 to give a country by country comparison.
Table 3-1: General data of reference countries, source: EU 2008
Country Short EU
Membersince
Area (1000 km2)
Population1.1.2007 (10^6)
GDP nom.2006
(10^9 Euro)
GDP per head (%)
2005 EU27=100%
GDP per head (%)
2006 EU27=100%
Austria AT 1995 84 8.3 258 129 128
Germany DE 1958 357 82.7 2.322 115 114
Denmark DK 1973 43 5.4 220 127 126
Spain ES 1986 506 44.3 981 103 105
Poland PL 2004 313 38.5 272 51 52
EU-27 - - 4.323 492.7 11.616 100 100
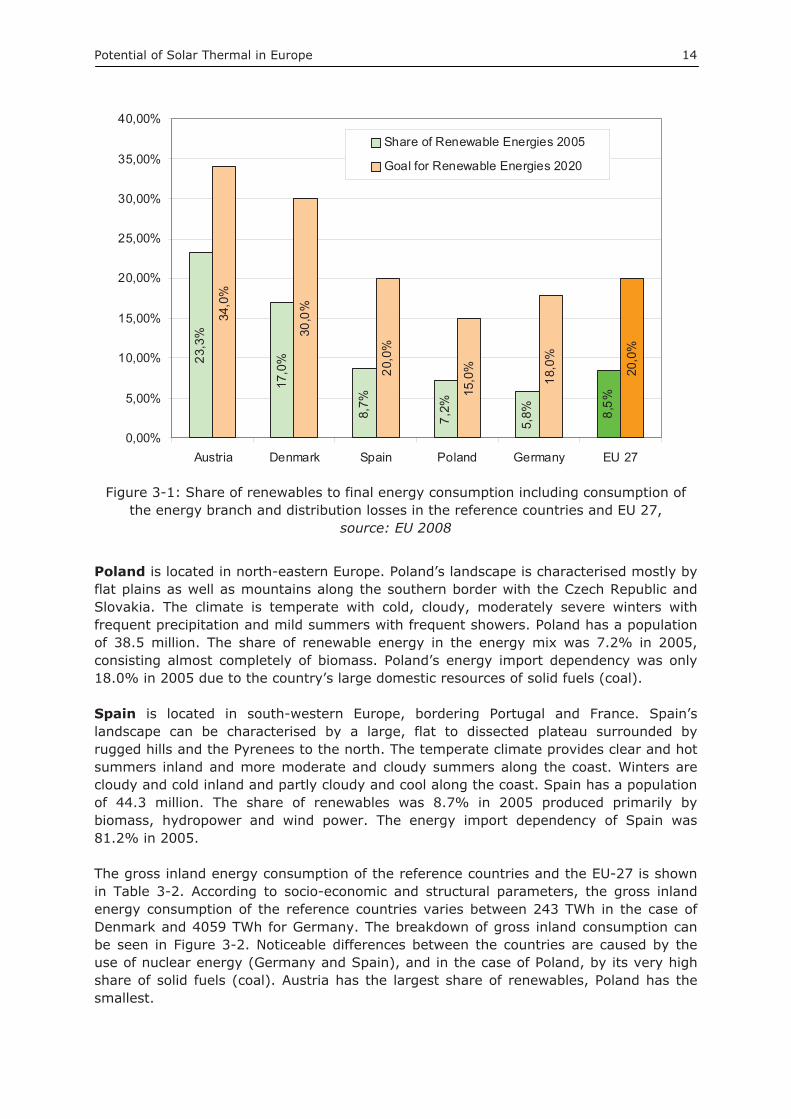
Austria is a comparatively small country with a population of 8.3 million people. Characterised by the alpine landscape, continental climate and a long tradition of renewable energy use. Austria has a high share of hydro power, biomass and other renewables play an important part in its energy mix. Furthermore, Austria is characterised by high diffusion rates of solar thermal systems. Austria’s current energy mix includes 23% renewables, placing it fourth in the EU-27 behind Sweden, Latvia and Finland. The current share of renewables and the corresponding target for the year 2020 for Austria, the other reference countries and the EU 27 are shown in Figure 3-1. Austria’s energy import dependency was 71.8% in 2005.
Denmark is a small Scandinavian country largely bordered by water and islands with a population of 5.4 million people. The country’s renewable energy share is 17.0% primarily from biomass and wind power. The energy import dependency of Denmark was negative 51.6% in 2005 because of Denmark’s oil and gas resources in the North Sea region.
Germany is one of the largest EU countries with a population of 82.7 million people. This highly industrialised country can be characterised by a central European climate and a flat to hilly landscape. Despite strong energy policies, Germany’s share of renewables in the energy mix is 5.8%. Germany has developed its hydropower and wind power sectors, while the biomass and solar energy sectors are becoming more relevant. The energy import dependency of Germany was 61.6% in 2005.
Potential of Solar Thermal in Europe 14
23,3
%
17,0
%
8,7%
7,2%
5,8% 8,
5%
34,0
%
30,0
%
20,0
%
15,0
%
18,0
%
20,0
%
0,00%
5,00%
10,00%
15,00%
20,00%
25,00%
30,00%
35,00%
40,00%
Austria Denmark Spain Poland Germany EU 27
Share of Renewable Energies 2005
Goal for Renewable Energies 2020
Figure 3-1: Share of renewables to final energy consumption including consumption of the energy branch and distribution losses in the reference countries and EU 27,
source: EU 2008
Poland is located in north-eastern Europe. Poland’s landscape is characterised mostly by flat plains as well as mountains along the southern border with the Czech Republic and Slovakia. The climate is temperate with cold, cloudy, moderately severe winters with frequent precipitation and mild summers with frequent showers. Poland has a population of 38.5 million. The share of renewable energy in the energy mix was 7.2% in 2005, consisting almost completely of biomass. Poland’s energy import dependency was only 18.0% in 2005 due to the country’s large domestic resources of solid fuels (coal).
Spain is located in south-western Europe, bordering Portugal and France. Spain’s landscape can be characterised by a large, flat to dissected plateau surrounded by rugged hills and the Pyrenees to the north. The temperate climate provides clear and hot summers inland and more moderate and cloudy summers along the coast. Winters are cloudy and cold inland and partly cloudy and cool along the coast. Spain has a population of 44.3 million. The share of renewables was 8.7% in 2005 produced primarily by biomass, hydropower and wind power. The energy import dependency of Spain was 81.2% in 2005.
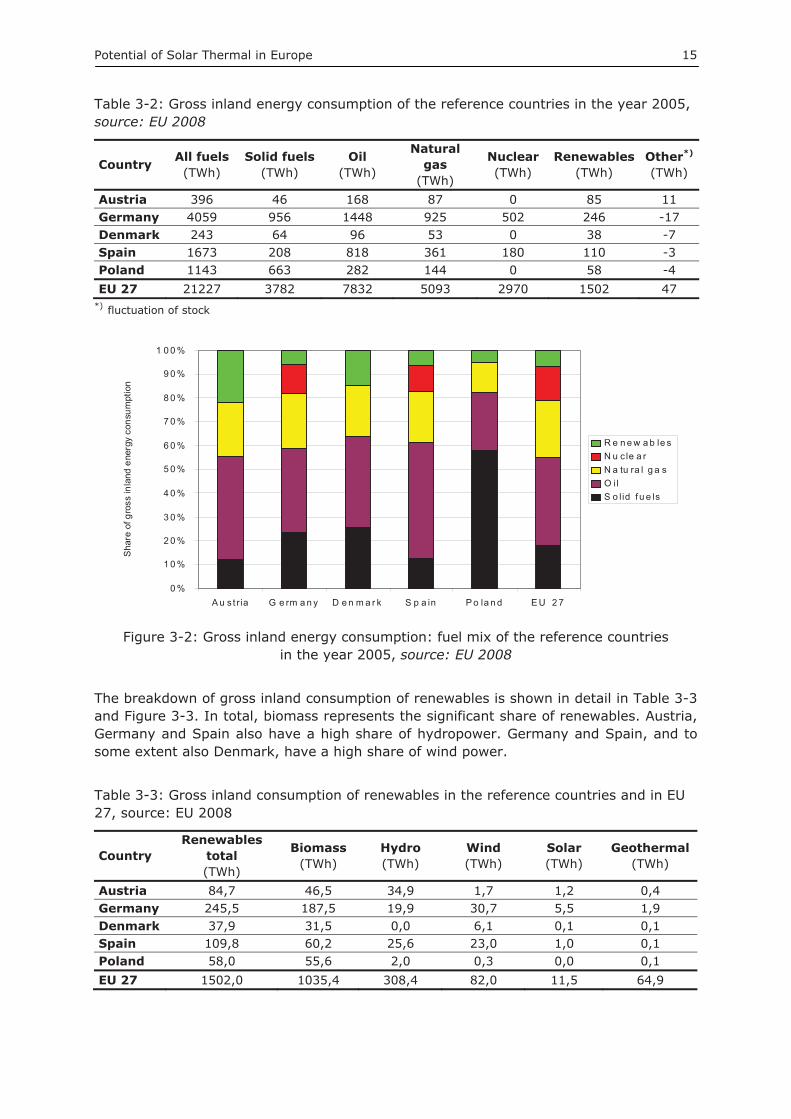
The gross inland energy consumption of the reference countries and the EU-27 is shown in Table 3-2. According to socio-economic and structural parameters, the gross inland energy consumption of the reference countries varies between 243 TWh in the case of Denmark and 4059 TWh for Germany. The breakdown of gross inland consumption can be seen in Figure 3-2. Noticeable differences between the countries are caused by the use of nuclear energy (Germany and Spain), and in the case of Poland, by its very high share of solid fuels (coal). Austria has the largest share of renewables, Poland has the smallest.
Potential of Solar Thermal in Europe 15
Table 3-2: Gross inland energy consumption of the reference countries in the year 2005, source: EU 2008
Country All fuels (TWh)
Solid fuels (TWh)
Oil(TWh)
Naturalgas
(TWh)
Nuclear(TWh)
Renewables(TWh)
Other*)
(TWh)
Austria 396 46 168 87 0 85 11 Germany 4059 956 1448 925 502 246 -17 Denmark 243 64 96 53 0 38 -7 Spain 1673 208 818 361 180 110 -3 Poland 1143 663 282 144 0 58 -4 EU 27 21227 3782 7832 5093 2970 1502 47
*) fluctuation of stock
0 %
1 0 %
2 0 %
3 0 %
4 0 %
5 0 %
6 0 %
7 0 %
8 0 %
9 0 %
1 0 0 %
A u st ria G e rm a n y D e n m a r k S p a in P o la n d E U 2 7
Sha
re o
f gro
ss in
land
ene
rgy
cons
umpt
ion
R e n e w a b le sN u c le a rN a tu ra l g a sO ilS o lid f u e ls
Figure 3-2: Gross inland energy consumption: fuel mix of the reference countries in the year 2005, source: EU 2008
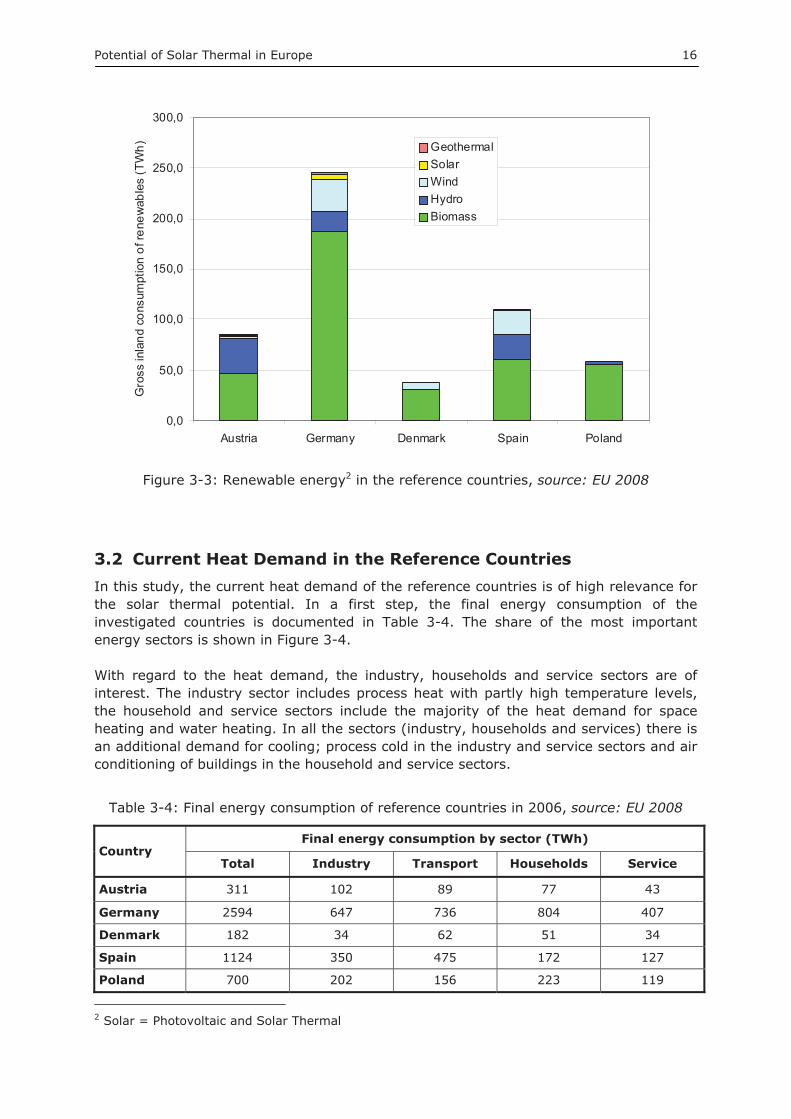
The breakdown of gross inland consumption of renewables is shown in detail in Table 3-3 and Figure 3-3. In total, biomass represents the significant share of renewables. Austria, Germany and Spain also have a high share of hydropower. Germany and Spain, and to some extent also Denmark, have a high share of wind power.
Table 3-3: Gross inland consumption of renewables in the reference countries and in EU 27, source: EU 2008
Country Renewables
total (TWh)
Biomass(TWh)
Hydro (TWh)
Wind(TWh)
Solar(TWh)
Geothermal(TWh)
Austria 84,7 46,5 34,9 1,7 1,2 0,4 Germany 245,5 187,5 19,9 30,7 5,5 1,9 Denmark 37,9 31,5 0,0 6,1 0,1 0,1 Spain 109,8 60,2 25,6 23,0 1,0 0,1 Poland 58,0 55,6 2,0 0,3 0,0 0,1 EU 27 1502,0 1035,4 308,4 82,0 11,5 64,9
Potential of Solar Thermal in Europe 16
0,0
50,0
100,0
150,0
200,0
250,0
300,0
Austria Germany Denmark Spain Poland
Gro
ss in
land
con
sum
ptio
n of
rene
wab
les
(TW
h) GeothermalSolarWindHydroBiomass
Figure 3-3: Renewable energy2 in the reference countries, source: EU 2008
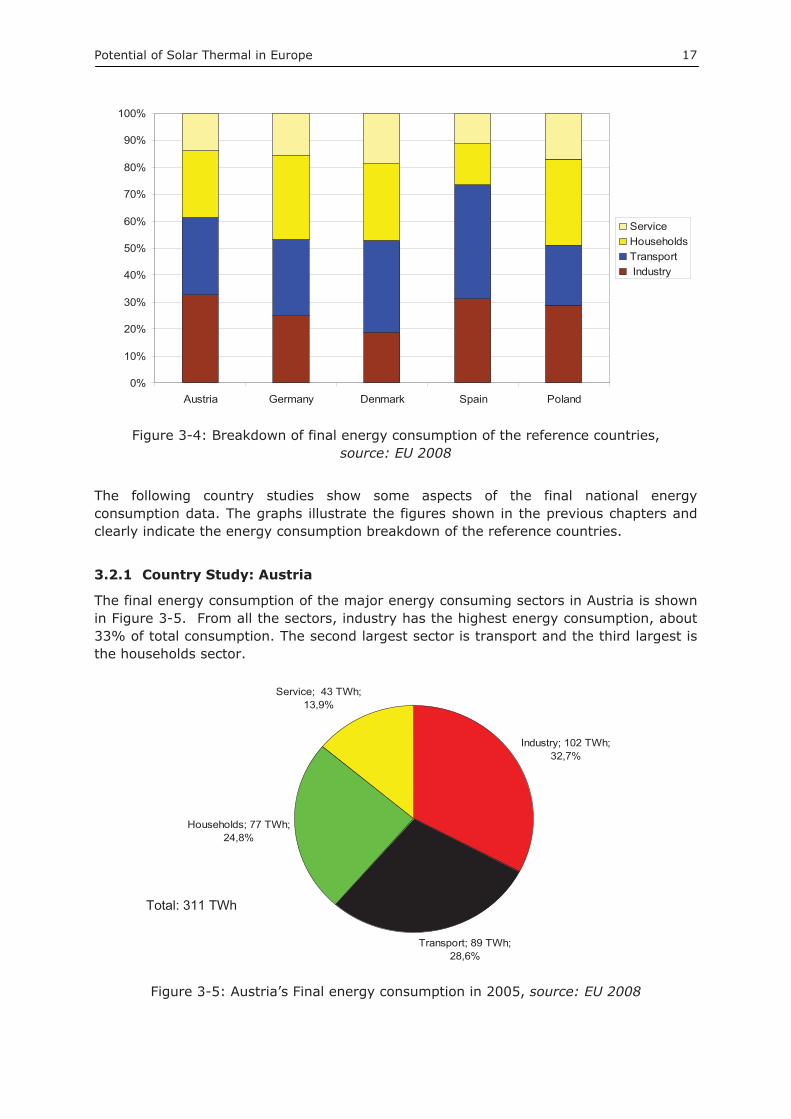
3.2 Current Heat Demand in the Reference Countries In this study, the current heat demand of the reference countries is of high relevance for the solar thermal potential. In a first step, the final energy consumption of the investigated countries is documented in Table 3-4. The share of the most important energy sectors is shown in Figure 3-4.
With regard to the heat demand, the industry, households and service sectors are of interest. The industry sector includes process heat with partly high temperature levels, the household and service sectors include the majority of the heat demand for space heating and water heating. In all the sectors (industry, households and services) there is an additional demand for cooling; process cold in the industry and service sectors and air conditioning of buildings in the household and service sectors.
Table 3-4: Final energy consumption of reference countries in 2006, source: EU 2008
Country Final energy consumption by sector (TWh)
Total Industry Transport Households Service
Austria 311 102 89 77 43
Germany 2594 647 736 804 407
Denmark 182 34 62 51 34
Spain 1124 350 475 172 127
Poland 700 202 156 223 119
2 Solar = Photovoltaic and Solar Thermal
Potential of Solar Thermal in Europe 17
0%
10%
20%
30%
40%
50%
60%
70%
80%
90%
100%
Austria Germany Denmark Spain Poland
ServiceHouseholdsTransport Industry
Figure 3-4: Breakdown of final energy consumption of the reference countries, source: EU 2008
The following country studies show some aspects of the final national energy consumption data. The graphs illustrate the figures shown in the previous chapters and clearly indicate the energy consumption breakdown of the reference countries.
3.2.1 Country Study: Austria
The final energy consumption of the major energy consuming sectors in Austria is shown in Figure 3-5. From all the sectors, industry has the highest energy consumption, about 33% of total consumption. The second largest sector is transport and the third largest is the households sector.
Service; 43 TWh; 13,9%
Industry; 102 TWh; 32,7%
Households; 77 TWh; 24,8%
Transport; 89 TWh; 28,6%
Figure 3-5: Austria’s Final energy consumption in 2005, source: EU 2008
Total: 311 TWh
Potential of Solar Thermal in Europe 18
The energy mix of Austria’s final energy consumption is shown in Figure 3-6. Oil is by far the major energy carrier. Electricity, the second most important energy carrier includes a high share of hydropower, about 62%. Therefore, the total share of renewables in Austria at 23.3% is comparatively high. The third most important energy carrier is gas at 16.7% of the total final energy consumption.
Gas; 52 TWh 16,7%
Electricity; 58 TWh 18,6%
Renewables excluding electricity; 31 TWh;
10,1%Solid fuels; 17 TWh;
5,5%
Oil; 132 TWh; 42,6%
Derived heat & Indust. waste; 20 TWh
6,5%
Figure 3-6: Austria’s final energy consumption in 2005 by energy carrier, source: EU 2008
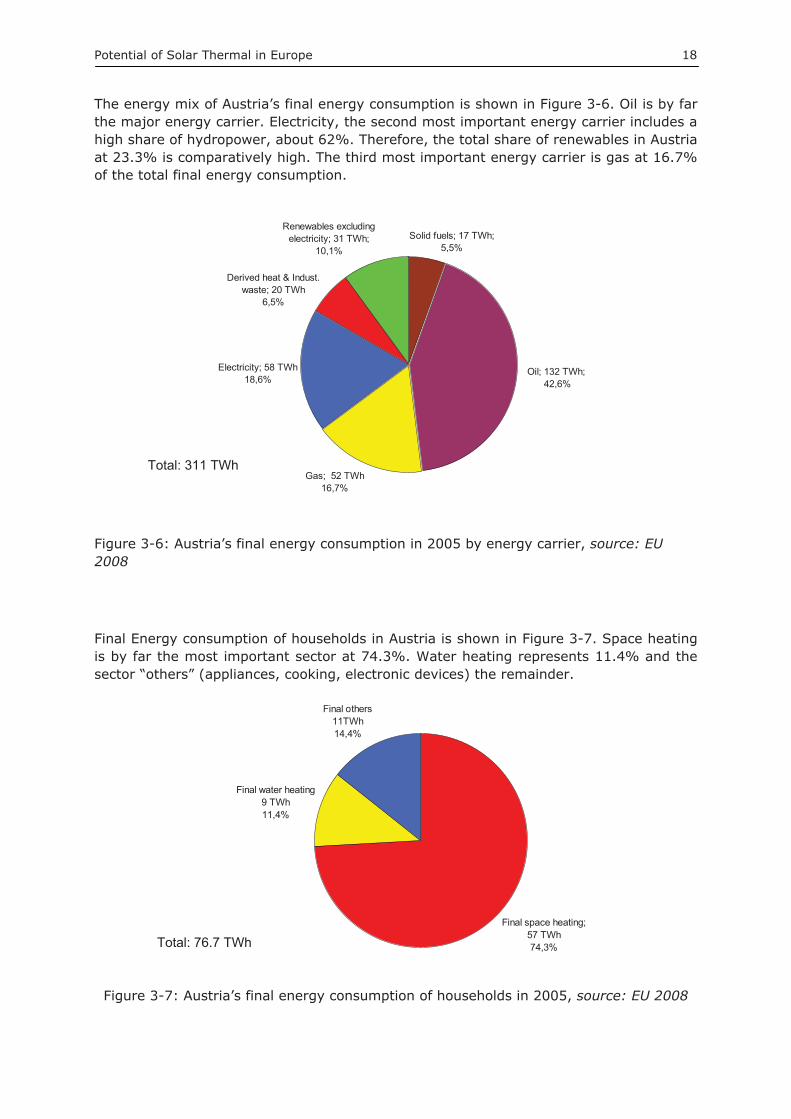
Final Energy consumption of households in Austria is shown in Figure 3-7. Space heating is by far the most important sector at 74.3%. Water heating represents 11.4% and the sector “others” (appliances, cooking, electronic devices) the remainder.
Final space heating; 57 TWh 74,3%
Final water heating 9 TWh 11,4%
Final others11TWh 14,4%
Figure 3-7: Austria’s final energy consumption of households in 2005, source: EU 2008
Total: 311 TWh
Total: 76.7 TWh
Potential of Solar Thermal in Europe 19
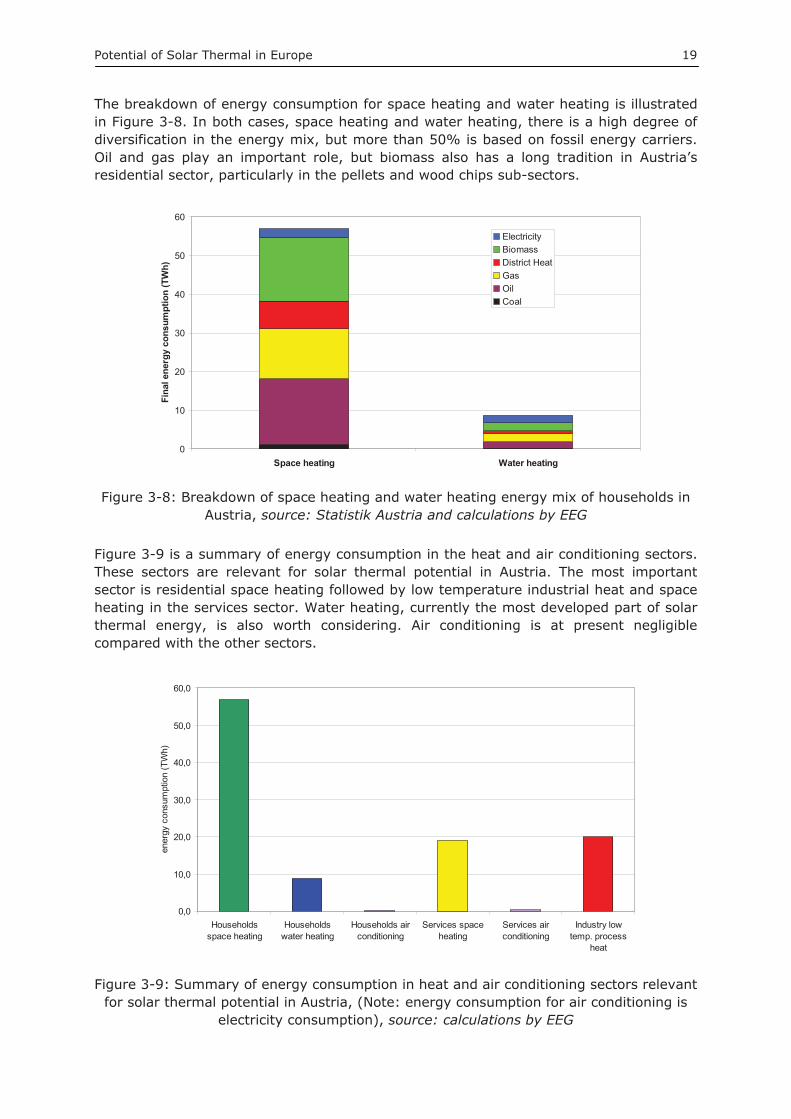
The breakdown of energy consumption for space heating and water heating is illustrated in Figure 3-8. In both cases, space heating and water heating, there is a high degree of diversification in the energy mix, but more than 50% is based on fossil energy carriers. Oil and gas play an important role, but biomass also has a long tradition in Austria’s residential sector, particularly in the pellets and wood chips sub-sectors.
0
10
20
30
40
50
60
Space heating Water heating
Fina
l ene
rgy
cons
umpt
ion
(TW
h)
ElectricityBiomassDistrict HeatGasOilCoal
Figure 3-8: Breakdown of space heating and water heating energy mix of households in Austria, source: Statistik Austria and calculations by EEG
Figure 3-9 is a summary of energy consumption in the heat and air conditioning sectors. These sectors are relevant for solar thermal potential in Austria. The most important sector is residential space heating followed by low temperature industrial heat and space heating in the services sector. Water heating, currently the most developed part of solar thermal energy, is also worth considering. Air conditioning is at present negligible compared with the other sectors.
0,0
10,0
20,0
30,0
40,0
50,0
60,0
Householdsspace heating
Householdswater heating
Households airconditioning
Services spaceheating
Services airconditioning
Industry lowtemp. process
heat
ener
gy c
onsu
mpt
ion
(TW
h)
Figure 3-9: Summary of energy consumption in heat and air conditioning sectors relevant for solar thermal potential in Austria, (Note: energy consumption for air conditioning is
electricity consumption), source: calculations by EEG
Potential of Solar Thermal in Europe 20
3.2.2 Country Study: Germany
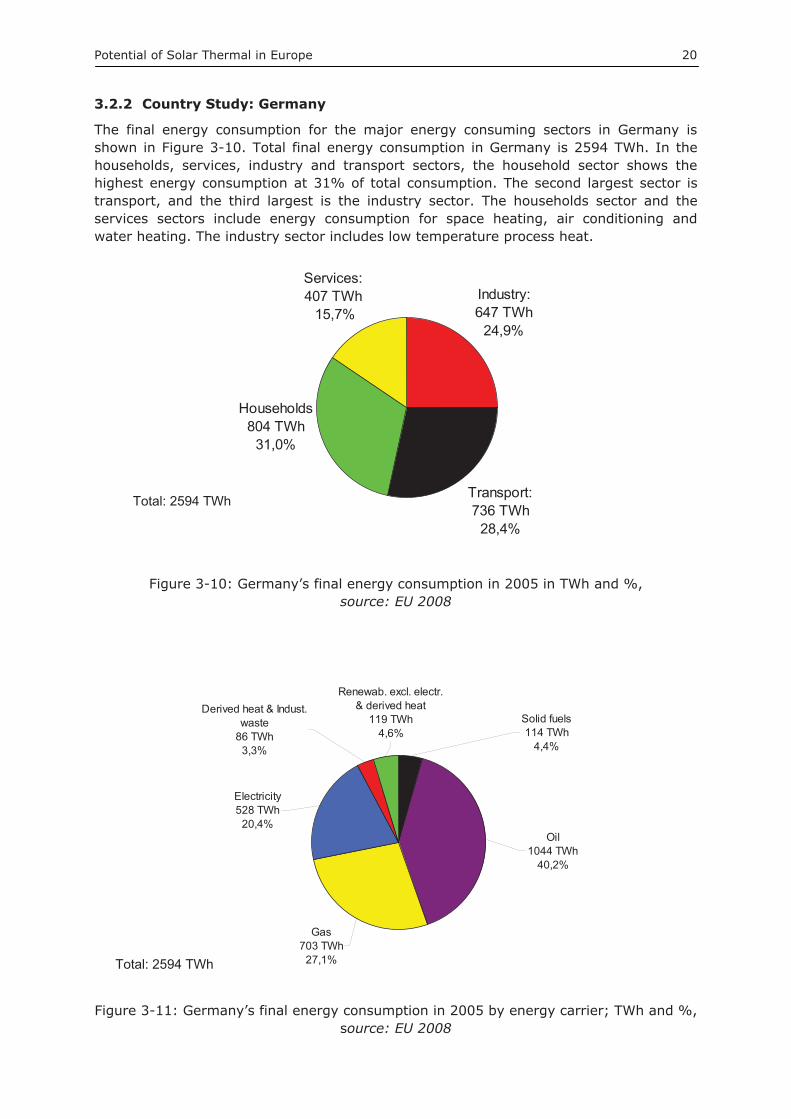
The final energy consumption for the major energy consuming sectors in Germany is shown in Figure 3-10. Total final energy consumption in Germany is 2594 TWh. In the households, services, industry and transport sectors, the household sector shows the highest energy consumption at 31% of total consumption. The second largest sector is transport, and the third largest is the industry sector. The households sector and the services sectors include energy consumption for space heating, air conditioning and water heating. The industry sector includes low temperature process heat.
Households 804 TWh
31,0%
Transport: 736 TWh
28,4%
Industry: 647 TWh
24,9%
Services: 407 TWh 15,7%
Figure 3-10: Germany’s final energy consumption in 2005 in TWh and %, source: EU 2008
Renewab. excl. electr. & derived heat
119 TWh 4,6%
Solid fuels114 TWh
4,4%
Derived heat & Indust. waste
86 TWh 3,3%
Oil1044 TWh
40,2%
Gas703 TWh
27,1%
Electricity528 TWh
20,4%
Figure 3-11: Germany’s final energy consumption in 2005 by energy carrier; TWh and %, source: EU 2008
Total: 2594 TWh
Total: 2594 TWh
Potential of Solar Thermal in Europe 21
The energy mix of the final energy consumption is shown in Figure 3-11. At 40.2%, oil is by far the most important energy carrier. The second most important energy carrier is gas at 27.1%. Electricity, the third important energy carrier, is mainly produced by a mix of fossil energy carriers and nuclear but also includes some renewables, such as wind power. Therefore, Figure 3-11 also illustrates the small share of renewable energy in the energy mix of Germany.
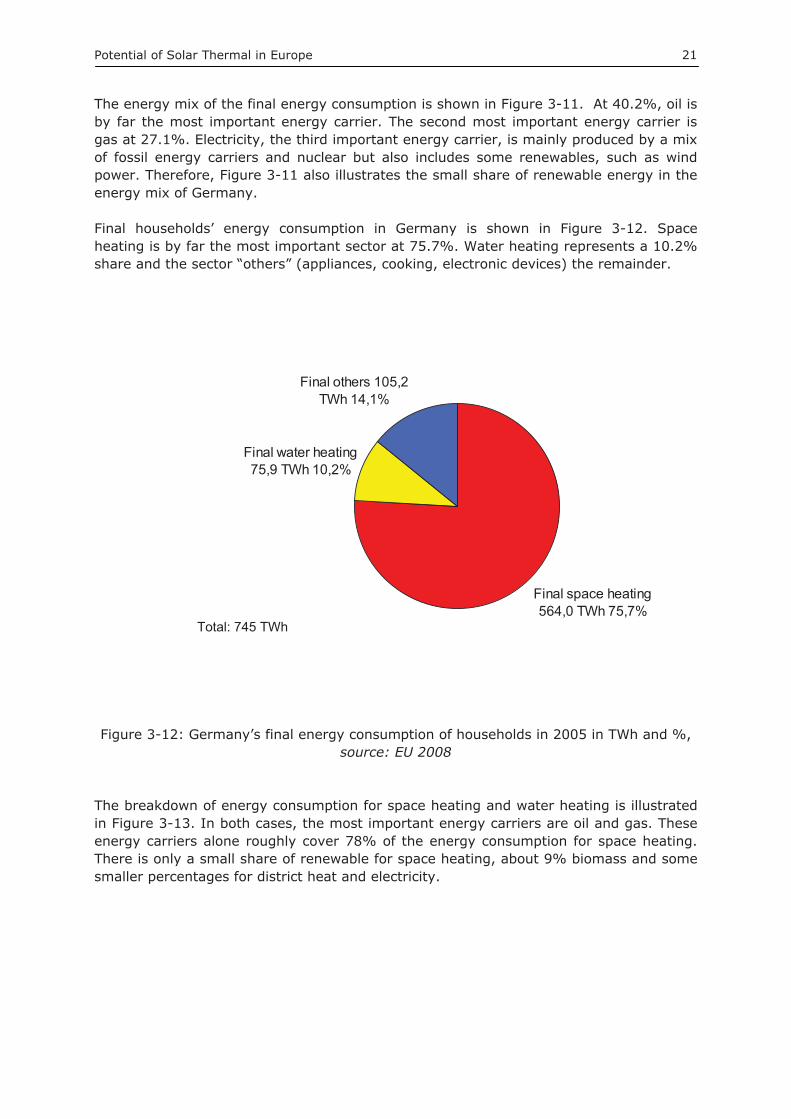
Final households’ energy consumption in Germany is shown in Figure 3-12. Space heating is by far the most important sector at 75.7%. Water heating represents a 10.2% share and the sector “others” (appliances, cooking, electronic devices) the remainder.
Final space heating564,0 TWh 75,7%
Final water heating75,9 TWh 10,2%
Final others 105,2 TWh 14,1%
Figure 3-12: Germany’s final energy consumption of households in 2005 in TWh and %, source: EU 2008
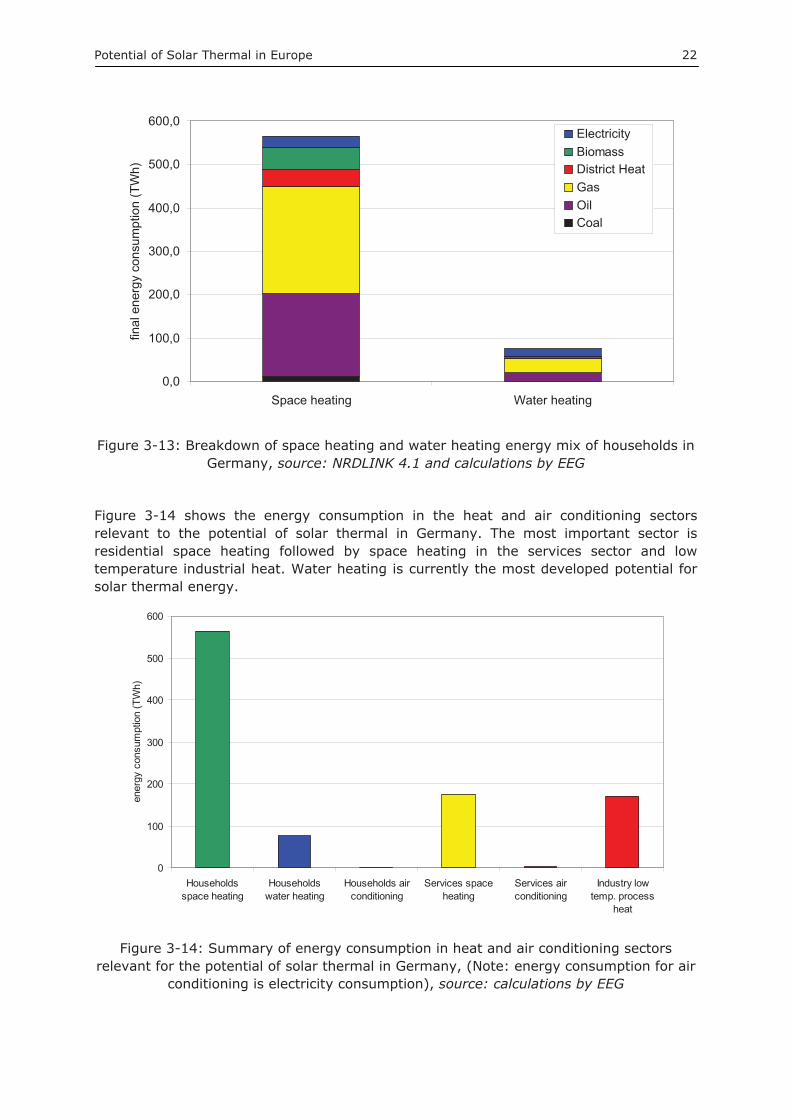
The breakdown of energy consumption for space heating and water heating is illustrated in Figure 3-13. In both cases, the most important energy carriers are oil and gas. These energy carriers alone roughly cover 78% of the energy consumption for space heating. There is only a small share of renewable for space heating, about 9% biomass and some smaller percentages for district heat and electricity.
Total: 745 TWh
Potential of Solar Thermal in Europe 22
0,0
100,0
200,0
300,0
400,0
500,0
600,0
Space heating Water heating
final
ene
rgy
cons
umpt
ion
(TW
h)ElectricityBiomassDistrict HeatGasOilCoal
Figure 3-13: Breakdown of space heating and water heating energy mix of households in Germany, source: NRDLINK 4.1 and calculations by EEG
Figure 3-14 shows the energy consumption in the heat and air conditioning sectors relevant to the potential of solar thermal in Germany. The most important sector is residential space heating followed by space heating in the services sector and low temperature industrial heat. Water heating is currently the most developed potential for solar thermal energy.
0
100
200
300
400
500
600
Householdsspace heating
Householdswater heating
Households airconditioning
Services spaceheating
Services airconditioning
Industry lowtemp. process
heat
ener
gy c
onsu
mpt
ion
(TW
h)
Figure 3-14: Summary of energy consumption in heat and air conditioning sectors relevant for the potential of solar thermal in Germany, (Note: energy consumption for air
conditioning is electricity consumption), source: calculations by EEG
Potential of Solar Thermal in Europe 23
3.2.3 Country Study: Denmark
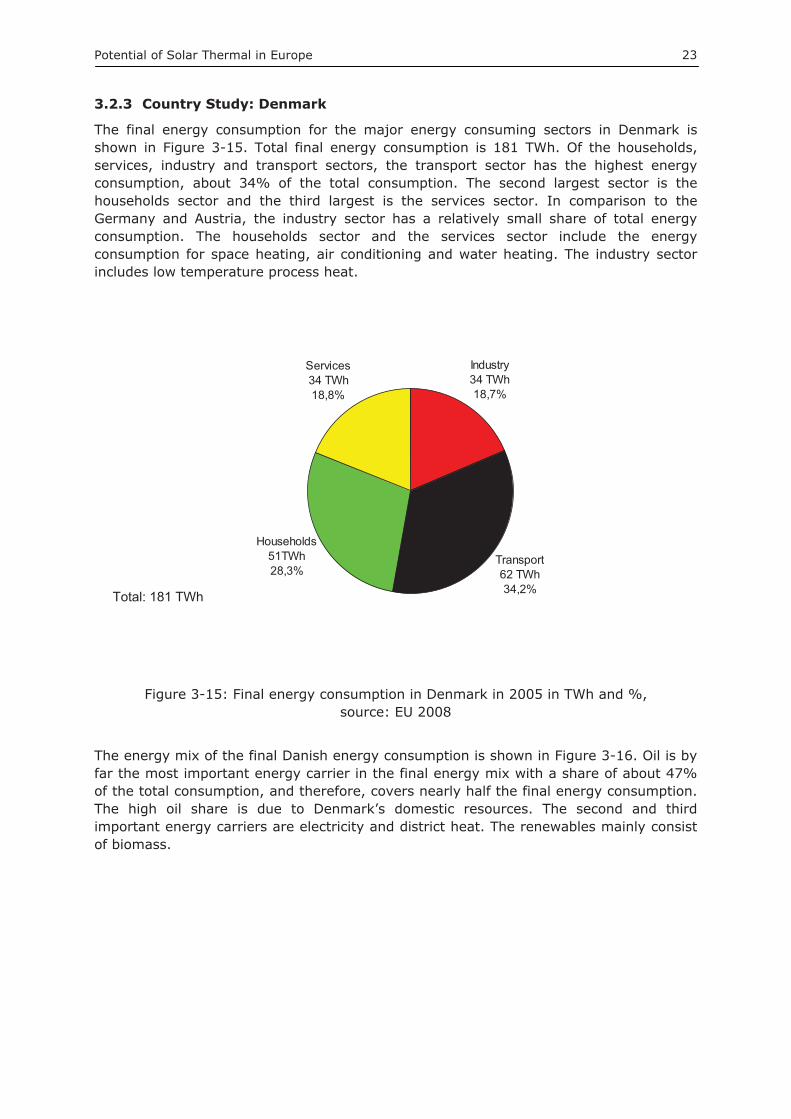
The final energy consumption for the major energy consuming sectors in Denmark is shown in Figure 3-15. Total final energy consumption is 181 TWh. Of the households, services, industry and transport sectors, the transport sector has the highest energy consumption, about 34% of the total consumption. The second largest sector is the households sector and the third largest is the services sector. In comparison to the Germany and Austria, the industry sector has a relatively small share of total energy consumption. The households sector and the services sector include the energy consumption for space heating, air conditioning and water heating. The industry sector includes low temperature process heat.
Households51TWh 28,3%
Transport62 TWh34,2%
Industry34 TWh 18,7%
Services34 TWh18,8%
Figure 3-15: Final energy consumption in Denmark in 2005 in TWh and %, source: EU 2008
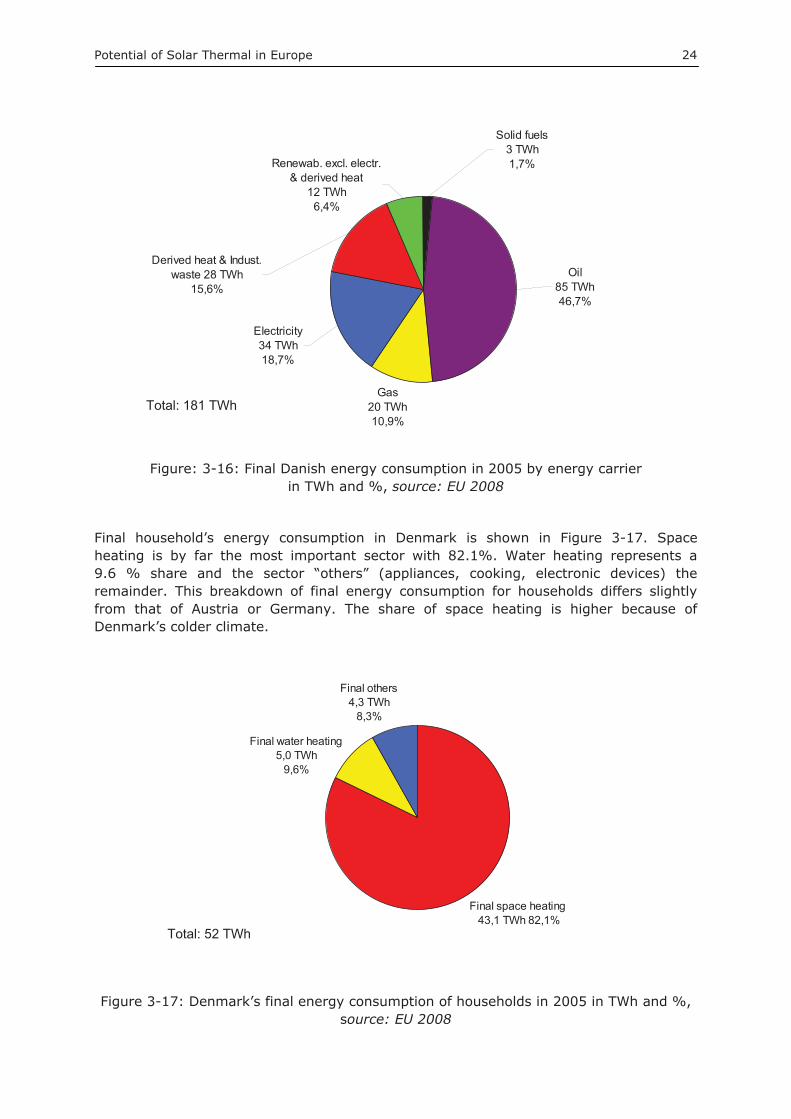
The energy mix of the final Danish energy consumption is shown in Figure 3-16. Oil is by far the most important energy carrier in the final energy mix with a share of about 47% of the total consumption, and therefore, covers nearly half the final energy consumption. The high oil share is due to Denmark’s domestic resources. The second and third important energy carriers are electricity and district heat. The renewables mainly consist of biomass.
Total: 181 TWh
Potential of Solar Thermal in Europe 24
Electricity34 TWh18,7%
Gas20 TWh10,9%
Oil85 TWh46,7%
Renewab. excl. electr. & derived heat
12 TWh6,4%
Derived heat & Indust. waste 28 TWh
15,6%
Solid fuels3 TWh1,7%
Figure: 3-16: Final Danish energy consumption in 2005 by energy carrier in TWh and %, source: EU 2008
Final household’s energy consumption in Denmark is shown in Figure 3-17. Space heating is by far the most important sector with 82.1%. Water heating represents a 9.6 % share and the sector “others” (appliances, cooking, electronic devices) the remainder. This breakdown of final energy consumption for households differs slightly from that of Austria or Germany. The share of space heating is higher because of Denmark’s colder climate.
Final space heating 43,1 TWh 82,1%
Final water heating5,0 TWh
9,6%
Final others4,3 TWh
8,3%
Figure 3-17: Denmark’s final energy consumption of households in 2005 in TWh and %, source: EU 2008
Total: 52 TWh
Total: 181 TWh
Potential of Solar Thermal in Europe 25
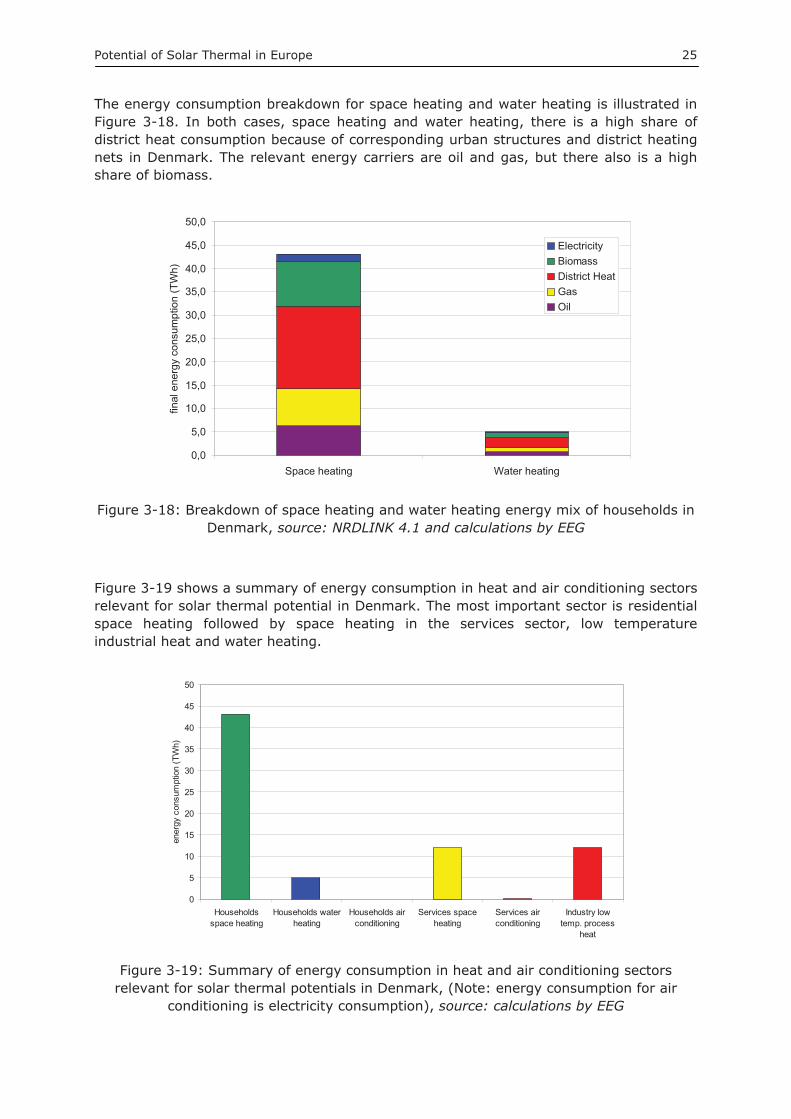
The energy consumption breakdown for space heating and water heating is illustrated in Figure 3-18. In both cases, space heating and water heating, there is a high share of district heat consumption because of corresponding urban structures and district heating nets in Denmark. The relevant energy carriers are oil and gas, but there also is a high share of biomass.
0,0
5,0
10,0
15,0
20,0
25,0
30,0
35,0
40,0
45,0
50,0
Space heating Water heating
final
ene
rgy
cons
umpt
ion
(TW
h)
ElectricityBiomassDistrict HeatGasOil
Figure 3-18: Breakdown of space heating and water heating energy mix of households in Denmark, source: NRDLINK 4.1 and calculations by EEG
Figure 3-19 shows a summary of energy consumption in heat and air conditioning sectors relevant for solar thermal potential in Denmark. The most important sector is residential space heating followed by space heating in the services sector, low temperature industrial heat and water heating.
0
5
10
15
20
25
30
35
40
45
50
Householdsspace heating
Households waterheating
Households airconditioning
Services spaceheating
Services airconditioning
Industry lowtemp. process
heat
ener
gy c
onsu
mpt
ion
(TW
h)
Figure 3-19: Summary of energy consumption in heat and air conditioning sectors relevant for solar thermal potentials in Denmark, (Note: energy consumption for air
conditioning is electricity consumption), source: calculations by EEG
Potential of Solar Thermal in Europe 26
3.2.4 Country Study: Spain
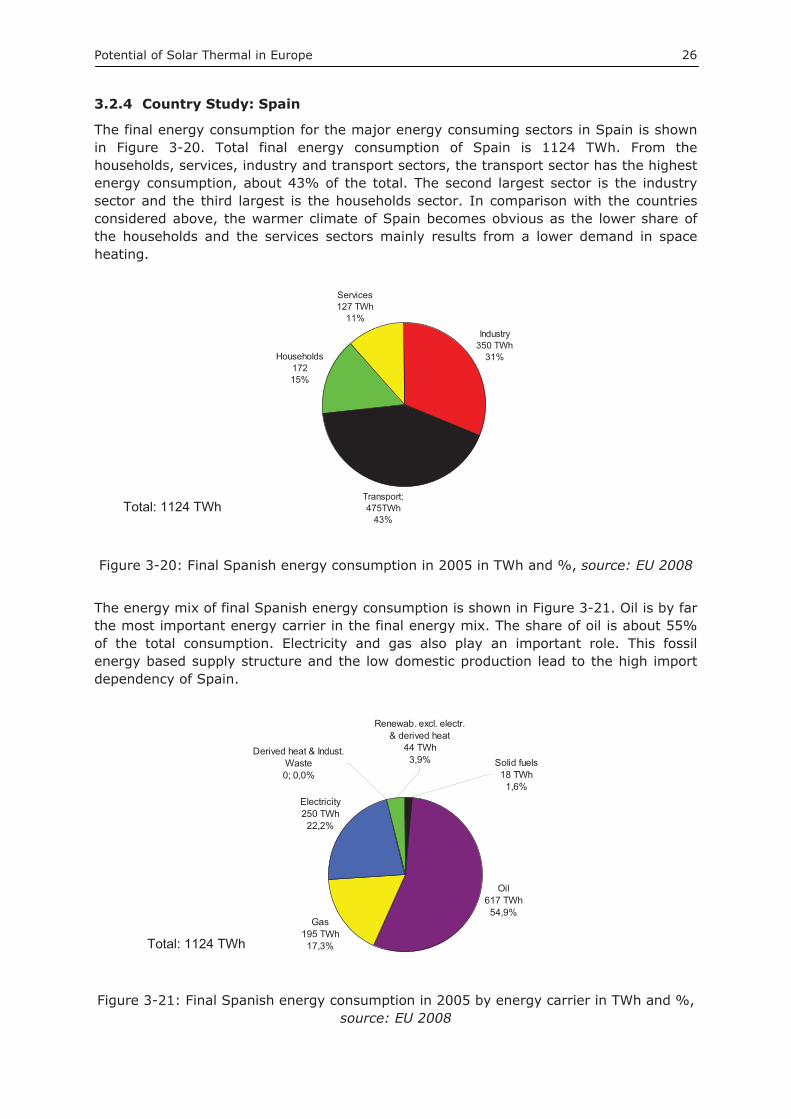
The final energy consumption for the major energy consuming sectors in Spain is shown in Figure 3-20. Total final energy consumption of Spain is 1124 TWh. From the households, services, industry and transport sectors, the transport sector has the highest energy consumption, about 43% of the total. The second largest sector is the industry sector and the third largest is the households sector. In comparison with the countries considered above, the warmer climate of Spain becomes obvious as the lower share of the households and the services sectors mainly results from a lower demand in space heating.
Households17215%
Transport; 475TWh
43%
Industry350 TWh
31%
Services127 TWh
11%
Figure 3-20: Final Spanish energy consumption in 2005 in TWh and %, source: EU 2008
The energy mix of final Spanish energy consumption is shown in Figure 3-21. Oil is by far the most important energy carrier in the final energy mix. The share of oil is about 55% of the total consumption. Electricity and gas also play an important role. This fossil energy based supply structure and the low domestic production lead to the high import dependency of Spain.
Derived heat & Indust. Waste0; 0,0%
Electricity250 TWh
22,2%
Gas195 TWh
17,3%
Oil617 TWh
54,9%
Renewab. excl. electr. & derived heat
44 TWh3,9% Solid fuels
18 TWh1,6%
Figure 3-21: Final Spanish energy consumption in 2005 by energy carrier in TWh and %, source: EU 2008
Total: 1124 TWh
Total: 1124 TWh
Potential of Solar Thermal in Europe 27
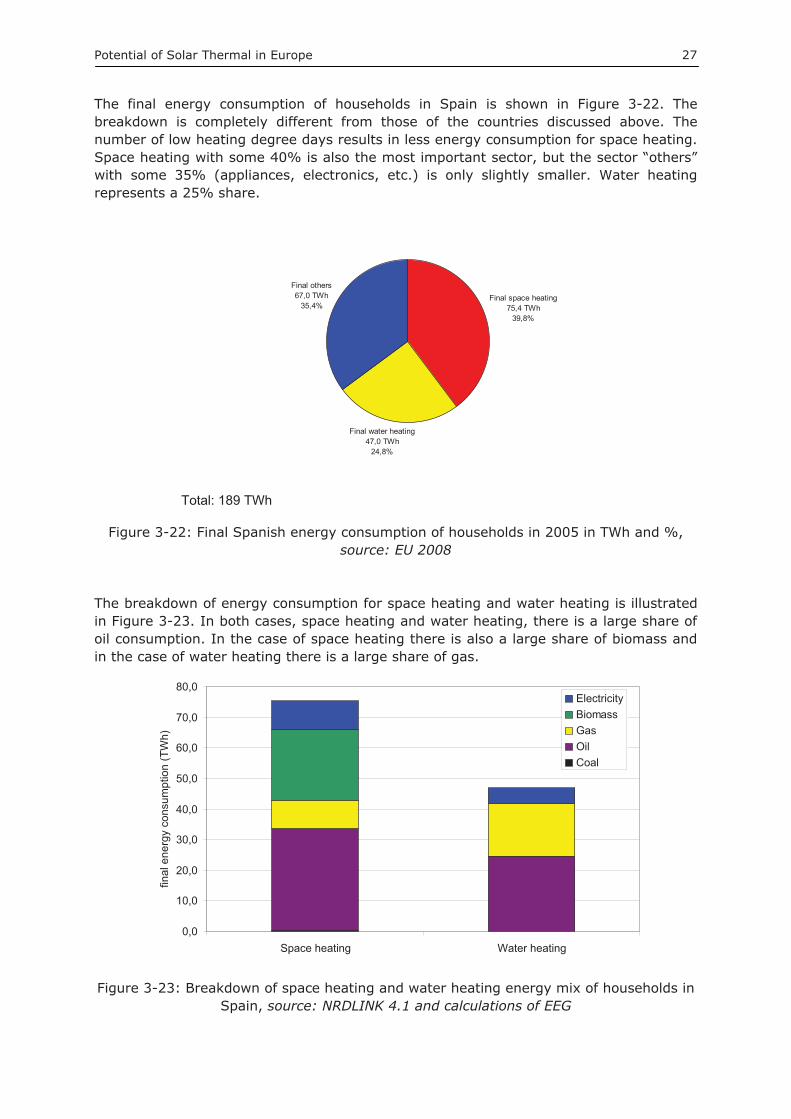
The final energy consumption of households in Spain is shown in Figure 3-22. The breakdown is completely different from those of the countries discussed above. The number of low heating degree days results in less energy consumption for space heating. Space heating with some 40% is also the most important sector, but the sector “others” with some 35% (appliances, electronics, etc.) is only slightly smaller. Water heating represents a 25% share.
Final water heating47,0 TWh
24,8%
Final space heating75,4 TWh
39,8%
Final others 67,0 TWh
35,4%
Figure 3-22: Final Spanish energy consumption of households in 2005 in TWh and %, source: EU 2008
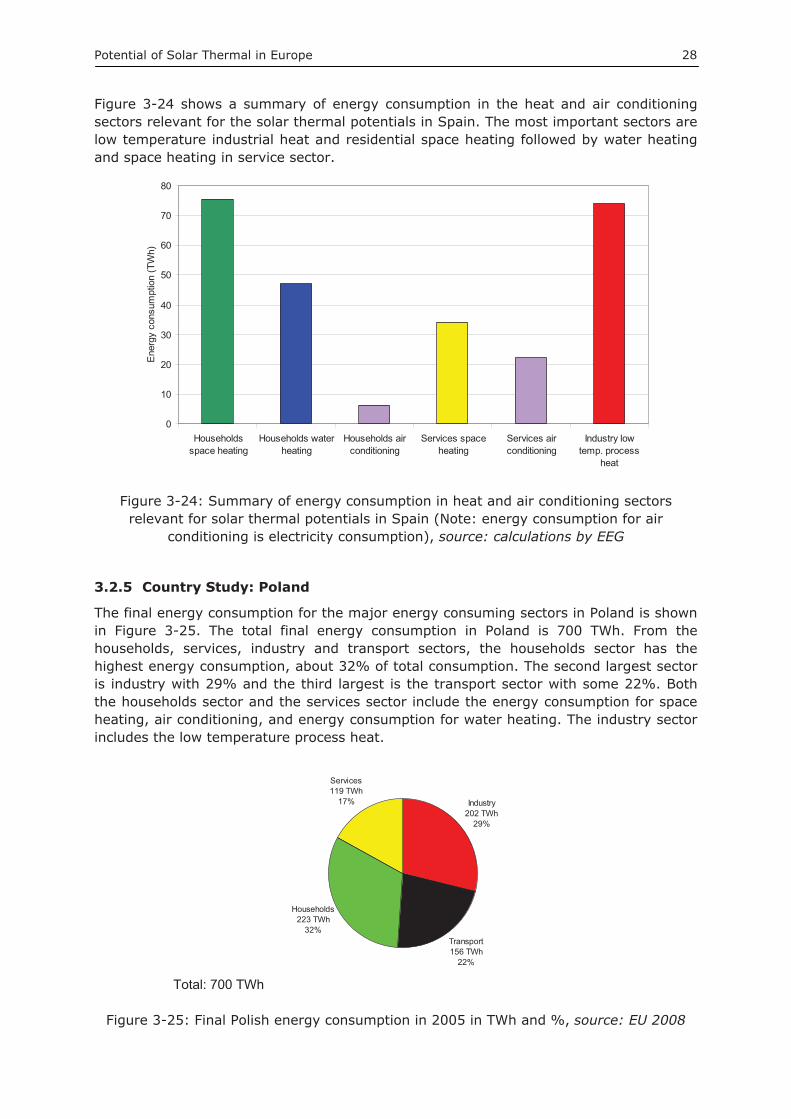
The breakdown of energy consumption for space heating and water heating is illustrated in Figure 3-23. In both cases, space heating and water heating, there is a large share of oil consumption. In the case of space heating there is also a large share of biomass and in the case of water heating there is a large share of gas.
0,0
10,0
20,0
30,0
40,0
50,0
60,0
70,0
80,0
Space heating Water heating
final
ene
rgy
cons
umpt
ion
(TW
h)
ElectricityBiomassGasOilCoal
Figure 3-23: Breakdown of space heating and water heating energy mix of households in Spain, source: NRDLINK 4.1 and calculations of EEG
Total: 189 TWh
Potential of Solar Thermal in Europe 28
Figure 3-24 shows a summary of energy consumption in the heat and air conditioning sectors relevant for the solar thermal potentials in Spain. The most important sectors are low temperature industrial heat and residential space heating followed by water heating and space heating in service sector.
0
10
20
30
40
50
60
70
80
Householdsspace heating
Households waterheating
Households airconditioning
Services spaceheating
Services airconditioning
Industry lowtemp. process
heat
Ene
rgy
cons
umpt
ion
(TW
h)
Figure 3-24: Summary of energy consumption in heat and air conditioning sectors relevant for solar thermal potentials in Spain (Note: energy consumption for air
conditioning is electricity consumption), source: calculations by EEG
3.2.5 Country Study: Poland
The final energy consumption for the major energy consuming sectors in Poland is shown in Figure 3-25. The total final energy consumption in Poland is 700 TWh. From the households, services, industry and transport sectors, the households sector has the highest energy consumption, about 32% of total consumption. The second largest sector is industry with 29% and the third largest is the transport sector with some 22%. Both the households sector and the services sector include the energy consumption for space heating, air conditioning, and energy consumption for water heating. The industry sector includes the low temperature process heat.
Transport156 TWh
22%
Households223 TWh
32%
Industry202 TWh
29%
Services119 TWh
17%
Figure 3-25: Final Polish energy consumption in 2005 in TWh and %, source: EU 2008
Total: 700 TWh
Potential of Solar Thermal in Europe 29
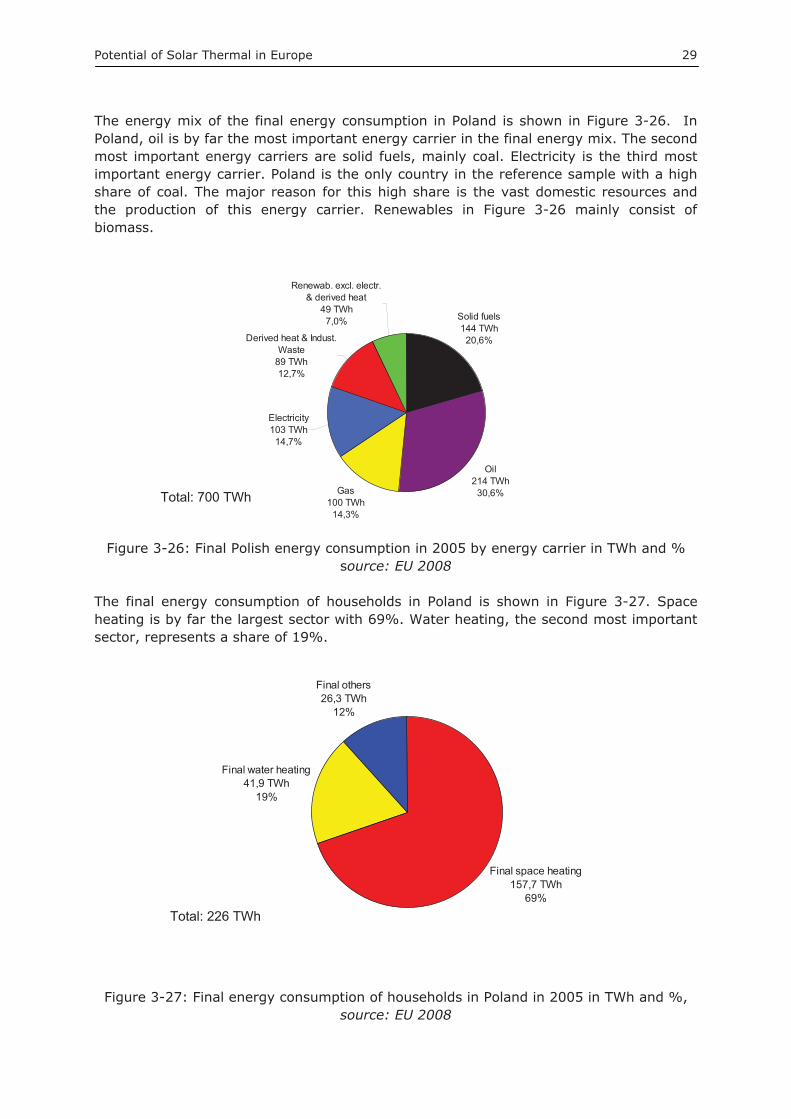
The energy mix of the final energy consumption in Poland is shown in Figure 3-26. In Poland, oil is by far the most important energy carrier in the final energy mix. The second most important energy carriers are solid fuels, mainly coal. Electricity is the third most important energy carrier. Poland is the only country in the reference sample with a high share of coal. The major reason for this high share is the vast domestic resources and the production of this energy carrier. Renewables in Figure 3-26 mainly consist of biomass.
Gas100 TWh
14,3%
Electricity103 TWh
14,7%
Derived heat & Indust. Waste
89 TWh12,7%
Oil214 TWh
30,6%
Solid fuels144 TWh
20,6%
Renewab. excl. electr. & derived heat
49 TWh7,0%
Figure 3-26: Final Polish energy consumption in 2005 by energy carrier in TWh and % source: EU 2008
The final energy consumption of households in Poland is shown in Figure 3-27. Space heating is by far the largest sector with 69%. Water heating, the second most important sector, represents a share of 19%.
Final space heating157,7 TWh
69%
Final water heating41,9 TWh
19%
Final others26,3 TWh
12%
Figure 3-27: Final energy consumption of households in Poland in 2005 in TWh and %, source: EU 2008
Total: 700 TWh
Total: 226 TWh
Potential of Solar Thermal in Europe 30
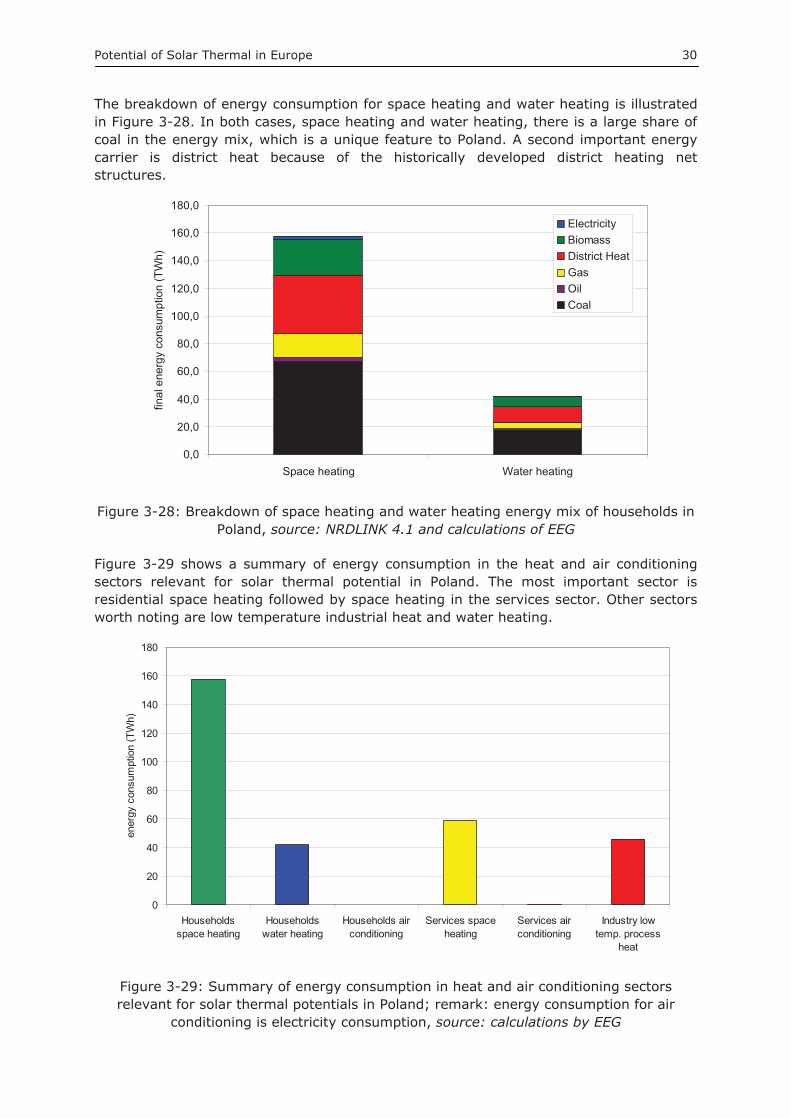
The breakdown of energy consumption for space heating and water heating is illustrated in Figure 3-28. In both cases, space heating and water heating, there is a large share of coal in the energy mix, which is a unique feature to Poland. A second important energy carrier is district heat because of the historically developed district heating net structures.
0,0
20,0
40,0
60,0
80,0
100,0
120,0
140,0
160,0
180,0
Space heating Water heating
final
ene
rgy
cons
umpt
ion
(TW
h)
ElectricityBiomassDistrict HeatGasOilCoal
Figure 3-28: Breakdown of space heating and water heating energy mix of households in Poland, source: NRDLINK 4.1 and calculations of EEG
Figure 3-29 shows a summary of energy consumption in the heat and air conditioning sectors relevant for solar thermal potential in Poland. The most important sector is residential space heating followed by space heating in the services sector. Other sectors worth noting are low temperature industrial heat and water heating.
0
20
40
60
80
100
120
140
160
180
Householdsspace heating
Householdswater heating
Households airconditioning
Services spaceheating
Services airconditioning
Industry lowtemp. process
heat
ener
gy c
onsu
mpt
ion
(TW
h)
Figure 3-29: Summary of energy consumption in heat and air conditioning sectors relevant for solar thermal potentials in Poland; remark: energy consumption for air
conditioning is electricity consumption, source: calculations by EEG
Potential of Solar Thermal in Europe 31
3.3 Heating and Cooling by Sector 3.3.1 Households Sector
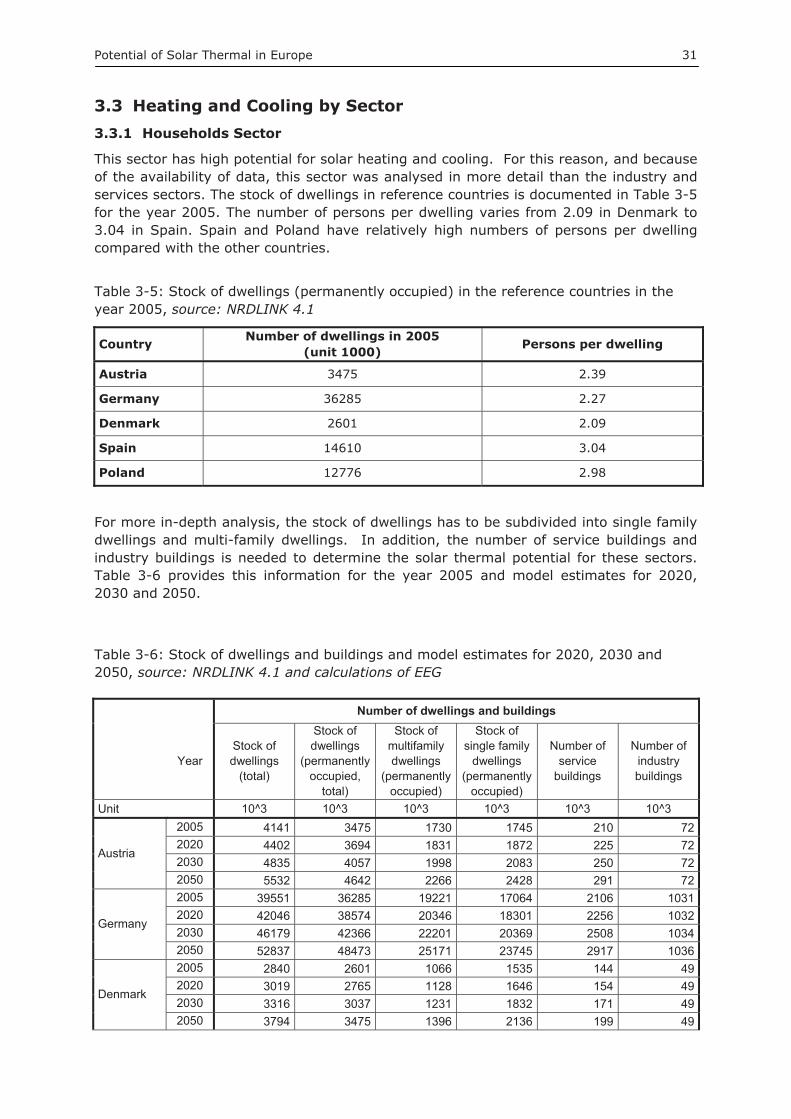
This sector has high potential for solar heating and cooling. For this reason, and because of the availability of data, this sector was analysed in more detail than the industry and services sectors. The stock of dwellings in reference countries is documented in Table 3-5 for the year 2005. The number of persons per dwelling varies from 2.09 in Denmark to 3.04 in Spain. Spain and Poland have relatively high numbers of persons per dwelling compared with the other countries.
Table 3-5: Stock of dwellings (permanently occupied) in the reference countries in the year 2005, source: NRDLINK 4.1
Country Number of dwellings in 2005 (unit 1000) Persons per dwelling
Austria 3475 2.39
Germany 36285 2.27
Denmark 2601 2.09
Spain 14610 3.04
Poland 12776 2.98
For more in-depth analysis, the stock of dwellings has to be subdivided into single family dwellings and multi-family dwellings. In addition, the number of service buildings and industry buildings is needed to determine the solar thermal potential for these sectors. Table 3-6 provides this information for the year 2005 and model estimates for 2020, 2030 and 2050.
Table 3-6: Stock of dwellings and buildings and model estimates for 2020, 2030 and 2050, source: NRDLINK 4.1 and calculations of EEG
Number of dwellings and buildings
Year Stock of dwellings
(total)
Stock of dwellings
(permanently occupied,
total)
Stock of multifamily dwellings
(permanently occupied)
Stock of single family
dwellings (permanently
occupied)
Number of service
buildings
Number of industry buildings
Unit 10^3 10^3 10^3 10^3 10^3 10^3
Austria
2005 4141 3475 1730 1745 210 722020 4402 3694 1831 1872 225 722030 4835 4057 1998 2083 250 722050 5532 4642 2266 2428 291 72
Germany
2005 39551 36285 19221 17064 2106 10312020 42046 38574 20346 18301 2256 10322030 46179 42366 22201 20369 2508 10342050 52837 48473 25171 23745 2917 1036
Denmark
2005 2840 2601 1066 1535 144 492020 3019 2765 1128 1646 154 492030 3316 3037 1231 1832 171 492050 3794 3475 1396 2136 199 49
Potential of Solar Thermal in Europe 32
Spain
2005 16429 14610 7827 6783 833 3282020 17465 15532 8285 7275 892 3282030 19182 17058 9041 8097 992 3292050 21948 19518 10250 9439 1154 330
Poland
2005 14366 12776 8596 4180 655 2992020 15272 13582 9099 4483 702 2992030 16773 14917 9929 4990 780 3002050 19192 17068 11257 5817 907 300
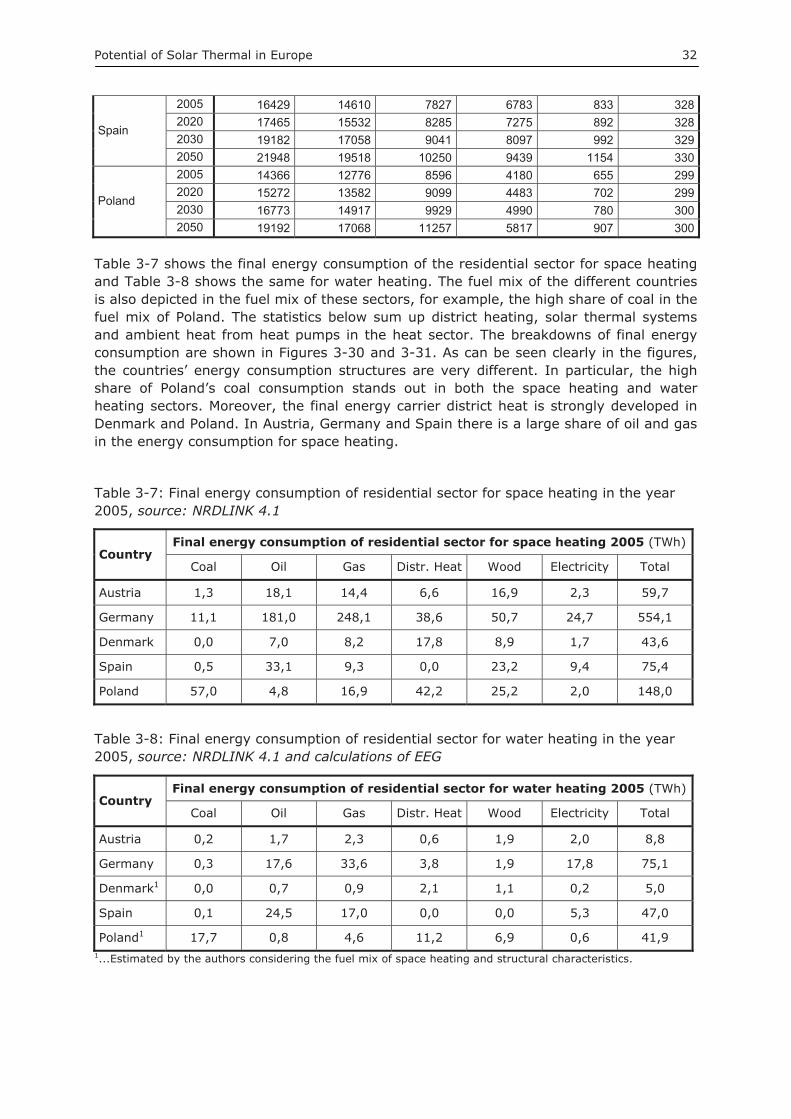
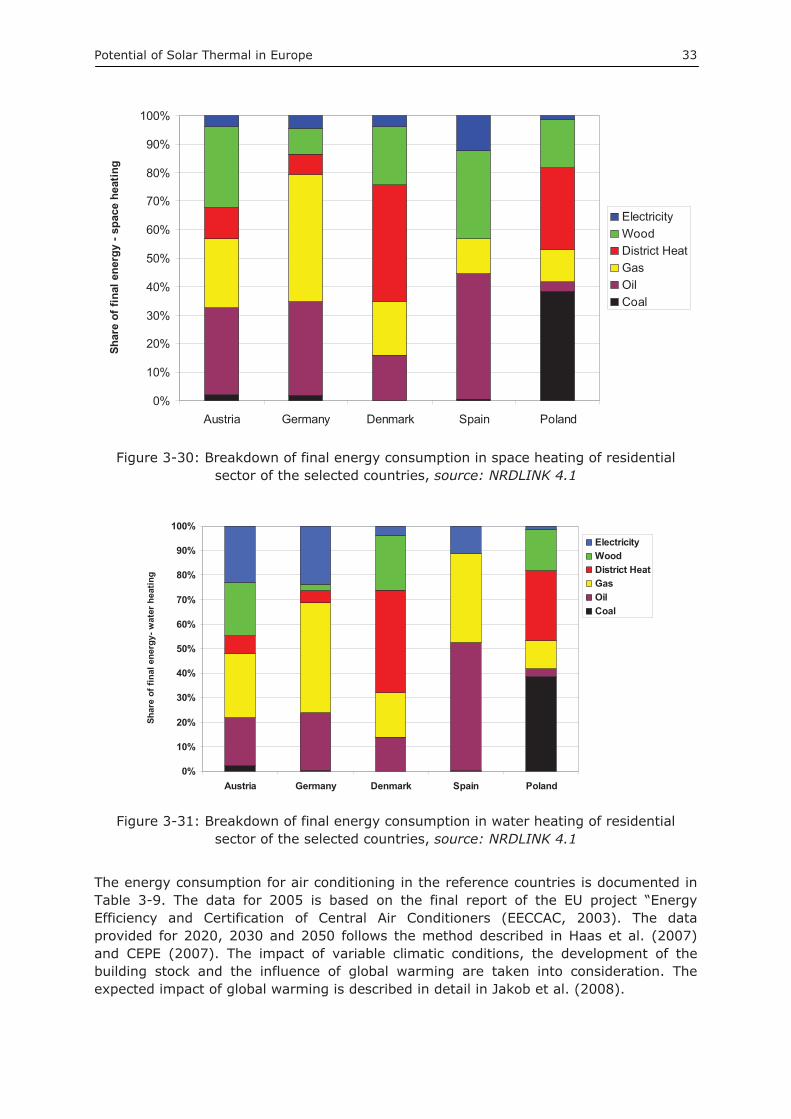
Table 3-7 shows the final energy consumption of the residential sector for space heating and Table 3-8 shows the same for water heating. The fuel mix of the different countries is also depicted in the fuel mix of these sectors, for example, the high share of coal in the fuel mix of Poland. The statistics below sum up district heating, solar thermal systems and ambient heat from heat pumps in the heat sector. The breakdowns of final energy consumption are shown in Figures 3-30 and 3-31. As can be seen clearly in the figures, the countries’ energy consumption structures are very different. In particular, the high share of Poland’s coal consumption stands out in both the space heating and water heating sectors. Moreover, the final energy carrier district heat is strongly developed in Denmark and Poland. In Austria, Germany and Spain there is a large share of oil and gas in the energy consumption for space heating.
Table 3-7: Final energy consumption of residential sector for space heating in the year 2005, source: NRDLINK 4.1
Country Final energy consumption of residential sector for space heating 2005 (TWh)
Coal Oil Gas Distr. Heat Wood Electricity Total
Austria 1,3 18,1 14,4 6,6 16,9 2,3 59,7
Germany 11,1 181,0 248,1 38,6 50,7 24,7 554,1
Denmark 0,0 7,0 8,2 17,8 8,9 1,7 43,6
Spain 0,5 33,1 9,3 0,0 23,2 9,4 75,4
Poland 57,0 4,8 16,9 42,2 25,2 2,0 148,0
Table 3-8: Final energy consumption of residential sector for water heating in the year 2005, source: NRDLINK 4.1 and calculations of EEG
Country Final energy consumption of residential sector for water heating 2005 (TWh)
Coal Oil Gas Distr. Heat Wood Electricity Total
Austria 0,2 1,7 2,3 0,6 1,9 2,0 8,8
Germany 0,3 17,6 33,6 3,8 1,9 17,8 75,1
Denmark1 0,0 0,7 0,9 2,1 1,1 0,2 5,0
Spain 0,1 24,5 17,0 0,0 0,0 5,3 47,0
Poland1 17,7 0,8 4,6 11,2 6,9 0,6 41,9 1...Estimated by the authors considering the fuel mix of space heating and structural characteristics.
Potential of Solar Thermal in Europe 33
0%
10%
20%
30%
40%
50%
60%
70%
80%
90%
100%
Austria Germany Denmark Spain Poland
Shar
e of
fina
l ene
rgy
- spa
ce h
eatin
g
ElectricityWoodDistrict HeatGasOilCoal
Figure 3-30: Breakdown of final energy consumption in space heating of residential sector of the selected countries, source: NRDLINK 4.1
0%
10%
20%
30%
40%
50%
60%
70%
80%
90%
100%
Austria Germany Denmark Spain Poland
Shar
e of
fina
l ene
rgy-
wat
er h
eatin
g
ElectricityWoodDistrict HeatGasOilCoal
Figure 3-31: Breakdown of final energy consumption in water heating of residential sector of the selected countries, source: NRDLINK 4.1
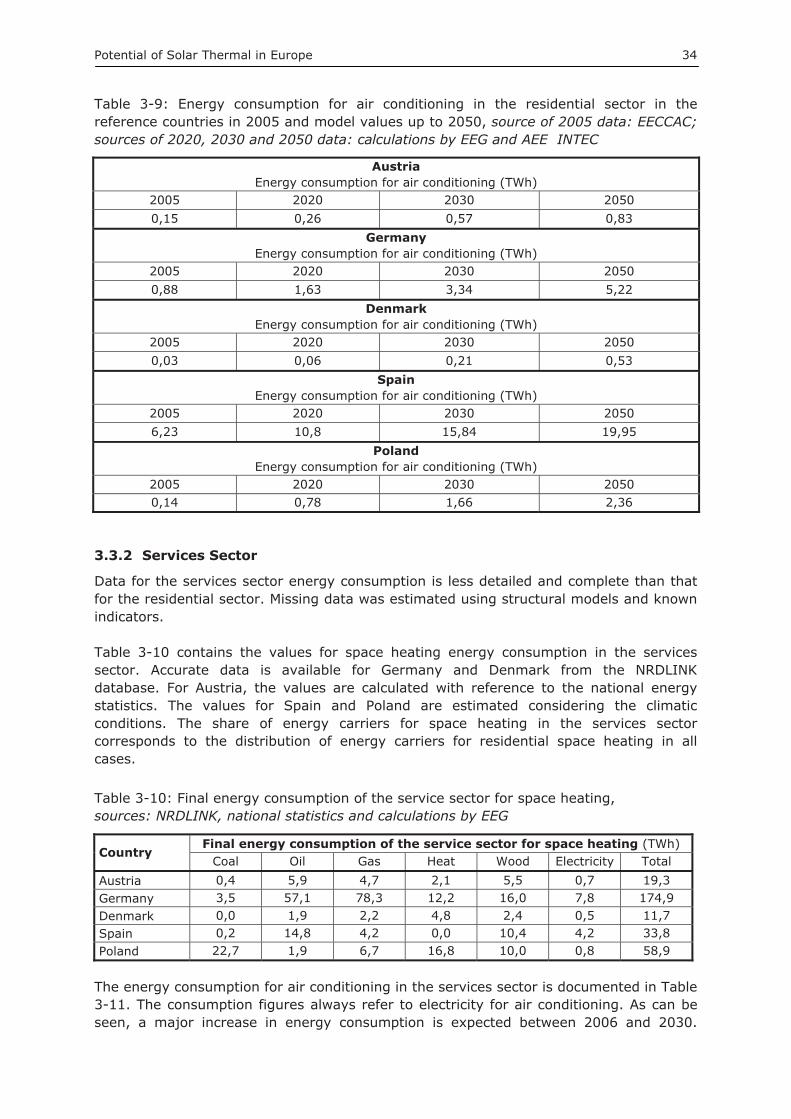
The energy consumption for air conditioning in the reference countries is documented in Table 3-9. The data for 2005 is based on the final report of the EU project “Energy Efficiency and Certification of Central Air Conditioners (EECCAC, 2003). The data provided for 2020, 2030 and 2050 follows the method described in Haas et al. (2007) and CEPE (2007). The impact of variable climatic conditions, the development of the building stock and the influence of global warming are taken into consideration. The expected impact of global warming is described in detail in Jakob et al. (2008).
Potential of Solar Thermal in Europe 34
Table 3-9: Energy consumption for air conditioning in the residential sector in the reference countries in 2005 and model values up to 2050, source of 2005 data: EECCAC; sources of 2020, 2030 and 2050 data: calculations by EEG and AEE INTEC
Austria Energy consumption for air conditioning (TWh)
2005 2020 2030 2050 0,15 0,26 0,57 0,83
Germany Energy consumption for air conditioning (TWh)
2005 2020 2030 2050 0,88 1,63 3,34 5,22
Denmark Energy consumption for air conditioning (TWh)
2005 2020 2030 2050 0,03 0,06 0,21 0,53
SpainEnergy consumption for air conditioning (TWh)
2005 2020 2030 2050 6,23 10,8 15,84 19,95
PolandEnergy consumption for air conditioning (TWh)
2005 2020 2030 2050 0,14 0,78 1,66 2,36
3.3.2 Services Sector
Data for the services sector energy consumption is less detailed and complete than that for the residential sector. Missing data was estimated using structural models and known indicators.
Table 3-10 contains the values for space heating energy consumption in the services sector. Accurate data is available for Germany and Denmark from the NRDLINK database. For Austria, the values are calculated with reference to the national energy statistics. The values for Spain and Poland are estimated considering the climatic conditions. The share of energy carriers for space heating in the services sector corresponds to the distribution of energy carriers for residential space heating in all cases.
Table 3-10: Final energy consumption of the service sector for space heating, sources: NRDLINK, national statistics and calculations by EEG
Country Final energy consumption of the service sector for space heating (TWh)
Coal Oil Gas Heat Wood Electricity Total Austria 0,4 5,9 4,7 2,1 5,5 0,7 19,3 Germany 3,5 57,1 78,3 12,2 16,0 7,8 174,9 Denmark 0,0 1,9 2,2 4,8 2,4 0,5 11,7 Spain 0,2 14,8 4,2 0,0 10,4 4,2 33,8 Poland 22,7 1,9 6,7 16,8 10,0 0,8 58,9
The energy consumption for air conditioning in the services sector is documented in Table 3-11. The consumption figures always refer to electricity for air conditioning. As can be seen, a major increase in energy consumption is expected between 2006 and 2030.
Potential of Solar Thermal in Europe 35
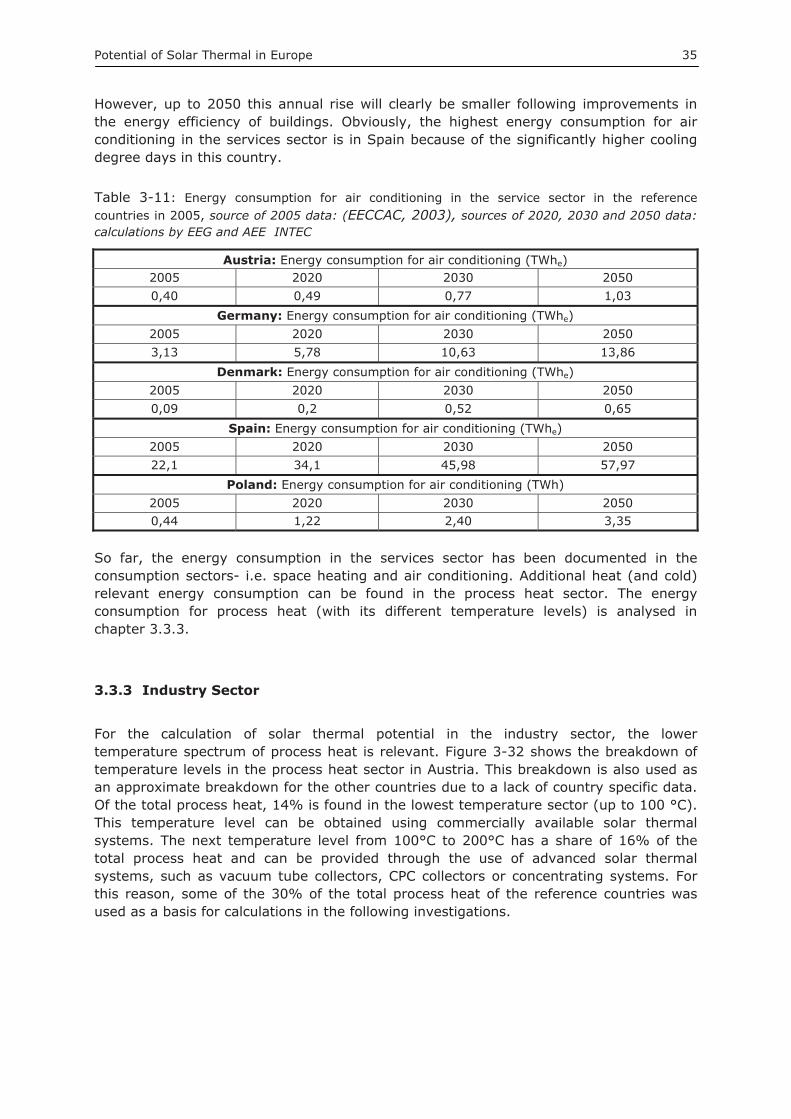
However, up to 2050 this annual rise will clearly be smaller following improvements in the energy efficiency of buildings. Obviously, the highest energy consumption for air conditioning in the services sector is in Spain because of the significantly higher cooling degree days in this country.
Table 3-11: Energy consumption for air conditioning in the service sector in the reference countries in 2005, source of 2005 data: (EECCAC, 2003), sources of 2020, 2030 and 2050 data: calculations by EEG and AEE INTEC
Austria: Energy consumption for air conditioning (TWhe)2005 2020 2030 2050 0,40 0,49 0,77 1,03
Germany: Energy consumption for air conditioning (TWhe)2005 2020 2030 2050 3,13 5,78 10,63 13,86
Denmark: Energy consumption for air conditioning (TWhe)2005 2020 2030 2050 0,09 0,2 0,52 0,65
Spain: Energy consumption for air conditioning (TWhe)2005 2020 2030 2050 22,1 34,1 45,98 57,97
Poland: Energy consumption for air conditioning (TWh) 2005 2020 2030 2050 0,44 1,22 2,40 3,35
So far, the energy consumption in the services sector has been documented in the consumption sectors- i.e. space heating and air conditioning. Additional heat (and cold) relevant energy consumption can be found in the process heat sector. The energy consumption for process heat (with its different temperature levels) is analysed in chapter 3.3.3.
3.3.3 Industry Sector
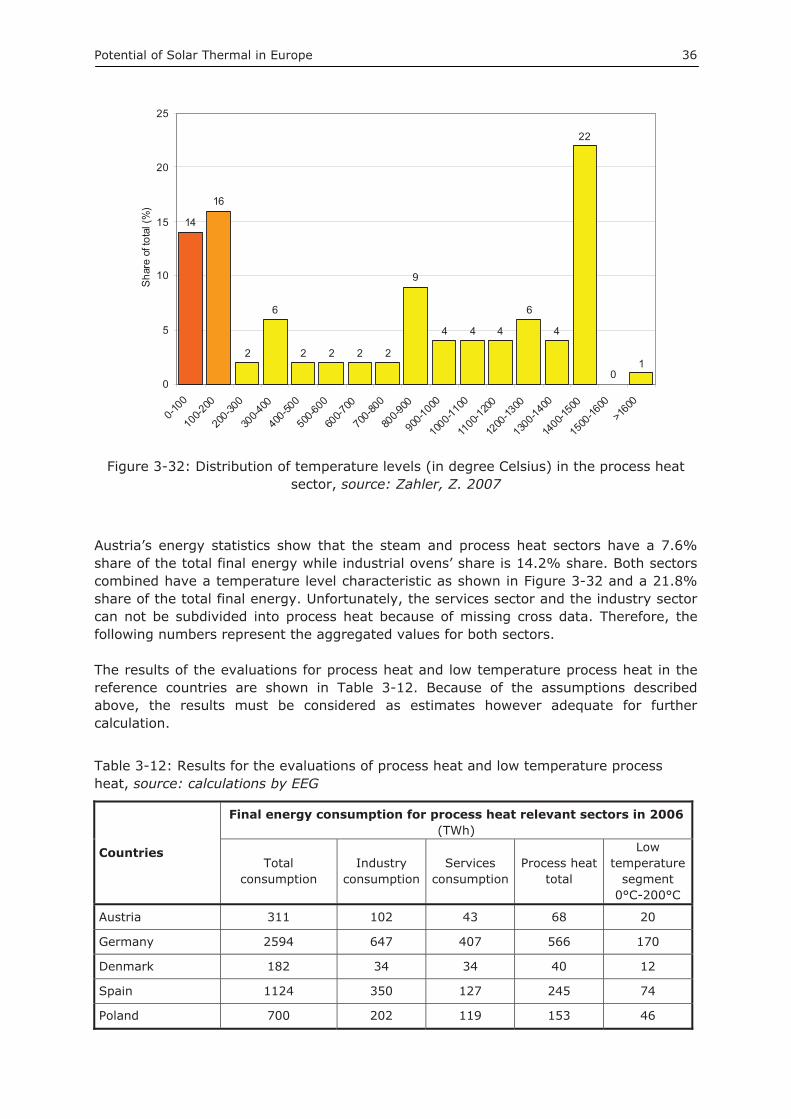
For the calculation of solar thermal potential in the industry sector, the lower temperature spectrum of process heat is relevant. Figure 3-32 shows the breakdown of temperature levels in the process heat sector in Austria. This breakdown is also used as an approximate breakdown for the other countries due to a lack of country specific data. Of the total process heat, 14% is found in the lowest temperature sector (up to 100 °C). This temperature level can be obtained using commercially available solar thermal systems. The next temperature level from 100°C to 200°C has a share of 16% of the total process heat and can be provided through the use of advanced solar thermal systems, such as vacuum tube collectors, CPC collectors or concentrating systems. For this reason, some of the 30% of the total process heat of the reference countries was used as a basis for calculations in the following investigations.
Potential of Solar Thermal in Europe 36
14
16
2
6
2 2 2 2
9
4 4 4
6
4
22
01
0
5
10
15
20
25
0-100
100-2
00
200-3
00
300-4
00
400-5
00
500-6
00
600-7
00
700-8
00
800-9
00
900-1
000
1000
-1100
1100
-1200
1200
-1300
1300
-1400
1400
-1500
1500
-1600
>160
0
Sha
re o
f tot
al (%
)
Figure 3-32: Distribution of temperature levels (in degree Celsius) in the process heat sector, source: Zahler, Z. 2007
Austria’s energy statistics show that the steam and process heat sectors have a 7.6% share of the total final energy while industrial ovens’ share is 14.2% share. Both sectors combined have a temperature level characteristic as shown in Figure 3-32 and a 21.8% share of the total final energy. Unfortunately, the services sector and the industry sector can not be subdivided into process heat because of missing cross data. Therefore, the following numbers represent the aggregated values for both sectors.
The results of the evaluations for process heat and low temperature process heat in the reference countries are shown in Table 3-12. Because of the assumptions described above, the results must be considered as estimates however adequate for further calculation.
Table 3-12: Results for the evaluations of process heat and low temperature process heat, source: calculations by EEG
Countries
Final energy consumption for process heat relevant sectors in 2006(TWh)
Total consumption
Industryconsumption
Services consumption
Process heat total
Lowtemperature
segment 0°C-200°C
Austria 311 102 43 68 20
Germany 2594 647 407 566 170
Denmark 182 34 34 40 12
Spain 1124 350 127 245 74
Poland 700 202 119 153 46
Potential of Solar Thermal in Europe 37
4 Solar Thermal Markets
4.1 Installed Capacity Worldwide The solar thermal collector capacity in operation worldwide equaled 127.8 GWth
corresponding to 182.5 million square metres at the end of the year 2006. Of this, 102.1 GWth were accounted for by flat-plate and evacuated tube collectors and 24.5 GWth
for unglazed plastic collectors. Installed air collector capacity was 1.2 GWth.
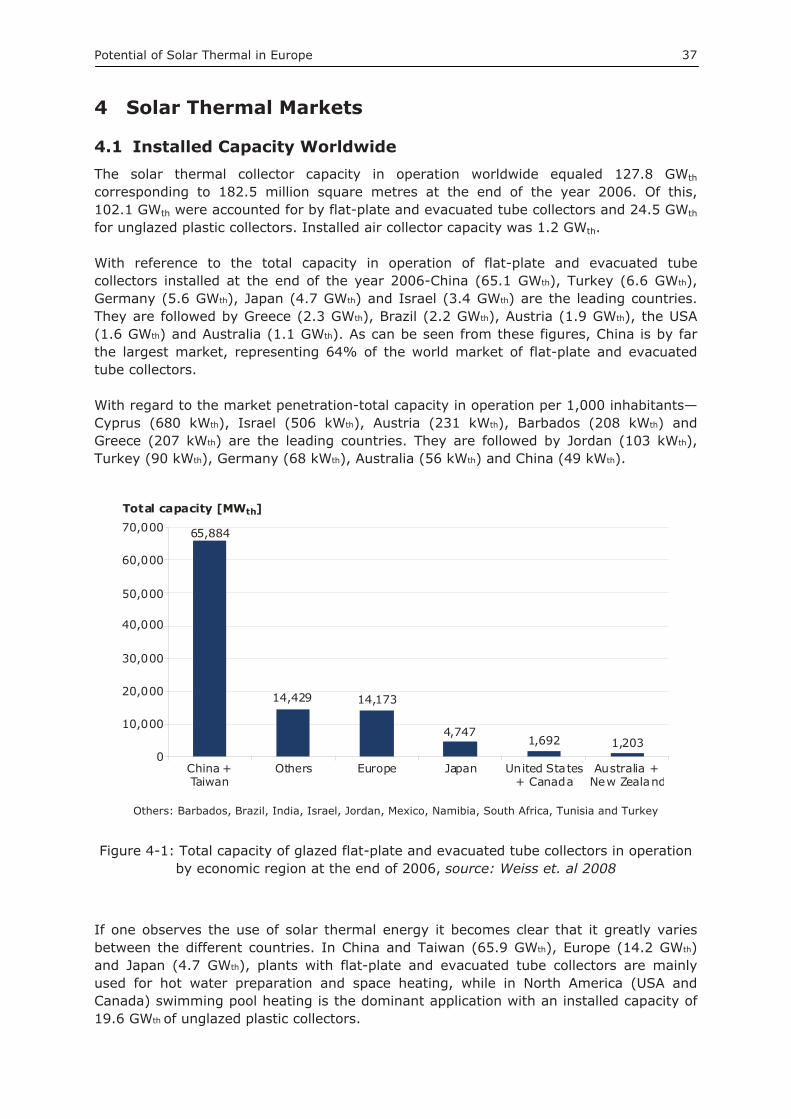
With reference to the total capacity in operation of flat-plate and evacuated tube collectors installed at the end of the year 2006-China (65.1 GWth), Turkey (6.6 GWth), Germany (5.6 GWth), Japan (4.7 GWth) and Israel (3.4 GWth) are the leading countries. They are followed by Greece (2.3 GWth), Brazil (2.2 GWth), Austria (1.9 GWth), the USA (1.6 GWth) and Australia (1.1 GWth). As can be seen from these figures, China is by far the largest market, representing 64% of the world market of flat-plate and evacuated tube collectors.
With regard to the market penetration-total capacity in operation per 1,000 inhabitants—Cyprus (680 kWth), Israel (506 kWth), Austria (231 kWth), Barbados (208 kWth) and Greece (207 kWth) are the leading countries. They are followed by Jordan (103 kWth), Turkey (90 kWth), Germany (68 kWth), Australia (56 kWth) and China (49 kWth).
65,884
1,2031,692
14,429
4,747
14,173
0
10,000
20,000
30,000
40,000
50,000
60,000
70,000
China +Taiwan
Others Europe Japan United States+ Canada
Australia +New Zealand
Total capacity [MW ]th
Others: Barbados, Brazil, India, Israel, Jordan, Mexico, Namibia, South Africa, Tunisia and Turkey
Figure 4-1: Total capacity of glazed flat-plate and evacuated tube collectors in operation by economic region at the end of 2006, source: Weiss et. al 2008
If one observes the use of solar thermal energy it becomes clear that it greatly varies between the different countries. In China and Taiwan (65.9 GWth), Europe (14.2 GWth)and Japan (4.7 GWth), plants with flat-plate and evacuated tube collectors are mainly used for hot water preparation and space heating, while in North America (USA and Canada) swimming pool heating is the dominant application with an installed capacity of 19.6 GWth of unglazed plastic collectors.
Potential of Solar Thermal in Europe 38
Total Capacity of Water Collectors at the end of 2006: Top 10 Countries
6,5
10
58
,59
0
0
2,000
4,000
6,000
8,000
10,000
12,000
14,000
16,000
18,000
20,000
22,000
24,000
China UnitedStates
Turkey Germany Japan Australia Israel Austria Greece Brazil
[MW ]th
Unglazed Plastic absorber Flat-plate Evacuated tube
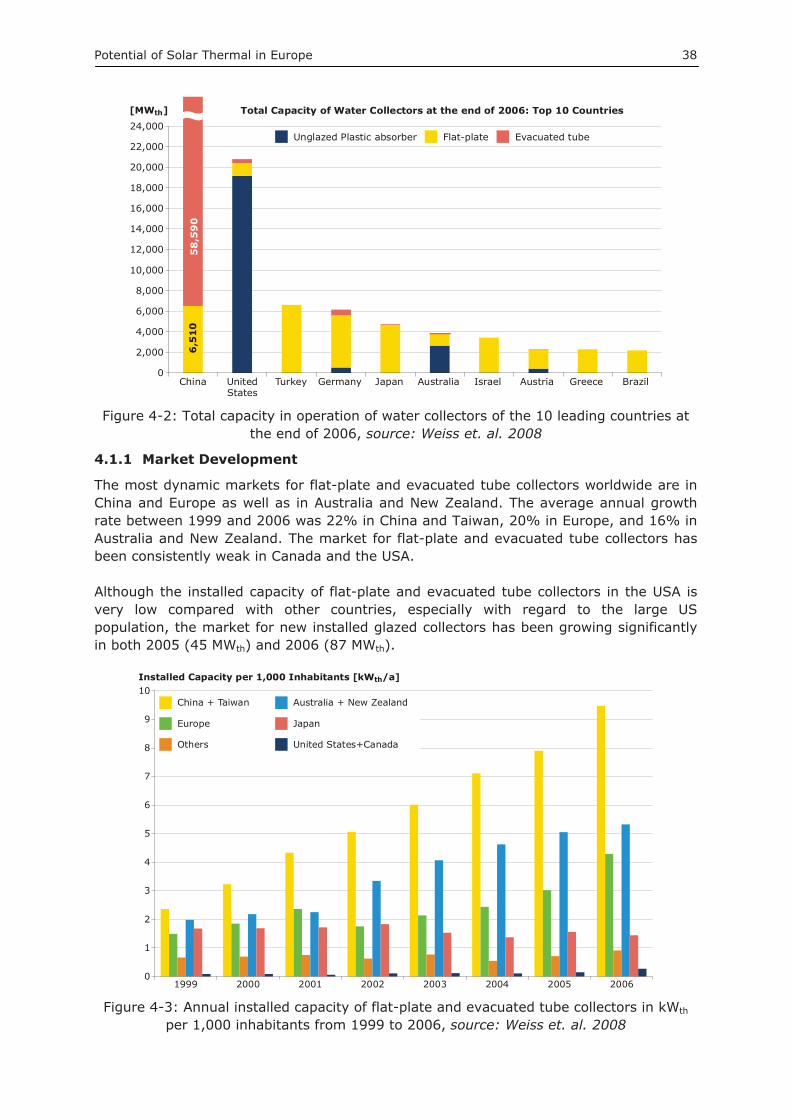
Figure 4-2: Total capacity in operation of water collectors of the 10 leading countries at the end of 2006, source: Weiss et. al. 2008
4.1.1 Market Development
The most dynamic markets for flat-plate and evacuated tube collectors worldwide are in China and Europe as well as in Australia and New Zealand. The average annual growth rate between 1999 and 2006 was 22% in China and Taiwan, 20% in Europe, and 16% in Australia and New Zealand. The market for flat-plate and evacuated tube collectors has been consistently weak in Canada and the USA.
Although the installed capacity of flat-plate and evacuated tube collectors in the USA is very low compared with other countries, especially with regard to the large US population, the market for new installed glazed collectors has been growing significantly in both 2005 (45 MWth) and 2006 (87 MWth).
0
1
2
3
4
5
6
7
8
9
10
1999 2000 2001 2002 2003 2004 2005 2006
Installed Capacity per 1,000 Inhabitants [kW /a]th
China + Taiwan
Europe
Others
Australia + New Zealand
Japan
United States+Canada
Figure 4-3: Annual installed capacity of flat-plate and evacuated tube collectors in kWth
per 1,000 inhabitants from 1999 to 2006, source: Weiss et. al. 2008

Potential of Solar Thermal in Europe 39
4.1.2 Contribution from solar collectors to the supply of energy
The annual collector yield for all solar thermal systems in operation worldwide by the end of 2006 was 76,959 GWh (277,054 TJ). This corresponds to an oil equivalent of 12.5 billion litres and an annual avoidance of 34.1 million tons of CO2.
697
3,2351,376
8,480
40,572
13,035
0
5,000
10,000
15,000
20,000
25,000
30,000
35,000
40,000
45,000
China +Taiwan
Others Europe Japan US +Canada
Australia +New Zealand
Collector yield [GWh/a]
Others: Barbados, Brazil, India, Israel, Jordan, Mexico, Namibia, South Africa, Tunisia and Turkey
Figure 4-4: Annual collector yield of glazed flat-plate and evacuated tube collectors in operation by economic region at the end of 2006, source: Weiss et. al. 2008
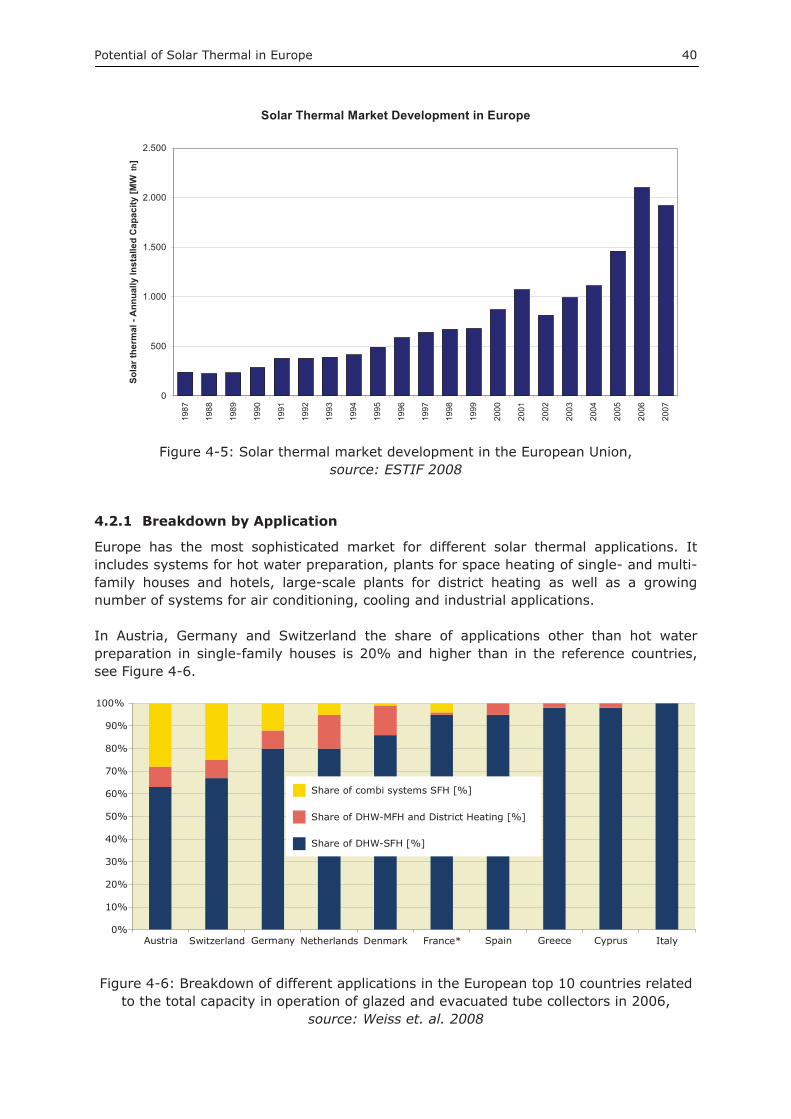
4.2 Installed Capacity Europe Since the early 1990s, there have been some positive developments in the European solar market. As figures from the IEA Solar Heating and Cooling Programme and the European Solar Thermal Industry Federation (ESTIF, 2008) confirm, flat-plate collectors and evacuated tube collectors recorded an average growth of 12.4% between 2000 and 2007. On this basis, it can be calculated that a collector capacity of 0.82 GWth
corresponding to 1.17 million m² of collector area were installed in Europe in the year 2000 and that by 2007 the collector area installed yearly increased to approximately 1.9 GWth (2.7 m² million m² of collector area), which means that the annual installed capacity more than doubled over these seven years.
By the end of 2007, the solar thermal collector capacity (flat-plate and evacuated tube collectors) in operation in Europe equaled 15.3 GWth corresponding to 21.9 million square metres. In this context it is remarkable that 70% (10.9 GWth) of this collector area was installed in just three countries—Austria, Germany and Greece.
With respect to the market penetration - total capacity in operation per 1,000 inhabitants - Cyprus (680 kWth), Austria (231 kWth) and Greece (207 kWth) are leading in Europe. They are followed by Germany (68 kWth), Denmark (48kWth) and Malta (42kWth).
Potential of Solar Thermal in Europe 40
Solar Thermal Market Development in Europe
0
500
1.000
1.500
2.000
2.500
1987
1988
1989
1990
1991
1992
1993
1994
1995
1996
1997
1998
1999
2000
2001
2002
2003
2004
2005
2006
2007
Sola
r the
rmal
- A
nnua
lly In
stal
led
Cap
acity
[MW
th]
Figure 4-5: Solar thermal market development in the European Union, source: ESTIF 2008
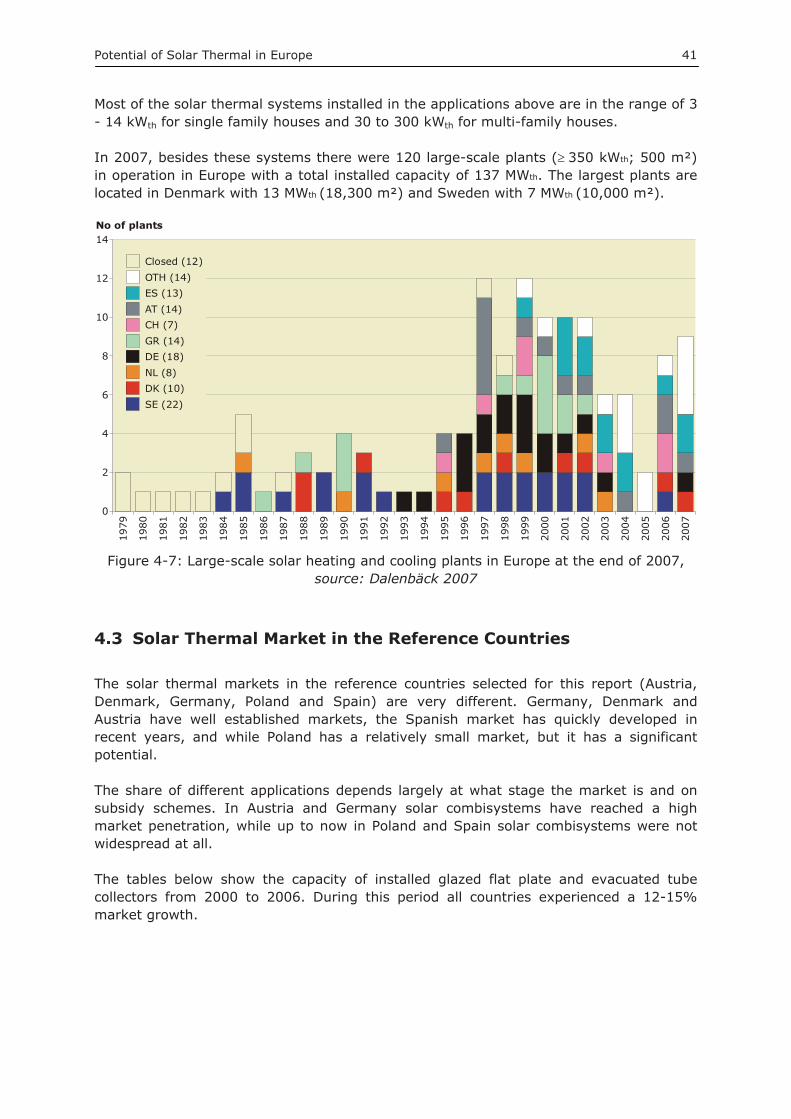
4.2.1 Breakdown by Application
Europe has the most sophisticated market for different solar thermal applications. It includes systems for hot water preparation, plants for space heating of single- and multi-family houses and hotels, large-scale plants for district heating as well as a growing number of systems for air conditioning, cooling and industrial applications.
In Austria, Germany and Switzerland the share of applications other than hot water preparation in single-family houses is 20% and higher than in the reference countries, see Figure 4-6.
Austria0%
10%
20%
30%
40%
50%
60%
70%
80%
90%
100%
Switzerland Germany Netherlands Denmark France* Spain Greece Cyprus Italy
Share of combi systems SFH [%]
Share of DHW-MFH and District Heating [%]
Share of DHW-SFH [%]
Figure 4-6: Breakdown of different applications in the European top 10 countries related to the total capacity in operation of glazed and evacuated tube collectors in 2006,
source: Weiss et. al. 2008
Potential of Solar Thermal in Europe 41
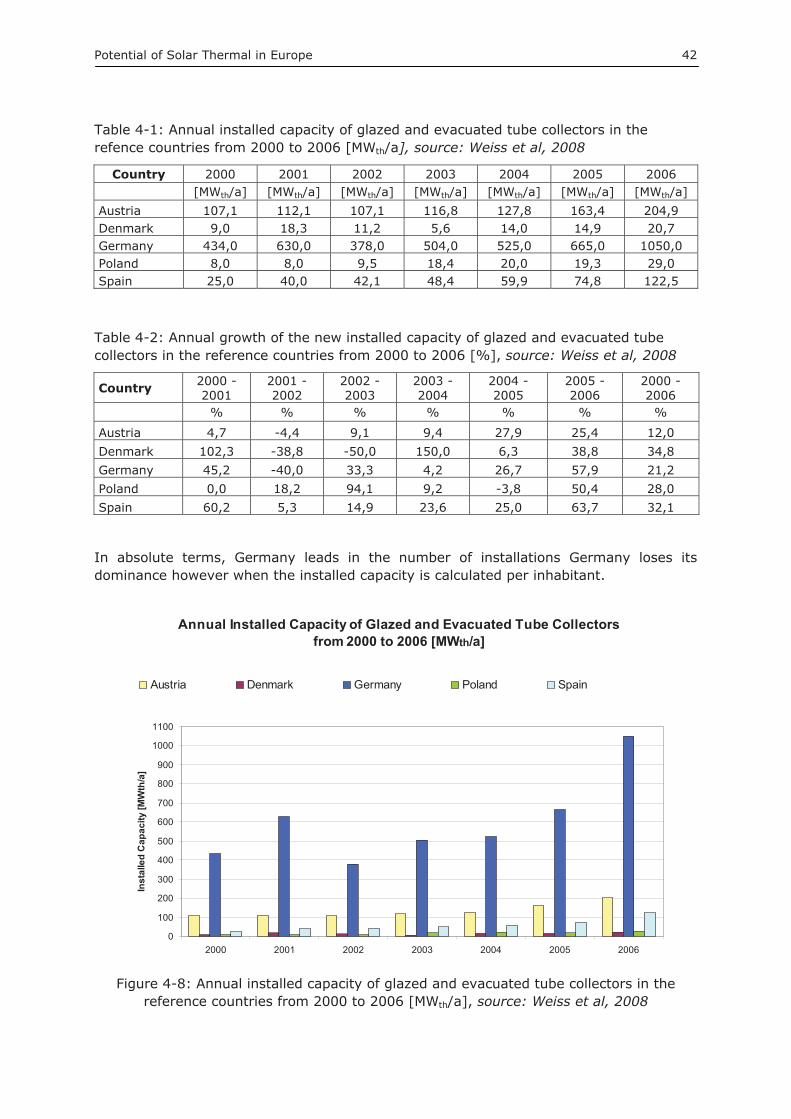
Most of the solar thermal systems installed in the applications above are in the range of 3 - 14 kWth for single family houses and 30 to 300 kWth for multi-family houses.
In 2007, besides these systems there were 120 large-scale plants (��350 kWth; 500 m²) in operation in Europe with a total installed capacity of 137 MWth. The largest plants are located in Denmark with 13 MWth (18,300 m²) and Sweden with 7 MWth (10,000 m²).
0
2
4
6
8
10
12
14
1979
1980
1981
1982
1983
1984
1985
1986
1987
1988
1989
1990
1991
1992
1993
1994
1995
1996
1997
1998
1999
2000
2001
2002
2003
2004
2005
2006
2007
No of plants
Closed (12)OTH (14)ES (13)AT (14)CH (7)GR (14)DE (18)NL (8)DK (10)SE (22)
Figure 4-7: Large-scale solar heating and cooling plants in Europe at the end of 2007, source: Dalenbäck 2007
4.3 Solar Thermal Market in the Reference Countries
The solar thermal markets in the reference countries selected for this report (Austria, Denmark, Germany, Poland and Spain) are very different. Germany, Denmark and Austria have well established markets, the Spanish market has quickly developed in recent years, and while Poland has a relatively small market, but it has a significant potential.
The share of different applications depends largely at what stage the market is and on subsidy schemes. In Austria and Germany solar combisystems have reached a high market penetration, while up to now in Poland and Spain solar combisystems were not widespread at all.
The tables below show the capacity of installed glazed flat plate and evacuated tube collectors from 2000 to 2006. During this period all countries experienced a 12-15% market growth.
Potential of Solar Thermal in Europe 42
Table 4-1: Annual installed capacity of glazed and evacuated tube collectors in the refence countries from 2000 to 2006 [MWth/a], source: Weiss et al, 2008
Country 2000 2001 2002 2003 2004 2005 2006 [MWth/a] [MWth/a] [MWth/a] [MWth/a] [MWth/a] [MWth/a] [MWth/a]
Austria 107,1 112,1 107,1 116,8 127,8 163,4 204,9 Denmark 9,0 18,3 11,2 5,6 14,0 14,9 20,7 Germany 434,0 630,0 378,0 504,0 525,0 665,0 1050,0 Poland 8,0 8,0 9,5 18,4 20,0 19,3 29,0 Spain 25,0 40,0 42,1 48,4 59,9 74,8 122,5
Table 4-2: Annual growth of the new installed capacity of glazed and evacuated tube collectors in the reference countries from 2000 to 2006 [%], source: Weiss et al, 2008
Country 2000 - 2001
2001 -2002
2002 - 2003
2003 - 2004
2004 - 2005
2005 - 2006
2000 - 2006
% % % % % % %
Austria 4,7 -4,4 9,1 9,4 27,9 25,4 12,0 Denmark 102,3 -38,8 -50,0 150,0 6,3 38,8 34,8 Germany 45,2 -40,0 33,3 4,2 26,7 57,9 21,2 Poland 0,0 18,2 94,1 9,2 -3,8 50,4 28,0 Spain 60,2 5,3 14,9 23,6 25,0 63,7 32,1
In absolute terms, Germany leads in the number of installations Germany loses its dominance however when the installed capacity is calculated per inhabitant.
Annual Installed Capacity of Glazed and Evacuated Tube Collectors from 2000 to 2006 [MWth/a]
0
100
200
300
400
500
600
700
800
900
1000
1100
2000 2001 2002 2003 2004 2005 2006
Inst
alle
d C
apac
ity [M
Wth
/a]
Austria Denmark Germany Poland Spain
Figure 4-8: Annual installed capacity of glazed and evacuated tube collectors in the reference countries from 2000 to 2006 [MWth/a], source: Weiss et al, 2008
Potential of Solar Thermal in Europe 43
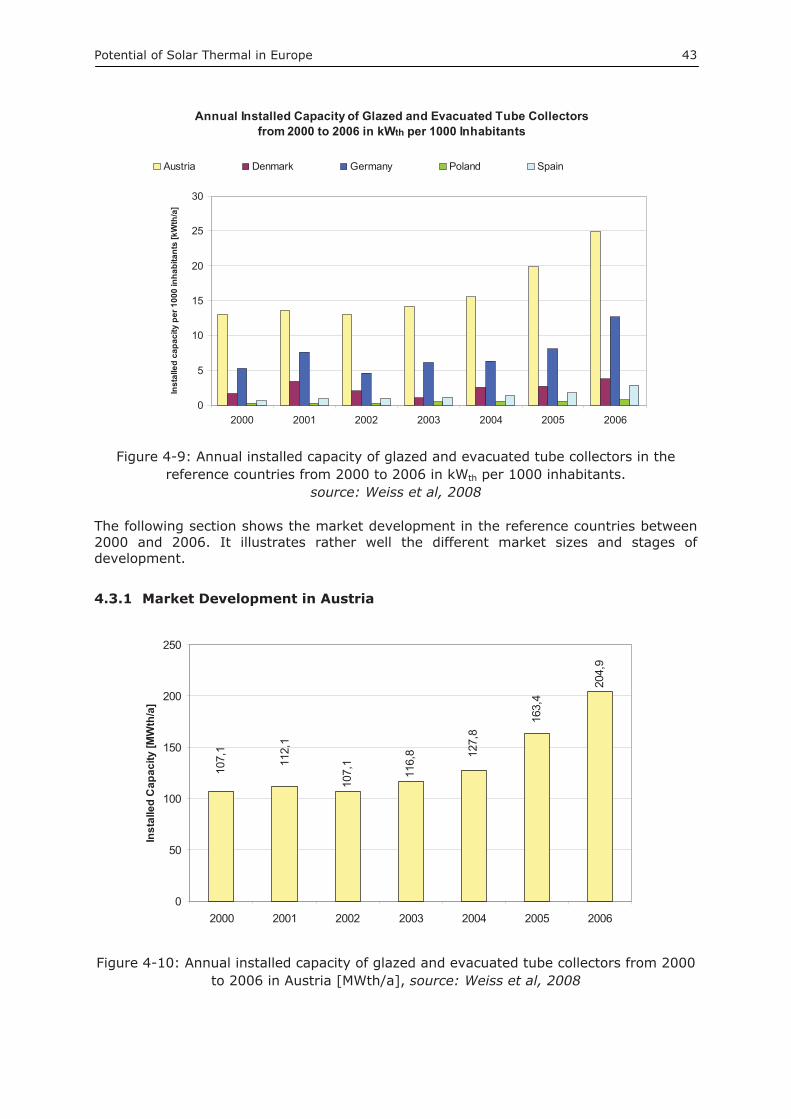
Annual Installed Capacity of Glazed and Evacuated Tube Collectors from 2000 to 2006 in kWth per 1000 Inhabitants
0
5
10
15
20
25
30
2000 2001 2002 2003 2004 2005 2006
Inst
alle
d ca
paci
ty p
er 1
000
inha
bita
nts
[kW
th/a
]Austria Denmark Germany Poland Spain
Figure 4-9: Annual installed capacity of glazed and evacuated tube collectors in the reference countries from 2000 to 2006 in kWth per 1000 inhabitants.
source: Weiss et al, 2008
The following section shows the market development in the reference countries between 2000 and 2006. It illustrates rather well the different market sizes and stages of development.
4.3.1 Market Development in Austria
107,
1
116,
8
204,
9
163,
4
127,
8
107,
1
112,
1
0
50
100
150
200
250
2000 2001 2002 2003 2004 2005 2006
Inst
alle
d C
apac
ity [M
Wth
/a]
Figure 4-10: Annual installed capacity of glazed and evacuated tube collectors from 2000 to 2006 in Austria [MWth/a], source: Weiss et al, 2008
Potential of Solar Thermal in Europe 44
Since 2002, the annual installation of glazed flat plate and evacuated tube collectors in Austria shows significant growth which was assisted by various national solar energy support programmes.
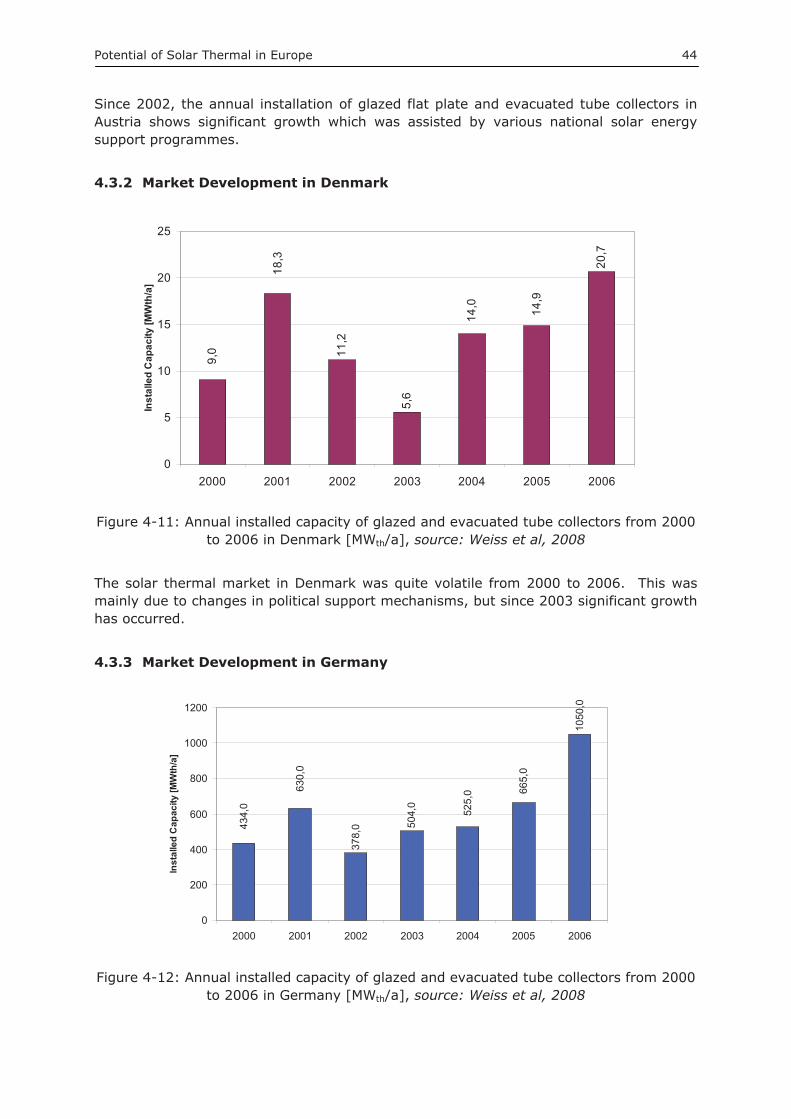
4.3.2 Market Development in Denmark
11,2
5,6
20,7
18,3
9,0
14,0 14,9
0
5
10
15
20
25
2000 2001 2002 2003 2004 2005 2006
Inst
alle
d C
apac
ity [M
Wth
/a]
Figure 4-11: Annual installed capacity of glazed and evacuated tube collectors from 2000 to 2006 in Denmark [MWth/a], source: Weiss et al, 2008
The solar thermal market in Denmark was quite volatile from 2000 to 2006. This was mainly due to changes in political support mechanisms, but since 2003 significant growth has occurred.
4.3.3 Market Development in Germany
378,
0 504,
0
1050
,0
665,
0
525,
0
434,
0
630,
0
0
200
400
600
800
1000
1200
2000 2001 2002 2003 2004 2005 2006
Inst
alle
d C
apac
ity [M
Wth
/a]
Figure 4-12: Annual installed capacity of glazed and evacuated tube collectors from 2000 to 2006 in Germany [MWth/a], source: Weiss et al, 2008
Potential of Solar Thermal in Europe 45
The solar thermal market for glazed flat-plate and evacuated tube collectors in Germany is well established, and has experienced a constant growth since 2002. The German market is one of the main drivers of the overall European solar thermal market. It is stimulated to a great extent by subsidies and other political support mechanisms.
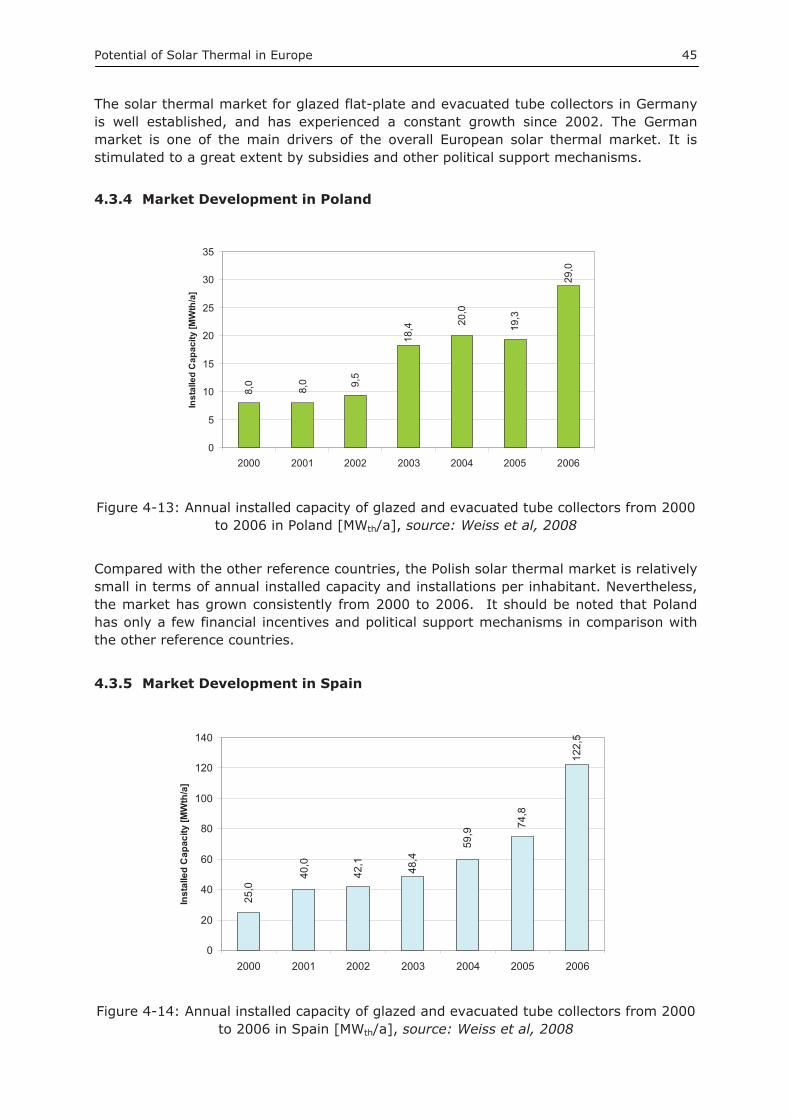
4.3.4 Market Development in Poland
18,4
29,0
9,5
8,0
8,0
20,0
19,3
0
5
10
15
20
25
30
35
2000 2001 2002 2003 2004 2005 2006
Inst
alle
d C
apac
ity [M
Wth
/a]
Figure 4-13: Annual installed capacity of glazed and evacuated tube collectors from 2000 to 2006 in Poland [MWth/a], source: Weiss et al, 2008
Compared with the other reference countries, the Polish solar thermal market is relatively small in terms of annual installed capacity and installations per inhabitant. Nevertheless, the market has grown consistently from 2000 to 2006. It should be noted that Poland has only a few financial incentives and political support mechanisms in comparison with the other reference countries.
4.3.5 Market Development in Spain
48,4
122,
5
74,8
59,9
25,0
40,0
42,1
0
20
40
60
80
100
120
140
2000 2001 2002 2003 2004 2005 2006
Inst
alle
d C
apac
ity [M
Wth
/a]
Figure 4-14: Annual installed capacity of glazed and evacuated tube collectors from 2000 to 2006 in Spain [MWth/a], source: Weiss et al, 2008

Potential of Solar Thermal in Europe 46
The solar thermal market in Spain shows a constant growth from 2000 to 2006. Due to mandatory solar obligation, the Spanish market is expected to show significant growth rates in future years.
Potential of Solar Thermal in Europe 47
5 Methodology used to assess the Solar Thermal Potential
The evaluation of the solr thermal potential in the European Union (EU-27) is based on detailed country studies regarding the solar thermal potential in the five reference countries.
As already mentioned earlier, the following countries were selected as reference countries: Austria, Denmark, Germany, Poland and Spain. They represent: 36% of the population of the EU Member States; all European climatic zones; very different stages of solar thermal market development; new and old EU member countries; and different political support mechanisms and incentives for solar thermal.
Table 5-1 shows the population of four European regions compared with the population in the reference countries.
Table 5-1: Population of European regions and population in reference countries
Population per Region
Share of total
Population Reference Counties
Share of population Reference Countries
Southern Europe 135.829.000 28% 44.279.000 25%
Central Europe 190.090.000 39% 90.914.000 51%
Eastern Europe 81.942.000 17% 38.082.000 21%
Northern Europe 84.908.000 17% 5.442.000 3%
EU - 27 492.769.000 100% 178.717.000 36%
The solar thermal potential for all reference countries was assessed for the following sectors:
- space heating of residential buildings - hot water preparation in the residential sector - space heating in the service sector - industrial low temperature heat (<250°C) - air conditioning and cooling in the residential and service sectors
The solar thermal potential in the EU-27 was determined by extrapolation of the weighted results of each sector of the reference countries. The weighting was proportionate to the population as shown in Table 5-1.
5.1 Expected Heating and Cooling Demand 2020 – 2050 To determine the potential of solar thermal’s contribution to the heat demand in the selected reference countries, a model for the future demand was developed. Major aspects of the model design are the “EU 20% renewables goal” and the estimated development of energy efficiency of the relevant technologies (thermal quality of buildings, heat applications in the residential sector, the service sector and the industrial sector). The development of the future heating and cooling demand was calculated for the years 2020, 2030 and 2050.
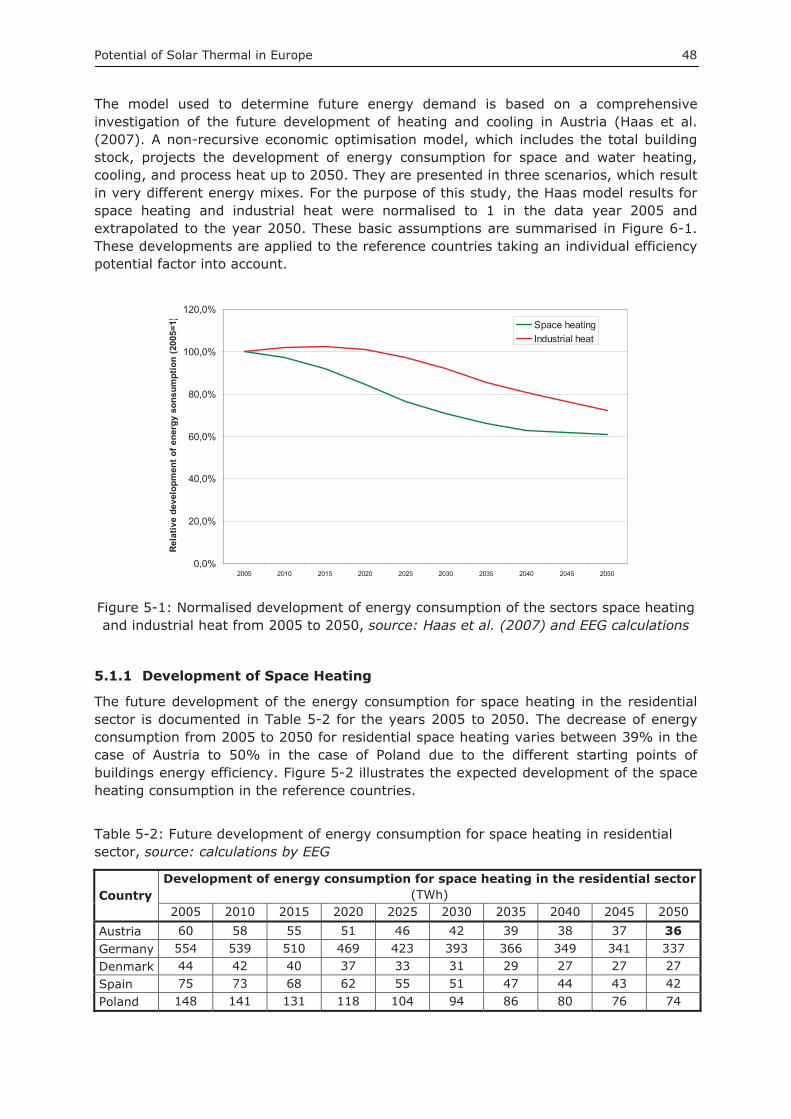
Potential of Solar Thermal in Europe 48
The model used to determine future energy demand is based on a comprehensive investigation of the future development of heating and cooling in Austria (Haas et al. (2007). A non-recursive economic optimisation model, which includes the total building stock, projects the development of energy consumption for space and water heating, cooling, and process heat up to 2050. They are presented in three scenarios, which result in very different energy mixes. For the purpose of this study, the Haas model results for space heating and industrial heat were normalised to 1 in the data year 2005 and extrapolated to the year 2050. These basic assumptions are summarised in Figure 6-1. These developments are applied to the reference countries taking an individual efficiencypotential factor into account.
0,0%
20,0%
40,0%
60,0%
80,0%
100,0%
120,0%
2005 2010 2015 2020 2025 2030 2035 2040 2045 2050
Rel
ativ
e de
velo
pmen
t of e
nerg
y so
nsum
ptio
n (2
005=
1) Space heatingIndustrial heat
Figure 5-1: Normalised development of energy consumption of the sectors space heating and industrial heat from 2005 to 2050, source: Haas et al. (2007) and EEG calculations
5.1.1 Development of Space Heating
The future development of the energy consumption for space heating in the residential sector is documented in Table 5-2 for the years 2005 to 2050. The decrease of energy consumption from 2005 to 2050 for residential space heating varies between 39% in the case of Austria to 50% in the case of Poland due to the different starting points of buildings energy efficiency. Figure 5-2 illustrates the expected development of the space heating consumption in the reference countries.
Table 5-2: Future development of energy consumption for space heating in residential sector, source: calculations by EEG
Country Development of energy consumption for space heating in the residential sector
(TWh) 2005 2010 2015 2020 2025 2030 2035 2040 2045 2050
Austria 60 58 55 51 46 42 39 38 37 36 Germany 554 539 510 469 423 393 366 349 341 337 Denmark 44 42 40 37 33 31 29 27 27 27 Spain 75 73 68 62 55 51 47 44 43 42 Poland 148 141 131 118 104 94 86 80 76 74
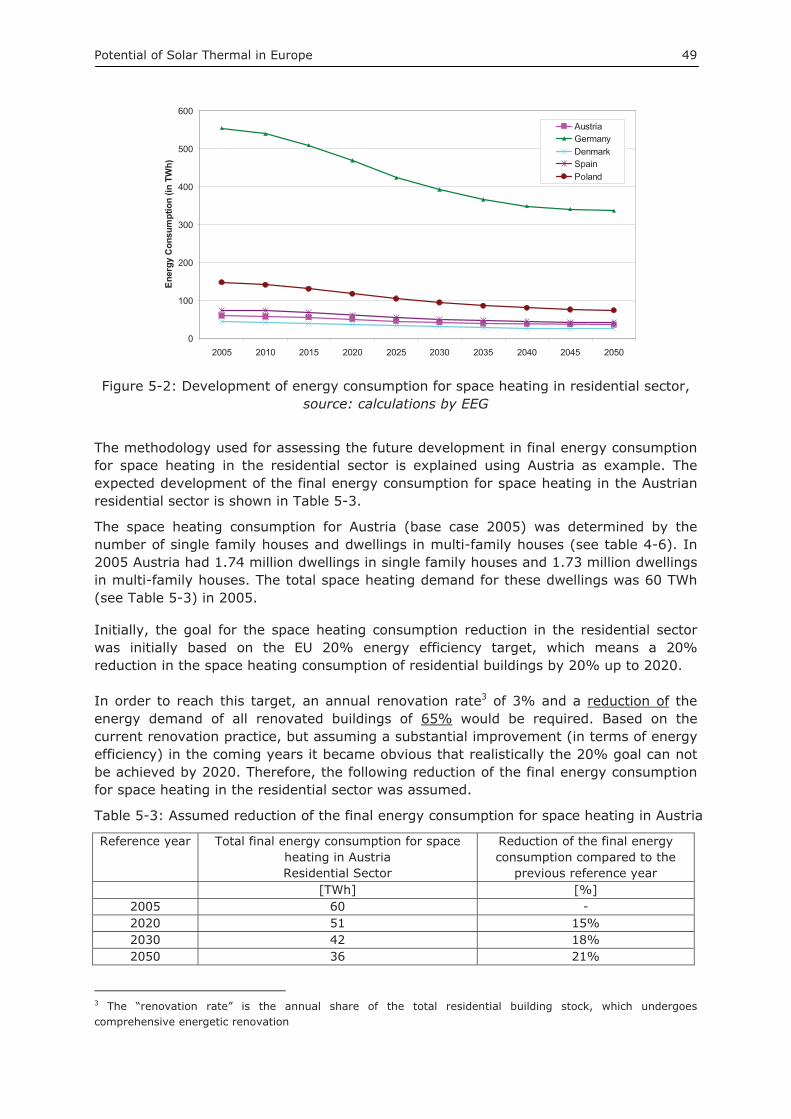
Potential of Solar Thermal in Europe 49
0
100
200
300
400
500
600
2005 2010 2015 2020 2025 2030 2035 2040 2045 2050
Ener
gy C
onsu
mpt
ion
(in T
Wh)
AustriaGermanyDenmarkSpainPoland
Figure 5-2: Development of energy consumption for space heating in residential sector, source: calculations by EEG
The methodology used for assessing the future development in final energy consumption for space heating in the residential sector is explained using Austria as example. The expected development of the final energy consumption for space heating in the Austrian residential sector is shown in Table 5-3.
The space heating consumption for Austria (base case 2005) was determined by the number of single family houses and dwellings in multi-family houses (see table 4-6). In 2005 Austria had 1.74 million dwellings in single family houses and 1.73 million dwellings in multi-family houses. The total space heating demand for these dwellings was 60 TWh (see Table 5-3) in 2005.
Initially, the goal for the space heating consumption reduction in the residential sector was initially based on the EU 20% energy efficiency target, which means a 20% reduction in the space heating consumption of residential buildings by 20% up to 2020.
In order to reach this target, an annual renovation rate3 of 3% and a reduction of the energy demand of all renovated buildings of 65% would be required. Based on the current renovation practice, but assuming a substantial improvement (in terms of energy efficiency) in the coming years it became obvious that realistically the 20% goal can not be achieved by 2020. Therefore, the following reduction of the final energy consumption for space heating in the residential sector was assumed.
Table 5-3: Assumed reduction of the final energy consumption for space heating in Austria
Reference year Total final energy consumption for space heating in Austria Residential Sector
Reduction of the final energy consumption compared to the
previous reference year [TWh] [%]
2005 60 - 2020 51 15% 2030 42 18% 2050 36 21%
3 The “renovation rate” is the annual share of the total residential building stock, which undergoes comprehensive energetic renovation
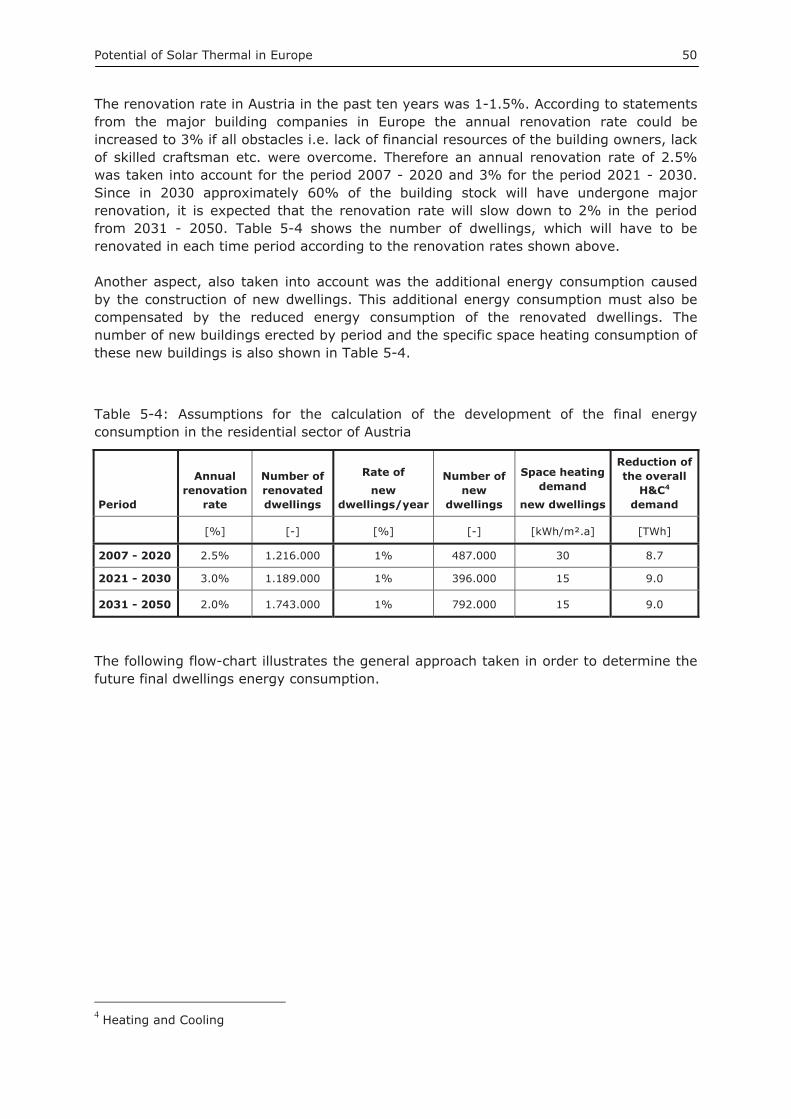
Potential of Solar Thermal in Europe 50
The renovation rate in Austria in the past ten years was 1-1.5%. According to statements from the major building companies in Europe the annual renovation rate could be increased to 3% if all obstacles i.e. lack of financial resources of the building owners, lack of skilled craftsman etc. were overcome. Therefore an annual renovation rate of 2.5% was taken into account for the period 2007 - 2020 and 3% for the period 2021 - 2030. Since in 2030 approximately 60% of the building stock will have undergone major renovation, it is expected that the renovation rate will slow down to 2% in the period from 2031 - 2050. Table 5-4 shows the number of dwellings, which will have to be renovated in each time period according to the renovation rates shown above.
Another aspect, also taken into account was the additional energy consumption caused by the construction of new dwellings. This additional energy consumption must also be compensated by the reduced energy consumption of the renovated dwellings. The number of new buildings erected by period and the specific space heating consumption of these new buildings is also shown in Table 5-4.
Table 5-4: Assumptions for the calculation of the development of the final energy consumption in the residential sector of Austria
Period
Annualrenovation
rate
Number of renovated dwellings
Rate of new
dwellings/year
Number of new
dwellings
Space heating demand
new dwellings
Reduction of the overall
H&C4
demand
[%] [-] [%] [-] [kWh/m².a] [TWh]
2007 - 2020 2.5% 1.216.000 1% 487.000 30 8.7
2021 - 2030 3.0% 1.189.000 1% 396.000 15 9.0
2031 - 2050 2.0% 1.743.000 1% 792.000 15 9.0
The following flow-chart illustrates the general approach taken in order to determine the future final dwellings energy consumption.
4 Heating and Cooling
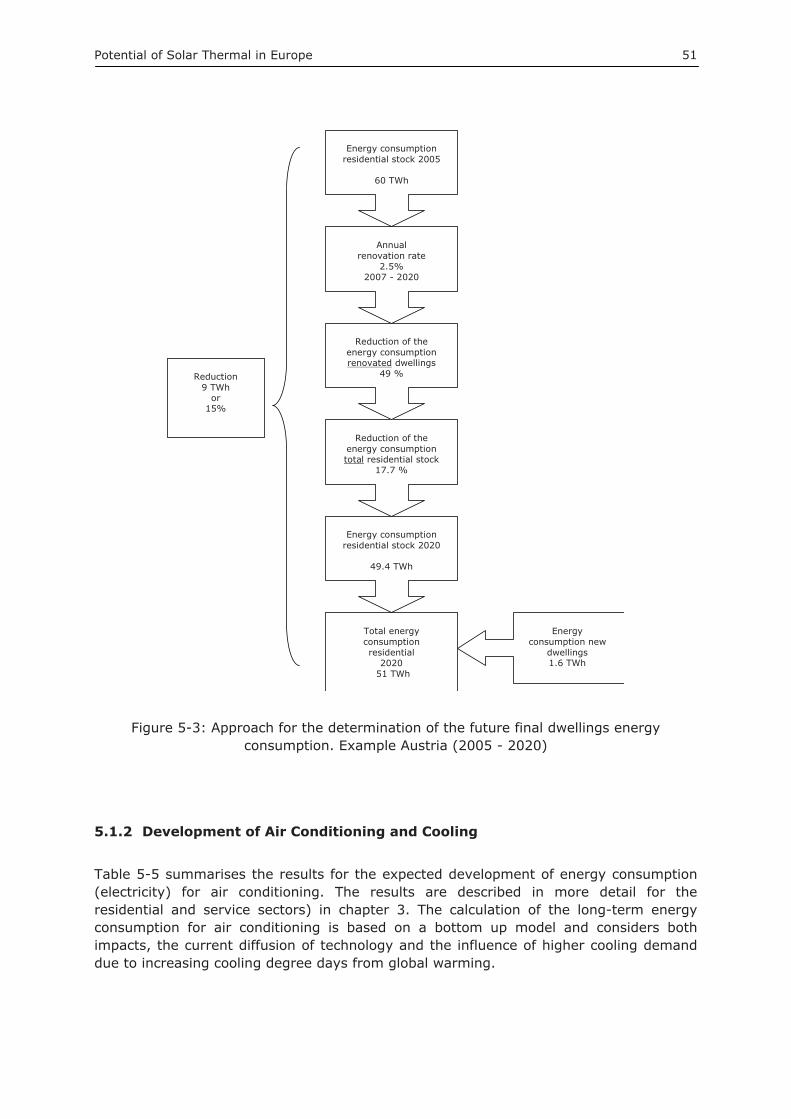
Potential of Solar Thermal in Europe 51
Annual renovation rate
2.5%2007 - 2020
Reduction of the energy consumption total residential stock
17.7 %
Energy consumption residential stock 2020
49.4 TWh
Energy consumption new
dwellings 1.6 TWh
Total energy consumption residential
2020 51 TWh
Reduction 9 TWh
or 15%
Reduction of the energy consumption renovated dwellings
49 %
Energy consumption residential stock 2005
60 TWh
Figure 5-3: Approach for the determination of the future final dwellings energy consumption. Example Austria (2005 - 2020)
5.1.2 Development of Air Conditioning and Cooling
Table 5-5 summarises the results for the expected development of energy consumption (electricity) for air conditioning. The results are described in more detail for the residential and service sectors) in chapter 3. The calculation of the long-term energy consumption for air conditioning is based on a bottom up model and considers both impacts, the current diffusion of technology and the influence of higher cooling demand due to increasing cooling degree days from global warming.
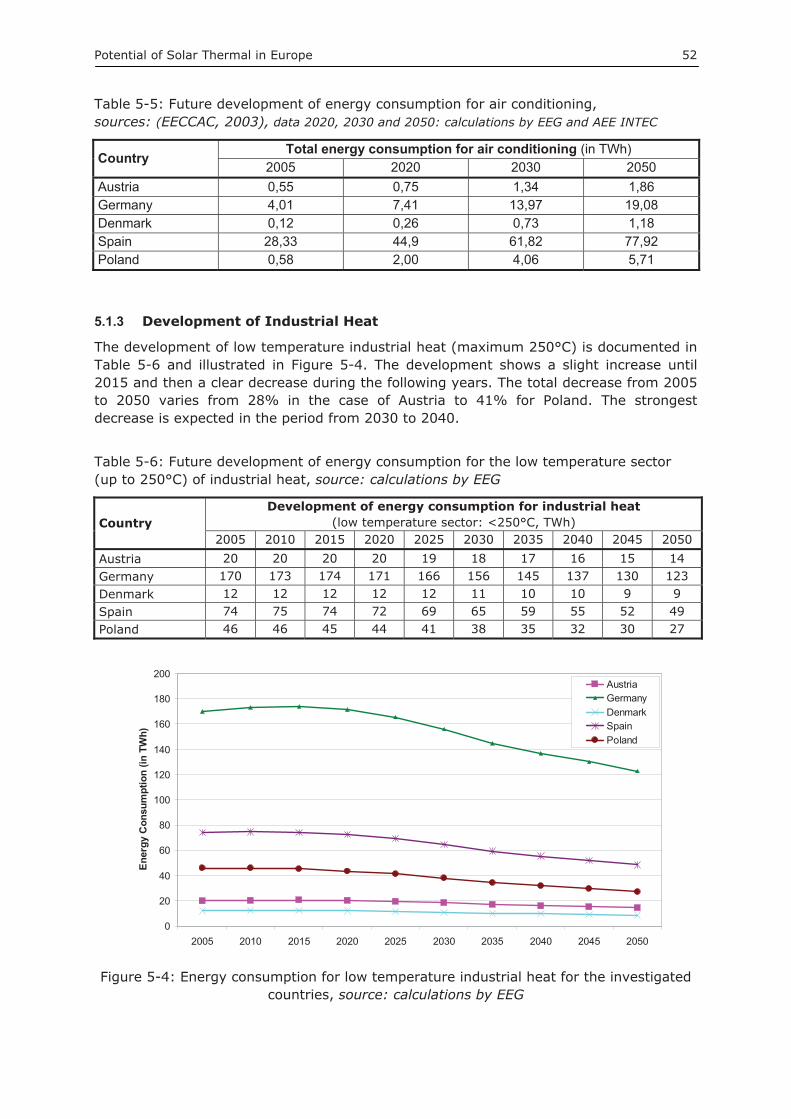
Potential of Solar Thermal in Europe 52
Table 5-5: Future development of energy consumption for air conditioning, sources: (EECCAC, 2003), data 2020, 2030 and 2050: calculations by EEG and AEE INTEC
Country Total energy consumption for air conditioning (in TWh) 2005 2020 2030 2050
Austria 0,55 0,75 1,34 1,86 Germany 4,01 7,41 13,97 19,08 Denmark 0,12 0,26 0,73 1,18 Spain 28,33 44,9 61,82 77,92 Poland 0,58 2,00 4,06 5,71
5.1.3 Development of Industrial Heat
The development of low temperature industrial heat (maximum 250°C) is documented in Table 5-6 and illustrated in Figure 5-4. The development shows a slight increase until 2015 and then a clear decrease during the following years. The total decrease from 2005 to 2050 varies from 28% in the case of Austria to 41% for Poland. The strongest decrease is expected in the period from 2030 to 2040.
Table 5-6: Future development of energy consumption for the low temperature sector (up to 250°C) of industrial heat, source: calculations by EEG
Country Development of energy consumption for industrial heat
(low temperature sector: <250°C, TWh) 2005 2010 2015 2020 2025 2030 2035 2040 2045 2050
Austria 20 20 20 20 19 18 17 16 15 14 Germany 170 173 174 171 166 156 145 137 130 123 Denmark 12 12 12 12 12 11 10 10 9 9 Spain 74 75 74 72 69 65 59 55 52 49 Poland 46 46 45 44 41 38 35 32 30 27
0
20
40
60
80
100
120
140
160
180
200
2005 2010 2015 2020 2025 2030 2035 2040 2045 2050
Ener
gy C
onsu
mpt
ion
(in T
Wh)
AustriaGermanyDenmarkSpainPoland
Figure 5-4: Energy consumption for low temperature industrial heat for the investigated countries, source: calculations by EEG
Potential of Solar Thermal in Europe 53
5.2 Limiting Factors for the Installation of Solar Thermal Systems Apart from low prices of fossil fuels, lack of skilled human resources as well as lack of political awareness, one of the major technical limiting factors for the installation of solar thermal systems seems to be the availability of space.
Other limiting factors for a high market penetration are the availability of key components like thermal storages with a high energy density and the availability of appropriate materials for the mass production of collectors.
These limiting factors acted as the basis for the definition of the three scenarios and the related growth rates as shown in chapter 6.4 below.
5.2.1 Availability of key components
Besides the collector, one of the key components of a solar thermal system is the heat storage. Heat storages increase the use that can be made of the solar resource by allowing heat to be used on demand, rather that at the time of production. For solar hot water systems, a good solution is to use the water as medium for heat storage.
Looking at solar combisystems for hot water preparation and space heating there is a different picture. The size of the store depends on the specific heat capacity of the heat storing medium. In the case of water, the heat capacity is relatively low. In order to keep the size of these heat storages economical, the solar fraction5 of combisystems is usually in the range of 15-30%.
To achieve the medium to long term goals set in the most ambitious scenarios, solar combisystems with high solar fractions are needed. One of the preconditions for a broad market diffusion of these solar thermal systems is the availability of thermal storages with high energy density and the ability to store non-sensible heat for a set time. To date, several research groups are working on thermal storages with high energy density. In the most ambitious scenarios, it is assumed that storages with high energy density will be available by 2020.
Another aspect to be considered is the availability of materials for the mass production of collectors. The current market is dominated by solar collectors produced mainly from copper and aluminum. Taking the expected long-term growth rates of solar thermal systems into consideration, new collector materials, such as polymeric materials, will eventually be needed (~2025).
5.2.2 Availability of space for the installation of solar thermal collectors
The calculations concerning the availability of space for the installation of the solar thermal collectors are based on the report “Potential for Building Integrated Photovoltaics” by the IEA Photovoltaic Power Systems Programme. This report shows in detail the availability of roof and facade areas for the installation of photovoltaic systems. The architectural suitability of roof and facade areas only considers southeast to southwest orientations, the limitations being due to construction, historical considerations, shading effects and the use of the available surfaces for other purposes.
5 The solar fraction is the share of the annual hot water and space heating demand that is covered by the solar thermal system.
Potential of Solar Thermal in Europe 54
Based on these considerations about 60% of the roof area and 20% of the facade area are architecturally suitable in Europe for solar technologies.
To determine the roof and facade area needed for the installation of solar thermal collectors it is assumed that 50% of the architecturally suitable area would be available for solar thermal collectors. Under this assumption, the remainder 50% of the suitable area would be available for other solar technologies such as photovoltaics.
5.3 ScenariosThe model for the determination of the solar thermal potential for the years 2020, 2030 and 2050 is based on the following three scenarios.
5.3.1 Business as Usual (BAU)
� No reduction of the heating and cooling demand compared with 2006. � Moderate political support mechanisms: Except for a few countries at the forefront no
solar obligations for new residential buildings; subsidies (10-30% of the system cost) for residential buildings and moderate energy prices of fossil energy.
� Low R&D rate and therefore no solution for high energy density heat stores or new collector materials; no sufficient and cost competitive solutions for solar thermal cooling.
� Main focus on solar thermal systems for hot water preparation (solar fractions 50 - 70%) in the residential sector; solar combisystems with low solar fraction (10-20%); marginal market diffusion in all other sectors.
� Low growth rates of installed capacity (7-10% per annum until 2020).
5.3.2 Advanced Market Deployment (AMD)
� Moderate reduction of the heating demand compared with 2006 (depending on the country but on average: -5% by 2020, -10% by 2030 and -20% by 2050).
� Political support mechanisms: Solar obligations for all new residential buildings; subsidies for existing residential, service and commercial buildings as well as for industrial applications (subsidies: 10 - 30% of the system cost) or constantly moderate rising energy prices of fossil energy.
� Medium R&D rate and therefore solutions for high energy density heat stores and new collector materials; sufficient and cost competitive solutions for solar thermal cooling by the year 2020.
� Main focus on solar combisystems for hot water preparation and space heating in the residential sector; solar combisystems with low solar fraction (10-20%) until 2020 and medium solar fraction (20-50%) from 2020; moderate market diffusion in all other sectors.
� Medium growth rate of installed capacity (10-15% per annum until 2020).
5.3.3 Full R&D and Policy Scenario (RDP)
� Significant reduction of the heat demand compared with 2006 (depending on the country but on average: -10% by 2020, -20% by 2030 and -30% by 2050).
� Full political support mechanisms: Solar obligations for all new and existing residential, service and commercial buildings as well as for low temperature industrial applications or high energy prices of fossil energy.
Potential of Solar Thermal in Europe 55
� High R&D rate and therefore solutions for cost efficient high energy density heat stores and new collector materials; sufficient and cost competitive solutions for solar thermal cooling available by 2020.
� Main focus on solar combisystems for hot water preparation and space heating in the residential sector; solar combisystems with low solar fraction (10-20%) until 2020 and high solar fraction (50-100%) from 2020; substantial market diffusion in all other sectors.
� High growth rate of installed capacity (~25% per annum until 2020).
Table 5-7: Abbreviations used in the following chapters
SFH……………………………………………… Single Family House
MFH…………………………………………….. Multi Family House
Industrial Heat - Low Temp………. Heat up to a temperature range of 250°C
BAU……………………………………………… Business as Usual Scenario
AMD……………………………………………. Advanced Market Deployment Scenario
RDP……………………………………………… Full R&D and Policy Scenario
GWth……………………………………………. Giga Watt thermal

Potential of Solar Thermal in Europe 56
6 Solar Thermal Potential in the Reference Countries
This chapter presents the solar thermal systems potential contributing to the overall final energy demand in the reference countries. The main focus is on the potential solar thermal contribution to the heating and cooling demand in the short, medium and long-term. Another important aspect presented in this chapter is the contribution of solar thermal to the national renewale energy goals in order to reach the “EU 20% Renewables Target”.
Due to the fact that heat accounts for 49% of the overall final energy demand of the European Union, the renewable heating sector will have to make a major contribution in order to reach the renewable energy target. Since just only three renewable sources (biomass, geothermal and solar) are available for providing heat, it is essential to show the potential and the areas of application for these renewable energy sources. Since geothermal sources are limited to only a few locations in Europe and shallow geothermal is considered as energy efficiency technology; biomass should also be used for transport fuels, electricity generation and medium to high temperature applications, it is apparent that solar thermal systems will need to provide a substantial share of the low temperature heat.
Taking also the exergy aspect into consideration, it is a must to use the geothermal and biomass sources mainly for the high exergetic applications while using solar thermal for the low temperature applications, such as space heating, hot water preparation, low temperature industrial heat, and air conditioning and cooling. This low temperature heat (<250°C) accounts for 70 - 75% of the overall heat demand in the European Union.
Based on data presented in chapter 3 and 4 and on methodology described in chapter 5 the potential of solar thermal contribution to the overall final energy demand was determined for the reference countries.
Because of the different conditions in the reference countries the overall heating and cooling demand due to energy efficiency measures is under the full R&D and policy scenario between 3.4% and 11% by 2020; between 9% and 28% by 2030 and between 20% and 40% by 2050.
The wide range is explained by the fact that the potential for energy efficiency measures depends upon the thermal quality of the building stock. For example, Poland has a great potential for a reduction in the heating demand because few buildings are suitably insulated. In addition, Poland could increase the efficiency of the district heating networks. On the other hand, the relatively low overall reduction of the heating and cooling demand in Spain is explained by the fact that the reduction of the heat demand in the residential, service and industrial sectors is compensated to a certain extend by the expected increase of the energy demand for air conditioning and cooling.
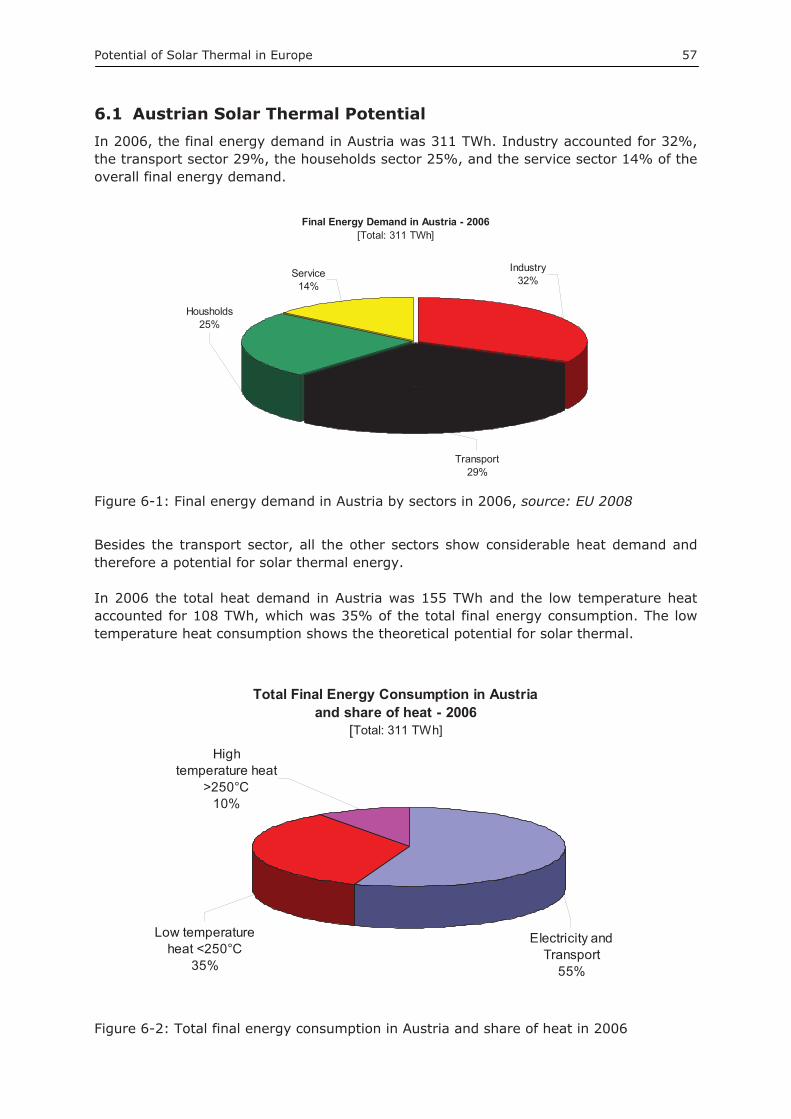
Potential of Solar Thermal in Europe 57
6.1 Austrian Solar Thermal Potential In 2006, the final energy demand in Austria was 311 TWh. Industry accounted for 32%, the transport sector 29%, the households sector 25%, and the service sector 14% of the overall final energy demand.
Final Energy Demand in Austria - 2006[Total: 311 TWh]
Service14%
Transport29%
Housholds25%
Industry32%
Figure 6-1: Final energy demand in Austria by sectors in 2006, source: EU 2008
Besides the transport sector, all the other sectors show considerable heat demand and therefore a potential for solar thermal energy.
In 2006 the total heat demand in Austria was 155 TWh and the low temperature heat accounted for 108 TWh, which was 35% of the total final energy consumption. The low temperature heat consumption shows the theoretical potential for solar thermal.
Total Final Energy Consumption in Austria and share of heat - 2006
[Total: 311 TWh]
High temperature heat
>250°C10%
Low temperature heat <250°C
35%
Electricity and Transport
55%
Figure 6-2: Total final energy consumption in Austria and share of heat in 2006
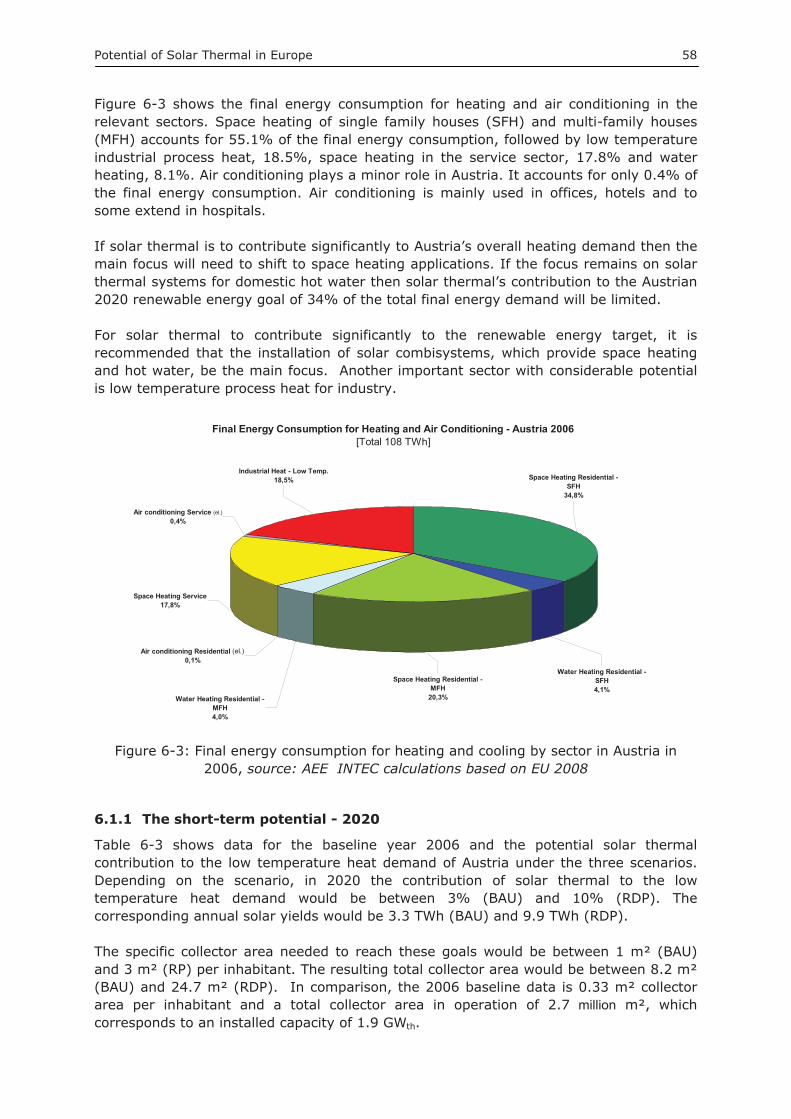
Potential of Solar Thermal in Europe 58
Figure 6-3 shows the final energy consumption for heating and air conditioning in the relevant sectors. Space heating of single family houses (SFH) and multi-family houses (MFH) accounts for 55.1% of the final energy consumption, followed by low temperature industrial process heat, 18.5%, space heating in the service sector, 17.8% and water heating, 8.1%. Air conditioning plays a minor role in Austria. It accounts for only 0.4% of the final energy consumption. Air conditioning is mainly used in offices, hotels and to some extend in hospitals.
If solar thermal is to contribute significantly to Austria’s overall heating demand then the main focus will need to shift to space heating applications. If the focus remains on solar thermal systems for domestic hot water then solar thermal’s contribution to the Austrian 2020 renewable energy goal of 34% of the total final energy demand will be limited.
For solar thermal to contribute significantly to the renewable energy target, it is recommended that the installation of solar combisystems, which provide space heating and hot water, be the main focus. Another important sector with considerable potential is low temperature process heat for industry.
Final Energy Consumption for Heating and Air Conditioning - Austria 2006 [Total 108 TWh]
Air conditioning Residential (el.)0,1%
Water Heating Residential - MFH4,0%
Space Heating Residential - MFH
20,3%
Space Heating Residential - SFH
34,8%
Water Heating Residential - SFH4,1%
Space Heating Service17,8%
Air conditioning Service (el.)0,4%
Industrial Heat - Low Temp.18,5%
Figure 6-3: Final energy consumption for heating and cooling by sector in Austria in 2006, source: AEE INTEC calculations based on EU 2008
6.1.1 The short-term potential - 2020
Table 6-3 shows data for the baseline year 2006 and the potential solar thermal contribution to the low temperature heat demand of Austria under the three scenarios. Depending on the scenario, in 2020 the contribution of solar thermal to the low temperature heat demand would be between 3% (BAU) and 10% (RDP). The corresponding annual solar yields would be 3.3 TWh (BAU) and 9.9 TWh (RDP).
The specific collector area needed to reach these goals would be between 1 m² (BAU) and 3 m² (RP) per inhabitant. The resulting total collector area would be between 8.2 m² (BAU) and 24.7 m² (RDP). In comparison, the 2006 baseline data is 0.33 m² collector area per inhabitant and a total collector area in operation of 2.7 million m², which corresponds to an installed capacity of 1.9 GWth.
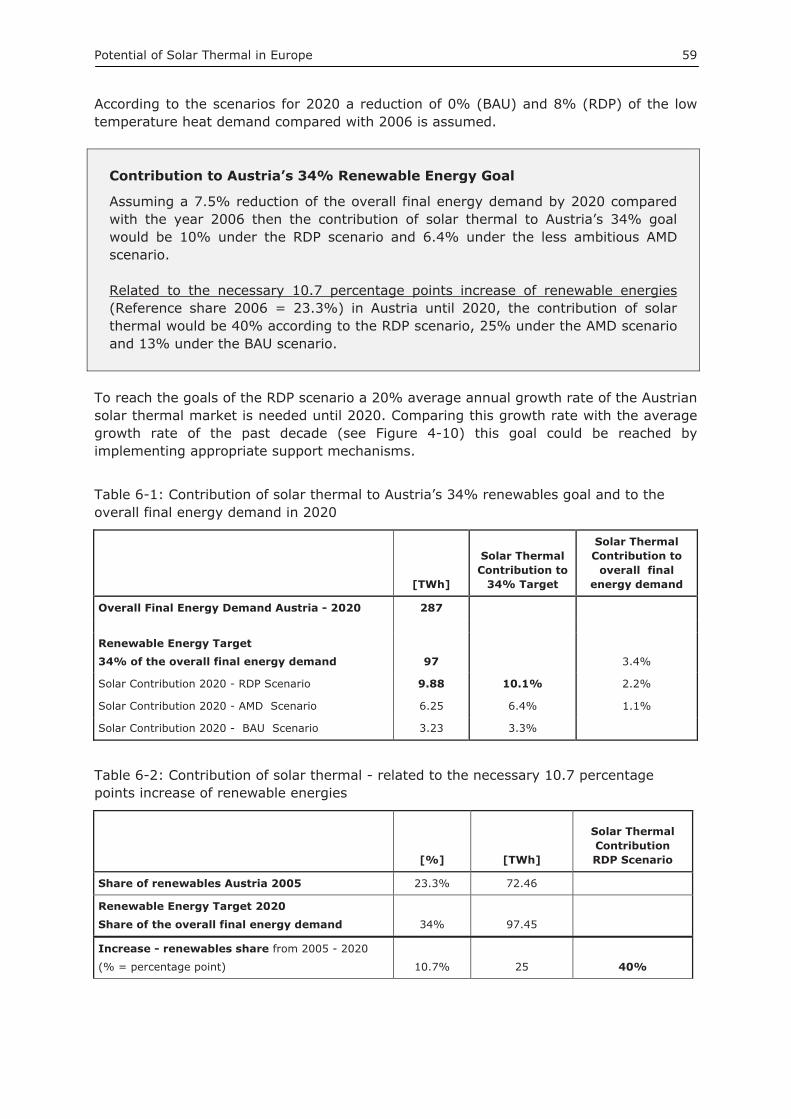
Potential of Solar Thermal in Europe 59
According to the scenarios for 2020 a reduction of 0% (BAU) and 8% (RDP) of the low temperature heat demand compared with 2006 is assumed.
Contribution to Austria’s 34% Renewable Energy Goal
Assuming a 7.5% reduction of the overall final energy demand by 2020 compared with the year 2006 then the contribution of solar thermal to Austria’s 34% goal would be 10% under the RDP scenario and 6.4% under the less ambitious AMD scenario.
Related to the necessary 10.7 percentage points increase of renewable energies(Reference share 2006 = 23.3%) in Austria until 2020, the contribution of solar thermal would be 40% according to the RDP scenario, 25% under the AMD scenario and 13% under the BAU scenario.
To reach the goals of the RDP scenario a 20% average annual growth rate of the Austrian solar thermal market is needed until 2020. Comparing this growth rate with the average growth rate of the past decade (see Figure 4-10) this goal could be reached by implementing appropriate support mechanisms.
Table 6-1: Contribution of solar thermal to Austria’s 34% renewables goal and to the overall final energy demand in 2020
[TWh]
Solar Thermal Contribution to
34% Target
Solar Thermal Contribution to
overall final energy demand
Overall Final Energy Demand Austria - 2020 287
Renewable Energy Target 34% of the overall final energy demand 97 3.4%
Solar Contribution 2020 - RDP Scenario 9.88 10.1% 2.2%
Solar Contribution 2020 - AMD Scenario 6.25 6.4% 1.1%
Solar Contribution 2020 - BAU Scenario 3.23 3.3%
Table 6-2: Contribution of solar thermal - related to the necessary 10.7 percentage points increase of renewable energies
[%] [TWh]
Solar Thermal Contribution RDP Scenario
Share of renewables Austria 2005 23.3% 72.46
Renewable Energy Target 2020
Share of the overall final energy demand 34% 97.45
Increase - renewables share from 2005 - 2020
(% = percentage point) 10.7% 25 40%
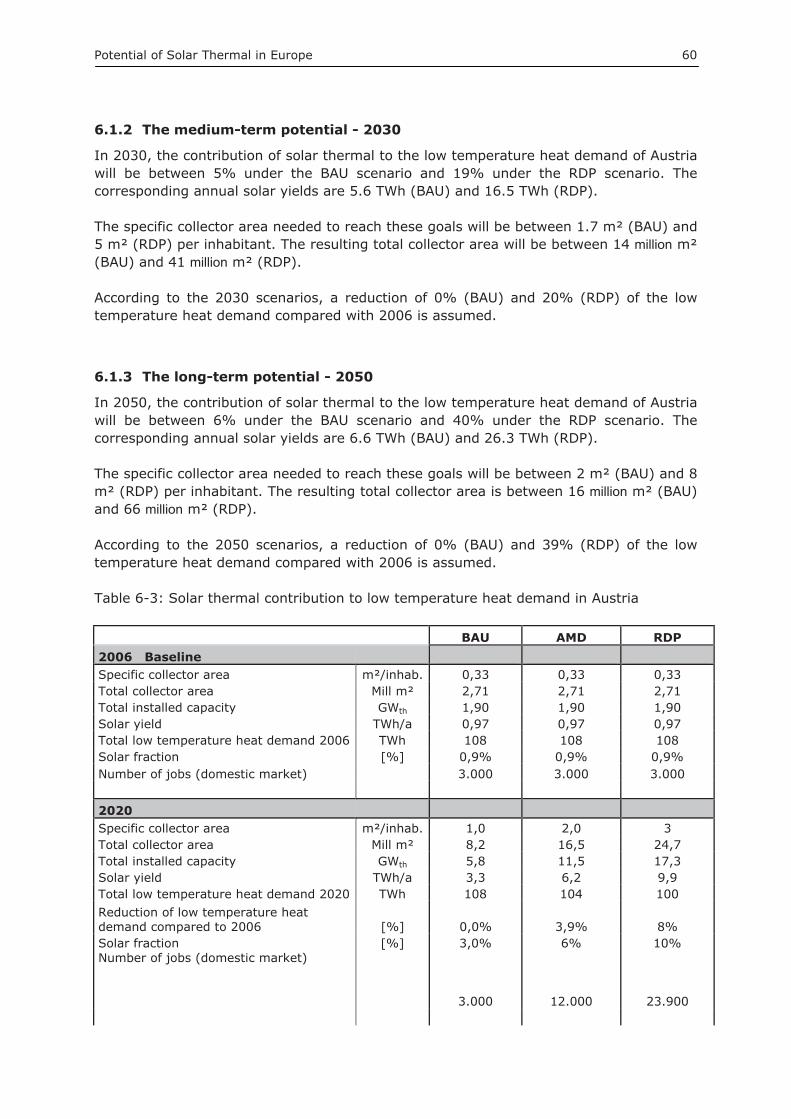
Potential of Solar Thermal in Europe 60
6.1.2 The medium-term potential - 2030
In 2030, the contribution of solar thermal to the low temperature heat demand of Austria will be between 5% under the BAU scenario and 19% under the RDP scenario. The corresponding annual solar yields are 5.6 TWh (BAU) and 16.5 TWh (RDP).
The specific collector area needed to reach these goals will be between 1.7 m² (BAU) and 5 m² (RDP) per inhabitant. The resulting total collector area will be between 14 million m² (BAU) and 41 million m² (RDP).
According to the 2030 scenarios, a reduction of 0% (BAU) and 20% (RDP) of the low temperature heat demand compared with 2006 is assumed.
6.1.3 The long-term potential - 2050
In 2050, the contribution of solar thermal to the low temperature heat demand of Austria will be between 6% under the BAU scenario and 40% under the RDP scenario. The corresponding annual solar yields are 6.6 TWh (BAU) and 26.3 TWh (RDP).
The specific collector area needed to reach these goals will be between 2 m² (BAU) and 8 m² (RDP) per inhabitant. The resulting total collector area is between 16 million m² (BAU) and 66 million m² (RDP).
According to the 2050 scenarios, a reduction of 0% (BAU) and 39% (RDP) of the low temperature heat demand compared with 2006 is assumed.
Table 6-3: Solar thermal contribution to low temperature heat demand in Austria
BAU AMD RDP 2006 Baseline Specific collector area m²/inhab. 0,33 0,33 0,33 Total collector area Mill m² 2,71 2,71 2,71 Total installed capacity GWth 1,90 1,90 1,90 Solar yield TWh/a 0,97 0,97 0,97 Total low temperature heat demand 2006 TWh 108 108 108 Solar fraction [%] 0,9% 0,9% 0,9% Number of jobs (domestic market) 3.000 3.000 3.000 2020 Specific collector area m²/inhab. 1,0 2,0 3 Total collector area Mill m² 8,2 16,5 24,7 Total installed capacity GWth 5,8 11,5 17,3 Solar yield TWh/a 3,3 6,2 9,9 Total low temperature heat demand 2020 TWh 108 104 100 Reduction of low temperature heat demand compared to 2006 [%] 0,0% 3,9% 8% Solar fraction [%] 3,0% 6% 10% Number of jobs (domestic market)
3.000 12.000 23.900
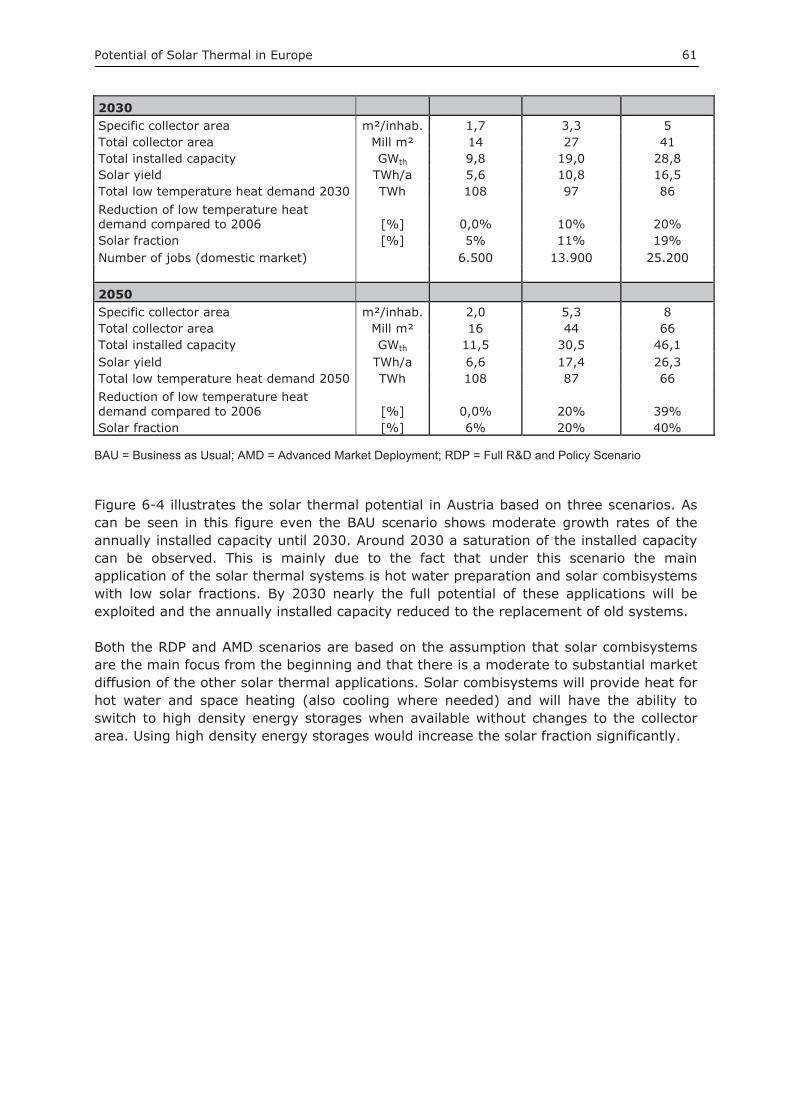
Potential of Solar Thermal in Europe 61
2030 Specific collector area m²/inhab. 1,7 3,3 5 Total collector area Mill m² 14 27 41 Total installed capacity GWth 9,8 19,0 28,8 Solar yield TWh/a 5,6 10,8 16,5 Total low temperature heat demand 2030 TWh 108 97 86 Reduction of low temperature heat demand compared to 2006 [%] 0,0% 10% 20% Solar fraction [%] 5% 11% 19% Number of jobs (domestic market) 6.500 13.900 25.200 2050 Specific collector area m²/inhab. 2,0 5,3 8 Total collector area Mill m² 16 44 66 Total installed capacity GWth 11,5 30,5 46,1 Solar yield TWh/a 6,6 17,4 26,3 Total low temperature heat demand 2050 TWh 108 87 66 Reduction of low temperature heat demand compared to 2006 [%] 0,0% 20% 39% Solar fraction [%] 6% 20% 40%
BAU = Business as Usual; AMD = Advanced Market Deployment; RDP = Full R&D and Policy Scenario
Figure 6-4 illustrates the solar thermal potential in Austria based on three scenarios. As can be seen in this figure even the BAU scenario shows moderate growth rates of the annually installed capacity until 2030. Around 2030 a saturation of the installed capacity can be observed. This is mainly due to the fact that under this scenario the main application of the solar thermal systems is hot water preparation and solar combisystems with low solar fractions. By 2030 nearly the full potential of these applications will be exploited and the annually installed capacity reduced to the replacement of old systems.
Both the RDP and AMD scenarios are based on the assumption that solar combisystems are the main focus from the beginning and that there is a moderate to substantial market diffusion of the other solar thermal applications. Solar combisystems will provide heat for hot water and space heating (also cooling where needed) and will have the ability to switch to high density energy storages when available without changes to the collector area. Using high density energy storages would increase the solar fraction significantly.
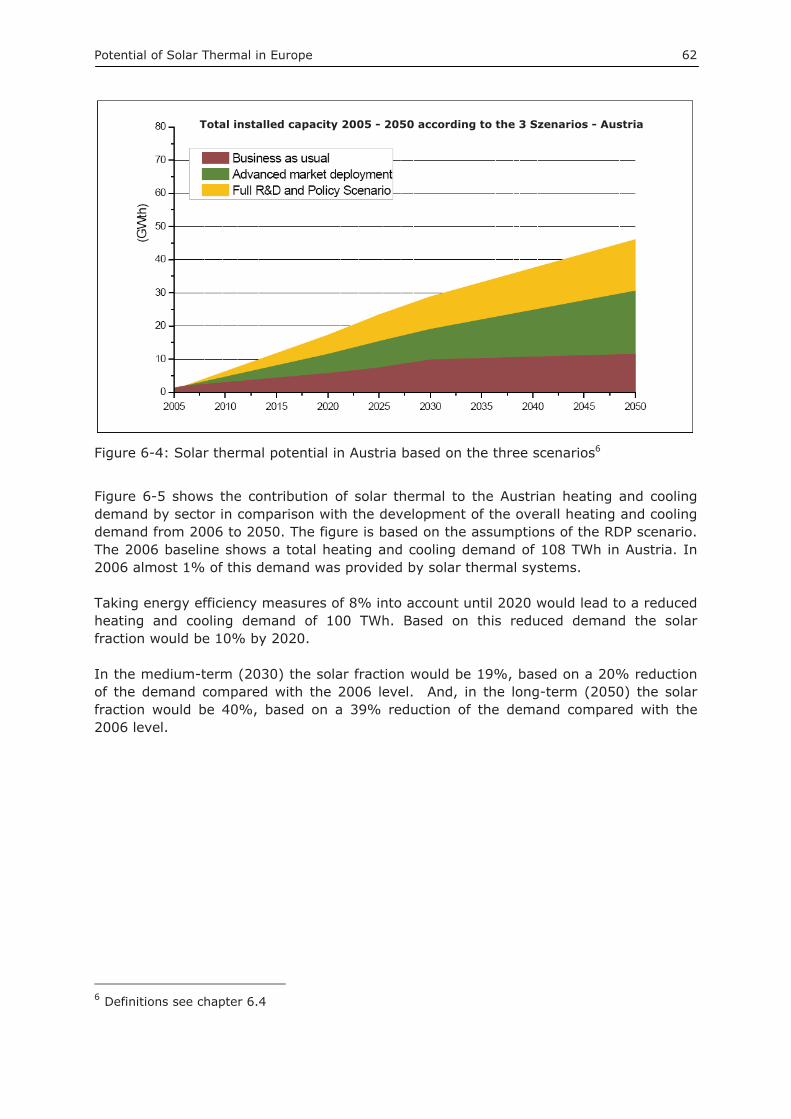
Potential of Solar Thermal in Europe 62
Figure 6-4: Solar thermal potential in Austria based on the three scenarios6
Figure 6-5 shows the contribution of solar thermal to the Austrian heating and cooling demand by sector in comparison with the development of the overall heating and cooling demand from 2006 to 2050. The figure is based on the assumptions of the RDP scenario. The 2006 baseline shows a total heating and cooling demand of 108 TWh in Austria. In 2006 almost 1% of this demand was provided by solar thermal systems.
Taking energy efficiency measures of 8% into account until 2020 would lead to a reduced heating and cooling demand of 100 TWh. Based on this reduced demand the solar fraction would be 10% by 2020.
In the medium-term (2030) the solar fraction would be 19%, based on a 20% reduction of the demand compared with the 2006 level. And, in the long-term (2050) the solar fraction would be 40%, based on a 39% reduction of the demand compared with the 2006 level.
6 Definitions see chapter 6.4
Total installed capacity 2005 - 2050 according to the 3 Szenarios - Austria
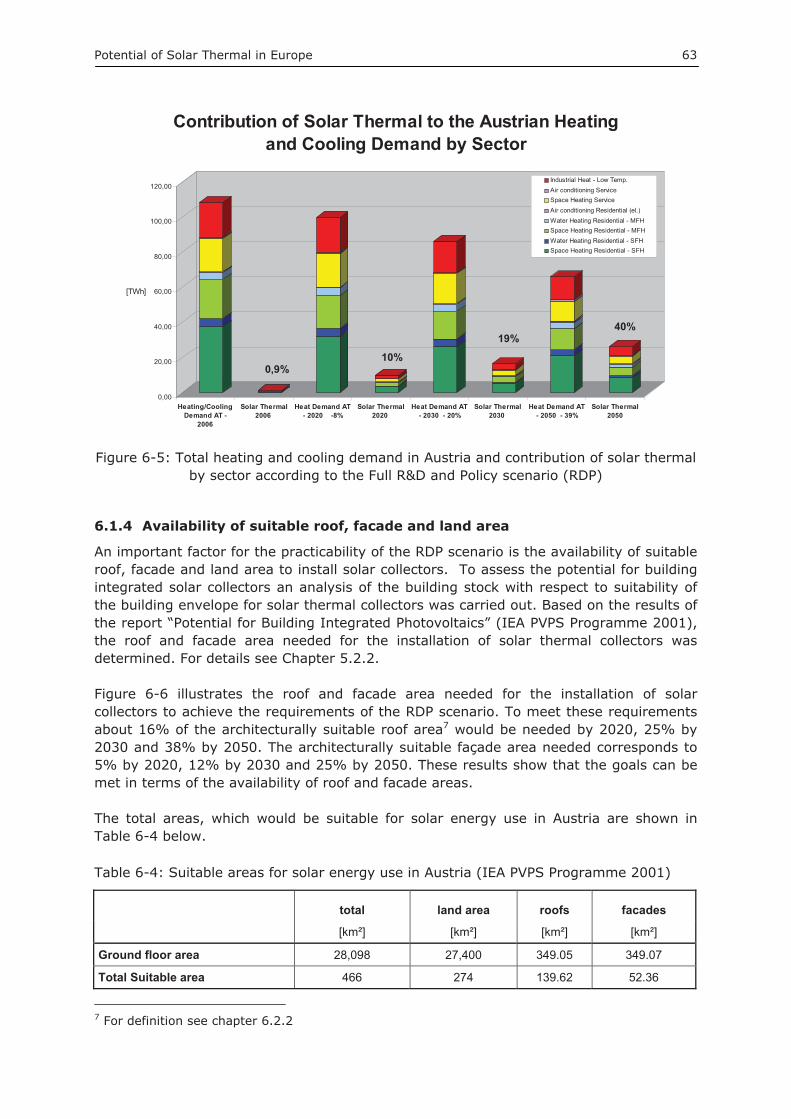
Potential of Solar Thermal in Europe 63
0,00
20,00
40,00
60,00
80,00
100,00
120,00
[TWh]
Heating/CoolingDemand AT -
2006
Solar Thermal2006
Heat Demand AT- 2020 -8%
Solar Thermal2020
Heat Demand AT- 2030 - 20%
Solar Thermal2030
Heat Demand AT- 2050 - 39%
Solar Thermal2050
Contribution of Solar Thermal to the Austrian Heating and Cooling Demand by Sector
Industrial Heat - Low Temp.Air conditioning ServiceSpace Heating ServiceAir conditioning Residential (el.)Water Heating Residential - MFHSpace Heating Residential - MFHWater Heating Residential - SFHSpace Heating Residential - SFH
Figure 6-5: Total heating and cooling demand in Austria and contribution of solar thermal by sector according to the Full R&D and Policy scenario (RDP)
6.1.4 Availability of suitable roof, facade and land area
An important factor for the practicability of the RDP scenario is the availability of suitable roof, facade and land area to install solar collectors. To assess the potential for building integrated solar collectors an analysis of the building stock with respect to suitability of the building envelope for solar thermal collectors was carried out. Based on the results of the report “Potential for Building Integrated Photovoltaics” (IEA PVPS Programme 2001), the roof and facade area needed for the installation of solar thermal collectors was determined. For details see Chapter 5.2.2.
Figure 6-6 illustrates the roof and facade area needed for the installation of solar collectors to achieve the requirements of the RDP scenario. To meet these requirements about 16% of the architecturally suitable roof area7 would be needed by 2020, 25% by 2030 and 38% by 2050. The architecturally suitable façade area needed corresponds to 5% by 2020, 12% by 2030 and 25% by 2050. These results show that the goals can be met in terms of the availability of roof and facade areas.
The total areas, which would be suitable for solar energy use in Austria are shown in Table 6-4 below.
Table 6-4: Suitable areas for solar energy use in Austria (IEA PVPS Programme 2001)
total land area roofs facades
[km²] [km²] [km²] [km²]
Ground floor area 28,098 27,400 349.05 349.07
Total Suitable area 466 274 139.62 52.36
7 For definition see chapter 6.2.2
10%
19% 40%
0,9%
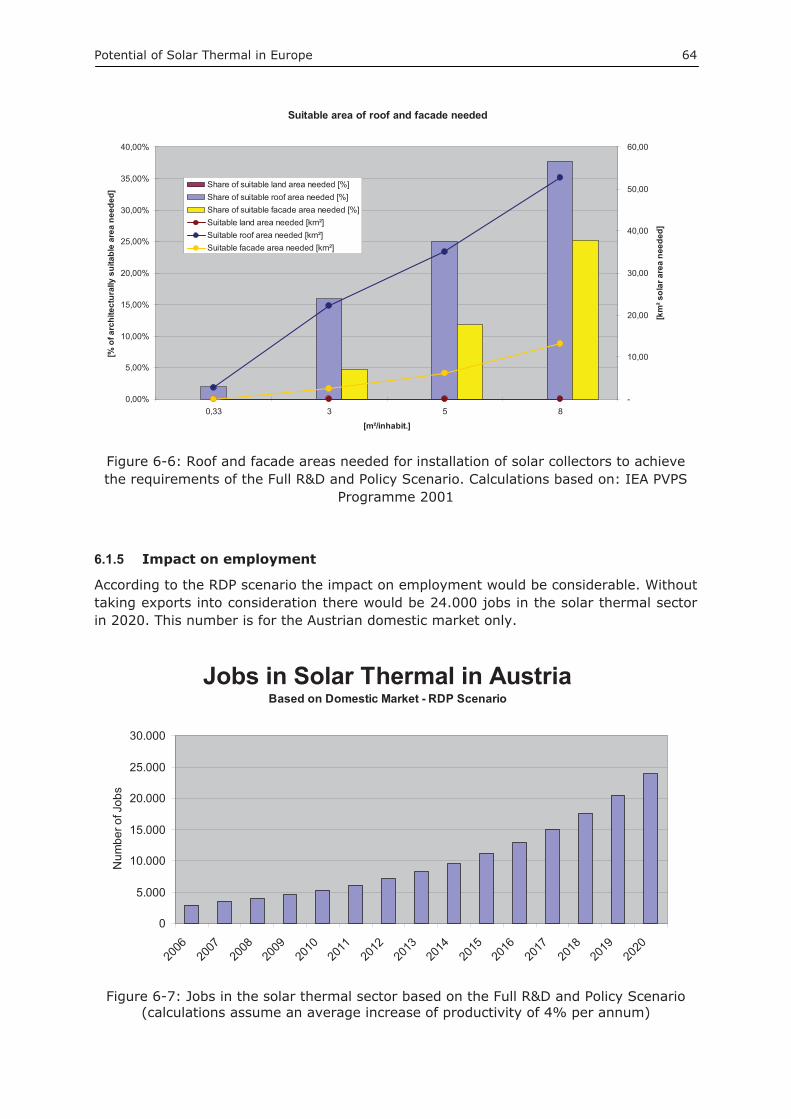
Potential of Solar Thermal in Europe 64
Suitable area of roof and facade needed
0,00%
5,00%
10,00%
15,00%
20,00%
25,00%
30,00%
35,00%
40,00%
0,33 3 5 8
[m²/inhabit.]
[% o
f arc
hite
ctur
ally
sui
tabl
e ar
ea n
eede
d]
-
10,00
20,00
30,00
40,00
50,00
60,00
[km
² sol
ar a
rea
need
ed]
Share of suitable land area needed [%]Share of suitable roof area needed [%]Share of suitable facade area needed [%]Suitable land area needed [km²]Suitable roof area needed [km²]Suitable facade area needed [km²]
Figure 6-6: Roof and facade areas needed for installation of solar collectors to achieve the requirements of the Full R&D and Policy Scenario. Calculations based on: IEA PVPS
Programme 2001
6.1.5 Impact on employment
According to the RDP scenario the impact on employment would be considerable. Without taking exports into consideration there would be 24.000 jobs in the solar thermal sector in 2020. This number is for the Austrian domestic market only.
Jobs in Solar Thermal in AustriaBased on Domestic Market - RDP Scenario
0
5.000
10.000
15.000
20.000
25.000
30.000
2006
2007
2008
2009
2010
2011
2012
2013
2014
2015
2016
2017
2018
2019
2020
Num
ber o
f Job
s
Figure 6-7: Jobs in the solar thermal sector based on the Full R&D and Policy Scenario (calculations assume an average increase of productivity of 4% per annum)
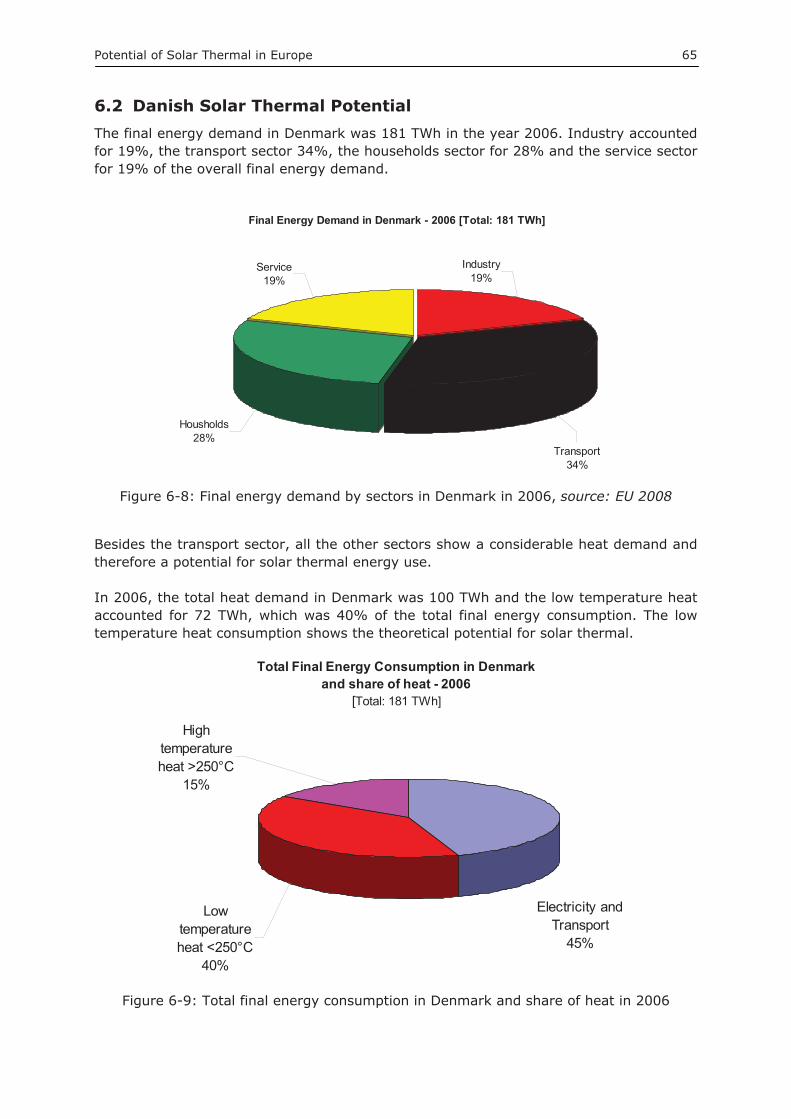
Potential of Solar Thermal in Europe 65
6.2 Danish Solar Thermal Potential The final energy demand in Denmark was 181 TWh in the year 2006. Industry accounted for 19%, the transport sector 34%, the households sector for 28% and the service sector for 19% of the overall final energy demand.
Final Energy Demand in Denmark - 2006 [Total: 181 TWh]
Service19%
Transport34%
Housholds28%
Industry19%
Figure 6-8: Final energy demand by sectors in Denmark in 2006, source: EU 2008
Besides the transport sector, all the other sectors show a considerable heat demand and therefore a potential for solar thermal energy use.
In 2006, the total heat demand in Denmark was 100 TWh and the low temperature heat accounted for 72 TWh, which was 40% of the total final energy consumption. The low temperature heat consumption shows the theoretical potential for solar thermal.
Total Final Energy Consumption in Denmark and share of heat - 2006
[Total: 181 TWh]
High temperature heat >250°C
15%
Low temperature heat <250°C
40%
Electricity and Transport
45%
Figure 6-9: Total final energy consumption in Denmark and share of heat in 2006
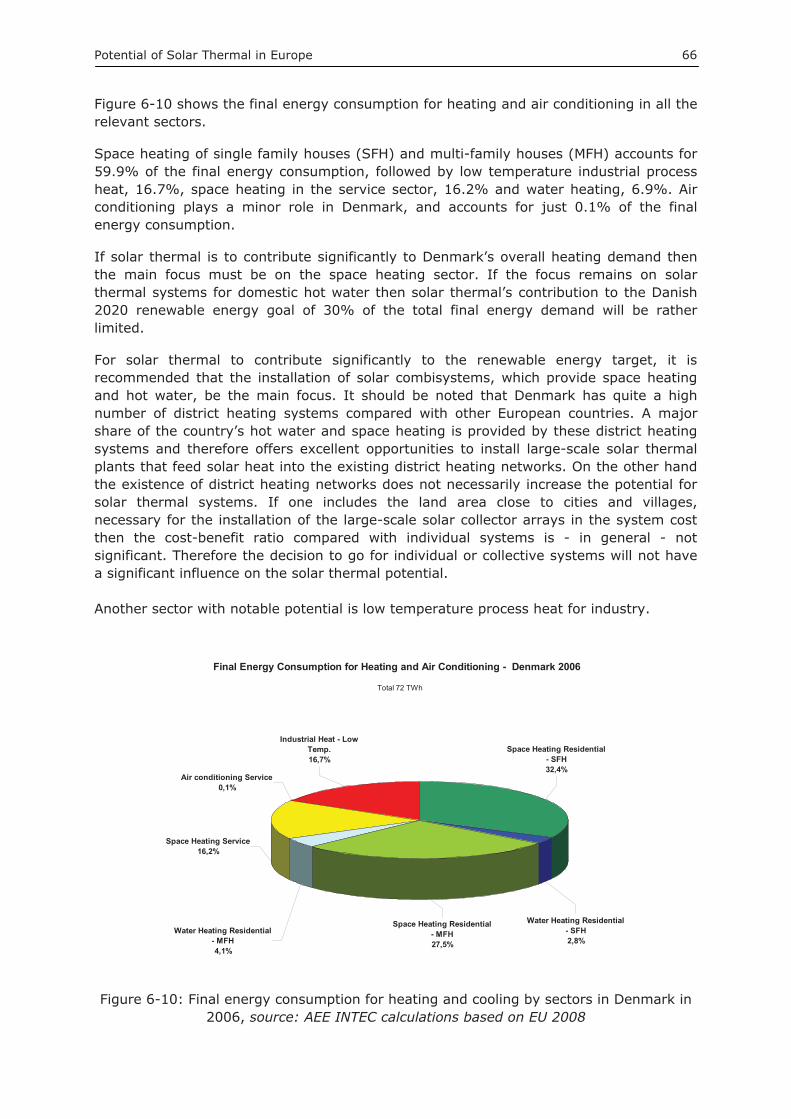
Potential of Solar Thermal in Europe 66
Figure 6-10 shows the final energy consumption for heating and air conditioning in all the relevant sectors.
Space heating of single family houses (SFH) and multi-family houses (MFH) accounts for 59.9% of the final energy consumption, followed by low temperature industrial process heat, 16.7%, space heating in the service sector, 16.2% and water heating, 6.9%. Air conditioning plays a minor role in Denmark, and accounts for just 0.1% of the final energy consumption.
If solar thermal is to contribute significantly to Denmark’s overall heating demand then the main focus must be on the space heating sector. If the focus remains on solar thermal systems for domestic hot water then solar thermal’s contribution to the Danish 2020 renewable energy goal of 30% of the total final energy demand will be rather limited.
For solar thermal to contribute significantly to the renewable energy target, it is recommended that the installation of solar combisystems, which provide space heating and hot water, be the main focus. It should be noted that Denmark has quite a high number of district heating systems compared with other European countries. A major share of the country’s hot water and space heating is provided by these district heating systems and therefore offers excellent opportunities to install large-scale solar thermal plants that feed solar heat into the existing district heating networks. On the other hand the existence of district heating networks does not necessarily increase the potential for solar thermal systems. If one includes the land area close to cities and villages, necessary for the installation of the large-scale solar collector arrays in the system cost then the cost-benefit ratio compared with individual systems is - in general - not significant. Therefore the decision to go for individual or collective systems will not have a significant influence on the solar thermal potential.
Another sector with notable potential is low temperature process heat for industry.
Final Energy Consumption for Heating and Air Conditioning - Denmark 2006
Water Heating Residential - MFH4,1%
Space Heating Residential - MFH27,5%
Space Heating Residential - SFH32,4%
Water Heating Residential - SFH2,8%
Space Heating Service16,2%
Air conditioning Service0,1%
Industrial Heat - Low Temp.16,7%
Total 72 TWh
Figure 6-10: Final energy consumption for heating and cooling by sectors in Denmark in 2006, source: AEE INTEC calculations based on EU 2008
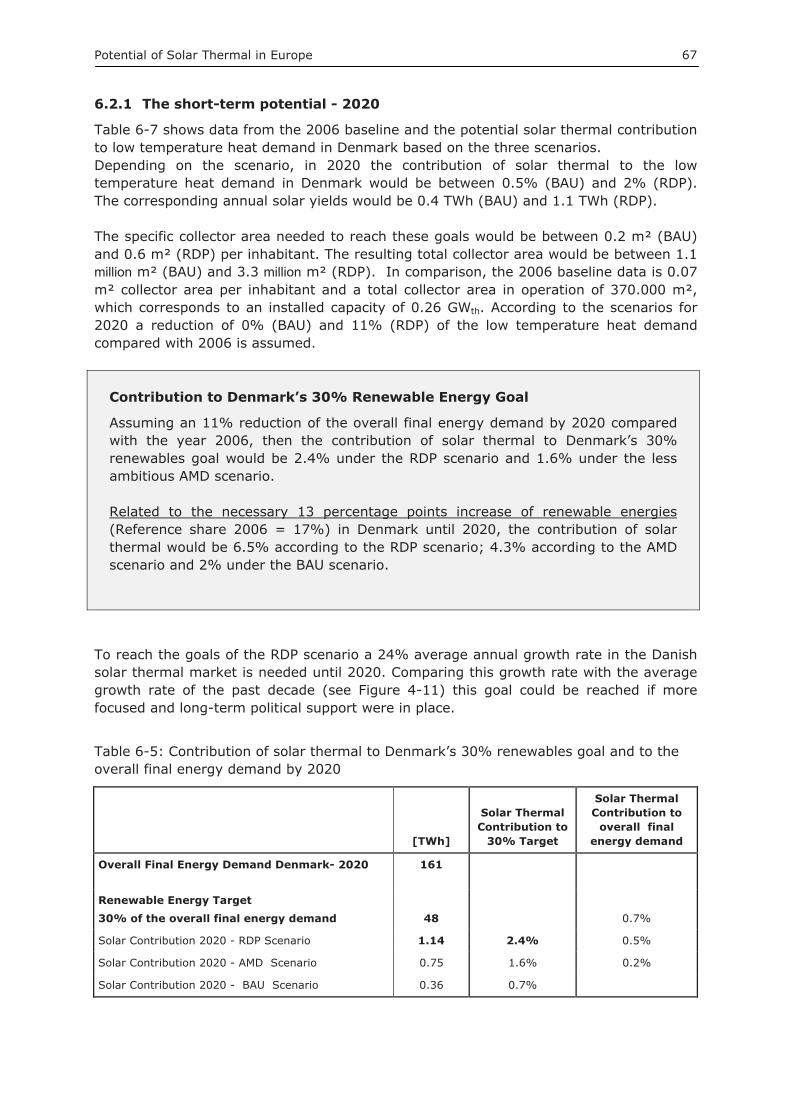
Potential of Solar Thermal in Europe 67
6.2.1 The short-term potential - 2020
Table 6-7 shows data from the 2006 baseline and the potential solar thermal contribution to low temperature heat demand in Denmark based on the three scenarios. Depending on the scenario, in 2020 the contribution of solar thermal to the low temperature heat demand in Denmark would be between 0.5% (BAU) and 2% (RDP). The corresponding annual solar yields would be 0.4 TWh (BAU) and 1.1 TWh (RDP).
The specific collector area needed to reach these goals would be between 0.2 m² (BAU) and 0.6 m² (RDP) per inhabitant. The resulting total collector area would be between 1.1 million m² (BAU) and 3.3 million m² (RDP). In comparison, the 2006 baseline data is 0.07 m² collector area per inhabitant and a total collector area in operation of 370.000 m², which corresponds to an installed capacity of 0.26 GWth. According to the scenarios for 2020 a reduction of 0% (BAU) and 11% (RDP) of the low temperature heat demand compared with 2006 is assumed.
Contribution to Denmark’s 30% Renewable Energy Goal
Assuming an 11% reduction of the overall final energy demand by 2020 compared with the year 2006, then the contribution of solar thermal to Denmark’s 30% renewables goal would be 2.4% under the RDP scenario and 1.6% under the less ambitious AMD scenario.
Related to the necessary 13 percentage points increase of renewable energies(Reference share 2006 = 17%) in Denmark until 2020, the contribution of solar thermal would be 6.5% according to the RDP scenario; 4.3% according to the AMD scenario and 2% under the BAU scenario.
To reach the goals of the RDP scenario a 24% average annual growth rate in the Danish solar thermal market is needed until 2020. Comparing this growth rate with the average growth rate of the past decade (see Figure 4-11) this goal could be reached if more focused and long-term political support were in place.
Table 6-5: Contribution of solar thermal to Denmark’s 30% renewables goal and to the overall final energy demand by 2020
[TWh]
Solar Thermal Contribution to
30% Target
Solar Thermal Contribution to
overall final energy demand
Overall Final Energy Demand Denmark- 2020 161
Renewable Energy Target 30% of the overall final energy demand 48 0.7%
Solar Contribution 2020 - RDP Scenario 1.14 2.4% 0.5%
Solar Contribution 2020 - AMD Scenario 0.75 1.6% 0.2%
Solar Contribution 2020 - BAU Scenario 0.36 0.7%

Potential of Solar Thermal in Europe 68
Table 6-6: Contribution of solar thermal - related to the necessary 13 percentage points increase of renewable energies
[%] [TWh]
Solar Thermal Contribution RDP Scenario
Share of renewables Denmark 2005 17% 30.77
Renewable Energy Target 2020 Share of the overall final energy demand 30% 48.20
Increase - renewables share from 2005 - 2020
(% = percentage points) 13% 17.4 6.5%
6.2.2 The medium-term potential - 2030
In 2030, the contribution of solar thermal to the low temperature heat demand in Denmark will be between 2% under the BAU scenario and 9% under the RDP scenario. The corresponding annual solar yields are 1.5 TWh (BAU) and 4.8 TWh (RDP).
The specific collector area needed to reach these goals will be between 0.8 m² (BAU) and 2.5 million m² (RDP) per inhabitant. The resulting total collector area will be between 4.5 million m² (BAU) and 13.6 million m² (RDP).
According to the 2030 scenarios a reduction of 0% (BAU) and 25% (RDP) of the low temperature heat demand compared to 2006 is assumed.
6.2.3 The long-term potential - 2050
In 2050, the contribution of solar thermal to the low temperature heat demand of Denmark will be between 5% under the BAU scenario and 32% under the RDP scenario. The corresponding annual solar yields are 3.8 TWh (BAU) and 15.2 TWh (RDP).
The specific collector area needed to reach these goals will be between 2 m² (BAU) and 8 m² (RDP) per inhabitant. The resulting total collector area is between 10.9 million m² (BAU) and 43.4 million m² (RDP).
According to the 2050 scenarios, a reduction of 0% (BAU) and 35% (RDP) of the low temperature heat demand compared with 2006 is assumed.
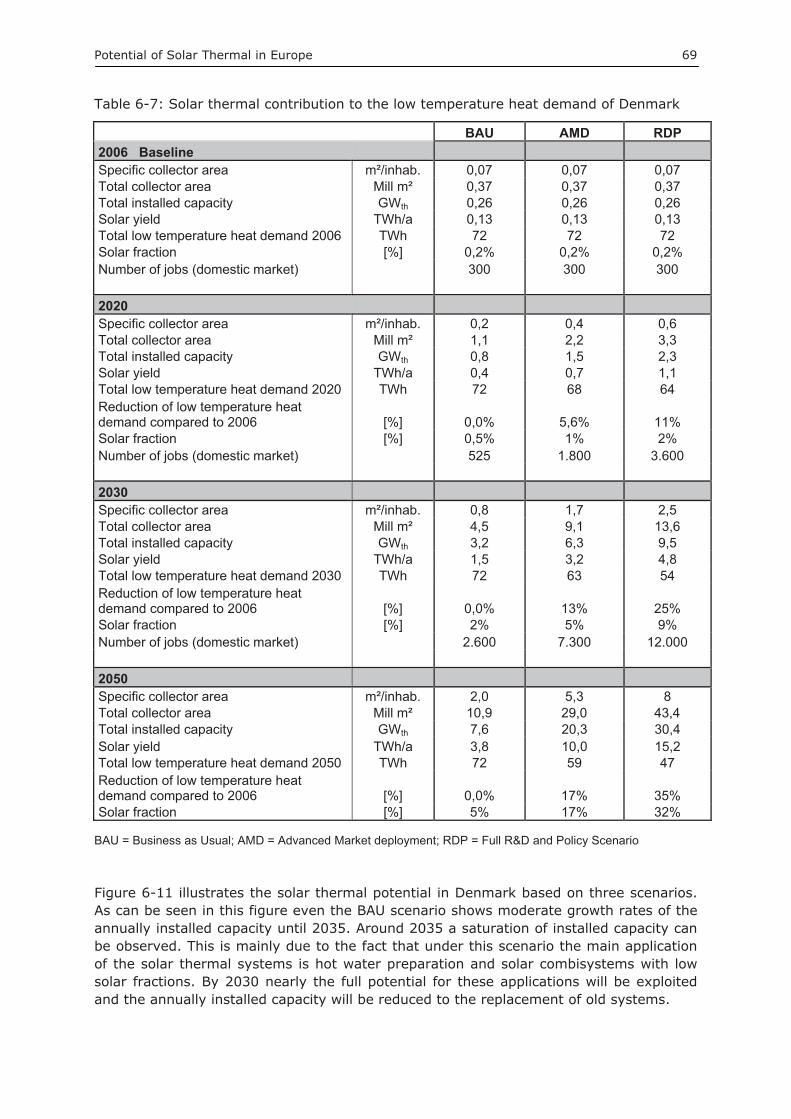
Potential of Solar Thermal in Europe 69
Table 6-7: Solar thermal contribution to the low temperature heat demand of Denmark
BAU AMD RDP 2006 Baseline Specific collector area m²/inhab. 0,07 0,07 0,07 Total collector area Mill m² 0,37 0,37 0,37 Total installed capacity GWth 0,26 0,26 0,26 Solar yield TWh/a 0,13 0,13 0,13 Total low temperature heat demand 2006 TWh 72 72 72 Solar fraction [%] 0,2% 0,2% 0,2% Number of jobs (domestic market) 300 300 300 2020 Specific collector area m²/inhab. 0,2 0,4 0,6 Total collector area Mill m² 1,1 2,2 3,3 Total installed capacity GWth 0,8 1,5 2,3 Solar yield TWh/a 0,4 0,7 1,1 Total low temperature heat demand 2020 TWh 72 68 64 Reduction of low temperature heat demand compared to 2006 [%] 0,0% 5,6% 11% Solar fraction [%] 0,5% 1% 2% Number of jobs (domestic market) 525 1.800 3.600 2030 Specific collector area m²/inhab. 0,8 1,7 2,5 Total collector area Mill m² 4,5 9,1 13,6 Total installed capacity GWth 3,2 6,3 9,5 Solar yield TWh/a 1,5 3,2 4,8 Total low temperature heat demand 2030 TWh 72 63 54 Reduction of low temperature heat demand compared to 2006 [%] 0,0% 13% 25% Solar fraction [%] 2% 5% 9% Number of jobs (domestic market) 2.600 7.300 12.000 2050 Specific collector area m²/inhab. 2,0 5,3 8 Total collector area Mill m² 10,9 29,0 43,4 Total installed capacity GWth 7,6 20,3 30,4 Solar yield TWh/a 3,8 10,0 15,2 Total low temperature heat demand 2050 TWh 72 59 47 Reduction of low temperature heat demand compared to 2006 [%] 0,0% 17% 35% Solar fraction [%] 5% 17% 32%
BAU = Business as Usual; AMD = Advanced Market deployment; RDP = Full R&D and Policy Scenario
Figure 6-11 illustrates the solar thermal potential in Denmark based on three scenarios. As can be seen in this figure even the BAU scenario shows moderate growth rates of the annually installed capacity until 2035. Around 2035 a saturation of installed capacity can be observed. This is mainly due to the fact that under this scenario the main application of the solar thermal systems is hot water preparation and solar combisystems with low solar fractions. By 2030 nearly the full potential for these applications will be exploited and the annually installed capacity will be reduced to the replacement of old systems.
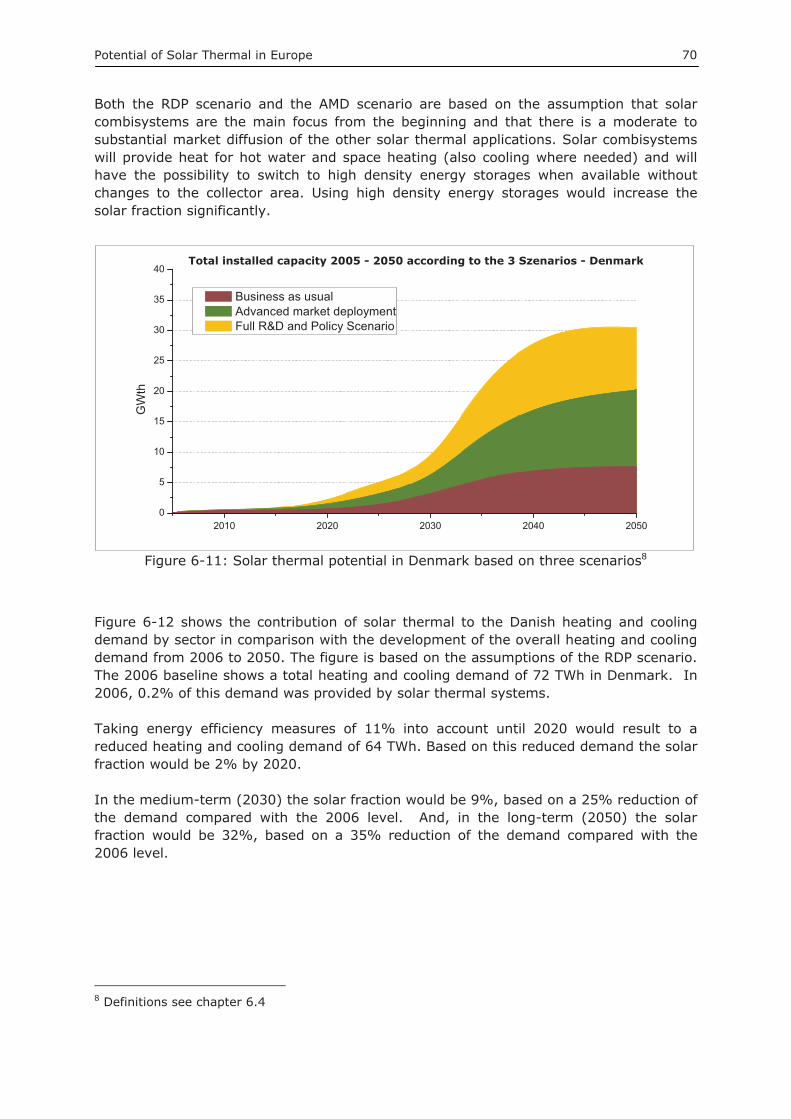
Potential of Solar Thermal in Europe 70
Both the RDP scenario and the AMD scenario are based on the assumption that solar combisystems are the main focus from the beginning and that there is a moderate to substantial market diffusion of the other solar thermal applications. Solar combisystems will provide heat for hot water and space heating (also cooling where needed) and will have the possibility to switch to high density energy storages when available without changes to the collector area. Using high density energy storages would increase the solar fraction significantly.
2010 2020 2030 2040 20500
5
10
15
20
25
30
35
40 Market Development 2005 - 2050 according to 3 Szenarios - Denmark
GW
th
Business as usual Advanced market deployment Full R&D and Policy Scenario
Figure 6-11: Solar thermal potential in Denmark based on three scenarios8
Figure 6-12 shows the contribution of solar thermal to the Danish heating and cooling demand by sector in comparison with the development of the overall heating and cooling demand from 2006 to 2050. The figure is based on the assumptions of the RDP scenario. The 2006 baseline shows a total heating and cooling demand of 72 TWh in Denmark. In 2006, 0.2% of this demand was provided by solar thermal systems.
Taking energy efficiency measures of 11% into account until 2020 would result to a reduced heating and cooling demand of 64 TWh. Based on this reduced demand the solar fraction would be 2% by 2020.
In the medium-term (2030) the solar fraction would be 9%, based on a 25% reduction of the demand compared with the 2006 level. And, in the long-term (2050) the solar fraction would be 32%, based on a 35% reduction of the demand compared with the 2006 level.
8 Definitions see chapter 6.4
Total installed capacity 2005 - 2050 according to the 3 Szenarios - Denmark
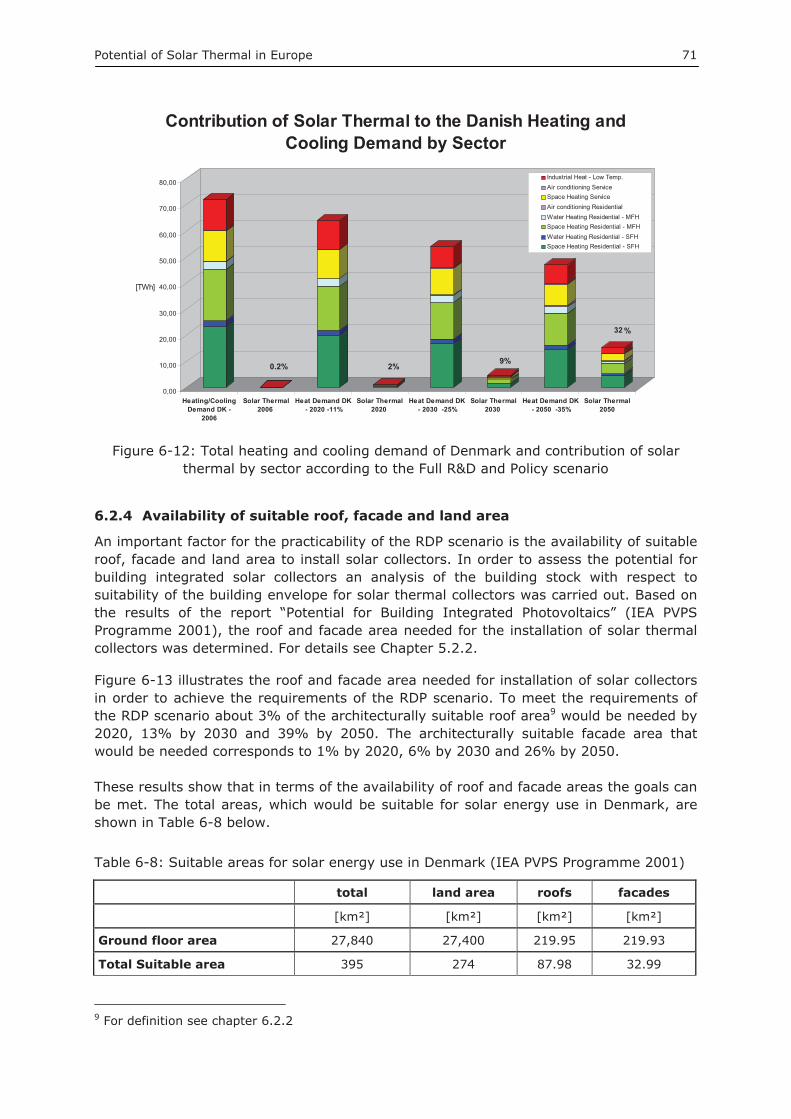
Potential of Solar Thermal in Europe 71
0,00
10,00
20,00
30,00
40,00
50,00
60,00
70,00
80,00
[TWh]
Heating/CoolingDemand DK -
2006
Solar Thermal2006
Heat Demand DK- 2020 -11%
Solar Thermal2020
Heat Demand DK- 2030 -25%
Solar Thermal2030
Heat Demand DK- 2050 -35%
Solar Thermal2050
Contribution of Solar Thermal to the Danish Heating and Cooling Demand by Sector
Industrial Heat - Low Temp.Air conditioning ServiceSpace Heating ServiceAir conditioning ResidentialWater Heating Residential - MFHSpace Heating Residential - MFHWater Heating Residential - SFHSpace Heating Residential - SFH
32
Figure 6-12: Total heating and cooling demand of Denmark and contribution of solar thermal by sector according to the Full R&D and Policy scenario
6.2.4 Availability of suitable roof, facade and land area
An important factor for the practicability of the RDP scenario is the availability of suitable roof, facade and land area to install solar collectors. In order to assess the potential for building integrated solar collectors an analysis of the building stock with respect to suitability of the building envelope for solar thermal collectors was carried out. Based on the results of the report “Potential for Building Integrated Photovoltaics” (IEA PVPS Programme 2001), the roof and facade area needed for the installation of solar thermal collectors was determined. For details see Chapter 5.2.2.
Figure 6-13 illustrates the roof and facade area needed for installation of solar collectors in order to achieve the requirements of the RDP scenario. To meet the requirements of the RDP scenario about 3% of the architecturally suitable roof area9 would be needed by 2020, 13% by 2030 and 39% by 2050. The architecturally suitable facade area that would be needed corresponds to 1% by 2020, 6% by 2030 and 26% by 2050.
These results show that in terms of the availability of roof and facade areas the goals can be met. The total areas, which would be suitable for solar energy use in Denmark, are shown in Table 6-8 below.
Table 6-8: Suitable areas for solar energy use in Denmark (IEA PVPS Programme 2001)
total land area roofs facades
[km²] [km²] [km²] [km²]
Ground floor area 27,840 27,400 219.95 219.93
Total Suitable area 395 274 87.98 32.99
9 For definition see chapter 6.2.2
0.2% 2% 9%
%
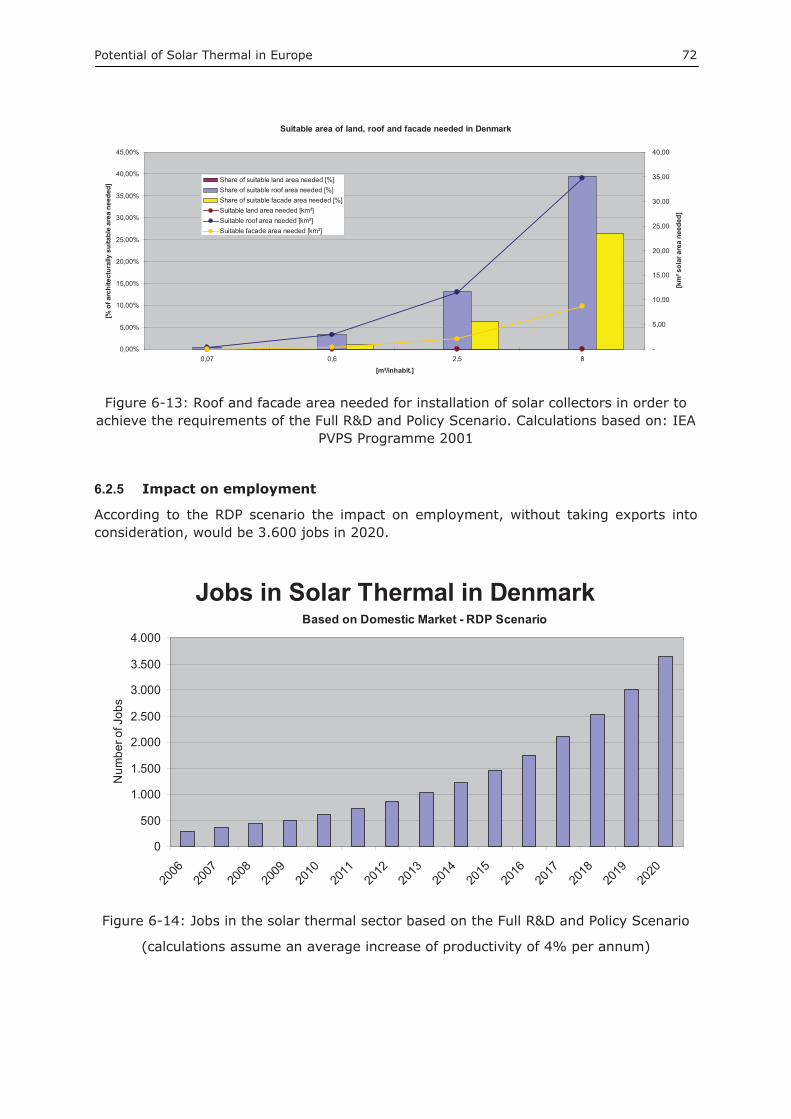
Potential of Solar Thermal in Europe 72
Suitable area of land, roof and facade needed in Denmark
0,00%
5,00%
10,00%
15,00%
20,00%
25,00%
30,00%
35,00%
40,00%
45,00%
0,07 0,6 2,5 8
[m²/inhabit.]
[% o
f arc
hite
ctur
ally
sui
tabl
e ar
ea n
eede
d]
-
5,00
10,00
15,00
20,00
25,00
30,00
35,00
40,00
[km
² sol
ar a
rea
need
ed]
Share of suitable land area needed [%]Share of suitable roof area needed [%]Share of suitable facade area needed [%]Suitable land area needed [km²]Suitable roof area needed [km²]Suitable facade area needed [km²]
Figure 6-13: Roof and facade area needed for installation of solar collectors in order to achieve the requirements of the Full R&D and Policy Scenario. Calculations based on: IEA
PVPS Programme 2001
6.2.5 Impact on employment
According to the RDP scenario the impact on employment, without taking exports into consideration, would be 3.600 jobs in 2020.
Jobs in Solar Thermal in Denmark
0
500
1.000
1.500
2.000
2.500
3.000
3.500
4.000
2006
2007
2008
2009
2010
2011
2012
2013
2014
2015
2016
2017
2018
2019
2020
Num
ber o
f Job
s
Based on Domestic Market - RDP Scenario
Figure 6-14: Jobs in the solar thermal sector based on the Full R&D and Policy Scenario
(calculations assume an average increase of productivity of 4% per annum)
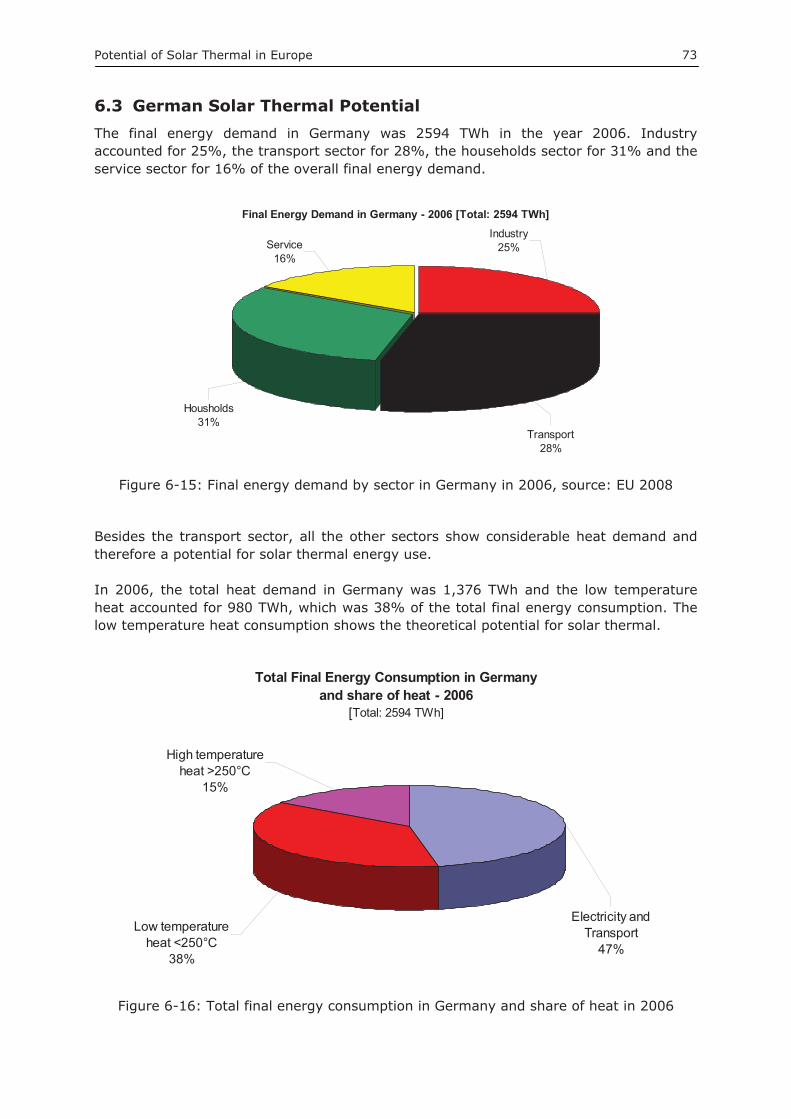
Potential of Solar Thermal in Europe 73
6.3 German Solar Thermal Potential The final energy demand in Germany was 2594 TWh in the year 2006. Industry accounted for 25%, the transport sector for 28%, the households sector for 31% and the service sector for 16% of the overall final energy demand.
Final Energy Demand in Germany - 2006 [Total: 2594 TWh]
Service16%
Transport28%
Housholds31%
Industry25%
Figure 6-15: Final energy demand by sector in Germany in 2006, source: EU 2008
Besides the transport sector, all the other sectors show considerable heat demand and therefore a potential for solar thermal energy use.
In 2006, the total heat demand in Germany was 1,376 TWh and the low temperature heat accounted for 980 TWh, which was 38% of the total final energy consumption. The low temperature heat consumption shows the theoretical potential for solar thermal.
Total Final Energy Consumption in Germany and share of heat - 2006
[Total: 2594 TWh]
Low temperature heat <250°C
38%
Electricity and Transport
47%
High temperature heat >250°C
15%
Figure 6-16: Total final energy consumption in Germany and share of heat in 2006
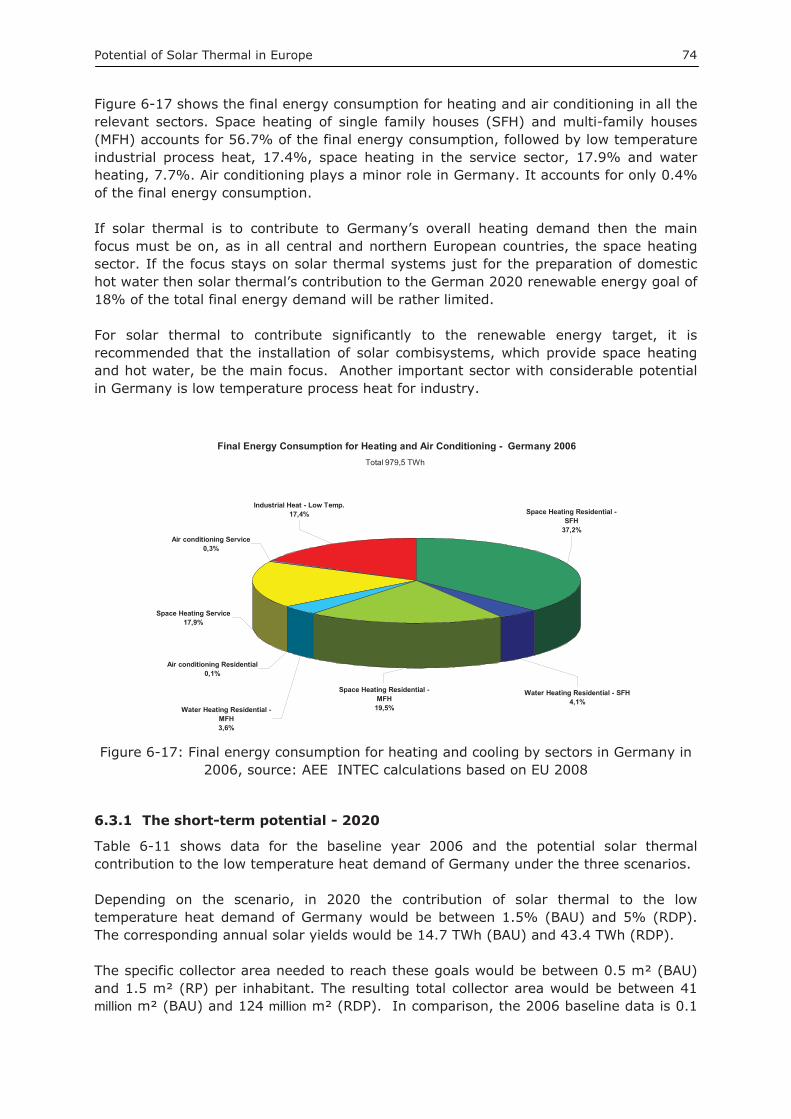
Potential of Solar Thermal in Europe 74
Figure 6-17 shows the final energy consumption for heating and air conditioning in all the relevant sectors. Space heating of single family houses (SFH) and multi-family houses (MFH) accounts for 56.7% of the final energy consumption, followed by low temperature industrial process heat, 17.4%, space heating in the service sector, 17.9% and water heating, 7.7%. Air conditioning plays a minor role in Germany. It accounts for only 0.4% of the final energy consumption.
If solar thermal is to contribute to Germany’s overall heating demand then the main focus must be on, as in all central and northern European countries, the space heating sector. If the focus stays on solar thermal systems just for the preparation of domestic hot water then solar thermal’s contribution to the German 2020 renewable energy goal of 18% of the total final energy demand will be rather limited.
For solar thermal to contribute significantly to the renewable energy target, it is recommended that the installation of solar combisystems, which provide space heating and hot water, be the main focus. Another important sector with considerable potential in Germany is low temperature process heat for industry.
Final Energy Consumption for Heating and Air Conditioning - Germany 2006
Air conditioning Residential0,1%
Water Heating Residential - MFH3,6%
Space Heating Residential - MFH
19,5%
Space Heating Residential - SFH
37,2%
Water Heating Residential - SFH4,1%
Space Heating Service17,9%
Air conditioning Service0,3%
Industrial Heat - Low Temp.17,4%
Total 979,5 TWh
Figure 6-17: Final energy consumption for heating and cooling by sectors in Germany in 2006, source: AEE INTEC calculations based on EU 2008
6.3.1 The short-term potential - 2020
Table 6-11 shows data for the baseline year 2006 and the potential solar thermal contribution to the low temperature heat demand of Germany under the three scenarios.
Depending on the scenario, in 2020 the contribution of solar thermal to the low temperature heat demand of Germany would be between 1.5% (BAU) and 5% (RDP). The corresponding annual solar yields would be 14.7 TWh (BAU) and 43.4 TWh (RDP).
The specific collector area needed to reach these goals would be between 0.5 m² (BAU) and 1.5 m² (RP) per inhabitant. The resulting total collector area would be between 41 million m² (BAU) and 124 million m² (RDP). In comparison, the 2006 baseline data is 0.1
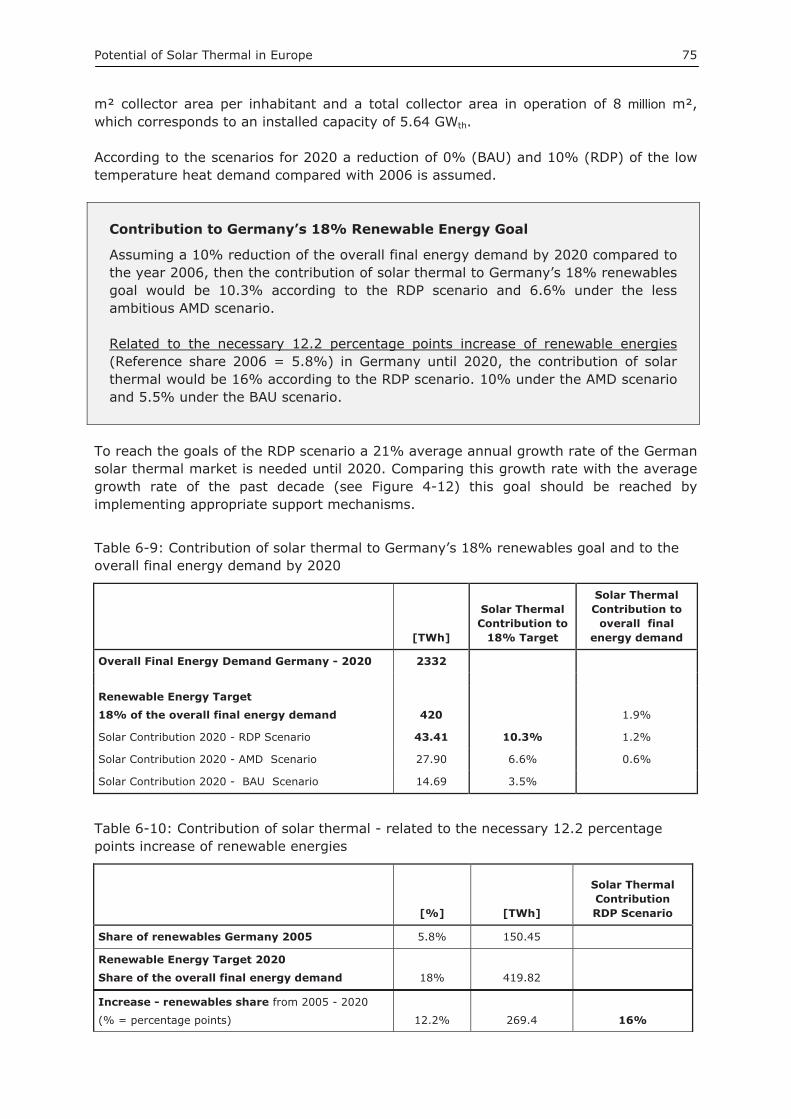
Potential of Solar Thermal in Europe 75
m² collector area per inhabitant and a total collector area in operation of 8 million m², which corresponds to an installed capacity of 5.64 GWth.
According to the scenarios for 2020 a reduction of 0% (BAU) and 10% (RDP) of the low temperature heat demand compared with 2006 is assumed.
Contribution to Germany’s 18% Renewable Energy Goal
Assuming a 10% reduction of the overall final energy demand by 2020 compared to the year 2006, then the contribution of solar thermal to Germany’s 18% renewables goal would be 10.3% according to the RDP scenario and 6.6% under the less ambitious AMD scenario.
Related to the necessary 12.2 percentage points increase of renewable energies(Reference share 2006 = 5.8%) in Germany until 2020, the contribution of solar thermal would be 16% according to the RDP scenario. 10% under the AMD scenario and 5.5% under the BAU scenario.
To reach the goals of the RDP scenario a 21% average annual growth rate of the German solar thermal market is needed until 2020. Comparing this growth rate with the average growth rate of the past decade (see Figure 4-12) this goal should be reached by implementing appropriate support mechanisms.
Table 6-9: Contribution of solar thermal to Germany’s 18% renewables goal and to the overall final energy demand by 2020
[TWh]
Solar Thermal Contribution to
18% Target
Solar Thermal Contribution to
overall final energy demand
Overall Final Energy Demand Germany - 2020 2332
Renewable Energy Target 18% of the overall final energy demand 420 1.9%
Solar Contribution 2020 - RDP Scenario 43.41 10.3% 1.2%
Solar Contribution 2020 - AMD Scenario 27.90 6.6% 0.6%
Solar Contribution 2020 - BAU Scenario 14.69 3.5%
Table 6-10: Contribution of solar thermal - related to the necessary 12.2 percentage points increase of renewable energies
[%] [TWh]
Solar Thermal Contribution RDP Scenario
Share of renewables Germany 2005 5.8% 150.45
Renewable Energy Target 2020 Share of the overall final energy demand 18% 419.82
Increase - renewables share from 2005 - 2020
(% = percentage points) 12.2% 269.4 16%
Potential of Solar Thermal in Europe 76
6.3.2 The medium-term potential - 2030
In 2030, the contribution of solar thermal to the low temperature heat demand of Germany will be between 3.8% under the BAU scenario and 15% under the RDP scenario. The corresponding annual solar yields are 37.2 TWh (BAU) and 115.8 TWh (RDP).
The specific collector area needed to reach these goals will be between 1.3 m² (BAU) and 4 m² (RDP) per inhabitant. The resulting total collector area is between 107 million m² (BAU) and 331 million m² (RDP).
According to the scenarios for 2030 a reduction of 0% (BAU) and 21% (RDP) of the low temperature heat demand compared to 2006 is assumed.
6.3.3 The long-term potential - 2050
In 2050, the contribution of solar thermal to the low temperature heat demand of Germany will be between 6% under the BAU scenario and 34% under the RDP scenario. The corresponding annual solar yields are 57.8 TWh (BAU) and 231.5 TWh (RDP).
The specific collector area needed to reach these goals will be between 2 m² (BAU) and 8 m² (RDP) per inhabitant. The resulting total collector area is between 165 million m² (BAU) and 662 million m² (RDP).
Accoridng to the scenarios for 2050 a reduction of 0% (BAU) and 31% (RDP) of the low temperature heat demand compared with 2006 is assumed.
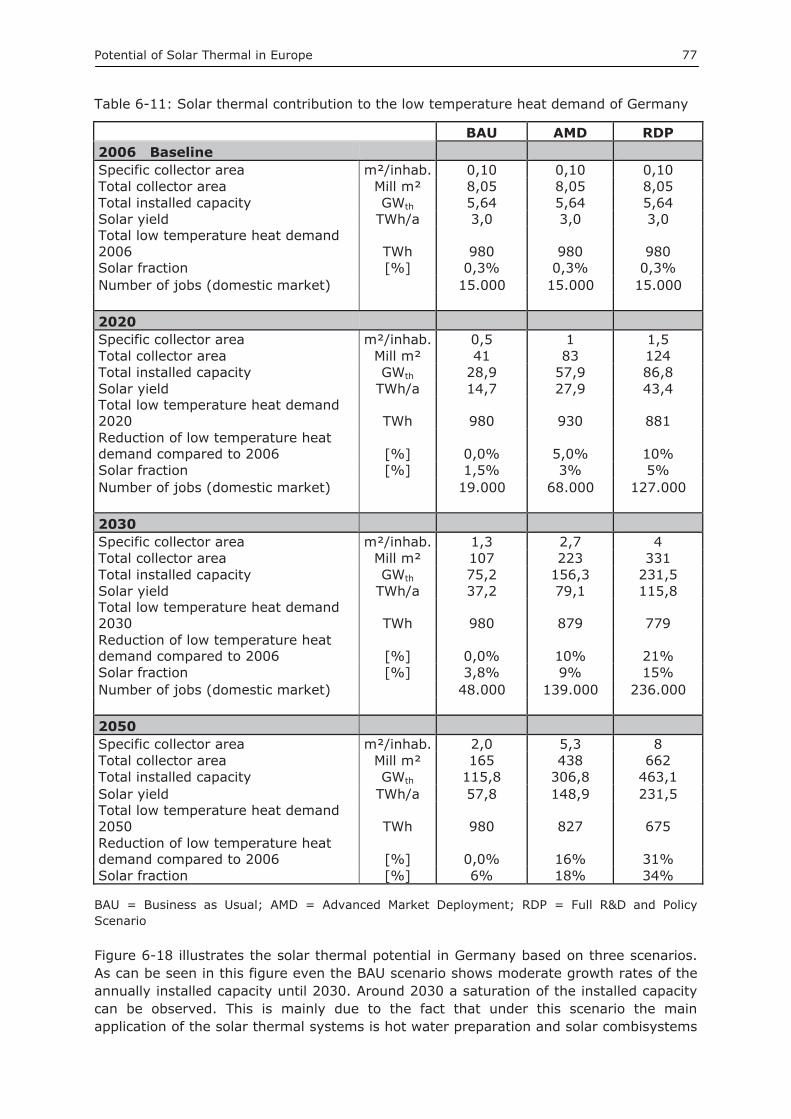
Potential of Solar Thermal in Europe 77
Table 6-11: Solar thermal contribution to the low temperature heat demand of Germany
BAU AMD RDP 2006 Baseline Specific collector area m²/inhab. 0,10 0,10 0,10 Total collector area Mill m² 8,05 8,05 8,05 Total installed capacity GWth 5,64 5,64 5,64 Solar yield TWh/a 3,0 3,0 3,0 Total low temperature heat demand 2006 TWh 980 980 980 Solar fraction [%] 0,3% 0,3% 0,3% Number of jobs (domestic market) 15.000 15.000 15.000 2020 Specific collector area m²/inhab. 0,5 1 1,5 Total collector area Mill m² 41 83 124 Total installed capacity GWth 28,9 57,9 86,8 Solar yield TWh/a 14,7 27,9 43,4 Total low temperature heat demand 2020 TWh 980 930 881 Reduction of low temperature heat demand compared to 2006 [%] 0,0% 5,0% 10% Solar fraction [%] 1,5% 3% 5% Number of jobs (domestic market) 19.000 68.000 127.000 2030 Specific collector area m²/inhab. 1,3 2,7 4 Total collector area Mill m² 107 223 331 Total installed capacity GWth 75,2 156,3 231,5 Solar yield TWh/a 37,2 79,1 115,8 Total low temperature heat demand 2030 TWh 980 879 779 Reduction of low temperature heat demand compared to 2006 [%] 0,0% 10% 21% Solar fraction [%] 3,8% 9% 15% Number of jobs (domestic market) 48.000 139.000 236.000 2050 Specific collector area m²/inhab. 2,0 5,3 8 Total collector area Mill m² 165 438 662 Total installed capacity GWth 115,8 306,8 463,1 Solar yield TWh/a 57,8 148,9 231,5 Total low temperature heat demand 2050 TWh 980 827 675 Reduction of low temperature heat demand compared to 2006 [%] 0,0% 16% 31% Solar fraction [%] 6% 18% 34%
BAU = Business as Usual; AMD = Advanced Market Deployment; RDP = Full R&D and Policy Scenario
Figure 6-18 illustrates the solar thermal potential in Germany based on three scenarios. As can be seen in this figure even the BAU scenario shows moderate growth rates of the annually installed capacity until 2030. Around 2030 a saturation of the installed capacity can be observed. This is mainly due to the fact that under this scenario the main application of the solar thermal systems is hot water preparation and solar combisystems
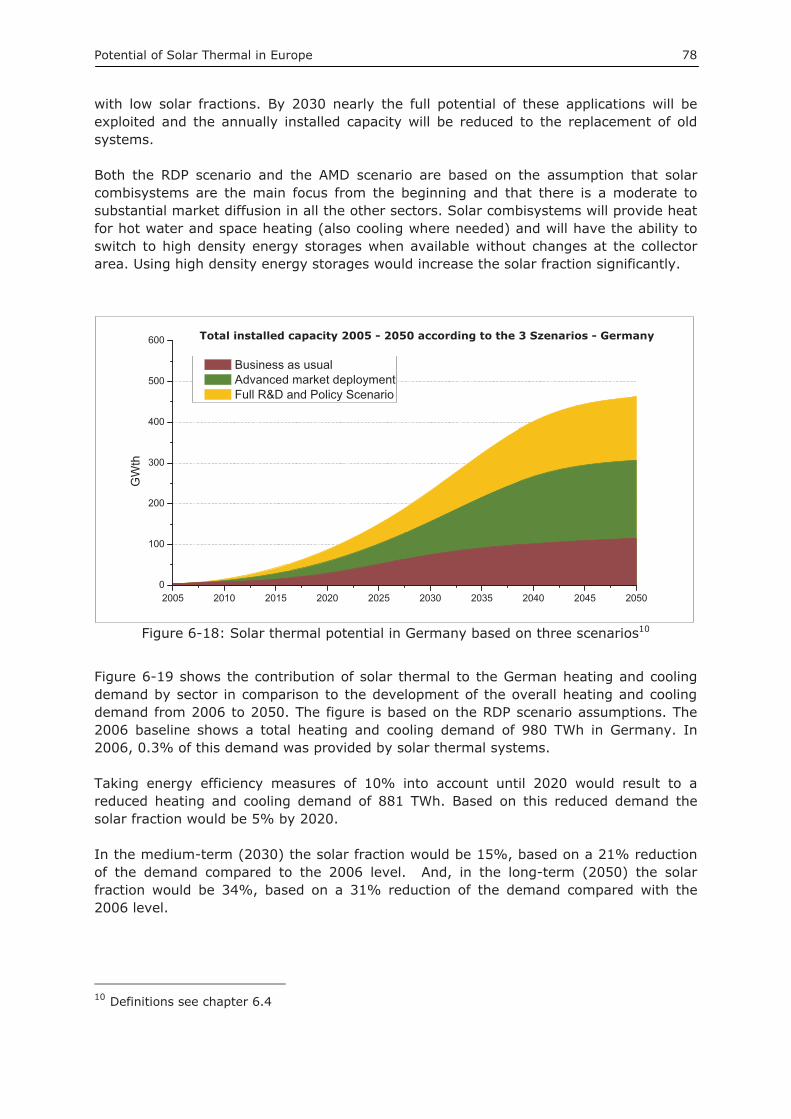
Potential of Solar Thermal in Europe 78
with low solar fractions. By 2030 nearly the full potential of these applications will be exploited and the annually installed capacity will be reduced to the replacement of old systems.
Both the RDP scenario and the AMD scenario are based on the assumption that solar combisystems are the main focus from the beginning and that there is a moderate to substantial market diffusion in all the other sectors. Solar combisystems will provide heat for hot water and space heating (also cooling where needed) and will have the ability to switch to high density energy storages when available without changes at the collector area. Using high density energy storages would increase the solar fraction significantly.
2005 2010 2015 2020 2025 2030 2035 2040 2045 20500
100
200
300
400
500
600 Market Development 2005 - 2050 according to 3 Szenarios - Germany
GW
th
Business as usual Advanced market deployment Full R&D and Policy Scenario
Figure 6-18: Solar thermal potential in Germany based on three scenarios10
Figure 6-19 shows the contribution of solar thermal to the German heating and cooling demand by sector in comparison to the development of the overall heating and cooling demand from 2006 to 2050. The figure is based on the RDP scenario assumptions. The 2006 baseline shows a total heating and cooling demand of 980 TWh in Germany. In 2006, 0.3% of this demand was provided by solar thermal systems.
Taking energy efficiency measures of 10% into account until 2020 would result to a reduced heating and cooling demand of 881 TWh. Based on this reduced demand the solar fraction would be 5% by 2020.
In the medium-term (2030) the solar fraction would be 15%, based on a 21% reduction of the demand compared to the 2006 level. And, in the long-term (2050) the solar fraction would be 34%, based on a 31% reduction of the demand compared with the 2006 level.
10 Definitions see chapter 6.4
Total installed capacity 2005 - 2050 according to the 3 Szenarios - Germany
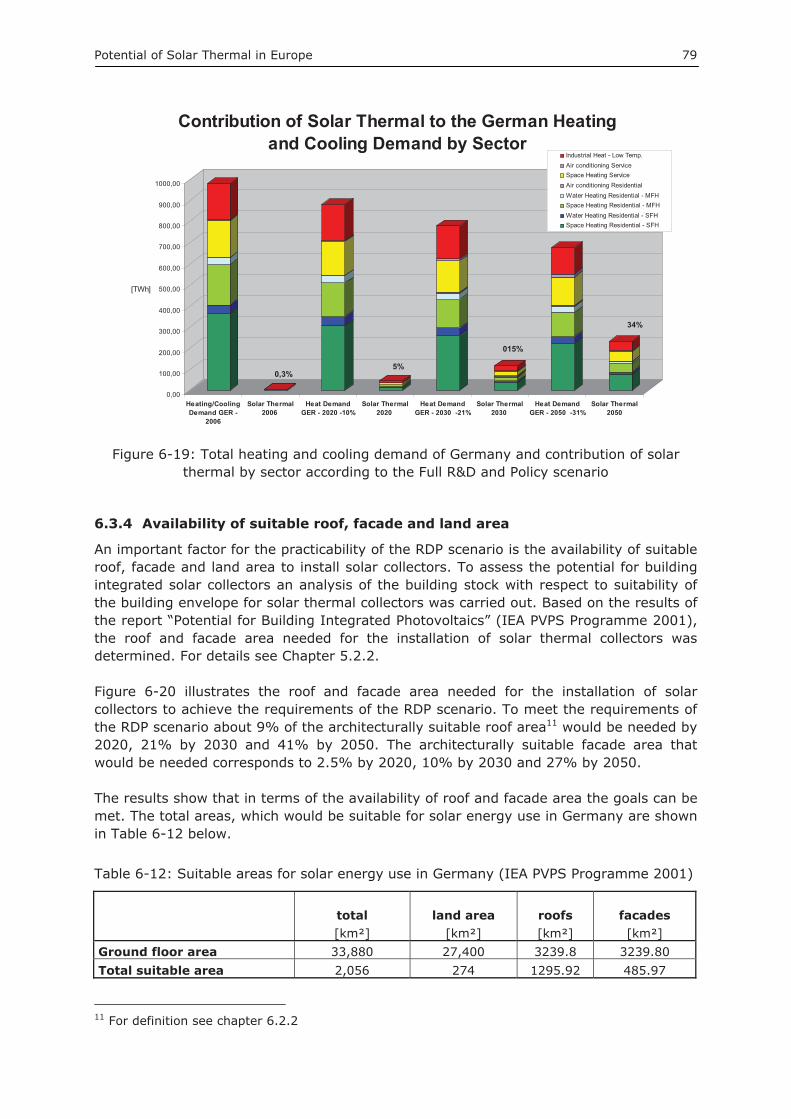
Potential of Solar Thermal in Europe 79
0,00
100,00
200,00
300,00
400,00
500,00
600,00
700,00
800,00
900,00
1000,00
[TWh]
Heating/CoolingDemand GER -
2006
Solar Thermal2006
Heat DemandGER - 2020 -10%
Solar Thermal2020
Heat DemandGER - 2030 -21%
Solar Thermal2030
Heat DemandGER - 2050 -31%
Solar Thermal2050
Contribution of Solar Thermal to the German Heating and Cooling Demand by Sector
Industrial Heat - Low Temp.Air conditioning ServiceSpace Heating ServiceAir conditioning ResidentialWater Heating Residential - MFHSpace Heating Residential - MFHWater Heating Residential - SFHSpace Heating Residential - SFH
34%
Figure 6-19: Total heating and cooling demand of Germany and contribution of solar thermal by sector according to the Full R&D and Policy scenario
6.3.4 Availability of suitable roof, facade and land area
An important factor for the practicability of the RDP scenario is the availability of suitable roof, facade and land area to install solar collectors. To assess the potential for building integrated solar collectors an analysis of the building stock with respect to suitability of the building envelope for solar thermal collectors was carried out. Based on the results of the report “Potential for Building Integrated Photovoltaics” (IEA PVPS Programme 2001), the roof and facade area needed for the installation of solar thermal collectors was determined. For details see Chapter 5.2.2.
Figure 6-20 illustrates the roof and facade area needed for the installation of solar collectors to achieve the requirements of the RDP scenario. To meet the requirements of the RDP scenario about 9% of the architecturally suitable roof area11 would be needed by 2020, 21% by 2030 and 41% by 2050. The architecturally suitable facade area that would be needed corresponds to 2.5% by 2020, 10% by 2030 and 27% by 2050.
The results show that in terms of the availability of roof and facade area the goals can be met. The total areas, which would be suitable for solar energy use in Germany are shown in Table 6-12 below.
Table 6-12: Suitable areas for solar energy use in Germany (IEA PVPS Programme 2001)
total land area roofs facades [km²] [km²] [km²] [km²]
Ground floor area 33,880 27,400 3239.8 3239.80 Total suitable area 2,056 274 1295.92 485.97
11 For definition see chapter 6.2.2
0,3% 5%
015%
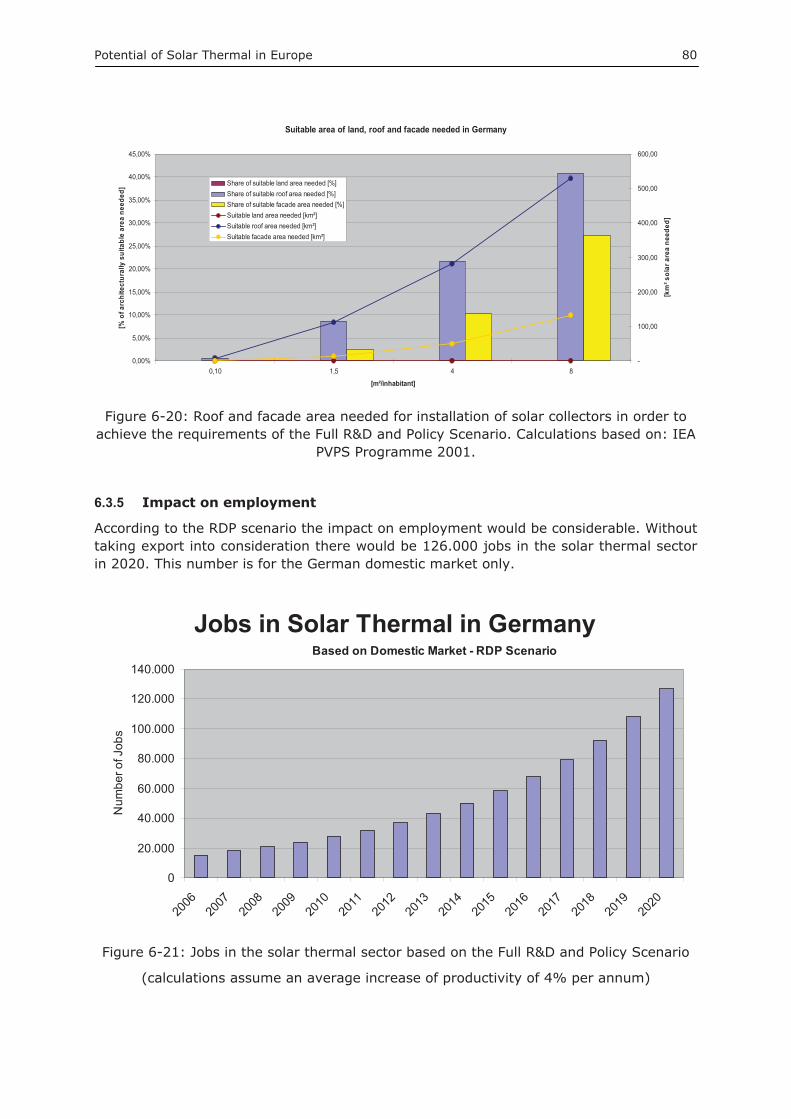
Potential of Solar Thermal in Europe 80
Suitable area of land, roof and facade needed in Germany
0,00%
5,00%
10,00%
15,00%
20,00%
25,00%
30,00%
35,00%
40,00%
45,00%
0,10 1,5 4 8
[m²/inhabitant]
[% o
f arc
hite
ctur
ally
sui
tabl
e ar
ea n
eede
d]
-
100,00
200,00
300,00
400,00
500,00
600,00
[km
² sol
ar a
rea
need
ed]
Share of suitable land area needed [%]Share of suitable roof area needed [%]Share of suitable facade area needed [%]Suitable land area needed [km²]Suitable roof area needed [km²]Suitable facade area needed [km²]
Figure 6-20: Roof and facade area needed for installation of solar collectors in order to achieve the requirements of the Full R&D and Policy Scenario. Calculations based on: IEA
PVPS Programme 2001.
6.3.5 Impact on employment
According to the RDP scenario the impact on employment would be considerable. Without taking export into consideration there would be 126.000 jobs in the solar thermal sector in 2020. This number is for the German domestic market only.
Jobs in Solar Thermal in Germany
0
20.000
40.000
60.000
80.000
100.000
120.000
140.000
2006
2007
2008
2009
2010
2011
2012
2013
2014
2015
2016
2017
2018
2019
2020
Num
ber o
f Job
s
Based on Domestic Market - RDP Scenario
Figure 6-21: Jobs in the solar thermal sector based on the Full R&D and Policy Scenario
(calculations assume an average increase of productivity of 4% per annum)

Potential of Solar Thermal in Europe 81
6.4 Polish Solar Thermal Potential The final energy demand in Poland was 700 TWh in the year 2006. Industry accounted for 29%, the transport sector for 22%, the households sector for 32% and the service sector for 17% of the overall final energy demand.
Final Energy Demand in Poland - 2006 [Total: 700 TWh]
Service17%
Transport22%
Housholds32%
Industry29%
Figure 6-22: Final energy demand by sectors in Poland in 2006, source: EU 2008
Besides the transport sector all the other sectors show a considerable heat demand and therefore a potential for solar thermal energy use.
In 2006 the total heat demand in Poland was 373 TWh and the low temperature heat accounted for 297 TWh, which was 42% of the total final energy consumption. The low temperature heat consumption shows the theoretical potential for solar thermal.
Total Final Energy Consumption in Poland and share of heat - 2006
[Total: 700 TWh]
High temperature heat >250°C
11%
Low temperature heat <250°C
42%
Electricity and Transport
47%
Figure 6-23: Total final energy consumption in Poland and share of heat in 2006
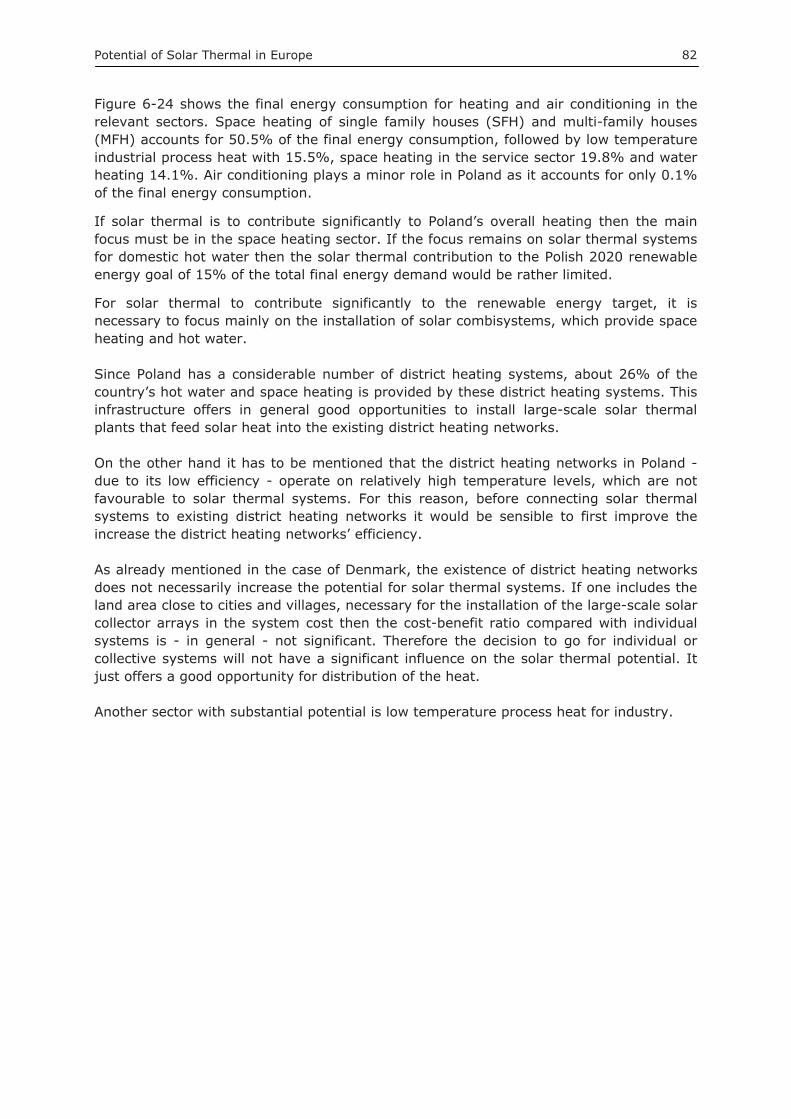
Potential of Solar Thermal in Europe 82
Figure 6-24 shows the final energy consumption for heating and air conditioning in the relevant sectors. Space heating of single family houses (SFH) and multi-family houses (MFH) accounts for 50.5% of the final energy consumption, followed by low temperature industrial process heat with 15.5%, space heating in the service sector 19.8% and water heating 14.1%. Air conditioning plays a minor role in Poland as it accounts for only 0.1% of the final energy consumption.
If solar thermal is to contribute significantly to Poland’s overall heating then the main focus must be in the space heating sector. If the focus remains on solar thermal systems for domestic hot water then the solar thermal contribution to the Polish 2020 renewable energy goal of 15% of the total final energy demand would be rather limited.
For solar thermal to contribute significantly to the renewable energy target, it is necessary to focus mainly on the installation of solar combisystems, which provide space heating and hot water.
Since Poland has a considerable number of district heating systems, about 26% of the country’s hot water and space heating is provided by these district heating systems. This infrastructure offers in general good opportunities to install large-scale solar thermal plants that feed solar heat into the existing district heating networks.
On the other hand it has to be mentioned that the district heating networks in Poland - due to its low efficiency - operate on relatively high temperature levels, which are not favourable to solar thermal systems. For this reason, before connecting solar thermal systems to existing district heating networks it would be sensible to first improve the increase the district heating networks’ efficiency.
As already mentioned in the case of Denmark, the existence of district heating networks does not necessarily increase the potential for solar thermal systems. If one includes the land area close to cities and villages, necessary for the installation of the large-scale solar collector arrays in the system cost then the cost-benefit ratio compared with individual systems is - in general - not significant. Therefore the decision to go for individual or collective systems will not have a significant influence on the solar thermal potential. It just offers a good opportunity for distribution of the heat.
Another sector with substantial potential is low temperature process heat for industry.
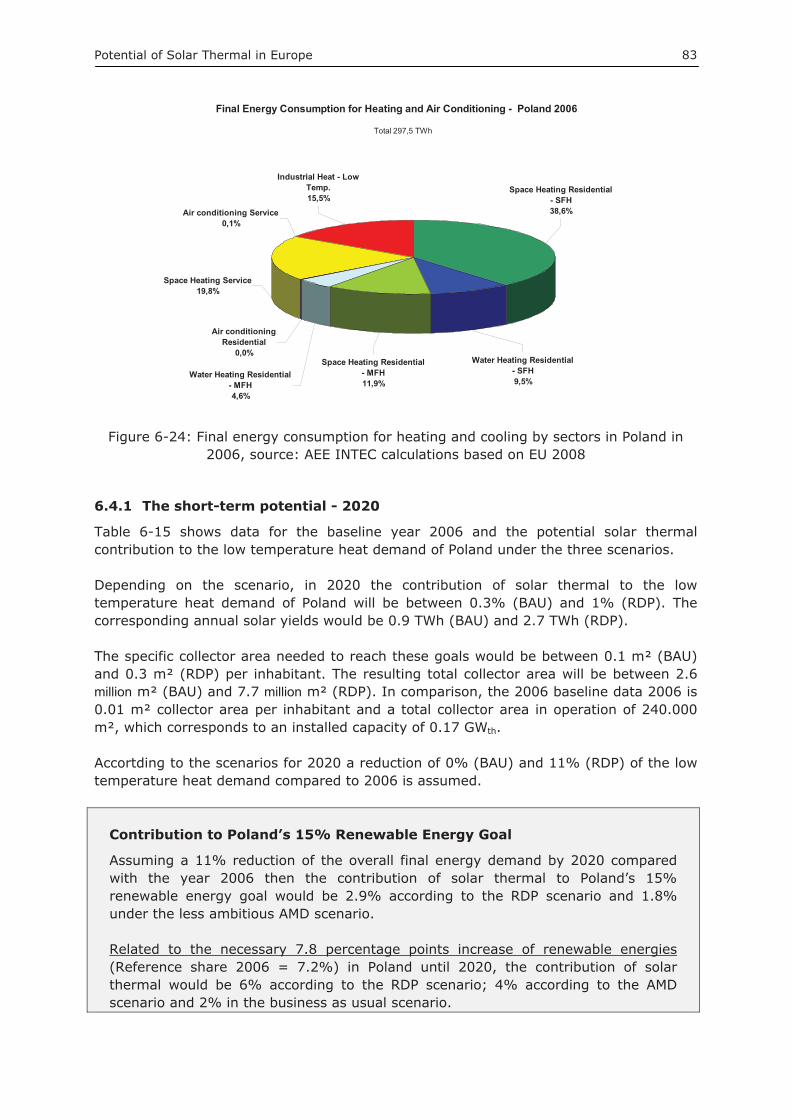
Potential of Solar Thermal in Europe 83
Final Energy Consumption for Heating and Air Conditioning - Poland 2006
Industrial Heat - Low Temp.15,5%
Air conditioning Service0,1%
Space Heating Service19,8%
Water Heating Residential - SFH9,5%
Space Heating Residential - SFH38,6%
Space Heating Residential - MFH11,9%
Water Heating Residential - MFH4,6%
Air conditioning Residential
0,0%
Total 297,5 TWh
Figure 6-24: Final energy consumption for heating and cooling by sectors in Poland in 2006, source: AEE INTEC calculations based on EU 2008
6.4.1 The short-term potential - 2020
Table 6-15 shows data for the baseline year 2006 and the potential solar thermal contribution to the low temperature heat demand of Poland under the three scenarios.
Depending on the scenario, in 2020 the contribution of solar thermal to the low temperature heat demand of Poland will be between 0.3% (BAU) and 1% (RDP). The corresponding annual solar yields would be 0.9 TWh (BAU) and 2.7 TWh (RDP).
The specific collector area needed to reach these goals would be between 0.1 m² (BAU) and 0.3 m² (RDP) per inhabitant. The resulting total collector area will be between 2.6 million m² (BAU) and 7.7 million m² (RDP). In comparison, the 2006 baseline data 2006 is 0.01 m² collector area per inhabitant and a total collector area in operation of 240.000 m², which corresponds to an installed capacity of 0.17 GWth.
Accortding to the scenarios for 2020 a reduction of 0% (BAU) and 11% (RDP) of the low temperature heat demand compared to 2006 is assumed.
Contribution to Poland’s 15% Renewable Energy Goal
Assuming a 11% reduction of the overall final energy demand by 2020 compared with the year 2006 then the contribution of solar thermal to Poland’s 15% renewable energy goal would be 2.9% according to the RDP scenario and 1.8% under the less ambitious AMD scenario.
Related to the necessary 7.8 percentage points increase of renewable energies(Reference share 2006 = 7.2%) in Poland until 2020, the contribution of solar thermal would be 6% according to the RDP scenario; 4% according to the AMD scenario and 2% in the business as usual scenario.
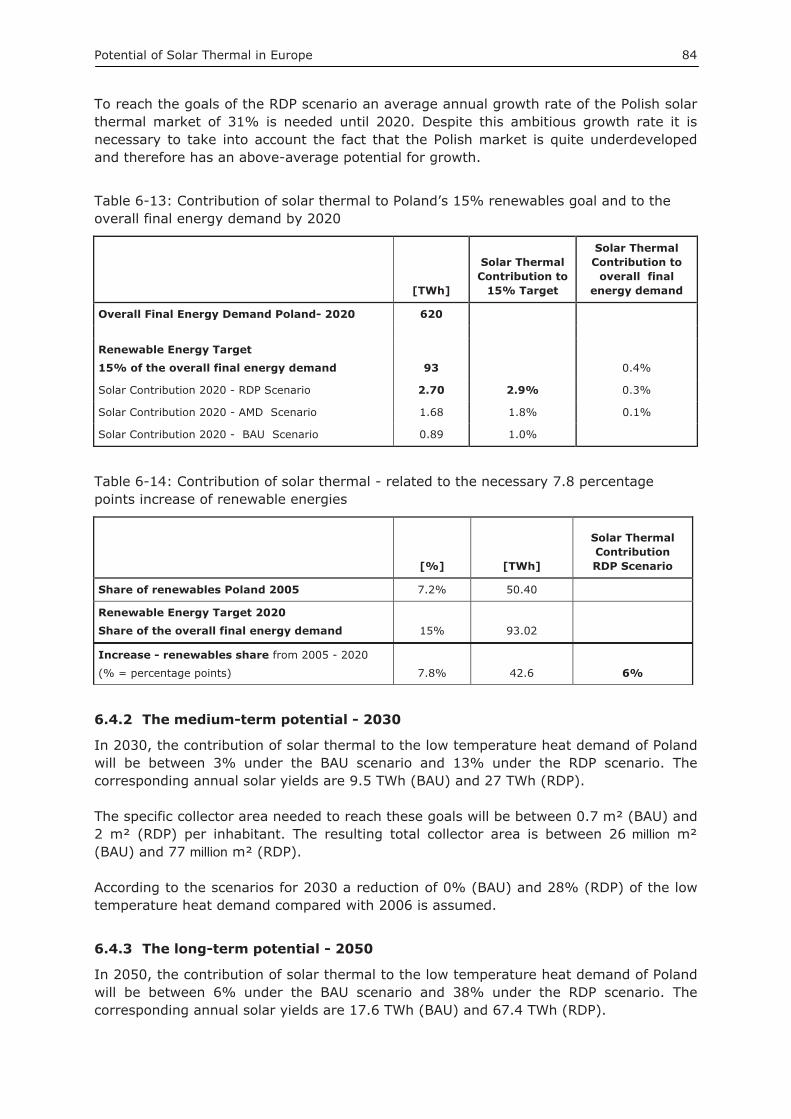
Potential of Solar Thermal in Europe 84
To reach the goals of the RDP scenario an average annual growth rate of the Polish solar thermal market of 31% is needed until 2020. Despite this ambitious growth rate it is necessary to take into account the fact that the Polish market is quite underdeveloped and therefore has an above-average potential for growth.
Table 6-13: Contribution of solar thermal to Poland’s 15% renewables goal and to the overall final energy demand by 2020
[TWh]
Solar Thermal Contribution to
15% Target
Solar Thermal Contribution to
overall final energy demand
Overall Final Energy Demand Poland- 2020 620
Renewable Energy Target
15% of the overall final energy demand 93 0.4%
Solar Contribution 2020 - RDP Scenario 2.70 2.9% 0.3%
Solar Contribution 2020 - AMD Scenario 1.68 1.8% 0.1%
Solar Contribution 2020 - BAU Scenario 0.89 1.0%
Table 6-14: Contribution of solar thermal - related to the necessary 7.8 percentage points increase of renewable energies
[%] [TWh]
Solar Thermal Contribution RDP Scenario
Share of renewables Poland 2005 7.2% 50.40
Renewable Energy Target 2020 Share of the overall final energy demand 15% 93.02
Increase - renewables share from 2005 - 2020
(% = percentage points) 7.8% 42.6 6%
6.4.2 The medium-term potential - 2030
In 2030, the contribution of solar thermal to the low temperature heat demand of Poland will be between 3% under the BAU scenario and 13% under the RDP scenario. The corresponding annual solar yields are 9.5 TWh (BAU) and 27 TWh (RDP).
The specific collector area needed to reach these goals will be between 0.7 m² (BAU) and 2 m² (RDP) per inhabitant. The resulting total collector area is between 26 million m² (BAU) and 77 million m² (RDP).
According to the scenarios for 2030 a reduction of 0% (BAU) and 28% (RDP) of the low temperature heat demand compared with 2006 is assumed.
6.4.3 The long-term potential - 2050
In 2050, the contribution of solar thermal to the low temperature heat demand of Poland will be between 6% under the BAU scenario and 38% under the RDP scenario. The corresponding annual solar yields are 17.6 TWh (BAU) and 67.4 TWh (RDP).
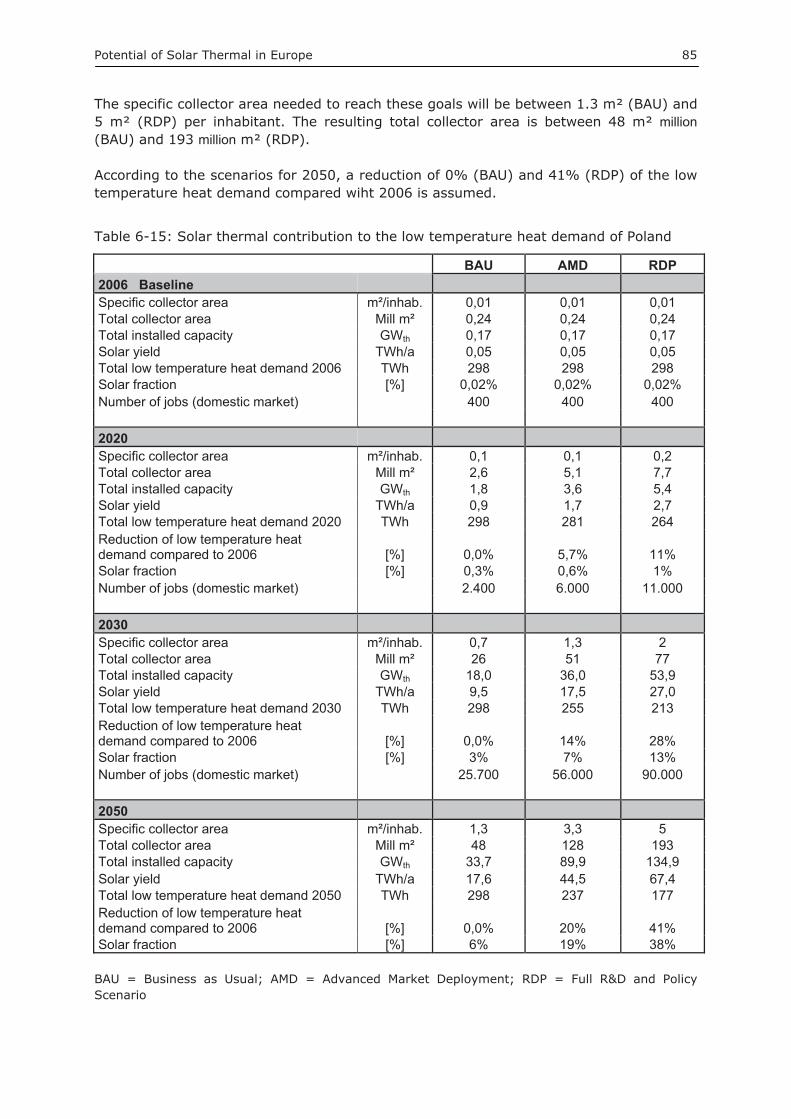
Potential of Solar Thermal in Europe 85
The specific collector area needed to reach these goals will be between 1.3 m² (BAU) and 5 m² (RDP) per inhabitant. The resulting total collector area is between 48 m² million(BAU) and 193 million m² (RDP).
According to the scenarios for 2050, a reduction of 0% (BAU) and 41% (RDP) of the low temperature heat demand compared wiht 2006 is assumed.
Table 6-15: Solar thermal contribution to the low temperature heat demand of Poland
BAU AMD RDP 2006 Baseline Specific collector area m²/inhab. 0,01 0,01 0,01 Total collector area Mill m² 0,24 0,24 0,24 Total installed capacity GWth 0,17 0,17 0,17 Solar yield TWh/a 0,05 0,05 0,05 Total low temperature heat demand 2006 TWh 298 298 298 Solar fraction [%] 0,02% 0,02% 0,02% Number of jobs (domestic market) 400 400 400 2020 Specific collector area m²/inhab. 0,1 0,1 0,2 Total collector area Mill m² 2,6 5,1 7,7 Total installed capacity GWth 1,8 3,6 5,4 Solar yield TWh/a 0,9 1,7 2,7 Total low temperature heat demand 2020 TWh 298 281 264 Reduction of low temperature heat demand compared to 2006 [%] 0,0% 5,7% 11% Solar fraction [%] 0,3% 0,6% 1% Number of jobs (domestic market) 2.400 6.000 11.000 2030 Specific collector area m²/inhab. 0,7 1,3 2 Total collector area Mill m² 26 51 77 Total installed capacity GWth 18,0 36,0 53,9 Solar yield TWh/a 9,5 17,5 27,0 Total low temperature heat demand 2030 TWh 298 255 213 Reduction of low temperature heat demand compared to 2006 [%] 0,0% 14% 28% Solar fraction [%] 3% 7% 13% Number of jobs (domestic market) 25.700 56.000 90.000 2050 Specific collector area m²/inhab. 1,3 3,3 5 Total collector area Mill m² 48 128 193 Total installed capacity GWth 33,7 89,9 134,9 Solar yield TWh/a 17,6 44,5 67,4 Total low temperature heat demand 2050 TWh 298 237 177 Reduction of low temperature heat demand compared to 2006 [%] 0,0% 20% 41% Solar fraction [%] 6% 19% 38%
BAU = Business as Usual; AMD = Advanced Market Deployment; RDP = Full R&D and Policy Scenario
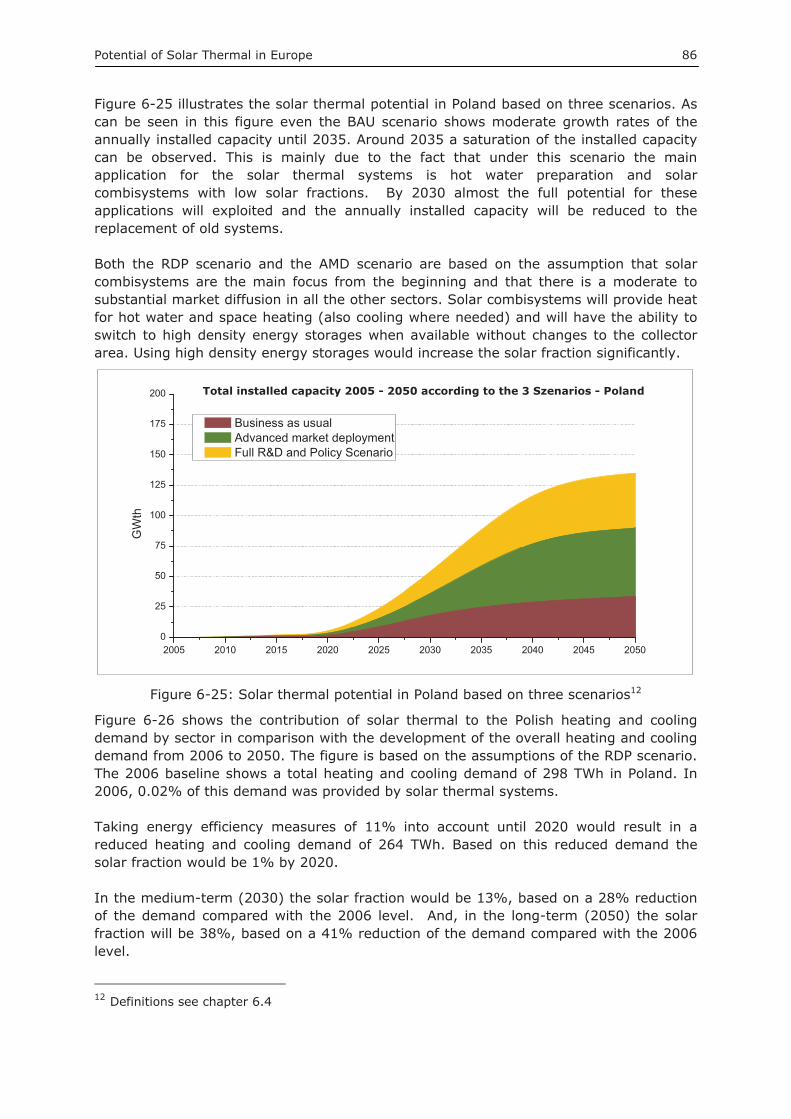
Potential of Solar Thermal in Europe 86
Figure 6-25 illustrates the solar thermal potential in Poland based on three scenarios. As can be seen in this figure even the BAU scenario shows moderate growth rates of the annually installed capacity until 2035. Around 2035 a saturation of the installed capacity can be observed. This is mainly due to the fact that under this scenario the main application for the solar thermal systems is hot water preparation and solar combisystems with low solar fractions. By 2030 almost the full potential for these applications will exploited and the annually installed capacity will be reduced to the replacement of old systems.
Both the RDP scenario and the AMD scenario are based on the assumption that solar combisystems are the main focus from the beginning and that there is a moderate to substantial market diffusion in all the other sectors. Solar combisystems will provide heat for hot water and space heating (also cooling where needed) and will have the ability to switch to high density energy storages when available without changes to the collector area. Using high density energy storages would increase the solar fraction significantly.
2005 2010 2015 2020 2025 2030 2035 2040 2045 20500
25
50
75
100
125
150
175
200 Market Development 2005 - 2050 according to 3 Szenarios - Poland
GW
th
Business as usual Advanced market deployment Full R&D and Policy Scenario
Figure 6-25: Solar thermal potential in Poland based on three scenarios12
Figure 6-26 shows the contribution of solar thermal to the Polish heating and cooling demand by sector in comparison with the development of the overall heating and cooling demand from 2006 to 2050. The figure is based on the assumptions of the RDP scenario. The 2006 baseline shows a total heating and cooling demand of 298 TWh in Poland. In 2006, 0.02% of this demand was provided by solar thermal systems.
Taking energy efficiency measures of 11% into account until 2020 would result in a reduced heating and cooling demand of 264 TWh. Based on this reduced demand the solar fraction would be 1% by 2020.
In the medium-term (2030) the solar fraction would be 13%, based on a 28% reduction of the demand compared with the 2006 level. And, in the long-term (2050) the solar fraction will be 38%, based on a 41% reduction of the demand compared with the 2006 level.
12 Definitions see chapter 6.4
Total installed capacity 2005 - 2050 according to the 3 Szenarios - Poland
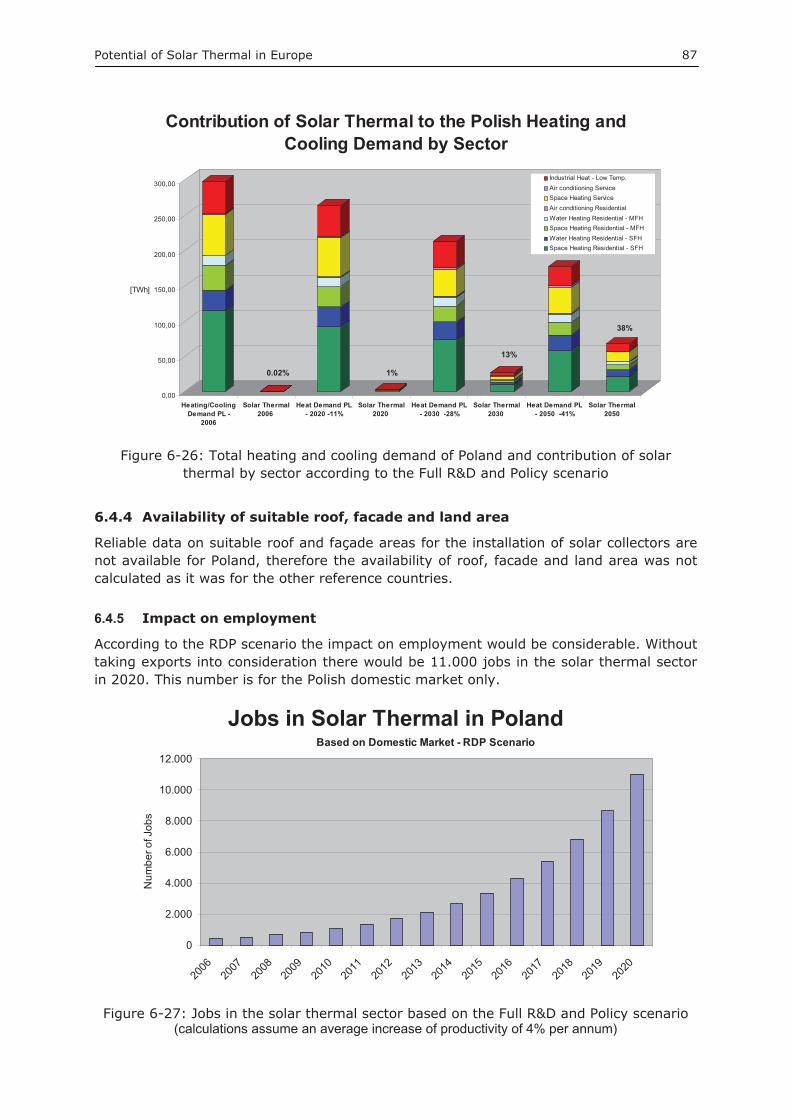
Potential of Solar Thermal in Europe 87
0,00
50,00
100,00
150,00
200,00
250,00
300,00
[TWh]
Heating/CoolingDemand PL -
2006
Solar Thermal2006
Heat Demand PL- 2020 -11%
Solar Thermal2020
Heat Demand PL- 2030 -28%
Solar Thermal2030
Heat Demand PL- 2050 -41%
Solar Thermal2050
Contribution of Solar Thermal to the Polish Heating and Cooling Demand by Sector
Industrial Heat - Low Temp.Air conditioning ServiceSpace Heating ServiceAir conditioning ResidentialWater Heating Residential - MFHSpace Heating Residential - MFHWater Heating Residential - SFHSpace Heating Residential - SFH
38%
Figure 6-26: Total heating and cooling demand of Poland and contribution of solar thermal by sector according to the Full R&D and Policy scenario
6.4.4 Availability of suitable roof, facade and land area
Reliable data on suitable roof and façade areas for the installation of solar collectors are not available for Poland, therefore the availability of roof, facade and land area was not calculated as it was for the other reference countries.
6.4.5 Impact on employment
According to the RDP scenario the impact on employment would be considerable. Without taking exports into consideration there would be 11.000 jobs in the solar thermal sector in 2020. This number is for the Polish domestic market only.
Jobs in Solar Thermal in Poland
0
2.000
4.000
6.000
8.000
10.000
12.000
2006
2007
2008
2009
2010
2011
2012
2013
2014
2015
2016
2017
2018
2019
2020
Num
ber o
f Job
s
Based on Domestic Market - RDP Scenario
Figure 6-27: Jobs in the solar thermal sector based on the Full R&D and Policy scenario (calculations assume an average increase of productivity of 4% per annum)
13%
1%0.02%

Potential of Solar Thermal in Europe 88
6.5 Spanish Solar Thermal Potential The final energy demand in Spain was 1124 TWh in the year 2006. Industry accounted for 31%, the transport sector for 43%, the households sector for 15% and the service sector for 11% of the overall final energy demand.
Final Energy Demand in Spain - 2006 [Total: 1124 TWh]
Service11%
Transport43%
Housholds15%
Industry31%
Figure 6-28: Final energy demand by sector in Spain in 2006, source: EU 2008
Besides the transport sector, all the other sectors show considerable heat demand and therefore a potential for solar thermal energy use.
In 2006 the total heat demand in Spain was 369 TWh and the low temperature heat accounted for 258 TWh, which was 23% of the total final energy consumption. The low temperature heat consumption shows the theoretical potential for solar thermal.
Total Final Energy Consumption in Spain and share of heat - 2006
[Total: 1124 TWh]
High temperature heat >250°C
10%
Low temperature heat <250°C
23%Electricity and
Transport67%
Figure 6-29: Total final energy consumption in Spain and share of heat in 2006

Potential of Solar Thermal in Europe 89
Figure 6-30 shows the final energy consumption for heating and air conditioning in the relevant sectors.
Compared with the other reference countries, Spain has significant sub-sectors for heating and cooling demand due to its Mediterranean climatic conditions.
Low temperature industrial process heat (28.7%) and space heating of single family houses (SFH) and multi-family houses (MFH) (29.1%) are the most important sectors, followed by water heating with 18.7% and space heating in the service sector with 13.1%. Air conditioning - to date mainly powered by electricity - accounts for 11% of the final energy consumption and is in the same range as water heating and equal to about 60% of the space heating demand in the residential sector.
In the service sector it is worth noting that the air conditioning demand corresponds to 65% of the space heating demand. This fact illustrates the large potential for combined solar thermal systems for space heating and air conditioning. To reach this potential it is necessary to have sufficient and cost competitive solutions for solar thermal cooling. A strong competitor in the area of air conditioning could be photovoltaic powered systems.
The major applications of solar thermal driven air conditioning are seen in the medium to large-scale systems in the service sectors (offices, hotels, etc.) and in industrial cooling. If solar thermal is to provide a significant contribution to the overall heating and cooling demand in Spain then the main focus must be on combined systems providing space heating, hot water and air conditioning in the residential and service sectors. Combined solutions could also provide solid solutions for low temperature process heat and cooling in industry.
Another future sector with considerable potential in Mediterranean countries, such as Spain will be in sea water desalination.
Final Energy Consumption for Heating and Air Conditioning - Spain 2006
Air conditioning Residential2,4%
Water Heating Residential - MFH9,8%
Space Heating Residential - MFH
11,8%
Space Heating Residential - SFH
17,3%Water Heating Residential -
SFH8,4%
Space Heating Service13,1%
Air conditioning Service8,6%
Industrial Heat - Low Temp.28,7%
Total 258,2 TWh
Figure 6-30: Final energy consumption for heating and cooling by sectors in Spain in 2006, source: AEE INTEC calculations based on EU 2008
Potential of Solar Thermal in Europe 90
6.5.1 The short-term potential - 2020
Table 6-18 shows data for baseline year 2006 and the potential solar thermal contribution to the low temperature heat demand of Spain under the three scenarios. Depending on the scenario, in 2020 the contribution of solar thermal to the low temperature heat demand of Spain will be between 2% (BAU) and 5% (RDP). The corresponding annual solar yields would be 5.2 TWh (BAU) and 11.8 TWh (RDP).
The specific collector area needed to reach these goals would be between 0.2 m² (BAU) and 0.5 m² (RP) per inhabitant. The resulting total collector area would be between 7.2 million m² (BAU) and 21.5 million m² (RDP). In comparison, the 2006 baseline data are 0.02 m² collector area per inhabitant and a total collector area in operation of 950.000 m², corresponding to an installed capacity of 0.66 GWth.
According to the scenarios for 2020 a reduction of 0% (BAU) and 1% (RDP) of the low temperature heat and air conditioning demand compared with 2006 is assumed.
The small reduction in the low temperature heat and air conditioning demand until 2020 is due primarily to the fact that in Spain the demand of air conditioning is expected to rise by a factor of 1.5 to 2 until 2020 (Henning H.M. 2008). The heat reductions in the other sectors will almost be compensated by this expected increase of the demand in the air conditioning and cooling sector.
Contribution to Spain’s 20% Renewable Energy Goal
Assuming a 1% reduction of the overall final energy demand by 2020 compared with the year 2006, the contribution of solar thermal to the Spain’s 20% renewable energies goal would be 5.3% according to the RDP scenario and 3.5% under the less ambitious AMD scenario.
Related to the necessary 11.3 percentage points increase of renewable energies(Reference share 2006 = 8.7%) in Spain until 2020, the contribution of solar thermal would be 9.4% according to the RDP scenario; 6.2% according to the AMD scenario and 4.1% in the business as usual scenario.
To reach the goals of the RDP scenario a 26% average annual growth rate of the Spanish solar thermal market is needed until 2020. Taking into account the market growth rates from 2000 to 2006 (see Figure 5-14) and the favourable political conditions for renewables in Spain, this goal should be within reach.
Potential of Solar Thermal in Europe 91
Table 6-16: Contribution of solar thermal to Spain’s 20% renewables goal and to the overall final energy demand by 2020
[TWh]
Solar Thermal Contribution to
20% Target
Solar Thermal Contribution to
overall final energy demand
Overall Final Energy Demand Spain - 2020 1117
Renewable Energy Target 20% of the overall final energy demand 223 1.1%
Solar Contribution 2020 - RDP Scenario 11.84 5.3% 0.7%
Solar Contribution 2020 - AMD Scenario 7.72 3.5% 0.5%
Solar Contribution 2020 - BAU Scenario 5.15 2.3%
Table 6-17: Contribution of solar thermal - related to the necessary 11.3 percentage points increase of renewable energies
[%] [TWh]
Solar Thermal Contribution RDP Scenario
Share of renewables Spain 2005 8.7% 97.79
Renewable Energy Target 2020 Share of the overall final energy demand 20% 223.46
Increase - renewables share from 2005 - 2020
(% = percentage points) 11.3% 125.7 9.4%
6.5.2 The medium-term potential - 2030
In 2030, the contribution of solar thermal to the low temperature heat demand of Spain will be between 10% under the BAU scenario and 29% under the RDP scenario. The corresponding annual solar yields are 26.1 TWh (BAU) and 71.1 TWh (RDP).
The specific collector area needed to reach these goals will be between 1 m² (BAU) and 3 m² (RDP) per inhabitant. The resulting total collector area will be between 43 million m² (BAU) and 129 million m² (RDP). According to the 2030 scenarios, a reduction of 0% (BAU) and 4% (RDP) of the low temperature heat and the cooling demand compared to 2006 is assumed.
6.5.3 The long-term potential - 2050
In 2050, the contribution of solar thermal to the low temperature heat demand of Spain will be between 15% under the BAU scenario and 63% under the RDP scenario. The corresponding annual solar yields are 39 TWh (BAU) and 142 TWh (RDP).
The specific collector area needed to reach these goals will be between 1.5 m² (BAU) and 6 m² (RDP) per inhabitant. The resulting total collector area is between 65 million m² (BAU) and 258 million m² (RDP).
According to the 2050 scenarios, a reduction of 0% (BAU) and 12% (RDP) of the low temperature heat and the cooling demand compared to 2006 is assumed.
Potential of Solar Thermal in Europe 92
Table 6-18: Solar thermal contribution to the low temperature heat demand of Spain BAU AMD RDP 2006 Baseline Specific collector area m²/inhab. 0,02 0,02 0,02 Total collector area Mill m² 0,95 0,95 0,95 Total installed capacity GWth 0,66 0,66 0,66 Solar yield TWh/a 0,58 0,58 0,58 Total low temperature heat demand 2006 TWh 258 258 258 Solar fraction [%] 0,22% 0,22% 0,22% Number of jobs (domestic market) 1.800 1.800 1.800 2020 Specific collector area m²/inhab. 0,2 0,3 0,5 Total collector area Mill m² 7,2 14,4 21,5 Total installed capacity GWth 5,0 10,0 15,1 Solar yield TWh/a 5,2 7,7 11,8 Total low temperature heat demand 2020 TWh 258 257 257 Reduction of low temperature heat demand compared to 2006 [%] 0,0% 0,3% 1% Solar fraction [%] 2,0% 3% 5% Number of jobs (domestic market) 7.500 12.600 26.500 2030 Specific collector area m²/inhab. 1,0 2,0 3 Total collector area Mill m² 43 86 129 Total installed capacity GWth 30,1 60,3 90,4 Solar yield TWh/a 26,1 53,3 71,1 Total low temperature heat demand 2030 TWh 258 253 247 Reduction of low temperature heat demand compared to 2006 [%] 0,0% 2% 4% Solar fraction [%] 10% 21% 29% Number of jobs (domestic market) 31.100 77.000 126.900 2050 Specific collector area m²/inhab. 1,5 4,0 6 Total collector area Mill m² 65 172 258 Total installed capacity GWth 45,2 120,6 180,9 Solar yield TWh/a 39,0 108,8 142,1 Total low temperature heat demand 2050 TWh 258 242 226 Reduction of low temperature heat demand compared to 2006 [%] 0,0% 6% 12% Solar fraction [%] 15% 45% 63%
BAU = Business as Usual; AMD = Advanced Market Deployment; RDP = Full R&D and Policy Scenario
Figure 6-31 illustrates the solar thermal potential in Spain based on three scenarios. As can be seen in this figure around 2025 a saturation of the annually installed capacity can be observed. This is mainly due to the fact that under this scenario the main application for the solar thermal systems is hot water preparation. By 2030 nearly the full potential for these applications will be exploited and the annually installed capacity will be reduced to the replacement of old systems.
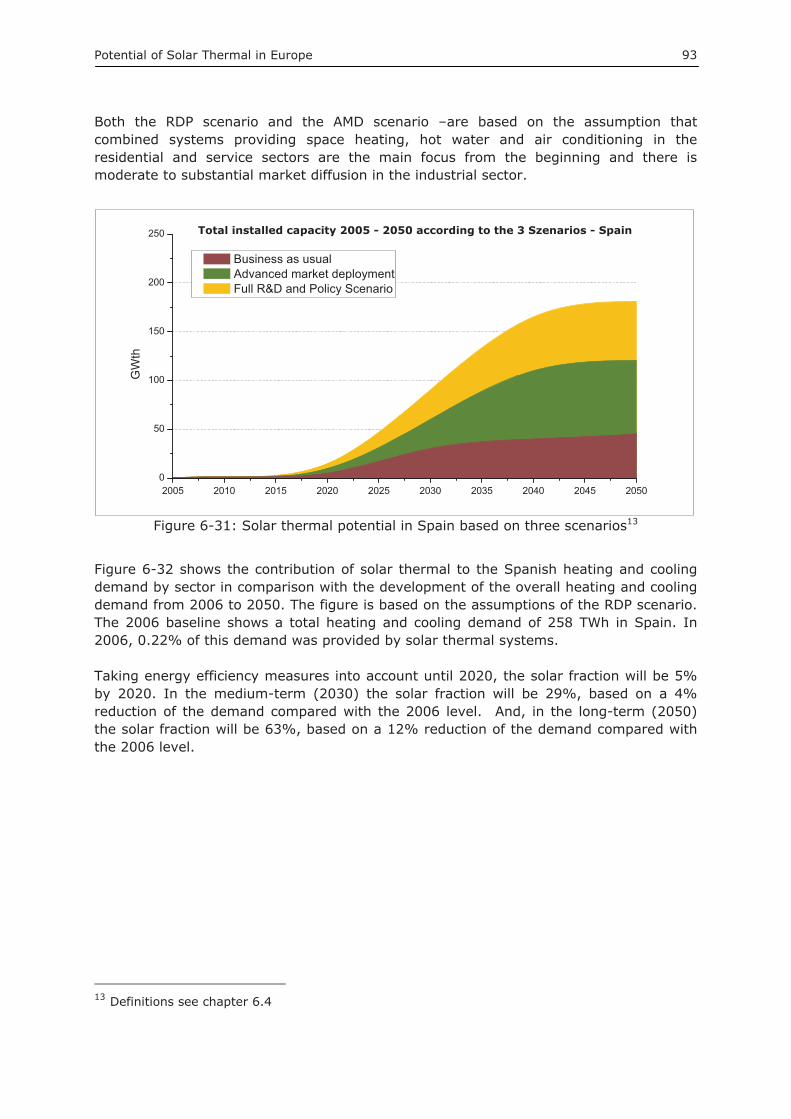
Potential of Solar Thermal in Europe 93
Both the RDP scenario and the AMD scenario –are based on the assumption that combined systems providing space heating, hot water and air conditioning in the residential and service sectors are the main focus from the beginning and there is moderate to substantial market diffusion in the industrial sector.
2005 2010 2015 2020 2025 2030 2035 2040 2045 20500
50
100
150
200
250 Market Development 2005 - 2050 according to 3 Szenarios - Spain
GW
th
Business as usual Advanced market deployment Full R&D and Policy Scenario
Figure 6-31: Solar thermal potential in Spain based on three scenarios13
Figure 6-32 shows the contribution of solar thermal to the Spanish heating and cooling demand by sector in comparison with the development of the overall heating and cooling demand from 2006 to 2050. The figure is based on the assumptions of the RDP scenario. The 2006 baseline shows a total heating and cooling demand of 258 TWh in Spain. In 2006, 0.22% of this demand was provided by solar thermal systems.
Taking energy efficiency measures into account until 2020, the solar fraction will be 5% by 2020. In the medium-term (2030) the solar fraction will be 29%, based on a 4% reduction of the demand compared with the 2006 level. And, in the long-term (2050) the solar fraction will be 63%, based on a 12% reduction of the demand compared with the 2006 level.
13 Definitions see chapter 6.4
Total installed capacity 2005 - 2050 according to the 3 Szenarios - Spain

Potential of Solar Thermal in Europe 94
0,00
50,00
100,00
150,00
200,00
250,00
300,00
[TWh]
Heating/CoolingDemand ES -
2006
Solar Thermal2006
Heat Demand ES- 2020 -1%
Solar Thermal2020
Heat Demand ES- 2030 -4.4%
Solar Thermal2030
Heat Demand ES- 2050 -12%
Solar Thermal2050
Contribution of Solar Thermal to the Spanish Heating and Cooling Demand by Sector Industrial Heat - Low Temp.
Air conditioning ServiceSpace Heating Service
Air conditioning ResidentialWater Heating Residential - MFH
Space Heating Residential - MFHWater Heating Residential - SFH
Space Heating Residential - SFH
63%
29%
5%0,22%
Figure 6-32: Total heating and cooling demand of Spain and contribution of solar thermal by sector according to the Full R&D and Policy scenario
6.5.4 Availability of suitable roof, facade and land area
An important factor for the practicability of the RDP scenario is the availability of suitable roof, facade and land area to install solar collectors. To assess the potential for building integrated solar collectors an analysis of the building stock with respect to suitability of the building envelope for solar thermal collectors was carried out. Based on the results of the report “Potential for Building Integrated Photovoltaics” (IEA PVPS Programme 2001), the roof and facade area needed for the installation of the solar thermal collectors was determined.
Figure 6-33 illustrates the roof and facade area needed for the installation of solar collectors to achieve the requirements of the RDP scenario. To meet the requirements of the RDP scenario about 4.5% of the architecturally suitable roof area14 would be needed by 2020, 26% by 2030 and 49% by 2050. The architecturally suitable façade area that would be needed corresponds to 0.6% by 2020, 7.5% by 2030 and 15% by 2050.
These results show that in terms of the availability of roof and facade area the goals can easily be met. The total areas, which would be suitable for solar energy use in Germany, are shown in Table 6-19 below.
Table 6-19: Suitable areas for solar energy use in Spain (IEA PVPS Programme 2001)
total land area roofs facades [km²] [km²] [km²] [km²]
Ground floor area 29,644 27,400 1122.05 1122.07 Total Suitable area 891 274 448.82 168.31
14 For definition see chapter 6.2.2
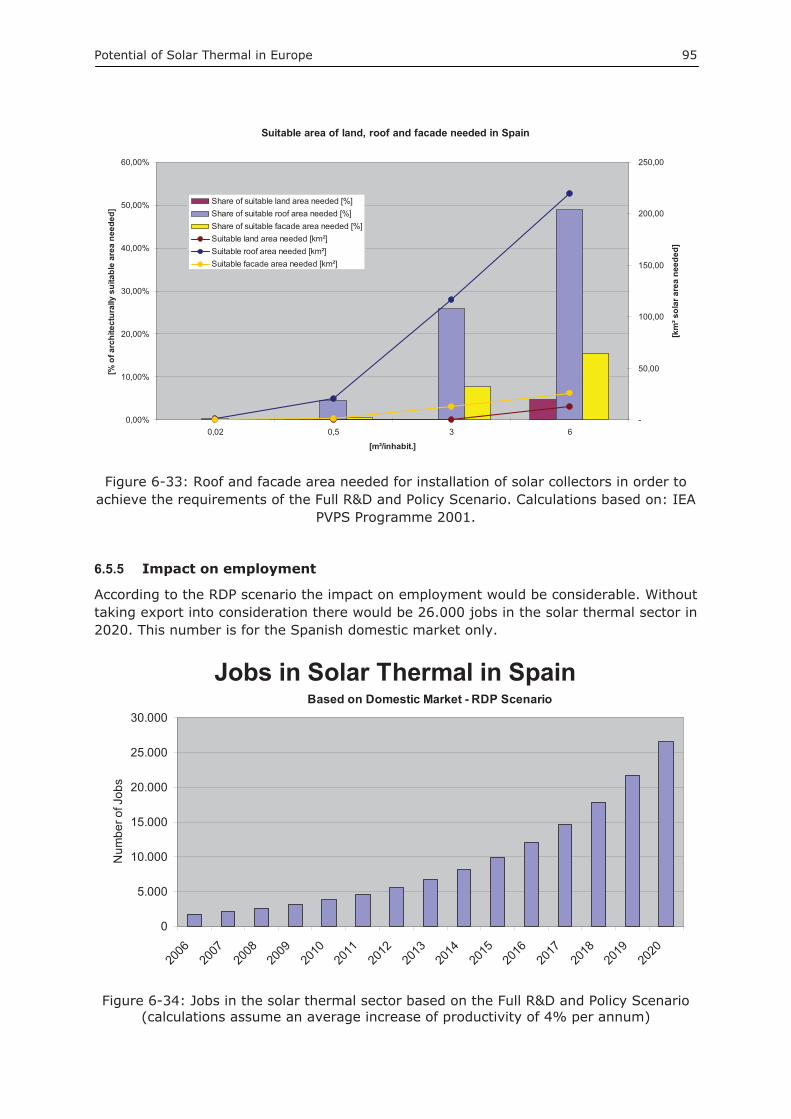
Potential of Solar Thermal in Europe 95
Suitable area of land, roof and facade needed in Spain
0,00%
10,00%
20,00%
30,00%
40,00%
50,00%
60,00%
0,02 0,5 3 6
[m²/inhabit.]
[% o
f arc
hite
ctur
ally
sui
tabl
e ar
ea n
eede
d]
-
50,00
100,00
150,00
200,00
250,00
[km
² sol
ar a
rea
need
ed]
Share of suitable land area needed [%]Share of suitable roof area needed [%]Share of suitable facade area needed [%]Suitable land area needed [km²]Suitable roof area needed [km²]Suitable facade area needed [km²]
Figure 6-33: Roof and facade area needed for installation of solar collectors in order to achieve the requirements of the Full R&D and Policy Scenario. Calculations based on: IEA
PVPS Programme 2001.
6.5.5 Impact on employment
According to the RDP scenario the impact on employment would be considerable. Without taking export into consideration there would be 26.000 jobs in the solar thermal sector in 2020. This number is for the Spanish domestic market only.
Jobs in Solar Thermal in Spain
0
5.000
10.000
15.000
20.000
25.000
30.000
2006
2007
2008
2009
2010
2011
2012
2013
2014
2015
2016
2017
2018
2019
2020
Num
ber o
f Job
s
Based on Domestic Market - RDP Scenario
Figure 6-34: Jobs in the solar thermal sector based on the Full R&D and Policy Scenario (calculations assume an average increase of productivity of 4% per annum)
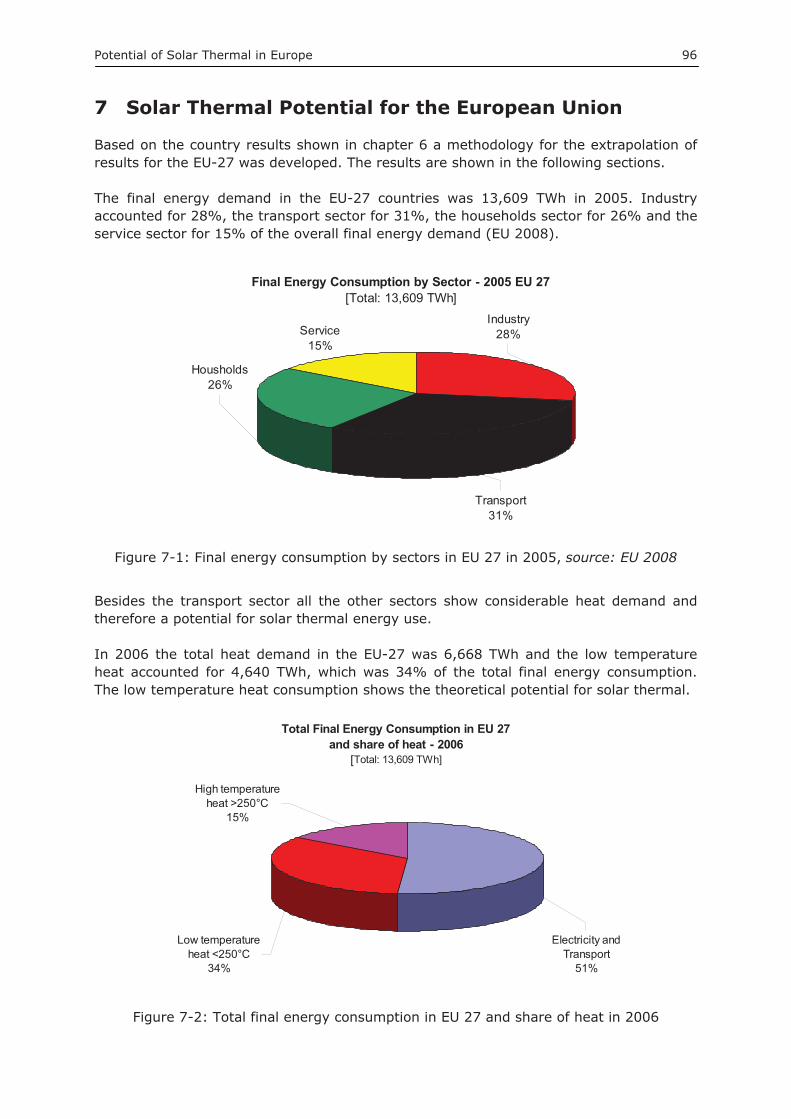
Potential of Solar Thermal in Europe 96
7 Solar Thermal Potential for the European Union
Based on the country results shown in chapter 6 a methodology for the extrapolation of results for the EU-27 was developed. The results are shown in the following sections.
The final energy demand in the EU-27 countries was 13,609 TWh in 2005. Industry accounted for 28%, the transport sector for 31%, the households sector for 26% and the service sector for 15% of the overall final energy demand (EU 2008).
Final Energy Consumption by Sector - 2005 EU 27 [Total: 13,609 TWh]
Service15%
Transport31%
Housholds26%
Industry28%
Figure 7-1: Final energy consumption by sectors in EU 27 in 2005, source: EU 2008
Besides the transport sector all the other sectors show considerable heat demand and therefore a potential for solar thermal energy use.
In 2006 the total heat demand in the EU-27 was 6,668 TWh and the low temperature heat accounted for 4,640 TWh, which was 34% of the total final energy consumption. The low temperature heat consumption shows the theoretical potential for solar thermal.
Total Final Energy Consumption in EU 27 and share of heat - 2006
[Total: 13,609 TWh]
Electricity and Transport
51%
Low temperature heat <250°C
34%
High temperature heat >250°C
15%
Figure 7-2: Total final energy consumption in EU 27 and share of heat in 2006
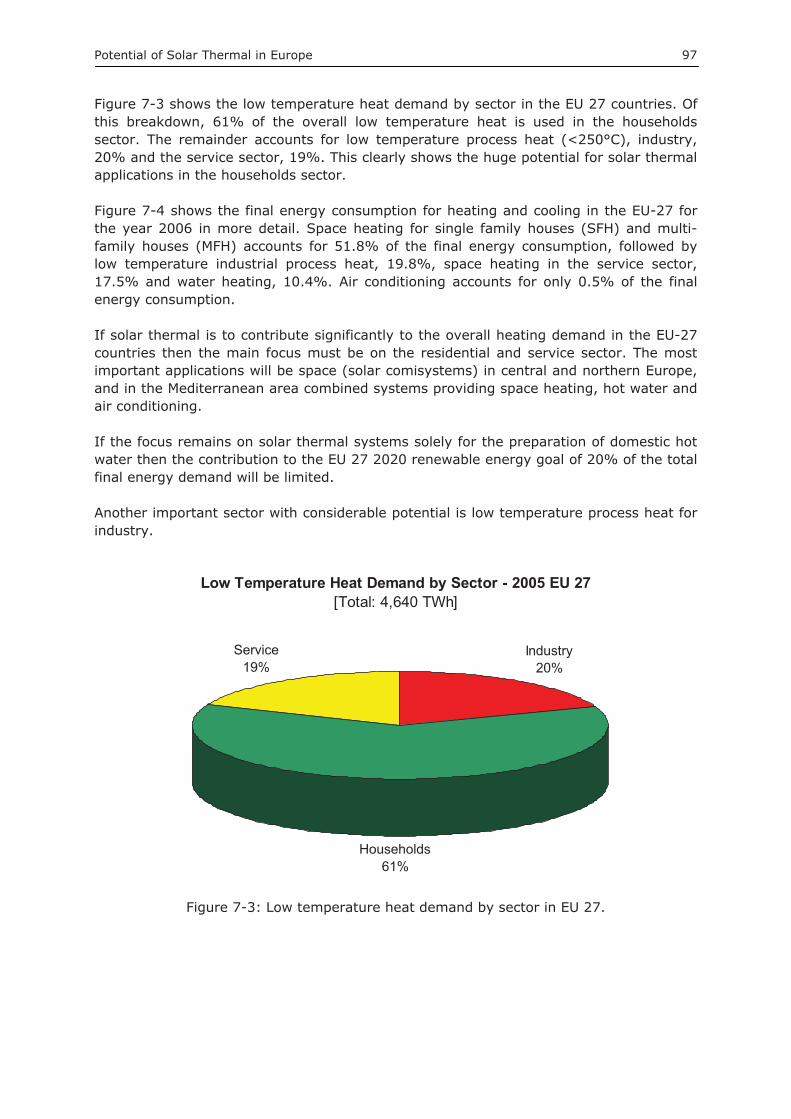
Potential of Solar Thermal in Europe 97
Figure 7-3 shows the low temperature heat demand by sector in the EU 27 countries. Of this breakdown, 61% of the overall low temperature heat is used in the households sector. The remainder accounts for low temperature process heat (<250°C), industry, 20% and the service sector, 19%. This clearly shows the huge potential for solar thermal applications in the households sector.
Figure 7-4 shows the final energy consumption for heating and cooling in the EU-27 for the year 2006 in more detail. Space heating for single family houses (SFH) and multi-family houses (MFH) accounts for 51.8% of the final energy consumption, followed by low temperature industrial process heat, 19.8%, space heating in the service sector, 17.5% and water heating, 10.4%. Air conditioning accounts for only 0.5% of the final energy consumption.
If solar thermal is to contribute significantly to the overall heating demand in the EU-27 countries then the main focus must be on the residential and service sector. The most important applications will be space (solar comisystems) in central and northern Europe, and in the Mediterranean area combined systems providing space heating, hot water and air conditioning.
If the focus remains on solar thermal systems solely for the preparation of domestic hot water then the contribution to the EU 27 2020 renewable energy goal of 20% of the total final energy demand will be limited.
Another important sector with considerable potential is low temperature process heat for industry.
Low Temperature Heat Demand by Sector - 2005 EU 27 [Total: 4,640 TWh]
Industry20%
Households 61%
Service19%
Figure 7-3: Low temperature heat demand by sector in EU 27.
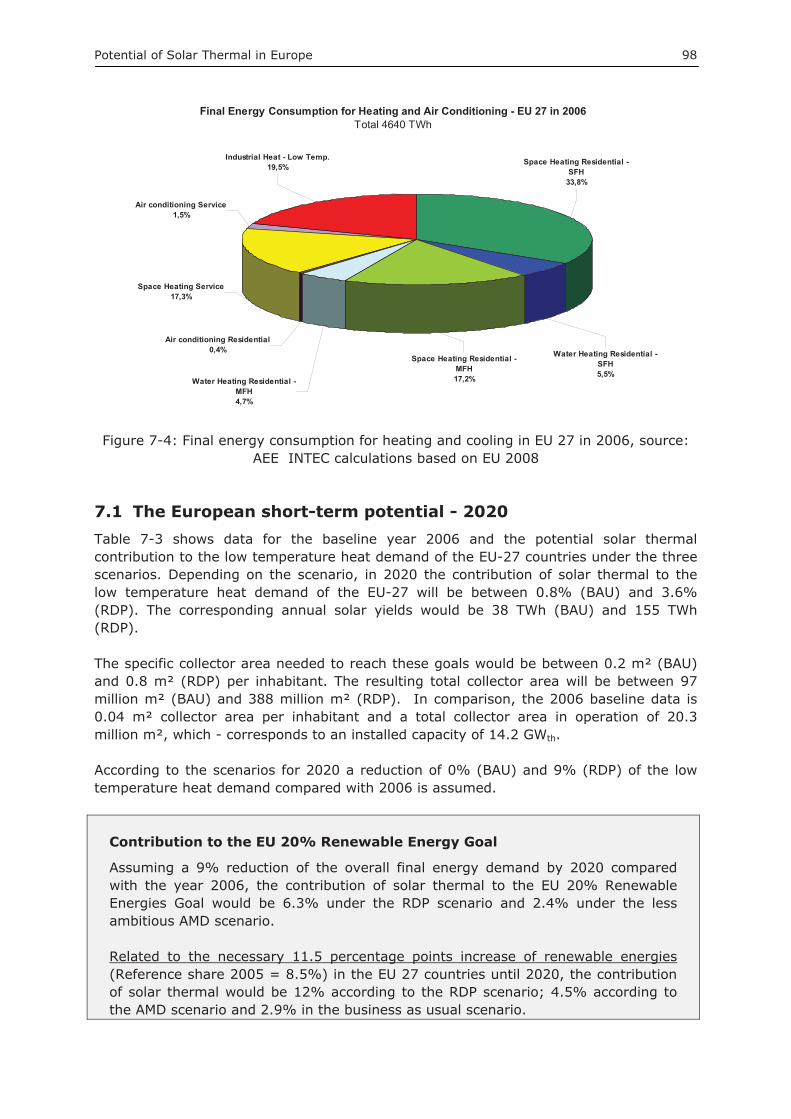
Potential of Solar Thermal in Europe 98
Final Energy Consumption for Heating and Air Conditioning - EU 27 in 2006 Total 4640 TWh
Air conditioning Residential0,4%
Water Heating Residential - MFH4,7%
Space Heating Residential - MFH17,2%
Space Heating Residential - SFH
33,8%
Water Heating Residential - SFH5,5%
Space Heating Service17,3%
Air conditioning Service1,5%
Industrial Heat - Low Temp.19,5%
Figure 7-4: Final energy consumption for heating and cooling in EU 27 in 2006, source: AEE INTEC calculations based on EU 2008
7.1 The European short-term potential - 2020 Table 7-3 shows data for the baseline year 2006 and the potential solar thermal contribution to the low temperature heat demand of the EU-27 countries under the three scenarios. Depending on the scenario, in 2020 the contribution of solar thermal to the low temperature heat demand of the EU-27 will be between 0.8% (BAU) and 3.6% (RDP). The corresponding annual solar yields would be 38 TWh (BAU) and 155 TWh (RDP).
The specific collector area needed to reach these goals would be between 0.2 m² (BAU) and 0.8 m² (RDP) per inhabitant. The resulting total collector area will be between 97 million m² (BAU) and 388 million m² (RDP). In comparison, the 2006 baseline data is 0.04 m² collector area per inhabitant and a total collector area in operation of 20.3 million m², which - corresponds to an installed capacity of 14.2 GWth.
According to the scenarios for 2020 a reduction of 0% (BAU) and 9% (RDP) of the low temperature heat demand compared with 2006 is assumed.
Contribution to the EU 20% Renewable Energy Goal
Assuming a 9% reduction of the overall final energy demand by 2020 compared with the year 2006, the contribution of solar thermal to the EU 20% Renewable Energies Goal would be 6.3% under the RDP scenario and 2.4% under the less ambitious AMD scenario.
Related to the necessary 11.5 percentage points increase of renewable energies(Reference share 2005 = 8.5%) in the EU 27 countries until 2020, the contribution of solar thermal would be 12% according to the RDP scenario; 4.5% according to the AMD scenario and 2.9% in the business as usual scenario.
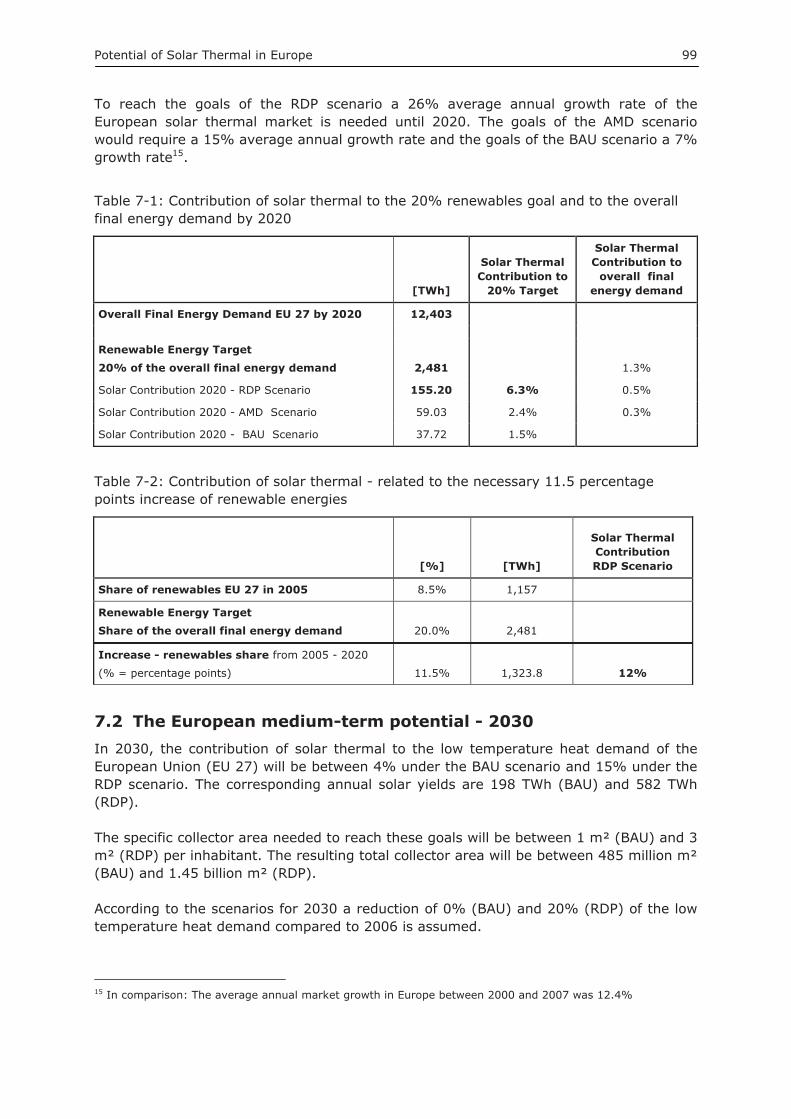
Potential of Solar Thermal in Europe 99
To reach the goals of the RDP scenario a 26% average annual growth rate of the European solar thermal market is needed until 2020. The goals of the AMD scenario would require a 15% average annual growth rate and the goals of the BAU scenario a 7% growth rate15.
Table 7-1: Contribution of solar thermal to the 20% renewables goal and to the overall final energy demand by 2020
[TWh]
Solar Thermal Contribution to
20% Target
Solar Thermal Contribution to
overall final energy demand
Overall Final Energy Demand EU 27 by 2020 12,403
Renewable Energy Target
20% of the overall final energy demand 2,481 1.3%
Solar Contribution 2020 - RDP Scenario 155.20 6.3% 0.5%
Solar Contribution 2020 - AMD Scenario 59.03 2.4% 0.3%
Solar Contribution 2020 - BAU Scenario 37.72 1.5%
Table 7-2: Contribution of solar thermal - related to the necessary 11.5 percentage points increase of renewable energies
[%] [TWh]
Solar Thermal Contribution RDP Scenario
Share of renewables EU 27 in 2005 8.5% 1,157
Renewable Energy Target Share of the overall final energy demand 20.0% 2,481
Increase - renewables share from 2005 - 2020
(% = percentage points) 11.5% 1,323.8 12%
7.2 The European medium-term potential - 2030 In 2030, the contribution of solar thermal to the low temperature heat demand of the European Union (EU 27) will be between 4% under the BAU scenario and 15% under the RDP scenario. The corresponding annual solar yields are 198 TWh (BAU) and 582 TWh (RDP).
The specific collector area needed to reach these goals will be between 1 m² (BAU) and 3 m² (RDP) per inhabitant. The resulting total collector area will be between 485 million m² (BAU) and 1.45 billion m² (RDP).
According to the scenarios for 2030 a reduction of 0% (BAU) and 20% (RDP) of the low temperature heat demand compared to 2006 is assumed.
15 In comparison: The average annual market growth in Europe between 2000 and 2007 was 12.4%
Potential of Solar Thermal in Europe 100
7.3 The European long-term potential - 2050 In 2050, the contribution of solar thermal to the low temperature heat demand of the European Union (EU-27) will be between 8% under the BAU scenario and 47% under the RDP scenario. The corresponding annual solar yields are 391 TWh (BAU) and 1552 TWh (RDP).
The specific collector area needed to reach these goals will be between 2 m² (BAU) and 8 m² (RDP) per inhabitant. The resulting total collector area will be between 970 million m² (BAU) and 3.88 billion square metres (RDP).
According to the scenarios for 2050 a reduction of 0% (BAU) and 31% (RDP) of the low temperature heat demand compared to 2006 is assumed.
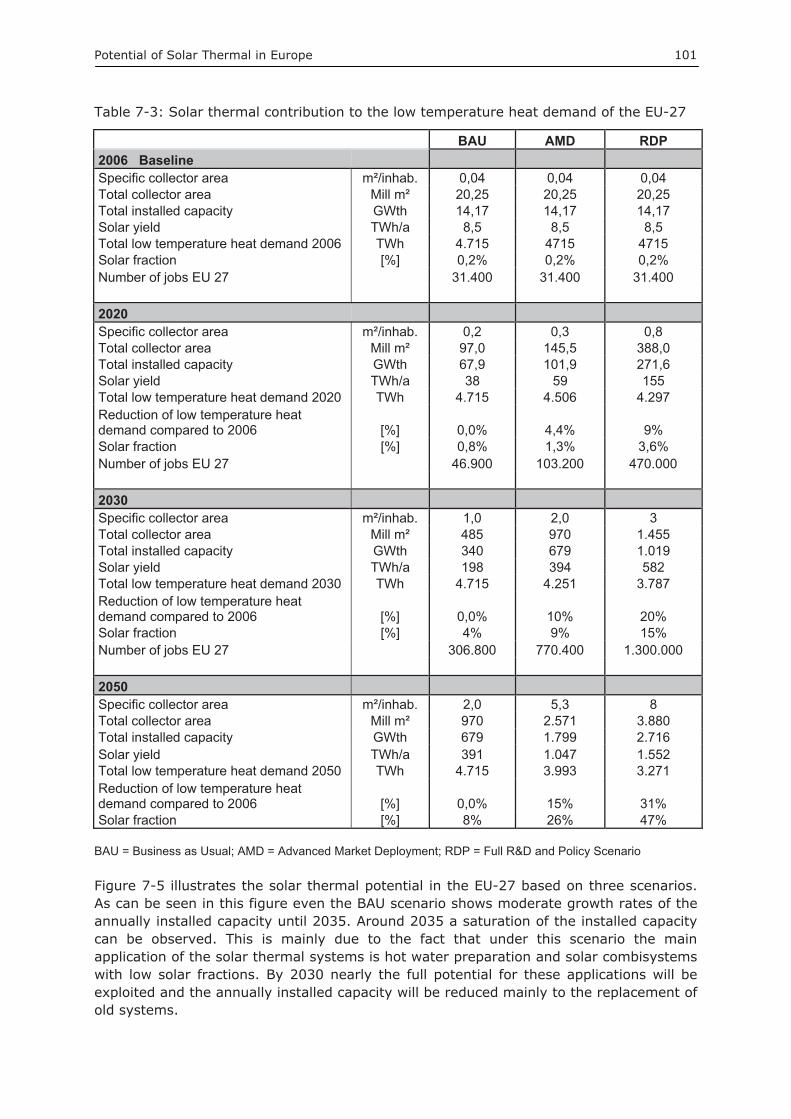
Potential of Solar Thermal in Europe 101
Table 7-3: Solar thermal contribution to the low temperature heat demand of the EU-27
BAU AMD RDP 2006 Baseline Specific collector area m²/inhab. 0,04 0,04 0,04 Total collector area Mill m² 20,25 20,25 20,25 Total installed capacity GWth 14,17 14,17 14,17 Solar yield TWh/a 8,5 8,5 8,5 Total low temperature heat demand 2006 TWh 4.715 4715 4715 Solar fraction [%] 0,2% 0,2% 0,2% Number of jobs EU 27 31.400 31.400 31.400 2020 Specific collector area m²/inhab. 0,2 0,3 0,8 Total collector area Mill m² 97,0 145,5 388,0 Total installed capacity GWth 67,9 101,9 271,6 Solar yield TWh/a 38 59 155 Total low temperature heat demand 2020 TWh 4.715 4.506 4.297 Reduction of low temperature heat demand compared to 2006 [%] 0,0% 4,4% 9% Solar fraction [%] 0,8% 1,3% 3,6% Number of jobs EU 27 46.900 103.200 470.000 2030 Specific collector area m²/inhab. 1,0 2,0 3 Total collector area Mill m² 485 970 1.455 Total installed capacity GWth 340 679 1.019 Solar yield TWh/a 198 394 582 Total low temperature heat demand 2030 TWh 4.715 4.251 3.787 Reduction of low temperature heat demand compared to 2006 [%] 0,0% 10% 20% Solar fraction [%] 4% 9% 15% Number of jobs EU 27 306.800 770.400 1.300.000 2050 Specific collector area m²/inhab. 2,0 5,3 8 Total collector area Mill m² 970 2.571 3.880 Total installed capacity GWth 679 1.799 2.716 Solar yield TWh/a 391 1.047 1.552 Total low temperature heat demand 2050 TWh 4.715 3.993 3.271 Reduction of low temperature heat demand compared to 2006 [%] 0,0% 15% 31% Solar fraction [%] 8% 26% 47%
BAU = Business as Usual; AMD = Advanced Market Deployment; RDP = Full R&D and Policy Scenario
Figure 7-5 illustrates the solar thermal potential in the EU-27 based on three scenarios. As can be seen in this figure even the BAU scenario shows moderate growth rates of the annually installed capacity until 2035. Around 2035 a saturation of the installed capacity can be observed. This is mainly due to the fact that under this scenario the main application of the solar thermal systems is hot water preparation and solar combisystems with low solar fractions. By 2030 nearly the full potential for these applications will be exploited and the annually installed capacity will be reduced mainly to the replacement of old systems.
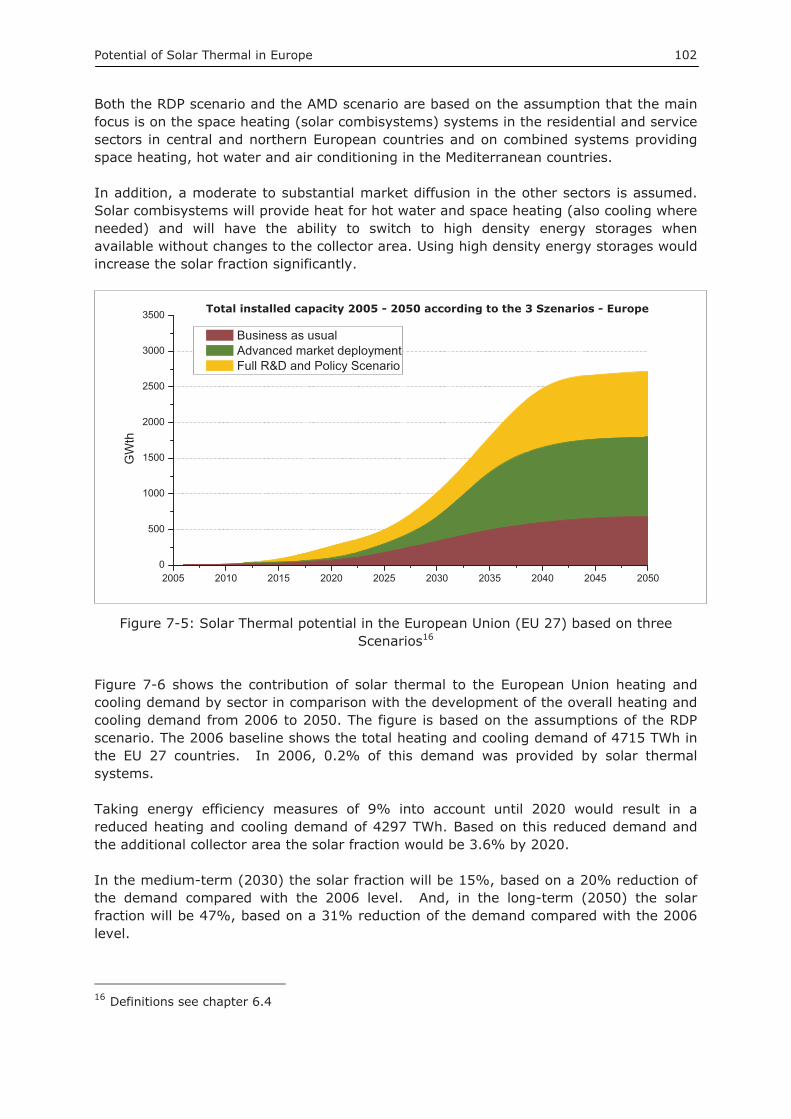
Potential of Solar Thermal in Europe 102
Both the RDP scenario and the AMD scenario are based on the assumption that the main focus is on the space heating (solar combisystems) systems in the residential and service sectors in central and northern European countries and on combined systems providing space heating, hot water and air conditioning in the Mediterranean countries.
In addition, a moderate to substantial market diffusion in the other sectors is assumed. Solar combisystems will provide heat for hot water and space heating (also cooling where needed) and will have the ability to switch to high density energy storages when available without changes to the collector area. Using high density energy storages would increase the solar fraction significantly.
2005 2010 2015 2020 2025 2030 2035 2040 2045 20500
500
1000
1500
2000
2500
3000
3500 Market Development 2005 - 2050 according to 3 Szenarios - Europe
GW
th
Business as usual Advanced market deployment Full R&D and Policy Scenario
Figure 7-5: Solar Thermal potential in the European Union (EU 27) based on three Scenarios16
Figure 7-6 shows the contribution of solar thermal to the European Union heating and cooling demand by sector in comparison with the development of the overall heating and cooling demand from 2006 to 2050. The figure is based on the assumptions of the RDP scenario. The 2006 baseline shows the total heating and cooling demand of 4715 TWh in the EU 27 countries. In 2006, 0.2% of this demand was provided by solar thermal systems.
Taking energy efficiency measures of 9% into account until 2020 would result in a reduced heating and cooling demand of 4297 TWh. Based on this reduced demand and the additional collector area the solar fraction would be 3.6% by 2020.
In the medium-term (2030) the solar fraction will be 15%, based on a 20% reduction of the demand compared with the 2006 level. And, in the long-term (2050) the solar fraction will be 47%, based on a 31% reduction of the demand compared with the 2006 level.
16 Definitions see chapter 6.4
Total installed capacity 2005 - 2050 according to the 3 Szenarios - Europe
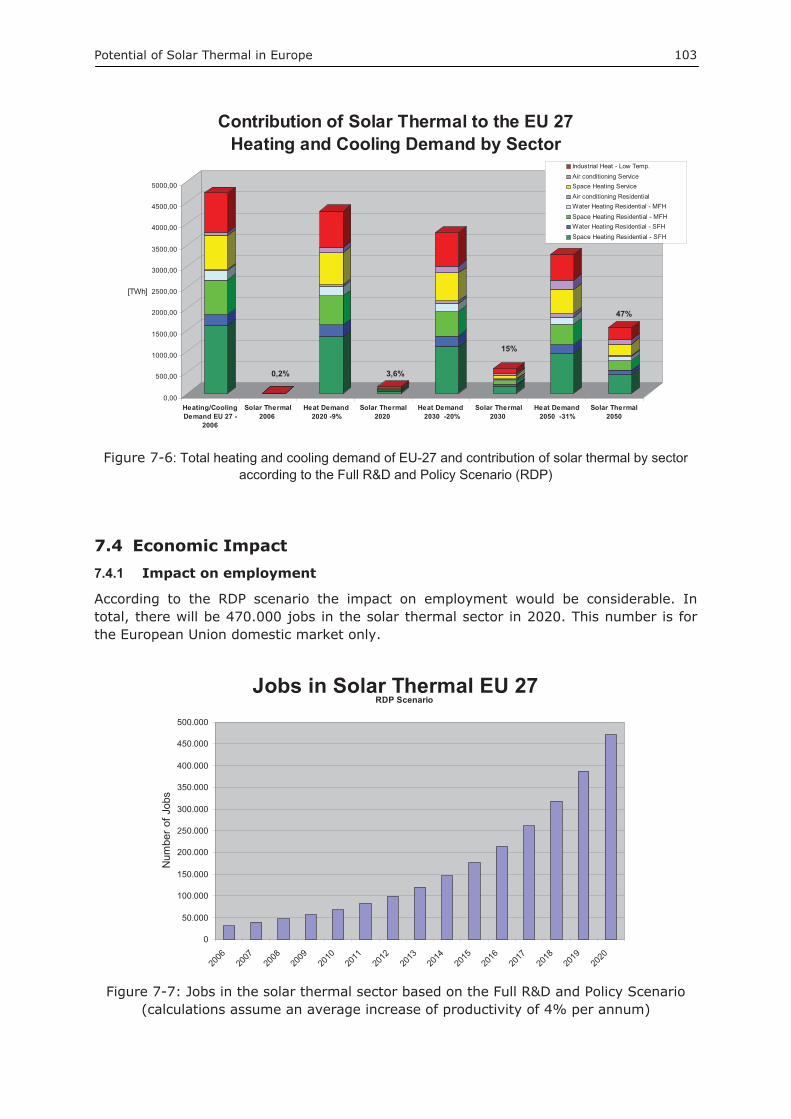
Potential of Solar Thermal in Europe 103
0,00
500,00
1000,00
1500,00
2000,00
2500,00
3000,00
3500,00
4000,00
4500,00
5000,00
[TWh]
Heating/CoolingDemand EU 27 -
2006
Solar Thermal2006
Heat Demand2020 -9%
Solar Thermal2020
Heat Demand 2030 -20%
Solar Thermal2030
Heat Demand2050 -31%
Solar Thermal2050
Contribution of Solar Thermal to the EU 27 Heating and Cooling Demand by Sector
Industrial Heat - Low Temp.Air conditioning ServiceSpace Heating ServiceAir conditioning ResidentialWater Heating Residential - MFHSpace Heating Residential - MFHWater Heating Residential - SFHSpace Heating Residential - SFH
Figure 7-6: Total heating and cooling demand of EU-27 and contribution of solar thermal by sector according to the Full R&D and Policy Scenario (RDP)
7.4 Economic Impact 7.4.1 Impact on employment
According to the RDP scenario the impact on employment would be considerable. In total, there will be 470.000 jobs in the solar thermal sector in 2020. This number is for the European Union domestic market only.
Jobs in Solar Thermal EU 27
0
50.000
100.000
150.000
200.000
250.000
300.000
350.000
400.000
450.000
500.000
2006
2007
2008
2009
2010
2011
2012
2013
2014
2015
2016
2017
2018
2019
2020
Num
ber o
f Job
s
RDP Scenario
Figure 7-7: Jobs in the solar thermal sector based on the Full R&D and Policy Scenario (calculations assume an average increase of productivity of 4% per annum)
0,2% 3,6%
15%
47%
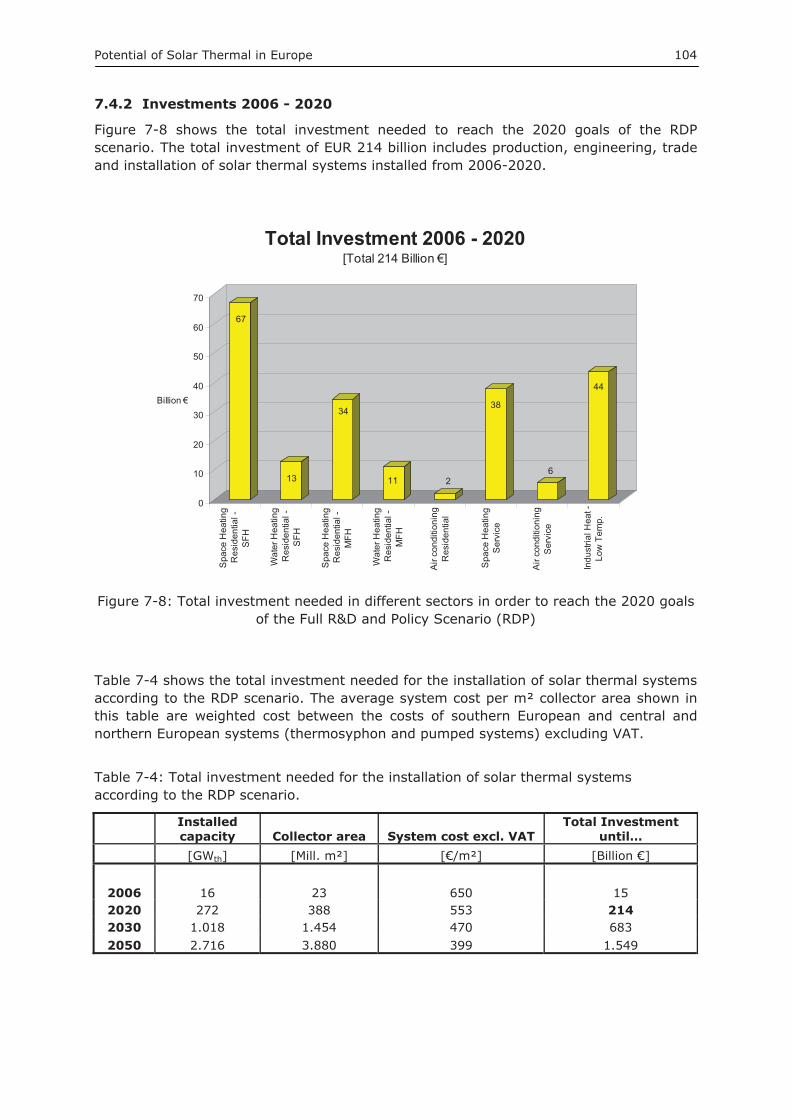
Potential of Solar Thermal in Europe 104
7.4.2 Investments 2006 - 2020
Figure 7-8 shows the total investment needed to reach the 2020 goals of the RDP scenario. The total investment of EUR 214 billion includes production, engineering, trade and installation of solar thermal systems installed from 2006-2020.
67
13
34
11 2
38
6
44
0
10
20
30
40
50
60
70
Billion €
Spa
ce H
eatin
gR
esid
entia
l -S
FH
Wat
er H
eatin
gR
esid
entia
l -S
FH
Spa
ce H
eatin
gR
esid
entia
l -M
FH
Wat
er H
eatin
gR
esid
entia
l -M
FH
Air
cond
ition
ing
Res
iden
tial
Spa
ce H
eatin
gS
ervi
ce
Air
cond
ition
ing
Ser
vice
Indu
stria
l Hea
t -Lo
w T
emp.
Total Investment 2006 - 2020 [Total 214 Billion €]
Figure 7-8: Total investment needed in different sectors in order to reach the 2020 goals of the Full R&D and Policy Scenario (RDP)
Table 7-4 shows the total investment needed for the installation of solar thermal systems according to the RDP scenario. The average system cost per m² collector area shown in this table are weighted cost between the costs of southern European and central and northern European systems (thermosyphon and pumped systems) excluding VAT.
Table 7-4: Total investment needed for the installation of solar thermal systems according to the RDP scenario.
Installedcapacity Collector area System cost excl. VAT
Total Investment until…
[GWth] [Mill. m²] [€/m²] [Billion €]
2006 16 23 650 15 2020 272 388 553 214 2030 1.018 1.454 470 683 2050 2.716 3.880 399 1.549
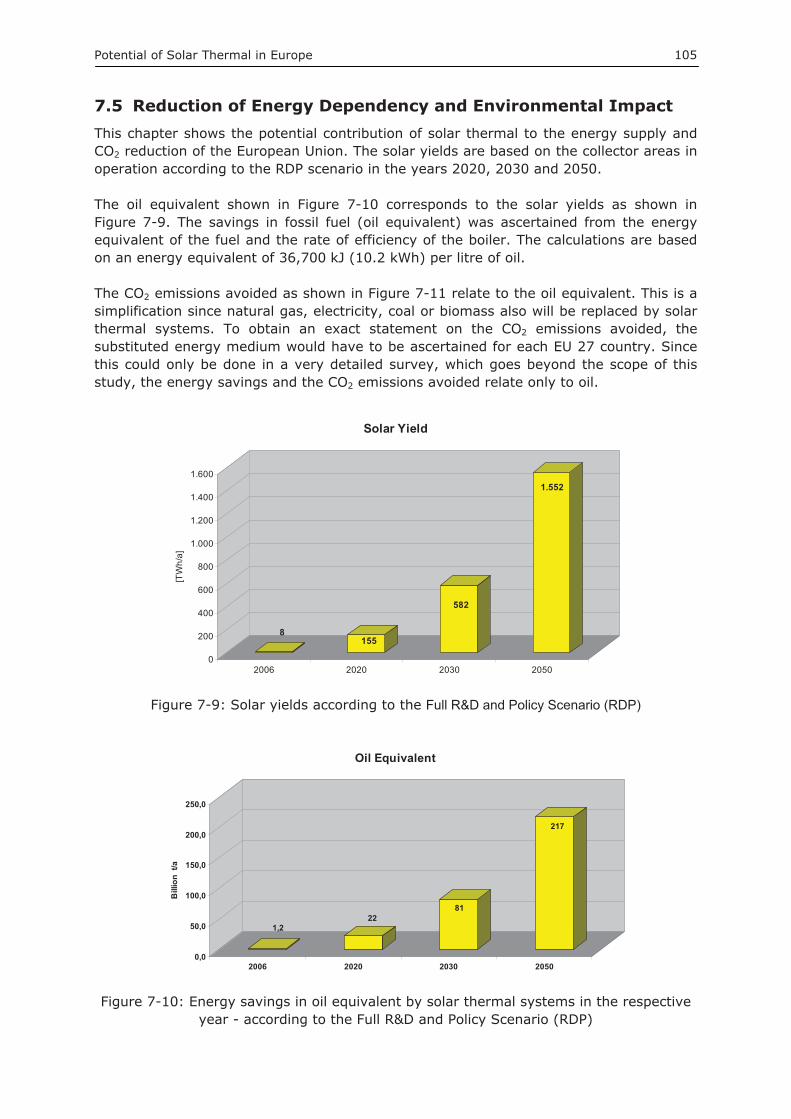
Potential of Solar Thermal in Europe 105
7.5 Reduction of Energy Dependency and Environmental Impact This chapter shows the potential contribution of solar thermal to the energy supply and CO2 reduction of the European Union. The solar yields are based on the collector areas in operation according to the RDP scenario in the years 2020, 2030 and 2050.
The oil equivalent shown in Figure 7-10 corresponds to the solar yields as shown in Figure 7-9. The savings in fossil fuel (oil equivalent) was ascertained from the energy equivalent of the fuel and the rate of efficiency of the boiler. The calculations are based on an energy equivalent of 36,700 kJ (10.2 kWh) per litre of oil.
The CO2 emissions avoided as shown in Figure 7-11 relate to the oil equivalent. This is a simplification since natural gas, electricity, coal or biomass also will be replaced by solar thermal systems. To obtain an exact statement on the CO2 emissions avoided, the substituted energy medium would have to be ascertained for each EU 27 country. Since this could only be done in a very detailed survey, which goes beyond the scope of this study, the energy savings and the CO2 emissions avoided relate only to oil.
8155
582
1.552
0
200
400
600
800
1.000
1.200
1.400
1.600
[TW
h/a]
2006 2020 2030 2050
Solar Yield
Figure 7-9: Solar yields according to the Full R&D and Policy Scenario (RDP)
1,222
81
217
0,0
50,0
100,0
150,0
200,0
250,0
Bill
ion
t/a
2006 2020 2030 2050
Oil Equivalent
Figure 7-10: Energy savings in oil equivalent by solar thermal systems in the respective year - according to the Full R&D and Policy Scenario (RDP)
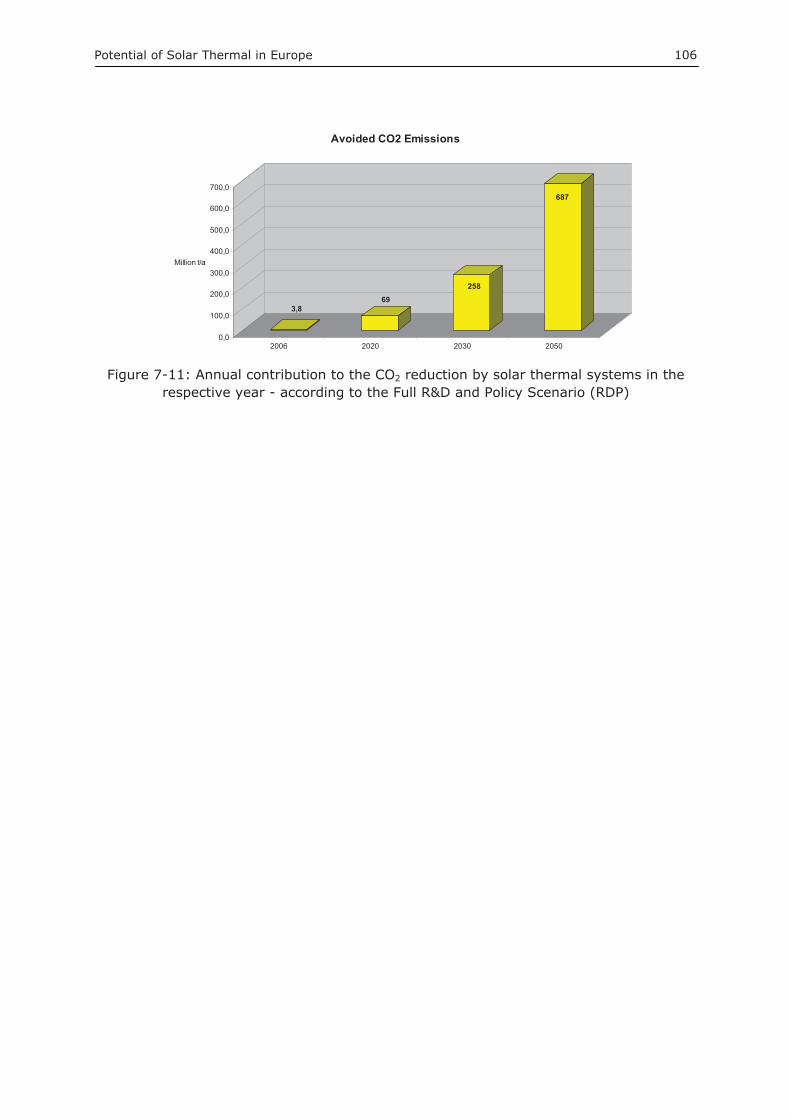
Potential of Solar Thermal in Europe 106
3,869
258
687
0,0
100,0
200,0
300,0
400,0
500,0
600,0
700,0
Million t/a
2006 2020 2030 2050
Avoided CO2 Emissions
Figure 7-11: Annual contribution to the CO2 reduction by solar thermal systems in the respective year - according to the Full R&D and Policy Scenario (RDP)
Potential of Solar Thermal in Europe 107
8 References
CEPE, 2007, Der Energieverbrauch der Dienstleistungen und der Landwirtschaft 1990-2035, Eidgenössisches Departement für Umwelt, Verkehr, Energie und Kommunikation UVEK, März 2007.
COM 2006, 2007, Communication from the Commission to the Council and the European Parliament: Renewable Energy Road Map, COM (2006) 848 final, Brussels, 10.01.2007.
COM 2008, Commission of the European Communities, Proposal for a Directive of the European Parliament and of the Council on the Promotion of the use of Energy from Renewable Sources, version 15.4, Brussels, 23.01.2008.
Dalenbäck 2007, Jan-Olof Dalenbäck, ESTTP report on solar district heating and cooling, 2007.
EECCAC 2003, Energy Efficiency and Certification of Central Air Conditioners, Final Report - April 2003, Volume 1, EU SAVE Programme.
EIA 2007, International Energy Outlook 2007, Energy Information Administration, Office of Integrated Analysis and Forecasting, U.S. Department of Energy, May 2007.
ESTIF 2008, Solar Thermal Markets in Europe, Trends and Market Statistics 2007, Brussels, June 2008.
EU 2008, EU Energy and Transport in Figures, Statistical Pocketbook 2007/2008 Directorate-General for Energy and Transport.
Haas R. et al. 2007, Heat and Cold from Renewables 2030, research project of the Energy Economics Group, Technical University of Vienna (in German language) for the Wirtschaftskammer Österreich.
Henning H.M. 2008, Internal Data - Fraunhofer Institute for Solar Energy Systems, Freiburg.
IEA PVPS Programme 2001, Potential for Building Integrated Photovoltaics, Report IEA - PVPS T7-4, IEA Photovoltaic Power Systems Programme.
IEA 2007, Renewables for Heating and Cooling, International Energy Agency, OECD/IEA 2007.
Jakob Martin, Giacomo Catenazzi, Eberhard Jochem, Ashish Shukla, 2008, Impact of climate change in the tertiary sector of Europe (EU27+2), Centre for Energy Policy and Economics (CEPE), ETH Zürich.
Nitsch Joachim, 2008, Leitstudie 2008, Weiterentwicklung der Ausbaustrategie Erneuerbare Energien vor dem Hintergrund der aktuellen Klimaschutzziele Deutschlands und Europas, Bundesministerium für Umwelt, Naturschutz und Reaktorsicherheit.

Potential of Solar Thermal in Europe 108
Weiss et al, 2008, Solar Heat Worldwide, Markets and Contribution to the Energy Supply 2006, IEA Solar Heating and Cooling Programme, 2008.
NRDLINK 4.1, Energy Data Base of the EU Odyssee Project.
For more information, please contact:
European Solar Thermal Industry Federation (ESTIF)Renewable Energy HouseRue d’ Arlon 63-67B-1040 BrusselsBelgium
Tel: +32 2 546 19 89Fax: +32 2 546 19 39
E-mail: [email protected]: www.estif.org
Pict
ures
cou
rtes
y of
: TiS
UN
Gm
bH, V
iridi
an S
olar