wepa outlook on water environmental management in asia … · wepa outlook on water environmental...
TRANSCRIPT

Ministry of the Environment
2012WEPA Outlook onWater EnvironmentalManagement


WEPAOutlook on Water Environmental
Management in Asia 2012
Water Environment Partnership in Asia (WEPA)
Ministry of the Environment, JapanInstitute for Global Environmental Strategies (IGES)

Outlook on Water Environmental Management in Asia 2012Copyright © 2012 Ministry of the Environment, Japan. All rights reserved.
No parts of this publication may be reproduced or transmitted in any form or by any means, electronic or mechanical, including photocopying, recording, or any information storage and retrieval system, without prior permission in writing from Ministry of the Environment Japan through the Institute for Global Environment Strategies (IGES), which serves as the WEPA Secretariat.
ISBN: 978-4-88788-108-2
This publication is made as a part of WEPA and published by the Institute for Global Environmental Strategies (IGES).Although every effort is made to ensure objectivity and balance, the publication of study results does not imply WEPA partner country’s endorsement or acquiescence with its conclusions.
Ministry of the Environment, Japan1-2-2 Kasumigaseki, Chiyoda-ku, Tokyo, 100-8795, JapanTel: +81-(0)3-3581-3351 http://www.env.go.jp/en/
Institute for Global Environmental Strategies (IGES)2108-11 Kamiyamaguchi, Hayama, Kanagawa, 240-0115, JapanTel: +81-(0)46-855-3700http://www.iges.or.jp/
The research team for WEPA Outlook 2012includes the following IGES members:
[Drafting team]Yatsuka Kataoka, Director, Freshwater Sub-groupTetsuo Kuyama, Policy Researcher, Freshwater Sub-groupAyumi Goto, Research Associate, Freshwater Sub-groupBijon Kumer Mitra, Associate Researcher, Freshwater Sub-groupBhim Nath Acharya, Policy Researcher, Freshwater Sub-group
[Supporting team]Binaya Raj Shivakoti, Policy Researcher, Freshwater Sub-groupKumiko Yokoyama, Administrative Assistant, Freshwater Sub-groupAyako Hongo, Group Administrator, Freshwater Sub-group
Printed in Japan
Table of Contents
Background to the Publication ...................................................................................................................................................................................................................................................................................................... 5
Message from WEPA: Water Quality Challenges in Asia for a Sustainable Future ...................................................................... 6
Acknowledgements ..................................................................................................................................................................................................................................................................................................................................................... 9
Abbreviations ............................................................................................................................................................................................................................................................................................................................................................................... 11
[ Chapter 1 ] Outlook on Water Environmental Management in WEPA countries ....................................................................... 13
[ Chapter 2 ] Discussion and Findings on Priority Topics ....................................................................................................................................................................................... 29
2.1 Domestic Wastewater Treatment in Asia ........................................................................................................................................................................................................................................... 30
2.2 Climate Change and the Water Environment - Summary of findings based on WEPA discussions and surveys - ............... 42
[ Chapter 3] Country Profiles of Water Environmental Management in WEPA Countries ................................... 51
3.1 Cambodia ................................................................................................................................................................................................................................................................................................................................................................... 52
3.2 China ..................................................................................................................................................................................................................................................................................................................................................................................... 58
3.3 Indonesia ...................................................................................................................................................................................................................................................................................................................................................................... 64
3.4 Japan ....................................................................................................................................................................................................................................................................................................................................................................................... 70
3.5 Republic of Korea ..................................................................................................................................................................................................................................................................................................................................... 76
3.6 Lao PDR ........................................................................................................................................................................................................................................................................................................................................................................ 82
3.7 Malaysia ........................................................................................................................................................................................................................................................................................................................................................................... 88
3.8 Myanmar ...................................................................................................................................................................................................................................................................................................................................................................... 94
3.9 Nepal .................................................................................................................................................................................................................................................................................................................................................................................... 98
3.10 Philippines ............................................................................................................................................................................................................................................................................................................................................................ 102
3.11 Sri Lanka ................................................................................................................................................................................................................................................................................................................................................................... 108
3.12 Thailand ..................................................................................................................................................................................................................................................................................................................................................................... 114
3.13 Viet Nam ................................................................................................................................................................................................................................................................................................................................................................ 120
Appendix ............................................................................................................................................................................................................................................................................................................................................................................................ 127
Selected social, economic and water related indicators in WEPA partner countries ........................................................................................ 128
References ...................................................................................................................................................................................................................................................................................................................................................................................... 131
3

4
Background to the Publication
Recognizing the critical situation of water quality in Asia, the Water Environment Partnership in Asia (WEPA) was proposed by the Ministry of the Environment of Japan at the 3rd World Water Forum in 2003. WEPA aims to strengthen water environmental governance in Asia through the collection and dissemination of information and capacity development of relevant stakeholders in partnership with thirteen partner countries in the region, namely Cambodia, China, Indonesia, Japan, Republic of Korea, Lao PDR, Malaysia, Myanmar, Nepal, Philippines, Sri Lanka, Thailand and Viet Nam. WEPA is a forum which allows partner countries to discuss their experiences and identify potential solutions to improve the water environment.
Considering the importance of extracting information on water environment and management, “WEPA Outlook on Water Environmental Management” has been designed to provide basic information on the status and management of the water environment in each WEPA partner country, and to make this information available to the public in one platform as a source of knowledge to promote good water quality governance in the region. The Outlook, which was first published during the 5th World Water Forum in 2009, may also serve as a useful reference for those who are striving to solve water quality issues in other countries in the world.
“WEPA Outlook on Water Environmental Management 2012”, which is the second edition of the series, consists of three main chapters. Chapter 1 presents the result of the analysis of institutional frameworks for water environment management in each country. Chapter 2 summarizes the discussions and studies conducted on the two priority issues of “domestic wastewater treatment” and “climate change and the water environment”. The third chapter provides updated country profiles on water environmental management in the WEPA partner countries. It also presents WEPA’s message which introduces the key actions identified and future commitments made in discussions held at WEPA annual meetings and dialogues.
The report, a major output of the WEPA activities by all partner countries, intends to stimulate dialogue around the issues on water environment. The WEPA Outlook 2012 is published at the 6th World Water Forum, which is held in March 2012 in Marseille, France, and where WEPA was registered as one of the “Solutions for Water.” We wish the Outlook to serve as a useful reference for those interested in the issues in Asia including the participants of the 2nd Asia Pacific Water Summit, and in other parts of the world to accomplish our mutual goal of sustainable water environment.
March 2012
Ministry of the Environment, JapanInstitute for Global Environmental Strategies (WEPA Secretariat)
5
WEPA Outlook on Water Environmental Management in Asia 2012

Message from WEPA:Water Quality Challenges in Asia for a Sustainable Future
Significant pressure and risks to the water environment in the region1. While diverse, Asian countries also share similarities in climatic and
natural conditions and cultural backgrounds. In general, people in the region enjoy many of the benefits provided by water. Nevertheless, they also suffer from seasonal fluctuations in water volume at both ends of the spectrum, such as from floods and droughts.
2. Over the past few decades, Asia has been a focal point for the world’s rapid growth, demonstrating a 120% increase in GDP in the region and accounting for 60% of the world’s population growth. Rapid urbanization and the swift increase in population and economic development that are associated with unsustainable development practices have resulted in intense pressure on water resources both in quantity and quality, as well as on aquatic ecosystems in the region.
Accelerate water environmental management to safeguard the water environment3. Significant time and resources must be invested to improve water
quality and restore aquatic ecosystems once destroyed. Therefore, it is of the utmost importance to strengthen water quality management in areas where water environmental deterioration has been observed, and to promote and ensure development and implementation of water environmental management at regional, national and local levels without delay in order to minimize the impacts of human activities on the water environment. The key to our sustainable future is ensuring a sound water environment.
Water Environment Partnership in Asia (WEPA)4. Considering the critical situation of the water environment in the region, the Water Environment Partnership
in Asia (WEPA) was proposed by the Ministry of the Environment of Japan at the 3rd World Water Forum in 2003. The programme, launched in 2004 with the participation of 11 Asian countries: Cambodia, China, Indonesia, Japan, Republic of Korea, Lao PDR, Malaysia, Myanmar, the Philippines, Thailand, and Viet Nam, is a forum which allows partner countries to discuss their experiences and identify potential solutions to improve the water environment. In 2009, WEPA membership expanded to include Nepal and Sri Lanka.
5. Reaffirming that the sound management of the water environment is necessary for the sustainable development of Asia, as well as to achieve the Millennium Development Goals (MDGs), and recalling discussions within WEPA for better water environment, WEPA partners hereby deliver the following key messages to those residing in the region and to stakeholders worldwide to promote a sustainable water environment in Asia and the Pacific, and commit to upholding efforts to improve the condition of the world’s water environment through WEPA activities.
6

Key messages6. Between 1980 and 1990, in particular, most WEPA partner countries established frameworks for sound
water environmental management, set goals for water environmental management and implemented various measures to improve water pollution. Thanks to these efforts, a number of WEPA partner countries were able to observe significant improvement in water quality.
7. Despite this, organic pollution in rivers located in populated areas and eutrophication in enclosed water bodies such as lakes, reservoirs and estuaries continue to require special attention. Considering economic development, population growth and urbanization observed in the region and the possible impacts of climate change, further intensified efforts are necessary to guarantee the implementation of water environmental policies to secure human health, sustainability of ecosystems, and promotion of sustainable development in the region.
Key action areas in water environmental management8. WEPA partner countries identified the following common action areas to be promoted in each
country to set and/or attain the water quality goals of each country.
a) Review laws, regulations, and setting of standards in consideration of socio-economic conditions and the current state of the water environment, such as effluent standards taking into account the structure of industries and quality of effluents.
b) Strengthen local management of the water environment such through the establishment of water environmental management strategies and action plans at the basin level.
c) Improve/strengthen the scientific basis for policy making such as the establishment of effective monitoring systems within limited budgets and the improvement of data storage systems.
d) Strengthen the control of water pollution sources such as through the promotion of adequate domestic wastewater treatment and the introduction/implementation of total pollution control load systems.
e) Stipulate polluter pays principle in water quality management and utilize market-based instruments as an incentive for compliance.
f ) Promote institutional and technical capacity building of organizations in charge of water environmental management at national and local levels.
g) Promote participation of the private sector, civil society and communities in water management and improve environmental awareness.
Preparation for the potential impacts of climate change9. The impacts of climate change to the water environment is one of the myriad mid- and long-term challenges
facing the region, although there is as yet little scientific proof on which to base actions. To prepare for potential impacts, however, “no-regret responses” should be taken such as ensuring regular water quality monitoring and improving data collection and exchange systems. At the international and regional level, it is also important to share scientific knowledge and possible adaptation options.
7
WEPA Outlook on Water Environmental Management in Asia 2012
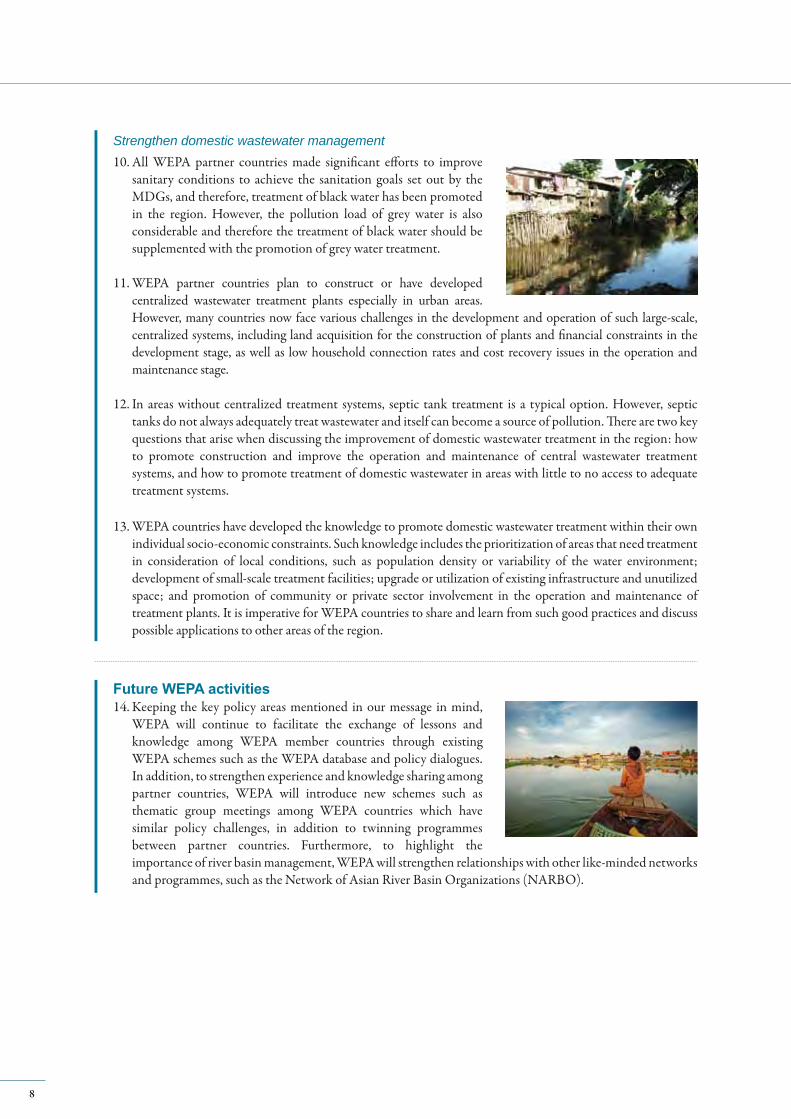
Strengthen domestic wastewater management10. All WEPA partner countries made significant efforts to improve
sanitary conditions to achieve the sanitation goals set out by the MDGs, and therefore, treatment of black water has been promoted in the region. However, the pollution load of grey water is also considerable and therefore the treatment of black water should be supplemented with the promotion of grey water treatment.
11. WEPA partner countries plan to construct or have developed centralized wastewater treatment plants especially in urban areas. However, many countries now face various challenges in the development and operation of such large-scale, centralized systems, including land acquisition for the construction of plants and financial constraints in the development stage, as well as low household connection rates and cost recovery issues in the operation and maintenance stage.
12. In areas without centralized treatment systems, septic tank treatment is a typical option. However, septic tanks do not always adequately treat wastewater and itself can become a source of pollution. There are two key questions that arise when discussing the improvement of domestic wastewater treatment in the region: how to promote construction and improve the operation and maintenance of central wastewater treatment systems, and how to promote treatment of domestic wastewater in areas with little to no access to adequate treatment systems.
13. WEPA countries have developed the knowledge to promote domestic wastewater treatment within their own individual socio-economic constraints. Such knowledge includes the prioritization of areas that need treatment in consideration of local conditions, such as population density or variability of the water environment; development of small-scale treatment facilities; upgrade or utilization of existing infrastructure and unutilized space; and promotion of community or private sector involvement in the operation and maintenance of treatment plants. It is imperative for WEPA countries to share and learn from such good practices and discuss possible applications to other areas of the region.
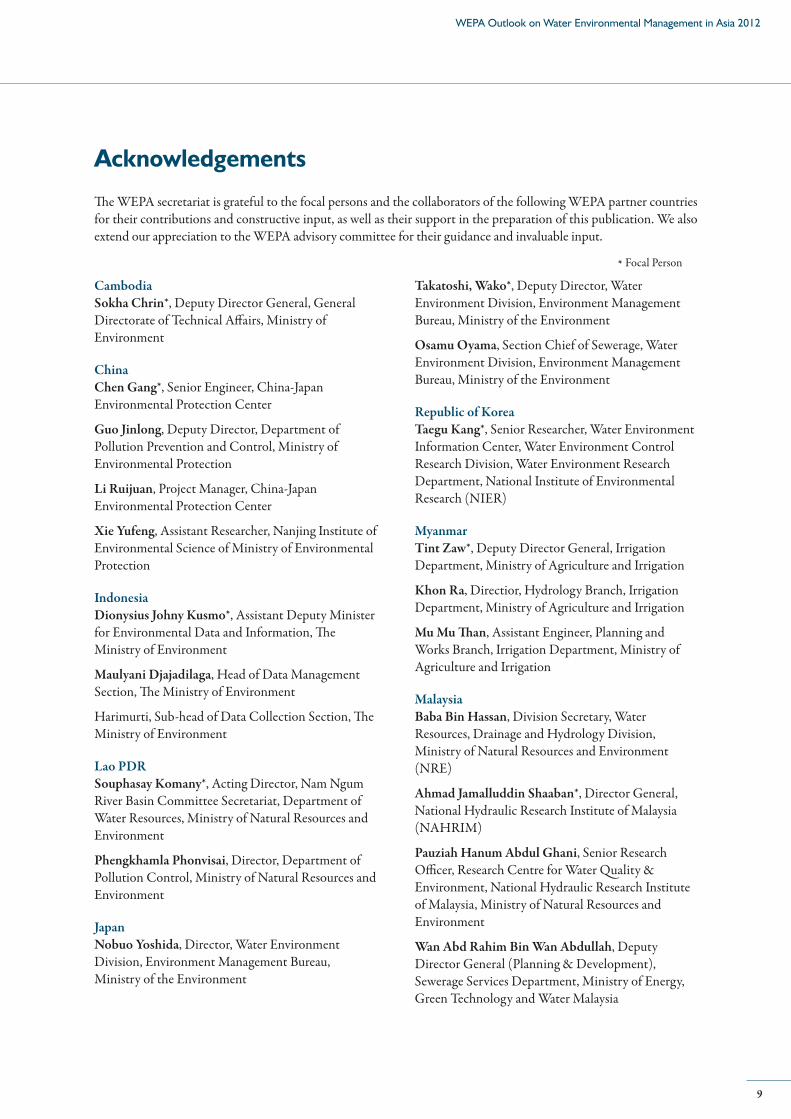
Future WEPA activities14. Keeping the key policy areas mentioned in our message in mind,
WEPA will continue to facilitate the exchange of lessons and knowledge among WEPA member countries through existing WEPA schemes such as the WEPA database and policy dialogues. In addition, to strengthen experience and knowledge sharing among partner countries, WEPA will introduce new schemes such as thematic group meetings among WEPA countries which have similar policy challenges, in addition to twinning programmes between partner countries. Furthermore, to highlight the importance of river basin management, WEPA will strengthen relationships with other like-minded networks and programmes, such as the Network of Asian River Basin Organizations (NARBO).
8
Acknowledgements
Cambodia Sokha Chrin*, Deputy Director General, General Directorate of Technical Affairs, Ministry of Environment
ChinaChen Gang*, Senior Engineer, China-Japan Environmental Protection Center
Guo Jinlong, Deputy Director, Department of Pollution Prevention and Control, Ministry of Environmental Protection
Li Ruijuan, Project Manager, China-Japan Environmental Protection Center
Xie Yufeng, Assistant Researcher, Nanjing Institute of Environmental Science of Ministry of Environmental Protection
IndonesiaDionysius Johny Kusmo*, Assistant Deputy Minister for Environmental Data and Information, The Ministry of Environment
Maulyani Djajadilaga, Head of Data Management Section, The Ministry of Environment
Harimurti, Sub-head of Data Collection Section, The Ministry of Environment
Lao PDRSouphasay Komany*, Acting Director, Nam Ngum River Basin Committee Secretariat, Department of Water Resources, Ministry of Natural Resources and Environment
Phengkhamla Phonvisai, Director, Department of Pollution Control, Ministry of Natural Resources and Environment
JapanNobuo Yoshida, Director, Water Environment Division, Environment Management Bureau, Ministry of the Environment
The WEPA secretariat is grateful to the focal persons and the collaborators of the following WEPA partner countries for their contributions and constructive input, as well as their support in the preparation of this publication. We also extend our appreciation to the WEPA advisory committee for their guidance and invaluable input.
Takatoshi, Wako*, Deputy Director, Water Environment Division, Environment Management Bureau, Ministry of the Environment
Osamu Oyama, Section Chief of Sewerage, Water Environment Division, Environment Management Bureau, Ministry of the Environment
Republic of KoreaTaegu Kang*, Senior Researcher, Water Environment Information Center, Water Environment Control Research Division, Water Environment Research Department, National Institute of Environmental Research (NIER)
MyanmarTint Zaw*, Deputy Director General, Irrigation Department, Ministry of Agriculture and Irrigation
Khon Ra, Directior, Hydrology Branch, Irrigation Department, Ministry of Agriculture and Irrigation
Mu Mu Than, Assistant Engineer, Planning and Works Branch, Irrigation Department, Ministry of Agriculture and Irrigation
MalaysiaBaba Bin Hassan, Division Secretary, Water Resources, Drainage and Hydrology Division, Ministry of Natural Resources and Environment (NRE)
Ahmad Jamalluddin Shaaban*, Director General, National Hydraulic Research Institute of Malaysia (NAHRIM)
Pauziah Hanum Abdul Ghani, Senior Research Officer, Research Centre for Water Quality & Environment, National Hydraulic Research Institute of Malaysia, Ministry of Natural Resources and Environment
Wan Abd Rahim Bin Wan Abdullah, Deputy Director General (Planning & Development), Sewerage Services Department, Ministry of Energy, Green Technology and Water Malaysia
* Focal Person
9
WEPA Outlook on Water Environmental Management in Asia 2012
Hoo Huey Ching, Research Centre for Water Quality & Environment, National Hydraulic Research Institute of Malaysia, Ministry of Natural Resources and Environment
Bashirah binti Mohd Fazli, Research Officer, Research Centre for Water Quality & Environment, National Hydraulic Research Institute of Malaysia (NAHRIM)
NepalGautam Rajkarnikar*, Chief, Koshi River Basin Management Cell, Water and Energy Commission Secretariat
PhilippinesVicente B. Tuddao Jr., Executive Director, River Basin Control Office, Department of Environment and Natural Resources
Marcelino N. Rivera Jr., Chief, Water Quality Management Section, Environmental Management Bureau, Department of Environment and Natural Resources
Erlinda A. Gonzales*, Technical Officer, Environmental Management Bureau, Department of Environment and Natural Resources
Mark Mulingbayan, Manager, Environmental Department, Manila Water Company Inc.
Sri LankaR.M.S.K. Ratnayake*, Director (Environmental Pollution Control), Central Environmental Authority
Himali Karunaweera, Assistant Director (Environmental Pollution Control), Central Environmental Authority
ThailandWijarn Simachaya, Inspector General, Ministry of Natural Resources and Environment
Thiparpa Yolthantham*, Director of Inland Water Division, Pollution Control Department, Ministry of Natural Resources and Environment
Viet NamNguyen The Dong*, Deputy Director General, Vietnam Environment Administration, Ministry of Natural Resources and Environment
Do Nam Thang, Deputy Director, Institute of Science for Environmental Management (ISEM), Vietnam Environment Administration, Ministry of Natural Resources and Environment
Pham Thi Nguyet Nga, International Cooperation and Science & Technology Department (ISD), Vietnam Environment Administration, Ministry of Natural Resources and Environment
WEPA Advisory Committee MembersMotoyuki Suzuki, Chair of Central Environment Council, Japan, Auditor of Tokyo Institute of Technology, Professor emeritus at the University of Tokyo
Mitsumasa Okada, Professor, the Open University of Japan
Kaoru Takara, Professor, Disaster Prevention Research Institute (DPRI), Kyoto University
Kensuke Fukushi, Associate Professor, Integrated Research System for Sustainability Science, The University of Tokyo
So Kazama, Professor, Graduate School of Engineering, Tohoku University
The secretariat would also like to express our gratitude to the following experts who have also provided valuable inputs to this publication.
Kazuo Yamamoto, Professor, Environmental Science Center, The University of Tokyo
Takahiko Hiraishi, Senior Consultant, IGES, (Co-Chair, IPCC Inventories Task Force Bureau)
10
Abbreviations
ADB Asian Development Bank
AMDAL Environmental Impact Assessment Statement
ASER Annual Regional Environment Statement
BOD Biochemical Oxygen Demand
CBS Central Bureau of Statistics
CEA Central Environment Authority
CNMC Cambodia National Mekong Committee
COD Chemical Oxygen Demand
CRMP Coastal Resource Management Project
CWTPs Combined Wastewater Treatment Plants
DAO DENR Administrative Order
DA Department of Agriculture
DDA Department of Development Affairs
DDCs District Development Committees
DENR Department of Environment and Natural Resources
DHM Department of Hydrology and Meteorology
DKI Special Capital City District
DO Dissolved Oxygen
DoE Department of Environment
DoEPC Department of Environmental Pollution Control
DoNRE Department of Natural Resources and Environment
DWSS Department of Water Supply and Sewerage
EIA Environmental Impact Assessments
EMB Environmental Management Bureau
EPA Environment Protection Act
EPL Environmental Protection Law
EQA Environmental Quality Act
EQS Environmental Quality Standards
FAO Food and Agriculture Organization
GB National Standards
GB/T Recommended Standards
GDP Gross Domestic Product
ICIMOD International Centre for Integrated Mountain Development
IETS Industrial Effluent Treatment Systems
IGES Institute for Global Environmental Strategies
IMF International Monetary Fund
IPCC Intergovernmental Panel on Climate Change
ISES Industry-Specific Effluent Standards
IWK Indah Water Konsortium
LGUs Local Government Units
LLDA Laguna Lake Development Authority
LSGA Local Self Governance Act
MBAS Methylene Blue Active Substances
MDG Millennium Development Goal
MENR Ministry of Environment and Natural Resources
MEP Ministry of Environmental Protection
MLIT Ministry of Land, Infrastructure, Transport and Tourism of Japan
MoAIMD Ministry of Agriculture, Irrigation and Mahaweli Development
MoCT Ministry of Construction and Transportation
MoE Ministry of Environment
MoEJ Ministry of the Envrionment of Japan
MoNRE Ministry of Natural Resources and Environment
MoSTI Ministry of Science, Technology and Innovation
MoU Memorandum of Understanding
MoWRAM Ministry of Water Resources and Meteorology
MPPA Marine Pollution Prevention Authority
MPWT Ministry of Public Works and Transportation
MRC Mekong River Commission
MWQCS Marine Water Quality Criteria and Standards
MWR Ministry of Water Resources
MWSS Metropolitan Water Works and Sewerage System
NAA Non-Attainment Areas
NCEA National Commission for Environmental Affairs
NCSD National Council for Sustainable Development
NEB National Environmental Board
NGO Non Governmental Organization
NIS National Institute of Statistics
11
WEPA Outlook on Water Environmental Management in Asia 2012

NLMA National Land Management Authority
NRE Ministry of Natural Resources and Environment
NSDW National Standards for Drinking Water
NSO National Statistics Office
NTNC National Trust for Nature Conservation
NWP National Water Plan
NWQS National Water Quality Standards
NWS&DB National Water Supply and Drainage Board
ONEP Office of Natural Resources and Environmental Policy and Planning
PCAs Pollution Control Areas
PCB Polychlorinated Biphenyl
PCD Pollution Control of Department
PCE Perchloroethylene
PD Presidential Decree
pH Power of Hydrogen (hydrogen-ion concentration)
PPP Polluter Pay Principal
PRC People’s Republic of China
RA Republic Act
RBIMS River Basin Integrated Information Management Systems
ROK Republic of Krea
SEPA State Environmental Protection Administration, China
SLS Sri Lanka Standards (test method)
SMEs Small and Medium Enterprises
SOEs State Owned Enterprises
SSD Sewerage Service Department
TCE Trichloroethylene
TCVN National Environmental Standards
TMDLs Total Maximum Daily Load System
TMS Tele-Monitoring system
TN Total Nitrogen
TOC Total Organic Carbon
TP Total Phosphorus
TPLCs Total Pollutant Load Control System
TSS Total Suspended Solids
TSGL Tonle Sap Great Lake
UKL-UPL Environmental Management Effort and Environmental Monitoring Efforts
UNDESA United Nations Department of Economic and Social Affairs
UNDP United Nations Development Programme
UNEP United Nations Environmental Programme
UNESCO United Nations, Educational, Scientific and Cultural Organization
UNICEF United Nations Children’s Fund
VAT Value Added Tax
VDCs Village Development Committees
VEA Vietnam Environment Administration
VOC Volatile Organic Compounds
WCP Wastewater Charge Programme
WDI World Development Indicator
WECS Water and Energy Commission Secretariat
WEPA Water Environment Partnership in Asia
WHO World Health Organization
WQC Water Quality Criteria
WQI Water Quality Index
WQMA Water Quality Management Areas
WQMAP Water Quality Management Action Plan
WREA Water Resources and Environment Administration
WRUD Water Resources Utilization Department
WWF World Wide Fund for Nature
YCDC Yangon City Development Committee
12
Outlook on Water Environmental Management in WEPA countries
Chapter
1
1. Background
The Water Environment Partnership in Asia (WEPA) was formed to address issues related to the water environment in the 13 countries that it covers. Despite measures taken to date to combat pollution and improve the quality of water, low water quality still sits among the most pressing environmental problems for these countries and is still critical in some areas, particularly urban areas, as a consequence of socio-economic growth. The partner countries have each developed policies and measures designed to both combat the growing threat of water pollution in critical areas, and to avoid future outbreaks in other areas.
Certain aspects of water environmental management differ across the partner countries–due to factors such as the duration, gravity, cause and level of socio-economic development forming the backdrop to the problems—but some, such as pollution source control, are common to all as basic measures. Providing a review, therefore, was deemed useful in order both to illustrate what progress has been made and to identify common management challenges. It is hoped that this will in turn lead to more knowledge-sharing for future WEPA activities.
To this end, this chapter summarises the state of water environmental management in WEPA partner countries based on the country profiles in Chapter 3 and attempts to identify common challenges.
2. Overview of Water Environmental Management Framework in WEPAPartner Countries
This section gives a snapshot of the current water environmental management frameworks existing in the WEPA partner countries, from the following four perspectives: 1) Legislation, policies and strategies for water environmental
management, related to policy goal/target setting;2)Measures to ensure implementation and compliance,
focusing on wastewater management;
Outlook on Water Environmental Management inWEPA countries
Chapter 1
3)Monitoring of ambient and effluent waters necessary to access the efficacy of 1 and 2 above;
4)Other factors contributing to enforcement and improvement measures.
Given that the problems faced by each country differ in both type and scale we set out to solely provide a country-based overview of the progress made in the policies and measures related to the water environment, and tried to avoid any inter-country comparisons or evaluations of progress. The measures themselves and their status of implementation are not dealt with here in detail and will be covered at a later date by WEPA.
Legislation, policies and strategies for water environmental management1) Objectives of water environmental management
Most countries have set out a basic environmental law stipulating protection of human health, ensuring a safe human environment and protection of the environment as a basis for sustainable development, and these objectives also apply for water environmental management. Myanmar has various laws and regulations related to environmental protection, but no environmental conservation or pollution control specific ones.More detailed definitions of water environmental management objectives are given by such as laws or acts specific to water pollution control in some countries.
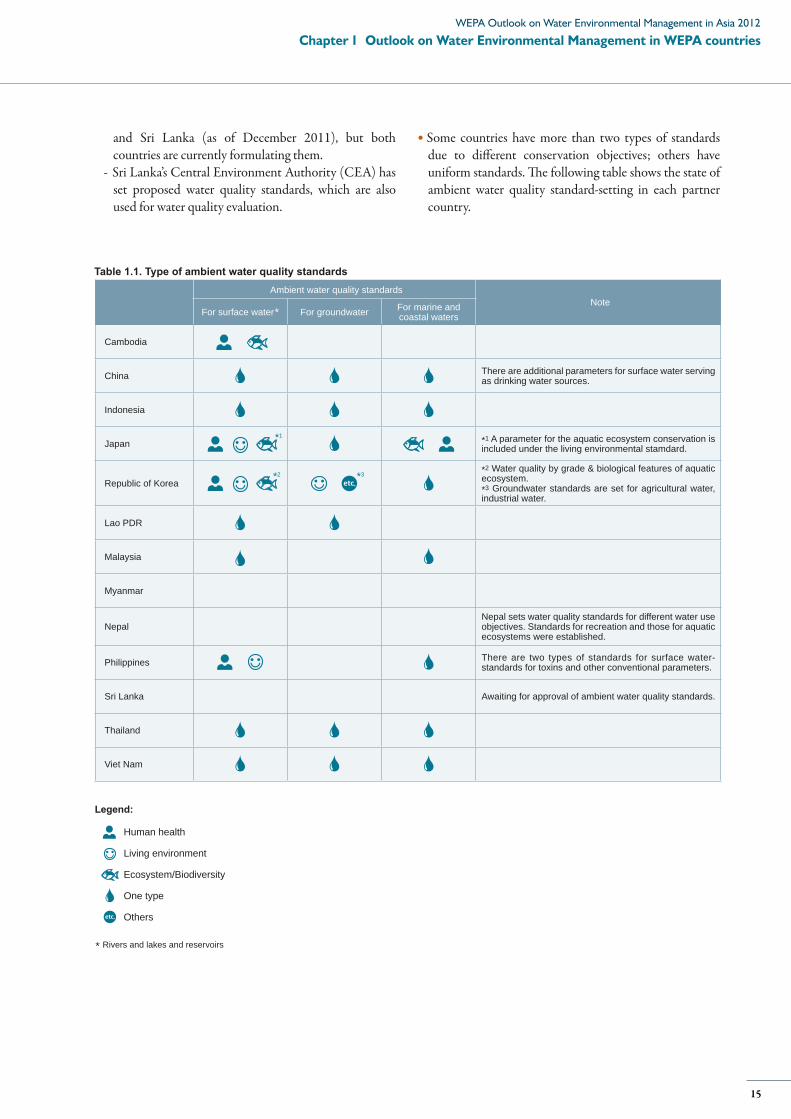
2) Ambient water quality standards as the administrative target
Ambient water quality standards show the basic levels of water quality that need to be maintained and act as administrative targets.- Most WEPA countries set ambient water quality
standards for rivers are established, while less number of countries has the one for groundwater.
- Drinking water quality standards are used to evaluate water quality in countries that have not set ambient quality standards.
- No ambient water quality standards set out in Myanmar
14
Ambient water quality standardsNote
For surface water* For groundwater For marine and coastal waters
Cambodia
China There are additional parameters for surface water serving as drinking water sources.
Indonesia
Japan *1 A parameter for the aquatic ecosystem conservation is included under the living environmental stamdard.
Republic of Korea etc.
*2 Water quality by grade & biological features of aquatic ecosystem.*3 Groundwater standards are set for agricultural water, industrial water.
Lao PDR
Malaysia
Myanmar
NepalNepal sets water quality standards for different water use objectives. Standards for recreation and those for aquatic ecosystems were established.
Philippines There are two types of standards for surface water- standards for toxins and other conventional parameters.
Sri Lanka Awaiting for approval of ambient water quality standards.
Thailand
Viet Nam
Table 1.1. Type of ambient water quality standards
and Sri Lanka (as of December 2011), but both countries are currently formulating them.
- Sri Lanka’s Central Environment Authority (CEA) has set proposed water quality standards, which are also used for water quality evaluation.
Some countries have more than two types of standards due to different conservation objectives; others have uniform standards. The following table shows the state of ambient water quality standard-setting in each partner country.
* Rivers and lakes and reservoirs
Legend:
Human health
Living environment
Ecosystem/Biodiversity
One type
Othersetc.
*3
*1
*2
15
Chapter 1 Outlook on Water Environmental Management in WEPA countriesWEPA Outlook on Water Environmental Management in Asia 2012

3) Strategies or plans for water environmental management
Use of time-bound specific targets as a tool to accurately evaluate policy objectives, as practiced in China, Indonesia, Republic of Korea, and Viet Nam.
Use of national water environmental plan/strategies with specific time periods (Sri Lanka and Thailand), without numerical targets.
Use of time-bound specific targets established for specific water bodies under a total pollution load control system (as in Japan, which has no specific plans or strategies for water environmental management).
Successful implementation relies on the availability of financing.
Measures to ensure implementation and compliance1) Effluent standards
All countries have set national effluent standards (with the exception of Myanmar, where national effluent standards are now under consideration and Yangon Special City has set its own effluent standards).
- China, Lao PDR, Nepal, Sri Lanka, Thailand and Viet Nam set industrial effluent standards
according to the type of industry.
- In Cambodia, different effluent standards can be established in accordance with proximity of pollution sources to sensitive environmental/ecosystem conservation areas.
- Since 2000, China, Indonesia, Lao PDR, Malaysia and Sri Lanka* have introduced or revised effluent standards to strengthen effluent management.
- Japan and Republic of Korea introduced a system to control total pollution loads in specific water bodies in addition to effluent control via pollutant concentration.
2) Inspections and penalties for non-complianceSystems for inspection, governmental guidance and penalties are in place in countries which set effluent standards.
Measures to counter non-compliance in effluent management (such as violations of effluent standards and effluent quality recording obligations) have been beefed-up in Indonesia, Japan and Viet Nam.
Monitoring of ambient and effluent water1) Ambient water quality monitoring
Ambient water quality is monitored on a project basis or for a specific benefit (e.g., irrigation and drinking water) such in Nepal, Myanmar and Sri Lanka. Other countries have regular monitoring systems which differ in number of monitoring points, parameters, and frequency.
- According to the WEPA survey in 2009, the following countries have collected water quality data of river waters for over 10 years: Japan, Republic of Korea, Malaysia, and Thailand (see Chapter 2.2, Figure 2.2.6).
2) Effluent quality monitoring Despite obligations on the owner of the pollution source and wastewater treatment facility to monitor effluent quality, this is not comprehensively done in all countries and monitoring results sometimes do not reach the intended authorities.
- In Cambodia and Sri Lanka the central government conducts monitoring at sites suspected of discharging high concentrations of effluents.
- In Republic of Korea, centralized monitoring of effluent using a tele-metering system was introduced for pollution sources (industries and domestic wastewater treatment facilities) with certain volumes of effluents.
- In Malaysia, an on-line reporting system has been introduced under which industries can report their effluent monitoring results through a website.
- In Japan, recording of monitoring results became mandatory under a revision to the Water Pollution Control Law in 2010.
3) Recording, maintenance and evaluation of monitoring results
Results of ambient water quality monitoring are recorded and maintained by the agencies conducting monitoring. However, the data is not maintained according to any set format.
* In Sri Lanka, another revision of effluent standards is now under consideration for approval.
16
- The WEPA survey on water quality monitoring data collection in 2009 found that it is difficult to share pooling of data maintained by different agencies among them (see chapter 2.2, p.48).
Other factors contributing to enforcement and removal of incorrect practices1) Disclosure of ambient water quality
monitoring results
The results of monitoring are evaluated annually in many countries for information disclosure and policy evaluation.
- In many countries the state of water quality is mainly reported to the general public via annually published environmental quality reports. The following countries enable public access to environmental reports giving comprehensive assessments of water quality on websites: China, Japan, Republic of Korea, Malaysia, Thailand, and Viet Nam.
- The Water Quality Index (WQI) is used for evaluation of overall status of water quality in some countries, such as China, Malaysia and Thailand. The method of WQI calculation is decided by each country. Other countries that assess their water quality annually ( Japan, Republic of Korea, Philippines and Viet Nam) use specific parameters to represent water quality status (e.g., BOD or COD for organic pollution).
- In some countries, such as China, Republic of Korea and Thailand, the public can view real-time monitoring data on a website, which is uploaded from continuous monitoring stations. Other countries such as Japan also utilise a website to publish details of water quality monitoring results.
2) Review cycle of water environmental policy
The WEPA secretariat cannot obtain sufficient information on the review cycle of water environmental policy as many countries have no fixed review cycle.
- In countries utilising time-bound policy/strategies, the efficacy of mitigation measures is reviewed according to such policy/strategies.
3. Recent Developments in Water Environmental Management and Challenges
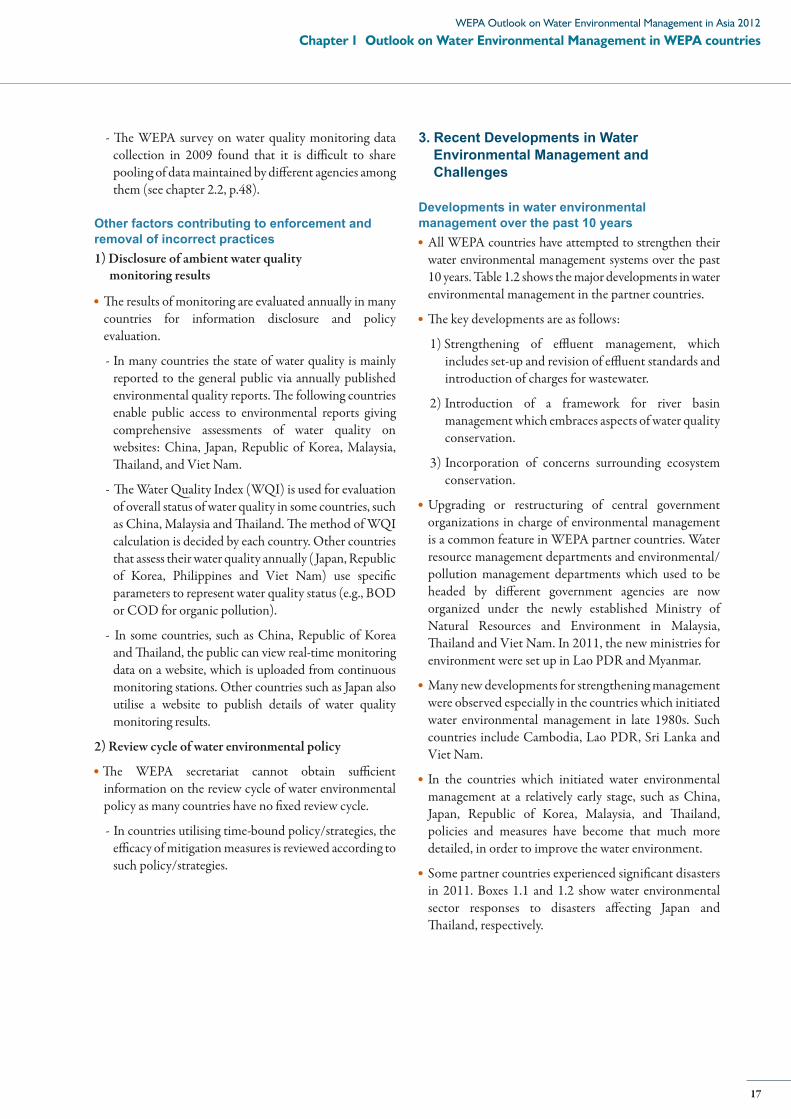
Developments in water environmental management over the past 10 years
All WEPA countries have attempted to strengthen their water environmental management systems over the past 10 years. Table 1.2 shows the major developments in water environmental management in the partner countries.
The key developments are as follows:
1) Strengthening of effluent management, which includes set-up and revision of effluent standards and introduction of charges for wastewater.
2) Introduction of a framework for river basin management which embraces aspects of water quality conservation.
3) Incorporation of concerns surrounding ecosystem conservation.
Upgrading or restructuring of central government organizations in charge of environmental management is a common feature in WEPA partner countries. Water resource management departments and environmental/pollution management departments which used to be headed by different government agencies are now organized under the newly established Ministry of Natural Resources and Environment in Malaysia, Thailand and Viet Nam. In 2011, the new ministries for environment were set up in Lao PDR and Myanmar.
Many new developments for strengthening management were observed especially in the countries which initiated water environmental management in late 1980s. Such countries include Cambodia, Lao PDR, Sri Lanka and Viet Nam.
In the countries which initiated water environmental management at a relatively early stage, such as China, Japan, Republic of Korea, Malaysia, and Thailand, policies and measures have become that much more detailed, in order to improve the water environment.
Some partner countries experienced significant disasters in 2011. Boxes 1.1 and 1.2 show water environmental sector responses to disasters affecting Japan and Thailand, respectively.
17
Chapter 1 Outlook on Water Environmental Management in WEPA countriesWEPA Outlook on Water Environmental Management in Asia 2012
Year Major development in organizational setting Major development in legislation
2000 Revision of Environment Act (Sri Lanka)
2001Establishment of Ministry of the Environment, upgraded from Environment Agency (Japan)
2002
Establishment of Ministry of Natural Resource and Environment as a restructure of central government agencies (Thailand, Viet Nam)
Revision of the Framework Act on Environmental Policy (ROK)Approval of National Environment Policy (Malaysia)
2003
Addition of zinc as a parameter of water quality environmental standards, in consideration of protection of aquatic ecosystem (Japan)Establishment of Environmental Management Policy (Nepal)National Environmental Management Policy (Sri Lanka)Set up the National Strategy for Environmental Management until 2010 and vision toward 2020 (Viet Nam)Introduction of environmental protection charge for wastewater (Viet Nam)
2004Establishment of Ministry of Natural Resource and Environment as a restructure of central government agencies (Malaysia)
Introduction of total maximum daily load system (TMDLs) (ROK)Revision of the Clean Water Act (Philippines)Decree on Licensing for exploitation, utilization, use and discharge of waste water
(Viet Nam)
2005Addition of chemical substance parameters to standards (ROK) Approval of the National Water Environment Master Plan (2006-2015) (ROK)Adoption of the National Water Policy (Nepal)Revision of Law on Environmental Protection (Viet Nam)
2006Inclusion of 16 water pollution projects in mid-term plan (China)Start of regular monitoring in 35 major rivers (Indonesia)Revision of the Lake Water Law (Japan)Approval of basin management project in three major basins (Viet Nam)
2007
Enacted the Law on Water Resources and Management (Cambodia)Revision of the Water Quality Conservation Act (renamed as the Water Quality and Ecosystem Conservation Act) (ROK), which further emphasize conservation of ecosystems Revision of Water Quality and Ecosystem Conservation Act and its Enforcement Decree (ROK) Approval of national ambient and effluent water standards (Lao PDR)Approval of the National master Program for Natural Resource and Environment Monitoring until 2020 (Viet Nam)
2008
Establishment of the Ministry of Environment Protection (MEP), upgraded from the State Environmental Protection Administration (SEPA) (China)
Set up the Vietnam Environment Administration (VEA) (Viet Nam)
Revision of series of effluent standards (2008-2011) (China) Start of regular ambient water monitoring conducted by the central government (Cambodia)Establishment of new effluent standards (Sri Lanka) Establishment of Marine Pollution Prevention Act (Sri Lanka)Revision of ambient quality standards for surface, coastal and underground waters (Viet Nam)Revision of series of effluent standards (2008-2010) (Viet Nam)Establishment of ambient quality standard for groundwater (Viet Nam)Approval of Decree 120/2008/ND-CP on basin management (Viet Nam)
2009
Revision of the National Environment Law, aiming to strengthen implementation, especially control of point sources (Indonesia)Revision of effluent standards (Malaysia)Approval of Bagmati Action Plan (Nepal)Approval of a new national environmental policy and its action plan (Sri Lanka) Start of classification of water bodies (Philippines)
2010
Adoption of the mid-term development plan (2010-2015), which states reduction targets for pollutants (China)Revision of the Water Pollution Control Law, which address water quality related accidents and effluent management (Japan)Introduction of on-line wastewater registration system (Malaysia)Establishment of Wastewater Treatment System Effluent Standard (Thailand)
2011
Establishment of Ministry of Natural Resource and Environment (Lao PDR)
Establishment of Ministry of Environmental Conservation and Forestry (Myanmar)
12th Five-Year Plan (2011-2015) (China)Revision of the Water Pollution Control Law, which strengthen groundwater quality management (Japan)
Table 1.2. Major developments in water environmental management in WEPA Countries
18
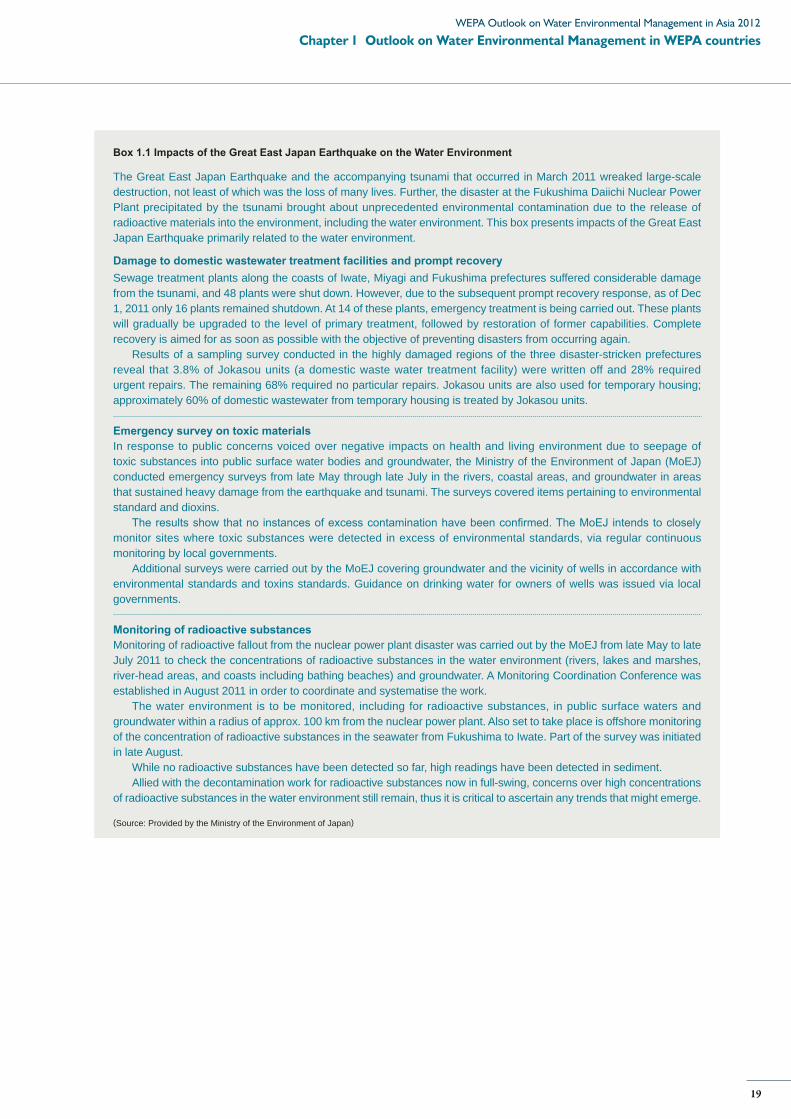
The Great East Japan Earthquake and the accompanying tsunami that occurred in March 2011 wreaked large-scale destruction, not least of which was the loss of many lives. Further, the disaster at the Fukushima Daiichi Nuclear Power Plant precipitated by the tsunami brought about unprecedented environmental contamination due to the release of radioactive materials into the environment, including the water environment. This box presents impacts of the Great East Japan Earthquake primarily related to the water environment.
Damage to domestic wastewater treatment facilities and prompt recoverySewage treatment plants along the coasts of Iwate, Miyagi and Fukushima prefectures suffered considerable damage from the tsunami, and 48 plants were shut down. However, due to the subsequent prompt recovery response, as of Dec 1, 2011 only 16 plants remained shutdown. At 14 of these plants, emergency treatment is being carried out. These plants will gradually be upgraded to the level of primary treatment, followed by restoration of former capabilities. Complete recovery is aimed for as soon as possible with the objective of preventing disasters from occurring again.
Results of a sampling survey conducted in the highly damaged regions of the three disaster-stricken prefectures reveal that 3.8% of Jokasou units (a domestic waste water treatment facility) were written off and 28% required urgent repairs. The remaining 68% required no particular repairs. Jokasou units are also used for temporary housing; approximately 60% of domestic wastewater from temporary housing is treated by Jokasou units.
Emergency survey on toxic materialsIn response to public concerns voiced over negative impacts on health and living environment due to seepage of toxic substances into public surface water bodies and groundwater, the Ministry of the Environment of Japan (MoEJ) conducted emergency surveys from late May through late July in the rivers, coastal areas, and groundwater in areas that sustained heavy damage from the earthquake and tsunami. The surveys covered items pertaining to environmental standard and dioxins.
The results show that no instances of excess contamination have been confirmed. The MoEJ intends to closely monitor sites where toxic substances were detected in excess of environmental standards, via regular continuous monitoring by local governments.
Additional surveys were carried out by the MoEJ covering groundwater and the vicinity of wells in accordance with environmental standards and toxins standards. Guidance on drinking water for owners of wells was issued via local governments.
Monitoring of radioactive substancesMonitoring of radioactive fallout from the nuclear power plant disaster was carried out by the MoEJ from late May to late July 2011 to check the concentrations of radioactive substances in the water environment (rivers, lakes and marshes, river-head areas, and coasts including bathing beaches) and groundwater. A Monitoring Coordination Conference was established in August 2011 in order to coordinate and systematise the work.
The water environment is to be monitored, including for radioactive substances, in public surface waters and groundwater within a radius of approx. 100 km from the nuclear power plant. Also set to take place is offshore monitoring of the concentration of radioactive substances in the seawater from Fukushima to Iwate. Part of the survey was initiated in late August.
While no radioactive substances have been detected so far, high readings have been detected in sediment. Allied with the decontamination work for radioactive substances now in full-swing, concerns over high concentrations
of radioactive substances in the water environment still remain, thus it is critical to ascertain any trends that might emerge.
(Source: Provided by the Ministry of the Environment of Japan)
Box 1.1 Impacts of the Great East Japan Earthquake on the Water Environment
19
Chapter 1 Outlook on Water Environmental Management in WEPA countriesWEPA Outlook on Water Environmental Management in Asia 2012
20
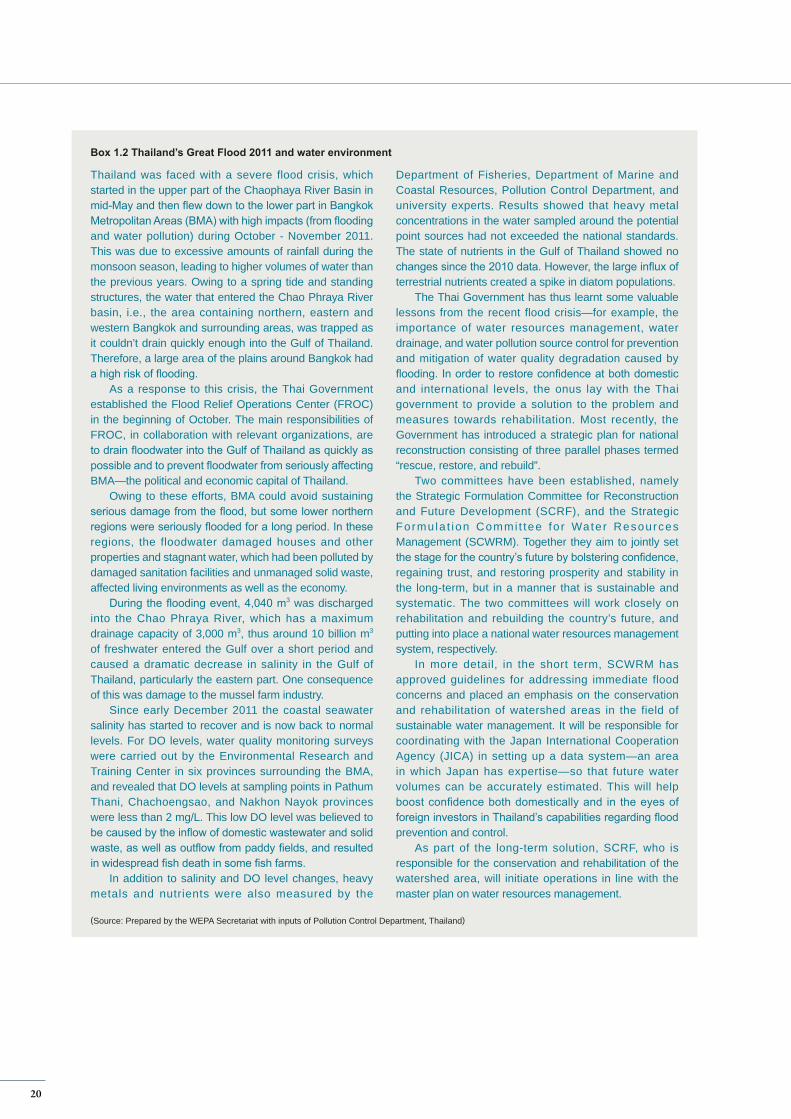
Thailand was faced with a severe flood crisis, which started in the upper part of the Chaophaya River Basin in mid-May and then flew down to the lower part in Bangkok Metropolitan Areas (BMA) with high impacts (from flooding and water pollution) during October - November 2011. This was due to excessive amounts of rainfall during the monsoon season, leading to higher volumes of water than the previous years. Owing to a spring tide and standing structures, the water that entered the Chao Phraya River basin, i.e., the area containing northern, eastern and western Bangkok and surrounding areas, was trapped as it couldn’t drain quickly enough into the Gulf of Thailand. Therefore, a large area of the plains around Bangkok had a high risk of flooding.
As a response to this crisis, the Thai Government established the Flood Relief Operations Center (FROC) in the beginning of October. The main responsibilities of FROC, in collaboration with relevant organizations, are to drain floodwater into the Gulf of Thailand as quickly as possible and to prevent floodwater from seriously affecting BMA—the political and economic capital of Thailand.
Owing to these efforts, BMA could avoid sustaining serious damage from the flood, but some lower northern regions were seriously flooded for a long period. In these regions, the floodwater damaged houses and other properties and stagnant water, which had been polluted by damaged sanitation facilities and unmanaged solid waste, affected living environments as well as the economy.
During the flooding event, 4,040 m3 was discharged into the Chao Phraya River, which has a maximum drainage capacity of 3,000 m3, thus around 10 billion m3 of freshwater entered the Gulf over a short period and caused a dramatic decrease in salinity in the Gulf of Thailand, particularly the eastern part. One consequence of this was damage to the mussel farm industry.
Since early December 2011 the coastal seawater salinity has started to recover and is now back to normal levels. For DO levels, water quality monitoring surveys were carried out by the Environmental Research and Training Center in six provinces surrounding the BMA, and revealed that DO levels at sampling points in Pathum Thani, Chachoengsao, and Nakhon Nayok provinces were less than 2 mg/L. This low DO level was believed to be caused by the inflow of domestic wastewater and solid waste, as well as outflow from paddy fields, and resulted in widespread fish death in some fish farms.
In addition to salinity and DO level changes, heavy metals and nutrients were also measured by the
Box 1.2 Thailand’s Great Flood 2011 and water environment
Department of Fisheries, Department of Marine and Coastal Resources, Pollution Control Department, and university experts. Results showed that heavy metal concentrations in the water sampled around the potential point sources had not exceeded the national standards. The state of nutrients in the Gulf of Thailand showed no changes since the 2010 data. However, the large influx of terrestrial nutrients created a spike in diatom populations.
The Thai Government has thus learnt some valuable lessons from the recent flood crisis—for example, the importance of water resources management, water drainage, and water pollution source control for prevention and mitigation of water quality degradation caused by flooding. In order to restore confidence at both domestic and international levels, the onus lay with the Thai government to provide a solution to the problem and measures towards rehabilitation. Most recently, the Government has introduced a strategic plan for national reconstruction consisting of three parallel phases termed “rescue, restore, and rebuild”.
Two committees have been established, namely the Strategic Formulation Committee for Reconstruction and Future Development (SCRF), and the Strategic Formula t ion Commi t tee fo r Water Resources Management (SCWRM). Together they aim to jointly set the stage for the country’s future by bolstering confidence, regaining trust, and restoring prosperity and stability in the long-term, but in a manner that is sustainable and systematic. The two committees will work closely on rehabilitation and rebuilding the country’s future, and putting into place a national water resources management system, respectively.
In more detail, in the short term, SCWRM has approved guidelines for addressing immediate flood concerns and placed an emphasis on the conservation and rehabilitation of watershed areas in the field of sustainable water management. It will be responsible for coordinating with the Japan International Cooperation Agency (JICA) in setting up a data system—an area in which Japan has expertise—so that future water volumes can be accurately estimated. This will help boost confidence both domestically and in the eyes of foreign investors in Thailand’s capabilities regarding flood prevention and control.
As part of the long-term solution, SCRF, who is responsible for the conservation and rehabilitation of the watershed area, will initiate operations in line with the master plan on water resources management.
(Source: Prepared by the WEPA Secretariat with inputs of Pollution Control Department, Thailand)

4. Common Challenges among WEPA Partner Countries
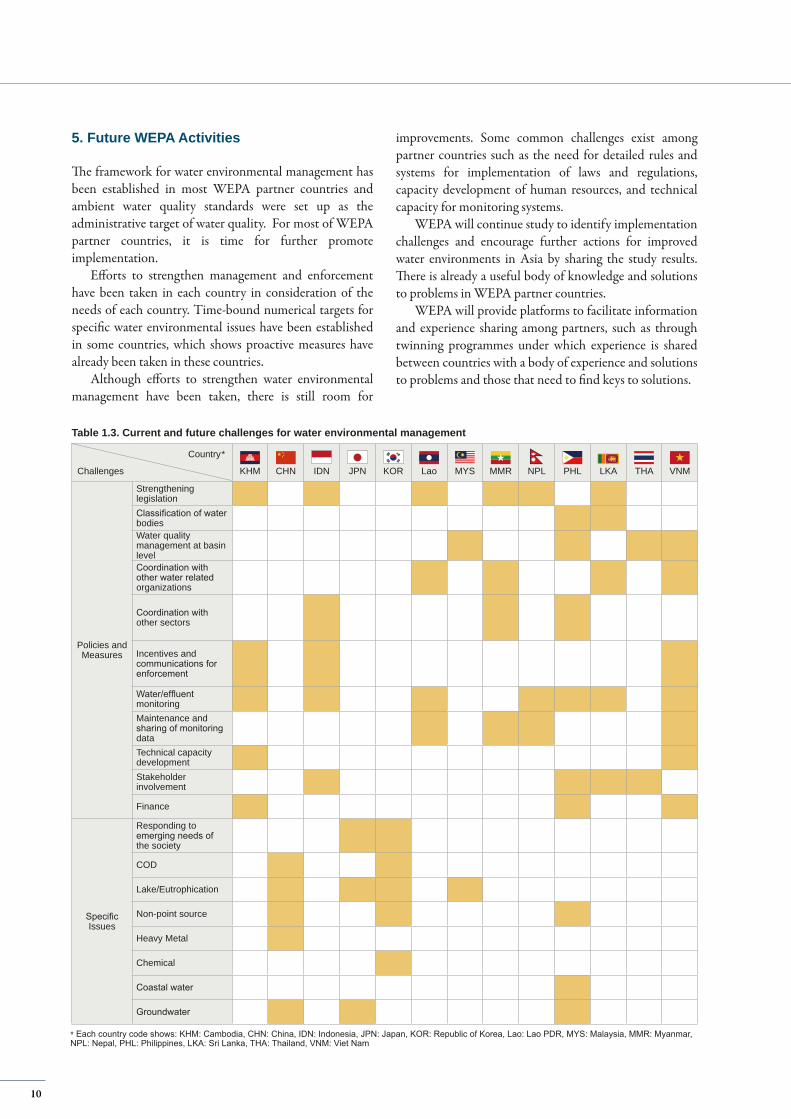
This section aims to illustrate both the present and future challenges mentioned in the country profiles (Chapter 3), which were developed based on the presentations and discussions at WEPA workshops, annual meetings, as well as governmental reports. Table 1.3 gives a summary of challenges according to several management categories and individual problems. The following part summarises the challenges that are common among the countries.
Legislation and Organization: Detailed systems and capacity require developing in order to implement a legislative framework A framework for water environmental management has been developed in each country, but detailed rules and systems (e.g., classifications of public water bodies) need to be developed in some countries to promote implementation and enforcement.
The majority of countries that have identified domestic and industrial wastewater management as a challenge have also listed the challenge of creating a comprehensive system to implement appropriate management. These challenges are inextricably linked with each other. Management of wastewater, which is a major pollution factor, is a fundamental element of water environmental management, and to improve on this it is necessary to strengthen management systems and capacity. The setting of appropriate targets, promotion of enforcement (e.g., development of incentive mechanisms) and technical and human capacity development for implementation are the areas that need assistance.
Ensuring implementation of proper monitoring and data management is a common challenge Water quality monitoring is also common among many partner countries. Insufficient infrastructure and capacity of human resources to conduct monitoring have been identified as barriers. In addition, insufficient budgets are also a big barrier to promoting monitoring.
Maintenance of monitoring data is a further challenge. Development of a database and establishment of data sharing mechanisms among different organizations are common issues among four partner countries.
Coordination among relevant water organizations as well as with other sectoral organizations is a challenge especially for those countries that attempt to promote water quality management.
Coordination among relevant water related organizations is not a new challenge in water environmental management but is still relevant. Many of the countries that see coordination as a challenge are those that have promoted or tried to promote a water environmental management framework in recent years (Lao PDR, and Sri Lanka, and Viet Nam). Coordination thus appears as a challenge in the process of developing a management framework.
Coordination with other sectors, especially waste and land use, is also identified as a challenge among a few countries. Waste dumping and development practices conducted without due consideration for the impacts on the environment are big concerns that need to be addressed to improve the water environment.
Recurrent issue – water quality management at the basin levelIn many WEPA partner countries, water resource management at the basin level has been promoted. Reflecting this trend, four countries identified basin management as a challenge. Other countries, such as China, Republic of Korea, Lao PDR, and Indonesia have already promoted basin level management of water resources, in which water quality aspects are addressed.
How to manage the water environment at the basin level is an important topic when considering improving water quality management in the near future. Stakeholder involvement is also a key in this field.
Individual water quality issuesIn addition to the management challenge, the following specific problems are identified as issues to be addressed further.
- Reduction of Chemical Oxygen Demand (COD) concentration: China and Republic of Korea
- Lake water quality and eutrophication: China, Japan, Republic of Korea, Malaysia
- Non-point source control: China, Republic of Korea, Philippines
- Heavy metal pollution: China- Chemical pollution: Republic of Korea- Groundwater quality improvement: China, Japan,
Philippines- Coastal water quality improvement: Philippines- Consideration of emerging needs from society for
creating a new water environmental management scheme: Japan and Republic of Korea
21
Chapter 1 Outlook on Water Environmental Management in WEPA countriesWEPA Outlook on Water Environmental Management in Asia 2012
5. Future WEPA Activities
The framework for water environmental management has been established in most WEPA partner countries and ambient water quality standards were set up as the administrative target of water quality. For most of WEPA partner countries, it is time for further promote implementation.
Efforts to strengthen management and enforcement have been taken in each country in consideration of the needs of each country. Time-bound numerical targets for specific water environmental issues have been established in some countries, which shows proactive measures have already been taken in these countries.
Although efforts to strengthen water environmental management have been taken, there is still room for
improvements. Some common challenges exist among partner countries such as the need for detailed rules and systems for implementation of laws and regulations, capacity development of human resources, and technical capacity for monitoring systems.
WEPA will continue study to identify implementation challenges and encourage further actions for improved water environments in Asia by sharing the study results. There is already a useful body of knowledge and solutions to problems in WEPA partner countries.
WEPA will provide platforms to facilitate information and experience sharing among partners, such as through twinning programmes under which experience is shared between countries with a body of experience and solutions to problems and those that need to find keys to solutions.
KHM CHN IDN JPN KOR Lao MYS MMR NPL PHL LKA THA VNM
Policies and Measures
Strengthening legislation Classification of water bodiesWater quality management at basin levelCoordination with other water related organizations
Coordination with other sectors
Incentives and communications for enforcement
Water/effluent monitoringMaintenance and sharing of monitoring dataTechnical capacity developmentStakeholder involvement
Finance
Specific Issues
Responding to emerging needs of the society
COD
Lake/Eutrophication
Non-point source
Heavy Metal
Chemical
Coastal water
Groundwater
Country*
Challenges
* Each country code shows: KHM: Cambodia, CHN: China, IDN: Indonesia, JPN: Japan, KOR: Republic of Korea, Lao: Lao PDR, MYS: Malaysia, MMR: Myanmar, NPL: Nepal, PHL: Philippines, LKA: Sri Lanka, THA: Thailand, VNM: Viet Nam
Table 1.3. Current and future challenges for water environmental management
10
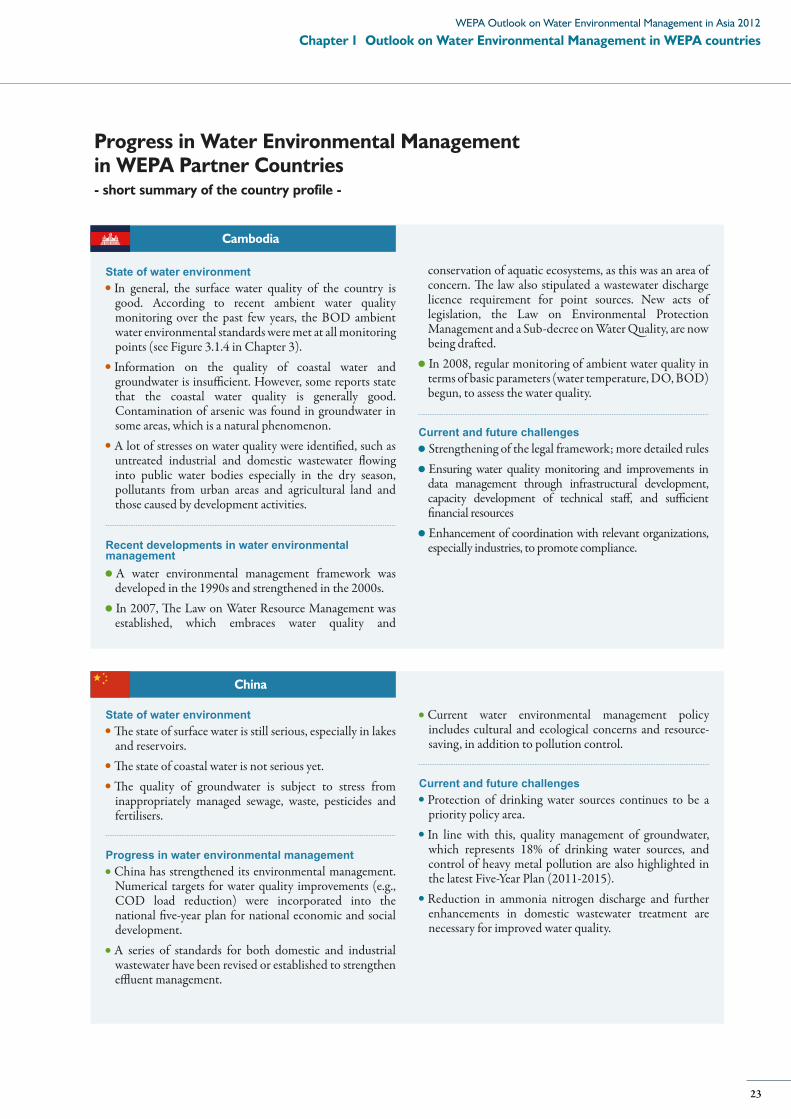
Progress in Water Environmental Managementin WEPA Partner Countries- short summary of the country profile -
State of water environmentIn general, the surface water quality of the country is good. According to recent ambient water quality monitoring over the past few years, the BOD ambient water environmental standards were met at all monitoring points (see Figure 3.1.4 in Chapter 3). Information on the quality of coastal water and groundwater is insufficient. However, some reports state that the coastal water quality is generally good. Contamination of arsenic was found in groundwater in some areas, which is a natural phenomenon. A lot of stresses on water quality were identified, such as untreated industrial and domestic wastewater flowing into public water bodies especially in the dry season, pollutants from urban areas and agricultural land and those caused by development activities.
Recent developments in water environmental management
A water environmental management framework was developed in the 1990s and strengthened in the 2000s. In 2007, The Law on Water Resource Management was established, which embraces water quality and
State of water environmentThe state of surface water is still serious, especially in lakes and reservoirs. The state of coastal water is not serious yet. The quality of groundwater is subject to stress from inappropriately managed sewage, waste, pesticides and fertilisers.
Progress in water environmental management China has strengthened its environmental management. Numerical targets for water quality improvements (e.g., COD load reduction) were incorporated into the national five-year plan for national economic and social development. A series of standards for both domestic and industrial wastewater have been revised or established to strengthen effluent management.
conservation of aquatic ecosystems, as this was an area of concern. The law also stipulated a wastewater discharge licence requirement for point sources. New acts of legislation, the Law on Environmental Protection Management and a Sub-decree on Water Quality, are now being drafted. In 2008, regular monitoring of ambient water quality in terms of basic parameters (water temperature, DO, BOD) begun, to assess the water quality.
Current and future challengesStrengthening of the legal framework; more detailed rulesEnsuring water quality monitoring and improvements in data management through infrastructural development, capacity development of technical staff, and sufficient financial resourcesEnhancement of coordination with relevant organizations, especially industries, to promote compliance.
Current water environmental management policy includes cultural and ecological concerns and resource-saving, in addition to pollution control.
Current and future challengesProtection of drinking water sources continues to be a priority policy area.In line with this, quality management of groundwater, which represents 18% of drinking water sources, and control of heavy metal pollution are also highlighted in the latest Five-Year Plan (2011-2015). Reduction in ammonia nitrogen discharge and further enhancements in domestic wastewater treatment are necessary for improved water quality.
Cambodia
China
23
Chapter 1 Outlook on Water Environmental Management in WEPA countriesWEPA Outlook on Water Environmental Management in Asia 2012
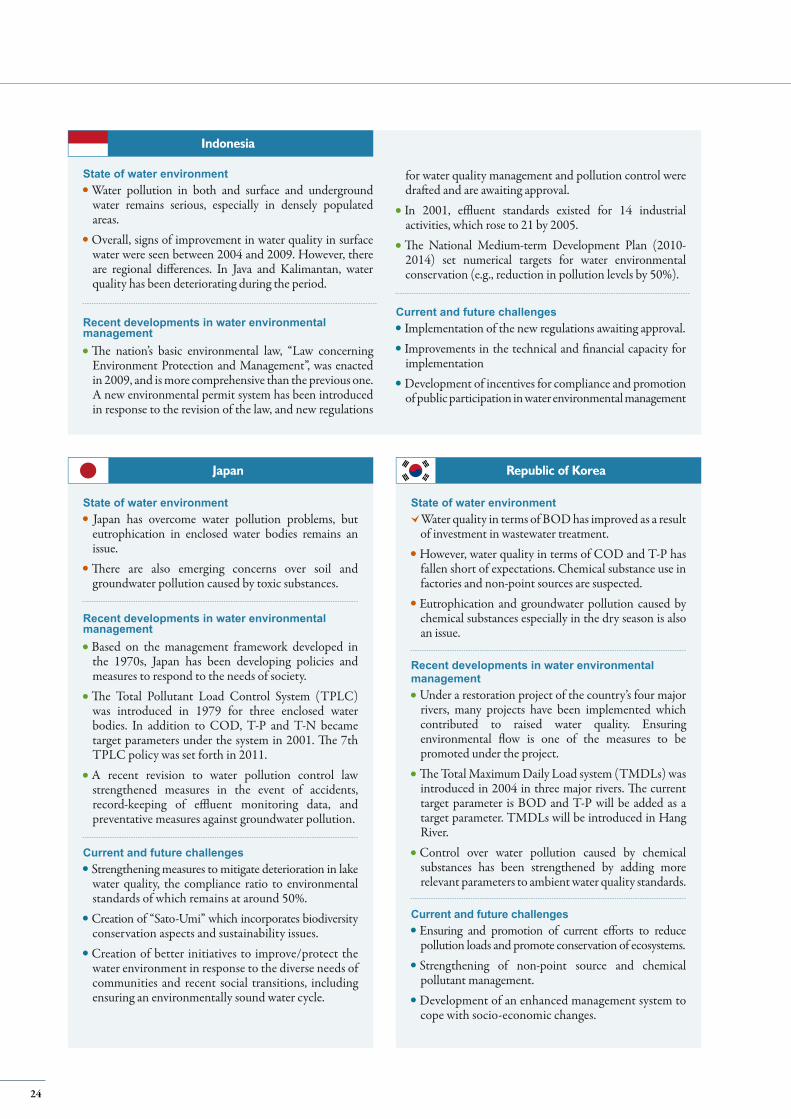
State of water environmentWater quality in terms of BOD has improved as a result of investment in wastewater treatment. However, water quality in terms of COD and T-P has fallen short of expectations. Chemical substance use in factories and non-point sources are suspected. Eutrophication and groundwater pollution caused by chemical substances especially in the dry season is also an issue.
Recent developments in water environmental management
Under a restoration project of the country’s four major rivers, many projects have been implemented which contributed to raised water quality. Ensuring environmental flow is one of the measures to be promoted under the project. The Total Maximum Daily Load system (TMDLs) was introduced in 2004 in three major rivers. The current target parameter is BOD and T-P will be added as a target parameter. TMDLs will be introduced in Hang River. Control over water pollution caused by chemical substances has been strengthened by adding more relevant parameters to ambient water quality standards.
Current and future challengesEnsuring and promotion of current efforts to reduce pollution loads and promote conservation of ecosystems.Strengthening of non-point source and chemical pollutant management. Development of an enhanced management system to cope with socio-economic changes.
State of water environmentJapan has overcome water pollution problems, but eutrophication in enclosed water bodies remains an issue. There are also emerging concerns over soil and groundwater pollution caused by toxic substances.
Recent developments in water environmental management
Based on the management framework developed in the 1970s, Japan has been developing policies and measures to respond to the needs of society. The Total Pollutant Load Control System (TPLC) was introduced in 1979 for three enclosed water bodies. In addition to COD, T-P and T-N became target parameters under the system in 2001. The 7th TPLC policy was set forth in 2011. A recent revision to water pollution control law strengthened measures in the event of accidents, record-keeping of effluent monitoring data, and preventative measures against groundwater pollution.
Current and future challengesStrengthening measures to mitigate deterioration in lake water quality, the compliance ratio to environmental standards of which remains at around 50%. Creation of “Sato-Umi” which incorporates biodiversity conservation aspects and sustainability issues.Creation of better initiatives to improve/protect the water environment in response to the diverse needs of communities and recent social transitions, including ensuring an environmentally sound water cycle.
State of water environmentWater pollution in both and surface and underground water remains serious, especially in densely populated areas. Overall, signs of improvement in water quality in surface water were seen between 2004 and 2009. However, there are regional differences. In Java and Kalimantan, water quality has been deteriorating during the period.
Recent developments in water environmental management
The nation’s basic environmental law, “Law concerning Environment Protection and Management”, was enacted in 2009, and is more comprehensive than the previous one. A new environmental permit system has been introduced in response to the revision of the law, and new regulations
for water quality management and pollution control were drafted and are awaiting approval. In 2001, effluent standards existed for 14 industrial activities, which rose to 21 by 2005. The National Medium-term Development Plan (2010-2014) set numerical targets for water environmental conservation (e.g., reduction in pollution levels by 50%).
Current and future challengesImplementation of the new regulations awaiting approval. Improvements in the technical and financial capacity for implementationDevelopment of incentives for compliance and promotion of public participation in water environmental management
Indonesia
Republic of KoreaJapan
24
State of water environmentWater quality of surface water in the country is generally good. Anticipated social and economic development may cause deterioration in water quality if appropriate control measures are not introduced.
Recent developments in water environmental management
Since there are no significant pollution problems identified, there are no specific laws and regulations to control water pollution. Water monitoring is conducted on a project basis or for each water use, such as drinking and irrigation.
Current and future challengesIntroduction/promotion of preventive and proactive measures against water pollution. Such measures can include coordination of relevant organizations, reduction in potential pollution loads by promoting effective water use such as in irrigation and industrial sectors; strengthening of waste treatment; and prevention of erosion through forest conservation efforts.
State of water environmentSerious water pollution problems have been mitigated as a result of measures taken under the National Environmental Quality Act, but a recent assessment shows a slight increase in “polluted” or “slightly polluted” rivers. This is considered to be caused by an increase in number of pollution sources and in inadequately treated wastewater. The condition of coastal water quality differs by area, but TSS and oil are the common parameters measured. Total coliform is the common parameter used for groundwater
Recent developments in water environmental management
A framework for water environmental management is well established in the country. Effluent control has been improved/strengthened by revision of effluent standards, reinforcing recording and reporting of effluents from pollution sources. On-line reporting of effluent quality has been introduced. The Industrial Effluent Treatment System (IETS), which aims to improve the process of wastewater treatment, was also introduced to strengthen effluent control.
Current and future challengesFurther promotion of effluent control. In particular, encouragement and strengthening of the “self-regulation approach” in which industry voluntarily implements pollution control measures. Promotion of water quality management at the basin level, which may include development of countermeasures that account for capacity and water use in each basin. Further study on lake water quality to achieve better management of lakes and reservoirs.
State of water environmentSurface water quality in the country is considered good. However, the quality of urban rivers could worsen in the future due to the inflow of untreated wastewater the volume of which will increase with urban growth.
Recent developments in water environmental management
A series of ambient water quality standards were established in 2009. Measures to control effluent from industry have been strengthened, which included the introduction of effluent standards in 2009.Currently the Environmental Protection Law is awaiting approval of revision. The revision will include strengthening water quality monitoring and inspection of
pollution sources and introduction of strategic environmental assessments. Establishment of the Ministry of Natural Resources and Environment in 2011.
Current and future challengesStrengthening and implementation of preventive measures before serious pollution problems occur. Areas for action include development of domestic wastewater treatment facilities in urban areas, ensuring water quality monitoring and development of a sharing mechanism of the monitoring results, and implementation of an effluent licence system.The newly established Ministry of Natural Resources and Environment is expected to promote and strengthen better management to prevent future cases of pollution.
Lao PDR
MyanmarMalaysia
25
Chapter 1 Outlook on Water Environmental Management in WEPA countriesWEPA Outlook on Water Environmental Management in Asia 2012
State of water environmentWater quality information data is limited, but available sources shows there is no serious water pollution. Concerns over water quality deterioration due to untreated/inadequately treated domestic and industrial wastewater exist. Organic pollution has been identified in some coastal waters. Salinization is major issue for groundwater quality, as is pathogen pollution caused by improper sanitation.
Recent developments in water environmental management
A framework on environmental management has been developed since the 1980s. A revision of effluent standards and interim ambient water quality standards are awaiting approval. The national environmental policy 2010-15 was developed, which includes certain pollution control related measures.
Current and future challengesCoordination of relevant agencies to take more comprehensive measures.Setting national ambient water quality standards, which are now awaiting approval; this should be followed by the classification of surface water bodies. A lack of baseline data, and the need for ambient water quality monitoring to address the problem. The means the sharing of monitoring data across different organizations also needs addressing. Awareness-raising of conservation of the water environment. Awareness-raising in the industrial sector is necessary to promote enforcement.
State of water environmentSurface water quality deterioration needs to be addressed especially in the urban areas, although an improvement trend has been observed based on the result of water quality monitoring conducted under the Sagip llong (Save the River) Program. In general, the quality of groundwater and marine and coastal waters is good.
Recent developments in water environmental management
A Clean Water Act was established in 2004. Under the act, more proactive measures are planned. Water quality management in water quality management area is a key feature under the Clean Water Act. An effluent licence system as well as charging system will also be introduced under the act. Effluent standards by type of industry are currently awaiting approval.
Current and future challengesInfrastructure development and human capacity development to ensure implementation of water quality monitoring. A data sharing mechanism is also an important element to be addressed.Coordination with other sectors such as land use and waste management.Strengthening non-point sources, and coastal water and groundwater quality improvements. Consideration of inclusion of water quality aspects in basin level water management and database.
State of water environmentThe water quality in the country is good except in some urban areas where water pollution is serious. Water quality in Kathmandu is serious due to untreated domestic and industrial wastewater, dumping of waste and unplanned development activities. Water pollution caused by pesticides and fertilisers are concerns.
Recent developments in water environmental management
Acts on environmental protection were established in 1997. Regarding water resources management, the National Water Policy and Water Resource Law were established in 2002 and 2004 respectively.
In 2000s, a series of water related standards were established, including standards for ecosystem conservation in 2008. The Bagmati Action Plan was approved in 2009 in which water pollution in the Bagmati River is addressed.
Current and future challengesImplementation and enforcement after establishment of a partial framework for environmental and water resource management. Detailed rules and a system to manage water pollution are absent in the promotion of water pollution control. Monitoring and data sharing mechanisms need to be improved, and the institutional arrangements, technical capacity and financial basis therefore should be addressed.
Nepal
Sri LankaPhilippines
26
State of water environmentSurface water quality has been improved, but recent monitoring data shows a slight rising trend in “polluted” points. Monitoring results of coastal waters over the past 5 years show no significant changes in quality. However, the number of “polluted” waters is on the increase, especially in the inner gulf where polluted water flows. Groundwater is generally in good in quality, but in some areas high levels of fluoride, salinity and Volatile Organic Compounds (VOC ) were identified.
Recent developments in water environmental management
Water environmental management has been implemented based on the National Enhancement of Environmental Conservation Act 1992, which includes establishment of pollution control area and environmental protection area.
State of water environmentThe water quality of the upper stream is good, but serious pollution was identified downstream. Most of the major rivers and lakes/reservoirs in inner cities do not meet the environmental BOD standard. Coastal waters are also polluted, e.g., by untreated/inadequately treated wastewater and waste and wastewater from aquaculture. Oil pollution is one of the common issues in coastal areas. An increase in salinity has widely noted, partly due to excessive groundwater extraction.
Recent developments in water environmental management
Since 2000, a framework development of water environmental management has been accelerated in the country. Such developments include introduction of a wastewater charging system, strengthening penal systems against non-compliance and revision of ambient and effluent standards.
A priority area identified in the environmental Policy 2010-14 includes improvement and enhancement of domestic wastewater treatment and stipulates the polluter-pay-principle (PPP). In 2009, new effluent standards for wastewater treatment facility were introduced.
Current and future challengesTo improve implementation, the following items should be further addressed:
- Further strengthening of domestic wastewater treatment;- Encouragement of public participation and promotion of
a voluntary approach in the industrial sector;- Further consideration on how to manage water quality at
the basin level. - A method of promoting the PPP principle, especially
after the establishment of the PPP law is currently under consideration.
River basin water quality management has been demonstrated in three major river basins, namely Cau, Nhue-Day, and Don-Nai. Coordination of relevant local governments has been promoted.
Current and future challengesEnsuring water environmental management policies and measures by
- addressing duplication of rules across different areas of legislation;
- development of incentives for compliance;- strengthening of inspection and guidance by the government
Coordination of relevant organizations.Promotion of water quality management at the basin level.
Thailand
Viet Nam
27
Chapter 1 Outlook on Water Environmental Management in WEPA countriesWEPA Outlook on Water Environmental Management in Asia 2012

28
Discussion and Findings on Priority Topics
2.1 Domestic Wastewater Treatment in Asia
2.2 Climate Change and the Water Environment - Summary of findings based on WEPA discussions and surveys -
Chapter
2
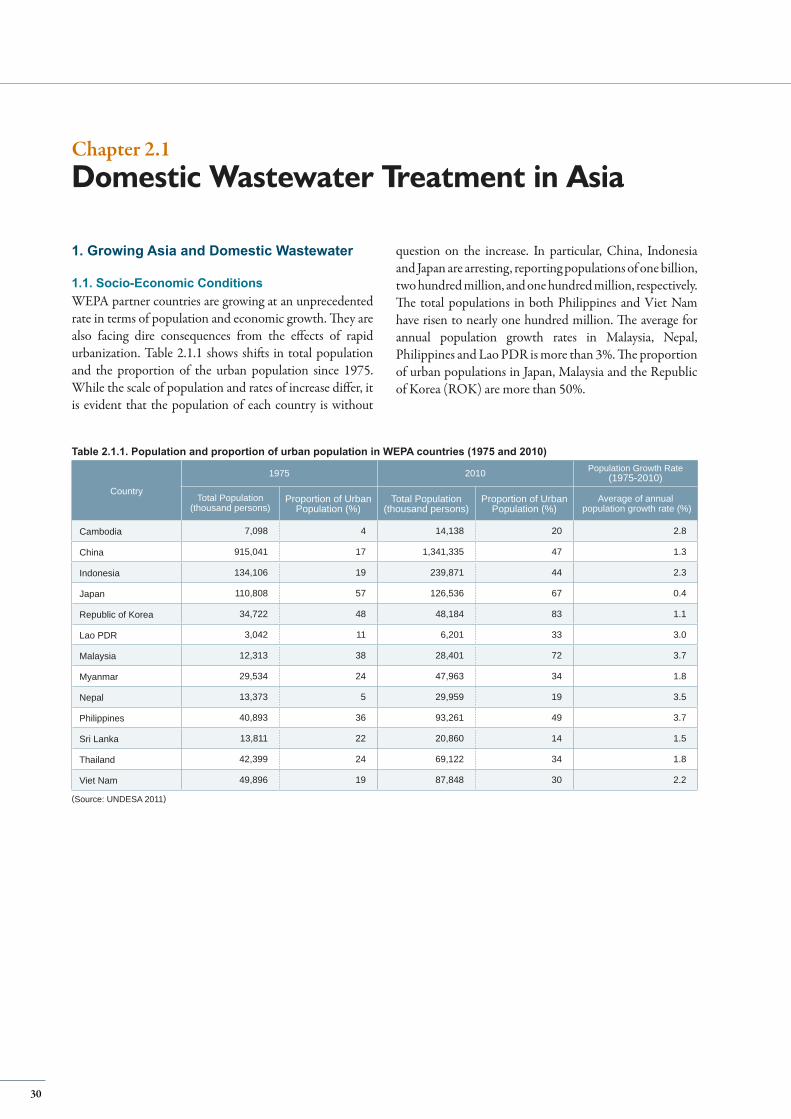
Country
1975 2010 Population Growth Rate (1975-2010)
Total Population (thousand persons)
Proportion of Urban Population (%)
Total Population (thousand persons)
Proportion of Urban Population (%)
Average of annual population growth rate (%)
Cambodia 7,098 4 14,138 20 2.8
China 915,041 17 1,341,335 47 1.3
Indonesia 134,106 19 239,871 44 2.3
Japan 110,808 57 126,536 67 0.4
Republic of Korea 34,722 48 48,184 83 1.1
Lao PDR 3,042 11 6,201 33 3.0
Malaysia 12,313 38 28,401 72 3.7
Myanmar 29,534 24 47,963 34 1.8
Nepal 13,373 5 29,959 19 3.5
Philippines 40,893 36 93,261 49 3.7
Sri Lanka 13,811 22 20,860 14 1.5
Thailand 42,399 24 69,122 34 1.8
Viet Nam 49,896 19 87,848 30 2.2
Table 2.1.1. Population and proportion of urban population in WEPA countries (1975 and 2010)
(Source: UNDESA 2011)
1. Growing Asia and Domestic Wastewater
1.1. Socio-Economic ConditionsWEPA partner countries are growing at an unprecedented rate in terms of population and economic growth. They are also facing dire consequences from the effects of rapid urbanization. Table 2.1.1 shows shifts in total population and the proportion of the urban population since 1975. While the scale of population and rates of increase differ, it is evident that the population of each country is without
question on the increase. In particular, China, Indonesia and Japan are arresting, reporting populations of one billion, two hundred million, and one hundred million, respectively. The total populations in both Philippines and Viet Nam have risen to nearly one hundred million. The average for annual population growth rates in Malaysia, Nepal, Philippines and Lao PDR is more than 3%. The proportion of urban populations in Japan, Malaysia and the Republic of Korea (ROK) are more than 50%.
Chapter 2.1Domestic Wastewater Treatment in Asia
30
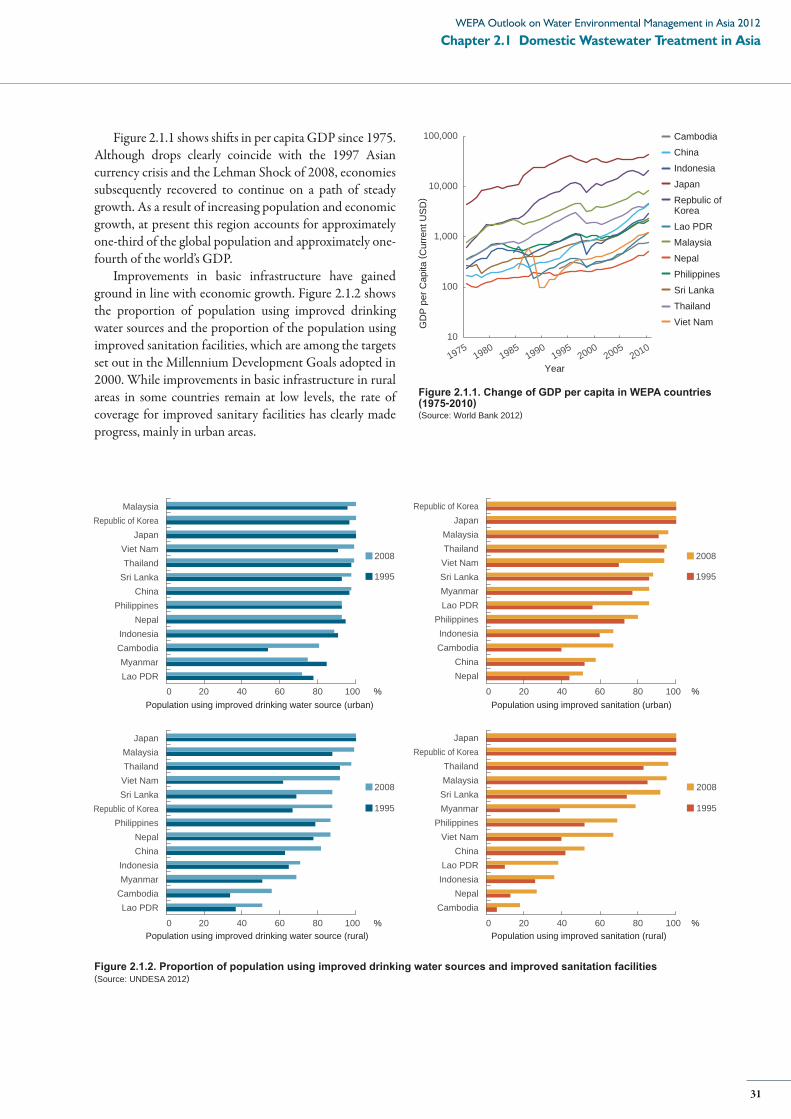
Figure 2.1.1 shows shifts in per capita GDP since 1975. Although drops clearly coincide with the 1997 Asian currency crisis and the Lehman Shock of 2008, economies subsequently recovered to continue on a path of steady growth. As a result of increasing population and economic growth, at present this region accounts for approximately one-third of the global population and approximately one-fourth of the world’s GDP.
Improvements in basic infrastructure have gained ground in line with economic growth. Figure 2.1.2 shows the proportion of population using improved drinking water sources and the proportion of the population using improved sanitation facilities, which are among the targets set out in the Millennium Development Goals adopted in 2000. While improvements in basic infrastructure in rural areas in some countries remain at low levels, the rate of coverage for improved sanitary facilities has clearly made progress, mainly in urban areas.
Figure 2.1.2. Proportion of population using improved drinking water sources and improved sanitation facilities(Source: UNDESA 2012)
10
100
1,000
10,000
100,000
19751980
19851990
19952000
20052010
GD
P p
er C
apita
( Cur
rent
US
D)
Year
Cambodia
Repbulic ofKorea
Lao PDR
Sri Lanka
Malaysia
Nepal
Philippines
Thailand
Viet Nam
China
Indonesia
Japan
0 20 40 60 80 100Lao PDRMyanmar
CambodiaIndonesia
NepalPhilippines
ChinaSri LankaThailandViet Nam
JapanRepublic of Korea
Malaysia
Population using improved drinking water source (urban) Population using improved sanitation (urban)
Population using improved drinking water source (rural) Population using improved sanitation (rural)
%
2008
1995
0 20 40 60 80 100
Lao PDRCambodiaMyanmarIndonesia
ChinaNepal
PhilippinesRepublic of Korea
Sri LankaViet NamThailandMalaysia
Japan
%
2008
1995
0 20 40 60 80 100
NepalChina
CambodiaIndonesia
PhilippinesLao PDRMyanmarSri LankaViet NamThailandMalaysia
JapanRepublic of Korea
%
2008
1995
0 20 40 60 80 100
CambodiaNepal
IndonesiaLao PDR
ChinaViet Nam
PhilippinesMyanmarSri LankaMalaysiaThailand
Republic of KoreaJapan
%
2008
1995
Figure 2.1.1. Change of GDP per capita in WEPA countries (1975-2010)(Source: World Bank 2012)
31
Chapter 2.1 Domestic Wastewater Treatment in AsiaWEPA Outlook on Water Environmental Management in Asia 2012
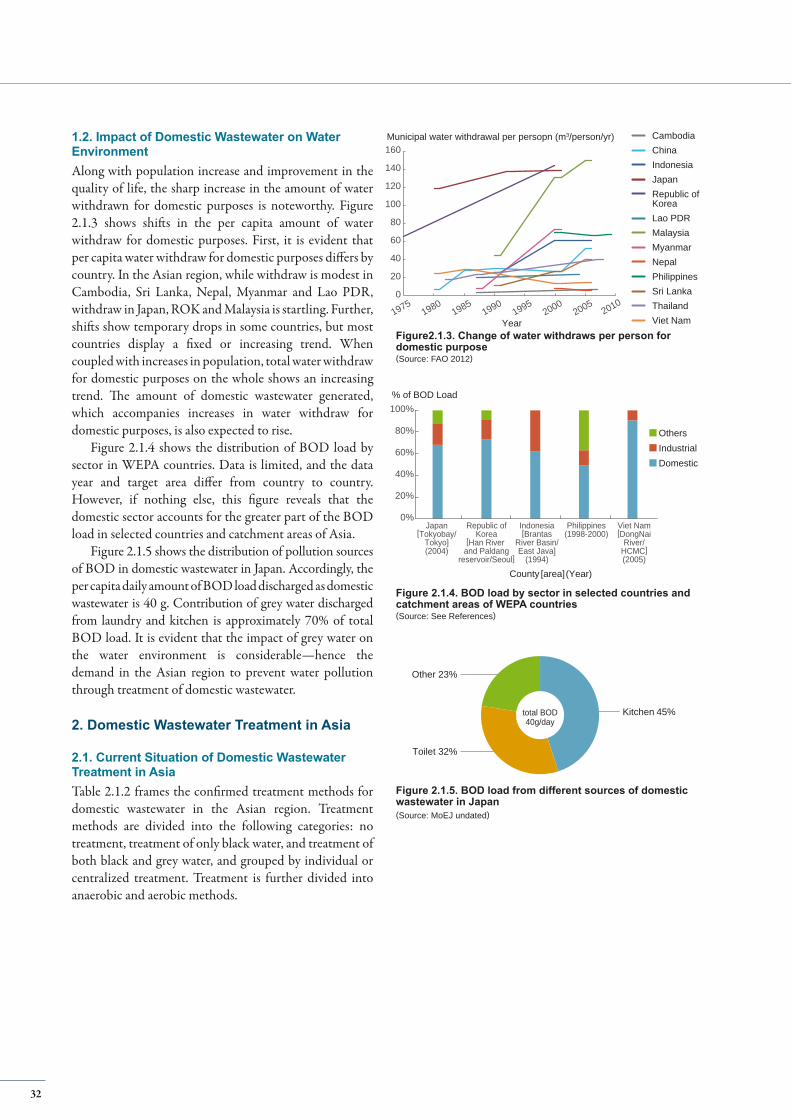
0%
20%
40%
60%
80%
100%% of BOD Load
County [area](Year)
Japan[Tokyobay/
Tokyo](2004)
Republic ofKorea
[Han River and Paldang
reservoir/Seoul]
Indonesia[Brantas
River Basin/East Java]
(1994)
Philippines(1998-2000)
Viet Nam[DongNai
River/HCMC](2005)
OthersIndustrialDomestic
Other 23%
Kitchen 45%
Toilet 32%
total BOD40g/day
Figure 2.1.4. BOD load by sector in selected countries and catchment areas of WEPA countries(Source: See References)
Figure 2.1.5. BOD load from different sources of domestic wastewater in Japan(Source: MoEJ undated)
0
20
40
60
80
100
120
140
160
19751980
19851990
19952000
20052010
Municipal water withdrawal per persopn (m3/person/yr)
Year
Malaysia
Philippines
ThailandViet Nam
Indonesia
Cambodia
Lao PDR
Republic ofKorea
Sri Lanka
China
MyanmarNepal
Japan
Figure2.1.3. Change of water withdraws per person for domestic purpose(Source: FAO 2012)
1.2. Impact of Domestic Wastewater on Water Environment Along with population increase and improvement in the quality of life, the sharp increase in the amount of water withdrawn for domestic purposes is noteworthy. Figure 2.1.3 shows shifts in the per capita amount of water withdraw for domestic purposes. First, it is evident that per capita water withdraw for domestic purposes differs by country. In the Asian region, while withdraw is modest in Cambodia, Sri Lanka, Nepal, Myanmar and Lao PDR, withdraw in Japan, ROK and Malaysia is startling. Further, shifts show temporary drops in some countries, but most countries display a fixed or increasing trend. When coupled with increases in population, total water withdraw for domestic purposes on the whole shows an increasing trend. The amount of domestic wastewater generated, which accompanies increases in water withdraw for domestic purposes, is also expected to rise.
Figure 2.1.4 shows the distribution of BOD load by sector in WEPA countries. Data is limited, and the data year and target area differ from country to country. However, if nothing else, this figure reveals that the domestic sector accounts for the greater part of the BOD load in selected countries and catchment areas of Asia.
Figure 2.1.5 shows the distribution of pollution sources of BOD in domestic wastewater in Japan. Accordingly, the per capita daily amount of BOD load discharged as domestic wastewater is 40 g. Contribution of grey water discharged from laundry and kitchen is approximately 70% of total BOD load. It is evident that the impact of grey water on the water environment is considerable—hence the demand in the Asian region to prevent water pollution through treatment of domestic wastewater.
2. Domestic Wastewater Treatment in Asia
2.1. Current Situation of Domestic Wastewater Treatment in AsiaTable 2.1.2 frames the confirmed treatment methods for domestic wastewater in the Asian region. Treatment methods are divided into the following categories: no treatment, treatment of only black water, and treatment of both black and grey water, and grouped by individual or centralized treatment. Treatment is further divided into anaerobic and aerobic methods.
32
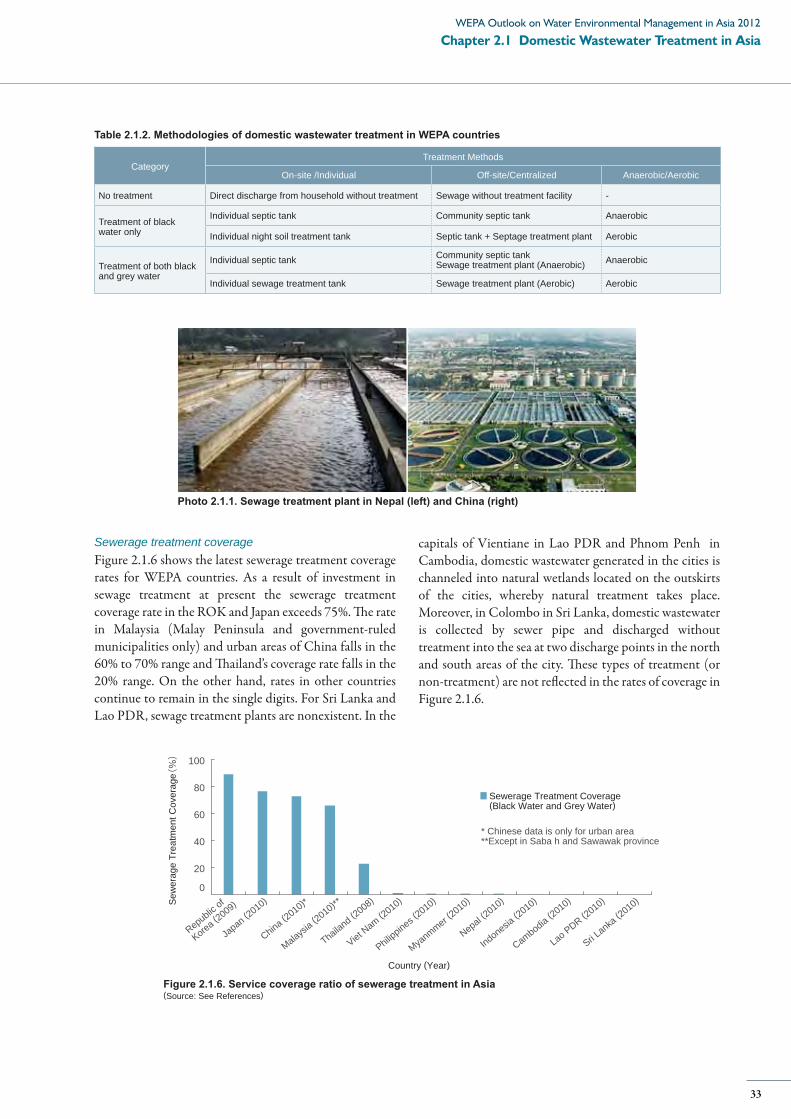
Sewerage treatment coverageFigure 2.1.6 shows the latest sewerage treatment coverage rates for WEPA countries. As a result of investment in sewage treatment at present the sewerage treatment coverage rate in the ROK and Japan exceeds 75%. The rate in Malaysia (Malay Peninsula and government-ruled municipalities only) and urban areas of China falls in the 60% to 70% range and Thailand’s coverage rate falls in the 20% range. On the other hand, rates in other countries continue to remain in the single digits. For Sri Lanka and Lao PDR, sewage treatment plants are nonexistent. In the
0
20
40
60
80
100
Sew
erag
e Tr
eatm
ent C
over
age (%)
Country (Year)
Sewerage Treatment Coverage(Black Water and Grey Water)
* Chinese data is only for urban area**Except in Saba h and Sawawak province
Japan (2
010)
China (2010)*
Malaysia (2
010)**
Thailand (2008)
Viet Nam (2
010)
Philippines (
2010)
Myanmmer (2
010)
Nepal (2010)
Indonesia (2
010)
Cambodia (2010)
Lao PDR (2010)
Sri Lanka
(2010)
Republic of
Korea (2009)
Figure 2.1.6. Service coverage ratio of sewerage treatment in Asia(Source: See References)
Photo 2.1.1. Sewage treatment plant in Nepal (left) and China (right)
capitals of Vientiane in Lao PDR and Phnom Penh in Cambodia, domestic wastewater generated in the cities is channeled into natural wetlands located on the outskirts of the cities, whereby natural treatment takes place. Moreover, in Colombo in Sri Lanka, domestic wastewater is collected by sewer pipe and discharged without treatment into the sea at two discharge points in the north and south areas of the city. These types of treatment (or non-treatment) are not reflected in the rates of coverage in Figure 2.1.6.
CategoryTreatment Methods
On-site /Individual Off-site/Centralized Anaerobic/Aerobic
No treatment Direct discharge from household without treatment Sewage without treatment facility -
Treatment of black water only
Individual septic tank Community septic tank Anaerobic
Individual night soil treatment tank Septic tank + Septage treatment plant Aerobic
Treatment of both black and grey water
Individual septic tank Community septic tankSewage treatment plant (Anaerobic) Anaerobic
Individual sewage treatment tank Sewage treatment plant (Aerobic) Aerobic
Table 2.1.2. Methodologies of domestic wastewater treatment in WEPA countries
33
Chapter 2.1 Domestic Wastewater Treatment in AsiaWEPA Outlook on Water Environmental Management in Asia 2012
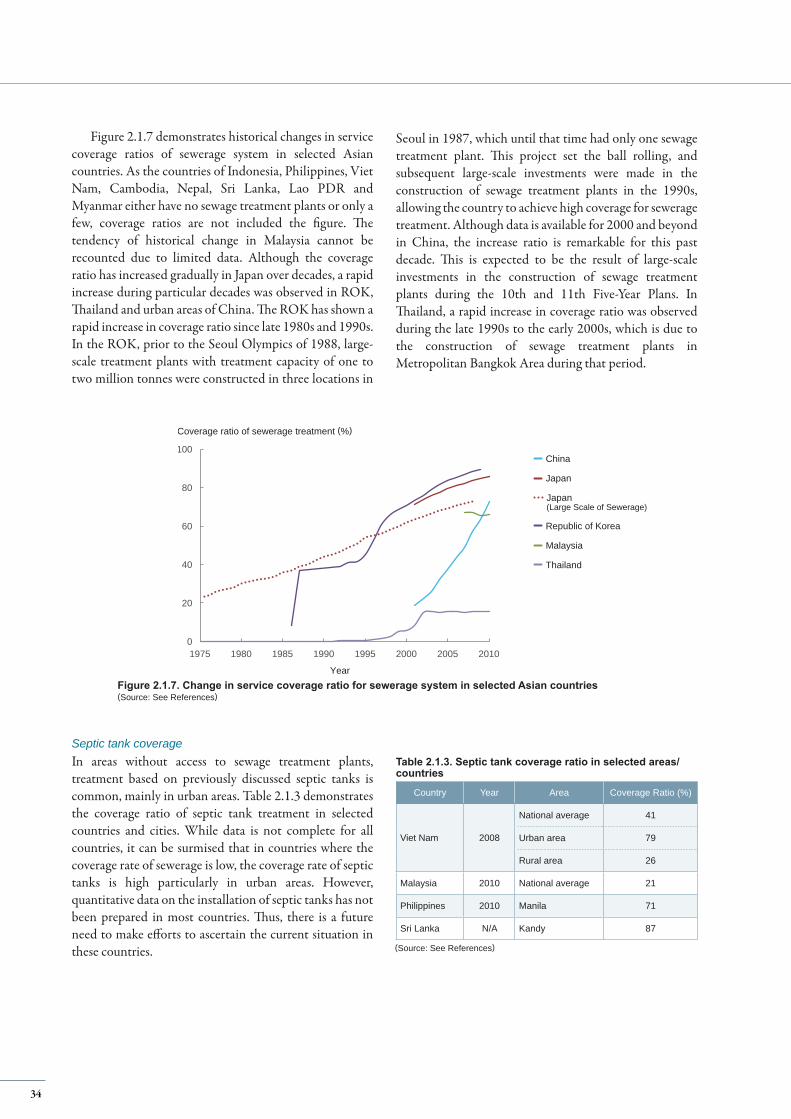
Septic tank coverageIn areas without access to sewage treatment plants, treatment based on previously discussed septic tanks is common, mainly in urban areas. Table 2.1.3 demonstrates the coverage ratio of septic tank treatment in selected countries and cities. While data is not complete for all countries, it can be surmised that in countries where the coverage rate of sewerage is low, the coverage rate of septic tanks is high particularly in urban areas. However, quantitative data on the installation of septic tanks has not been prepared in most countries. Thus, there is a future need to make efforts to ascertain the current situation in these countries.
Country Year Area Coverage Ratio (%)
Viet Nam 2008
National average 41
Urban area 79
Rural area 26
Malaysia 2010 National average 21
Philippines 2010 Manila 71
Sri Lanka N/A Kandy 87
Table 2.1.3. Septic tank coverage ratio in selected areas/countries
Figure 2.1.7 demonstrates historical changes in service coverage ratios of sewerage system in selected Asian countries. As the countries of Indonesia, Philippines, Viet Nam, Cambodia, Nepal, Sri Lanka, Lao PDR and Myanmar either have no sewage treatment plants or only a few, coverage ratios are not included the figure. The tendency of historical change in Malaysia cannot be recounted due to limited data. Although the coverage ratio has increased gradually in Japan over decades, a rapid increase during particular decades was observed in ROK, Thailand and urban areas of China. The ROK has shown a rapid increase in coverage ratio since late 1980s and 1990s. In the ROK, prior to the Seoul Olympics of 1988, large-scale treatment plants with treatment capacity of one to two million tonnes were constructed in three locations in
0
20
40
60
80
100
1975 1980 1985 1990 1995 2000 2005 2010
Coverage ratio of sewerage treatment (%)
Year
Japan
Japan(Large Scale of Sewerage)
Republic of Korea
Malaysia
Thailand
China
Figure 2.1.7. Change in service coverage ratio for sewerage system in selected Asian countries(Source: See References)
Seoul in 1987, which until that time had only one sewage treatment plant. This project set the ball rolling, and subsequent large-scale investments were made in the construction of sewage treatment plants in the 1990s, allowing the country to achieve high coverage for sewerage treatment. Although data is available for 2000 and beyond in China, the increase ratio is remarkable for this past decade. This is expected to be the result of large-scale investments in the construction of sewage treatment plants during the 10th and 11th Five-Year Plans. In Thailand, a rapid increase in coverage ratio was observed during the late 1990s to the early 2000s, which is due to the construction of sewage treatment plants in Metropolitan Bangkok Area during that period.
(Source: See References)
34
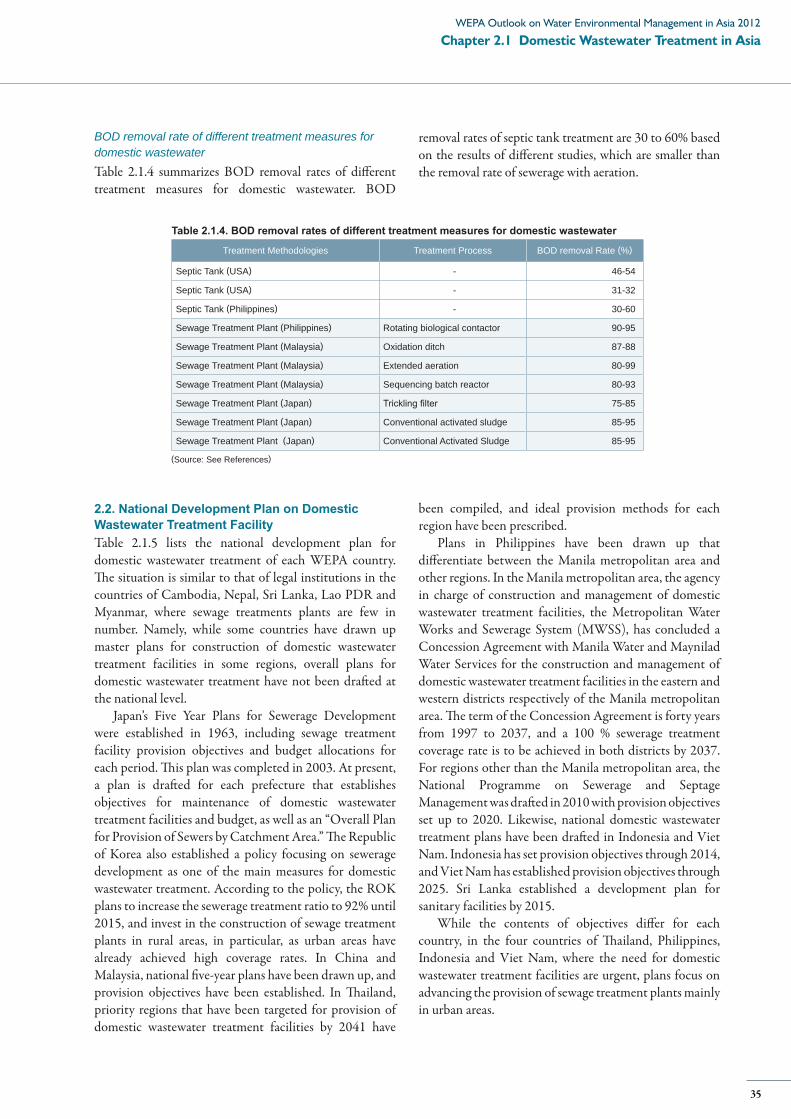
BOD removal rate of different treatment measures for domestic wastewaterTable 2.1.4 summarizes BOD removal rates of different treatment measures for domestic wastewater. BOD
Treatment Methodologies Treatment Process BOD removal Rate (%)
Septic Tank (USA) - 46-54
Septic Tank (USA) - 31-32
Septic Tank (Philippines) - 30-60
Sewage Treatment Plant (Philippines) Rotating biological contactor 90-95
Sewage Treatment Plant (Malaysia) Oxidation ditch 87-88
Sewage Treatment Plant (Malaysia) Extended aeration 80-99
Sewage Treatment Plant (Malaysia) Sequencing batch reactor 80-93
Sewage Treatment Plant (Japan) Trickling filter 75-85
Sewage Treatment Plant (Japan) Conventional activated sludge 85-95
Sewage Treatment Plant (Japan) Conventional Activated Sludge 85-95
Table 2.1.4. BOD removal rates of different treatment measures for domestic wastewater
2.2. National Development Plan on Domestic Wastewater Treatment FacilityTable 2.1.5 lists the national development plan for domestic wastewater treatment of each WEPA country. The situation is similar to that of legal institutions in the countries of Cambodia, Nepal, Sri Lanka, Lao PDR and Myanmar, where sewage treatments plants are few in number. Namely, while some countries have drawn up master plans for construction of domestic wastewater treatment facilities in some regions, overall plans for domestic wastewater treatment have not been drafted at the national level.
Japan’s Five Year Plans for Sewerage Development were established in 1963, including sewage treatment facility provision objectives and budget allocations for each period. This plan was completed in 2003. At present, a plan is drafted for each prefecture that establishes objectives for maintenance of domestic wastewater treatment facilities and budget, as well as an “Overall Plan for Provision of Sewers by Catchment Area.” The Republic of Korea also established a policy focusing on sewerage development as one of the main measures for domestic wastewater treatment. According to the policy, the ROK plans to increase the sewerage treatment ratio to 92% until 2015, and invest in the construction of sewage treatment plants in rural areas, in particular, as urban areas have already achieved high coverage rates. In China and Malaysia, national five-year plans have been drawn up, and provision objectives have been established. In Thailand, priority regions that have been targeted for provision of domestic wastewater treatment facilities by 2041 have
been compiled, and ideal provision methods for each region have been prescribed.
Plans in Philippines have been drawn up that differentiate between the Manila metropolitan area and other regions. In the Manila metropolitan area, the agency in charge of construction and management of domestic wastewater treatment facilities, the Metropolitan Water Works and Sewerage System (MWSS), has concluded a Concession Agreement with Manila Water and Maynilad Water Services for the construction and management of domestic wastewater treatment facilities in the eastern and western districts respectively of the Manila metropolitan area. The term of the Concession Agreement is forty years from 1997 to 2037, and a 100 % sewerage treatment coverage rate is to be achieved in both districts by 2037. For regions other than the Manila metropolitan area, the National Programme on Sewerage and Septage Management was drafted in 2010 with provision objectives set up to 2020. Likewise, national domestic wastewater treatment plans have been drafted in Indonesia and Viet Nam. Indonesia has set provision objectives through 2014, and Viet Nam has established provision objectives through 2025. Sri Lanka established a development plan for sanitary facilities by 2015.
While the contents of objectives differ for each country, in the four countries of Thailand, Philippines, Indonesia and Viet Nam, where the need for domestic wastewater treatment facilities are urgent, plans focus on advancing the provision of sewage treatment plants mainly in urban areas.
removal rates of septic tank treatment are 30 to 60% based on the results of different studies, which are smaller than the removal rate of sewerage with aeration.
(Source: See References)
35
Chapter 2.1 Domestic Wastewater Treatment in AsiaWEPA Outlook on Water Environmental Management in Asia 2012
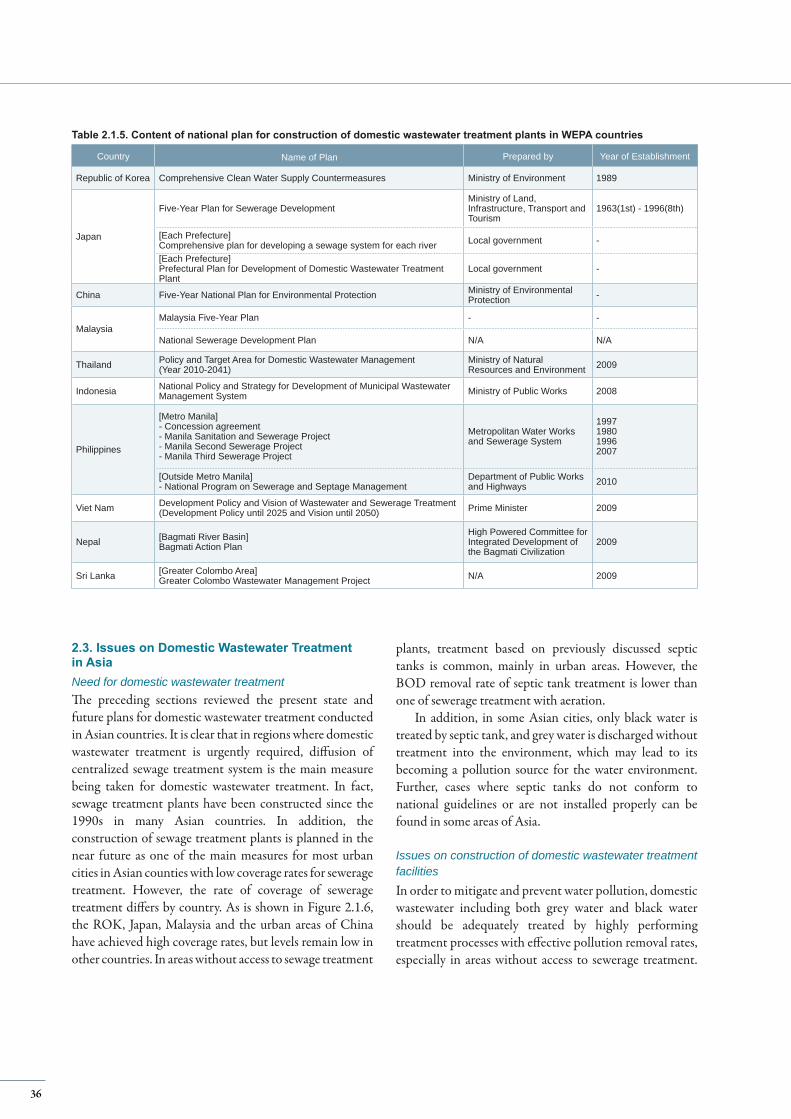
2.3. Issues on Domestic Wastewater Treatmentin Asia Need for domestic wastewater treatmentThe preceding sections reviewed the present state and future plans for domestic wastewater treatment conducted in Asian countries. It is clear that in regions where domestic wastewater treatment is urgently required, diffusion of centralized sewage treatment system is the main measure being taken for domestic wastewater treatment. In fact, sewage treatment plants have been constructed since the 1990s in many Asian countries. In addition, the construction of sewage treatment plants is planned in the near future as one of the main measures for most urban cities in Asian counties with low coverage rates for sewerage treatment. However, the rate of coverage of sewerage treatment differs by country. As is shown in Figure 2.1.6, the ROK, Japan, Malaysia and the urban areas of China have achieved high coverage rates, but levels remain low in other countries. In areas without access to sewage treatment
plants, treatment based on previously discussed septic tanks is common, mainly in urban areas. However, the BOD removal rate of septic tank treatment is lower than one of sewerage treatment with aeration.
In addition, in some Asian cities, only black water is treated by septic tank, and grey water is discharged without treatment into the environment, which may lead to its becoming a pollution source for the water environment. Further, cases where septic tanks do not conform to national guidelines or are not installed properly can be found in some areas of Asia.
Issues on construction of domestic wastewater treatment facilitiesIn order to mitigate and prevent water pollution, domestic wastewater including both grey water and black water should be adequately treated by highly performing treatment processes with effective pollution removal rates, especially in areas without access to sewerage treatment.
Country Name of Plan Prepared by Year of Establishment
Republic of Korea Comprehensive Clean Water Supply Countermeasures Ministry of Environment 1989
Japan
Five-Year Plan for Sewerage DevelopmentMinistry of Land, Infrastructure, Transport and Tourism
1963(1st) - 1996(8th)
[Each Prefecture]Comprehensive plan for developing a sewage system for each river Local government -
[Each Prefecture]Prefectural Plan for Development of Domestic Wastewater Treatment Plant
Local government -
China Five-Year National Plan for Environmental Protection Ministry of Environmental Protection -
MalaysiaMalaysia Five-Year Plan - -
National Sewerage Development Plan N/A N/A
Thailand Policy and Target Area for Domestic Wastewater Management(Year 2010-2041)
Ministry of Natural Resources and Environment 2009
Indonesia National Policy and Strategy for Development of Municipal Wastewater Management System Ministry of Public Works 2008
Philippines
[Metro Manila]- Concession agreement- Manila Sanitation and Sewerage Project- Manila Second Sewerage Project- Manila Third Sewerage Project
Metropolitan Water Works and Sewerage System
1997 198019962007
[Outside Metro Manila]- National Program on Sewerage and Septage Management
Department of Public Works and Highways 2010
Viet Nam Development Policy and Vision of Wastewater and Sewerage Treatment (Development Policy until 2025 and Vision until 2050) Prime Minister 2009
Nepal [Bagmati River Basin]Bagmati Action Plan
High Powered Committee for Integrated Development of the Bagmati Civilization
2009
Sri Lanka [Greater Colombo Area]Greater Colombo Wastewater Management Project N/A 2009
Table 2.1.5. Content of national plan for construction of domestic wastewater treatment plants in WEPA countries
36
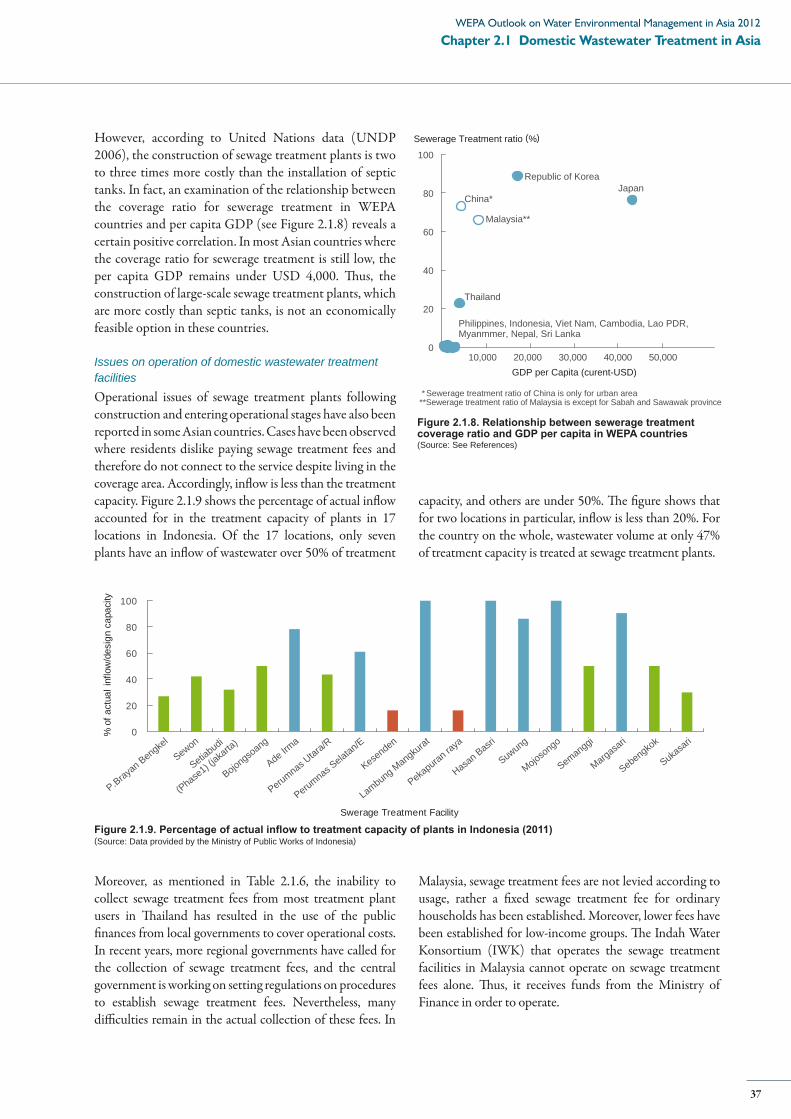
0
20
40
60
80
100
% o
f act
ual i
nflo
w/d
esig
n ca
paci
ty
Swerage Treatment Facility
P.Brayan Bengke
l
Sewon
Setiabudi
(Phase1) (j
akarta
)
Bojongsoang
Ade Irma
Perumnas Utara/R
Perumnas Selatan/E
Kesenden
Lambung Mangku
rat
Pekapuran ra
ya
Hasan Basri
Suwung
Mojosongo
Semanggi
Margasari
Sebengkok
Sukasa
ri
Figure 2.1.9. Percentage of actual inflow to treatment capacity of plants in Indonesia (2011)(Source: Data provided by the Ministry of Public Works of Indonesia)
However, according to United Nations data (UNDP 2006), the construction of sewage treatment plants is two to three times more costly than the installation of septic tanks. In fact, an examination of the relationship between the coverage ratio for sewerage treatment in WEPA countries and per capita GDP (see Figure 2.1.8) reveals a certain positive correlation. In most Asian countries where the coverage ratio for sewerage treatment is still low, the per capita GDP remains under USD 4,000. Thus, the construction of large-scale sewage treatment plants, which are more costly than septic tanks, is not an economically feasible option in these countries.
Issues on operation of domestic wastewater treatment facilitiesOperational issues of sewage treatment plants following construction and entering operational stages have also been reported in some Asian countries. Cases have been observed where residents dislike paying sewage treatment fees and therefore do not connect to the service despite living in the coverage area. Accordingly, inflow is less than the treatment capacity. Figure 2.1.9 shows the percentage of actual inflow accounted for in the treatment capacity of plants in 17 locations in Indonesia. Of the 17 locations, only seven plants have an inflow of wastewater over 50% of treatment
capacity, and others are under 50%. The figure shows that for two locations in particular, inflow is less than 20%. For the country on the whole, wastewater volume at only 47% of treatment capacity is treated at sewage treatment plants.
Moreover, as mentioned in Table 2.1.6, the inability to collect sewage treatment fees from most treatment plant users in Thailand has resulted in the use of the public finances from local governments to cover operational costs. In recent years, more regional governments have called for the collection of sewage treatment fees, and the central government is working on setting regulations on procedures to establish sewage treatment fees. Nevertheless, many difficulties remain in the actual collection of these fees. In
0
20
40
60
80
100
Sewerage Treatment ratio (%)
GDP per Capita (curent-USD)
JapanRepublic of Korea
China*
Malaysia**
Thailand
Philippines, Indonesia, Viet Nam, Cambodia, Lao PDR,Myanmmer, Nepal, Sri Lanka
* Sewerage treatment ratio of China is only for urban area**Sewerage treatment ratio of Malaysia is except for Sabah and Sawawak province
10,000 20,000 30,000 40,000 50,000
Figure 2.1.8. Relationship between sewerage treatment coverage ratio and GDP per capita in WEPA countries(Source: See References)
Malaysia, sewage treatment fees are not levied according to usage, rather a fixed sewage treatment fee for ordinary households has been established. Moreover, lower fees have been established for low-income groups. The Indah Water Konsortium (IWK) that operates the sewage treatment facilities in Malaysia cannot operate on sewage treatment fees alone. Thus, it receives funds from the Ministry of Finance in order to operate.
37
Chapter 2.1 Domestic Wastewater Treatment in AsiaWEPA Outlook on Water Environmental Management in Asia 2012
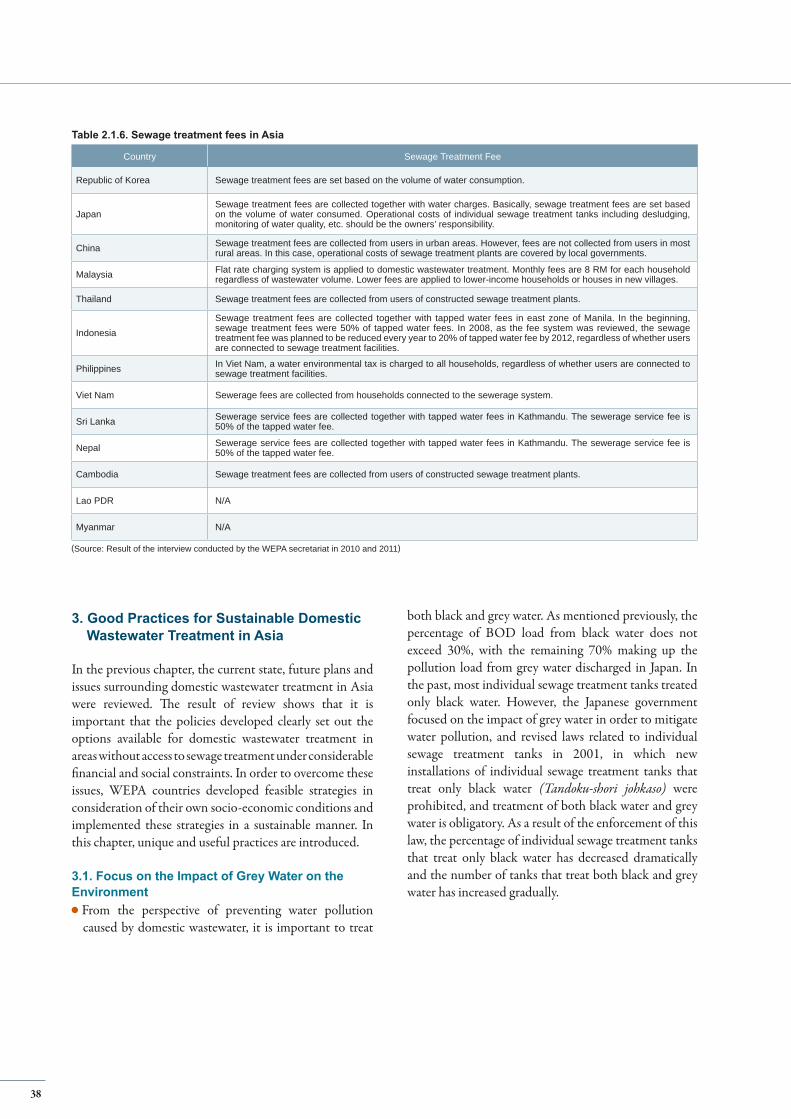
Country Sewage Treatment Fee
Republic of Korea Sewage treatment fees are set based on the volume of water consumption.
JapanSewage treatment fees are collected together with water charges. Basically, sewage treatment fees are set based on the volume of water consumed. Operational costs of individual sewage treatment tanks including desludging, monitoring of water quality, etc. should be the owners’ responsibility.
China Sewage treatment fees are collected from users in urban areas. However, fees are not collected from users in most rural areas. In this case, operational costs of sewage treatment plants are covered by local governments.
Malaysia Flat rate charging system is applied to domestic wastewater treatment. Monthly fees are 8 RM for each household regardless of wastewater volume. Lower fees are applied to lower-income households or houses in new villages.
Thailand Sewage treatment fees are collected from users of constructed sewage treatment plants.
Indonesia Sewage treatment fees are collected together with tapped water fees in east zone of Manila. In the beginning, sewage treatment fees were 50% of tapped water fees. In 2008, as the fee system was reviewed, the sewage treatment fee was planned to be reduced every year to 20% of tapped water fee by 2012, regardless of whether users are connected to sewage treatment facilities.
Philippines In Viet Nam, a water environmental tax is charged to all households, regardless of whether users are connected to sewage treatment facilities.
Viet Nam Sewerage fees are collected from households connected to the sewerage system.
Sri Lanka Sewerage service fees are collected together with tapped water fees in Kathmandu. The sewerage service fee is 50% of the tapped water fee.
Nepal Sewerage service fees are collected together with tapped water fees in Kathmandu. The sewerage service fee is 50% of the tapped water fee.
Cambodia Sewage treatment fees are collected from users of constructed sewage treatment plants.
Lao PDR N/A
Myanmar N/A
Table 2.1.6. Sewage treatment fees in Asia
(Source: Result of the interview conducted by the WEPA secretariat in 2010 and 2011)
3. Good Practices for Sustainable Domestic Wastewater Treatment in Asia
In the previous chapter, the current state, future plans and issues surrounding domestic wastewater treatment in Asia were reviewed. The result of review shows that it is important that the policies developed clearly set out the options available for domestic wastewater treatment in areas without access to sewage treatment under considerable financial and social constraints. In order to overcome these issues, WEPA countries developed feasible strategies in consideration of their own socio-economic conditions and implemented these strategies in a sustainable manner. In this chapter, unique and useful practices are introduced.
3.1. Focus on the Impact of Grey Water on the Environment
From the perspective of preventing water pollution caused by domestic wastewater, it is important to treat
both black and grey water. As mentioned previously, the percentage of BOD load from black water does not exceed 30%, with the remaining 70% making up the pollution load from grey water discharged in Japan. In the past, most individual sewage treatment tanks treated only black water. However, the Japanese government focused on the impact of grey water in order to mitigate water pollution, and revised laws related to individual sewage treatment tanks in 2001, in which new installations of individual sewage treatment tanks that treat only black water (Tandoku-shori johkaso) were prohibited, and treatment of both black water and grey water is obligatory. As a result of the enforcement of this law, the percentage of individual sewage treatment tanks that treat only black water has decreased dramatically and the number of tanks that treat both black and grey water has increased gradually.
38
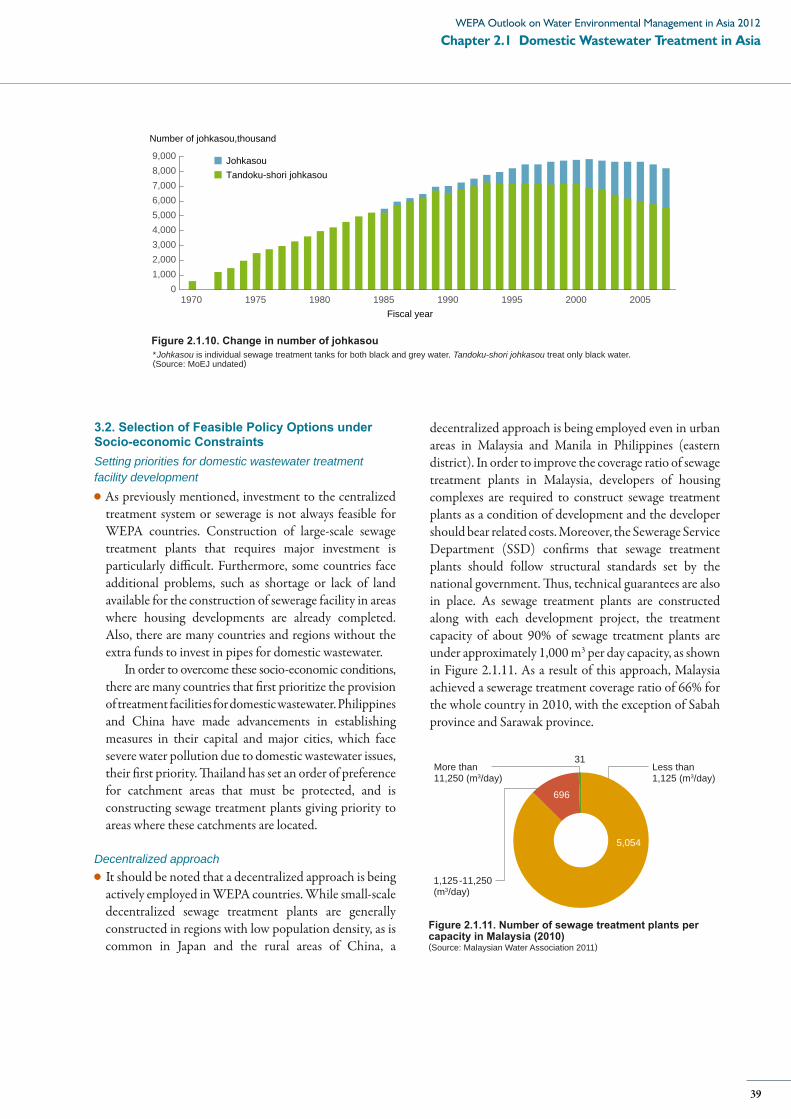
1,0000
2,0003,0004,0005,0006,000
9,000
7,0008,000
1970 1975 1980 1985 1990 1995 2000 2005Fiscal year
Number of johkasou,thousand
JohkasouTandoku-shori johkasou
Figure 2.1.10. Change in number of johkasou* Johkasou is individual sewage treatment tanks for both black and grey water. Tandoku-shori johkasou treat only black water.(Source: MoEJ undated)
3.2. Selection of Feasible Policy Options under Socio-economic ConstraintsSetting priorities for domestic wastewater treatment facility development
As previously mentioned, investment to the centralized treatment system or sewerage is not always feasible for WEPA countries. Construction of large-scale sewage treatment plants that requires major investment is particularly difficult. Furthermore, some countries face additional problems, such as shortage or lack of land available for the construction of sewerage facility in areas where housing developments are already completed.Also, there are many countries and regions without the extra funds to invest in pipes for domestic wastewater.
In order to overcome these socio-economic conditions, there are many countries that first prioritize the provision of treatment facilities for domestic wastewater. Philippines and China have made advancements in establishing measures in their capital and major cities, which face severe water pollution due to domestic wastewater issues, their first priority. Thailand has set an order of preference for catchment areas that must be protected, and is constructing sewage treatment plants giving priority to areas where these catchments are located.
Decentralized approachIt should be noted that a decentralized approach is being actively employed in WEPA countries. While small-scale decentralized sewage treatment plants are generally constructed in regions with low population density, as is common in Japan and the rural areas of China, a
decentralized approach is being employed even in urban areas in Malaysia and Manila in Philippines (eastern district). In order to improve the coverage ratio of sewage treatment plants in Malaysia, developers of housing complexes are required to construct sewage treatment plants as a condition of development and the developer should bear related costs. Moreover, the Sewerage Service Department (SSD) confirms that sewage treatment plants should follow structural standards set by the national government. Thus, technical guarantees are also in place. As sewage treatment plants are constructed along with each development project, the treatment capacity of about 90% of sewage treatment plants are under approximately 1,000 m3 per day capacity, as shown in Figure 2.1.11. As a result of this approach, Malaysia achieved a sewerage treatment coverage ratio of 66% for the whole country in 2010, with the exception of Sabah province and Sarawak province.
31More than11,250 (m3/day)
Less than1,125 (m3/day)
1,125-11,250(m3/day)
5,054
696
Figure 2.1.11. Number of sewage treatment plants per capacity in Malaysia (2010) (Source: Malaysian Water Association 2011)
39
Chapter 2.1 Domestic Wastewater Treatment in AsiaWEPA Outlook on Water Environmental Management in Asia 2012
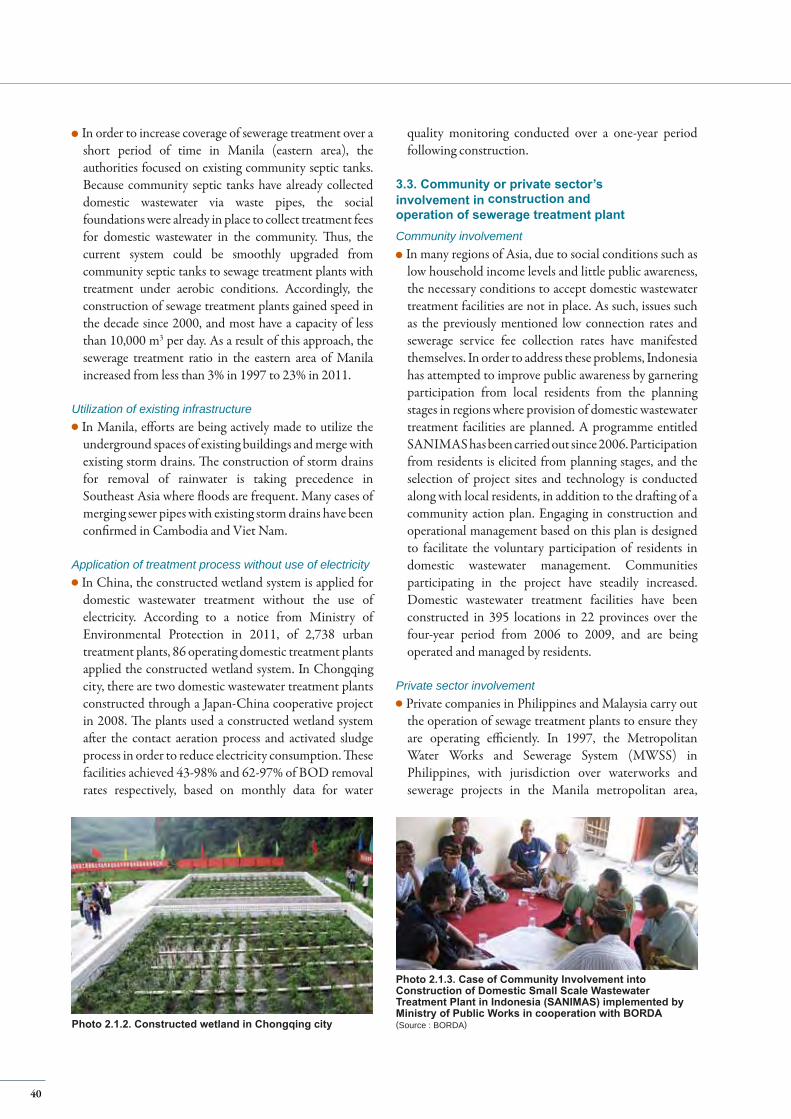
quality monitoring conducted over a one-year period following construction.
3.3. Community or private sector’sinvolvement in construction andoperation of sewerage treatment plant Community involvement
In many regions of Asia, due to social conditions such as low household income levels and little public awareness, the necessary conditions to accept domestic wastewater treatment facilities are not in place. As such, issues such as the previously mentioned low connection rates and sewerage service fee collection rates have manifested themselves. In order to address these problems, Indonesia has attempted to improve public awareness by garnering participation from local residents from the planning stages in regions where provision of domestic wastewater treatment facilities are planned. A programme entitled SANIMAS has been carried out since 2006. Participation from residents is elicited from planning stages, and the selection of project sites and technology is conducted along with local residents, in addition to the drafting of a community action plan. Engaging in construction and operational management based on this plan is designed to facilitate the voluntary participation of residents in domestic wastewater management. Communities participating in the project have steadily increased. Domestic wastewater treatment facilities have been constructed in 395 locations in 22 provinces over the four-year period from 2006 to 2009, and are being operated and managed by residents.
Private sector involvementPrivate companies in Philippines and Malaysia carry out the operation of sewage treatment plants to ensure they are operating efficiently. In 1997, the Metropolitan Water Works and Sewerage System (MWSS) in Philippines, with jurisdiction over waterworks and sewerage projects in the Manila metropolitan area,
Photo 2.1.2. Constructed wetland in Chongqing city
In order to increase coverage of sewerage treatment over a short period of time in Manila (eastern area), the authorities focused on existing community septic tanks. Because community septic tanks have already collected domestic wastewater via waste pipes, the social foundations were already in place to collect treatment fees for domestic wastewater in the community. Thus, the current system could be smoothly upgraded from community septic tanks to sewage treatment plants with treatment under aerobic conditions. Accordingly, the construction of sewage treatment plants gained speed in the decade since 2000, and most have a capacity of less than 10,000 m3 per day. As a result of this approach, the sewerage treatment ratio in the eastern area of Manila increased from less than 3% in 1997 to 23% in 2011.
Utilization of existing infrastructureIn Manila, efforts are being actively made to utilize the underground spaces of existing buildings and merge with existing storm drains. The construction of storm drains for removal of rainwater is taking precedence in Southeast Asia where floods are frequent. Many cases of merging sewer pipes with existing storm drains have been confirmed in Cambodia and Viet Nam.
Application of treatment process without use of electricityIn China, the constructed wetland system is applied for domestic wastewater treatment without the use of electricity. According to a notice from Ministry of Environmental Protection in 2011, of 2,738 urban treatment plants, 86 operating domestic treatment plants applied the constructed wetland system. In Chongqing city, there are two domestic wastewater treatment plants constructed through a Japan-China cooperative project in 2008. The plants used a constructed wetland system after the contact aeration process and activated sludge process in order to reduce electricity consumption. These facilities achieved 43-98% and 62-97% of BOD removal rates respectively, based on monthly data for water
Photo 2.1.3. Case of Community Involvement into Construction of Domestic Small Scale Wastewater Treatment Plant in Indonesia (SANIMAS) implemented by Ministry of Public Works in cooperation with BORDA (Source : BORDA)
40
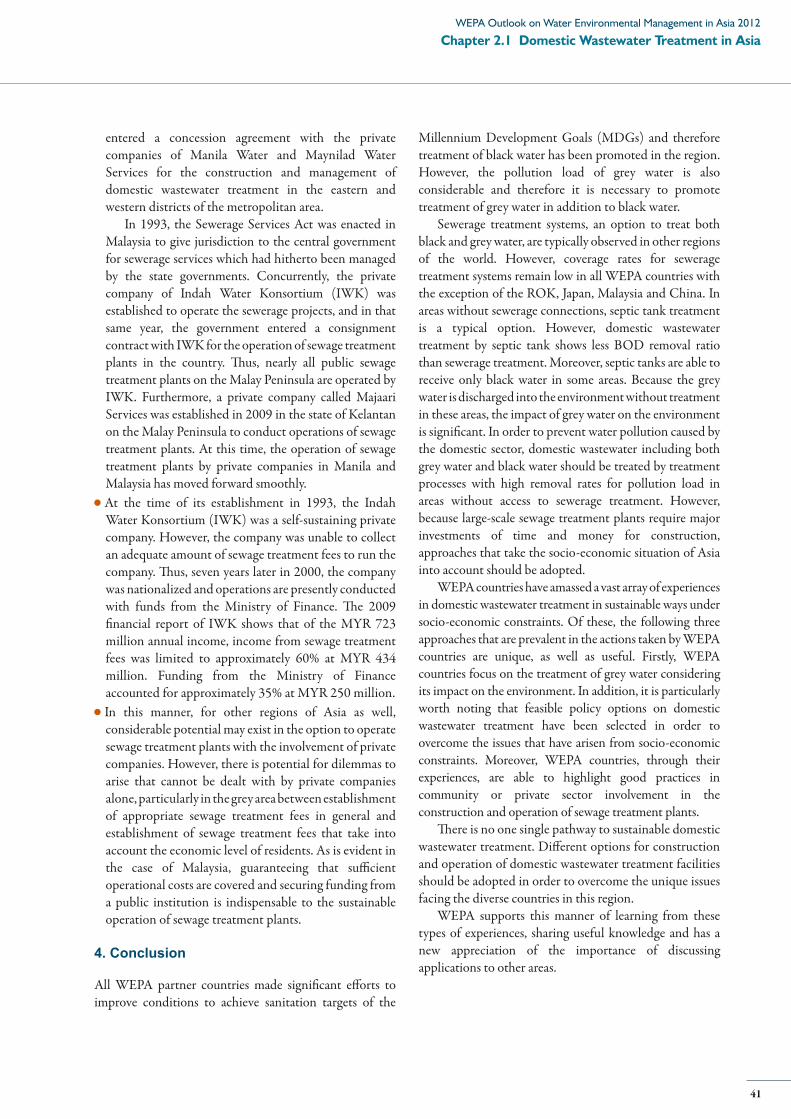
entered a concession agreement with the private companies of Manila Water and Maynilad Water Services for the construction and management of domestic wastewater treatment in the eastern and western districts of the metropolitan area.
In 1993, the Sewerage Services Act was enacted in Malaysia to give jurisdiction to the central government for sewerage services which had hitherto been managed by the state governments. Concurrently, the private company of Indah Water Konsortium (IWK) was established to operate the sewerage projects, and in that same year, the government entered a consignment contract with IWK for the operation of sewage treatment plants in the country. Thus, nearly all public sewage treatment plants on the Malay Peninsula are operated by IWK. Furthermore, a private company called Majaari Services was established in 2009 in the state of Kelantan on the Malay Peninsula to conduct operations of sewage treatment plants. At this time, the operation of sewage treatment plants by private companies in Manila and Malaysia has moved forward smoothly.At the time of its establishment in 1993, the Indah Water Konsortium (IWK) was a self-sustaining private company. However, the company was unable to collect an adequate amount of sewage treatment fees to run the company. Thus, seven years later in 2000, the company was nationalized and operations are presently conducted with funds from the Ministry of Finance. The 2009 financial report of IWK shows that of the MYR 723 million annual income, income from sewage treatment fees was limited to approximately 60% at MYR 434 million. Funding from the Ministry of Finance accounted for approximately 35% at MYR 250 million.In this manner, for other regions of Asia as well, considerable potential may exist in the option to operate sewage treatment plants with the involvement of private companies. However, there is potential for dilemmas to arise that cannot be dealt with by private companies alone, particularly in the grey area between establishment of appropriate sewage treatment fees in general and establishment of sewage treatment fees that take into account the economic level of residents. As is evident in the case of Malaysia, guaranteeing that sufficient operational costs are covered and securing funding from a public institution is indispensable to the sustainable operation of sewage treatment plants.
4. Conclusion
All WEPA partner countries made significant efforts to improve conditions to achieve sanitation targets of the
Millennium Development Goals (MDGs) and therefore treatment of black water has been promoted in the region. However, the pollution load of grey water is also considerable and therefore it is necessary to promote treatment of grey water in addition to black water.
Sewerage treatment systems, an option to treat both black and grey water, are typically observed in other regions of the world. However, coverage rates for sewerage treatment systems remain low in all WEPA countries with the exception of the ROK, Japan, Malaysia and China. In areas without sewerage connections, septic tank treatment is a typical option. However, domestic wastewater treatment by septic tank shows less BOD removal ratio than sewerage treatment. Moreover, septic tanks are able to receive only black water in some areas. Because the grey water is discharged into the environment without treatment in these areas, the impact of grey water on the environment is significant. In order to prevent water pollution caused by the domestic sector, domestic wastewater including both grey water and black water should be treated by treatment processes with high removal rates for pollution load in areas without access to sewerage treatment. However, because large-scale sewage treatment plants require major investments of time and money for construction, approaches that take the socio-economic situation of Asia into account should be adopted.
WEPA countries have amassed a vast array of experiences in domestic wastewater treatment in sustainable ways under socio-economic constraints. Of these, the following three approaches that are prevalent in the actions taken by WEPA countries are unique, as well as useful. Firstly, WEPA countries focus on the treatment of grey water considering its impact on the environment. In addition, it is particularly worth noting that feasible policy options on domestic wastewater treatment have been selected in order to overcome the issues that have arisen from socio-economic constraints. Moreover, WEPA countries, through their experiences, are able to highlight good practices in community or private sector involvement in the construction and operation of sewage treatment plants.
There is no one single pathway to sustainable domestic wastewater treatment. Different options for construction and operation of domestic wastewater treatment facilities should be adopted in order to overcome the unique issues facing the diverse countries in this region.
WEPA supports this manner of learning from these types of experiences, sharing useful knowledge and has a new appreciation of the importance of discussing applications to other areas.
41
Chapter 2.1 Domestic Wastewater Treatment in AsiaWEPA Outlook on Water Environmental Management in Asia 2012

1. Background
Climate change is one of the drivers of change in water resources and poses challenges to existing water management practices (Connor 2009). Climate change can affect the water environment in complex ways (Figure 2.2.1). Various direct and indirect impacts of climate change to the water environment are expected, which will occur in association with other socio-economic factors.
The Working Group II of the Intergovernmental Panel for Climate Change (IPCC) concluded that “higher water temperatures, increased precipitation intensity, and longer periods of low flows exacerbate many forms of water pollution, with impacts on ecosystems, human health, water system reliability and operating costs (high confidence)” (Kundzewicz et al. 2007). The impacts of human induced climate change include higher water temperatures that affect the self purification capacities of water bodies by reducing the amount of dissolved oxygen (DO), which consequently disrupts indigenous aquatic biological species. In addition to direct impacts on water temperature, the potential increase of water use in the energy sector for cooling purposes is also considered to be an indirect cause of higher water temperatures (Kunazewicz et al. 2007). An increase in water temperatures may result in an oxygen-deficient environment in lakes by increase in thermal stability and altered mixing patterns (Bates et al. 2008).
In addition to water temperature, changes in precipitation patterns, intensity and duration also affect water quality. Intense rainfall over short periods increases the amount of suspended solids, sediment, nutrients and other toxins in water bodies due to run-off. In addition, unreliable supplies of surface water caused by changes in precipitation patterns may increase dependency on groundwater for potable use, resulting in overexploitation of the groundwater resource, as well as increased risks to human health from arsenic and fluorine where they exist in groundwater. The rising of sea water levels due to climate change is another threat, resulting in salt water intrusion to surface and underground freshwater systems, consequently causing deterioration in water quality. The impact on human health and water quality due to flooding of polluted water is also identified as a potential risk. Combined with excessive water exploitation, problems from salt water
Climate Change and the Water Environment Summary of findings based on WEPA discussions and surveys
Chapter 2.2
intrusion would be more intensified in coastal cities. Increase of wastewater due to increased demand caused by atmospheric temperature rise such as in the irrigation sector, which may provide negative impacts to water quality. These potential adverse impacts to water quality may aggravate water scarcity in the region.
Aquatic ecosystems are also affected by higher atmospheric and water temperatures, the changes in precipitation and sea level rise. A warmer climate may increase threats to wetlands, which are one of the important habitats of many species. Increases in water temperature may favor exotic aquatic species rather than indigenous species. Once ecosystems are destroyed, they cannot be recovered or require tremendous time and effort to restore.
Considering that climate change may render great impacts on the water environment in a variety of ways, and also recognizing that the Asia-Pacific region has already observed events that are presumed to be caused by climate change, WEPA decided to initiate information exchange and discussions on “climate change and the water environment and possible adaptation options” as one of its priority topics in the second phase activities that started in 2009.
WEPA found that information on the potential impacts of climate change on the water environments (water quality and aquatic ecosystems) is not sufficient to facilitate discussion among partners. Therefore WEPA activities for this topic concentrated on information and knowledge-sharing through WEPA workshops, reinforced by literature reviews and fact-finding and perception surveys. This chapter summarizes these WEPA activities in the Japanese fiscal years 2009 to 2011 and outlines future actions for WEPA on this topic.
2. Impact of Climate Change on Water Quality and Aquatic Ecosystems in WEPA Countries
WEPA partner countries demonstrate examples of changes in the water environment that are suspected to result from or be escalated by climate change. Figure 2.2.2 shows such examples from relevant literature and news articles. A comparative study conducted in East and Southeast Asia between 2007 and 2008 shows that changes in precipitation volume and patterns can affect surface water quality in East
42
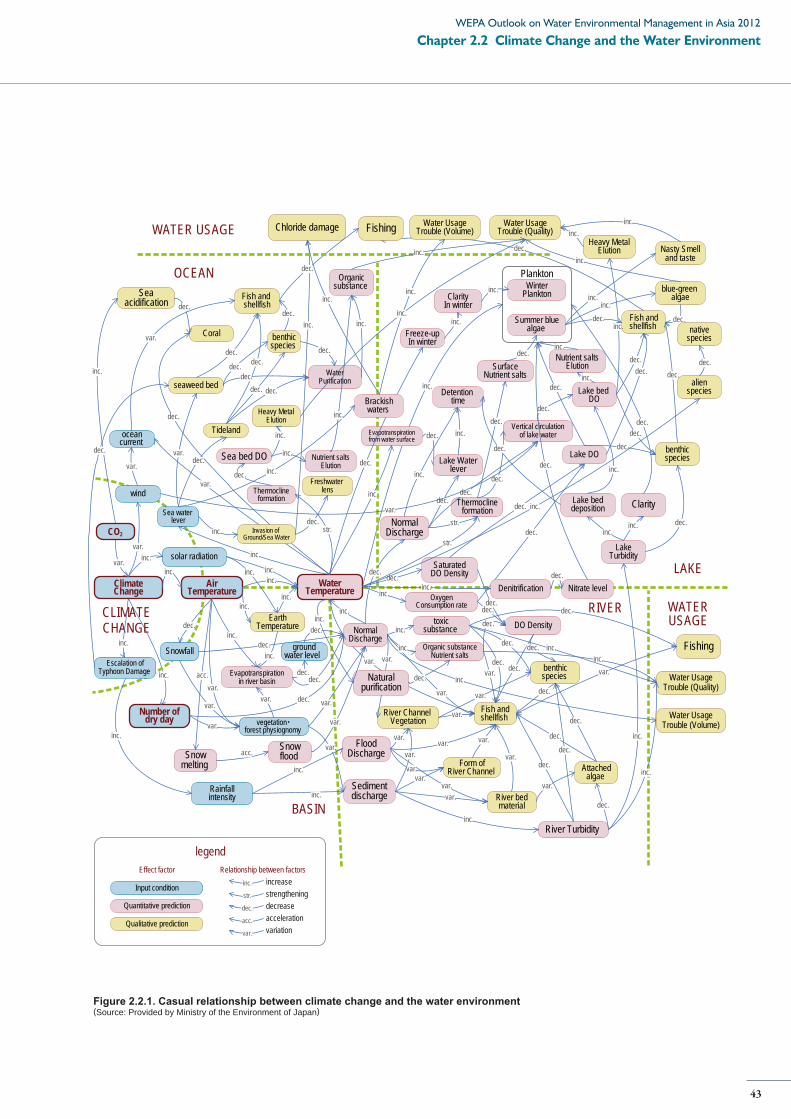
Figure 2.2.1. Casual relationship between climate change and the water environment(Source: Provided by Ministry of the Environment of Japan)
Evapotranspirationin river basin
AirTemperature
WaterTemperature
Rainfallintensity
SaturatedDO Density
OxygenConsumption rate
Fish andshellfish
DO Density
FloodDischarge
NormalDischarge
Sedimentdischarge
River Turbidity
River bedmaterial
River Channel Vegetation
benthicspecies
Form ofRiver Channel Attached
algae
Thermoclineformation
Evapotranspirationfrom water surface
Detention time
NormalDischarge
Snowfall
Snowmelting
Water UsageTrouble (Quality)
Fishing
Vertical circulationof lake water
Lake bed DO
Nutrient saltsElution
benthicspecies
Heavy MetalElution
Freeze-upIn winter
ClarityIn winter
WinterPlankton
SurfaceNutrient salts
Summer bluealgae
Nasty Smelland taste
blue-green algae
Fish andshellfish
Lake DO
LAKE
CLIMATECHANGE
RIVER WATERUSAGE
LakeTurbidity
Clarity
Plankton
Water UsageTrouble (Volume)
Naturalpurification
Organic substanceNutrient salts
Escalation ofTyphoon Damage
Lake beddeposition
Snowflood
Sea water lever
Tideland
Brackishwaters
benthicspecies
Invasion of Ground/Sea Water
Chloride damage
seaweed bed
Fish and shellfish
Fishing
Seaacidification
Coral
Freshwater lensThermocline
formation
Organicsubstance
WaterPurification
EarthTemperature
vegetation・forest physiognomy
Denitrification Nitrate level
Lake Waterlever
Sea bed DO Nutrient saltsElution
Heavy MetalElution
Water UsageTrouble (Quality)
Water UsageTrouble (Volume)WATER USAGE
legend
Quantitative prediction
Qualitative prediction
Input condition
Effect factor Relationship between factors
groundwater level
toxicsubstance
ClimateChange
wind
oceancurrent
alienspecies
nativespecies
solar radiation
BASIN
OCEAN
Number ofdry day
CO2
inc.
inc.
var.
dec.
inc. dec.
inc.dec.
dec.
var.
inc.
inc.
dec.
inc.
inc.
inc.
var.var.
var.
var.
var.var.
dec.
var.
dec.
dec.
dec.
var.dec.
var.
var.
var.
var.
var.
var.
dec.
dec.
dec.
str.
inc.
dec.
dec.
str.
inc.
acc.
acc.
dec.
dec.
inc.
inc.
var.
dec.dec.
dec.
dec.
inc.
inc.
inc.
dec.
inc.
inc.
dec.
dec.
inc.inc.
dec.
dec.
dec.
inc.
inc.
inc.
dec.
dec.
inc.
dec.
inc.dec.inc.
dec.
dec.
dec.
inc.
inc.
dec.
inc.
inc.
inc.
dec.
var.
inc.
dec.
dec.
inc.
inc.
inc.
inc.
var.
dec.
dec.
dec.
dec.
dec.str.
dec.
dec.
dec.
inc.
inc.inc.
inc.
var.var.
var. var.
var.
inc.dec.
dec.
inc.
dec.
var.
dec.
inc.
inc.
dec.
inc.
inc.
dec.
var.
inc.
dec.
dec.dec.
inc.
inc.
inc.
dec.
dec.
dec.
inc.dec.
dec.
inc.inc.var.
inc.
var.
var.
var.
var.
inc.
dec.
increasestrengtheningdecreaseaccelerationvariation
inc.
dec.
acc.
var.
str.
dec.
inc.
inc.
dec.
43
Chapter 2.2 Climate Change and the Water Environment WEPA Outlook on Water Environmental Management in Asia 2012
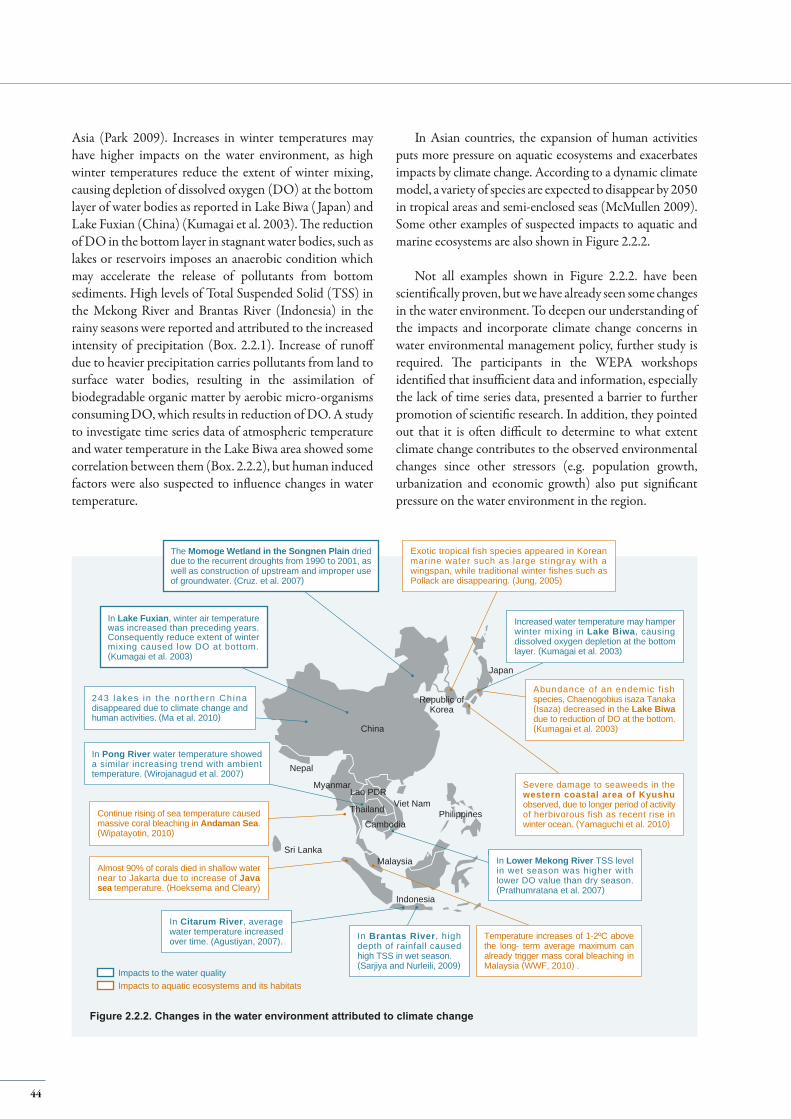
In Lake Fuxian, winter air temperature was increased than preceding years. Consequently reduce extent of winter mixing caused low DO at bottom. (Kumagai et al. 2003)
In Pong River water temperature showed a similar increasing trend with ambient temperature. (Wirojanagud et al. 2007)
Continue rising of sea temperature caused massive coral bleaching in Andaman Sea. (Wipatayotin, 2010)
Almost 90% of corals died in shallow water near to Jakarta due to increase of Java sea temperature. (Hoeksema and Cleary)
In Brantas River, high depth of rainfall caused high TSS in wet season.(Sarjiya and Nurleili, 2009)
In Citarum River, average water temperature increased over time. (Agustiyan, 2007).
In Lower Mekong River TSS level in wet season was higher with lower DO value than dry season. (Prathumratana et al. 2007)
The Momoge Wetland in the Songnen Plain dried due to the recurrent droughts from 1990 to 2001, as well as construction of upstream and improper use of groundwater. (Cruz. et al. 2007)
243 lakes in the nor thern China disappeared due to climate change and human activities. (Ma et al. 2010)
Exotic tropical fish species appeared in Korean marine water such as large stingray with a wingspan, while traditional winter fishes such as Pollack are disappearing. (Jung, 2005)
Abundance of an endemic f ish species, Chaenogobius isaza Tanaka (Isaza) decreased in the Lake Biwa due to reduction of DO at the bottom. (Kumagai et al. 2003)
Increased water temperature may hamper winter mixing in Lake Biwa, causing dissolved oxygen depletion at the bottom layer. (Kumagai et al. 2003)
Severe damage to seaweeds in the western coastal area of Kyushu observed, due to longer period of activity of herbivorous fish as recent rise in winter ocean. (Yamaguchi et al. 2010)
Temperature increases of 1-2ºC above the long- term average maximum can already trigger mass coral bleaching in Malaysia (WWF, 2010) .
Impacts to the water qualityImpacts to aquatic ecosystems and its habitats
Japan
China
Viet Nam
Republic ofKorea
Myanmar
Nepal
Philippines
Malaysia
Lao PDR
Sri Lanka
Cambodia
Thailand
Indonesia
Figure 2.2.2. Changes in the water environment attributed to climate change
Asia (Park 2009). Increases in winter temperatures may have higher impacts on the water environment, as high winter temperatures reduce the extent of winter mixing, causing depletion of dissolved oxygen (DO) at the bottom layer of water bodies as reported in Lake Biwa ( Japan) and Lake Fuxian (China) (Kumagai et al. 2003). The reduction of DO in the bottom layer in stagnant water bodies, such as lakes or reservoirs imposes an anaerobic condition which may accelerate the release of pollutants from bottom sediments. High levels of Total Suspended Solid (TSS) in the Mekong River and Brantas River (Indonesia) in the rainy seasons were reported and attributed to the increased intensity of precipitation (Box. 2.2.1). Increase of runoff due to heavier precipitation carries pollutants from land to surface water bodies, resulting in the assimilation of biodegradable organic matter by aerobic micro-organisms consuming DO, which results in reduction of DO. A study to investigate time series data of atmospheric temperature and water temperature in the Lake Biwa area showed some correlation between them (Box. 2.2.2), but human induced factors were also suspected to influence changes in water temperature.
In Asian countries, the expansion of human activities puts more pressure on aquatic ecosystems and exacerbates impacts by climate change. According to a dynamic climate model, a variety of species are expected to disappear by 2050 in tropical areas and semi-enclosed seas (McMullen 2009). Some other examples of suspected impacts to aquatic and marine ecosystems are also shown in Figure 2.2.2.
Not all examples shown in Figure 2.2.2. have been scientifically proven, but we have already seen some changes in the water environment. To deepen our understanding of the impacts and incorporate climate change concerns in water environmental management policy, further study is required. The participants in the WEPA workshops identified that insufficient data and information, especially the lack of time series data, presented a barrier to further promotion of scientific research. In addition, they pointed out that it is often difficult to determine to what extent climate change contributes to the observed environmental changes since other stressors (e.g. population growth, urbanization and economic growth) also put significant pressure on the water environment in the region.
44

The climate of Indonesia is already witnessing major changes. The depth of precipitation is likely to increase in shorter rainy season, while it will become lower in dry season compared to the current climate. According to analysis of water monitoring data for 12 years (1995-2007) in three stations at the Brantas River in East Java, Indonesia, DO values show slight improvement trend at two stations, while decreasing at another one. A reason of the decreasing trend of DO is considered to be industrial activities taking place near the monitoring station. The analysis identified clear seasonal variation for BOD and COD - higher values of both parameters in the rainy season than in the dry season. It is assumed that flush of contaminants and sediments with rain water may contribute to the higher value of these parameters, and higher TSS concentration in the rainy season may support this assumption. Higher ammonia concentration in the rainy season is also observed. The seasonal change in water quality may be attributed to climate change. However, it is difficult to directly link the effects of climate change to water quality in the basin because of other factors including human activities.
(Source: Sarjiya and et al. 2009)
Box 2.2.1. A study of climate change impacts to water quality in Brantas River basin, Indonesia
Time series data on water temperature monitored at 46 points over the past 30 years were analyzed as part of a study of potential impacts on the water environment and possible adaptation actions, conducted by the Ministry of the Environment of Japan from 2009 to 2011.
Results showed that the yearly increasing rate of water temperature in Lake Biwa was 0.5 to 3.3°C (yearly average: 1.6°C) and 0.1 to 1.7°C (yearly average: 0.9°C) in summer and winter, respectively over the last thirty years.
Atmospheric temperature data (1960-2008) at the Hikone local meteorological observatory and water temperature at the centre of Minami Hira offshore showed that the annual average increase rate of water temperature during summer was 1.73°C, which is greater than that of atmospheric temperature (1.23°C). In winter, water temperature and atmospheric temperature showed an different trend - the annual average increase rate of water temperature was 0.84°C and that of atmospheric temperature was 1.48°C.
Distinct changes in water temperature as compared to atmospheric temperature in summer revealed that the water temperature of Lake Biwa is influenced by increasing atmospheric temperatures as well as other external factors. On the contrary, in winter, vertical mixing of cold water from the lower layers and warm water from the upper layers might attenuate the effect of external factors on water temperatures of the largest lake (with 27,500 million m3) in Japan.
This study could not find significant collation between water temperature change in Lake Biwa and other external factors such as population density and industrial activities in the lake basin. However, heat emission from wastewater treatment is seen as another important factor impacting water temperature. A huge volume of high temperature (25-28°C in summer and 17-19°C in winter) treated wastewater drains into Lake Biwa, which has a lower temperature of 20-25°C in summer and about 10°C in winter. It was estimated that about 135 million cubic meters of treated wastewater was drained into Lake Biwa in 2005. About 80 percent of the treated wastewater came from the southern basin and the rest from the northern basin. The ratio of wastewater to lake volume in the southern basin was 0.53, which revealed that heat emission from treated wastewater may greatly influence the water temperature of the largest lake of Japan.
(Source: Yuasa et al. 2011)
Box 2.2.2. Case Study: Impacts of climate change on the water environment of Lake Biwa
Water Temp Change
0-1℃1-2℃>2℃
Lake Biwa
Figure 2.2.3. Water temperature change trend over the past 30 years in Lake Biwa
45
Chapter 2.2 Climate Change and the Water Environment WEPA Outlook on Water Environmental Management in Asia 2012
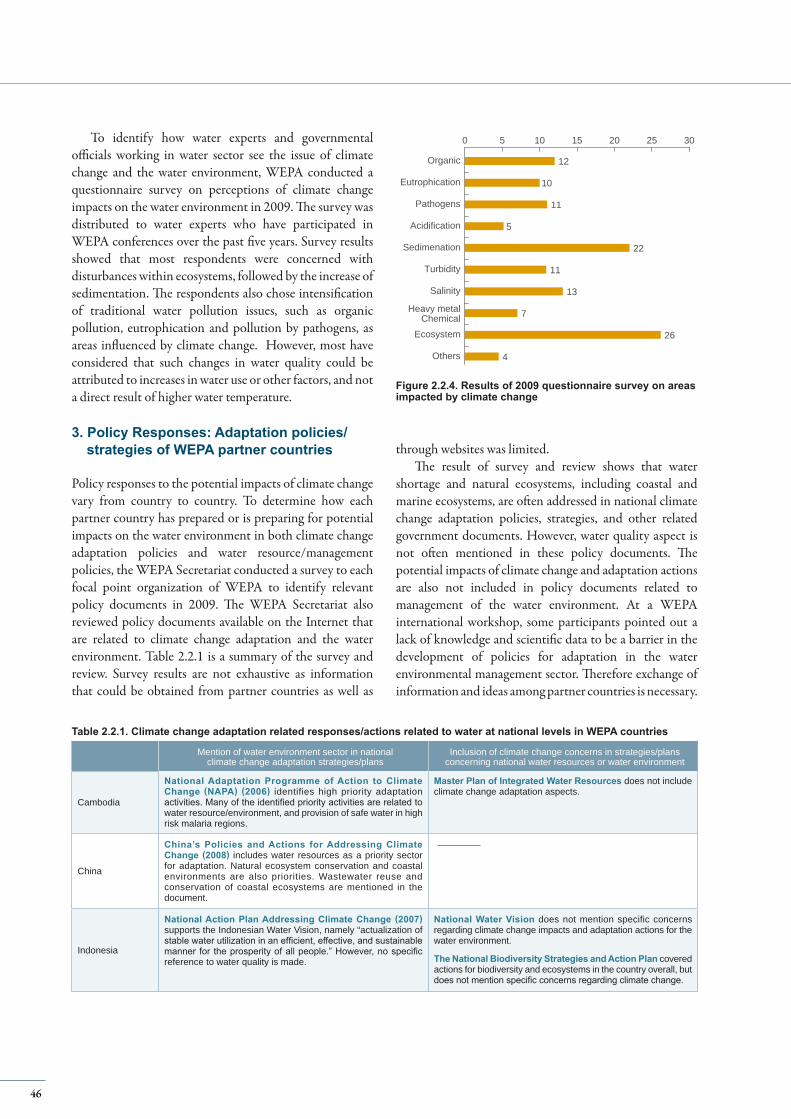
Mention of water environment sector in national climate change adaptation strategies/plans
Inclusion of climate change concerns in strategies/plans concerning national water resources or water environment
Cambodia
National Adaptation Programme of Action to Climate Change (NAPA) (2006) identifies high priority adaptation activities. Many of the identified priority activities are related to water resource/environment, and provision of safe water in high risk malaria regions.
Master Plan of Integrated Water Resources does not include climate change adaptation aspects.
China
China’s Policies and Actions for Addressing Climate Change (2008) includes water resources as a priority sector for adaptation. Natural ecosystem conservation and coastal environments are also priorities. Wastewater reuse and conservation of coastal ecosystems are mentioned in the document.
Indonesia
National Action Plan Addressing Climate Change (2007) supports the Indonesian Water Vision, namely “actualization of stable water utilization in an efficient, effective, and sustainable manner for the prosperity of all people.” However, no specific reference to water quality is made.
National Water Vision does not mention specific concerns regarding climate change impacts and adaptation actions for the water environment.
The National Biodiversity Strategies and Action Plan covered actions for biodiversity and ecosystems in the country overall, but does not mention specific concerns regarding climate change.
To identify how water experts and governmental officials working in water sector see the issue of climate change and the water environment, WEPA conducted a questionnaire survey on perceptions of climate change impacts on the water environment in 2009. The survey was distributed to water experts who have participated in WEPA conferences over the past five years. Survey results showed that most respondents were concerned with disturbances within ecosystems, followed by the increase of sedimentation. The respondents also chose intensification of traditional water pollution issues, such as organic pollution, eutrophication and pollution by pathogens, as areas influenced by climate change. However, most have considered that such changes in water quality could be attributed to increases in water use or other factors, and not a direct result of higher water temperature.
3. Policy Responses: Adaptation policies/strategies of WEPA partner countries
Policy responses to the potential impacts of climate change vary from country to country. To determine how each partner country has prepared or is preparing for potential impacts on the water environment in both climate change adaptation policies and water resource/management policies, the WEPA Secretariat conducted a survey to each focal point organization of WEPA to identify relevant policy documents in 2009. The WEPA Secretariat also reviewed policy documents available on the Internet that are related to climate change adaptation and the water environment. Table 2.2.1 is a summary of the survey and review. Survey results are not exhaustive as information that could be obtained from partner countries as well as
0 5
12
10
11
5
22
11
13
7
26
4
10 15 20 25 30
Others
Ecosystem
Heavy metalChemical
Salinity
Turbidity
Sedimenation
Acidification
Pathogens
Eutrophication
Organic
Figure 2.2.4. Results of 2009 questionnaire survey on areas impacted by climate change
through websites was limited.The result of survey and review shows that water
shortage and natural ecosystems, including coastal and marine ecosystems, are often addressed in national climate change adaptation policies, strategies, and other related government documents. However, water quality aspect is not often mentioned in these policy documents. The potential impacts of climate change and adaptation actions are also not included in policy documents related to management of the water environment. At a WEPA international workshop, some participants pointed out a lack of knowledge and scientific data to be a barrier in the development of policies for adaptation in the water environmental management sector. Therefore exchange of information and ideas among partner countries is necessary.
Table 2.2.1. Climate change adaptation related responses/actions related to water at national levels in WEPA countries
46
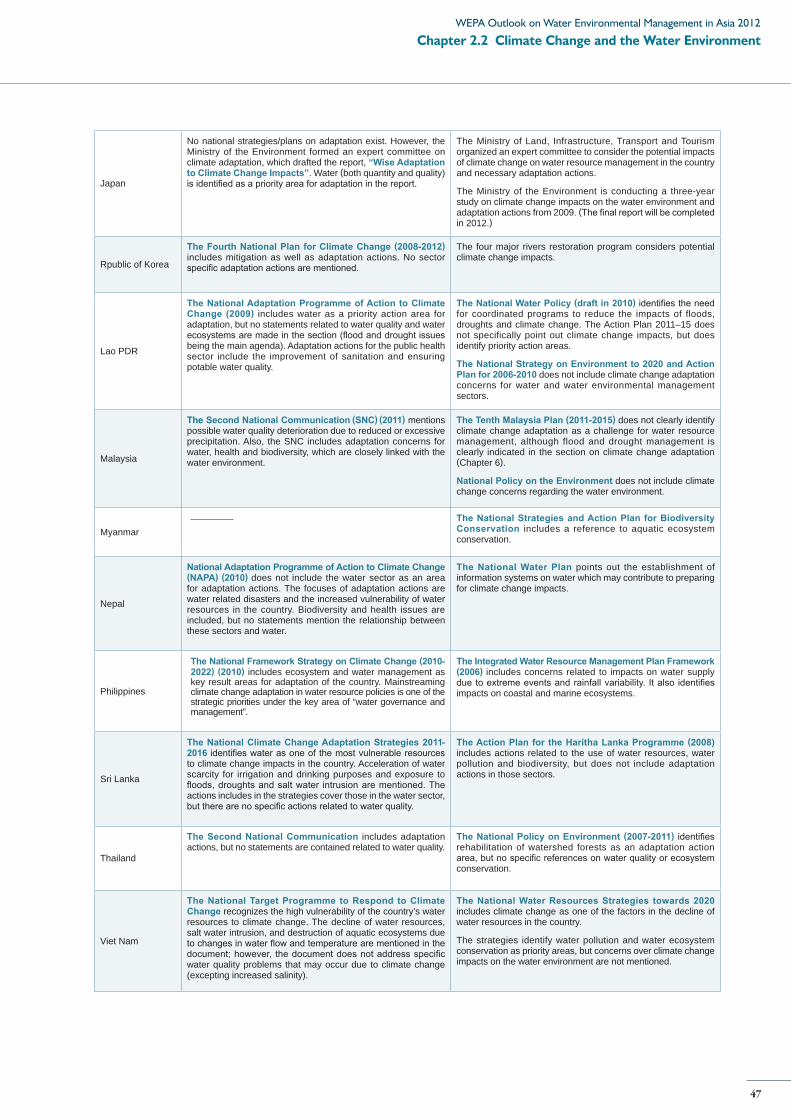
Japan
No national strategies/plans on adaptation exist. However, the Ministry of the Environment formed an expert committee on climate adaptation, which drafted the report, “Wise Adaptation to Climate Change Impacts”. Water (both quantity and quality) is identified as a priority area for adaptation in the report.
The Ministry of Land, Infrastructure, Transport and Tourism organized an expert committee to consider the potential impacts of climate change on water resource management in the country and necessary adaptation actions.
The Ministry of the Environment is conducting a three-year study on climate change impacts on the water environment and adaptation actions from 2009. (The final report will be completed in 2012.)
Rpublic of Korea
The Fourth National Plan for Climate Change (2008-2012) includes mitigation as well as adaptation actions. No sector specific adaptation actions are mentioned.
The four major rivers restoration program considers potential climate change impacts.
Lao PDR
The National Adaptation Programme of Action to Climate Change (2009) includes water as a priority action area for adaptation, but no statements related to water quality and water ecosystems are made in the section (flood and drought issues being the main agenda). Adaptation actions for the public health sector include the improvement of sanitation and ensuring potable water quality.
The National Water Policy (draft in 2010) identifies the need for coordinated programs to reduce the impacts of floods, droughts and climate change. The Action Plan 2011–15 does not specifically point out climate change impacts, but does identify priority action areas.
The National Strategy on Environment to 2020 and Action Plan for 2006-2010 does not include climate change adaptation concerns for water and water environmental management sectors.
Malaysia
The Second National Communication (SNC) (2011) mentions possible water quality deterioration due to reduced or excessive precipitation. Also, the SNC includes adaptation concerns for water, health and biodiversity, which are closely linked with the water environment.
The Tenth Malaysia Plan (2011-2015) does not clearly identify climate change adaptation as a challenge for water resource management, although flood and drought management is clearly indicated in the section on climate change adaptation (Chapter 6).
National Policy on the Environment does not include climate change concerns regarding the water environment.
MyanmarThe National Strategies and Action Plan for Biodiversity Conservation includes a reference to aquatic ecosystem conservation.
Nepal
National Adaptation Programme of Action to Climate Change (NAPA) (2010) does not include the water sector as an area for adaptation actions. The focuses of adaptation actions are water related disasters and the increased vulnerability of water resources in the country. Biodiversity and health issues are included, but no statements mention the relationship between these sectors and water.
The National Water Plan points out the establishment of information systems on water which may contribute to preparing for climate change impacts.
Philippines
The National Framework Strategy on Climate Change (2010-2022) (2010) includes ecosystem and water management as key result areas for adaptation of the country. Mainstreaming climate change adaptation in water resource policies is one of the strategic priorities under the key area of “water governance and management”.
The Integrated Water Resource Management Plan Framework (2006) includes concerns related to impacts on water supply due to extreme events and rainfall variability. It also identifies impacts on coastal and marine ecosystems.
Sri Lanka
The National Climate Change Adaptation Strategies 2011-2016 identifies water as one of the most vulnerable resources to climate change impacts in the country. Acceleration of water scarcity for irrigation and drinking purposes and exposure to floods, droughts and salt water intrusion are mentioned. The actions includes in the strategies cover those in the water sector, but there are no specific actions related to water quality.
The Action Plan for the Haritha Lanka Programme (2008) includes actions related to the use of water resources, water pollution and biodiversity, but does not include adaptation actions in those sectors.
Thailand
The Second National Communication includes adaptation actions, but no statements are contained related to water quality.
The National Policy on Environment (2007-2011) identifies rehabilitation of watershed forests as an adaptation action area, but no specific references on water quality or ecosystem conservation.
Viet Nam
The National Target Programme to Respond to Climate Change recognizes the high vulnerability of the country’s water resources to climate change. The decline of water resources, salt water intrusion, and destruction of aquatic ecosystems due to changes in water flow and temperature are mentioned in the document; however, the document does not address specific water quality problems that may occur due to climate change (excepting increased salinity).
The National Water Resources Strategies towards 2020 includes climate change as one of the factors in the decline of water resources in the country.
The strategies identify water pollution and water ecosystem conservation as priority areas, but concerns over climate change impacts on the water environment are not mentioned.
47
Chapter 2.2 Climate Change and the Water Environment WEPA Outlook on Water Environmental Management in Asia 2012
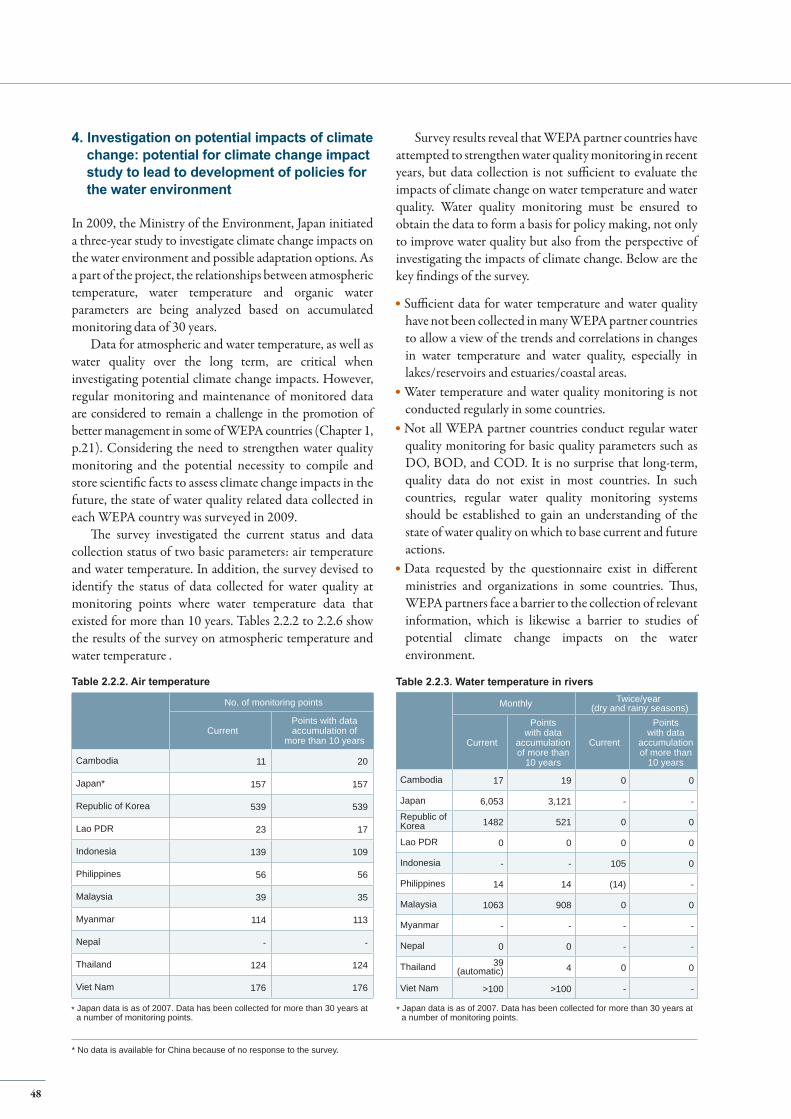
4. Investigation on potential impacts of climate change: potential for climate change impact study to lead to development of policies for the water environment
In 2009, the Ministry of the Environment, Japan initiated a three-year study to investigate climate change impacts on the water environment and possible adaptation options. As a part of the project, the relationships between atmospheric temperature, water temperature and organic water parameters are being analyzed based on accumulated monitoring data of 30 years.
Data for atmospheric and water temperature, as well as water quality over the long term, are critical when investigating potential climate change impacts. However, regular monitoring and maintenance of monitored data are considered to remain a challenge in the promotion of better management in some of WEPA countries (Chapter 1, p.21). Considering the need to strengthen water quality monitoring and the potential necessity to compile and store scientific facts to assess climate change impacts in the future, the state of water quality related data collected in each WEPA country was surveyed in 2009.
The survey investigated the current status and data collection status of two basic parameters: air temperature and water temperature. In addition, the survey devised to identify the status of data collected for water quality at monitoring points where water temperature data that existed for more than 10 years. Tables 2.2.2 to 2.2.6 show the results of the survey on atmospheric temperature and water temperature .
Survey results reveal that WEPA partner countries have attempted to strengthen water quality monitoring in recent years, but data collection is not sufficient to evaluate the impacts of climate change on water temperature and water quality. Water quality monitoring must be ensured to obtain the data to form a basis for policy making, not only to improve water quality but also from the perspective of investigating the impacts of climate change. Below are the key findings of the survey.
Sufficient data for water temperature and water quality have not been collected in many WEPA partner countries to allow a view of the trends and correlations in changes in water temperature and water quality, especially in lakes/reservoirs and estuaries/coastal areas. Water temperature and water quality monitoring is not conducted regularly in some countries. Not all WEPA partner countries conduct regular water quality monitoring for basic quality parameters such as DO, BOD, and COD. It is no surprise that long-term, quality data do not exist in most countries. In such countries, regular water quality monitoring systems should be established to gain an understanding of the state of water quality on which to base current and future actions.Data requested by the questionnaire exist in different ministries and organizations in some countries. Thus, WEPA partners face a barrier to the collection of relevant information, which is likewise a barrier to studies of potential climate change impacts on the water environment.
No. of monitoring points
CurrentPoints with data accumulation of
more than 10 years
Cambodia 11 20
Japan* 157 157
Republic of Korea 539 539
Lao PDR 23 17
Indonesia 139 109
Philippines 56 56
Malaysia 39 35
Myanmar 114 113
Nepal - -
Thailand 124 124
Viet Nam 176 176
Table 2.2.2. Air temperature
* Japan data is as of 2007. Data has been collected for more than 30 years at a number of monitoring points.
Monthly Twice/year (dry and rainy seasons)
Current
Points with data
accumulation of more than
10 years
Current
Points with data
accumulation of more than
10 years
Cambodia 17 19 0 0
Japan 6,053 3,121 - -Republic of Korea 1482 521 0 0
Lao PDR 0 0 0 0
Indonesia - - 105 0
Philippines 14 14 (14) -
Malaysia 1063 908 0 0
Myanmar - - - -
Nepal 0 0 - -
Thailand 39 (automatic) 4 0 0
Viet Nam >100 >100 - -
* Japan data is as of 2007. Data has been collected for more than 30 years at a number of monitoring points.
Table 2.2.3. Water temperature in rivers
* No data is available for China because of no response to the survey.
48
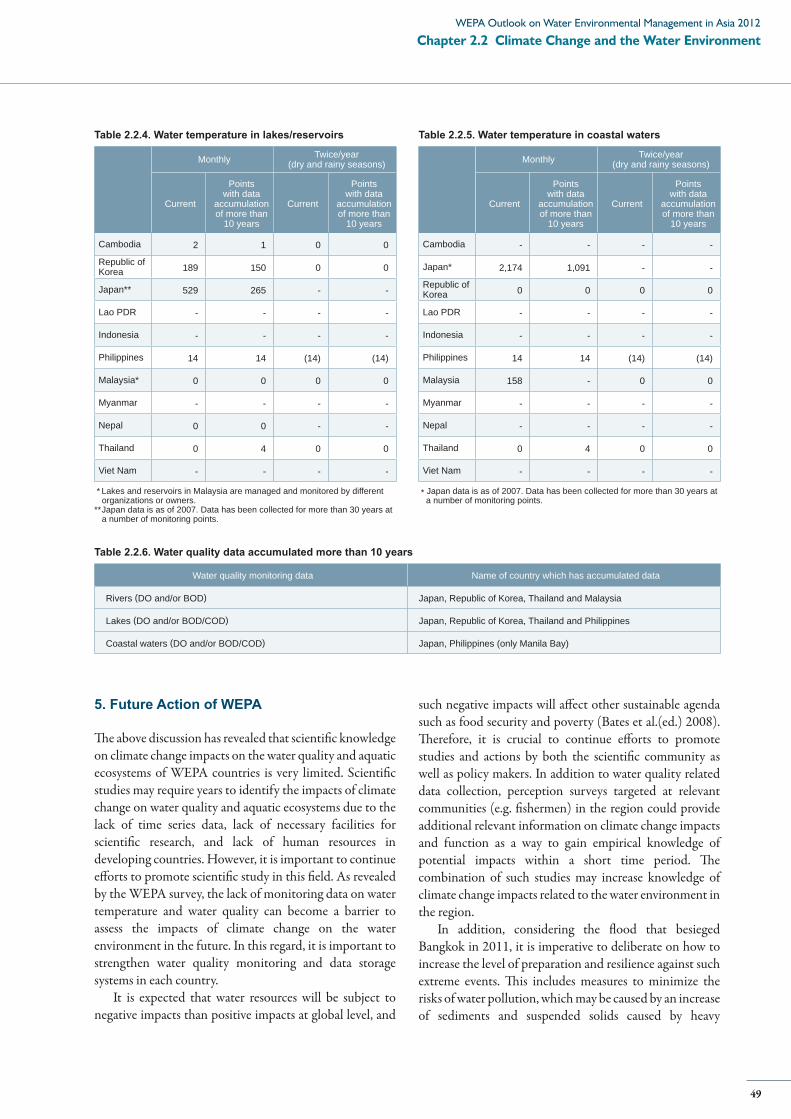
5. Future Action of WEPA
The above discussion has revealed that scientific knowledge on climate change impacts on the water quality and aquatic ecosystems of WEPA countries is very limited. Scientific studies may require years to identify the impacts of climate change on water quality and aquatic ecosystems due to the lack of time series data, lack of necessary facilities for scientific research, and lack of human resources in developing countries. However, it is important to continue efforts to promote scientific study in this field. As revealed by the WEPA survey, the lack of monitoring data on water temperature and water quality can become a barrier to assess the impacts of climate change on the water environment in the future. In this regard, it is important to strengthen water quality monitoring and data storage systems in each country.
It is expected that water resources will be subject to negative impacts than positive impacts at global level, and
Monthly Twice/year(dry and rainy seasons)
Current
Points with data
accumulation of more than
10 years
Current
Points with data
accumulation of more than
10 years
Cambodia 2 1 0 0
Republic of Korea 189 150 0 0
Japan** 529 265 - -
Lao PDR - - - -
Indonesia - - - -
Philippines 14 14 (14) (14)
Malaysia* 0 0 0 0
Myanmar - - - -
Nepal 0 0 - -
Thailand 0 4 0 0
Viet Nam - - - -
Monthly Twice/year(dry and rainy seasons)
Current
Points with data
accumulation of more than
10 years
Current
Points with data
accumulation of more than
10 years
Cambodia - - - -
Japan* 2,174 1,091 - -
Republic of Korea 0 0 0 0
Lao PDR - - - -
Indonesia - - - -
Philippines 14 14 (14) (14)
Malaysia 158 - 0 0
Myanmar - - - -
Nepal - - - -
Thailand 0 4 0 0
Viet Nam - - - -
* Lakes and reservoirs in Malaysia are managed and monitored by different organizations or owners.
**Japan data is as of 2007. Data has been collected for more than 30 years at a number of monitoring points.
* Japan data is as of 2007. Data has been collected for more than 30 years at a number of monitoring points.
Table 2.2.4. Water temperature in lakes/reservoirs Table 2.2.5. Water temperature in coastal waters
Water quality monitoring data Name of country which has accumulated data
Rivers (DO and/or BOD) Japan, Republic of Korea, Thailand and Malaysia
Lakes (DO and/or BOD/COD) Japan, Republic of Korea, Thailand and Philippines
Coastal waters (DO and/or BOD/COD) Japan, Philippines (only Manila Bay)
Table 2.2.6. Water quality data accumulated more than 10 years
such negative impacts will affect other sustainable agenda such as food security and poverty (Bates et al.(ed.) 2008). Therefore, it is crucial to continue efforts to promote studies and actions by both the scientific community as well as policy makers. In addition to water quality related data collection, perception surveys targeted at relevant communities (e.g. fishermen) in the region could provide additional relevant information on climate change impacts and function as a way to gain empirical knowledge of potential impacts within a short time period. The combination of such studies may increase knowledge of climate change impacts related to the water environment in the region.
In addition, considering the flood that besieged Bangkok in 2011, it is imperative to deliberate on how to increase the level of preparation and resilience against such extreme events. This includes measures to minimize the risks of water pollution, which may be caused by an increase of sediments and suspended solids caused by heavy
49
Chapter 2.2 Climate Change and the Water Environment WEPA Outlook on Water Environmental Management in Asia 2012
precipitation, as well as measures to reduce health risks that may increase as a result of disasters, such as the overflow of untreated wastewater and temporarily nonfunctional wastewater treatment facilities, and water supply systems. water treatment facilities.
Clear-cut scientific evidence does not yet exist in terms of climate change impacts on the water environment. As discussed in WEPA meetings, distinguishing between the impacts on the water environment, as being from human activity or climate change, is very difficult. However, while considering the importance of and difficulties in addressing this issue, WEPA will take the following actions.
To continue and enhance discussion and information exchange open on this issue whereby WEPA partners can strengthen water environmental management against potential/suspected climate change impacts. To strengthen WEPA activities and broaden the knowledge base to contribute to improvement of water quality management in partner countries, recognizing that strengthening and improvement of current water quality management is an important adaptation action, especially in countries which face implementation problems. As a knowledge base on this issue, an archive page on “Climate Change and the Water Environment” will created for the WEPA database.
50

Chapter
3
3.1 Cambodia
3.2 China
3.3 Indonesia
3.4 Japan
3.5 Republic of Korea
3.6 Lao PDR
3.7 Malaysia
3.8 Myanmar
3.9 Nepal
3.10 Philippines
3.11 Sri Lanka
3.12 Thailand
3.13 Viet Nam
Country Profiles of Water Environmental Management in WEPA Countries
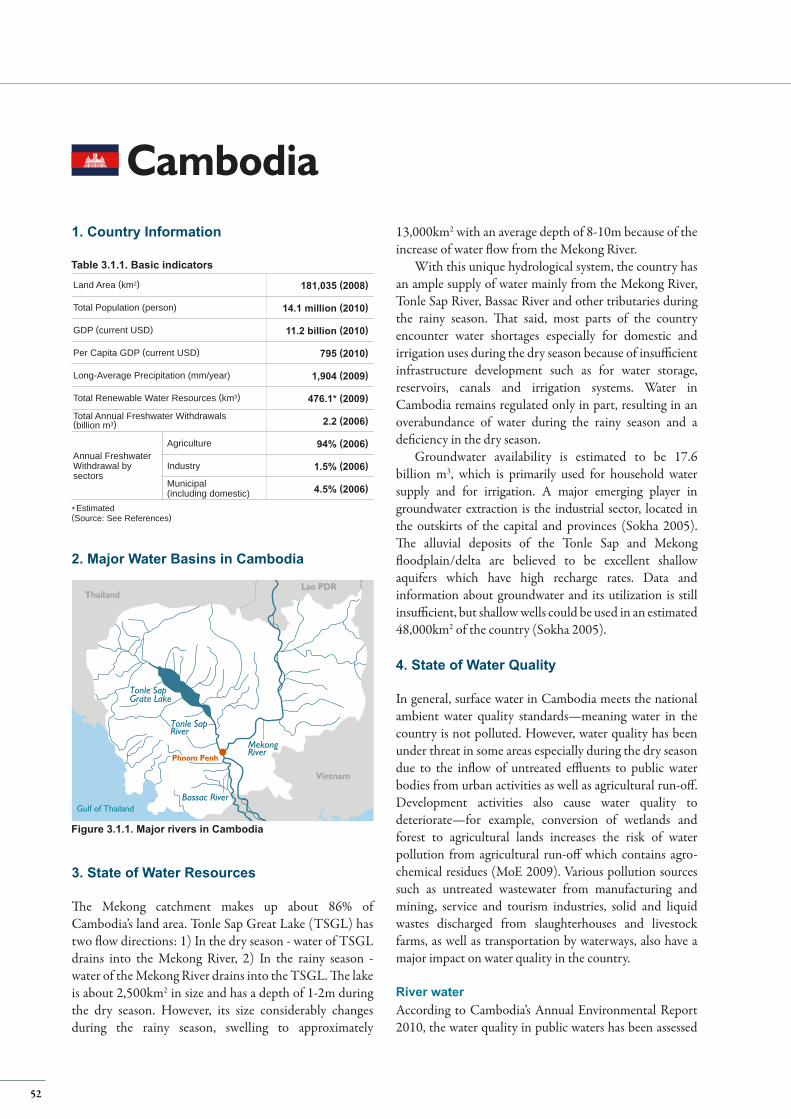
Cambodia
Gulf of Thailand
Tonle SapGrate LakeTonle SapGrate Lake
Tonle SapRiverTonle SapRiver
MekongRiverMekongRiver
Bassac River
Phnom PenhPhnom Penh
Lao PDRThailand
Vietnam
Land Area (km2) 181,035 (2008)
Total Population (person) 14.1 million (2010)
GDP (current USD) 11.2 billion (2010)
Per Capita GDP (current USD) 795 (2010)
Long-Average Precipitation (mm/year) 1,904 (2009)
Total Renewable Water Resources (km3) 476.1* (2009)
Total Annual Freshwater Withdrawals(billion m3) 2.2 (2006)
Annual FreshwaterWithdrawal bysectors
Agriculture 94% (2006)
Industry 1.5% (2006)
Municipal(including domestic) 4.5% (2006)
3. State of Water Resources
The Mekong catchment makes up about 86% of Cambodia’s land area. Tonle Sap Great Lake (TSGL) has two flow directions: 1) In the dry season - water of TSGL drains into the Mekong River, 2) In the rainy season - water of the Mekong River drains into the TSGL. The lake is about 2,500km2 in size and has a depth of 1-2m during the dry season. However, its size considerably changes during the rainy season, swelling to approximately
13,000km2 with an average depth of 8-10m because of the increase of water flow from the Mekong River.
With this unique hydrological system, the country has an ample supply of water mainly from the Mekong River, Tonle Sap River, Bassac River and other tributaries during the rainy season. That said, most parts of the country encounter water shortages especially for domestic and irrigation uses during the dry season because of insufficient infrastructure development such as for water storage, reservoirs, canals and irrigation systems. Water in Cambodia remains regulated only in part, resulting in an overabundance of water during the rainy season and a deficiency in the dry season.
Groundwater availability is estimated to be 17.6 billion m3, which is primarily used for household water supply and for irrigation. A major emerging player in groundwater extraction is the industrial sector, located in the outskirts of the capital and provinces (Sokha 2005). The alluvial deposits of the Tonle Sap and Mekong floodplain/delta are believed to be excellent shallow aquifers which have high recharge rates. Data and information about groundwater and its utilization is still insufficient, but shallow wells could be used in an estimated 48,000km2 of the country (Sokha 2005).
4. State of Water Quality
In general, surface water in Cambodia meets the national ambient water quality standards—meaning water in the country is not polluted. However, water quality has been under threat in some areas especially during the dry season due to the inflow of untreated effluents to public water bodies from urban activities as well as agricultural run-off. Development activities also cause water quality to deteriorate—for example, conversion of wetlands and forest to agricultural lands increases the risk of water pollution from agricultural run-off which contains agro-chemical residues (MoE 2009). Various pollution sources such as untreated wastewater from manufacturing and mining, service and tourism industries, solid and liquid wastes discharged from slaughterhouses and livestock farms, as well as transportation by waterways, also have a major impact on water quality in the country.
River waterAccording to Cambodia’s Annual Environmental Report 2010, the water quality in public waters has been assessed
1. Country Information
2. Major Water Basins in Cambodia
* Estimated(Source: See References)
Figure 3.1.1. Major rivers in Cambodia
Table 3.1.1. Basic indicators
52
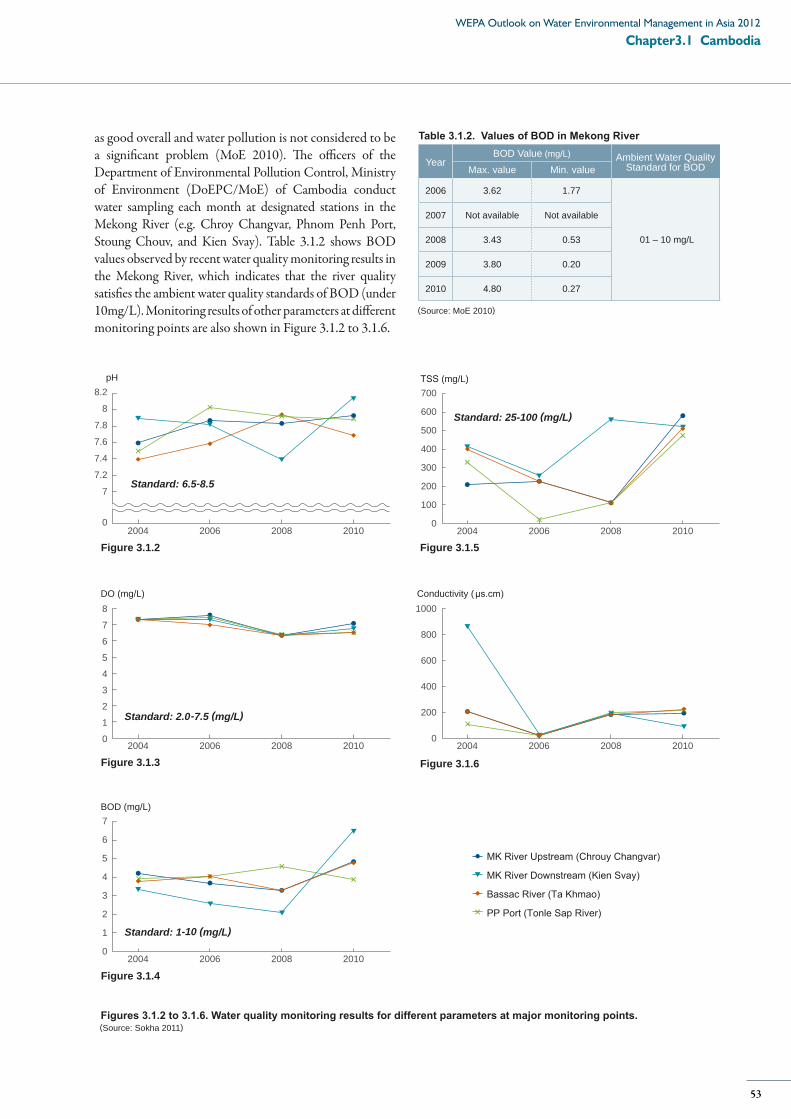
YearBOD Value (mg/L) Ambient Water Quality
Standard for BODMax. value Min. value
2006 3.62 1.77
01 – 10 mg/L
2007 Not available Not available
2008 3.43 0.53
2009 3.80 0.20
2010 4.80 0.27
Table 3.1.2. Values of BOD in Mekong River
pH
2004 2006 2008 2010
8.2
8
7.8
7.6
7.4
7.2
7
0
Standard: 6.5-8.5
BOD (mg/L)
2004 2006 2008 2010
7
6
5
4
3
2
1
0
Standard: 1-10 (mg/L)
Conductivity (μs.cm)
2004 2006 2008 2010
MK River Upstream (Chrouy Changvar)
MK River Downstream (Kien Svay)
Bassac River (Ta Khmao)
PP Port (Tonle Sap River)
TSS (mg/L)
2004 2006 2008 2010
Standard: 25-100 (mg/L)
700
600
500
400
300
200
100
0
1000
800
600
400
200
0
Figure 3.1.2
Figure 3.1.6
Figure 3.1.4
Figure 3.1.5
DO (mg/L)
2004 2006 2008 2010
8
7
6
5
4
3
2
1
0
Standard: 2.0-7.5 (mg/L)
Figure 3.1.3
Figures 3.1.2 to 3.1.6. Water quality monitoring results for different parameters at major monitoring points.
as good overall and water pollution is not considered to be a significant problem (MoE 2010). The officers of the Department of Environmental Pollution Control, Ministry of Environment (DoEPC/MoE) of Cambodia conduct water sampling each month at designated stations in the Mekong River (e.g. Chroy Changvar, Phnom Penh Port, Stoung Chouv, and Kien Svay). Table 3.1.2 shows BOD values observed by recent water quality monitoring results in the Mekong River, which indicates that the river quality satisfies the ambient water quality standards of BOD (under 10mg/L). Monitoring results of other parameters at different monitoring points are also shown in Figure 3.1.2 to 3.1.6.
(Source: MoE 2010)
(Source: Sokha 2011)
53
Chapter3.1 CambodiaWEPA Outlook on Water Environmental Management in Asia 2012
Lakes and reservoirsAccording to various literatures, the general level of pollution in lakes on average remains low, although water pollution has been locally identified in and around floating villages. Since 2009, MoE has started taking water samples to check water quality of lakes. The results of monitoring of COD show that the maximum value in 2010 exceeds ambient water quality standards (Table 3.1.3).
YearChhnok True
(Tonle Sap Great Lake) Ambient Water Quality Standard for COD Max.value (mg/L) Min.value (mg/L)
2009 4.80 1.27Under 8 mg/L
2010 8.57 1.0
Table 3.1.3. Lake water quality in Tonle Sap Great Lake in 2009 and 2010
Coastal waterCambodia’s coastal shoreline is 435 km long on the Gulf of Thailand, and the seaward boundary of the coastal zone has been delimited as the outer limit of the country’s exclusive economic zone with an area of 55,600km2. The landward boundary of the coastal zone has not yet been satisfactorily defined, but it is currently considered to be about 5 km from the shore. The coastal zones are situated in the four provinces of Koh Kong, Kampot, Sihanoukville and Kep municipalities. In general, coastal water is considered to be of fairly good quality, but development activities such as those in economic zones and seaports may exert a negative influence on coastal water and coastal ecosystems without the sound management of solid and liquid wastes generated from those activities. According to the results of monitoring in 2005-2006, water quality had not deteriorated in terms of total suspended solids, dissolved oxygen, biological oxygen demand, total nitrogen, and total phosphorous (MoE 2006).
GroundwaterThe data on groundwater quality is very limited, but arsenic contamination of groundwater was identified by a national drinking water quality assessment in 2000 in some provinces located in Mekong, Bassac and Tonle Sap River basins (Arsenic Center of Cambodia 2010) where dependency on groundwater as the source of domestic water is as high as 62-100% (MoWRAM 2008).
5. Frameworks for Water Environment Management
LegislationThe current legislative framework for water environment management in Cambodia is shown in Figure 3.1.7. The protection and promotion of environmental quality and public health is the objective of natural resource management including water (Article 1, Law on Environmental Protection and Natural Resource Management). The Law on Water Resources and Management (2007) includes aspects of water quality management, such as requiring wastewater discharge licenses or permission for activities that could have negative impacts on water quality and human and ecosystem health (Article 22), as well as designations for dangerous or restricted zones for water use where the water quality, quantity and ecological balance are endangered (Article 23).
The details on water environmental conservation measures are explained in the Sub-decree on Water Pollution Control, which was established in 1999 under the Law on Environmental Protection and Natural Resources Management. The sub-decree aims to regulate various activities that could pollute and/or have already polluted public water areas (e.g. rivers, lakes, groundwater, and sea water). Ambient water quality standards for human health and bio-diversity (Article 7), as well as effluent standards for pollution sources (Article 4) are set by this sub-decree. Other elements of the sub-decree include monitoring of pollution sources and their effluents (Chapter 4), monitoring of public water areas (Chapter 5), and inspection rules (Chapter 6). Other sub-decrees under the Law on Environmental Protection and Natural Resources Management, such as the Sub-decree on Solid Wastes and the Sub-decree on Environmental Impact Assessment Process, also contain articles related to water environmental conservation.
Currently, two new pieces of legislation are being drafted in relation to water quality management, namely the Law on Environmental Pollution Management by MoE and the Sub-decree on Water Quality by the Ministry of Water Resources and Meteorology (MoWRAM). The draft Law on Environmental Pollution Management will stipulate the process related to monitoring and control of water, air and soil pollution.
(Source: MoE 2009 and 2010)
54
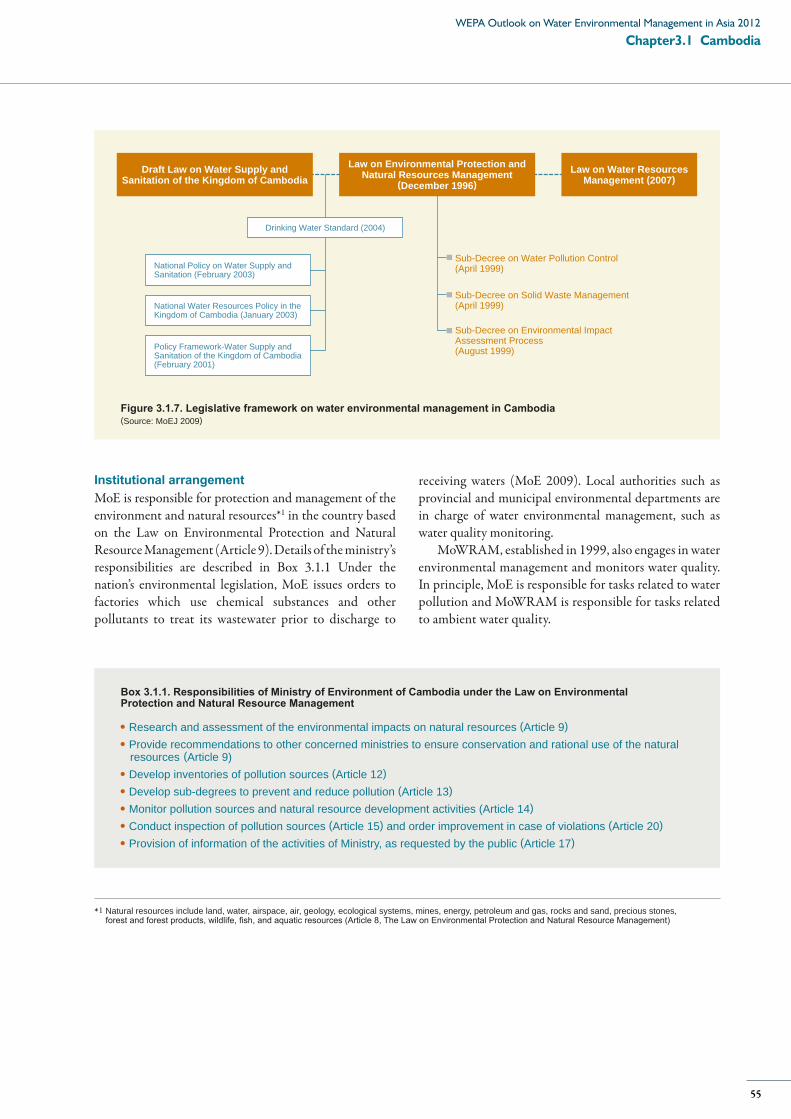
Sub-Decree on Water Pollution Control (April 1999)
Sub-Decree on Solid Waste Management(April 1999)
Sub-Decree on Environmental ImpactAssessment Process(August 1999)
Law on Environmental Protection andNatural Resources Management
(December 1996)Law on Water Resources
Management (2007)Draft Law on Water Supply and
Sanitation of the Kingdom of Cambodia
National Policy on Water Supply andSanitation (February 2003)
National Water Resources Policy in theKingdom of Cambodia (January 2003)
Policy Framework-Water Supply andSanitation of the Kingdom of Cambodia(February 2001)
Drinking Water Standard (2004)
Institutional arrangementMoE is responsible for protection and management of the environment and natural resources*1 in the country based on the Law on Environmental Protection and Natural Resource Management (Article 9). Details of the ministry’s responsibilities are described in Box 3.1.1 Under the nation’s environmental legislation, MoE issues orders to factories which use chemical substances and other pollutants to treat its wastewater prior to discharge to
receiving waters (MoE 2009). Local authorities such as provincial and municipal environmental departments are in charge of water environmental management, such as water quality monitoring.
MoWRAM, established in 1999, also engages in water environmental management and monitors water quality. In principle, MoE is responsible for tasks related to water pollution and MoWRAM is responsible for tasks related to ambient water quality.
Figure 3.1.7. Legislative framework on water environmental management in Cambodia(Source: MoEJ 2009)
*1 Natural resources include land, water, airspace, air, geology, ecological systems, mines, energy, petroleum and gas, rocks and sand, precious stones, forest and forest products, wildlife, fish, and aquatic resources (Article 8, The Law on Environmental Protection and Natural Resource Management)
Research and assessment of the environmental impacts on natural resources (Article 9)Provide recommendations to other concerned ministries to ensure conservation and rational use of the natural resources (Article 9)Develop inventories of pollution sources (Article 12)Develop sub-degrees to prevent and reduce pollution (Article 13)Monitor pollution sources and natural resource development activities (Article 14)Conduct inspection of pollution sources (Article 15) and order improvement in case of violations (Article 20)Provision of information of the activities of Ministry, as requested by the public (Article 17)
Box 3.1.1. Responsibilities of Ministry of Environment of Cambodia under the Law on EnvironmentalProtection and Natural Resource Management
55
Chapter3.1 CambodiaWEPA Outlook on Water Environmental Management in Asia 2012
Ambient water quality standardsAmbient water quality standards for public water areas are set by the Sub-decree on Water Pollution Control. There are two kinds of water quality standards. The first is water quality standards for biodiversity conservation designated for rivers (five parameters), lakes and reservoirs (seven parameters), and coastal water (seven parameters), respectively. The second is water quality standards for public health, which designates standard values for 25 parameters that have harmful effects on human health. There are no ambient quality standards for groundwater, but water quality is assessed by standards designated for specific uses such as national drinking water quality standards.
Monitoring of ambient water quality in public water bodies MoE is responsible for the regular control and monitoring of water pollution in public water areas throughout Cambodia (see Box 3.1.2). The details of parameters monitored are shown in Table 3.1.4. Although decentralization has led to local governments and departments handling various tasks, the main constraint to this process is a lack of experienced officials and laboratories for water quality analysis. Therefore, central officials of MoE continue carrying out these tasks in conjunction with local capacity building and institutional capacity development.
Parametermonitored BOD, DO, pH, Temperature, TSS, Coliform
Sampling sites
Each of 10 public water body(Chroy Chang Var, PP Port, Ta Kmao, Kien Svay, Prek Kdam, Stoeung Sangke, Stoeung Porsat, Stoeung Sen, Stoeung Chinit and Tonle Sap Great Lake)
Frequency Once a month
Table 3.1.4. Current status of water quality monitoring by MoE (2011)
Under the Water Quality Monitoring Network (Mekong River Commission (MRC) Program), MoWRM also takes water samples monthly at designated stations in rivers and relevant tributaries for analysis and reports back to MRC via the Cambodia National Mekong Committee (CNMC). The parameters monitored are temperature, pH, TSS, Conductivity, Ca, Mg, Na, K, Alk, Cl, SO4 , Tot-Fe, Si, DO, COD, Mn, NO3-N, NH4-N, PO4-P, and Tot-P. The monitoring results are made public via database and upon request.
Water quality samples are taken on an ad-hoc basis to check that groundwater quality satisfies standards for drinking water and household use, as the country does not yet have a regular groundwater quality monitoring system in place.
Effluent StandardsAiming at managing effluents discharged from pollution sources, the Effluent Standard for Pollution Sources Discharging Wastewater to Public Water Areas of Sewers was established under the Sub-decree on Water Pollution Control. Standard values are set for 52 parameters, such as temperature, pH, BOD, heavy metals, agricultural chemicals, and organic solvents. In principle, the standards are applied to all industries and other pollution sources designated by the sub-standards. For areas which require special treatment for protection of human health and biodiversity, MoE can establish separate effluent standards for pollution sources in the area (Article 5 of the sub-decree).
Effluent MonitoringUnder the Sub-decree on Water Pollution Control, all business operators must self-monitor effluent and submit a periodic report of the results to MoE. However, some industries do not comply with this regulation. Therefore, MoE regularly conducts on-site inspections to check whether the business operators are in compliance with effluent standards by taking and analyzing water samples of the effluent and also treated water. There are two types of monitoring programs in place at pollution sources: (i) regular effluent monitoring at normal factories and hotels that is conducted within an interval period of 90 days; and (ii) regular effluent monitoring at factories that use chemicals and/or chemical compounds for production that should be conducted in an interval period of 45 days.
Non-compliance MeasuresWhen violation of effluent standards is found, MoE issues a written order to industries to correct current activities to comply with the standards. Industries are fined and punished for violations in the monitoring and reporting of, and compliance with effluent standards stipulated under the Sub-decree on Water Pollution Control if they do not respond to orders issued by MoE.
(Source: MoEJ 2009)
56
Based on the current state of water quality management in Cambodia, a few key management challenges are identified as follows. process related to monitoring and control of water, air and soil pollution.
1. Weak legal framework such as lack of water quality standards for specific beneficial uses such as human health and recreation.
2. Insufficient equipment for laboratory and field testing which become barriers to the appropriate management of water quality.
3. Shortage of technical officers at both national and local levels with expertise who can carry out adequate water quality management.
4. Budget limitations of government, especially for improvement of capacity of laboratories in terms of facility infrastructure/equipment and human resources.
5. Weak coordination between stakeholders, especially industries that are responsible for protecting and improving water quality in Cambodia. Facilitation of communication and data sharing must be promoted.
6. Insufficient technical capacity both at national and local levels, such as water quality monitoring and decentralized domestic wastewater treatment technologies, which require international support.
6. Existing and Future Challenges
Box 3.1.2. Recent development of water quality management: strengthening water quality monitoring
Many developing countries in the region pointed out that lack of data on ambient water quality and effluent from pollution sources are barriers to the promotion of water quality management; Cambodia is no different in this respect.
The Cambodian government has worked to strengthen monitoring and assessment of ambient and effluent water quality for more than 15 years to improve and build upon the scientific basis for better management of water quality. For example, MoWRAM started monthly water quality sampling at public water areas in 1993. MoE also conducts a routine monitoring programme at various areas and has conducted ambient water quality monitoring since 1999. Such monitoring practices form the scientific basis for improvement of water quality management policy and specific measures in the future. (Source: Sokha 2011)
57
Chapter3.1 CambodiaWEPA Outlook on Water Environmental Management in Asia 2012
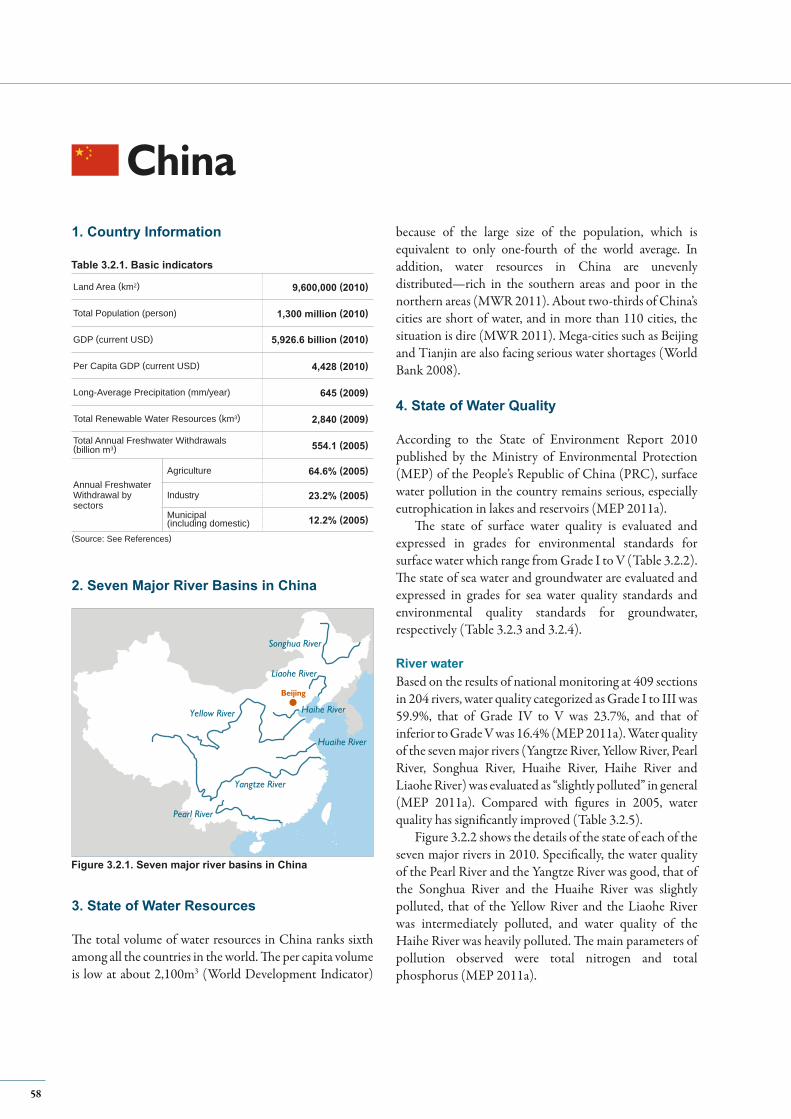
China
3. State of Water Resources
The total volume of water resources in China ranks sixth among all the countries in the world. The per capita volume is low at about 2,100m3 (World Development Indicator)
1. Country Information
Yellow River
Yangtze River
Pearl River
Songhua River
Liaohe River
Haihe River
Huaihe River
BeijingBeijing
(Source: See References)
2. Seven Major River Basins in China
because of the large size of the population, which is equivalent to only one-fourth of the world average. In addition, water resources in China are unevenly distributed—rich in the southern areas and poor in the northern areas (MWR 2011). About two-thirds of China’s cities are short of water, and in more than 110 cities, the situation is dire (MWR 2011). Mega-cities such as Beijing and Tianjin are also facing serious water shortages (World Bank 2008).
4. State of Water Quality
According to the State of Environment Report 2010 published by the Ministry of Environmental Protection (MEP) of the People’s Republic of China (PRC), surface water pollution in the country remains serious, especially eutrophication in lakes and reservoirs (MEP 2011a).
The state of surface water quality is evaluated and expressed in grades for environmental standards for surface water which range from Grade I to V (Table 3.2.2). The state of sea water and groundwater are evaluated and expressed in grades for sea water quality standards and environmental quality standards for groundwater, respectively (Table 3.2.3 and 3.2.4).
River waterBased on the results of national monitoring at 409 sections in 204 rivers, water quality categorized as Grade I to III was 59.9%, that of Grade IV to V was 23.7%, and that of inferior to Grade V was 16.4% (MEP 2011a). Water quality of the seven major rivers (Yangtze River, Yellow River, Pearl River, Songhua River, Huaihe River, Haihe River and Liaohe River) was evaluated as “slightly polluted” in general (MEP 2011a). Compared with figures in 2005, water quality has significantly improved (Table 3.2.5).
Figure 3.2.2 shows the details of the state of each of the seven major rivers in 2010. Specifically, the water quality of the Pearl River and the Yangtze River was good, that of the Songhua River and the Huaihe River was slightly polluted, that of the Yellow River and the Liaohe River was intermediately polluted, and water quality of the Haihe River was heavily polluted. The main parameters of pollution observed were total nitrogen and total phosphorus (MEP 2011a).
Table 3.2.1. Basic indicators
Figure 3.2.1. Seven major river basins in China
Land Area (km2) 9,600,000 (2010)
Total Population (person) 1,300 million (2010)
GDP (current USD)
Per Capita GDP (current USD) 4,428 (2010)
Long-Average Precipitation (mm/year) 645 (2009)
Total Renewable Water Resources (km3) 2,840 (2009)
Total Annual Freshwater Withdrawals (billion m3) 554.1 (2005)
Annual FreshwaterWithdrawal bysectors
Agriculture 64.6% (2005)
Industry 23.2% (2005)
Municipal(including domestic) 12.2% (2005)
5,926.6 billion (2010)
58
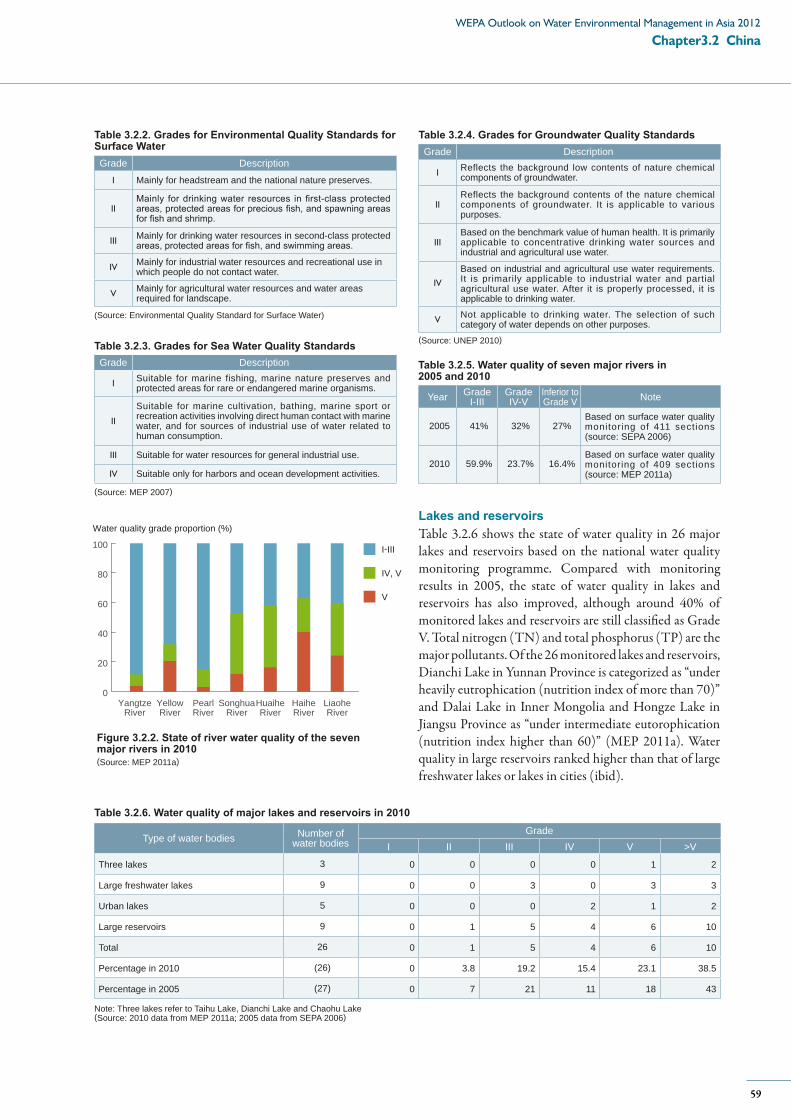
Note: Three lakes refer to Taihu Lake, Dianchi Lake and Chaohu Lake(Source: 2010 data from MEP 2011a; 2005 data from SEPA 2006)
Table 3.2.5. Water quality of seven major rivers in2005 and 2010
Year GradeI-III
GradeIV-V
Inferior to Grade V Note
2005 41% 32% 27%Based on surface water quality monitoring of 411 sections (source: SEPA 2006)
2010 59.9% 23.7% 16.4%Based on surface water quality monitoring of 409 sections (source: MEP 2011a)
Type of water bodies Number ofwater bodies
GradeI II III IV V >V
Three lakes 3 0 0 0 0 1 2
Large freshwater lakes 9 0 0 3 0 3 3
Urban lakes 5 0 0 0 2 1 2
Large reservoirs 9 0 1 5 4 6 10
Total 26 0 1 5 4 6 10
Percentage in 2010 (26) 0 3.8 19.2 15.4 23.1 38.5
Percentage in 2005 (27) 0 7 21 11 18 43
Table 3.2.6. Water quality of major lakes and reservoirs in 2010
Table 3.2.3. Grades for Sea Water Quality Standards (Source: UNEP 2010)
Table 3.2.4. Grades for Groundwater Quality Standards
(Source: MEP 2007)
Grade Description
I Mainly for headstream and the national nature preserves.
IIMainly for drinking water resources in first-class protected areas, protected areas for precious fish, and spawning areas for fish and shrimp.
III Mainly for drinking water resources in second-class protected areas, protected areas for fish, and swimming areas.
IV Mainly for industrial water resources and recreational use inwhich people do not contact water.
V Mainly for agricultural water resources and water areasrequired for landscape.
Grade Description
I Reflects the background low contents of nature chemical components of groundwater.
IIReflects the background contents of the nature chemical components of groundwater. It is applicable to various purposes.
IIIBased on the benchmark value of human health. It is primarily applicable to concentrative drinking water sources and industrial and agricultural use water.
IV
Based on industrial and agricultural use water requirements. It is primarily applicable to industrial water and partial agricultural use water. After it is properly processed, it is applicable to drinking water.
V Not applicable to drinking water. The selection of such category of water depends on other purposes.
Grade Description
I Suitable for marine fishing, marine nature preserves and protected areas for rare or endangered marine organisms.
II
Suitable for marine cultivation, bathing, marine sport or recreation activities involving direct human contact with marine water, and for sources of industrial use of water related to human consumption.
III Suitable for water resources for general industrial use.
IV Suitable only for harbors and ocean development activities.
Table 3.2.2. Grades for Environmental Quality Standards for Surface Water
(Source: Environmental Quality Standard for Surface Water)
YangtzeRiver
YellowRiver
PearlRiver
SonghuaRiver
HuaiheRiver
HaiheRiver
LiaoheRiver
0
20
40
60
80
100
IV, V
I-III
V
Water quality grade proportion (%)
(Source: MEP 2011a)
Figure 3.2.2. State of river water quality of the sevenmajor rivers in 2010
Lakes and reservoirsTable 3.2.6 shows the state of water quality in 26 major lakes and reservoirs based on the national water quality monitoring programme. Compared with monitoring results in 2005, the state of water quality in lakes and reservoirs has also improved, although around 40% of monitored lakes and reservoirs are still classified as Grade V. Total nitrogen (TN) and total phosphorus (TP) are the major pollutants. Of the 26 monitored lakes and reservoirs, Dianchi Lake in Yunnan Province is categorized as “under heavily eutrophication (nutrition index of more than 70)” and Dalai Lake in Inner Mongolia and Hongze Lake in Jiangsu Province as “under intermediate eutorophication (nutrition index higher than 60)” (MEP 2011a). Water quality in large reservoirs ranked higher than that of large freshwater lakes or lakes in cities (ibid).
59
Chapter3.2 ChinaWEPA Outlook on Water Environmental Management in Asia 2012
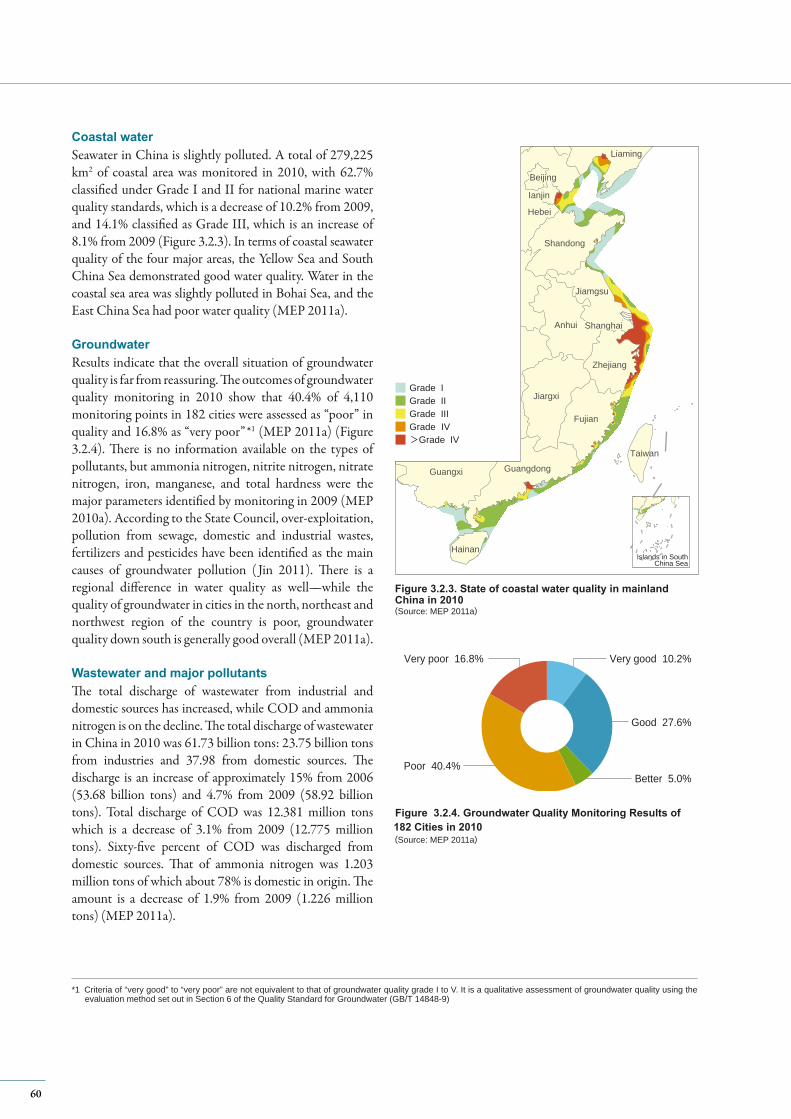
Coastal waterSeawater in China is slightly polluted. A total of 279,225 km2 of coastal area was monitored in 2010, with 62.7% classified under Grade I and II for national marine water quality standards, which is a decrease of 10.2% from 2009, and 14.1% classified as Grade III, which is an increase of 8.1% from 2009 (Figure 3.2.3). In terms of coastal seawater quality of the four major areas, the Yellow Sea and South China Sea demonstrated good water quality. Water in the coastal sea area was slightly polluted in Bohai Sea, and the East China Sea had poor water quality (MEP 2011a).
GroundwaterResults indicate that the overall situation of groundwater quality is far from reassuring. The outcomes of groundwater quality monitoring in 2010 show that 40.4% of 4,110 monitoring points in 182 cities were assessed as “poor” in quality and 16.8% as “very poor”*1 (MEP 2011a) (Figure 3.2.4). There is no information available on the types of pollutants, but ammonia nitrogen, nitrite nitrogen, nitrate nitrogen, iron, manganese, and total hardness were the major parameters identified by monitoring in 2009 (MEP 2010a). According to the State Council, over-exploitation, pollution from sewage, domestic and industrial wastes, fertilizers and pesticides have been identified as the main causes of groundwater pollution ( Jin 2011). There is a regional difference in water quality as well—while the quality of groundwater in cities in the north, northeast and northwest region of the country is poor, groundwater quality down south is generally good overall (MEP 2011a).
Wastewater and major pollutantsThe total discharge of wastewater from industrial and domestic sources has increased, while COD and ammonia nitrogen is on the decline. The total discharge of wastewater in China in 2010 was 61.73 billion tons: 23.75 billion tons from industries and 37.98 from domestic sources. The discharge is an increase of approximately 15% from 2006 (53.68 billion tons) and 4.7% from 2009 (58.92 billion tons). Total discharge of COD was 12.381 million tons which is a decrease of 3.1% from 2009 (12.775 million tons). Sixty-five percent of COD was discharged from domestic sources. That of ammonia nitrogen was 1.203 million tons of which about 78% is domestic in origin. The amount is a decrease of 1.9% from 2009 (1.226 million tons) (MEP 2011a).
(Source: MEP 2011a)
Figure 3.2.4. Groundwater Quality Monitoring Results of 182 Cities in 2010
BeijingBeijing
Hebei
Shandong
Jiamgsu
ShanghaiShanghaiAnhui
Zhejiang
Jiargxi
Fujian
Taiwan
GuangdongGuangxi
Hainan
IanjinIanjin
Liaming
Grade IGrade IIGrade IIIGrade IV>Grade IV
Islands in SouthChina Sea
Figure 3.2.3. State of coastal water quality in mainland China in 2010(Source: MEP 2011a)
Very poor 16.8% Very good 10.2%
Good 27.6%
Better 5.0%Poor 40.4%
*1 Criteria of “very good” to “very poor” are not equivalent to that of groundwater quality grade I to V. It is a qualitative assessment of groundwater quality using the evaluation method set out in Section 6 of the Quality Standard for Groundwater (GB/T 14848-9)
60
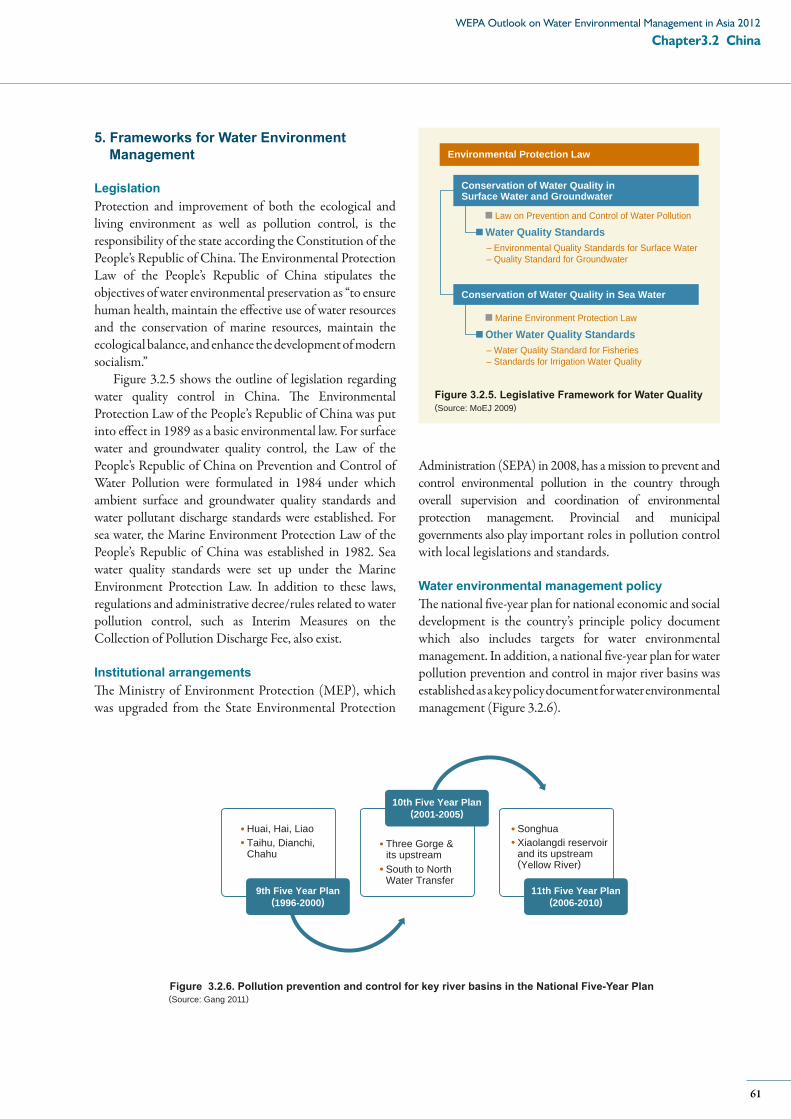
5. Frameworks for Water Environment Management
Legislation Protection and improvement of both the ecological and living environment as well as pollution control, is the responsibility of the state according the Constitution of the People’s Republic of China. The Environmental Protection Law of the People’s Republic of China stipulates the objectives of water environmental preservation as “to ensure human health, maintain the effective use of water resources and the conservation of marine resources, maintain the ecological balance, and enhance the development of modern socialism.”
Figure 3.2.5 shows the outline of legislation regarding water quality control in China. The Environmental Protection Law of the People’s Republic of China was put into effect in 1989 as a basic environmental law. For surface water and groundwater quality control, the Law of the People’s Republic of China on Prevention and Control of Water Pollution were formulated in 1984 under which ambient surface and groundwater quality standards and water pollutant discharge standards were established. For sea water, the Marine Environment Protection Law of the People’s Republic of China was established in 1982. Sea water quality standards were set up under the Marine Environment Protection Law. In addition to these laws, regulations and administrative decree/rules related to water pollution control, such as Interim Measures on the Collection of Pollution Discharge Fee, also exist.
Institutional arrangementsThe Ministry of Environment Protection (MEP), which was upgraded from the State Environmental Protection
Administration (SEPA) in 2008, has a mission to prevent and control environmental pollution in the country through overall supervision and coordination of environmental protection management. Provincial and municipal governments also play important roles in pollution control with local legislations and standards.
Water environmental management policyThe national five-year plan for national economic and social development is the country’s principle policy document which also includes targets for water environmental management. In addition, a national five-year plan for water pollution prevention and control in major river basins was established as a key policy document for water environmental management (Figure 3.2.6).
Huai, Hai, LiaoTaihu, Dianchi, Chahu
9th Five Year Plan(1996-2000)
SonghuaXiaolangdi reservoirand its upstream(Yellow River)
11th Five Year Plan(2006-2010)
Three Gorge & its upstreamSouth to NorthWater Transfer
10th Five Year Plan(2001-2005)
(Source: Gang 2011)Figure 3.2.6. Pollution prevention and control for key river basins in the National Five-Year Plan
Environmental Protection Law
Water Quality Standards– Environmental Quality Standards for Surface Water– Quality Standard for Groundwater
Law on Prevention and Control of Water Pollution
Conservation of Water Quality inSurface Water and Groundwater
Conservation of Water Quality in Sea Water
Other Water Quality Standards– Water Quality Standard for Fisheries– Standards for Irrigation Water Quality
Marine Environment Protection Law
(Source: MoEJ 2009)Figure 3.2.5. Legislative Framework for Water Quality
61
Chapter3.2 ChinaWEPA Outlook on Water Environmental Management in Asia 2012

Box 3.2.1. Main measures taken to meet the pollution reduction targetsPollution control regulations such as stricter EIA process, total discharge pollution load control, and an examination system for water quality of trans-boundary river sections of the main river basins, as well as the enforcement system for these instruments, including performance appraisal methods of local governments, could be construed as one of the main effective measures behind China’s achievements to date.
Specifically for the EIA process, MEP has reinforced stricter rules for construction projects that impact water quality. In the river basins and regions that have not met reduction targets, approvals for new investments and plant expansion were restricted. As well, plants that did not meet water quality standards within a certain time frame were closed down. The process has gained legal validity as it was stated in the Article 18 of the revised Law of the People’s Republic of China on Prevention and Control of Water Pollution in February 2008, that for areas with total discharge of water pollutants over the prescribed level, the government shall suspend the examination and approval of EIA documents for construction projects
In addition, by replacing the previous pollution concentration based approach, the total discharge pollution load control approach was adopted to take into account the carrying capacity of the pollution receiving water bodies when discharging wastewater. In its implementation, discharge load permits were issued to polluters, discharge fees for emissions above standards were levied, and enterprises violating the relevant regulations were closed down. In order to enforce and implement the above measures, the central government has signed an agreement with local governments. The agreement makes it obligatory for the local governments to meet pollution reduction targets and if they fail to do so, the responsible officials, including the head of the government, will not be promoted and may even be demoted. This link between performance evaluation indicators and pollution reduction targets was the newest initiative taken during the 11th Five-Year Plan.(Source: World Bank 2008)
Recent policy achievements in protecting water environmentThe National 11th Five-Year Plan (2006-2010) has set an obligatory target of reducing COD emissions by 10% from that of 2005 levels. Since 2006, Environmental Impact Assessments (EIA) for 822 construction projects failing to satisfy water quality control regulations were rejected or suspended. Also, more than 20,000 firms that have discharged wastewater not meeting the requirements of the environmental protection law were closed down. As a result, during the 11th Five-Year Plan, the amount of COD discharged decreased by 12.45% compared to that of 2005 levels meeting the reduction target (Met 2011b). Furthermore, under the national monitoring programme, by the end of 2010, 80.9% of the river section has satisfied the national surface water quality standards. The average concentration of permanganate value of river sections decreased by 31.9% compared to that of 2005, and the proportion of river sections of the seven big rivers which met Grade III water quality standards increased from 41% in 2005 to 59.9% in 2011 (MEP 2011d). The main measures taken to meet the pollution reduction targets are explained in Box 3.2.1.
Ambient water quality standardsThe Environmental Quality Standards for Surface Water stipulate standard values for 24 basic parameters in the five above-mentioned grades. The Quality Standard for Groundwater stipulates standard values for 39 parameters,
and 35 parameters in the Sea Water Quality Standard. Water Quality Standards for Fisheries and Standards for Irrigation Water Quality have been established as additional water quality standards.
Monitoring of water quality in public water bodiesWater quality monitoring is conducted in stations established across the country to check the water quality of rivers, groundwater, lakes, and sea water. In 2010, monitoring was implemented in 409 stations for 204 rivers, 182 cities with 4,110 stations for groundwater, 26 lakes, and 279,225 km2 of coastal area (MEP 2011a). The analytical methods for water quality are provided in each water quality standard (Environmental Quality Standards for Surface Water (GB3838-2002), Quality Standard for Groundwater (GB/T14848-93) and Sea Water Quality Standard (GB3097-1997)).
Effluent standardsEffluent quality of domestic wastewater at the discharge points of urban wastewater treatment plants is regulated by the Discharge Standard of Pollutants for Municipal Wastewater Treatment Plants (GB18918-2002). The Integrated Wastewater Discharge Standard (GB 8978-1996) regulates effluent levels for industrial wastewater. However, for various types of industries such as iron and steel and meat packing industries which are not covered by the above standard, individual standards were established. Different target values for specific pollutants are designed
62

for industries constructed before 31 December 1997 and after 1 January 1998 in the Integrated Wastewater Discharge Standard (GB 8978-1996). Since 2008, more than ten new effluent standards have been added to the existing standards (as of October 2011) (MEP 2011c).
6. Existing and Future Challenges
China has strengthened management of the water environment that serves a basis for the sound development of the country. Currently, water environmental management in the country has incorporated additional strategic management policies in which cultural and ecological aspects, as well as resource-saving aspects, are included. Drinking water source protection remains a priority, and groundwater is taking off as a new priority area in water quality management in China.
As for pollution reduction, the 12th Five-Year Plan (2011-2015) set a goal of 8% reduction of COD discharge and 10% reduction of ammonia nitrogen compared with that of 2010. Prevention and control of agricultural non-point pollution is also highlighted (MEP 2011d).
COD monitoring in the 11th Five-Year Plan covered mostly discharges from point sources, and monitoring of non-point sources will become necessary to comprehensively address the pollution of the water environment in China. According to the first national pollution source survey in 2010, over 40% of water pollutants come from agricultural sources such as run-off of fertilizers, pesticides and livestock
wastes, and landfill leakage. Agricultural pollutants accounted for 57.2% of total nitrogen and 67.4% of total phosphorous in water (MEP 2010b). These results have led to the adoption of a new reduction target for ammonia nitrogen. With the increase of water for domestic use along with economic growth, measures in the domestic sector such as development of sewage treatment plants may be considered.
In the 12th Five-Year Plan, reinforcement of environmental protection was identified as a focus. Specifically, reduction of heavy metal pollution, air and soil pollution was highlighted to protect human health (MEP 2011d). From the perspective of the water environment, pollution from heavy metals is particularly threatening to the safety of drinking water sources or groundwater supply in China. According to the State Council, 18% of water supply in China is from groundwater, and out of 657 cities, more than 40% use groundwater as a major source of drinking water (Chinese Government’s Official Web Portal 2011). The pollution of groundwater remains a serious issue; within the past two years between January 2010 and May 2011, there were 21 heavy metal pollution incidents including lead poisoning and damages to the protection zones (Wang 2011). A national plan was adopted by the State Council in August 2011 to protect the safety of groundwater sources and address pollution prevention. Under the plan, the local government will be required to establish a groundwater environment supervision system by 2015 and pollution prevention mechanisms by 2020 ( Jin 2011).
63
Chapter3.2 ChinaWEPA Outlook on Water Environmental Management in Asia 2012
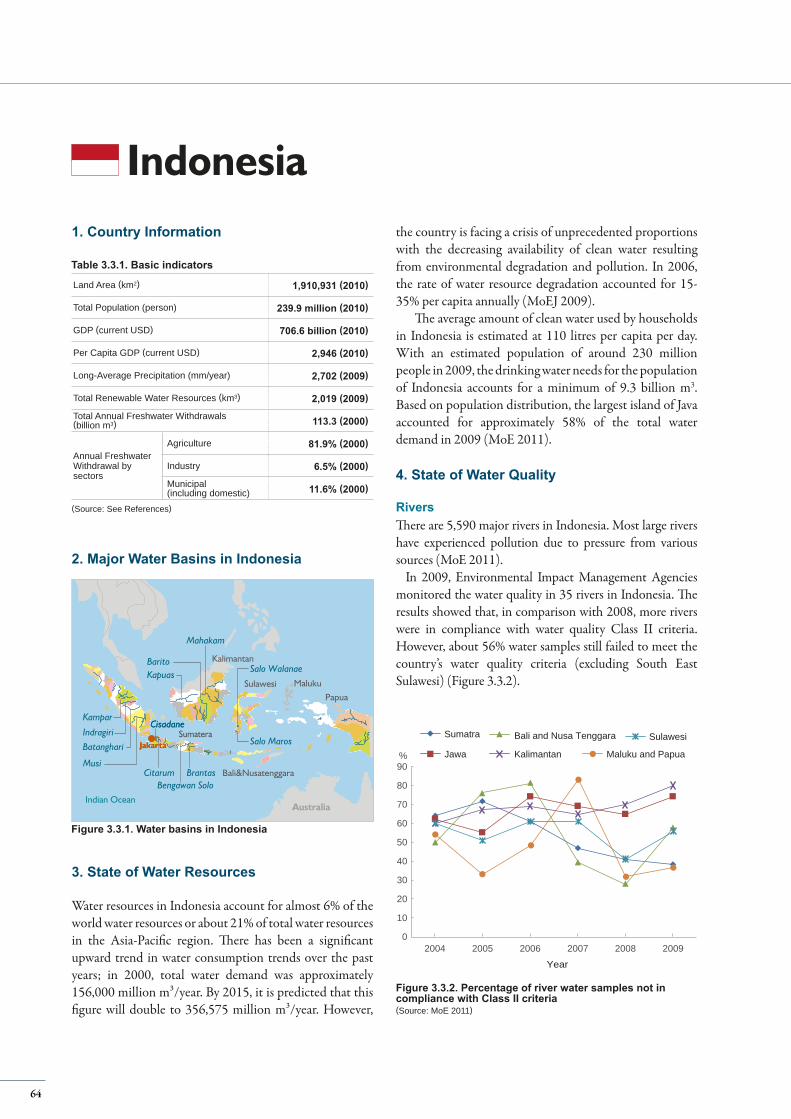
Land Area (km2) 1,910,931 (2010)
Total Population (person) 239.9 million (2010)
GDP (current USD) 706.6 billion (2010)
Per Capita GDP (current USD) 2,946 (2010)
Long-Average Precipitation (mm/year) 2,702 (2009)
Total Renewable Water Resources (km3) 2,019 (2009)
Total Annual Freshwater Withdrawals(billion m3) 113.3 (2000)
Annual FreshwaterWithdrawal bysectors
Agriculture 81.9% (2000)
Industry 6.5% (2000)
Municipal(including domestic) 11.6% (2000)
1. Country Information
(Source: See References)
Table 3.3.1. Basic indicators
the country is facing a crisis of unprecedented proportions with the decreasing availability of clean water resulting from environmental degradation and pollution. In 2006, the rate of water resource degradation accounted for 15-35% per capita annually (MoEJ 2009).
The average amount of clean water used by households in Indonesia is estimated at 110 litres per capita per day. With an estimated population of around 230 million people in 2009, the drinking water needs for the population of Indonesia accounts for a minimum of 9.3 billion m3. Based on population distribution, the largest island of Java accounted for approximately 58% of the total water demand in 2009 (MoE 2011).
4. State of Water Quality
RiversThere are 5,590 major rivers in Indonesia. Most large rivers have experienced pollution due to pressure from various sources (MoE 2011). In 2009, Environmental Impact Management Agencies monitored the water quality in 35 rivers in Indonesia. The results showed that, in comparison with 2008, more rivers were in compliance with water quality Class II criteria. However, about 56% water samples still failed to meet the country’s water quality criteria (excluding South East Sulawesi) (Figure 3.3.2).
Indonesia
Mahakam
Citarum
Salo Maros
Salo WalanaeBarito
Kampar
Indragiri
Kapuas
BrantasBengawan Solo
Batanghari
Musi
JakartaJakarta
CisadaneCisadaneSumatera
PapuaMalukuSulawesi
Kalimantan
Bali&Nusatenggara
Indian OceanAustralia
2. Major Water Basins in Indonesia
Figure 3.3.1. Water basins in Indonesia
3. State of Water Resources
Water resources in Indonesia account for almost 6% of the world water resources or about 21% of total water resources in the Asia-Pacific region. There has been a significant upward trend in water consumption trends over the past years; in 2000, total water demand was approximately 156,000 million m³/year. By 2015, it is predicted that this figure will double to 356,575 million m³/year. However,
0
10
20
30
40
50
60
70
80
90%
Year
Sumatra
Jawa
Bali and Nusa Tenggara
Kalimantan
Sulawesi
Maluku and Papua
2004 2005 2006 2007 2008 2009
Figure 3.3.2. Percentage of river water samples not in compliance with Class II criteria(Source: MoE 2011)
64
The water quality of rivers that flow in big cities mainly in Java and Sumatra is declining because the contaminants (pollutants) are increasing. Due to high pollution, most of the rivers in Java are already categorized as Class III or IV. Even the downstream of Ciliwung River ( Jakarta) was worse than Class IV.
A major source of pollution is untreated domestic wastewater and waste directly dumped into river bodies. The Statistical Year Book of Indonesia reported that up until 2010, only 55% of households had improved sanitation facilities (Statistics Indonesia 2011). An additional cause of water pollution is wastewater from industrial activities of small-scale industries such as agriculture, textiles, pulp and paper, petrochemicals, mining, and oil and gas. Other pollutant sources outside of Java and Sumatra include land erosion which has resulted in part from illegal logging and farming (MoE 2011).
In addition, the water quality of rivers in West Java are in critical condition. The results of research conducted on seven rivers, Cimanuk, Citarum, Cisadane, Kali Surabaya, Ciliwung, Citanduy and Cilamaya, showed that all rivers were categorized as Class D, which indicates extremely poor water quality. At the Citarum watershed, not one single location meets the water quality criteria for Class II water quality. The high content of fecal coli, dissolved oxygen, BOD, COD and suspended substances at all locations, especially the parameters of dissolved oxygen which is an indicator of the health of a water body, were at very low levels, with some readings even plunging to zero in locations such as Sapan, Cijeruk, and Burujul Dayeuh. Water pollution in the many rivers was caused from pollution from industrial waste, domestic activities, hospitals, livestock and agricultural activities (MoE 2011).
Water quality in Citarum River had moved into levels of heavy pollution. Many key parameters exceed quality standards, from organic waste to heavy metal content. About 40% of waste in Citarum River is organic household waste. The rest is comprised of chemical or industrial wastes and livestock and agricultural wastes (MoE 2011).
Lakes and reservoirsSimilar to conditions in rivers, there is significant pressure on water quality in lakes from various sources. The water quality monitoring of lakes conducted by the Research Center for Limnology at Lake Maninjau LIPI in 2008 showed that lake waters are eutrophic or have remained at the same trophic state as in 2007. The trophic status of Lake Batur Sendangkan improved slightly in 2008 to mesotrophic (MoE 2011).
The results of research conducted by PT Indonesia Power together with the Natural Resources Research Center and Environment (PPSDAL) Padjadjaran
University, Bandung in 2004, indicate that the water quality of Saguling reservoir was already above the normal threshold. The content of mercury (Hg), for example, reached 0.236 mg/m3. In fact, the standard, safe rate is 0.002 mg/m3 (MoE 2011).
The metal mercury, according to research PPSDAL University of Padjadjaran, can be extracted from fish food and plastics industries. Other heavy metals are delivered to water bodies from textile mills through the fabric dyeing process. This large amount of heavy metals are a ticking time bomb, ready to destroy the already fragile water quality in the country. Currently, the water in Saguling reservoir is no longer acceptable for consumption, agriculture and fisheries (MoE 2011).
Coastal waterAccording to the State of Environment Report of Indonesia 2007, monitoring data from four harbours in Java (Tanjung Priok ( Jakarta), Tanjung Emas (Semarang), and Tanjung Perak (Surabaya)) show excessively high concentrations of phenol, which exceed the marine water quality standards for harbour areas (Decree of the State Minister of the Environment Number 51 of 2004 Concerning Marine Water Quality Standards). These high concentrations are caused by antiseptic substances from ship wastewater (MoE 2008).
In the northern coastal areas of West Java, damaged areas are characterized by the destruction of mangrove forests, coastal erosion, and siltation of rivers that have an impact on boat traffic events. The level of abrasion that occurs on the south coast is around 35.35 ha/year and about 370.3 ha/year on the north coast, with a seawater pollutant index between 7.391 and 9.843, indicating heavy pollution (MoE 2011).
GroundwaterThe Decree of Health Minister No. 416 of 1990 concerning the provision and control of water quality stipulates quality standards for groundwater. According to the Jakarta State of Environment Report 2006, about 39 percent of monitoring wells in the Jakarta area, which are mostly located in densely settled areas, have concentrations of E. coli that exceed standards (Environmental Management of DKI Jakarta 2007).
5. Frameworks for Water Environment Management
The objective of environmental management in Indonesia is to enable environmentally-sustainable development. Towards this end, water has been recognized as having an important function in achieving this development and
65
Chapter3.3 IndonesiaWEPA Outlook on Water Environmental Management in Asia 2012
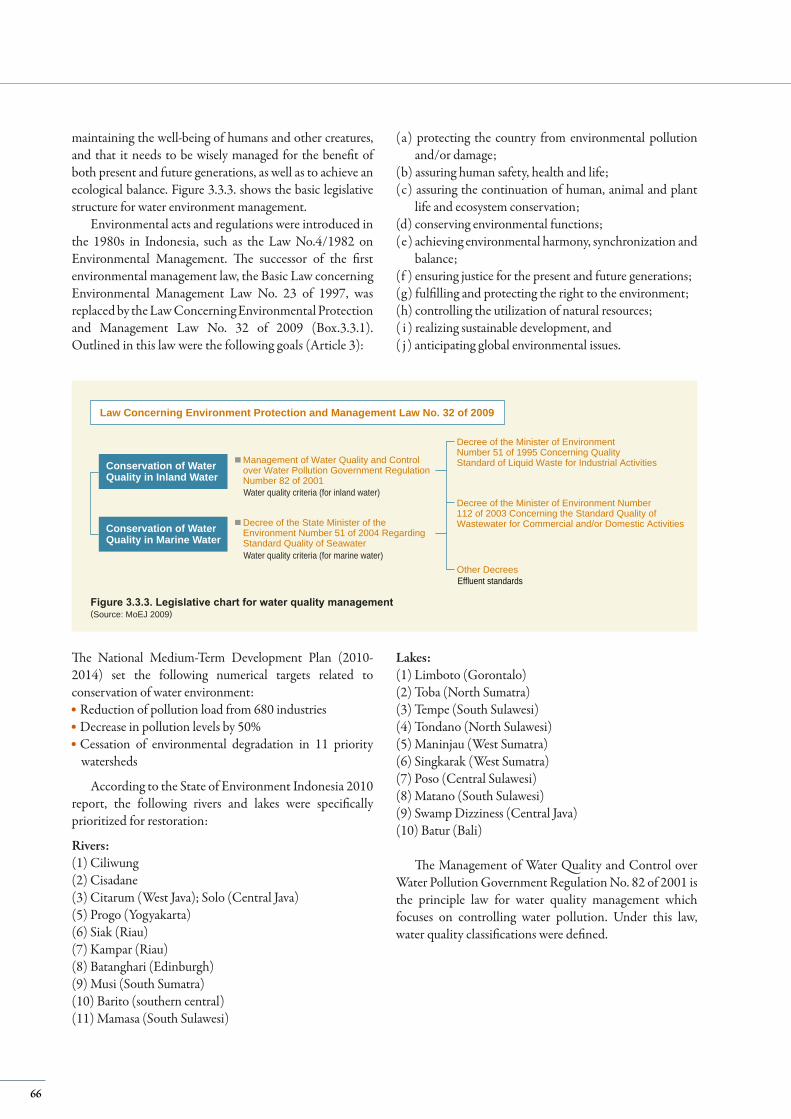
maintaining the well-being of humans and other creatures, and that it needs to be wisely managed for the benefit of both present and future generations, as well as to achieve an ecological balance. Figure 3.3.3. shows the basic legislative structure for water environment management.
Environmental acts and regulations were introduced in the 1980s in Indonesia, such as the Law No.4/1982 on Environmental Management. The successor of the first environmental management law, the Basic Law concerning Environmental Management Law No. 23 of 1997, was replaced by the Law Concerning Environmental Protection and Management Law No. 32 of 2009 (Box.3.3.1). Outlined in this law were the following goals (Article 3):
The National Medium-Term Development Plan (2010-2014) set the following numerical targets related to conservation of water environment:
Reduction of pollution load from 680 industriesDecrease in pollution levels by 50%Cessation of environmental degradation in 11 priority watersheds
According to the State of Environment Indonesia 2010 report, the following rivers and lakes were specifically prioritized for restoration:
Rivers:(1) Ciliwung(2) Cisadane(3) Citarum (West Java); Solo (Central Java)(5) Progo (Yogyakarta)(6) Siak (Riau)(7) Kampar (Riau)(8) Batanghari (Edinburgh)(9) Musi (South Sumatra)(10) Barito (southern central) (11) Mamasa (South Sulawesi)
(a) protecting the country from environmental pollution and/or damage;
(b) assuring human safety, health and life; (c) assuring the continuation of human, animal and plant
life and ecosystem conservation; (d) conserving environmental functions; (e) achieving environmental harmony, synchronization and
balance;(f ) ensuring justice for the present and future generations;(g) fulfilling and protecting the right to the environment; (h) controlling the utilization of natural resources; ( i ) realizing sustainable development, and ( j ) anticipating global environmental issues.
Law Concerning Environment Protection and Management Law No. 32 of 2009
Conservation of Water Quality in Inland Water
Management of Water Quality and Controlover Water Pollution Government RegulationNumber 82 of 2001
Conservation of Water Quality in Marine Water
Decree of the State Minister of theEnvironment Number 51 of 2004 RegardingStandard Quality of SeawaterWater quality criteria (for marine water)
Water quality criteria (for inland water)
Decree of the Minister of EnvironmentNumber 51 of 1995 Concerning QualityStandard of Liquid Waste for Industrial Activities
Decree of the Minister of Environment Number112 of 2003 Concerning the Standard Quality ofWastewater for Commercial and/or Domestic Activities
Other DecreesEffluent standards
Lakes:(1) Limboto (Gorontalo)(2) Toba (North Sumatra)(3) Tempe (South Sulawesi)(4) Tondano (North Sulawesi)(5) Maninjau (West Sumatra)(6) Singkarak (West Sumatra)(7) Poso (Central Sulawesi)(8) Matano (South Sulawesi)(9) Swamp Dizziness (Central Java)(10) Batur (Bali)
The Management of Water Quality and Control over Water Pollution Government Regulation No. 82 of 2001 is the principle law for water quality management which focuses on controlling water pollution. Under this law, water quality classifications were defined.
Figure 3.3.3. Legislative chart for water quality management(Source: MoEJ 2009)
66
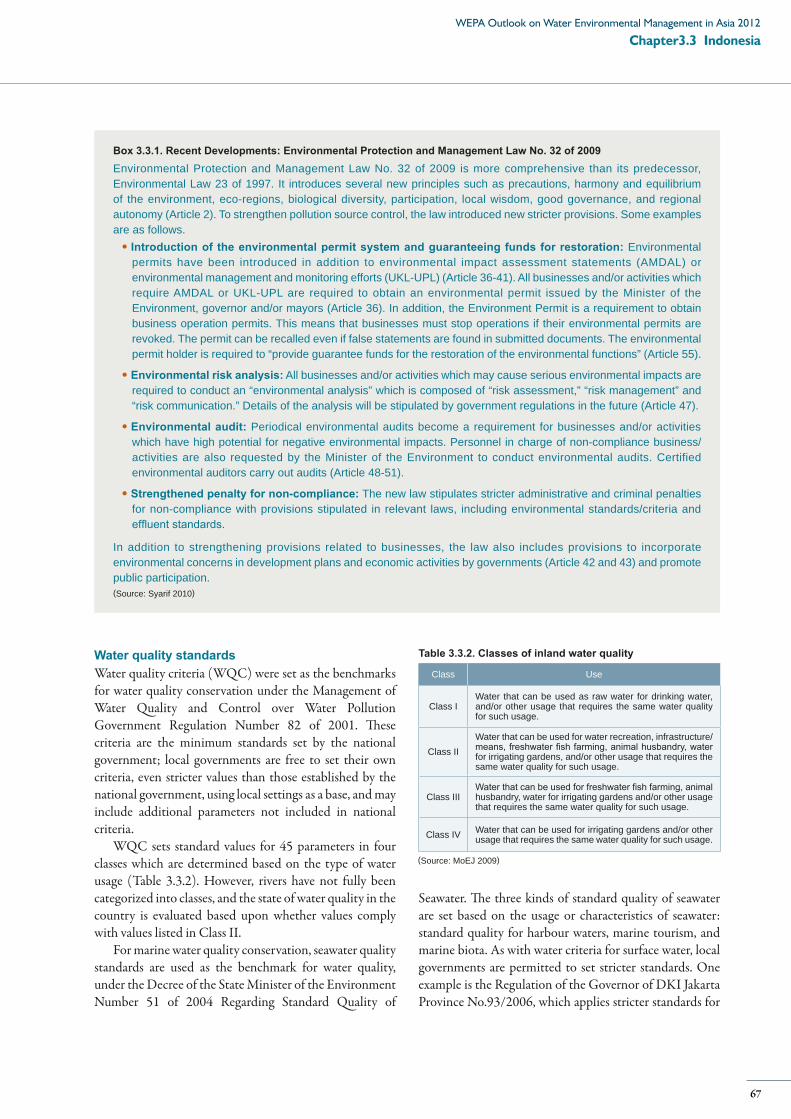
Box 3.3.1. Recent Developments: Environmental Protection and Management Law No. 32 of 2009Environmental Protection and Management Law No. 32 of 2009 is more comprehensive than its predecessor, Environmental Law 23 of 1997. It introduces several new principles such as precautions, harmony and equilibrium of the environment, eco-regions, biological diversity, participation, local wisdom, good governance, and regional autonomy (Article 2). To strengthen pollution source control, the law introduced new stricter provisions. Some examples are as follows.
Introduction of the environmental permit system and guaranteeing funds for restoration: Environmental permits have been introduced in addition to environmental impact assessment statements (AMDAL) or environmental management and monitoring efforts (UKL-UPL) (Article 36-41). All businesses and/or activities which require AMDAL or UKL-UPL are required to obtain an environmental permit issued by the Minister of the Environment, governor and/or mayors (Article 36). In addition, the Environment Permit is a requirement to obtain business operation permits. This means that businesses must stop operations if their environmental permits are revoked. The permit can be recalled even if false statements are found in submitted documents. The environmental permit holder is required to “provide guarantee funds for the restoration of the environmental functions” (Article 55).
Environmental risk analysis: All businesses and/or activities which may cause serious environmental impacts are required to conduct an “environmental analysis” which is composed of “risk assessment,” “risk management” and “risk communication.” Details of the analysis will be stipulated by government regulations in the future (Article 47).
Environmental audit: Periodical environmental audits become a requirement for businesses and/or activities which have high potential for negative environmental impacts. Personnel in charge of non-compliance business/activities are also requested by the Minister of the Environment to conduct environmental audits. Certified environmental auditors carry out audits (Article 48-51).
Strengthened penalty for non-compliance: The new law stipulates stricter administrative and criminal penalties for non-compliance with provisions stipulated in relevant laws, including environmental standards/criteria and effluent standards.
In addition to strengthening provisions related to businesses, the law also includes provisions to incorporate environmental concerns in development plans and economic activities by governments (Article 42 and 43) and promote public participation. (Source: Syarif 2010)
Water quality standards Water quality criteria (WQC) were set as the benchmarks for water quality conservation under the Management of Water Quality and Control over Water Pollution Government Regulation Number 82 of 2001. These criteria are the minimum standards set by the national government; local governments are free to set their own criteria, even stricter values than those established by the national government, using local settings as a base, and may include additional parameters not included in national criteria.
WQC sets standard values for 45 parameters in four classes which are determined based on the type of water usage (Table 3.3.2). However, rivers have not fully been categorized into classes, and the state of water quality in the country is evaluated based upon whether values comply with values listed in Class II.
For marine water quality conservation, seawater quality standards are used as the benchmark for water quality, under the Decree of the State Minister of the Environment Number 51 of 2004 Regarding Standard Quality of
Class Use
Class IWater that can be used as raw water for drinking water, and/or other usage that requires the same water quality for such usage.
Class IIWater that can be used for water recreation, infrastructure/means, freshwater fish farming, animal husbandry, water for irrigating gardens, and/or other usage that requires the same water quality for such usage.
Class IIIWater that can be used for freshwater fish farming, animal husbandry, water for irrigating gardens and/or other usage that requires the same water quality for such usage.
Class IV Water that can be used for irrigating gardens and/or other usage that requires the same water quality for such usage.
Table 3.3.2. Classes of inland water quality
Seawater. The three kinds of standard quality of seawater are set based on the usage or characteristics of seawater: standard quality for harbour waters, marine tourism, and marine biota. As with water criteria for surface water, local governments are permitted to set stricter standards. One example is the Regulation of the Governor of DKI Jakarta Province No.93/2006, which applies stricter standards for
(Source: MoEJ 2009)
67
Chapter3.3 IndonesiaWEPA Outlook on Water Environmental Management in Asia 2012
capitals of provinces and special region of Jakarta (DKI Jakarta Province).
As of January 2012, the Ministry of Environment of Indonesia is drafting a new Government Regulation revising the existing Government Regulation No. 82 of 2001 to reflect the more recent Regulation No. 32 of 2009. The draft has been completed and is awaiting approval. It is expected to be issued in 2012 (Information from the focal person of Indonesia).
Monitoring of water quality in public water bodies Water quality monitoring schemes are determined under the Management of Water Quality and Control over Water Pollution Government Regulation as follows:
(1) Monitoring of water sources in the regency/municipal region is carried out by the regency/municipal government
(2) Monitoring of water sources in two or more regency/municipal regions within one province is coordinated by the provincial government and is carried out by each regency/municipal government
(3) Monitoring of water sources in two or more provincial regions and/or water sources on the border with other countries is observed by the national government.
Water quality observation is carried out at least once every six months and results are submitted to the Minister. The mechanisms and procedures for water quality monitoring are stipulated further in detail through a Ministerial Decree.
Since 2004, 33 Regional Environmental Impact Control Agencies in the provinces have monitored water quality parameters in 40 rivers in Indonesia.
Effluent standardsNational wastewater quality standards are specified with a Ministerial Decree by taking into account suggestions from related government agencies (Management of Water Quality and Control over Water Pollution Government Regulation). As with water quality standards, the provincial government can specify the same or tighter wastewater quality standards than the national wastewater quality standard.
In 2001, the government set up the first effluent standards for 14 industrial activities. By 2005, this number increased to 21 by the Decree of the Minister of Environment Number 51 of 1995 Concerning Quality Standard of Liquid Waste for Industrial Activities. The Minister determines the values for wastewater quality standards by individual regulations. Local governments such in DKI Jakarta, West Java and Jogjakarta established stricter wastewater quality standards the national government.
6. Existing and Future Challenges
To achieve and promote better water environment management in Indonesia, several attempts will be required such as:
Create incentives for industries to comply with the existing regulationsEnsure implementation of waste management in riversDevelopment and implementation of water quality restoration policy instrumentsStrengthen database and information systems, and improve capacity building activities in the laboratoriesIntroduce spatial regulations and promote the involvement of all stakeholders in the process of spatial planning in a participatory manner
68

69
Chapter3.3 IndonesiaWEPA Outlook on Water Environmental Management in Asia 2012
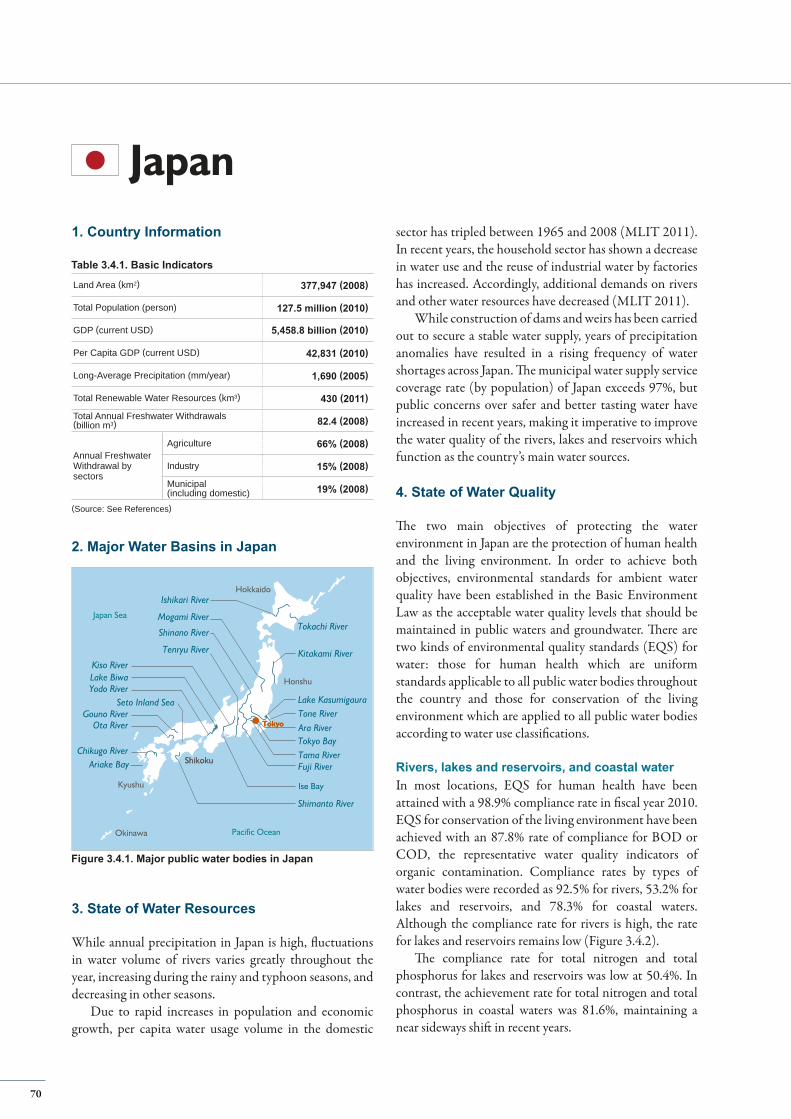
Hokkaido
Honshu
Kitakami River
Lake KasumigauraTone RiverAra River
Tama RiverFuji River
Tenryu River
Ishikari River
Mogami River
Shinano River
Kiso RiverLake BiwaYodo River
Gouno RiverOta River
Chikugo River
Shimanto River
Okinawa Pacific Ocean
Japan Sea
Ariake Bay
Seto Inland Sea
Tokyo Bay
Ise Bay
ShikokuShikoku
Tokachi River
Kyushu
TokyoTokyo
Land Area (km2) 377,947 (2008)
Total Population (person) 127.5 million (2010)
GDP (current USD)
Per Capita GDP (current USD) 42,831 (2010)
Long-Average Precipitation (mm/year) 1,690 (2005)
Total Renewable Water Resources (km3) 430 (2011)
Total Annual Freshwater Withdrawals (billion m3) 82.4 (2008)
Annual FreshwaterWithdrawal bysectors
Agriculture 66% (2008)
Industry 15% (2008)
Municipal(including domestic) 19% (2008)
1. Country Information
2. Major Water Basins in Japan
(Source: See References)
Figure 3.4.1. Major public water bodies in Japan
Table 3.4.1. Basic Indicators
Japan
3. State of Water Resources
While annual precipitation in Japan is high, fluctuations in water volume of rivers varies greatly throughout the year, increasing during the rainy and typhoon seasons, and decreasing in other seasons.
Due to rapid increases in population and economic growth, per capita water usage volume in the domestic
sector has tripled between 1965 and 2008 (MLIT 2011). In recent years, the household sector has shown a decrease in water use and the reuse of industrial water by factories has increased. Accordingly, additional demands on rivers and other water resources have decreased (MLIT 2011).
While construction of dams and weirs has been carried out to secure a stable water supply, years of precipitation anomalies have resulted in a rising frequency of water shortages across Japan. The municipal water supply service coverage rate (by population) of Japan exceeds 97%, but public concerns over safer and better tasting water have increased in recent years, making it imperative to improve the water quality of the rivers, lakes and reservoirs which function as the country’s main water sources.
4. State of Water Quality
The two main objectives of protecting the water environment in Japan are the protection of human health and the living environment. In order to achieve both objectives, environmental standards for ambient water quality have been established in the Basic Environment Law as the acceptable water quality levels that should be maintained in public waters and groundwater. There are two kinds of environmental quality standards (EQS) for water: those for human health which are uniform standards applicable to all public water bodies throughout the country and those for conservation of the living environment which are applied to all public water bodies according to water use classifications.
Rivers, lakes and reservoirs, and coastal waterIn most locations, EQS for human health have been attained with a 98.9% compliance rate in fiscal year 2010. EQS for conservation of the living environment have been achieved with an 87.8% rate of compliance for BOD or COD, the representative water quality indicators of organic contamination. Compliance rates by types of water bodies were recorded as 92.5% for rivers, 53.2% for lakes and reservoirs, and 78.3% for coastal waters. Although the compliance rate for rivers is high, the rate for lakes and reservoirs remains low (Figure 3.4.2).
The compliance rate for total nitrogen and total phosphorus for lakes and reservoirs was low at 50.4%. In contrast, the achievement rate for total nitrogen and total phosphorus in coastal waters was 81.6%, maintaining a near sideways shift in recent years.
5,458.8 billion (2010)
70
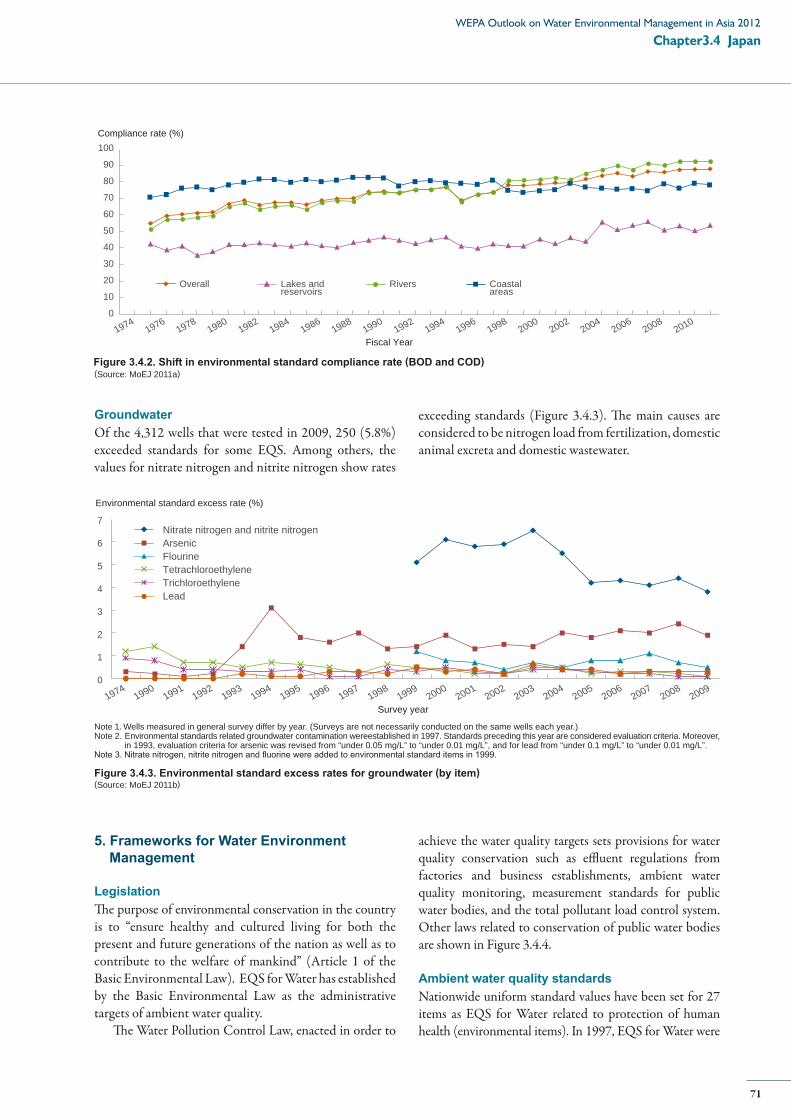
Compliance rate (%)
0
10
20
30
40
50
60
70
80
90
100
Overall RiversLakes andreservoirs
Coastalareas
Fiscal Year1974
19761978
19801982
19841986
19881990
19921994
19961998
20002002
20042006
20082010
0
1
2
3
4
5
6
7
Environmental standard excess rate (%)
Survey year
Nitrate nitrogen and nitrite nitrogenArsenicFlourineTetrachloroethylene TrichloroethyleneLead
19741990
19911992
19931994
19951996
19971998
19992000
20012002
20032004
20052006
20072008
2009
5. Frameworks for Water Environment Management
Legislation The purpose of environmental conservation in the country is to “ensure healthy and cultured living for both the present and future generations of the nation as well as to contribute to the welfare of mankind” (Article 1 of the Basic Environmental Law). EQS for Water has established by the Basic Environmental Law as the administrative targets of ambient water quality.
The Water Pollution Control Law, enacted in order to
(Source: MoEJ 2011a)
(Source: MoEJ 2011b)Figure 3.4.3. Environmental standard excess rates for groundwater (by item)
achieve the water quality targets sets provisions for water quality conservation such as effluent regulations from factories and business establishments, ambient water quality monitoring, measurement standards for public water bodies, and the total pollutant load control system. Other laws related to conservation of public water bodies are shown in Figure 3.4.4.
Ambient water quality standardsNationwide uniform standard values have been set for 27 items as EQS for Water related to protection of human health (environmental items). In 1997, EQS for Water were
Note 1. Wells measured in general survey differ by year. (Surveys are not necessarily conducted on the same wells each year.) Note 2. Environmental standards related groundwater contamination wereestablished in 1997. Standards preceding this year are considered evaluation criteria. Moreover,
in 1993, evaluation criteria for arsenic was revised from “under 0.05 mg/L” to “under 0.01 mg/L”, and for lead from “under 0.1 mg/L” to “under 0.01 mg/L”. Note 3. Nitrate nitrogen, nitrite nitrogen and fluorine were added to environmental standard items in 1999.
Groundwater Of the 4,312 wells that were tested in 2009, 250 (5.8%) exceeded standards for some EQS. Among others, the values for nitrate nitrogen and nitrite nitrogen show rates
exceeding standards (Figure 3.4.3). The main causes are considered to be nitrogen load from fertilization, domestic animal excreta and domestic wastewater.
Figure 3.4.2. Shift in environmental standard compliance rate (BOD and COD)
71
Chapter3.4 JapanWEPA Outlook on Water Environmental Management in Asia 2012
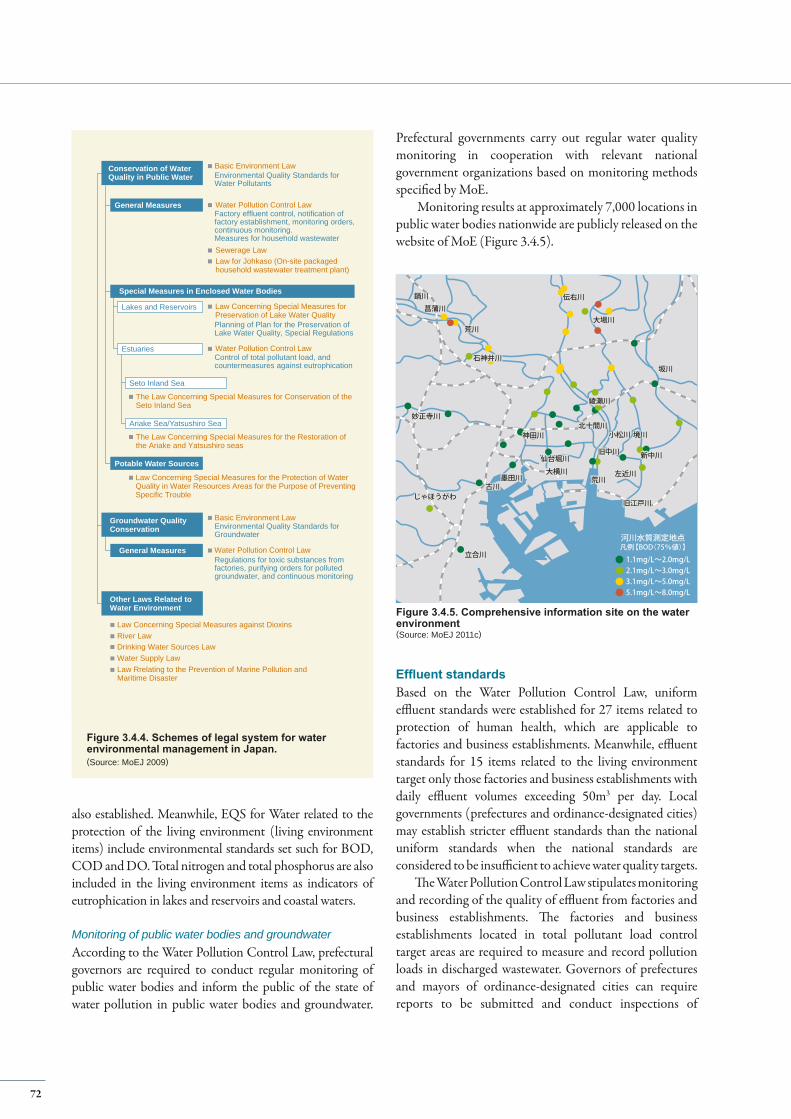
also established. Meanwhile, EQS for Water related to the protection of the living environment (living environment items) include environmental standards set such for BOD, COD and DO. Total nitrogen and total phosphorus are also included in the living environment items as indicators of eutrophication in lakes and reservoirs and coastal waters.
Monitoring of public water bodies and groundwaterAccording to the Water Pollution Control Law, prefectural governors are required to conduct regular monitoring of public water bodies and inform the public of the state of water pollution in public water bodies and groundwater.
Prefectural governments carry out regular water quality monitoring in cooperation with relevant national government organizations based on monitoring methods specified by MoE.
Monitoring results at approximately 7,000 locations in public water bodies nationwide are publicly released on the website of MoE (Figure 3.4.5).
伝右川伝右川
大場川大場川
妙正寺川妙正寺川
石神井川石神井川
荒川荒川
菖蒲川菖蒲川
鍋川鍋川
坂川坂川
綾瀬川綾瀬川
1.1mg/L~2.0mg/L
河川水質測定地点凡例【BOD(75%値)】
小松川小松川 境川境川
新中川新中川旧中川旧中川仙台堀川仙台堀川
大横川大横川墨田川墨田川
古川古川
立合川立合川
じゃほうがわじゃほうがわ
北十間川北十間川神田川神田川
荒川荒川左近川左近川
旧江戸川旧江戸川
2.1mg/L~3.0mg/L3.1mg/L~5.0mg/L5.1mg/L~8.0mg/L
(Source: MoEJ 2011c)
Figure 3.4.5. Comprehensive information site on the water environment
Effluent standardsBased on the Water Pollution Control Law, uniform effluent standards were established for 27 items related to protection of human health, which are applicable to factories and business establishments. Meanwhile, effluent standards for 15 items related to the living environment target only those factories and business establishments with daily effluent volumes exceeding 50m3 per day. Local governments (prefectures and ordinance-designated cities) may establish stricter effluent standards than the national uniform standards when the national standards are considered to be insufficient to achieve water quality targets.
The Water Pollution Control Law stipulates monitoring and recording of the quality of effluent from factories and business establishments. The factories and business establishments located in total pollutant load control target areas are required to measure and record pollution loads in discharged wastewater. Governors of prefectures and mayors of ordinance-designated cities can require reports to be submitted and conduct inspections of
Conservation of WaterQuality in Public Water
Groundwater QualityConservation
Other Laws Related toWater Environment
Basic Environment Law
Water Pollution Control Law
Basic Environment Law
Law Concerning Special Measures against DioxinsRiver LawDrinking Water Sources LawWater Supply LawLaw Rrelating to the Prevention of Marine Pollution andMaritime Disaster
Water Pollution Control Law
Sewerage LawLaw for Johkaso (On-site packagedhousehold wastewater treatment plant)
The Law Concerning Special Measures for Conservation of theSeto Inland Sea
Law Concerning Special Measures forPreservation of Lake Water Quality
General Measures
Special Measures in Enclosed Water Bodies
Potable Water Sources
General Measures
Environmental Quality Standards forWater Pollutants
Factory effluent control, notification offactory establishment, monitoring orders,continuous monitoring.Measures for household wastewater
Planning of Plan for the Preservation ofLake Water Quality, Special Regulations
Lakes and Reservoirs
Water Pollution Control LawControl of total pollutant load, andcountermeasures against eutrophication
Environmental Quality Standards forGroundwater
Regulations for toxic substances fromfactories, purifying orders for pollutedgroundwater, and continuous monitoring
Estuaries
Seto Inland Sea
The Law Concerning Special Measures for the Restoration ofthe Ariake and Yatsushiro seas
Law Concerning Special Measures for the Protection of WaterQuality in Water Resources Areas for the Purpose of PreventingSpecific Trouble
Ariake Sea/Yatsushiro Sea
(Source: MoEJ 2009)
Figure 3.4.4. Schemes of legal system for water environmental management in Japan.
72

5.44.4
6.1
4.3 3.4
3.5
3.5
2.83.33.3
3.23.4
3.0
3.3
3.33.1
3.42.9
2.9
2.72.5
2.42.9
2.2
2.21.7
3.84.1
4.3
4.55.0
4.8
3.93.9
3.84.4
4.67.3
3.65.3
4.5 4.1神奈川県
東京都
千葉県
6.0 <5.0 - 6.04.5 - 5.04.0 - 4.53.5 - 4.03.0 - 3.52.5 - 3.02.0 - 2.51.5 - 2.0
凡例(mg/L)
3.74.0
4.2
3.8
3.1 3.7
2.4
2.72.3
5.2
6.2 5.2
神奈川県
東京都
千葉県
6.0 <5.0 - 6.04.5 - 5.04.0 - 4.53.5 - 4.03.0 - 3.52.5 - 3.02.0 - 2.51.5 - 2.0
凡例(mg/L)
1982 - 1984 (average) 2006 - 2008 (average)
5.2
4.0
324 290 243 197 167 144 124 119 151 150 141 134 118 99 81 71
488 444 400 365 319
115 83
76 59
52 42 36 36
119 101 97 83 76 65 57 56
429
367 356
309 286 38
40 36
30 28
25 23 22
37 35 34 29 27 22 20 19
95
89 82
72
67
477 413
355
286 247
211 183 177
307 286 272 246 221 186
158 146
1,012
900 838
746
672
19791984
19891994
20002005
20092014
(target) 19791984
19891994
20002005
20092014
(target) 20052009
2014
(target)
Ise BayTokyo Bay
Osaka Bay
Seto Inland Sea
Fiscal year0
200
400
600
800
1,000
COD generated loads (tons/day)
261 221 201 102 83 80
245
193 215
32 26 26
55
54 56
10 9 10
561
468 472
144 118 116
Domestic IndustrialOthers
19791984
19891994
20002005
20092014
(target)
Tokyo Bay
Seto Inland Sea
Ise Bay
Osaka Bay
(Source: Provided by MoEJ)
(Source: Provided by MoEJ)
Figure 3.4.7. COD concentration in Tokyo Bay
Figure 3.4.6. Changes in pollution load and target value (in terms of COD)Note: Figures for 1979-2009 are actual. Figures for 2014 is the reduction target
factories and business establishments on wastewater treatment methods and the quality/amount of wastewater in order to prevent violations. They are also authorized to take administrative measures in the event that violations are found, such as issuing orders for improvements according to the outcomes of reports and inspections.
Total pollutant load control system (TPLCs)The total pollutant load control system is a discharge control mechanism to improve water quality by reducing total pollutant loads flowing into the selected enclosed coastal waters, namely Tokyo Bay, Ise Bay, and the Seto Inland Sea where it is difficult to achieve EQS for Water by
regulating discharge based on only concentrations of regulated substances. Under the system, the national government sets targets for pollutant loads every five years (one phase for five years), and relevant prefectures establish reduction plans that set targets for each emission source and stipulate the methods necessary to meet targets.
To date, COD loads has been steadily reduced in target water bodies since 1979 (Figure 3.4.6). Figure 3.4.7 shows the improvement of COD concentration in Tokyo Bay, for example. Nitrogen and phosphorus loads have also been reduced since there items are covered by the system in 2001. In July 2011, Japan set forth the basic policy of the 7th phase total reduction of which target year is 2016.
73
Chapter3.4 JapanWEPA Outlook on Water Environmental Management in Asia 2012
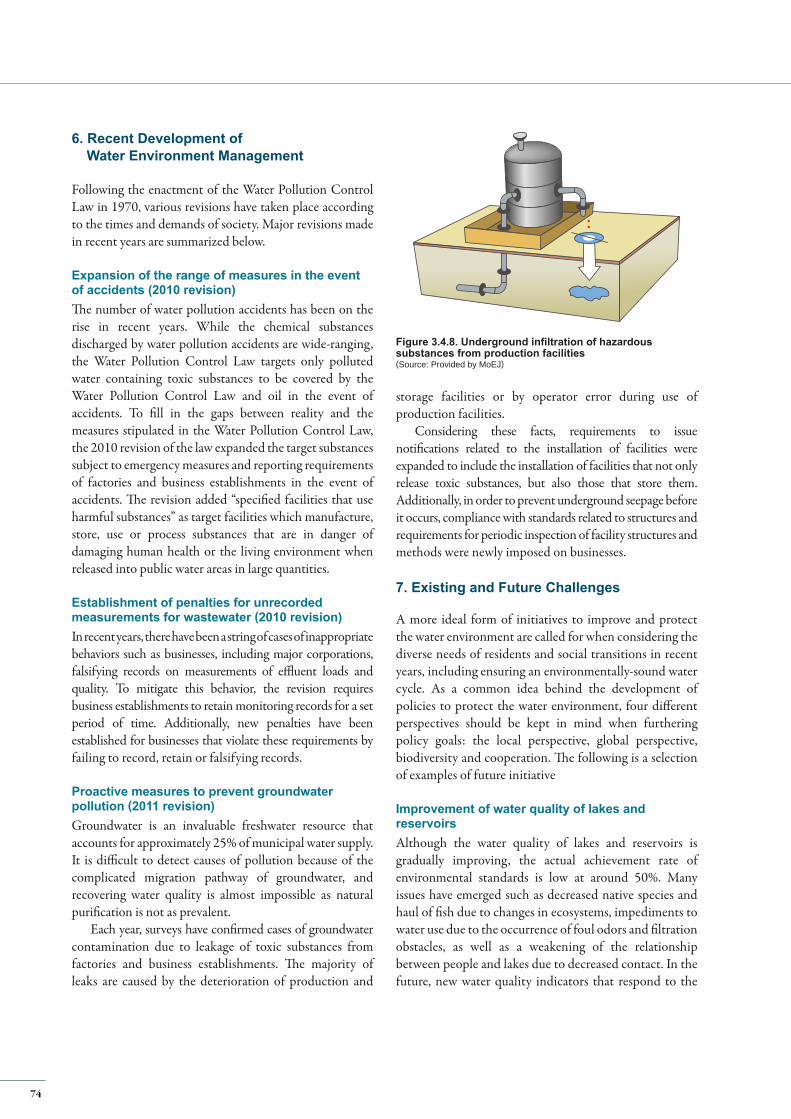
6. Recent Development of Water Environment Management
Following the enactment of the Water Pollution Control Law in 1970, various revisions have taken place according to the times and demands of society. Major revisions made in recent years are summarized below.
Expansion of the range of measures in the event of accidents (2010 revision)The number of water pollution accidents has been on the rise in recent years. While the chemical substances discharged by water pollution accidents are wide-ranging, the Water Pollution Control Law targets only polluted water containing toxic substances to be covered by the Water Pollution Control Law and oil in the event of accidents. To fill in the gaps between reality and the measures stipulated in the Water Pollution Control Law, the 2010 revision of the law expanded the target substances subject to emergency measures and reporting requirements of factories and business establishments in the event of accidents. The revision added “specified facilities that use harmful substances” as target facilities which manufacture, store, use or process substances that are in danger of damaging human health or the living environment when released into public water areas in large quantities.
Establishment of penalties for unrecorded measurements for wastewater (2010 revision)In recent years, there have been a string of cases of inappropriate behaviors such as businesses, including major corporations, falsifying records on measurements of effluent loads and quality. To mitigate this behavior, the revision requires business establishments to retain monitoring records for a set period of time. Additionally, new penalties have been established for businesses that violate these requirements by failing to record, retain or falsifying records.
Proactive measures to prevent groundwater pollution (2011 revision)Groundwater is an invaluable freshwater resource that accounts for approximately 25% of municipal water supply. It is difficult to detect causes of pollution because of the complicated migration pathway of groundwater, and recovering water quality is almost impossible as natural purification is not as prevalent.
Each year, surveys have confirmed cases of groundwater contamination due to leakage of toxic substances from factories and business establishments. The majority of leaks are caused by the deterioration of production and
storage facilities or by operator error during use of production facilities.
Considering these facts, requirements to issue notifications related to the installation of facilities were expanded to include the installation of facilities that not only release toxic substances, but also those that store them. Additionally, in order to prevent underground seepage before it occurs, compliance with standards related to structures and requirements for periodic inspection of facility structures and methods were newly imposed on businesses.
7. Existing and Future Challenges
A more ideal form of initiatives to improve and protect the water environment are called for when considering the diverse needs of residents and social transitions in recent years, including ensuring an environmentally-sound water cycle. As a common idea behind the development of policies to protect the water environment, four different perspectives should be kept in mind when furthering policy goals: the local perspective, global perspective, biodiversity and cooperation. The following is a selection of examples of future initiative
Improvement of water quality of lakes and reservoirsAlthough the water quality of lakes and reservoirs is gradually improving, the actual achievement rate of environmental standards is low at around 50%. Many issues have emerged such as decreased native species and haul of fish due to changes in ecosystems, impediments to water use due to the occurrence of foul odors and filtration obstacles, as well as a weakening of the relationship between people and lakes due to decreased contact. In the future, new water quality indicators that respond to the
Figure 3.4.8. Underground infiltration of hazardous substances from production facilities(Source: Provided by MoEJ)
74

An “ordinance designated city” is a large city which is delegated some affairs and authorities of prefecture by cabinet order. The population of the ordinance designated city must be more than 0.5 million. As of April 2011, there are 19 ordinance designated city in Japan.
actual needs of the country’s residents, as well as targets that reflect the natural conditions and purpose of each water body should be examined further. It is important to promote measures for both lakes themselves and catchment areas that utilize natural purification mechanism, following efforts to elucidate contamination mechanisms of lakes and reservoirs.
Creation of “sato-umi”A sato-umi, or “local seaside” is defined as “a coastal area where biological productivity and biodiversity have increased through human interaction.” It is an important ocean area that has supported not only marine and distribution industries, but also the local culture and exchange with other areas for many years. In a healthy sato-umi, the circulation function of materials is appropriately maintained due to the integrated comprehensive management of land and coastal zones by human being. With the preservation of the rich and diverse ecosystem and natural environment, sato-umi provides the country with a wonderful legacy, and therefore, is a focal point in the protection of the water environment.
Initiatives on global water issuesJapan’s water environment is closely related to the global water environment. Thus, it is important to maintain an international perspective and contribute to the preservation and improvement of the water environment in other countries. As such, we must utilize Japan’s technologies and experience in water environmental preservation to promote
initiatives in international cooperation and partnerships, such as institutional transfer and technology support. Additionally, in order to respond to both quality and quantity related water issues manifesting themselves in regions where increased water demand is predicted, such as Asia and the Middle East, we must endeavor to improve the water environment overseas through the close and active joint efforts of the private and public sector on initiatives to enhance the international competitiveness of Japan’s water-related industries.
Biodiversity odiversityThree elements thatsupport preservation
and restoration
SustainabilityTwo elements that support hands-on action
SATOUMI
Substancecirculation
Entities thatperform activities
Activityspheres
Fishing villages and citiesWatershed (mountains,rivers,
fields and oceans)
ContactCoexistence with nature
Regional cooperativeeffort
EcosystemDiversity and productivityResource management
fishing operations
Fishermen and other coastalresidents Urban residents
that use the oceanResidents ofwatersheds
(mountains,rivers,fields and oceans)
Appropriate nutrient saltsHealthy substance circulation
Water quality and bottomsediment
Figure 3.4.9. The concept of “Satoumi”(Source: Provided by the focal person in 2012)
75
Chapter3.4 JapanWEPA Outlook on Water Environmental Management in Asia 2012
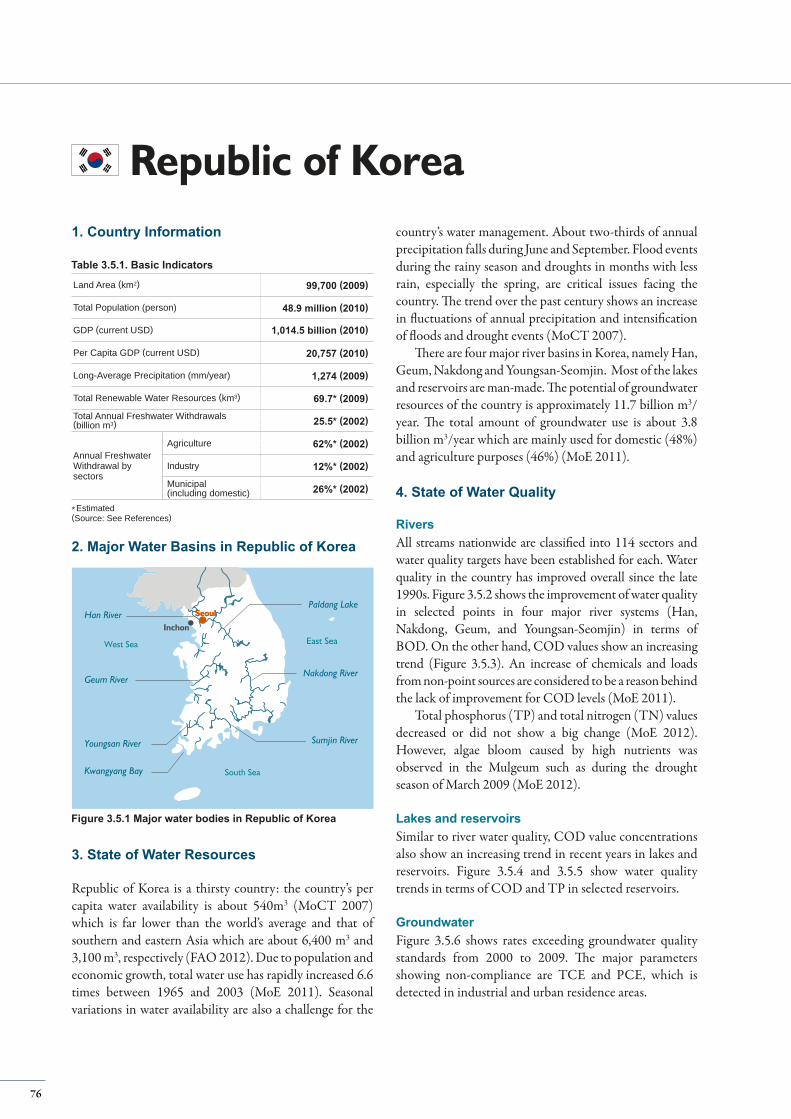
SeoulSeoul
Inchon
Paldang Lake
Nakdong River
Sumjin River
Geum River
Youngsan River
Han River
South Sea
East SeaWest Sea
Kwangyang Bay
Land Area (km2) 99,700 (2009)
Total Population (person) 48.9 million (2010)
GDP (current USD)
Per Capita GDP (current USD) 20,757 (2010)
Long-Average Precipitation (mm/year) 1,274 (2009)
Total Renewable Water Resources (km3) 69.7* (2009)
Total Annual Freshwater Withdrawals(billion m3) 25.5* (2002)
Annual FreshwaterWithdrawal bysectors
Agriculture 62%* (2002)
Industry 12%* (2002)
Municipal(including domestic) 26%* (2002)
1. Country Information
2. Major Water Basins in Republic of Korea
* Estimated(Source: See References)
Figure 3.5.1 Major water bodies in Republic of Korea
Table 3.5.1. Basic Indicators
Republic of Korea
3. State of Water Resources
Republic of Korea is a thirsty country: the country’s per capita water availability is about 540m3 (MoCT 2007) which is far lower than the world’s average and that of southern and eastern Asia which are about 6,400 m3 and 3,100 m3, respectively (FAO 2012). Due to population and economic growth, total water use has rapidly increased 6.6 times between 1965 and 2003 (MoE 2011). Seasonal variations in water availability are also a challenge for the
country’s water management. About two-thirds of annual precipitation falls during June and September. Flood events during the rainy season and droughts in months with less rain, especially the spring, are critical issues facing the country. The trend over the past century shows an increase in fluctuations of annual precipitation and intensification of floods and drought events (MoCT 2007).
There are four major river basins in Korea, namely Han, Geum, Nakdong and Youngsan-Seomjin. Most of the lakes and reservoirs are man-made. The potential of groundwater resources of the country is approximately 11.7 billion m3/year. The total amount of groundwater use is about 3.8 billion m3/year which are mainly used for domestic (48%) and agriculture purposes (46%) (MoE 2011).
4. State of Water Quality
Rivers All streams nationwide are classified into 114 sectors and water quality targets have been established for each. Water quality in the country has improved overall since the late 1990s. Figure 3.5.2 shows the improvement of water quality in selected points in four major river systems (Han, Nakdong, Geum, and Youngsan-Seomjin) in terms of BOD. On the other hand, COD values show an increasing trend (Figure 3.5.3). An increase of chemicals and loads from non-point sources are considered to be a reason behind the lack of improvement for COD levels (MoE 2011).
Total phosphorus (TP) and total nitrogen (TN) values decreased or did not show a big change (MoE 2012). However, algae bloom caused by high nutrients was observed in the Mulgeum such as during the drought season of March 2009 (MoE 2012).
Lakes and reservoirsSimilar to river water quality, COD value concentrations also show an increasing trend in recent years in lakes and reservoirs. Figure 3.5.4 and 3.5.5 show water quality trends in terms of COD and TP in selected reservoirs.
Groundwater Figure 3.5.6 shows rates exceeding groundwater quality standards from 2000 to 2009. The major parameters showing non-compliance are TCE and PCE, which is detected in industrial and urban residence areas.
1,014.5 billion (2010)
76
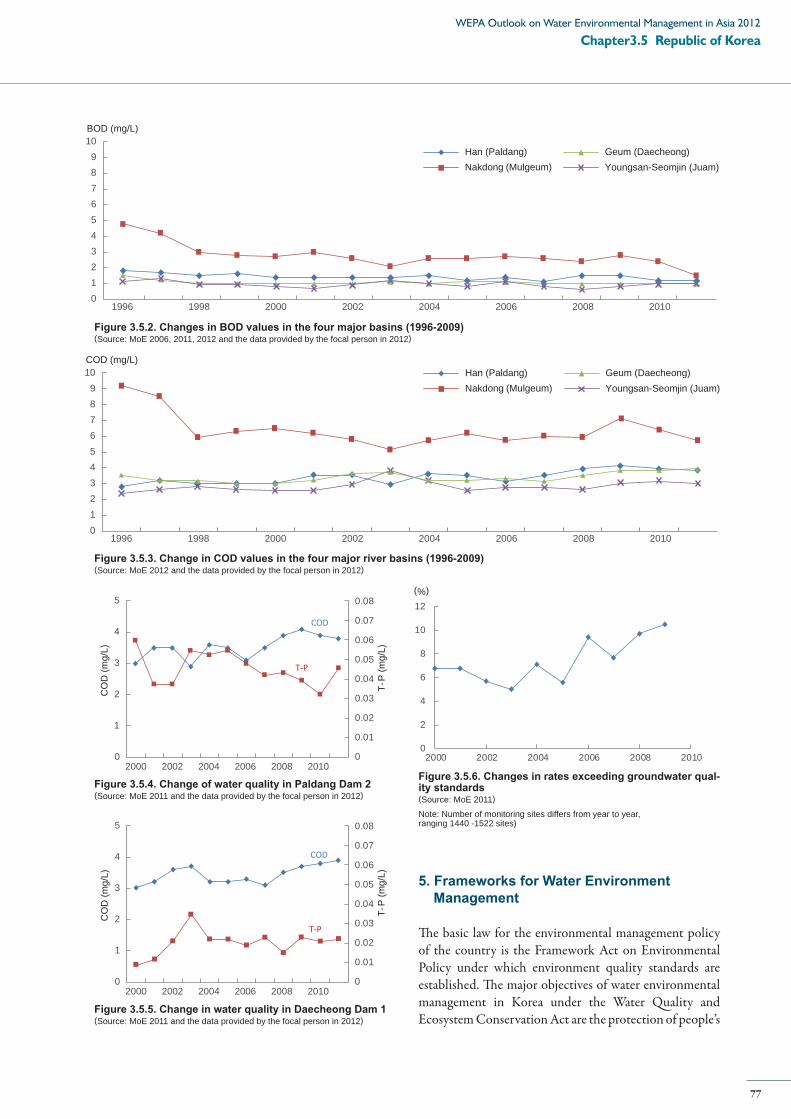
0
0.01
0.02
0.03
0.04
0.05
0.06
0.07
0.08
2000 2002 2004 2006 2008 20100
1
2
3
4
5
T-P
(mg/
L)
CO
D (m
g/L)
COD
T-P
Figure 3.5.5. Change in water quality in Daecheong Dam 1(Source: MoE 2011 and the data provided by the focal person in 2012)
0
0.01
0.02
0.03
0.04
0.05
0.06
0.07
0.08
0
1
2
3
4
5
T-P
(mg/
L)
CO
D (m
g/L)
COD
T-P
2000 2002 2004 2006 2008 2010
Figure 3.5.4. Change of water quality in Paldang Dam 2(Source: MoE 2011 and the data provided by the focal person in 2012)
0123456789
10BOD (mg/L)
Han (Paldang)Nakdong (Mulgeum)
Geum (Daecheong)Youngsan-Seomjin (Juam)
1996 1998 2000 2002 2004 2006 2008 2010
Figure 3.5.2. Changes in BOD values in the four major basins (1996-2009)(Source: MoE 2006, 2011, 2012 and the data provided by the focal person in 2012)
0
2
4
6
8
10
12
2000 2002 2004 2006 2008 2010
(%)
Figure 3.5.6. Changes in rates exceeding groundwater qual-ity standards (Source: MoE 2011)
Note: Number of monitoring sites differs from year to year, ranging 1440 -1522 sites)
5. Frameworks for Water Environment Management
The basic law for the environmental management policy of the country is the Framework Act on Environmental Policy under which environment quality standards are established. The major objectives of water environmental management in Korea under the Water Quality and Ecosystem Conservation Act are the protection of people’s
1996 1998 2000 2002 2004 2006 2008 20100123456789
10 Han (Paldang)Nakdong (Mulgeum)
Geum (Daecheong)Youngsan-Seomjin (Juam)
COD (mg/L)
Figure 3.5.3. Change in COD values in the four major river basins (1996-2009)(Source: MoE 2012 and the data provided by the focal person in 2012)
77
Chapter3.5 Republic of KoreaWEPA Outlook on Water Environmental Management in Asia 2012
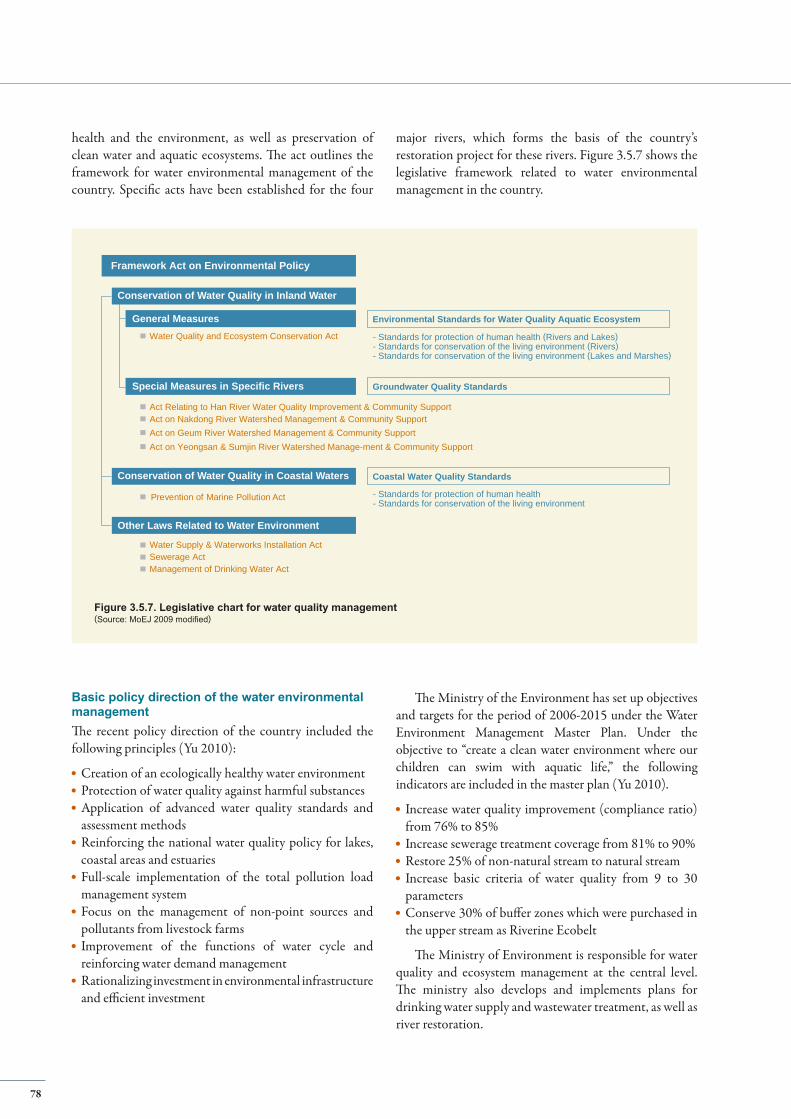
Basic policy direction of the water environmental managementThe recent policy direction of the country included the following principles (Yu 2010):
Creation of an ecologically healthy water environment Protection of water quality against harmful substances Application of advanced water quality standards and assessment methods Reinforcing the national water quality policy for lakes, coastal areas and estuaries Full-scale implementation of the total pollution load management system Focus on the management of non-point sources and pollutants from livestock farms Improvement of the functions of water cycle and reinforcing water demand management Rationalizing investment in environmental infrastructure and efficient investment
Conservation of Water Quality in Inland Water
Conservation of Water Quality in Coastal Waters
Other Laws Related to Water Environment
Special Measures in Specific Rivers
General Measures
Framework Act on Environmental Policy
Groundwater Quality Standards
Environmental Standards for Water Quality Aquatic Ecosystem
- Standards for protection of human health (Rivers and Lakes)- Standards for conservation of the living environment (Rivers)- Standards for conservation of the living environment (Lakes and Marshes)
Coastal Water Quality Standards
- Standards for protection of human health- Standards for conservation of the living environment
Water Quality and Ecosystem Conservation Act
Act Relating to Han River Water Quality Improvement & Community SupportAct on Nakdong River Watershed Management & Community SupportAct on Geum River Watershed Management & Community SupportAct on Yeongsan & Sumjin River Watershed Manage-ment & Community Support
Prevention of Marine Pollution Act
Water Supply & Waterworks Installation ActSewerage ActManagement of Drinking Water Act
Figure 3.5.7. Legislative chart for water quality management(Source: MoEJ 2009 modified)
The Ministry of the Environment has set up objectives and targets for the period of 2006-2015 under the Water Environment Management Master Plan. Under the objective to “create a clean water environment where our children can swim with aquatic life,” the following indicators are included in the master plan (Yu 2010).
Increase water quality improvement (compliance ratio) from 76% to 85% Increase sewerage treatment coverage from 81% to 90% Restore 25% of non-natural stream to natural stream Increase basic criteria of water quality from 9 to 30 parameters Conserve 30% of buffer zones which were purchased in the upper stream as Riverine Ecobelt
The Ministry of Environment is responsible for water quality and ecosystem management at the central level. The ministry also develops and implements plans for drinking water supply and wastewater treatment, as well as river restoration.
health and the environment, as well as preservation of clean water and aquatic ecosystems. The act outlines the framework for water environmental management of the country. Specific acts have been established for the four
major rivers, which forms the basis of the country’s restoration project for these rivers. Figure 3.5.7 shows the legislative framework related to water environmental management in the country.
78
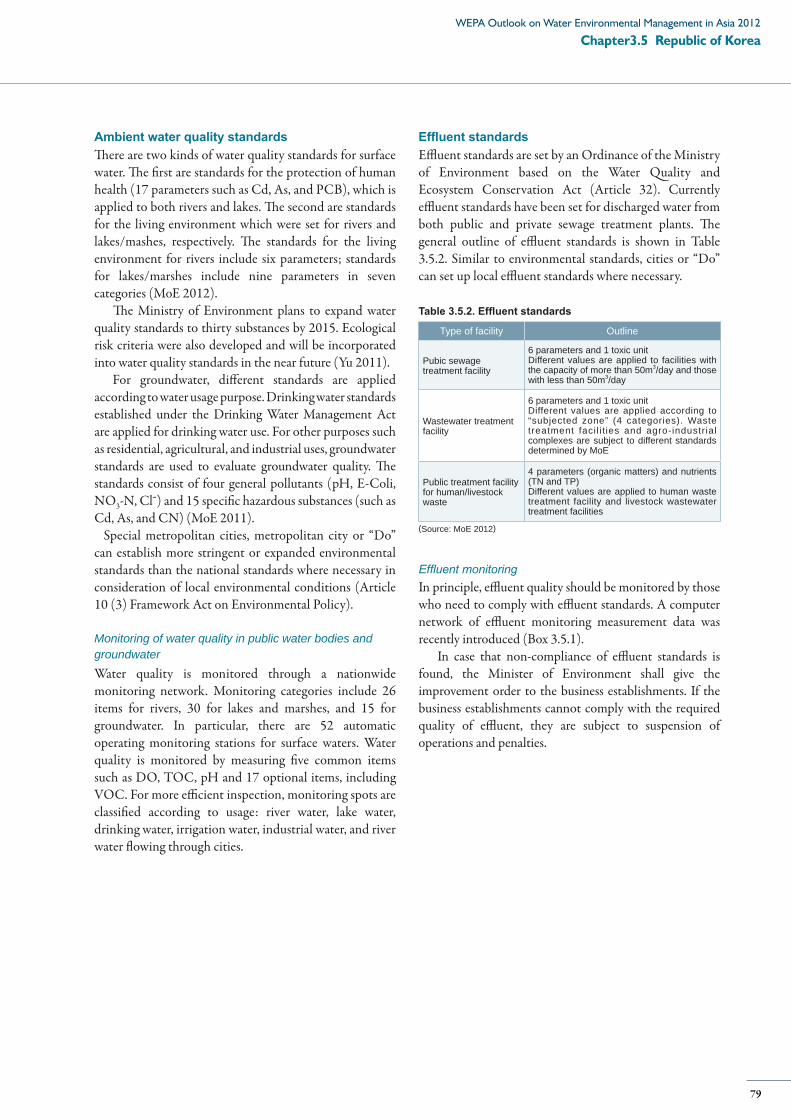
Ambient water quality standards There are two kinds of water quality standards for surface water. The first are standards for the protection of human health (17 parameters such as Cd, As, and PCB), which is applied to both rivers and lakes. The second are standards for the living environment which were set for rivers and lakes/mashes, respectively. The standards for the living environment for rivers include six parameters; standards for lakes/marshes include nine parameters in seven categories (MoE 2012).
The Ministry of Environment plans to expand water quality standards to thirty substances by 2015. Ecological risk criteria were also developed and will be incorporated into water quality standards in the near future (Yu 2011). For groundwater, different standards are applied according to water usage purpose. Drinking water standards established under the Drinking Water Management Act are applied for drinking water use. For other purposes such as residential, agricultural, and industrial uses, groundwater standards are used to evaluate groundwater quality. The standards consist of four general pollutants (pH, E-Coli, NO3-N, Cl-) and 15 specific hazardous substances (such as Cd, As, and CN) (MoE 2011). Special metropolitan cities, metropolitan city or “Do” can establish more stringent or expanded environmental standards than the national standards where necessary in consideration of local environmental conditions (Article 10 (3) Framework Act on Environmental Policy).
Monitoring of water quality in public water bodies and groundwater Water quality is monitored through a nationwide monitoring network. Monitoring categories include 26 items for rivers, 30 for lakes and marshes, and 15 for groundwater. In particular, there are 52 automatic operating monitoring stations for surface waters. Water quality is monitored by measuring five common items such as DO, TOC, pH and 17 optional items, including VOC. For more efficient inspection, monitoring spots are classified according to usage: river water, lake water, drinking water, irrigation water, industrial water, and river water flowing through cities.
Effluent standardsEffluent standards are set by an Ordinance of the Ministry of Environment based on the Water Quality and Ecosystem Conservation Act (Article 32). Currently effluent standards have been set for discharged water from both public and private sewage treatment plants. The general outline of effluent standards is shown in Table 3.5.2. Similar to environmental standards, cities or “Do” can set up local effluent standards where necessary.
(Source: MoE 2012)
Type of facility Outline
Pubic sewage treatment facility
6 parameters and 1 toxic unitDifferent values are applied to facilities with the capacity of more than 50m3/day and those with less than 50m3/day
Wastewater treatment facility
6 parameters and 1 toxic unitDifferent values are applied according to “subjected zone” (4 categories). Waste treatment faci l i t ies and agro-industrial complexes are subject to different standards determined by MoE
Public treatment facility for human/livestock waste
4 parameters (organic matters) and nutrients (TN and TP)Different values are applied to human waste treatment facility and livestock wastewater treatment facilities
Table 3.5.2. Effluent standards
Effluent monitoringIn principle, effluent quality should be monitored by those who need to comply with effluent standards. A computer network of effluent monitoring measurement data was recently introduced (Box 3.5.1).
In case that non-compliance of effluent standards is found, the Minister of Environment shall give the improvement order to the business establishments. If the business establishments cannot comply with the required quality of effluent, they are subject to suspension of operations and penalties.
79
Chapter3.5 Republic of KoreaWEPA Outlook on Water Environmental Management in Asia 2012
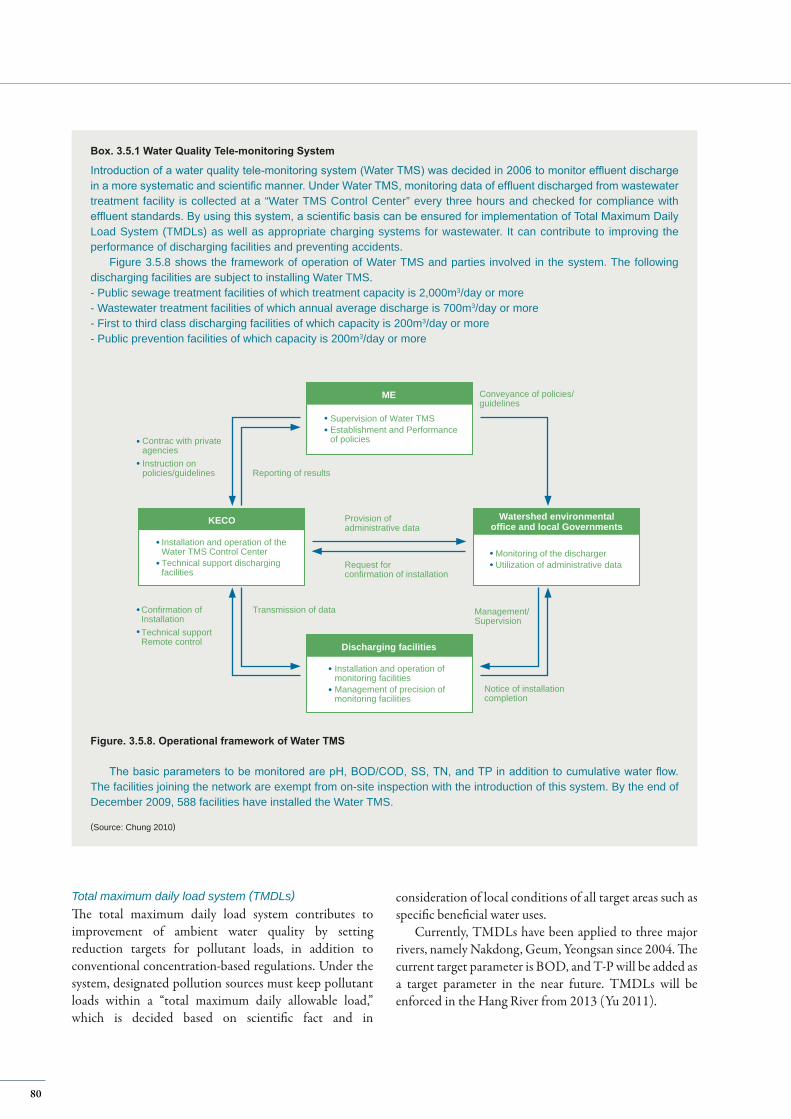
Box. 3.5.1 Water Quality Tele-monitoring System
Figure. 3.5.8. Operational framework of Water TMS
Introduction of a water quality tele-monitoring system (Water TMS) was decided in 2006 to monitor effluent discharge in a more systematic and scientific manner. Under Water TMS, monitoring data of effluent discharged from wastewater treatment facility is collected at a “Water TMS Control Center” every three hours and checked for compliance with effluent standards. By using this system, a scientific basis can be ensured for implementation of Total Maximum Daily Load System (TMDLs) as well as appropriate charging systems for wastewater. It can contribute to improving the performance of discharging facilities and preventing accidents.
Figure 3.5.8 shows the framework of operation of Water TMS and parties involved in the system. The following discharging facilities are subject to installing Water TMS. - Public sewage treatment facilities of which treatment capacity is 2,000m3/day or more- Wastewater treatment facilities of which annual average discharge is 700m3/day or more- First to third class discharging facilities of which capacity is 200m3/day or more- Public prevention facilities of which capacity is 200m3/day or more
The basic parameters to be monitored are pH, BOD/COD, SS, TN, and TP in addition to cumulative water flow. The facilities joining the network are exempt from on-site inspection with the introduction of this system. By the end of December 2009, 588 facilities have installed the Water TMS.
(Source: Chung 2010)
Total maximum daily load system (TMDLs)The total maximum daily load system contributes to improvement of ambient water quality by setting reduction targets for pollutant loads, in addition to conventional concentration-based regulations. Under the system, designated pollution sources must keep pollutant loads within a “total maximum daily allowable load,” which is decided based on scientific fact and in
consideration of local conditions of all target areas such as specific beneficial water uses.
Currently, TMDLs have been applied to three major rivers, namely Nakdong, Geum, Yeongsan since 2004. The current target parameter is BOD, and T-P will be added as a target parameter in the near future. TMDLs will be enforced in the Hang River from 2013 (Yu 2011).
Conveyance of policies/guidelines
Reporting of results
Provision ofadministrative data
Request for confirmation of installation
Transmission of data Management/Supervision
Notice of installationcompletion
ME
KECO Watershed environmentaloffice and local Governments
Discharging facilities
Supervision of Water TMSEstablishment and Performanceof policies
Installation and operation of theWater TMS Control CenterTechnical support dischargingfacilities
Installation and operation ofmonitoring facilitiesManagement of precision ofmonitoring facilities
Monitoring of the dischargerUtilization of administrative data
Contrac with privateagenciesInstruction onpolicies/guidelines
Confirmation ofInstallationTechnical supportRemote control
80
6. Existing and Future Challenges
According to the Environmental Review 2011published by the Ministry of Environment, Korea, the following items have been tagged as challenges to improving water environmental management:
To ensure implementation of water quality improvement projects which are conducted under the Four Major Rivers Restoration Project. Reduction of pollution load, especially that of nitrogen and phosphorous and maintenance of water environment which reservoirs originally have.
Measures for non-point source pollutionIt is projected that the contribution ratio to water pollution from non-point sources will exceed that of point sources and reach 68-75% by 2020 (MoE 2012). To cope with non-point sources, the Comprehensive Measures for Non-point Source Pollution Management in the Four Major Rivers were established in 2004 under the leadership of the Prime Minister’s Office and in cooperation with related ministries. The Comprehensive Measures contain three major policy fields: policy system improvements, pilot projects on the construction and management of non-point source pollution treatment facilities, and
Box. 3.5.2 Recent Development in Water Environmental Management
In addition to the developments mentioned in this section, recent developments in water environmental management in Korea include:
Investment for restoration of the “well-being of the freshwater ecosystem” and water quality, which includes the construction of wastewater treatment plants, installment of T-P treatment facilities, and creation of natural fish ways. Increase of water flow mainly by dredging has been promoted to ensure environmental flow, which contributes to water quality improvement. Establishment of the Water Pollution Response Center, which intends to strengthen the prevention and response to water pollution accidents. A 24-hour surveillance system is operated through the water quality automatic monitoring network. Plan for the Restoration of Ecological Waterways was established in 2010 to restore ecological health of water ways. Consideration of eco-toxicity emission management system to address harmful substances in industrial wastewater. Introduction of water quality prediction system for algal bloom.
(Source: MoE 2012)
research and public relations. Under the measure, highly vulnerable areas against non-point sources are designated as non-point source control districts, which includes Soyang Lake, Doam Lake, Imha Lake, and Gwangju metropolitan city (Yu 2011).
The first phase (2004-2005) focused on policy system improvement and pilot projects; the second phase (2006-2011) focused on best-fit management projects for major river basins of the four major rivers. As of March 2011, 43 non-point source reduction facilities have been installed on a pilot basis for different land use types including urban areas, farmland, and parking lots (Yu 2011).
To strengthen non-point sources of which loads will increase. To develop an enhanced water environmental management system, responding to socio-economic changes such as the ongoing march of the aging society, enhancement of urbanization and increases in income levels. The co-existence of water and human beings is a key goal of the enhanced management system.
81
Chapter3.5 Republic of KoreaWEPA Outlook on Water Environmental Management in Asia 2012
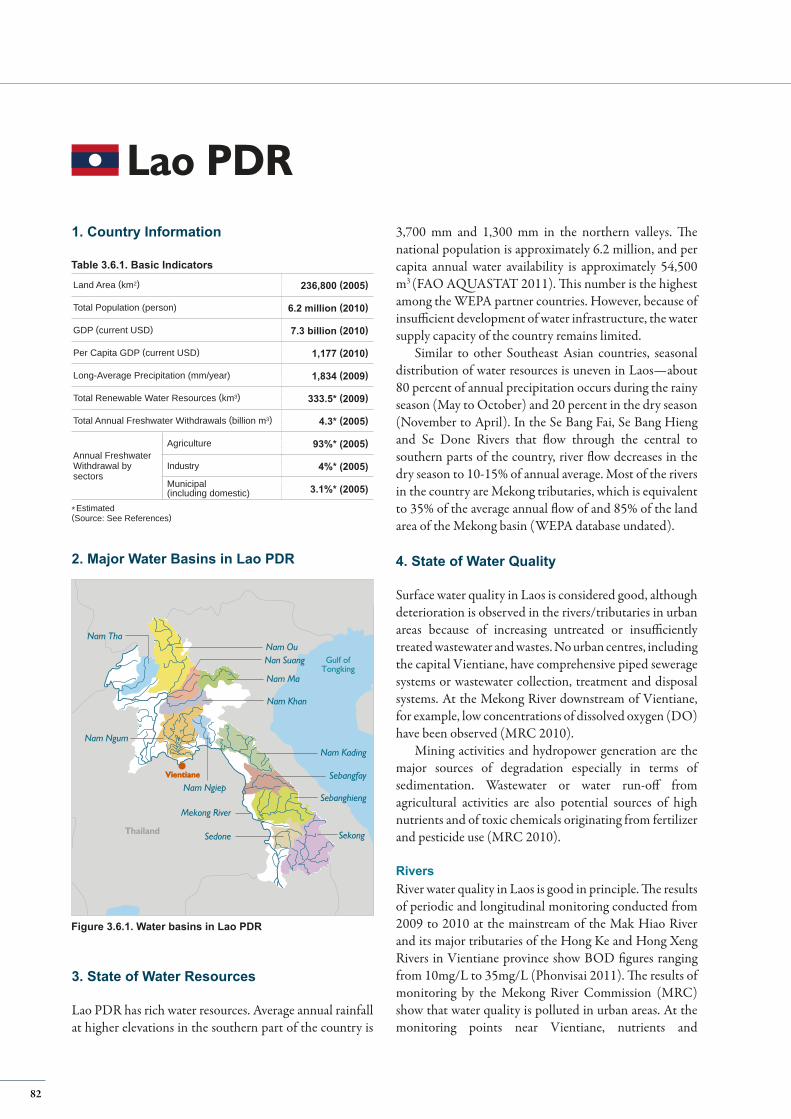
Thailand
Mekong River
Nan Suang
Nam Ngiep
Sedone Sekong
VientianeVientiane
Sebanghieng
Sebangfay
Nam Kading
Nam Ma
Nam OuNam Tha
Nam Khan
Nam Ngum
Gulf ofTongking
Land Area (km2) 236,800 (2005)
Total Population (person) 6.2 million (2010)
GDP (current USD) 7.3 billion (2010)
Per Capita GDP (current USD) 1,177 (2010)
Long-Average Precipitation (mm/year) 1,834 (2009)
Total Renewable Water Resources (km3) 333.5* (2009)
Total Annual Freshwater Withdrawals (billion m3) 4.3* (2005)
Annual FreshwaterWithdrawal bysectors
Agriculture 93%* (2005)
Industry 4%* (2005)Municipal(including domestic) 3.1%* (2005)
1. Country Information
2. Major Water Basins in Lao PDR
* Estimated(Source: See References)
Figure 3.6.1. Water basins in Lao PDR
Table 3.6.1. Basic Indicators
Lao PDR
3. State of Water Resources
Lao PDR has rich water resources. Average annual rainfall at higher elevations in the southern part of the country is
3,700 mm and 1,300 mm in the northern valleys. The national population is approximately 6.2 million, and per capita annual water availability is approximately 54,500 m3 (FAO AQUASTAT 2011). This number is the highest among the WEPA partner countries. However, because of insufficient development of water infrastructure, the water supply capacity of the country remains limited.
Similar to other Southeast Asian countries, seasonal distribution of water resources is uneven in Laos—about 80 percent of annual precipitation occurs during the rainy season (May to October) and 20 percent in the dry season (November to April). In the Se Bang Fai, Se Bang Hieng and Se Done Rivers that flow through the central to southern parts of the country, river flow decreases in the dry season to 10-15% of annual average. Most of the rivers in the country are Mekong tributaries, which is equivalent to 35% of the average annual flow of and 85% of the land area of the Mekong basin (WEPA database undated).
4. State of Water Quality
Surface water quality in Laos is considered good, although deterioration is observed in the rivers/tributaries in urban areas because of increasing untreated or insufficiently treated wastewater and wastes. No urban centres, including the capital Vientiane, have comprehensive piped sewerage systems or wastewater collection, treatment and disposal systems. At the Mekong River downstream of Vientiane, for example, low concentrations of dissolved oxygen (DO) have been observed (MRC 2010).
Mining activities and hydropower generation are the major sources of degradation especially in terms of sedimentation. Wastewater or water run-off from agricultural activities are also potential sources of high nutrients and of toxic chemicals originating from fertilizer and pesticide use (MRC 2010).
Rivers River water quality in Laos is good in principle. The results of periodic and longitudinal monitoring conducted from 2009 to 2010 at the mainstream of the Mak Hiao River and its major tributaries of the Hong Ke and Hong Xeng Rivers in Vientiane province show BOD figures ranging from 10mg/L to 35mg/L (Phonvisai 2011). The results of monitoring by the Mekong River Commission (MRC) show that water quality is polluted in urban areas. At the monitoring points near Vientiane, nutrients and
82

phosphorus levels, as well as ammonium levels, increased between 2000 and 2008 (MRC 2010). The report from MRC (2010) pointed out that pollution levels may worsen if human activities in the upstream (e.g. dam operations and irrigation projects) reduce river water flows.
Sediment is the primary quality problem in the country, especially in the wet season. Figure 3.6.2 shows seasonable changes in sedimentation observed in Luang Prabang in the north region of the country.
Lakes and reservoirs Perennial ponds, marshes and oxbow lakes are fairly common in the lowland-floodplains in Laos. These water bodies are usually shallow and vary greatly in size during the year. They are habitat for many types of aquatic plants, molluscs, crustaceans, amphibians and reptiles. Currently, data on the water environment in lakes and reservoirs is available only on project basis in Lao PDR. For example, water quality monitoring was conducted in the reservoirs of the Nam Ngum dams (Nam Ngum 2 and Nam Ngum 1) from 2006-2011 as a part of a hydropower development project. The result of monitoring at the nine stations (Figure 3.6.3) illustrates that DO levels in some stations show a decreasing trend for DO levels (standard if below 6mg/L) (Figure 3.6.4). Total phosphorus levels in some stations in 2009 also highly exceeded the national standard level of the country (0.05mg/L). Fertilizers and detergents are suspected as one of the potential sources of pollution (Figure 3.6.5).
DO (mg/L)
Jul06
Sep06
Nov06
Jan07
Mar07
May07
Jul07
Sep07
Nov07
Jan08
Mar08
May08
Jul08
Sep08
Nov08
Jan09
Mar09
May09
Jul09
Sep09
Nov09
Jan10
Mar10
May10
Jul10
Sep10
Nov10
Jan11
During Period
DO at station 1-9
0.0
5.0
10.0 Station 1
Station 2
Station 3
Station 4
Station 5
Station 6
Station 7
Station 9
Station 8
During Period
Total P (mg/L)
Total P at station 1-9
0.00
0.20
0.40
0.60
0.80
1.00
Jul06
Sep06
Nov06
Jan07
Mar07
May07
Jul07
Sep07
Nov07
Jan08
Mar08
May08
Jul08
Sep08
Nov08
Jan09
Mar09
May09
Jul09
Sep09
Nov09
Jan10
Mar10
May10
Jul10
Sep10
Nov10
Jan11
Station 1
Station 2
Station 3
Station 4
Station 5
Station 6
Station 7
Station 9
Station 8
(Source: Komany 2011)Figure 3.6.4. DO level
(Source: Komany 2011)Figure 3.6.5. TP value
B.Phone Xay KangB.Phone Xay TaiB.Koua LekNam NgunB.KomeeB.NaLuang
B.NaTou
Nam Mo
Nam Ngun
Huay Kal
Naw Ngum
Nam BakNN2 Dam Site
B.Phone Xay Neua
B.Phone Khan
B.Phone KeoNam Muay
B.Phone thong
B.Pha Yaeng TaiB.Pha Yaeng Neua
B.Lak 37B.Lak 33
Nam TongNam Koung
Huay Dokmal
Huay Pamom
B.Lak 24
B.Houay XayHhanB.Vleng Keo
Water Sampling Station
NN1 dAM sITE
ST-1ST-2
ST-3
ST-4
ST-5
ST-6
ST-7
ST-8
ST-9
(Source: Komany 2011)Figure 3.6.3. Monitoring stations
2500 16000
14000
12000
10000
8000
6000
4000
2000
0
2000
1500
1000
500
0Jan Feb mar Apr May Jun Jul Aug Sep Oct Nov Dec
Sus
pend
ed s
edim
ent c
once
ntra
tion
(mg/
L)
Dis
char
ge (m
3 s1 )
(Source: MRC 2010)
Figure 3.6.2. Seasonal variation in water and sediment discharge of Mekong at Luang Prabang, Lao PDR
83
Chapter3.6 Lao PDRWEPA Outlook on Water Environmental Management in Asia 2012
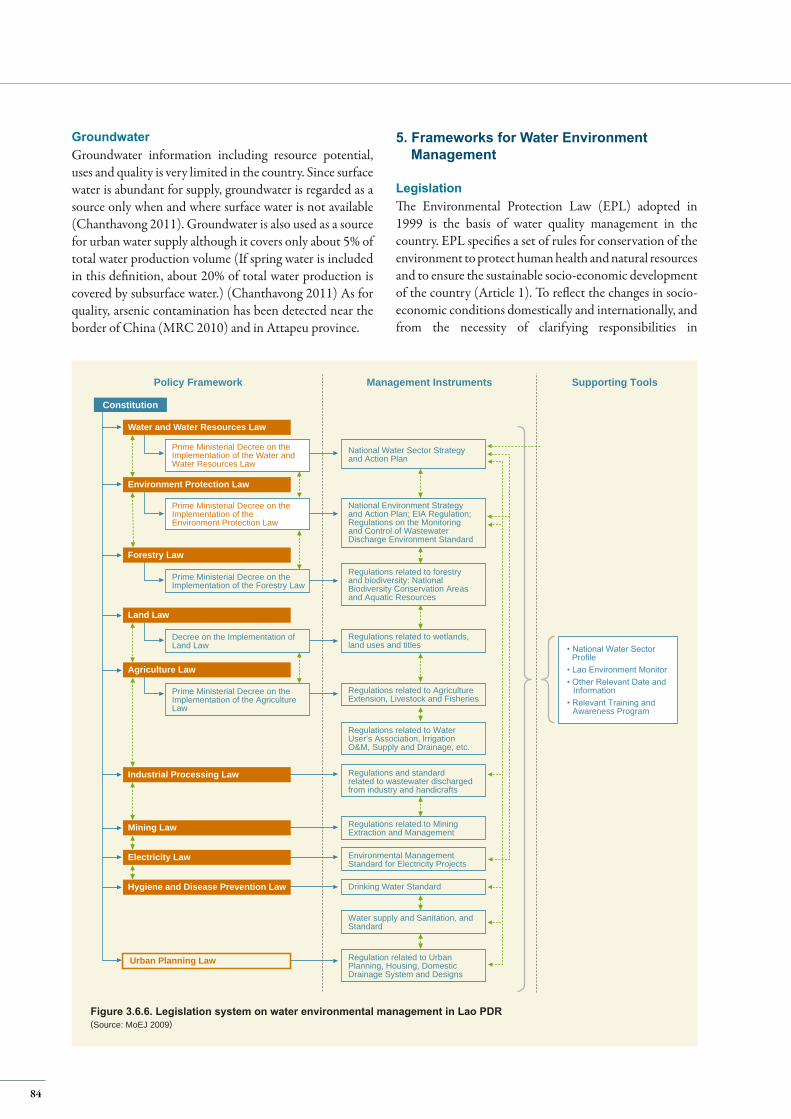
Groundwater Groundwater information including resource potential, uses and quality is very limited in the country. Since surface water is abundant for supply, groundwater is regarded as a source only when and where surface water is not available (Chanthavong 2011). Groundwater is also used as a source for urban water supply although it covers only about 5% of total water production volume (If spring water is included in this definition, about 20% of total water production is covered by subsurface water.) (Chanthavong 2011) As for quality, arsenic contamination has been detected near the border of China (MRC 2010) and in Attapeu province.
5. Frameworks for Water Environment Management
LegislationThe Environmental Protection Law (EPL) adopted in 1999 is the basis of water quality management in the country. EPL specifies a set of rules for conservation of the environment to protect human health and natural resources and to ensure the sustainable socio-economic development of the country (Article 1). To reflect the changes in socio-economic conditions domestically and internationally, and from the necessity of clarifying responsibilities in
Constitution
Water and Water Resources Law
Environment Protection Law
Forestry Law
Land Law
Agriculture Law
Industrial Processing Law
Mining Law
Electricity Law
Hygiene and Disease Prevention Law
Urban Planning Law
National Water Sector Strategyand Action Plan
National Environment Strategyand Action Plan; EIA Regulation;Regulations on the Monitoringand Control of WastewaterDischarge Environment Standard
Regulations related to forestryand biodiversity: NationalBiodiversity Conservation Areasand Aquatic Resources
Regulations and standardrelated to wastewater dischargedfrom industry and handicrafts
Regulation related to UrbanPlanning, Housing, DomesticDrainage System and Designs
Regulations related to AgricultureExtension, Livestock and Fisheries
Regulations related to WaterUser’s Association, lrrigationO&M, Supply and Drainage, etc.
Regulations related to MiningExtraction and Management
Environmental ManagementStandard for Electricity Projects
Water supply and Sanitation, andStandard
Drinking Water Standard
Regulations related to wetlands,land uses and titles
Decree on the Implementation ofLand Law
Prime Ministerial Decree on theImplementation of the Forestry Law
Prime Ministerial Decree on theImplementation of the AgricultureLaw
• National Water Sector Profile• Lao Environment Monitor• Other Relevant Date and Information• Relevant Training and Awareness Program
Prime Ministerial Decree on theImplementation of the Water andWater Resources Law
Prime Ministerial Decree on theImplementation of theEnvironment Protection Law
Supporting ToolsManagement InstrumentsPolicy Framework
(Source: MoEJ 2009)Figure 3.6.6. Legislation system on water environmental management in Lao PDR
84
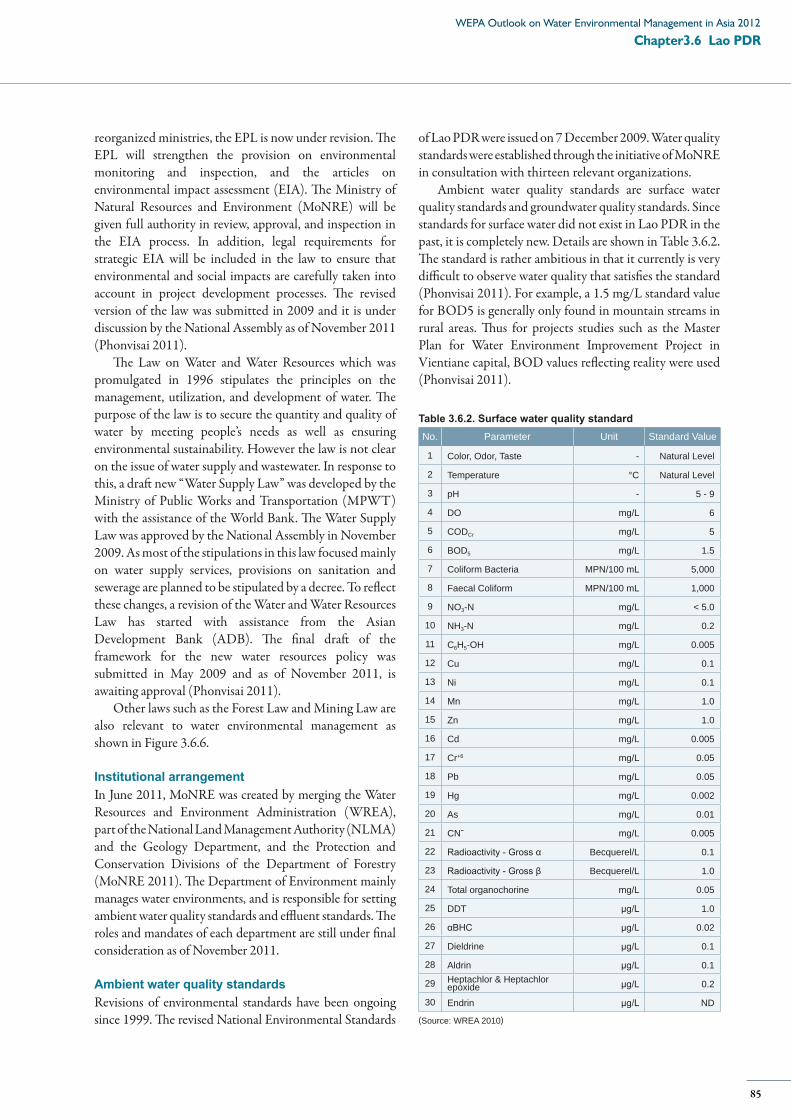
reorganized ministries, the EPL is now under revision. The EPL will strengthen the provision on environmental monitoring and inspection, and the articles on environmental impact assessment (EIA). The Ministry of Natural Resources and Environment (MoNRE) will be given full authority in review, approval, and inspection in the EIA process. In addition, legal requirements for strategic EIA will be included in the law to ensure that environmental and social impacts are carefully taken into account in project development processes. The revised version of the law was submitted in 2009 and it is under discussion by the National Assembly as of November 2011 (Phonvisai 2011).
The Law on Water and Water Resources which was promulgated in 1996 stipulates the principles on the management, utilization, and development of water. The purpose of the law is to secure the quantity and quality of water by meeting people’s needs as well as ensuring environmental sustainability. However the law is not clear on the issue of water supply and wastewater. In response to this, a draft new “Water Supply Law” was developed by the Ministry of Public Works and Transportation (MPWT) with the assistance of the World Bank. The Water Supply Law was approved by the National Assembly in November 2009. As most of the stipulations in this law focused mainly on water supply services, provisions on sanitation and sewerage are planned to be stipulated by a decree. To reflect these changes, a revision of the Water and Water Resources Law has started with assistance from the Asian Development Bank (ADB). The final draft of the framework for the new water resources policy was submitted in May 2009 and as of November 2011, is awaiting approval (Phonvisai 2011).
Other laws such as the Forest Law and Mining Law are also relevant to water environmental management as shown in Figure 3.6.6.
Institutional arrangementIn June 2011, MoNRE was created by merging the Water Resources and Environment Administration (WREA), part of the National Land Management Authority (NLMA) and the Geology Department, and the Protection and Conservation Divisions of the Department of Forestry (MoNRE 2011). The Department of Environment mainly manages water environments, and is responsible for setting ambient water quality standards and effluent standards. The roles and mandates of each department are still under final consideration as of November 2011.
Ambient water quality standards Revisions of environmental standards have been ongoing since 1999. The revised National Environmental Standards (Source: WREA 2010)
No. Parameter Unit Standard Value
1 Color, Odor, Taste - Natural Level
2 Temperature °C Natural Level
3 pH - 5 - 9
4 DO mg/L 6
5 CODCr mg/L 5
6 BOD5 mg/L 1.5
7 Coliform Bacteria MPN/100 mL 5,000
8 Faecal Coliform MPN/100 mL 1,000
9 NO3-N mg/L < 5.0
10 NH3-N mg/L 0.2
11 C6H5-OH mg/L 0.005
12 Cu mg/L 0.1
13 Ni mg/L 0.1
14 Mn mg/L 1.0
15 Zn mg/L 1.0
16 Cd mg/L 0.005
17 Cr+6 mg/L 0.05
18 Pb mg/L 0.05
19 Hg mg/L 0.002
20 As mg/L 0.01
21 CN- mg/L 0.005
22 Radioactivity - Gross α Becquerel/L 0.1
23 Radioactivity - Gross β Becquerel/L 1.0
24 Total organochorine mg/L 0.05
25 DDT μg/L 1.0
26 αBHC μg/L 0.02
27 Dieldrine μg/L 0.1
28 Aldrin μg/L 0.1
29 Heptachlor & Heptachlor epoxide μg/L 0.2
30 Endrin μg/L ND
Table 3.6.2. Surface water quality standard
of Lao PDR were issued on 7 December 2009. Water quality standards were established through the initiative of MoNRE in consultation with thirteen relevant organizations.
Ambient water quality standards are surface water quality standards and groundwater quality standards. Since standards for surface water did not exist in Lao PDR in the past, it is completely new. Details are shown in Table 3.6.2. The standard is rather ambitious in that it currently is very difficult to observe water quality that satisfies the standard (Phonvisai 2011). For example, a 1.5 mg/L standard value for BOD5 is generally only found in mountain streams in rural areas. Thus for projects studies such as the Master Plan for Water Environment Improvement Project in Vientiane capital, BOD values reflecting reality were used (Phonvisai 2011).
85
Chapter3.6 Lao PDRWEPA Outlook on Water Environmental Management in Asia 2012
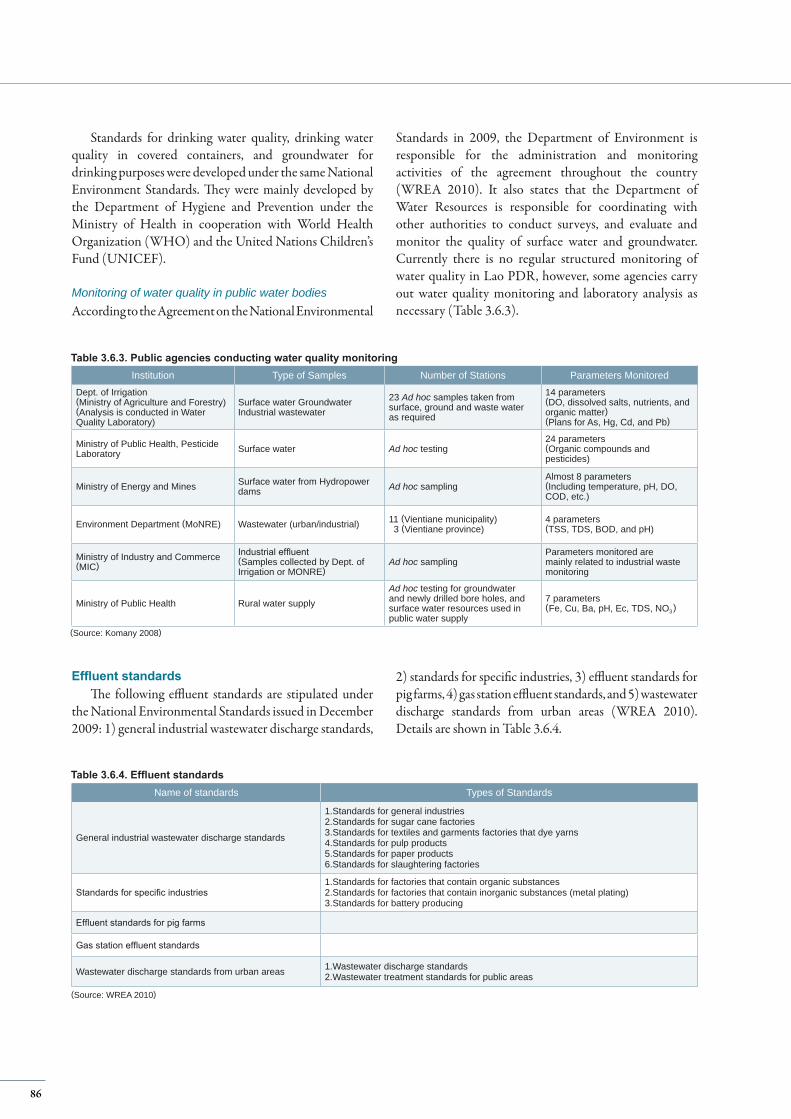
Institution Type of Samples Number of Stations Parameters Monitored
Dept. of Irrigation (Ministry of Agriculture and Forestry)(Analysis is conducted in Water Quality Laboratory)
Surface water Groundwater Industrial wastewater
23 Ad hoc samples taken from surface, ground and waste water as required
14 parameters (DO, dissolved salts, nutrients, and organic matter)(Plans for As, Hg, Cd, and Pb)
Ministry of Public Health, Pesticide Laboratory Surface water Ad hoc testing
24 parameters (Organic compounds and pesticides)
Ministry of Energy and Mines Surface water from Hydropower dams Ad hoc sampling
Almost 8 parameters(Including temperature, pH, DO, COD, etc.)
Environment Department (MoNRE) Wastewater (urban/industrial) 11 (Vientiane municipality) 3 (Vientiane province)
4 parameters(TSS, TDS, BOD, and pH)
Ministry of Industry and Commerce (MIC)
Industrial effluent (Samples collected by Dept. of Irrigation or MONRE)
Ad hoc sampling Parameters monitored are mainly related to industrial waste monitoring
Ministry of Public Health Rural water supply Ad hoc testing for groundwater and newly drilled bore holes, and surface water resources used in public water supply
7 parameters (Fe, Cu, Ba, pH, Ec, TDS, NO3)
Name of standards Types of Standards
General industrial wastewater discharge standards
1.Standards for general industries2.Standards for sugar cane factories3.Standards for textiles and garments factories that dye yarns4.Standards for pulp products5.Standards for paper products6.Standards for slaughtering factories
Standards for specific industries1.Standards for factories that contain organic substances2.Standards for factories that contain inorganic substances (metal plating)3.Standards for battery producing
Effluent standards for pig farms
Gas station effluent standards
Wastewater discharge standards from urban areas 1.Wastewater discharge standards2.Wastewater treatment standards for public areas
(Source: Komany 2008)
(Source: WREA 2010)
Effluent standardsThe following effluent standards are stipulated under
the National Environmental Standards issued in December 2009: 1) general industrial wastewater discharge standards,
2) standards for specific industries, 3) effluent standards for pig farms, 4) gas station effluent standards, and 5) wastewater discharge standards from urban areas (WREA 2010). Details are shown in Table 3.6.4.
Standards for drinking water quality, drinking water quality in covered containers, and groundwater for drinking purposes were developed under the same National Environment Standards. They were mainly developed by the Department of Hygiene and Prevention under the Ministry of Health in cooperation with World Health Organization (WHO) and the United Nations Children’s Fund (UNICEF).
Monitoring of water quality in public water bodies According to the Agreement on the National Environmental
Standards in 2009, the Department of Environment is responsible for the administration and monitoring activities of the agreement throughout the country (WREA 2010). It also states that the Department of Water Resources is responsible for coordinating with other authorities to conduct surveys, and evaluate and monitor the quality of surface water and groundwater. Currently there is no regular structured monitoring of water quality in Lao PDR, however, some agencies carry out water quality monitoring and laboratory analysis as necessary (Table 3.6.3).
Table 3.6.3. Public agencies conducting water quality monitoring
Table 3.6.4. Effluent standards
86
For wastewater discharge standards from urban areas, buildings such as hotels, dormitories or hospitals are classified according to the number of rooms and volume of discharged wastewater. Buildings such as residences, temples, schools, offices, markets and restaurants are also classified according to floor area. For the wastewater treatment standards for public areas, classifications are in place for areas such as historical sites, public parks, water parks, and marshes and ponds.
The Agreement on the National Environmental Standards in 2009 states that those who violate the provision of the agreement will be warned, fined or subject to criminal punishment (WREA 2010). Also under the Regulation on Wastewater Discharge from Industrial Processing Factories issued in 2005 by the Ministry of Industry and Handicrafts (currently the Ministry of Industry and Commerce), all industrial factories are required to obtain approval and major factories also need to submit treatment and management plans. They also are required to install wastewater treatment systems and the necessary facilities to monitor and analyze water samples, as well as frequently monitor and analyze wastewater and report results to the Director of the Industry Department of the Ministry or respective province. The staff of the Industry Department as factory environmental inspectors are permitted to enter all areas within factories to inspect, observe, measure, sample and monitor wastewater discharged into public water bodies. If violations are found, certifications for wastewater discharge will be suspended and the Director of the Industry Department may suspend or terminate wastewater discharge until improvement and compliance is confirmed. The penalty for violation of the regulations is set out as follows: (1) first stage: warning, suspension of import/export, suspension of production, (2) second stage: fine of 5-10 times the amount of certification fee, and (3) third stage: fine of 10-15 times the amount of certification fee and penalties for other relevant regulations (Phonvisai 2011).
6. Existing and Future Challenges
Although water quality is, in general, in good condition in the country, it has deteriorated in major urban areas. No urban centres, including the capital Vientiane, have comprehensive piped sewerage systems or wastewater collection, treatment and disposal systems. The water quality of urban rivers may further deteriorate in the near future because of the inflow of untreated wastewater of which volume will increase according to urban growth.
The government of Laos has been developing and revising environmental management frameworks such as through the revision of relevant laws. However, there are challenges in their implementation. For example, various ministries and departments carry out water quality management such as monitoring and analysis independently and do not share results. Also, there are overlaps in the laws. For example, there is duplication among the Regulation on the Wastewater Discharged from Industrial Processing Factories, EPL, EIA regulations and Decree on EIA for the Industrial Sector in requiring environmental compliance certificates, and submission/approval of environmental management plans for factories that discharge wastewater. It has been reported that the wastewater discharge certification system is currently not in operation and inspection is conducted according to each regulation (Phonvisai 2011). Capacity and systematic coordination procedures among responsible agencies for overall water quality monitoring and management need to be established. Recent organizational restructuring of MoNRE is expected to promote and strengthen water environmental management in Lao PDR.
87
Chapter3.6 Lao PDRWEPA Outlook on Water Environmental Management in Asia 2012
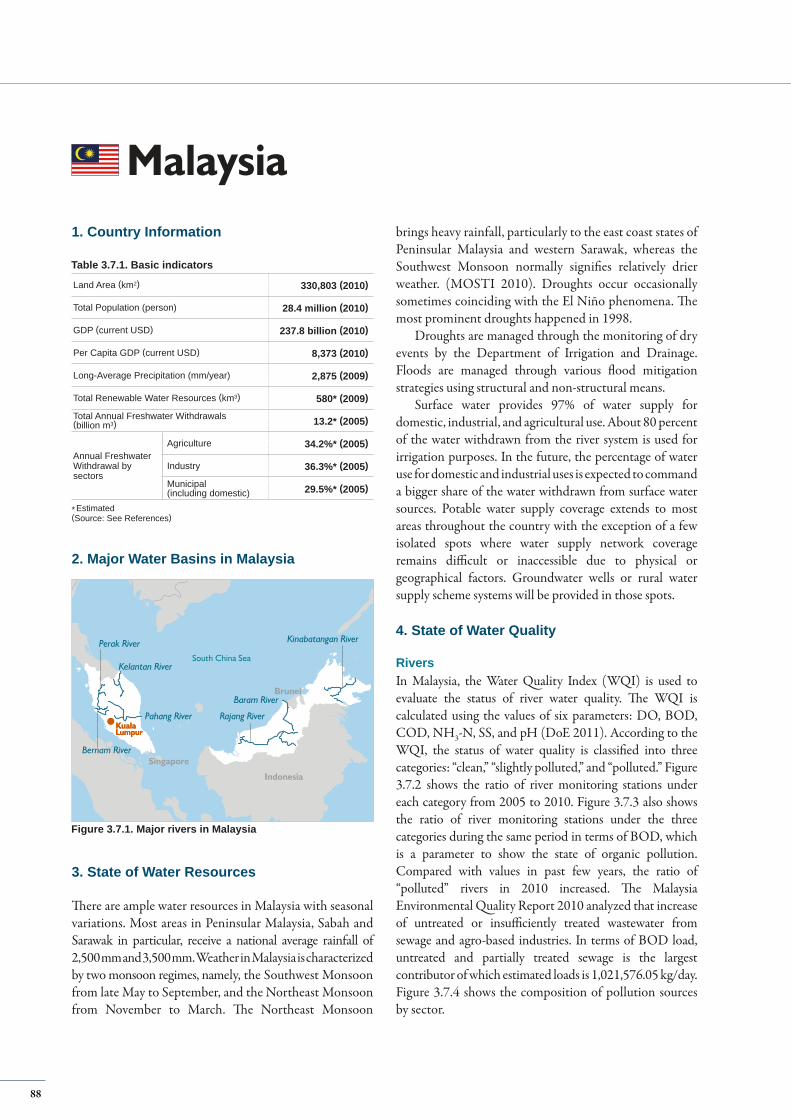
Land Area (km2) 330,803 (2010)
Total Population (person) 28.4 million (2010)
GDP (current USD) 237.8 billion (2010)
Per Capita GDP (current USD) 8,373 (2010)
Long-Average Precipitation (mm/year) 2,875 (2009)
Total Renewable Water Resources (km3) 580* (2009)
Total Annual Freshwater Withdrawals(billion m3) 13.2* (2005)
Annual FreshwaterWithdrawal bysectors
Agriculture 34.2%* (2005)
Industry 36.3%* (2005)
Municipal(including domestic) 29.5%* (2005)
1. Country Information
* Estimated(Source: See References)
Table 3.7.1. Basic indicators
brings heavy rainfall, particularly to the east coast states of Peninsular Malaysia and western Sarawak, whereas the Southwest Monsoon normally signifies relatively drier weather. (MOSTI 2010). Droughts occur occasionally sometimes coinciding with the El Niño phenomena. The most prominent droughts happened in 1998.
Droughts are managed through the monitoring of dry events by the Department of Irrigation and Drainage. Floods are managed through various flood mitigation strategies using structural and non-structural means.
Surface water provides 97% of water supply for domestic, industrial, and agricultural use. About 80 percent of the water withdrawn from the river system is used for irrigation purposes. In the future, the percentage of water use for domestic and industrial uses is expected to command a bigger share of the water withdrawn from surface water sources. Potable water supply coverage extends to most areas throughout the country with the exception of a few isolated spots where water supply network coverage remains difficult or inaccessible due to physical or geographical factors. Groundwater wells or rural water supply scheme systems will be provided in those spots.
4. State of Water Quality
RiversIn Malaysia, the Water Quality Index (WQI) is used to evaluate the status of river water quality. The WQI is calculated using the values of six parameters: DO, BOD, COD, NH3-N, SS, and pH (DoE 2011). According to the WQI, the status of water quality is classified into three categories: “clean,” “slightly polluted,” and “polluted.” Figure 3.7.2 shows the ratio of river monitoring stations under each category from 2005 to 2010. Figure 3.7.3 also shows the ratio of river monitoring stations under the three categories during the same period in terms of BOD, which is a parameter to show the state of organic pollution. Compared with values in past few years, the ratio of “polluted” rivers in 2010 increased. The Malaysia Environmental Quality Report 2010 analyzed that increase of untreated or insufficiently treated wastewater from sewage and agro-based industries. In terms of BOD load, untreated and partially treated sewage is the largest contributor of which estimated loads is 1,021,576.05 kg/day. Figure 3.7.4 shows the composition of pollution sources by sector.
Malaysia
Indonesia
South China SeaKelantan River
Pahang River
Kinabatangan River
Rajang River
Baram River
Perak River
Bernam River
KualaLumpurKualaLumpur
Brunei
Singapore
2. Major Water Basins in Malaysia
Figure 3.7.1. Major rivers in Malaysia
3. State of Water Resources
There are ample water resources in Malaysia with seasonal variations. Most areas in Peninsular Malaysia, Sabah and Sarawak in particular, receive a national average rainfall of 2,500 mm and 3,500 mm. Weather in Malaysia is characterized by two monsoon regimes, namely, the Southwest Monsoon from late May to September, and the Northeast Monsoon from November to March. The Northeast Monsoon
88
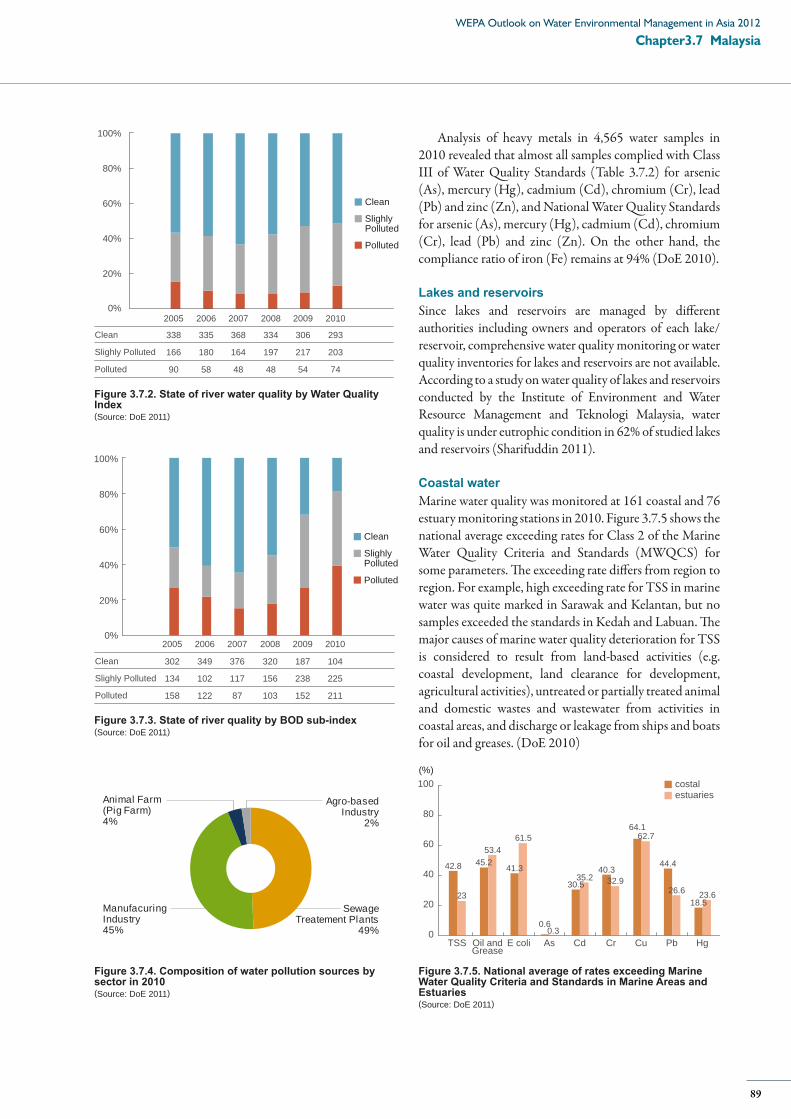
Analysis of heavy metals in 4,565 water samples in 2010 revealed that almost all samples complied with Class III of Water Quality Standards (Table 3.7.2) for arsenic (As), mercury (Hg), cadmium (Cd), chromium (Cr), lead (Pb) and zinc (Zn), and National Water Quality Standards for arsenic (As), mercury (Hg), cadmium (Cd), chromium (Cr), lead (Pb) and zinc (Zn). On the other hand, the compliance ratio of iron (Fe) remains at 94% (DoE 2010).
Lakes and reservoirsSince lakes and reservoirs are managed by different authorities including owners and operators of each lake/reservoir, comprehensive water quality monitoring or water quality inventories for lakes and reservoirs are not available. According to a study on water quality of lakes and reservoirs conducted by the Institute of Environment and Water Resource Management and Teknologi Malaysia, water quality is under eutrophic condition in 62% of studied lakes and reservoirs (Sharifuddin 2011).
Coastal waterMarine water quality was monitored at 161 coastal and 76 estuary monitoring stations in 2010. Figure 3.7.5 shows the national average exceeding rates for Class 2 of the Marine Water Quality Criteria and Standards (MWQCS) for some parameters. The exceeding rate differs from region to region. For example, high exceeding rate for TSS in marine water was quite marked in Sarawak and Kelantan, but no samples exceeded the standards in Kedah and Labuan. The major causes of marine water quality deterioration for TSS is considered to result from land-based activities (e.g. coastal development, land clearance for development, agricultural activities), untreated or partially treated animal and domestic wastes and wastewater from activities in coastal areas, and discharge or leakage from ships and boats for oil and greases. (DoE 2010)
2005 2006 2007 2008 2009 2010
Clean 338 335 368 334 306 293
Slighly Polluted 166 180 164 197 217 203
Polluted 90 58 48 48 54 74
0%
20%
40%
60%
80%
100%
Clean
SlighlyPolluted
Polluted
Figure 3.7.2. State of river water quality by Water Quality Index (Source: DoE 2011)
2005 2006 2007 2008 2009 2010
Clean 302 349 376 320 187 104
Slighly Polluted 134 102 117 156 238 225
Polluted 158 122 87 103 152 211
0%
20%
40%
60%
80%
100%
Clean
SlighlyPolluted
Polluted
Figure 3.7.3. State of river quality by BOD sub-index (Source: DoE 2011)
Agro-basedIndustry
2%
SewageTreatement Plants
49%
ManufacuringIndustry45%
Animal Farm(Pig Farm)4%
Figure 3.7.4. Composition of water pollution sources by sector in 2010 (Source: DoE 2011)
42.8 45.241.3
0.6
30.5
40.3
64.1
44.4
18.523
53.461.5
0.3
35.2 32.9
62.7
26.6 23.6
0
20
40
60
80
100
TSS Oil andGrease
E coli As Cd Cr Cu Pb Hg
costalestuaries
(%)
Figure 3.7.5. National average of rates exceeding Marine Water Quality Criteria and Standards in Marine Areas and Estuaries(Source: DoE 2011)
89
Chapter3.7 MalaysiaWEPA Outlook on Water Environmental Management in Asia 2012
GroundwaterGroundwater quality status was evaluated using the National Guidelines for Raw Drinking Water Quality from the Ministry of Health (revised in December 2000) as a benchmark.
In 2010, 201 water samples were taken from 112 monitored wells situated in eight different land use areas, namely industrial, landfills, agriculture, municipal water supply, urban/sub-urban, golf courses, rural areas and ex-mining (gold mining). The results show that values exceeding guidelines for As, Fe, Mn, Total coliform, and phenol were observed in all land use areas. The non-compliance ratio of total coliform was 100% in all land use categories. Other parameters of which exceeding rates are found in all categories include phenol, arsenic, iron, and manganese. On the other hand, for chromium, copper, and zinc, all samples satisfy guideline values.
5. Frameworks for Water Environment Management
The ultimate objective of Malaysia’s environmental management (including water quality management) is improvement of living standards and the sustainability of its citizens’ quality of life. The National Policy on the Environment approved in 2002 stated “the nation shall implement environmentally sound and sustainable development for the continuous economic, social and cultural progress and enhancement of the quality of life of Malaysia” (Ministry of Science, Technology and the Environment, Malaysia 2002). In line with the policy, the national policy set eight principles to integrate the economy and environment as follows:
Stewardship of the EnvironmentConservation of the Nature’s Vitality and DiversityContinuous Improvement in the Quality of the EnvironmentSustainable Use of Natural ResourceIntegrated Decision-makingRole of the Private SectorCommitment and AccountabilityActive Participation in the International Community
The Environmental Quality Act (EQA) 1974 is an act related to the prevention, abatement and control of pollution, and enhancement of the environment. The act ordains that the Minister, after consultation with the Environmental Quality Council, may elaborate regulations for prescribing ambient water quality and discharge standards, and specifying the maximum permissible loads that may be discharged by any source into inland waters, with reference either generally or specifically to the body of waters concerned. Other laws and regulations are also shown in Figure 3.7.6.
As for the nation’s target for water quality improvement, the 10th Malaysian Plan (2011-2015) includes efforts to tackle river water pollution, which is the country’s main water source, by addressing major pollution sources. Pollution countermeasures mentioned in the plan include the following points (Sharifuddin 2011; Economic Planning Unit of Prime Minister’s Department 2010):
- To strengthen the enforcement of effluent standards (sewage and industries) in line with Environmental Quality (Sewage and Industrial Effluents) Regulations
- To assess total maximum daily loads for both point and non-point sources
- To revise the Water Quality Index by incorporating other parameters for more accurate river water classification
- To develop the National Marine Water Quality Index
Institutional arrangementsThe Ministry of Natural Resources and Environment (NRE), established in 2004 as a result of restructuring of ministries, is in charge of environmental conservation which includes water quantity and quality management. Other ministries and authorities are also involved in water resource management such as the Ministry of Water Energy and Communication for water service monitoring and supervision, Ministry of Science, Technology and Innovation for water research and development, Ministry of Health for drinking water quality, and local governments for water planning and development (Sharifuddin 2011). For water pollution control, the Department of Environment (DoE) under NRE is mainly engaged in implementation of the Environmental Quality Act 1974.
90

Environmental Quality ActEnvironmental Quality Standards for Surface WaterEffluent Discharge Standards
General
Selangor Waters Management Authority Enactment (1999)Kedah Water Resources Enactment (2007)Sabah Conservation of the Environment Enactment
Sabah Water Resources Enactment (1998)National resources and EnvironmentOrdinance Sarawak
Specific Area
Peninsular Malaysia1. Agriculture
2. Forestry
3. Control of Rivers
4. Land Management
5. Domestic Water Supply
6. Mining
7. Local and Regional Planning
8. Fishery
9. Others
Irrigation Areas Act (1953)Drainage Works Acts (1954)
National Forestry Act (1984)
Water Acts (1920), Reviewed (1989)River Rights Enactment of PerakKelantan River Traffic Enactment (1955)Pahang River Launches Enactment 6/49
National Land Code (1965)Land Conservation Act (1960)Earthwork by laws
Water Service Indutry Act
Mining Enctment (1936)
Town and Country Planning Act (1976)
Fisheries Act (1963)
Local Government Act (1976)Street Drainage Building By law (1974, 1994-R)Geological Survey ActMinisterial Function Act (1969)
State of Sabah and Sarawak1. Agriculture
2. Forestry
3. Control of Rivers
4. Land Management
5. Domestic Water Supply
6. Mining
7. Local and Regional Planning
8. Others
Drainage and Irrigation, Sabah Ordinace (15/1956)Drainage Works Ordinance Sarawak (1966)
Sabah Forest Enactment (1965)Forest Ordinance Sarawak, Cap126
Sarawak Water Ordinance,Sarawak Riverine Transport Bill (1993)
Sabah Land Ordinance (1930)Sarawak Land Code (1958)
Water Services Industry Act
Mining Enactment (1960 Sabah)Mining Enactment (1949 Sarawak)
Town and Country PlanningEnactment Sabah Cap 141Town and Country Planning Sarawak Cap 87
Local Authority Enactment, Sabah Ordinance (11/1961)Local Authority Ordinance Sarawak Cap 117
Specific Sector
Conservation of Water Quality
Figure 3.7.6. Legislative chart for water quality management(Source: MoEJ 2009)
91
Chapter3.7 MalaysiaWEPA Outlook on Water Environmental Management in Asia 2012
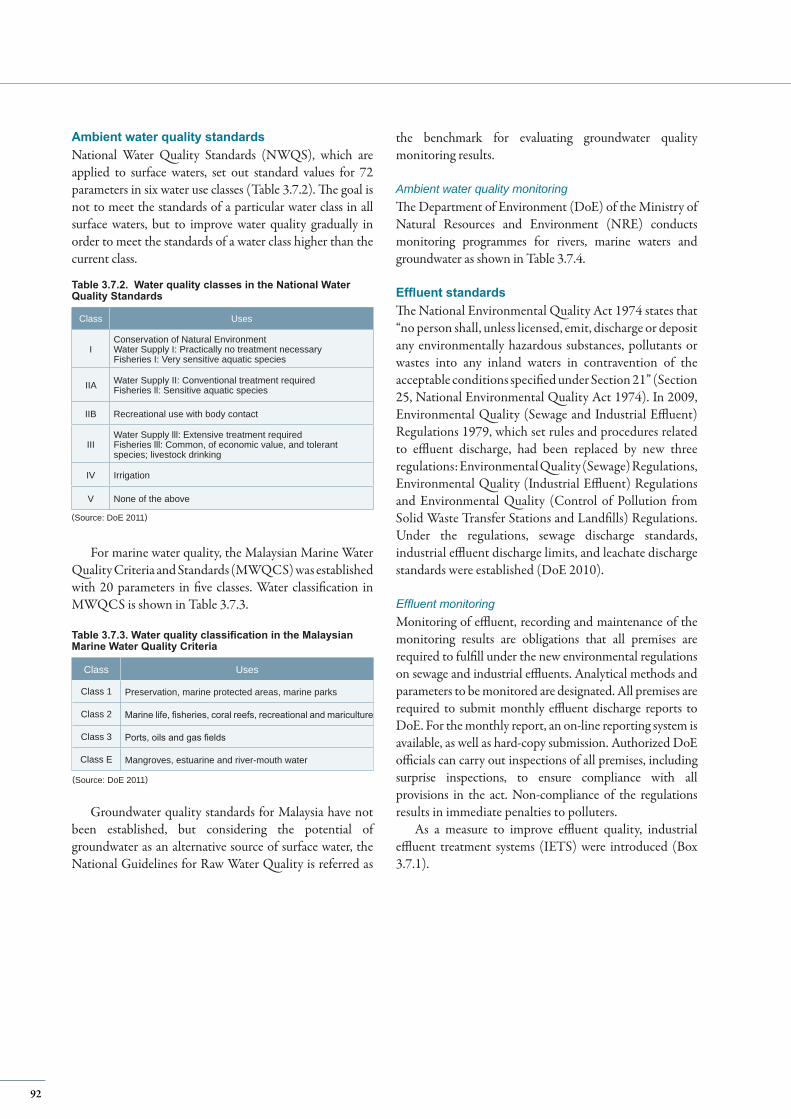
Ambient water quality standardsNational Water Quality Standards (NWQS), which are applied to surface waters, set out standard values for 72 parameters in six water use classes (Table 3.7.2). The goal is not to meet the standards of a particular water class in all surface waters, but to improve water quality gradually in order to meet the standards of a water class higher than the current class.
Class Uses
IConservation of Natural Environment Water Supply I: Practically no treatment necessaryFisheries I: Very sensitive aquatic species
IIA Water Supply II: Conventional treatment requiredFisheries ll: Sensitive aquatic species
IIB Recreational use with body contact
IIIWater Supply lll: Extensive treatment requiredFisheries lll: Common, of economic value, and tolerant species; livestock drinking
IV Irrigation
V None of the above
Table 3.7.2. Water quality classes in the National Water Quality Standards
(Source: DoE 2011)
For marine water quality, the Malaysian Marine Water Quality Criteria and Standards (MWQCS) was established with 20 parameters in five classes. Water classification in MWQCS is shown in Table 3.7.3.
Class Uses
Class 1 Preservation, marine protected areas, marine parks
Class 2 Marine life, fisheries, coral reefs, recreational and mariculture
Class 3 Ports, oils and gas fields
Class E Mangroves, estuarine and river-mouth water
Table 3.7.3. Water quality classification in the Malaysian Marine Water Quality Criteria
(Source: DoE 2011)
Groundwater quality standards for Malaysia have not been established, but considering the potential of groundwater as an alternative source of surface water, the National Guidelines for Raw Water Quality is referred as
the benchmark for evaluating groundwater quality monitoring results.
Ambient water quality monitoringThe Department of Environment (DoE) of the Ministry of Natural Resources and Environment (NRE) conducts monitoring programmes for rivers, marine waters and groundwater as shown in Table 3.7.4.
Effluent standardsThe National Environmental Quality Act 1974 states that “no person shall, unless licensed, emit, discharge or deposit any environmentally hazardous substances, pollutants or wastes into any inland waters in contravention of the acceptable conditions specified under Section 21” (Section 25, National Environmental Quality Act 1974). In 2009, Environmental Quality (Sewage and Industrial Effluent) Regulations 1979, which set rules and procedures related to effluent discharge, had been replaced by new three regulations: Environmental Quality (Sewage) Regulations, Environmental Quality (Industrial Effluent) Regulations and Environmental Quality (Control of Pollution from Solid Waste Transfer Stations and Landfills) Regulations. Under the regulations, sewage discharge standards, industrial effluent discharge limits, and leachate discharge standards were established (DoE 2010).
Effluent monitoringMonitoring of effluent, recording and maintenance of the monitoring results are obligations that all premises are required to fulfill under the new environmental regulations on sewage and industrial effluents. Analytical methods and parameters to be monitored are designated. All premises are required to submit monthly effluent discharge reports to DoE. For the monthly report, an on-line reporting system is available, as well as hard-copy submission. Authorized DoE officials can carry out inspections of all premises, including surprise inspections, to ensure compliance with all provisions in the act. Non-compliance of the regulations results in immediate penalties to polluters.
As a measure to improve effluent quality, industrial effluent treatment systems (IETS) were introduced (Box 3.7.1).
92
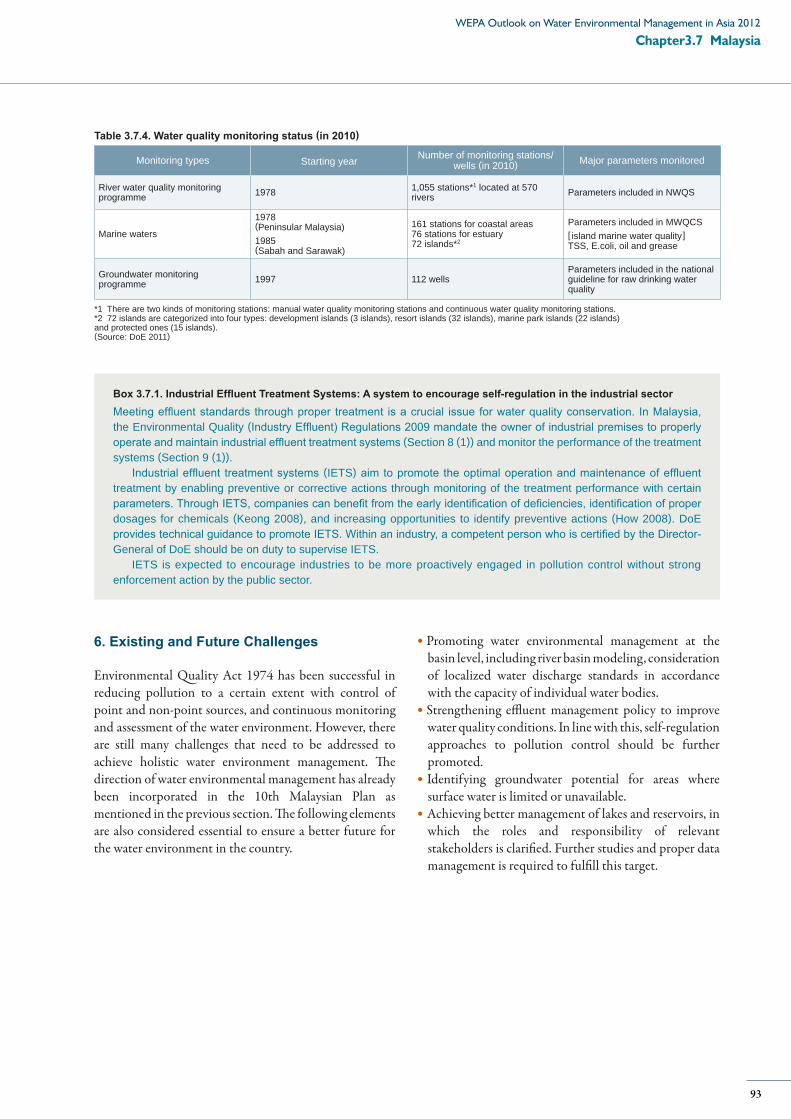
6. Existing and Future Challenges
Environmental Quality Act 1974 has been successful in reducing pollution to a certain extent with control of point and non-point sources, and continuous monitoring and assessment of the water environment. However, there are still many challenges that need to be addressed to achieve holistic water environment management. The direction of water environmental management has already been incorporated in the 10th Malaysian Plan as mentioned in the previous section. The following elements are also considered essential to ensure a better future for the water environment in the country.
Box 3.7.1. Industrial Effluent Treatment Systems: A system to encourage self-regulation in the industrial sectorMeeting effluent standards through proper treatment is a crucial issue for water quality conservation. In Malaysia, the Environmental Quality (Industry Effluent) Regulations 2009 mandate the owner of industrial premises to properly operate and maintain industrial effluent treatment systems (Section 8 (1)) and monitor the performance of the treatment systems (Section 9 (1)).
Industrial effluent treatment systems (IETS) aim to promote the optimal operation and maintenance of effluent treatment by enabling preventive or corrective actions through monitoring of the treatment performance with certain parameters. Through IETS, companies can benefit from the early identification of deficiencies, identification of proper dosages for chemicals (Keong 2008), and increasing opportunities to identify preventive actions (How 2008). DoE provides technical guidance to promote IETS. Within an industry, a competent person who is certified by the Director-General of DoE should be on duty to supervise IETS.
IETS is expected to encourage industries to be more proactively engaged in pollution control without strong enforcement action by the public sector.
Promoting water environmental management at the basin level, including river basin modeling, consideration of localized water discharge standards in accordance with the capacity of individual water bodies.Strengthening effluent management policy to improve water quality conditions. In line with this, self-regulation approaches to pollution control should be further promoted. Identifying groundwater potential for areas where surface water is limited or unavailable. Achieving better management of lakes and reservoirs, in which the roles and responsibility of relevant stakeholders is clarified. Further studies and proper data management is required to fulfill this target.
Monitoring types Starting year Number of monitoring stations/wells (in 2010) Major parameters monitored
River water quality monitoring programme 1978 1,055 stations*1 located at 570
rivers Parameters included in NWQS
Marine waters
1978 (Peninsular Malaysia) 1985(Sabah and Sarawak)
161 stations for coastal areas76 stations for estuary72 islands*2
Parameters included in MWQCS [ island marine water quality]TSS, E.coli, oil and grease
Groundwater monitoring programme 1997 112 wells
Parameters included in the national guideline for raw drinking water quality
*1 There are two kinds of monitoring stations: manual water quality monitoring stations and continuous water quality monitoring stations. *2 72 islands are categorized into four types: development islands (3 islands), resort islands (32 islands), marine park islands (22 islands) and protected ones (15 islands). (Source: DoE 2011)
Table 3.7.4. Water quality monitoring status (in 2010)
93
Chapter3.7 MalaysiaWEPA Outlook on Water Environmental Management in Asia 2012
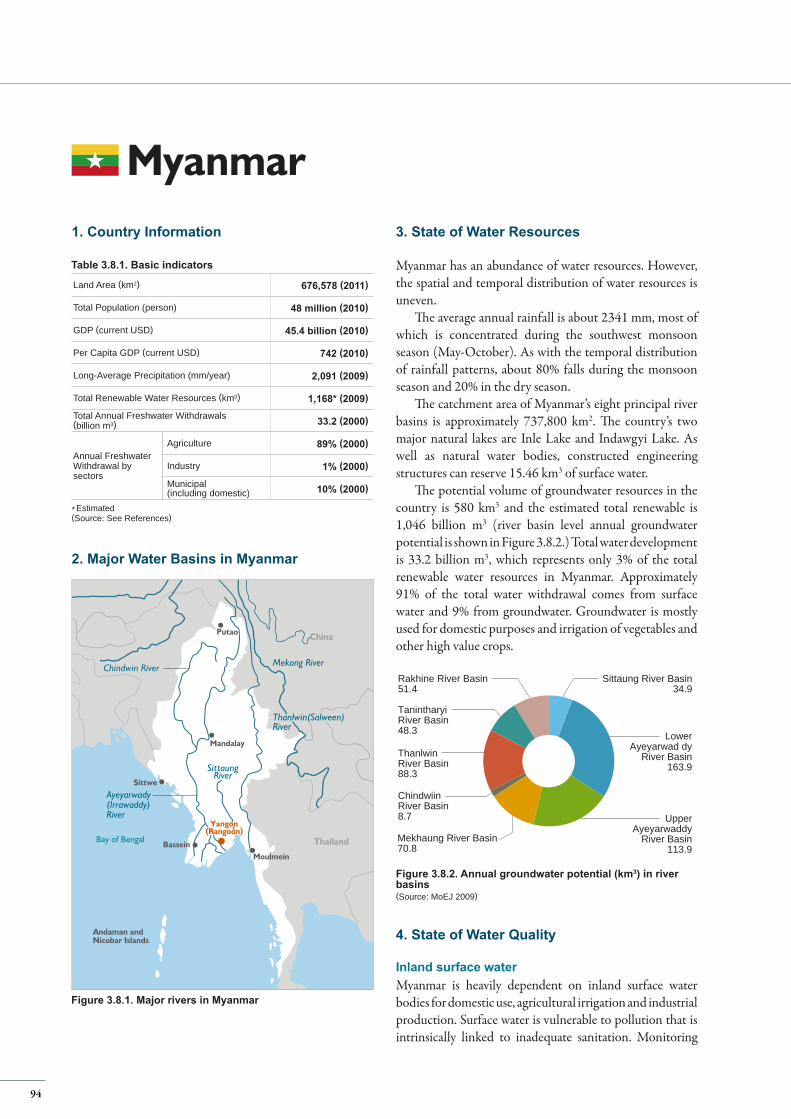
Thailand
China
BasseinMoulmein
Andaman andNicobar Islands
Sittwe
Mandalay
Putao
Mekong River
Thanlwin(Salween)RiverThanlwin(Salween)River
SittaungRiver
Ayeyarwady(Irrawaddy)River
Chindwin RiverChindwin River
Bay of Bengal
Yangon(Rangoon)
Yangon(Rangoon)
Land Area (km2) 676,578 (2011)
Total Population (person) 48 million (2010)
GDP (current USD) 45.4 billion (2010)
Per Capita GDP (current USD) 742 (2010)
Long-Average Precipitation (mm/year) 2,091 (2009)
Total Renewable Water Resources (km3) 1,168* (2009)
Total Annual Freshwater Withdrawals (billion m3) 33.2 (2000)
Annual FreshwaterWithdrawal bysectors
Agriculture 89% (2000)
Industry 1% (2000)
Municipal(including domestic) 10% (2000)
1. Country Information
2. Major Water Basins in Myanmar
* Estimated(Source: See References)
Figure 3.8.1. Major rivers in Myanmar
Table 3.8.1. Basic indicators
3. State of Water Resources
Myanmar has an abundance of water resources. However, the spatial and temporal distribution of water resources is uneven.
The average annual rainfall is about 2341 mm, most of which is concentrated during the southwest monsoon season (May-October). As with the temporal distribution of rainfall patterns, about 80% falls during the monsoon season and 20% in the dry season.
The catchment area of Myanmar’s eight principal river basins is approximately 737,800 km2. The country’s two major natural lakes are Inle Lake and Indawgyi Lake. As well as natural water bodies, constructed engineering structures can reserve 15.46 km3 of surface water.
The potential volume of groundwater resources in the country is 580 km3 and the estimated total renewable is 1,046 billion m3 (river basin level annual groundwater potential is shown in Figure 3.8.2.) Total water development is 33.2 billion m3, which represents only 3% of the total renewable water resources in Myanmar. Approximately 91% of the total water withdrawal comes from surface water and 9% from groundwater. Groundwater is mostly used for domestic purposes and irrigation of vegetables and other high value crops.
Rakhine River Basin51.4
Sittaung River Basin34.9
LowerAyeyarwad dy
River Basin163.9
UpperAyeyarwaddy
River Basin113.9
Mekhaung River Basin70.8
ChindwiinRiver Basin8.7
ThanlwinRiver Basin88.3
TanintharyiRiver Basin48.3
Figure 3.8.2. Annual groundwater potential (km3) in river basins (Source: MoEJ 2009)
4. State of Water Quality
Inland surface water Myanmar is heavily dependent on inland surface water bodies for domestic use, agricultural irrigation and industrial production. Surface water is vulnerable to pollution that is intrinsically linked to inadequate sanitation. Monitoring
Myanmar
94

data for water quality in Ayeyarwady River, Chindwil River, Thanlwin River, and Sittaung River revealed that water in these rivers is suitable for irrigation purposes (Table 3.8.2). However, the quality of some surface water bodies were inadequate both for human health and aquatic ecosystems. High levels of phosphate and nitrate and low levels of DO were measured in Inle Lake, which is most likely caused by runoff of agricultural fertilizers and discharge of untreated waste (Table 3.8.3, Box 3.8.1). In addition, both coliform and E.coli bacteria exceeded standards, making the water of Inle Lake unfit for use as drinking water.
Groundwater With increases in population and a greater need for water for economic activities, there is increasing pressure on groundwater extraction. Unrestricted groundwater extraction can result in land subsidence and saltwater instruction, and therefore, groundwater must be controlled and managed appropriately. As well, surface water should be managed along with groundwater in an integrated way in order to ensure the recharge of groundwater aquifers. Moreover, the rising water requirements of the country’s rapidly expanding urban and industrial centres, especially in Yangon City, and the contamination by pollutants from industrial, municipal and agricultural effluents (the latter associated with the uncontrolled use of pesticides and fertilizers) have lead to the decreasing availability of freshwater. Additionally, salinity intrusion has been reported in the inland areas along the tidal reaches of the Ayeyarwaddy River system, and monitoring of the Ayeyarwaddy in the dry zone shows excessive pollution, particularly in summer.
Salinity intrusion is also a critical problem in the country, particularly in the Delta Region, the third most populated area in Myanmar and where most rice is cultivated. The Figure 3.8.3 shows the degree of intrusion.
4.4.20074.4.200720.3.200720.3.2007
4.3.20074.3.2007PatheinPathein
LabuttaLabutta
MaubinMaubinYangonYangon
YandoonYandoon
BogalayBogalay PyaponPyapon
Figure 3.8.3. Degree of penetration and saline frontsmeasured in summer 2007(Source: Ra 2011)
5. Frameworks for Water Environment Management
Legislation Myanmar has no specific laws to control water pollution. There is a general provision in Section 9 of the Public Health Law of 1972, which empowers the Ministry of Health to carry out measures relating to environmental health, such as garbage disposal, use of water for drinking and other purposes, radioactivity, protection of air from pollution, and food and drug safety. However, detailed provisions do not exist to ensure more effective and comprehensive
Rivers DO Fe Na Cl
Ayeyarwady River 4.02 0.45 0.57 0.30
Chindwil River 4.17 0.01 0.69 0.52
Thanlwin River 3.56 0.02 0.62 0.35
Sittaung River 4.19 0.50 0.77 0.62
Table 3.8.2. Water quality in selected rivers
(Source: Data from the focal person in 2011)
Parameters Value Remarks
pH 7.8-8.0 Alkaline
Ca (mg/L) 30.0-50.4 High
PO4-P (mg/L) 0.0078-0.28 High
NO3-N (mg/L) 0.7-0.9 High
DO (mg/L) 0.6-8.6
Coliform bacteria (CFU) 18-137 Unfit for drinking
E. Coli (CFU) 0-23 Unfit for drinking
Table 3.8.3. Water quality of Inle Lake
(Source: Khin Lay Swe 2011)
Box 3.8.1. Water Environment in Inle LakeInle Lake, the second largest lake in Myanmar, serves as the sole source of domestic water. Water quality of the lake is impacted by various factors. Among them, deforestation and more intense agricultural activities on its western and northern watershed areas have brought in increasing amounts of silt and nutrients into the shallow lake. It was reported that concentrations of PO4-P, NO2-N, and NO3-N were relatively high, leading to a eutrophic state. The direct discharge of domestic wastewater is another cause of water pollution. A high number of coliform bacteria was reported, indicating that the lake water was unfit to drink. The government introduced the use of latrines with the assistance of WATSAN of the Community Water Supply and Sanitation project with the aim of addressing the specific problem of pollution in the lake.(Source: Than 2007; Akaishi et al. 2006)
(mg/L)
95
Chapter3.8 MyanmarWEPA Outlook on Water Environmental Management in Asia 2012
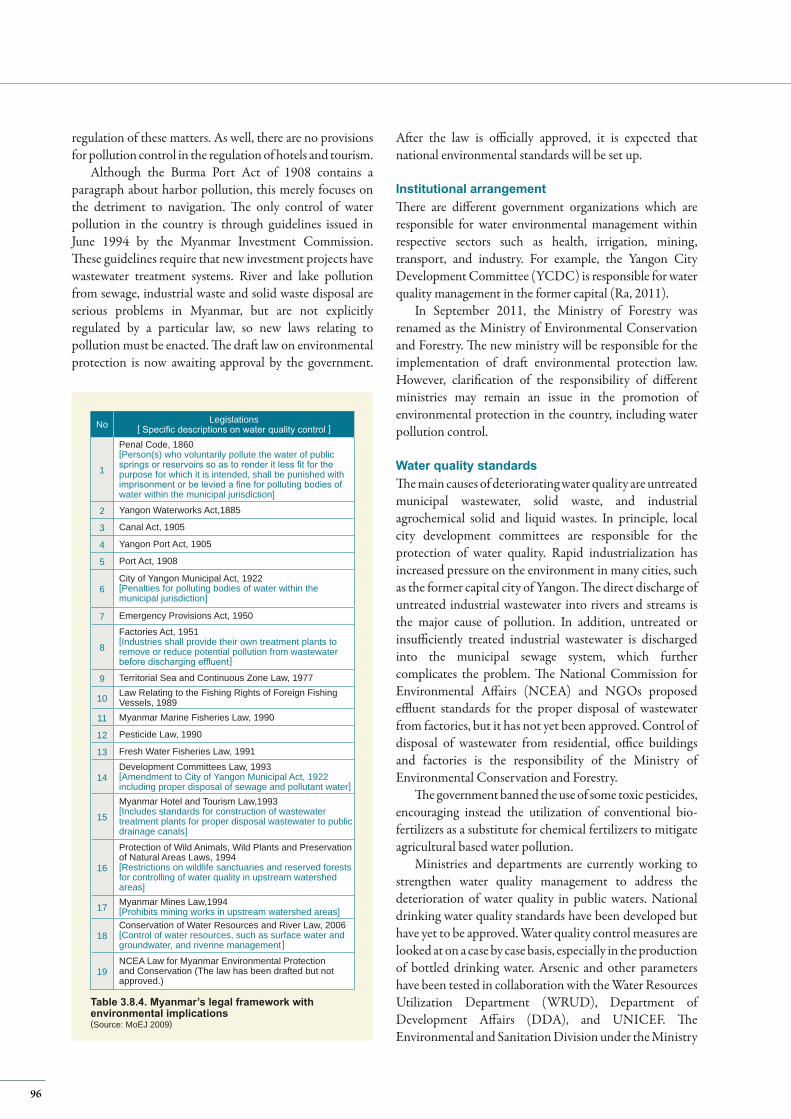
regulation of these matters. As well, there are no provisions for pollution control in the regulation of hotels and tourism.
Although the Burma Port Act of 1908 contains a paragraph about harbor pollution, this merely focuses on the detriment to navigation. The only control of water pollution in the country is through guidelines issued in June 1994 by the Myanmar Investment Commission. These guidelines require that new investment projects have wastewater treatment systems. River and lake pollution from sewage, industrial waste and solid waste disposal are serious problems in Myanmar, but are not explicitly regulated by a particular law, so new laws relating to pollution must be enacted. The draft law on environmental protection is now awaiting approval by the government.
After the law is officially approved, it is expected that national environmental standards will be set up.
Institutional arrangementThere are different government organizations which are responsible for water environmental management within respective sectors such as health, irrigation, mining, transport, and industry. For example, the Yangon City Development Committee (YCDC) is responsible for water quality management in the former capital (Ra, 2011).
In September 2011, the Ministry of Forestry was renamed as the Ministry of Environmental Conservation and Forestry. The new ministry will be responsible for the implementation of draft environmental protection law. However, clarification of the responsibility of different ministries may remain an issue in the promotion of environmental protection in the country, including water pollution control.
Water quality standardsThe main causes of deteriorating water quality are untreated municipal wastewater, solid waste, and industrial agrochemical solid and liquid wastes. In principle, local city development committees are responsible for the protection of water quality. Rapid industrialization has increased pressure on the environment in many cities, such as the former capital city of Yangon. The direct discharge of untreated industrial wastewater into rivers and streams is the major cause of pollution. In addition, untreated or insufficiently treated industrial wastewater is discharged into the municipal sewage system, which further complicates the problem. The National Commission for Environmental Affairs (NCEA) and NGOs proposed effluent standards for the proper disposal of wastewater from factories, but it has not yet been approved. Control of disposal of wastewater from residential, office buildings and factories is the responsibility of the Ministry of Environmental Conservation and Forestry.
The government banned the use of some toxic pesticides, encouraging instead the utilization of conventional bio-fertilizers as a substitute for chemical fertilizers to mitigate agricultural based water pollution.
Ministries and departments are currently working to strengthen water quality management to address the deterioration of water quality in public waters. National drinking water quality standards have been developed but have yet to be approved. Water quality control measures are looked at on a case by case basis, especially in the production of bottled drinking water. Arsenic and other parameters have been tested in collaboration with the Water Resources Utilization Department (WRUD), Department of Development Affairs (DDA), and UNICEF. The Environmental and Sanitation Division under the Ministry
No Legislations[ Specific descriptions on water quality control ]
1
Penal Code, 1860[Person(s) who voluntarily pollute the water of public springs or reservoirs so as to render it less fit for the purpose for which it is intended, shall be punished with imprisonment or be levied a fine for polluting bodies of water within the municipal jurisdiction]
2 Yangon Waterworks Act,1885
3 Canal Act, 1905
4 Yangon Port Act, 1905
5 Port Act, 1908
6City of Yangon Municipal Act, 1922[Penalties for polluting bodies of water within the municipal jurisdiction]
7 Emergency Provisions Act, 1950
8
Factories Act, 1951[Industries shall provide their own treatment plants to remove or reduce potential pollution from wastewater before discharging effluent]
9 Territorial Sea and Continuous Zone Law, 1977
10 Law Relating to the Fishing Rights of Foreign Fishing Vessels, 1989
11 Myanmar Marine Fisheries Law, 1990
12 Pesticide Law, 1990
13 Fresh Water Fisheries Law, 1991
14Development Committees Law, 1993[Amendment to City of Yangon Municipal Act, 1922 including proper disposal of sewage and pollutant water]
15
Myanmar Hotel and Tourism Law,1993[Includes standards for construction of wastewater treatment plants for proper disposal wastewater to public drainage canals]
16
Protection of Wild Animals, Wild Plants and Preservation of Natural Areas Laws, 1994[Restrictions on wildlife sanctuaries and reserved forests for controlling of water quality in upstream watershed areas]
17 Myanmar Mines Law,1994[Prohibits mining works in upstream watershed areas]
18Conservation of Water Resources and River Law, 2006[Control of water resources, such as surface water and groundwater, and riverine management]
19NCEA Law for Myanmar Environmental Protection and Conservation (The law has been drafted but not approved.)
Table 3.8.4. Myanmar’s legal framework with environmental implications(Source: MoEJ 2009)
96
of Health is jointly implementing a programme on water supply systems with health institutions and carrying out a Water Quality Surveillance and Monitoring System Pilot Project in the former capital city of Yangon.
Water quality monitoringThere are no specific regular monitoring programmes for ambient water quality in the country. Similarly, water quality monitoring is conducted by different governmental agencies in line with their own respective purposes.
In 2006, the Irrigation Department instituted water quality monitoring for both irrigation and potable water purposes at 15 stations in four rivers, namely Ayeyarwady (8 stations), Chindowin (3 stations), Thanlwin (2 stations) and Sittoung (2 stations). Sixteen parameters are monitored seasonally (twice a year): pH, ECw, turbidity, temperature, total hardness, TDS, salinity, SAR, RSC, Ca++, Mg++, K+, Co3+, HCO3, SO4, and Cl. The Irrigation Department also monitored salt water intrusion in the delta area during the summer season.
Effluent standardsYCDC convened a meeting in July 2001 to introduce proposed environmental standards for Yangon, including standards on air, noise, wastewater effluent and toxic chemicals. Similarly, governmental departments in YCDC have set their own standards with regard to the protection of environmental areas in which they are fully involved.
The main objective of the National Commission for Environmental Affairs is to conserve the environment and prevent its degradation when utilizing water, land, forest, mineral, marine and other natural resources. The current measures mentioned above are in line with the National Environment Policy of Myanmar initiated by the National Commission for Environmental Affairs.
6. Existing and Future Challenges
A number of agencies are responsible for implementing water supply and sanitation schemes, which should ideally be carried out in an integrated manner. Coordination mechanisms among the various agencies should be strengthened to promote more effective management of the programme.
Improvement of water use efficiency is an important factor for water conservation in the irrigation sector to reduce both water consumption and pollutant discharge by enterprises (point sources) and farmland (non-point source).
The main sources of deteriorating water quality are sewage, solid waste, industrial waste and agrochemical waste. Water conservation through water quality protection is undertaken by the relevant city development committees. In fact, the control of wastewater is both a municipal and an industrial problem. In cities undergoing rapid industrialization, the municipal treatment issue is still complicated. Thus stricter laws to control water quality should be imposed. In the agricultural sector, the government has banned the import of some toxic pesticides and encourages the use of conventional bio-fertilizers as a substitute for chemical fertilizers to mitigate water quality deterioration.
Deforestation in catchment areas and around water resources causes serious degradation of water quality and quantity. The resulting topsoil loss and land degradation by gully and sheet erosion leads to excessive levels of turbidity in incoming water and to offsite ecological and physical impacts from deposition in rivers and lakebeds. The silt and clay fractions, which carry absorbed chemicals, are transported by the sediments into the aquatic system.
Box. 3.8.2. Current actions taken in the water sector
Public awareness through community involvement is a key issue on the subject of water use efficiency and conservation. Social development and public education and information programmes lead to an increasingly knowledgeable public that wants to be involved in government decision making. Training in nurturing forests, producing firewood substitutes and distributing leaflets on reforestation technology is provided to educate the local people in forest conservation practices. The government has designated July as the Month of Planting Trees for communities countrywide.
YCDC has enacted Law No. 6/99 to improve water distribution systems, including leak detection, construction, repair and maintenance of city water mains, changes in plumbing codes and prosecution for illegal connections.
Some effective measures have been taken to conserve agricultural water, such as adjustment of cropping patterns, water supply scheduling, improvement of irrigation facilities and management, land leveling, water pricing, canal lining and proper use of fertilizers and pesticides. Rehabilitation works for existing irrigation facilities have been carried out for efficient use of water instead of building new structures. Programmes that promote irrigation efficiency directly equate increased efficiency with savings for farmers (reduced energy, labour or cost) or improved productivity.
Laws and regulations related to water resource and environmental management are reviewed in line with environmental assessments.
97
Chapter3.8 MyanmarWEPA Outlook on Water Environmental Management in Asia 2012
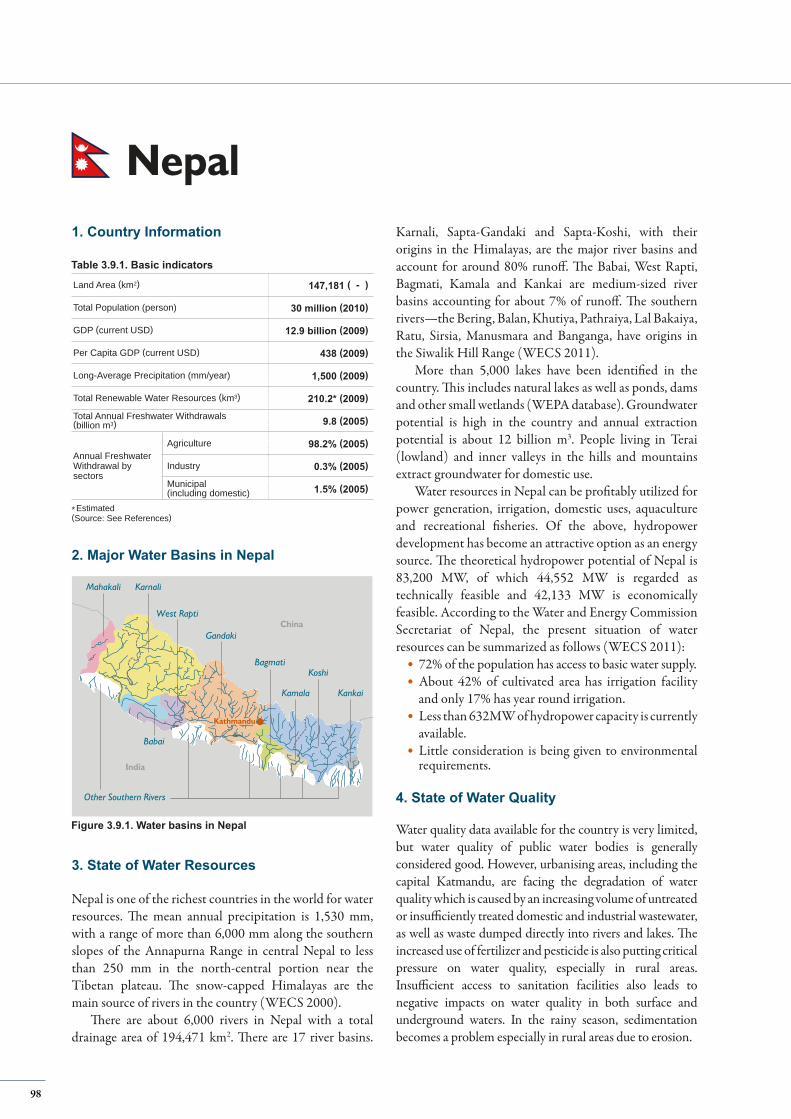
Nepal
China
India
Mahakali Karnali
Gandaki
West Rapti
Babai
KoshiBagmati
Kamala Kankai
Other Southern Rivers
KathmanduKathmandu
Land Area (km2) 147,181 ( - )
Total Population (person) 30 million (2010)
GDP (current USD) 12.9 billion (2009)
Per Capita GDP (current USD) 438 (2009)
Long-Average Precipitation (mm/year) 1,500 (2009)
Total Renewable Water Resources (km3) 210.2* (2009)
Total Annual Freshwater Withdrawals(billion m3) 9.8 (2005)
Annual FreshwaterWithdrawal bysectors
Agriculture 98.2% (2005)
Industry 0.3% (2005)
Municipal(including domestic) 1.5% (2005)
1. Country Information
2. Major Water Basins in Nepal
* Estimated(Source: See References)
Figure 3.9.1. Water basins in Nepal
Table 3.9.1. Basic indicators
3. State of Water Resources
Nepal is one of the richest countries in the world for water resources. The mean annual precipitation is 1,530 mm, with a range of more than 6,000 mm along the southern slopes of the Annapurna Range in central Nepal to less than 250 mm in the north-central portion near the Tibetan plateau. The snow-capped Himalayas are the main source of rivers in the country (WECS 2000).
There are about 6,000 rivers in Nepal with a total drainage area of 194,471 km2. There are 17 river basins.
Karnali, Sapta-Gandaki and Sapta-Koshi, with their origins in the Himalayas, are the major river basins and account for around 80% runoff. The Babai, West Rapti, Bagmati, Kamala and Kankai are medium-sized river basins accounting for about 7% of runoff. The southern rivers—the Bering, Balan, Khutiya, Pathraiya, Lal Bakaiya, Ratu, Sirsia, Manusmara and Banganga, have origins in the Siwalik Hill Range (WECS 2011).
More than 5,000 lakes have been identified in the country. This includes natural lakes as well as ponds, dams and other small wetlands (WEPA database). Groundwater potential is high in the country and annual extraction potential is about 12 billion m3. People living in Terai (lowland) and inner valleys in the hills and mountains extract groundwater for domestic use.
Water resources in Nepal can be profitably utilized for power generation, irrigation, domestic uses, aquaculture and recreational fisheries. Of the above, hydropower development has become an attractive option as an energy source. The theoretical hydropower potential of Nepal is 83,200 MW, of which 44,552 MW is regarded as technically feasible and 42,133 MW is economically feasible. According to the Water and Energy Commission Secretariat of Nepal, the present situation of water resources can be summarized as follows (WECS 2011):
72% of the population has access to basic water supply.About 42% of cultivated area has irrigation facility and only 17% has year round irrigation.Less than 632MW of hydropower capacity is currently available.Little consideration is being given to environmental requirements.
4. State of Water Quality
Water quality data available for the country is very limited, but water quality of public water bodies is generally considered good. However, urbanising areas, including the capital Katmandu, are facing the degradation of water quality which is caused by an increasing volume of untreated or insufficiently treated domestic and industrial wastewater, as well as waste dumped directly into rivers and lakes. The increased use of fertilizer and pesticide is also putting critical pressure on water quality, especially in rural areas. Insufficient access to sanitation facilities also leads to negative impacts on water quality in both surface and underground waters. In the rainy season, sedimentation becomes a problem especially in rural areas due to erosion.
98
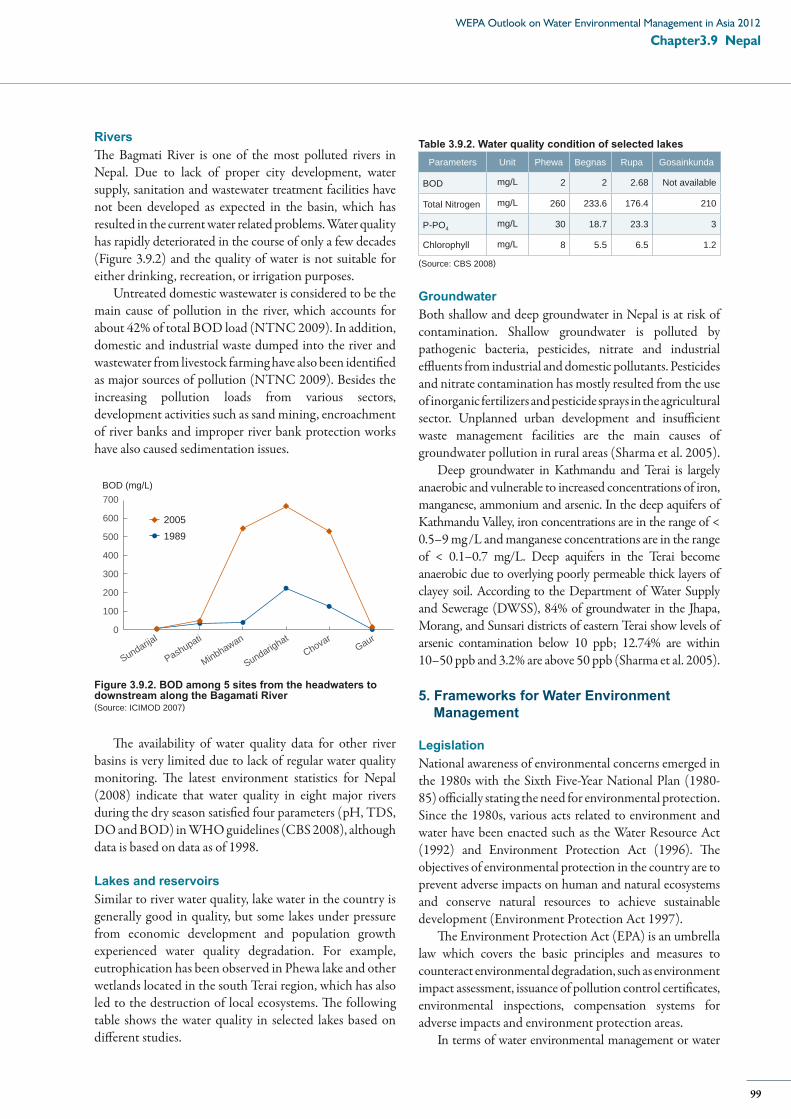
RiversThe Bagmati River is one of the most polluted rivers in Nepal. Due to lack of proper city development, water supply, sanitation and wastewater treatment facilities have not been developed as expected in the basin, which has resulted in the current water related problems. Water quality has rapidly deteriorated in the course of only a few decades (Figure 3.9.2) and the quality of water is not suitable for either drinking, recreation, or irrigation purposes.
Untreated domestic wastewater is considered to be the main cause of pollution in the river, which accounts for about 42% of total BOD load (NTNC 2009). In addition, domestic and industrial waste dumped into the river and wastewater from livestock farming have also been identified as major sources of pollution (NTNC 2009). Besides the increasing pollution loads from various sectors, development activities such as sand mining, encroachment of river banks and improper river bank protection works have also caused sedimentation issues.
BOD (mg/L)700
600
500
400
300
200
100
0
Sundarijal
Pashupati
Minbhawan
SundarighatChovar
Gaur
19892005
Figure 3.9.2. BOD among 5 sites from the headwaters to downstream along the Bagamati River(Source: ICIMOD 2007)
The availability of water quality data for other river basins is very limited due to lack of regular water quality monitoring. The latest environment statistics for Nepal (2008) indicate that water quality in eight major rivers during the dry season satisfied four parameters (pH, TDS, DO and BOD) in WHO guidelines (CBS 2008), although data is based on data as of 1998.
Lakes and reservoirsSimilar to river water quality, lake water in the country is generally good in quality, but some lakes under pressure from economic development and population growth experienced water quality degradation. For example, eutrophication has been observed in Phewa lake and other wetlands located in the south Terai region, which has also led to the destruction of local ecosystems. The following table shows the water quality in selected lakes based on different studies.
Parameters Unit Phewa Begnas Rupa Gosainkunda
BOD mg/L 2 2 2.68 Not available
Total Nitrogen mg/L 260 233.6 176.4 210
P-PO4mg/L 30 18.7 23.3 3
Chlorophyll mg/L 8 5.5 6.5 1.2
Table 3.9.2. Water quality condition of selected lakes
(Source: CBS 2008)
GroundwaterBoth shallow and deep groundwater in Nepal is at risk of contamination. Shallow groundwater is polluted by pathogenic bacteria, pesticides, nitrate and industrial effluents from industrial and domestic pollutants. Pesticides and nitrate contamination has mostly resulted from the use of inorganic fertilizers and pesticide sprays in the agricultural sector. Unplanned urban development and insufficient waste management facilities are the main causes of groundwater pollution in rural areas (Sharma et al. 2005).
Deep groundwater in Kathmandu and Terai is largely anaerobic and vulnerable to increased concentrations of iron, manganese, ammonium and arsenic. In the deep aquifers of Kathmandu Valley, iron concentrations are in the range of < 0.5–9 mg/L and manganese concentrations are in the range of < 0.1–0.7 mg/L. Deep aquifers in the Terai become anaerobic due to overlying poorly permeable thick layers of clayey soil. According to the Department of Water Supply and Sewerage (DWSS), 84% of groundwater in the Jhapa, Morang, and Sunsari districts of eastern Terai show levels of arsenic contamination below 10 ppb; 12.74% are within 10–50 ppb and 3.2% are above 50 ppb (Sharma et al. 2005).
5. Frameworks for Water Environment Management
Legislation National awareness of environmental concerns emerged in the 1980s with the Sixth Five-Year National Plan (1980-85) officially stating the need for environmental protection. Since the 1980s, various acts related to environment and water have been enacted such as the Water Resource Act (1992) and Environment Protection Act (1996). The objectives of environmental protection in the country are to prevent adverse impacts on human and natural ecosystems and conserve natural resources to achieve sustainable development (Environment Protection Act 1997).
The Environment Protection Act (EPA) is an umbrella law which covers the basic principles and measures to counteract environmental degradation, such as environment impact assessment, issuance of pollution control certificates, environmental inspections, compensation systems for adverse impacts and environment protection areas.
In terms of water environmental management or water
99
Chapter3.9 NepalWEPA Outlook on Water Environmental Management in Asia 2012
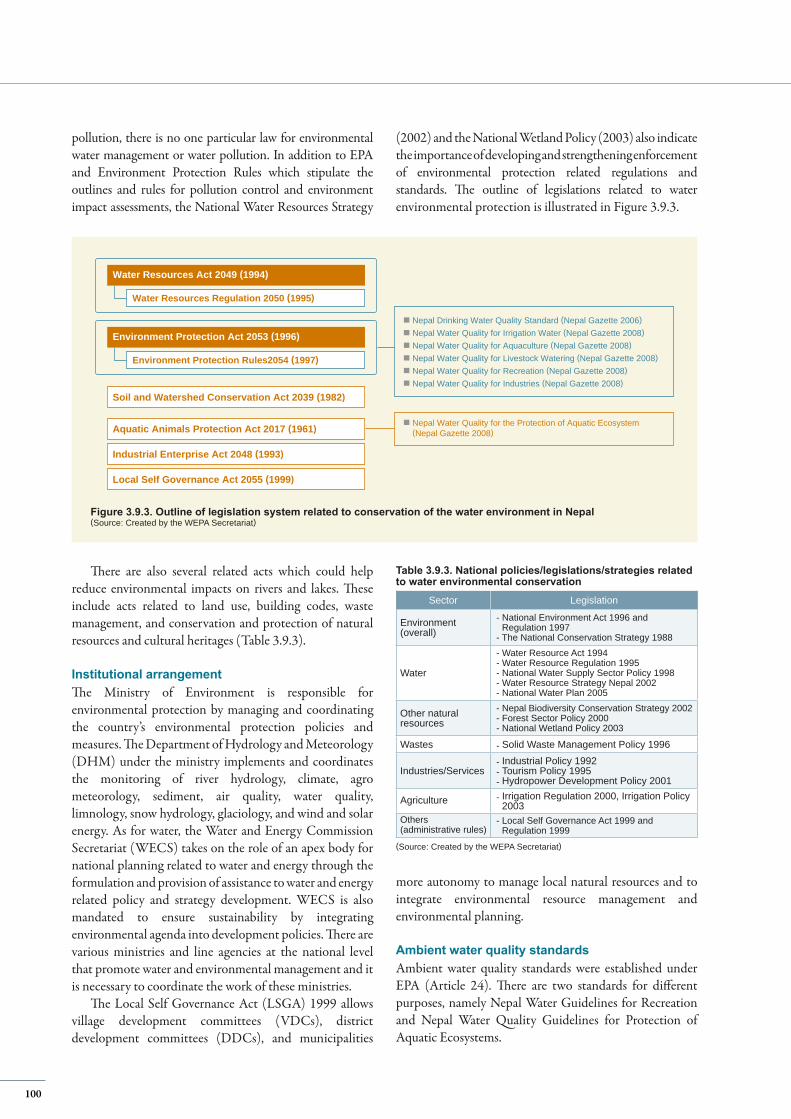
Aquatic Animals Protection Act 2017 (1961)
Soil and Watershed Conservation Act 2039 (1982)
Industrial Enterprise Act 2048 (1993)
Local Self Governance Act 2055 (1999)
Nepal Drinking Water Quality Standard (Nepal Gazette 2006)Nepal Water Quality for Irrigation Water (Nepal Gazette 2008)Nepal Water Quality for Aquaculture (Nepal Gazette 2008)Nepal Water Quality for Livestock Watering (Nepal Gazette 2008)Nepal Water Quality for Recreation (Nepal Gazette 2008)Nepal Water Quality for Industries (Nepal Gazette 2008)
Nepal Water Quality for the Protection of Aquatic Ecosystem (Nepal Gazette 2008)
Water Resources Act 2049 (1994)
Water Resources Regulation 2050 (1995)
Environment Protection Act 2053 (1996)
Environment Protection Rules2054 (1997)
Figure 3.9.3. Outline of legislation system related to conservation of the water environment in Nepal (Source: Created by the WEPA Secretariat)
pollution, there is no one particular law for environmental water management or water pollution. In addition to EPA and Environment Protection Rules which stipulate the outlines and rules for pollution control and environment impact assessments, the National Water Resources Strategy
There are also several related acts which could help reduce environmental impacts on rivers and lakes. These include acts related to land use, building codes, waste management, and conservation and protection of natural resources and cultural heritages (Table 3.9.3).
Institutional arrangementThe Ministry of Environment is responsible for environmental protection by managing and coordinating the country’s environmental protection policies and measures. The Department of Hydrology and Meteorology (DHM) under the ministry implements and coordinates the monitoring of river hydrology, climate, agro meteorology, sediment, air quality, water quality, limnology, snow hydrology, glaciology, and wind and solar energy. As for water, the Water and Energy Commission Secretariat (WECS) takes on the role of an apex body for national planning related to water and energy through the formulation and provision of assistance to water and energy related policy and strategy development. WECS is also mandated to ensure sustainability by integrating environmental agenda into development policies. There are various ministries and line agencies at the national level that promote water and environmental management and it is necessary to coordinate the work of these ministries.
The Local Self Governance Act (LSGA) 1999 allows village development committees (VDCs), district development committees (DDCs), and municipalities
(2002) and the National Wetland Policy (2003) also indicate the importance of developing and strengthening enforcement of environmental protection related regulations and standards. The outline of legislations related to water environmental protection is illustrated in Figure 3.9.3.
Sector Legislation
Environment(overall)
- National Environment Act 1996 and Regulation 1997
- The National Conservation Strategy 1988
Water
- Water Resource Act 1994- Water Resource Regulation 1995- National Water Supply Sector Policy 1998 - Water Resource Strategy Nepal 2002- National Water Plan 2005
Other naturalresources
- Nepal Biodiversity Conservation Strategy 2002- Forest Sector Policy 2000- National Wetland Policy 2003
Wastes - Solid Waste Management Policy 1996
Industries/Services- Industrial Policy 1992 - Tourism Policy 1995- Hydropower Development Policy 2001
Agriculture - Irrigation Regulation 2000, Irrigation Policy 2003
Others(administrative rules)
- Local Self Governance Act 1999 and Regulation 1999
Table 3.9.3. National policies/legislations/strategies related to water environmental conservation
(Source: Created by the WEPA Secretariat)
more autonomy to manage local natural resources and to integrate environmental resource management and environmental planning.
Ambient water quality standardsAmbient water quality standards were established under EPA (Article 24). There are two standards for different purposes, namely Nepal Water Guidelines for Recreation and Nepal Water Quality Guidelines for Protection of Aquatic Ecosystems.
100
Effluent standardsEffluent standards for different pollution sources are also set up under EPA as follows:
Tolerance limits for industrial effluent discharged into inland surface waters (generic)
Tolerance limits for specific industrial effluent discharged into inland surface waters (for nine industrial sectors, namely tanning, wool processing, fermentation, vegetable ghee and oil, paper and pulp, dairy products, sugar milling, cotton textiles, and soap industries)
Tolerance limits for industrial effluent discharged into public sewers
Tolerance limits for wastewater discharged into inland surface waters from combined wastewater treatment plants (CWTPs)
Water quality monitoringSystematic ambient water quality monitoring is not conducted in public water bodies in the country, although water quality is monitored by different ministries and agencies for different purposes (e.g. water quality monitoring of the source of municipal water supply). The water quality of the Bagmati River is monitored to some extent considering the critical state of the river quality. Water related database development is also set out in the action plan of the National Water Plan. Department of Hydrology and Meteorology under the Ministry of Environment monitors river and lake water quality.
Recent policy developmentIn the past two decades, the Nepalese government has strengthened legislation both in water and environmental sectors. In water environmental management, both sectors are closely interlinked but require further coordination. Effluent standards have been set up in the past three years as prescribed in the National Water Plan (Box 3.9.1). The framework of water environmental management already set up the country is facing enforcement and implementation issues.
6. Existing and Future Challenges
A framework of management has been set up for water environmental management in Nepal. The next step to be taken is the actual implementation of the nation’s regulations and rules. Lack of sub-ordinances enabling legislation and integration among related legislation and policies are major obstacles to achieving a comprehensive framework for water environmental management.
The lack of regular water quality monitoring is a constraint to the development of a scientific basis for policy making, implementation and review. There is a pressing need to coordinate institutions and develop institutional and human capacity to promote water quality monitoring.
To improve the present state of Nepal’s water environment, it is important to issue legal instruments which facilitate a feeling of ownership in order to improve the water environment. As well, an environmental database must be developed, and regular monitoring carried out to enforce legislation and ensure compliance.
Box 3.9.1. Implementation of water environmental related actions set by National Water Plan (2002) The National Water Plan (NWP) 2002 has different sectoral policies—hydropower development, irrigation, and drinking water supply and sanitation. Recognizing the importance of sustainable development principles for the country’s development, NWP incorporated environmental sustainable principles*1 and included four actions related to water quality management as follows.
(a) Development of water quality standards/guidelines for irrigation, drinking and recreational purposes(b) Establishment of water quality standards/guidelines for ecosystems maintenance(c) Development of standards/guidelines for the discharge of municipal and industrial wastewater(d) Establishment of minimum in-stream and outflow in important aquatic ecosystems
NWP also has special provisions in its environmental management plan (Part D). The environmental management plan is “a strategic document which deals with a plan for the implementation of environmental protection measures, monitoring and auditing programmes, institutions and procedures.” The actions introduced under NWP would have an impact on various environmental issues. The summary table of environmental issues included some water environmental conservation aspects such as downstream water pollution and groundwater quality, sedimentation, water pollution and sanitation, and impacts on aquatic ecosystems.
The environmental management plan aims to ultimately contribute to maximizing positive impacts and minimizing adverse effects in environmental sustainability in water development/conservation actions. Municipalities, local communities and the private sector are expected to play an increasing role in the utilization and sustainable use of groundwater.
*1 Definitions and principles of environmental sustainability in NWP include the following elements:a. to protect, conserve and manage natural resources and ecosystems while orienting technological, economic and institutional changes to
meet the needs of the present and future generations;b. to ensure the rate of consumption of natural resources does not exceed the rate of their regeneration;c. to include consideration of all aspects of the water cycle and all uses for sustainable water resources.
(Source: Government of Nepal 2002)
101
Chapter3.9 NepalWEPA Outlook on Water Environmental Management in Asia 2012
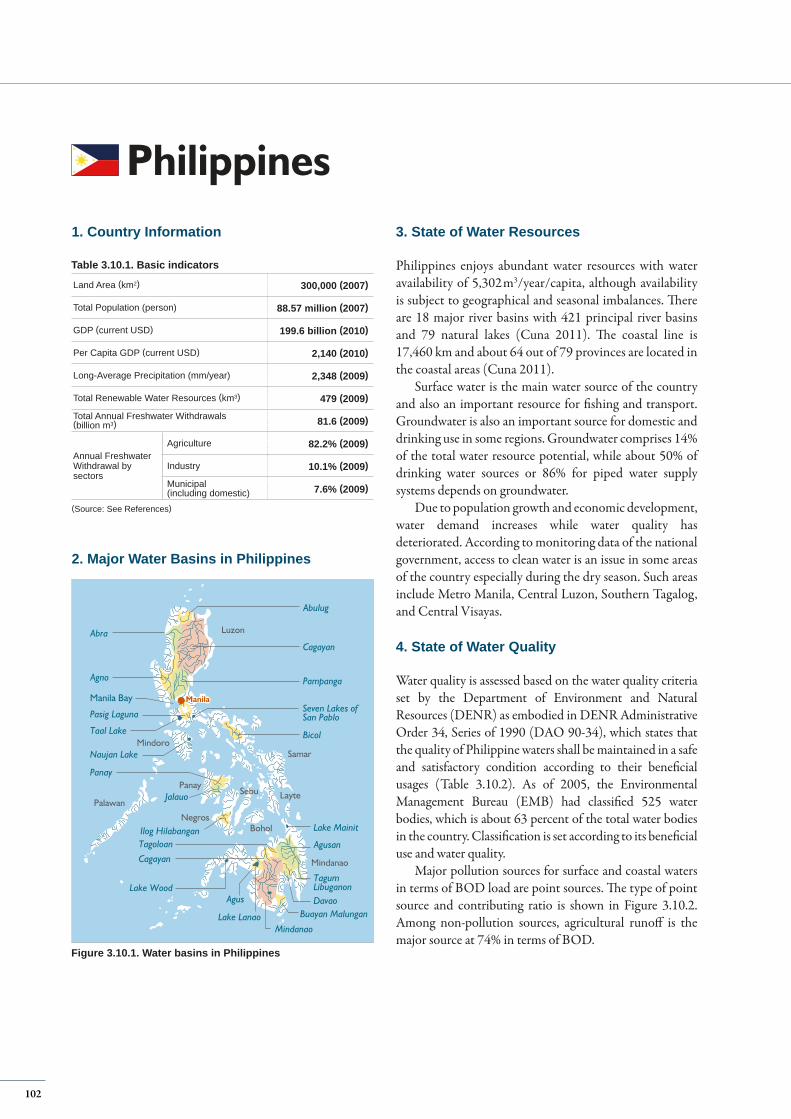
Cagayan
Abulug
Pampanga
Seven Lakes ofSan Pablo
Abra
Agno
Pasig Laguna
Taal Lake
Naujan Lake
Bicol
Panay
Jalauo
Ilog HilabanganTagoloan
Cagayan
Lake Wood
Lake LanaoMindanao
Buayan MalunganDavao
TagumLibuganon
Agusan
Lake Mainit
Agus
ManilaManila
Palawan
Negros
Sebu Layte
Samar
Panay
Mindoro
Luzon
Mindanao
Manila Bay
Bohol
Land Area (km2) 300,000 (2007)
Total Population (person) 88.57 million (2007)
GDP (current USD) 199.6 billion (2010)
Per Capita GDP (current USD) 2,140 (2010)
Long-Average Precipitation (mm/year) 2,348 (2009)
Total Renewable Water Resources (km3) 479 (2009)
Total Annual Freshwater Withdrawals(billion m3) 81.6 (2009)
Annual FreshwaterWithdrawal bysectors
Agriculture 82.2% (2009)
Industry 10.1% (2009)
Municipal(including domestic) 7.6% (2009)
1. Country Information
2. Major Water Basins in Philippines
(Source: See References)
Figure 3.10.1. Water basins in Philippines
Table 3.10.1. Basic indicators
3. State of Water Resources
Philippines enjoys abundant water resources with water availability of 5,302m3/year/capita, although availability is subject to geographical and seasonal imbalances. There are 18 major river basins with 421 principal river basins and 79 natural lakes (Cuna 2011). The coastal line is 17,460 km and about 64 out of 79 provinces are located in the coastal areas (Cuna 2011).
Surface water is the main water source of the country and also an important resource for fishing and transport. Groundwater is also an important source for domestic and drinking use in some regions. Groundwater comprises 14% of the total water resource potential, while about 50% of drinking water sources or 86% for piped water supply systems depends on groundwater.
Due to population growth and economic development, water demand increases while water quality has deteriorated. According to monitoring data of the national government, access to clean water is an issue in some areas of the country especially during the dry season. Such areas include Metro Manila, Central Luzon, Southern Tagalog, and Central Visayas.
4. State of Water Quality
Water quality is assessed based on the water quality criteria set by the Department of Environment and Natural Resources (DENR) as embodied in DENR Administrative Order 34, Series of 1990 (DAO 90-34), which states that the quality of Philippine waters shall be maintained in a safe and satisfactory condition according to their beneficial usages (Table 3.10.2). As of 2005, the Environmental Management Bureau (EMB) had classified 525 water bodies, which is about 63 percent of the total water bodies in the country. Classification is set according to its beneficial use and water quality.
Major pollution sources for surface and coastal waters in terms of BOD load are point sources. The type of point source and contributing ratio is shown in Figure 3.10.2. Among non-pollution sources, agricultural runoff is the major source at 74% in terms of BOD.
Philippines
102
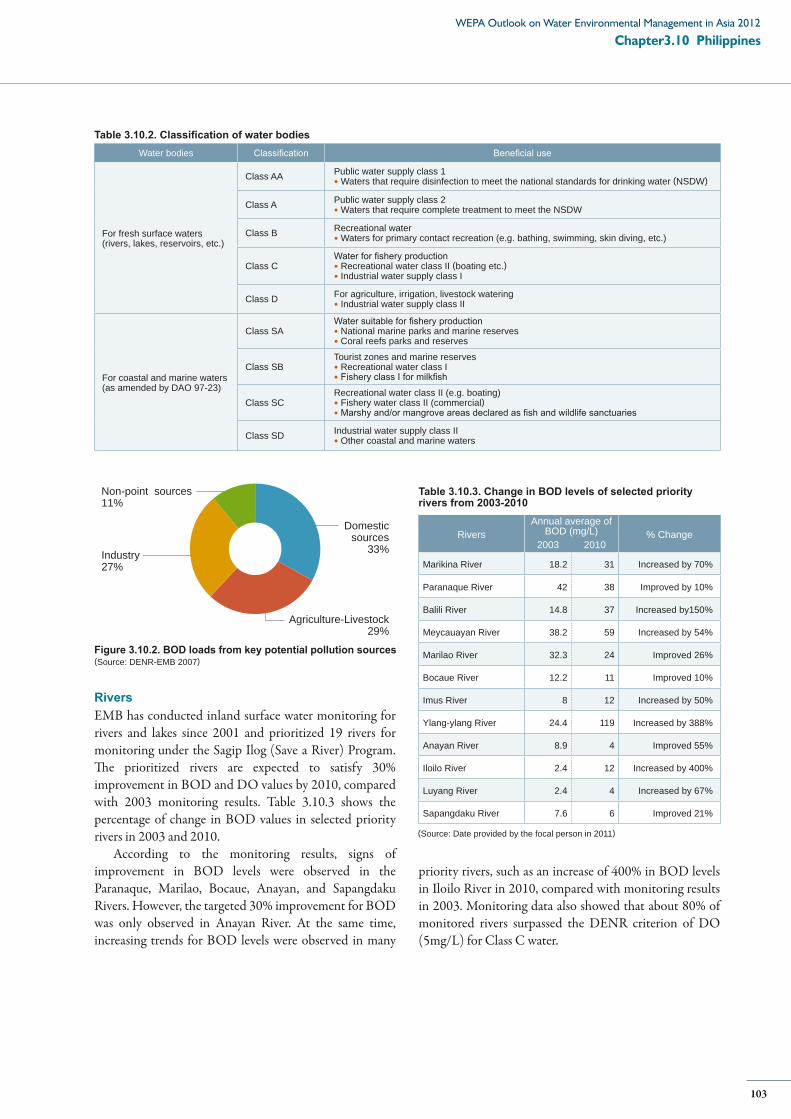
Water bodies Classification Beneficial use
For fresh surface waters(rivers, lakes, reservoirs, etc.)
Class AA Public water supply class 1• Waters that require disinfection to meet the national standards for drinking water (NSDW)
Class A Public water supply class 2• Waters that require complete treatment to meet the NSDW
Class B Recreational water• Waters for primary contact recreation (e.g. bathing, swimming, skin diving, etc.)
Class CWater for fishery production• Recreational water class II (boating etc.)• Industrial water supply class I
Class D For agriculture, irrigation, livestock watering• Industrial water supply class II
For coastal and marine waters(as amended by DAO 97-23)
Class SAWater suitable for fishery production• National marine parks and marine reserves• Coral reefs parks and reserves
Class SBTourist zones and marine reserves• Recreational water class I• Fishery class I for milkfish
Class SCRecreational water class II (e.g. boating)• Fishery water class II (commercial)• Marshy and/or mangrove areas declared as fish and wildlife sanctuaries
Class SD Industrial water supply class II• Other coastal and marine waters
Table 3.10.2. Classification of water bodies
Table 3.10.3. Change in BOD levels of selected priority rivers from 2003-2010
Domesticsources
33%
Agriculture-Livestock29%
Industry27%
Non-point sources11%
Figure 3.10.2. BOD loads from key potential pollution sources(Source: DENR-EMB 2007)
RiversAnnual average of
BOD (mg/L) % Change2003 2010
Marikina River 18.2 31 Increased by 70%
Paranaque River 42 38 Improved by 10%
Balili River 14.8 37 Increased by150%
Meycauayan River 38.2 59 Increased by 54%
Marilao River 32.3 24 Improved 26%
Bocaue River 12.2 11 Improved 10%
Imus River 8 12 Increased by 50%
Ylang-ylang River 24.4 119 Increased by 388%
Anayan River 8.9 4 Improved 55%
Iloilo River 2.4 12 Increased by 400%
Luyang River 2.4 4 Increased by 67%
Sapangdaku River 7.6 6 Improved 21%
(Source: Date provided by the focal person in 2011)
RiversEMB has conducted inland surface water monitoring for rivers and lakes since 2001 and prioritized 19 rivers for monitoring under the Sagip Ilog (Save a River) Program. The prioritized rivers are expected to satisfy 30% improvement in BOD and DO values by 2010, compared with 2003 monitoring results. Table 3.10.3 shows the percentage of change in BOD values in selected priority rivers in 2003 and 2010.
According to the monitoring results, signs of improvement in BOD levels were observed in the Paranaque, Marilao, Bocaue, Anayan, and Sapangdaku Rivers. However, the targeted 30% improvement for BOD was only observed in Anayan River. At the same time, increasing trends for BOD levels were observed in many
priority rivers, such as an increase of 400% in BOD levels in Iloilo River in 2010, compared with monitoring results in 2003. Monitoring data also showed that about 80% of monitored rivers surpassed the DENR criterion of DO (5mg/L) for Class C water.
103
Chapter3.10 PhilippinesWEPA Outlook on Water Environmental Management in Asia 2012
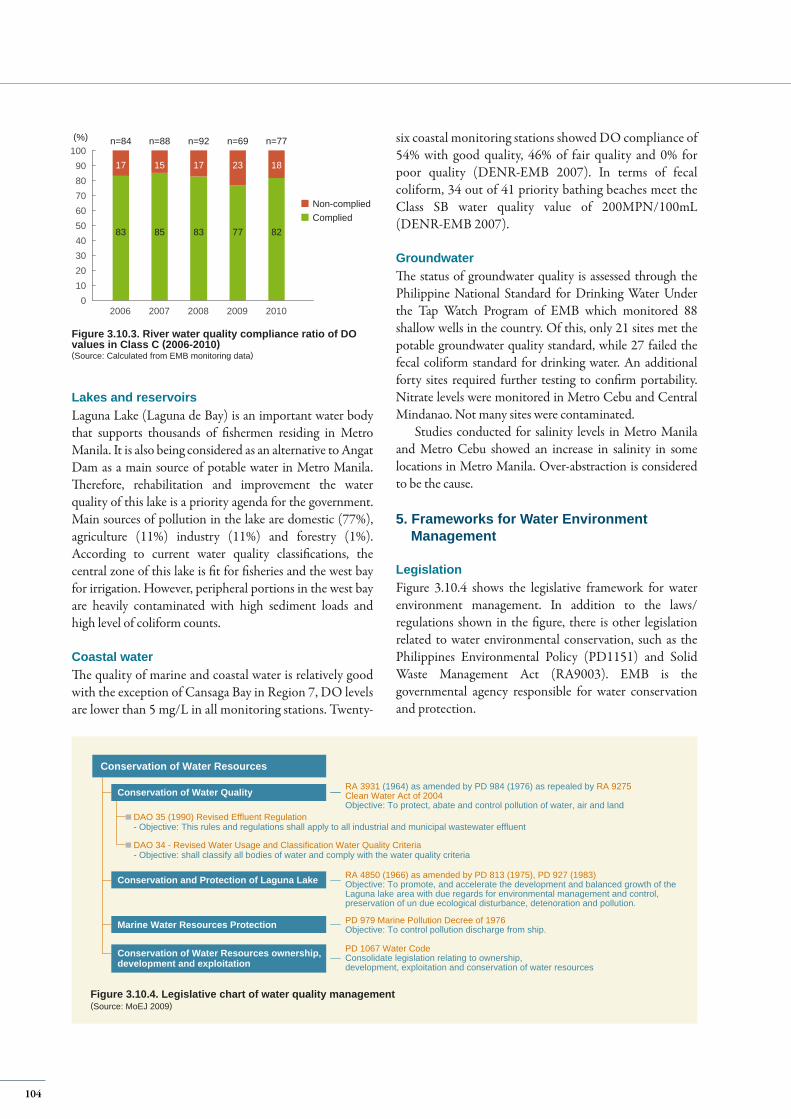
0102030405060708090
100
Non-compliedComplied
83
17
2006
n=84
85
15
2007
n=88
83
17
2008
n=92
77
23
2009
n=69
82
18
2010
n=77(%)
Figure 3.10.3. River water quality compliance ratio of DO values in Class C (2006-2010) (Source: Calculated from EMB monitoring data)
Lakes and reservoirs Laguna Lake (Laguna de Bay) is an important water body that supports thousands of fishermen residing in Metro Manila. It is also being considered as an alternative to Angat Dam as a main source of potable water in Metro Manila. Therefore, rehabilitation and improvement the water quality of this lake is a priority agenda for the government. Main sources of pollution in the lake are domestic (77%), agriculture (11%) industry (11%) and forestry (1%). According to current water quality classifications, the central zone of this lake is fit for fisheries and the west bay for irrigation. However, peripheral portions in the west bay are heavily contaminated with high sediment loads and high level of coliform counts.
Coastal waterThe quality of marine and coastal water is relatively good with the exception of Cansaga Bay in Region 7, DO levels are lower than 5 mg/L in all monitoring stations. Twenty-
six coastal monitoring stations showed DO compliance of 54% with good quality, 46% of fair quality and 0% for poor quality (DENR-EMB 2007). In terms of fecal coliform, 34 out of 41 priority bathing beaches meet the Class SB water quality value of 200MPN/100mL (DENR-EMB 2007).
GroundwaterThe status of groundwater quality is assessed through the Philippine National Standard for Drinking Water Under the Tap Watch Program of EMB which monitored 88 shallow wells in the country. Of this, only 21 sites met the potable groundwater quality standard, while 27 failed the fecal coliform standard for drinking water. An additional forty sites required further testing to confirm portability. Nitrate levels were monitored in Metro Cebu and Central Mindanao. Not many sites were contaminated.
Studies conducted for salinity levels in Metro Manila and Metro Cebu showed an increase in salinity in some locations in Metro Manila. Over-abstraction is considered to be the cause.
5. Frameworks for Water Environment Management
LegislationFigure 3.10.4 shows the legislative framework for water environment management. In addition to the laws/regulations shown in the figure, there is other legislation related to water environmental conservation, such as the Philippines Environmental Policy (PD1151) and Solid Waste Management Act (RA9003). EMB is the governmental agency responsible for water conservation and protection.
Conservation of Water Resources
DAO 35 (1990) Revised Effluent Regulation- Objective: This rules and regulations shall apply to all industrial and municipal wastewater effluent
DAO 34 - Revised Water Usage and Classification Water Quality Criteria- Objective: shall classify all bodies of water and comply with the water quality criteria
RA 3931 (1964) as amended by PD 984 (1976) as repealed by RA 9275Clean Water Act of 2004Objective: To protect, abate and control pollution of water, air and land
Conservation of Water Quality
RA 4850 (1966) as amended by PD 813 (1975), PD 927 (1983)Objective: To promote, and accelerate the development and balanced growth of the Laguna lake area with due regards for environmental management and control,preservation of un due ecological disturbance, detenoration and pollution.
Conservation and Protection of Laguna Lake
PD 1067 Water CodeConsolidate legislation relating to ownership,development, exploitation and conservation of water resources
Conservation of Water Resources ownership,development and exploitation
PD 979 Marine Pollution Decree of 1976Objective: To control pollution discharge from ship.Marine Water Resources Protection
Figure 3.10.4. Legislative chart of water quality management(Source: MoEJ 2009)
104
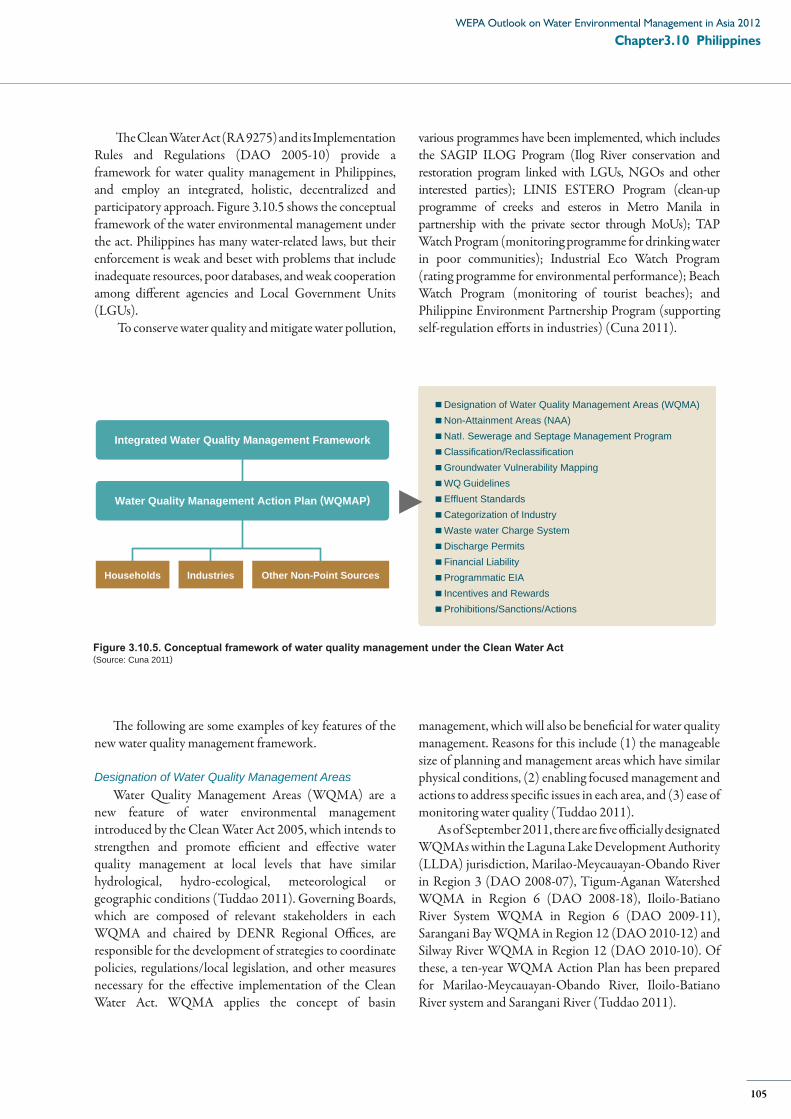
The Clean Water Act (RA 9275) and its Implementation Rules and Regulations (DAO 2005-10) provide a framework for water quality management in Philippines, and employ an integrated, holistic, decentralized and participatory approach. Figure 3.10.5 shows the conceptual framework of the water environmental management under the act. Philippines has many water-related laws, but their enforcement is weak and beset with problems that include inadequate resources, poor databases, and weak cooperation among different agencies and Local Government Units (LGUs).
To conserve water quality and mitigate water pollution,
The following are some examples of key features of the new water quality management framework.
Designation of Water Quality Management AreasWater Quality Management Areas (WQMA) are a
new feature of water environmental management introduced by the Clean Water Act 2005, which intends to strengthen and promote efficient and effective water quality management at local levels that have similar hydrological, hydro-ecological, meteorological or geographic conditions (Tuddao 2011). Governing Boards, which are composed of relevant stakeholders in each WQMA and chaired by DENR Regional Offices, are responsible for the development of strategies to coordinate policies, regulations/local legislation, and other measures necessary for the effective implementation of the Clean Water Act. WQMA applies the concept of basin
Designation of Water Quality Management Areas (WQMA)Non-Attainment Areas (NAA)NatI. Sewerage and Septage Management ProgramClassification/ReclassificationGroundwater Vulnerability MappingWQ GuidelinesEffluent StandardsCategorization of IndustryWaste water Charge SystemDischarge PermitsFinancial LiabilityProgrammatic EIAIncentives and RewardsProhibitions/Sanctions/Actions
Households Industries Other Non-Point Sources
Integrated Water Quality Management Framework
Water Quality Management Action Plan (WQMAP)
Figure 3.10.5. Conceptual framework of water quality management under the Clean Water Act (Source: Cuna 2011)
various programmes have been implemented, which includes the SAGIP ILOG Program (Ilog River conservation and restoration program linked with LGUs, NGOs and other interested parties); LINIS ESTERO Program (clean-up programme of creeks and esteros in Metro Manila in partnership with the private sector through MoUs); TAP Watch Program (monitoring programme for drinking water in poor communities); Industrial Eco Watch Program (rating programme for environmental performance); Beach Watch Program (monitoring of tourist beaches); and Philippine Environment Partnership Program (supporting self-regulation efforts in industries) (Cuna 2011).
management, which will also be beneficial for water quality management. Reasons for this include (1) the manageable size of planning and management areas which have similar physical conditions, (2) enabling focused management and actions to address specific issues in each area, and (3) ease of monitoring water quality (Tuddao 2011).
As of September 2011, there are five officially designated WQMAs within the Laguna Lake Development Authority (LLDA) jurisdiction, Marilao-Meycauayan-Obando River in Region 3 (DAO 2008-07), Tigum-Aganan Watershed WQMA in Region 6 (DAO 2008-18), Iloilo-Batiano River System WQMA in Region 6 (DAO 2009-11), Sarangani Bay WQMA in Region 12 (DAO 2010-12) and Silway River WQMA in Region 12 (DAO 2010-10). Of these, a ten-year WQMA Action Plan has been prepared for Marilao-Meycauayan-Obando River, Iloilo-Batiano River system and Sarangani River (Tuddao 2011).
105
Chapter3.10 PhilippinesWEPA Outlook on Water Environmental Management in Asia 2012
Designation of non-attainment areasIn cases where specific pollutants exceed water quality guidelines, DENR shall designate these areas as “non-attainment areas.” In the designated areas, pollution control measures are strengthened to comply with standards. For example, new sources of pollution will not be allowed in the non-attainment areas without plans to reduce total pollution loads from a facility below the guideline value.
Water pollution permits and wastewater charge systemThe wastewater charge formula was established in 2005 (DAO 2005-10) on the basis of payment to the government for discharging wastewater into water bodies in all water management areas. It is expected that the system is to be an incentive for those who discharge pollutants to reduce their pollution loads such as through modification of production process and investment in pollution control technologies. DENR also issues discharge permits for wastewater, which includes the allowable value of both quantity and quality of effluents, compliance schedule and monitoring requirements.
Incentives and rewardsFor outstanding and innovative projects, technologies, processes and techniques, and activities, rewards are provided to individuals, private organizations and other entities from the National Water Quality Management Fund. Incentives for industries are also provided, such as tax and duty exemptions for industrial wastewater treatment/collection facilities.
Ambient Water Quality StandardsAccording to the classification under the DENR AO No. 34 Series of 1990 (Table 3.10.2), the following water quality criteria has been set up for freshwater and coastal and marine water, respectively:(1) Water Quality Criteria for Conventional and Other
Pollutants Contributing to Aesthetics and Oxygen Demand
(2) Toxic and other Deleterious Substances (for protection of public health)
Monitoring of water quality in public water bodiesEMB and its Regional Offices conduct regular water quality monitoring throughout the country based on the parameters indicated in DAO 34. From 2001 to 2005, 238 water bodies were monitored either for classification or for regular water quality monitoring. Depending on the
resources, monitoring for these waters bodies is carried out monthly or quarterly according to the DENR-EMB Water Quality Monitoring manual (2009).
Effluent standards Section 14 of the Clean Water Act requires owners or operators of facilities that discharge regulated effluents to secure permits to discharge. Discharge permits are legal authorization granted by the DENR to discharge wastewater, provided that the discharge permit specifies among others, the quantity and quality of the effluent that said facilities are allowed to discharge into a particular water body, compliance schedule and monitoring requirements. DENR can also suspend and revoke permits when business entities are not in compliance with the rules and regulations and/or permit conditions. Effluent standards (DAO 35, 1990) are set as follows:a. Effluent standards for conventional and other pollutants
in Protected Waters Category I and II and in Inland Waters Class C. Standards were set for the following: color, temperature, pH, COD and settleable solids, BOD, TSS, TDS, surfactants (MBAS), oil and greases, phenolic substances and phenols. These standards apply to protected waters (both fresh and marine waters) and inland waters.
b. Effluent standards for toxic and other deleterious substances (maximum limits for protection of public health). For this category, effluent standards are set for arsenic, cadmium, chromium, cyanide, lead, mercury (Tot.), PCB, and formaldehyde. Different standard values for each substance are set in accordance with water classification. Stricter values are applied to “new planned industries.”
c. Effluent standards for conventional and other pollutants in Inland Waters Class D and Marine Waters Class SC and SD and other coastal waters which are not classified. The same parameters as in a. were considered with the exception of settleable solids.
d. Interim effluent standards for BOD applicable to old or existing industries producing strong industrial wastes (1990-1994).
e. Effluent standards for new industries producing strong wastes upon effect of the regulations and for all industries producing strong wastes starting 1 January 1995. The standard was based on BOD of raw wastewater. The standard covers old or existing industries producing strong waste whose wastewater treatment plants have yet to be constructed.
106
To set Industry-Specific Effluent Standards (ISES), a draft has been prepared with revision of current Industrial Effluent Standards. However, the draft still subject to revisions.
The Clean Water Act does not have standards for effluents discharges to land, but mandates that effluent emitters not affect the usability of land and groundwater resources. For effluent discharged for irrigation and other agricultural purposes, emitters should meet the guidelines of the Department of Agriculture (DA).
Effluent monitoringEffluent monitoring must be carried out by those who are required to comply with effluent standards, in principle. A manual on effluent monitoring was issued by DENR-EMB in 2009. In order to determine compliance by industrial establishments, a series of surveys and follow-up inspections are conducted by personnel in DENR’s sixteen regional offices.
6. Existing and Future Challenges
There are various challenges being faced in water environment management including the following elements.
Challenges in water quality management include the limited availability of funds and investments, which should be facilitated for effective and efficient enforcement of the requirements of the Clean Water Act 2004.
Water quality monitoring should be strengthened through capacity building, and ensuring the necessary resources and infrastructure.
Sharing of water quality monitoring data is also a challenge. Utilization of networks and strengthening of institutional partnerships could address this particular issue.
Management of wastes should be strengthened to protect water bodies from contamination, especially that of domestic solid waste and hazardous waste.
Strengthening institutional mechanisms and sustaining multi-sectoral participation in water quality management is necessary to promote water quality management.
Appropriate land use plans should be enforced to mitigate and prevent pollution both from point and non-point sources.
Strengthening of the following areas is necessary: non-point source management, coastal area management to avert impacts on coastal ecosystems, protection of groundwater quality, and rehabilitation of degraded water bodies.
Water quality management at the basin level should be promoted. Integration of water quality management strategies and action plans with basin level development/management strategies and master plans is a challenge that the country will face in the near future.
Incorporation of water quality parameters should be considered when river basin integrated information management systems (RBIMS) are designed/developed.
107
Chapter3.10 PhilippinesWEPA Outlook on Water Environmental Management in Asia 2012
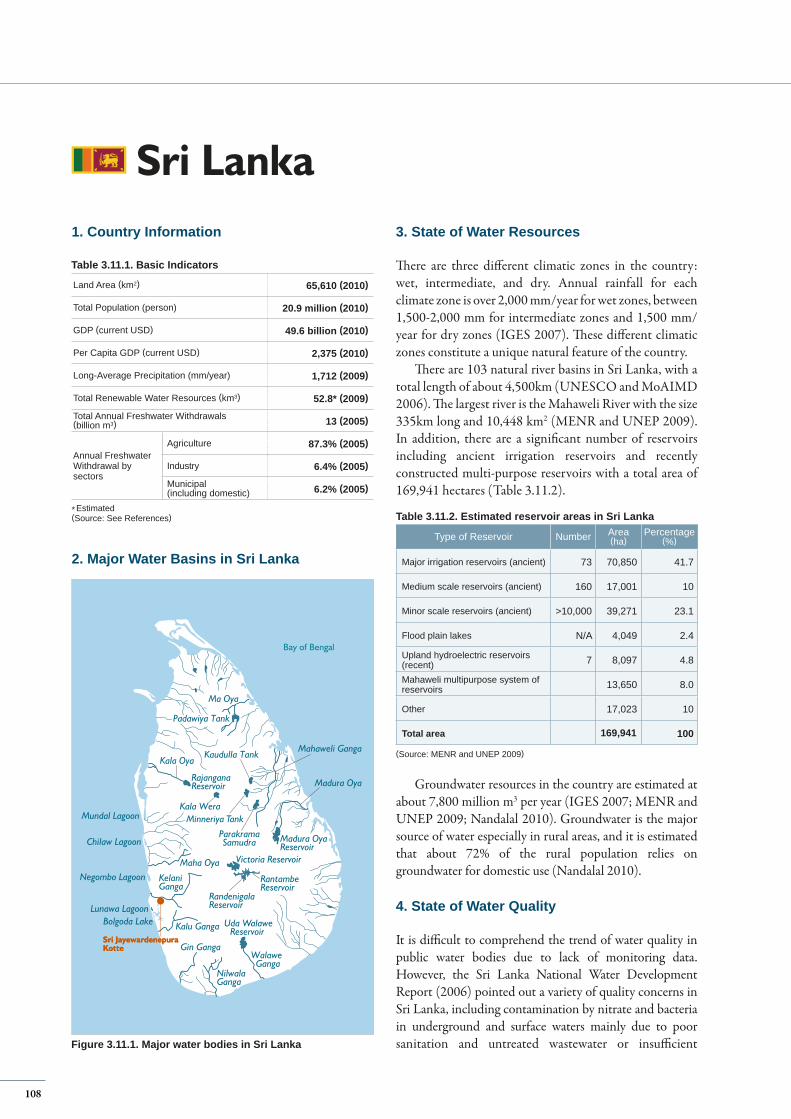
Sri Lanka
NilwalaGanga
Mahaweli Ganga
Madura Oya
RantambeReservoir RantambeReservoir
RandenigalaReservoirRandenigalaReservoir
Victoria Reservoir Victoria Reservoir
Kaudulla TankKaudulla Tank
Minneriya TankMinneriya Tank
RajanganaReservoirRajanganaReservoir
Mundal Lagoon
Chilaw Lagoon
Negombo Lagoon
Kala OyaKala Oya
Kala WeraKala Wera
ParakramaSamudra
Maha Oya
Kalu GangaKalu Ganga
Gin GangaGin GangaWalawe GangaWalawe Ganga
Uda WalaweReservoir
KelaniGangaKelaniGanga
Lunawa Lagoon
Bay of Bengal
Bolgoda Lake
Padawiya TankPadawiya Tank
Ma OyaMa Oya
Madura OyaReservoirMadura OyaReservoir
Sri JayewardenepuraKotteSri JayewardenepuraKotte
Land Area (km2) 65,610 (2010)
Total Population (person) 20.9 million (2010)
GDP (current USD) 49.6 billion (2010)
Per Capita GDP (current USD) 2,375 (2010)
Long-Average Precipitation (mm/year) 1,712 (2009)
Total Renewable Water Resources (km3) 52.8* (2009)
Total Annual Freshwater Withdrawals(billion m3) 13 (2005)
Annual FreshwaterWithdrawal bysectors
Agriculture 87.3% (2005)
Industry 6.4% (2005)
Municipal(including domestic) 6.2% (2005)
3. State of Water Resources
There are three different climatic zones in the country: wet, intermediate, and dry. Annual rainfall for each climate zone is over 2,000 mm/year for wet zones, between 1,500-2,000 mm for intermediate zones and 1,500 mm/year for dry zones (IGES 2007). These different climatic zones constitute a unique natural feature of the country.
There are 103 natural river basins in Sri Lanka, with a total length of about 4,500km (UNESCO and MoAIMD 2006). The largest river is the Mahaweli River with the size 335km long and 10,448 km2 (MENR and UNEP 2009). In addition, there are a significant number of reservoirs including ancient irrigation reservoirs and recently constructed multi-purpose reservoirs with a total area of 169,941 hectares (Table 3.11.2).
Type of Reservoir Number Area (ha)
Percentage (%)
Major irrigation reservoirs (ancient) 73 70,850 41.7
Medium scale reservoirs (ancient) 160 17,001 10
Minor scale reservoirs (ancient) >10,000 39,271 23.1
Flood plain lakes N/A 4,049 2.4
Upland hydroelectric reservoirs (recent) 7 8,097 4.8
Mahaweli multipurpose system of reservoirs 13,650 8.0
Other 17,023 10
Total area 169,941 100
Table 3.11.2. Estimated reservoir areas in Sri Lanka
(Source: MENR and UNEP 2009)
Groundwater resources in the country are estimated at about 7,800 million m3 per year (IGES 2007; MENR and UNEP 2009; Nandalal 2010). Groundwater is the major source of water especially in rural areas, and it is estimated that about 72% of the rural population relies on groundwater for domestic use (Nandalal 2010).
4. State of Water Quality
It is difficult to comprehend the trend of water quality in public water bodies due to lack of monitoring data. However, the Sri Lanka National Water Development Report (2006) pointed out a variety of quality concerns in Sri Lanka, including contamination by nitrate and bacteria in underground and surface waters mainly due to poor sanitation and untreated wastewater or insufficient
1. Country Information
2. Major Water Basins in Sri Lanka
* Estimated(Source: See References)
Figure 3.11.1. Major water bodies in Sri Lanka
Table 3.11.1. Basic Indicators
108
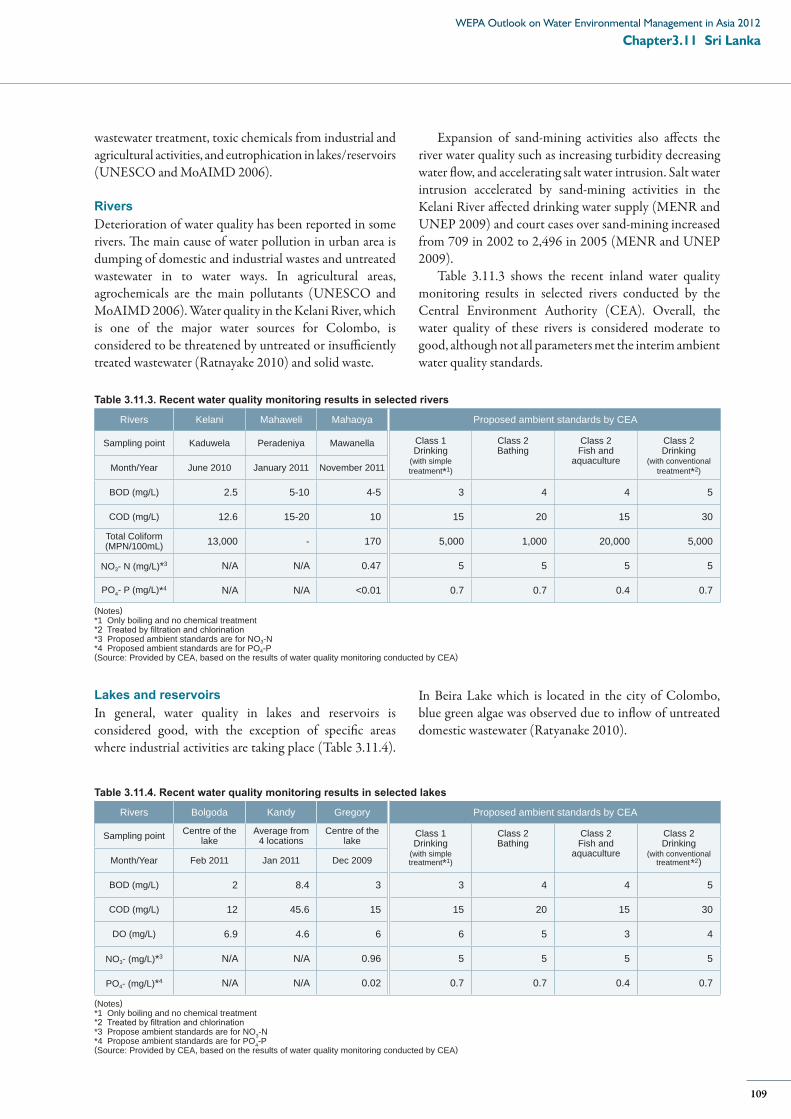
wastewater treatment, toxic chemicals from industrial and agricultural activities, and eutrophication in lakes/reservoirs (UNESCO and MoAIMD 2006).
RiversDeterioration of water quality has been reported in some rivers. The main cause of water pollution in urban area is dumping of domestic and industrial wastes and untreated wastewater in to water ways. In agricultural areas, agrochemicals are the main pollutants (UNESCO and MoAIMD 2006). Water quality in the Kelani River, which is one of the major water sources for Colombo, is considered to be threatened by untreated or insufficiently treated wastewater (Ratnayake 2010) and solid waste.
Lakes and reservoirsIn general, water quality in lakes and reservoirs is considered good, with the exception of specific areas where industrial activities are taking place (Table 3.11.4).
Expansion of sand-mining activities also affects the river water quality such as increasing turbidity decreasing water flow, and accelerating salt water intrusion. Salt water intrusion accelerated by sand-mining activities in the Kelani River affected drinking water supply (MENR and UNEP 2009) and court cases over sand-mining increased from 709 in 2002 to 2,496 in 2005 (MENR and UNEP 2009).
Table 3.11.3 shows the recent inland water quality monitoring results in selected rivers conducted by the Central Environment Authority (CEA). Overall, the water quality of these rivers is considered moderate to good, although not all parameters met the interim ambient water quality standards.
In Beira Lake which is located in the city of Colombo, blue green algae was observed due to inflow of untreated domestic wastewater (Ratyanake 2010).
Rivers Bolgoda Kandy Gregory Proposed ambient standards by CEA
Sampling point Centre of the lake
Average from4 locations
Centre of the lake
Class 1Drinking
(with simple treatment*1)
Class 2 Bathing
Class 2Fish and
aquaculture
Class 2Drinking
(with conventional treatment*2)Month/Year Feb 2011 Jan 2011 Dec 2009
BOD (mg/L) 2 8.4 3 3 4 4 5
COD (mg/L) 12 45.6 15 15 20 15 30
DO (mg/L) 6.9 4.6 6 6 5 3 4
NO3- (mg/L)*3 N/A N/A 0.96 5 5 5 5
PO4- (mg/L)*4 N/A N/A 0.02 0.7 0.7 0.4 0.7
Table 3.11.4. Recent water quality monitoring results in selected lakes
(Notes)*1 Only boiling and no chemical treatment*2 Treated by filtration and chlorination *3 Propose ambient standards are for NO3-N*4 Propose ambient standards are for PO4-P(Source: Provided by CEA, based on the results of water quality monitoring conducted by CEA)
109
Chapter3.11 Sri LankaWEPA Outlook on Water Environmental Management in Asia 2012
Rivers Kelani Mahaweli Mahaoya Proposed ambient standards by CEA
Sampling point Kaduwela Peradeniya Mawanella Class 1Drinking
(with simple treatment*1)
Class 2 Bathing
Class 2Fish and
aquaculture
Class 2Drinking
(with conventional treatment*2)Month/Year June 2010 January 2011 November 2011
BOD (mg/L) 2.5 5-10 4-5 3 4 4 5
COD (mg/L) 12.6 15-20 10 15 20 15 30
Total Coliform (MPN/100mL) 13,000 - 170 5,000 1,000 20,000 5,000
NO3- N (mg/L)*3 N/A N/A 0.47 5 5 5 5
PO4- P (mg/L)*4 N/A N/A <0.01 0.7 0.7 0.4 0.7
Table 3.11.3. Recent water quality monitoring results in selected rivers
(Notes)*1 Only boiling and no chemical treatment *2 Treated by filtration and chlorination *3 Proposed ambient standards are for NO3-N*4 Proposed ambient standards are for PO4-P(Source: Provided by CEA, based on the results of water quality monitoring conducted by CEA)
Coastal waterStudies on coastal water quality in Sri Lanka are few in number, although water pollution in coastal water bodies has grown over the past few decades due to rapid development activities and human settlements both in and outside coastal areas. The Coastal Resource Management Project (CRMP) implemented by the Ministry of Fisheries and Ocean Resources reported that the organic pollution in sea water of the Beruwala and Unawatuna areas attributed to high BOD values throughout the year (MENR and UNEP 2009).
Groundwater A common groundwater quality problem in the country is pathogenic pollution mainly caused by poor sanitation systems such as pit latrines (MENR and UNEP 2009; Nandalal 2010).
Nitrate is also identified in coastal aquifers such as in Jaffna (north coast) and Kalptiya (western coast) because of excessive fertilizer use and untreated wastewater (Nandalal 2010). High salinity is also an issue especially in coastal zones, which is exacerbated by excessive groundwater use. Fluoride and arsenic, which is naturally occuring, was identified in some areas of the country (Nandalal 2010).
5. Frameworks for Water Environment Management
The constitution of Sri Lanka states that protection, preservation and improvement of the environment for the benefit of the community is the responsibility of the state (Article 27(14)) and that every person in the country has a duty to “protect nature and conserve its riches” (Article 28). Surface water resources—rivers, streams and lakes, are under the control of the government under the Crown Lands Ordinance and the Constitution.
The Haritha Lanka Programme, approved in June 2008, is the current basic national policy document for environmental conservation in the country. The policy aims to promote sound environmental management in Sri Lanka by balancing the needs for social and economic development and environmental integrity. The “National Action Plan for Haritha Lanka Programme” was prepared in the same year, based on the programme. The action plan includes actions to be implemented between 2009-2016 under the supervision of the National Council for Sustainable Development (NCSD) (Box 3.11.2). The proposed strategies and actions in the Haritha Lanka Programme are a concerted effort of all relevant ministries and stakeholder institutions. As for the environment pollution control domain, the Central Environment Authority (CEA) prepares five year action plans. The 2012-2016 action plan is currently under preparation.
110
Box 3.11.1. Water quality under threat in Bolgoda Lake in Kelani River basin Bolgoda lake is a shallow brackish water body located between the southern and northern borders of the Kelani River basin, about 30 km south of Colombo. The lake water is used for agriculture and domestic purposes including recreational activities, and its wet land supports a rich bio-diversity of fauna. However, the release of industrial effluents, agricultural runoff and untreated domestic wastewater as well as other anthropogenic activities such as unplanned development activities, boat operating for recreational purposes, pose a serious threat to water quality of the lake and its eco system.
Several studies reported high values of total coliform and faecal coliform possibly due to disposal of untreated or partially treated wastewater from hotels and houses located on the banks. Presence of lead (Pb) and Chromium (Cr) due to industrial effluents is significant considering the proposed ambient water quality standard for category 4 class II waters (fish and aquatic life).
A recent study carried out by the CEA revealed that BOD ratios met the proposed ambient water quality standard for category 3 and 4 class II waters, while COD values exceeded the proposed standards at all points, and indicated that industrial wastewater contributed to the deterioration. High turbidity level was observed during the study (in September 2011) (CEA 2011).
Considering the importance of maintaining the quality of water, Bolgoda Lake was declared an Environmental Protection Area in 2009 under the provisions of the National Environmental Act No. 47 of 1980. (CEA 2011)
LegislationThe National Environmental Act No. 47 of 1980 (amended as Act No. 53 of 2000) is the country’s basic law protecting the environment in the country. Under the Act, National Environmental Regulations were set up to
Box 3.11.2. Water environmental conservation related targets in the National Action Plan for Haritha Lanka ProgramThe National Action Plan for the Haritha Lanka Programme consists of ten missions related to different environmental management domains. Among the missions, Mission 7 (Water for All and Always) and Mission 9 (Greening Industries) include specific strategies related to water environmental management. For coastal and marine water bodies, Mission 4 (Wise Use of Coastal Belt and Surrounding Sea) includes related actions.
Mission 7Strategy 4: “Keep drinking water sources free from contamination through proper zoning and control measures” is one
of the most popular water quality related targets. Actions include strengthening of inland water monitoring, identification of pollution sources, promotion of central wastewater treatment plants, and developing water conservation areas
Strategy 6: “Strictly enforce the polluter pays principle for water pollution industries/activities” outlines actions related to the Wastewater Charge Programme (WCP) which would be introduced by an amendment to the National Environmental Act. In addition to actions related to institutional arrangements for the introduction and implementation of WCP, the promotion of cleaner production principles and surveys on prescribed activities in the National Environmental Acts are also included in the strategy.
Strategy 8: “Reduce fertilizer leaching and eutrophication” is also a target to reduce pollution loads from agricultural activities. Soil erosion control is also included in the strategy.
Mission 9Strategy 1: “ Consolidate Cleaner Production in industries” aims to reduce the amount of resources wasted and
minimize water usage in industries. Promotion of environmental and social responsibility in small- and medium-sized enterprises, and appreciation and reward programmes for industries with good environmental performance are examples of actions included under this strategy.
Strategy 2: “Establish eco-industrial parks,” Strategy 3: “Certification of industries mostly related to ISO 14000 certification,” Strategy 4: “Greening the supply chain” and Strategy 6: “Incentives for environmental friendly investments” are not directly related to water quality conservation, but the actions under these strategies could contribute to the reduction of environmental loads from industrial activities.(Source: NCSD and Presidential Secretariat 2009)
stipulate wastewater quality standards to protect water quality in public water bodies. There is also a regulation on environment impact assessments (EIA). Other acts and ordinances related to water environmental management are illustrated in the following figure.
Environmental Conservation (Overall)
- Constitution of the Democratic Socialist Republic of Sri Lanka
Management of specific areas
- Mahaweli Authority Act No. 23 of 1979- North Western Provincial Environmental Statute No. 12 of 1990
- Effluents discharge standards Gazette No. 1534/18 and the prescribed activities for which a license is required in Gazette No. 1533/16
- Prescribed projects in Gazette No. 772/22 which apply the EIA process
- EPA - Environment Protection Areas declared under the sections 24C and 24D of the National Environmental Act No. 47 of 1980
- Local Authorities Act (for municipal and urban councils and Pradeshiya Sabah)
Other acts related to water environmental management
- Urban Development Authority Act No. 41 of 1978 as amended from time to time- Greater Colombo Economic Commission Law No. 4 of 1978 as amended by Act No. 49 of 1992
Marine Pollution Prevention Act of No. 35 of 2008Coast Conservation Act No.57 of 1984 as amended by Act No. 64 of 1988
Marine and costal water quality
- Irrigation Ordinance Chapter 453- National Water Supply & Drainage Board Act No.2 of 1974- Water Resources Board Act No. 29 of 1964
Water resource development/management
- National Environment Act No.47 of 1980 as amended by No. 56 of 1988 and No. 53 of 2000
Figure 3.11.2. Laws and regulations related to water environmental management(Source: created based on the information from CEA)
111
Chapter3.11 Sri LankaWEPA Outlook on Water Environmental Management in Asia 2012
Institutional arrangementsThe Ministry of Environment is the national authority that formulates policies and guidelines for the conservation of the environment and natural resources in Sri Lanka. Under the ministry, there are six agencies which are responsible for policy implementation, including the CEA and the Marine Environment Protection Authority (MEPA).
The CEA is was established in 1981 as the authority with regulatory powers for activities that have adverse impacts on the environment under the National Environment (Amendment) Acts No. 56 of 1988 and No. 53 of 2000. Industrial water pollution control is regulated under provisions of the NEA by CEA. In addition, there are different governmental agencies related to water environment management. MEPA is in charge of the management of the coastal and marine environment. National Water Supply and Drainage Board (NWS & DB) is responsible for water supply and sewerage treatment and management in the country. Other organizations which are responsible mainly for water resource management include the Department of Irrigation, Water Resources Board, and the Mahaweli Development Authority.
Governmental organizations related to construction, engineering services, housing and common amenities such as the Condominium Management Authority, National Housing Development Authority, and Board of Investment of Sri Lanka are not directly related to water environmental management, but they regulate development/industrial
activities which affect the condition of water quality. Local governments also play an important -role in water
environmental management. They are responsible for regulating low-impact industries and activities prescribed by orders issued under the National Environmental Act. They also regulate and control on-site sanitation systems such as pit latrines and septic tanks; public health inspectors are in charge of these tasks.
Ambient water quality standardsThere are no ambient water quality standards or classification of water bodies in Sri Lanka. Surface water quality is evaluated by potable water standards (SLS 614) and also by proposed ambient water quality standards which were prepared by CEA and is currently in the process of being approved. The proposed ambient water quality standards cover only surface water quality.
Monitoring of water quality in public water bodiesThere is no regular monitoring of surface and underground water quality except the monitoring of water intake quality conducted by the National Water Supply and Drainage Board. The CEA conducted ambient water quality monitoring projects for different river basins such as the Mahaweli River, Kandy Lake and Kelani River. Under the Pavithra Ganga Project, water quality has been monitored since 2001 (Box 3.11.3).
Box 3.11.3. Recent development of water environmental management: Pavithra Ganga Programme
The Pavithra Ganga (Clean River) Programme was initiated in 1998 by the Ministry of Environment of Sri Lanka to mitigate water pollution and conserve biodiversity of freshwater bodies in a comprehensive manner. Under the programme, a pilot project was conducted for the Kelani River which is the main drinking water source for the western province. The Pavithra Ganga project in the Kelani River included various activities such as the promotion of awareness programmes for industries especially on cleaner production, awareness programmes for school children, waste audits by the ministry in collaboration with local authorities, and tree-planting along river banks.
Water quality monitoring has been also strengthened under the project. Water quality has been monitored at 12 locations, and since 2003, water quality monitoring results have been made public through water quality information boards set up at selected locations along the river. The information boards help local people gain an awareness of the state of water quality in the river.
The project is a good showcase of comprehensive water environment management with the participation of national government agencies, as well as 13 local governments located in the Kelani River basin and other local stakeholders.(Source: Documentation from CEA, MENR 2008)
112
Environmental protection license systemEnvironmental protection licenses (EPL) are required for all entities in the country which discharge wastes to the environment, prescribed by a regulation published under the National Environmental Act. EPLs are issued by CEA based on the National Environmental Regulation No.1533/16 and No. 1534/18 of 2008. 138 activities in total are mandated to obtain EPLs by Governmental Notification (Gazette No. 1533/16, 2008). These activities are divided into three categories according to pollution load levels. In principle, EPLs are issued for water discharging activities which comply with national effluent standards (Ratnayake 2010). However, an industrial survey conducted by CEA found that some industries are functioning without EPL.
Effluent standardsCurrently, different kinds of effluent standards have been set based on point of discharge and type of effluent as follows.
General standards for discharge of effluent into inland surface waters
Tolerance limits for industrial effluents discharged on land for irrigation purposes
Tolerance limits for discharge of effluents into public sewers with central treatment plants
Tolerance limits for industrial and domestic effluents discharged into marine coastal areas
Tolerance limits for effluents from rubber factories discharged into inland surface waters
Tolerance limits for effluents from textile industries discharged into inland surface waters
Tolerance limits for effluents from tanning industries
Considering that current effluent standards do not well reflect local socio-economic and environmental conditions and have resulted in implementation problems, a revision of effluent standards is currently being proposed. Non-compliance actions shall be subject to fine or imprisonment based on the National Environmental Act.
Effluent monitoring In principle, effluent quality should be self monitored by discharging industries. However, significant number of industries do not monitor effluent quality of their discharging effluent.
The CEA occasionally monitors effluents discharged from industries/activities which are suspected of non-compliance with effluent standards. It also checks effluent quality based on complaints received from the general public.
6. Existing and Future Challenges
There has been a positive development in the development of a water quality management framework in past decades in Sri Lanka. On the other hand, various challenges remain to ensure implementation of water pollution control measures.
i) Organization: There is no umbrella body to regulate water issues and therefore, water resources/quality are managed by different agencies based on their area of interest. Coordination among agencies should be strengthened to ensure comprehensive water management in the country.
ii) Legislation: Ambient water quality standards and classification of water bodies should be established to strengthen water pollution control. Draft ambient water quality standards are now awaiting approval.
iii) Scientific data: Lack of baseline data is one of the critical challenges in promoting water quality management. The availability of data, as well as accessibility to data stored in different institutions is an issue. Financial and institutional arrangements should be improved to establish systematic data collection and periodical analysis systems.
iv) Awareness: Unwillingness by industries and the general public to contribute to water quality management is a barrier to reduce pollution loads on public water bodies. Awareness programmes and consultation processes should be further promoted to ensure sound and sustainable management for a better water environment.
113
Chapter3.11 Sri LankaWEPA Outlook on Water Environmental Management in Asia 2012
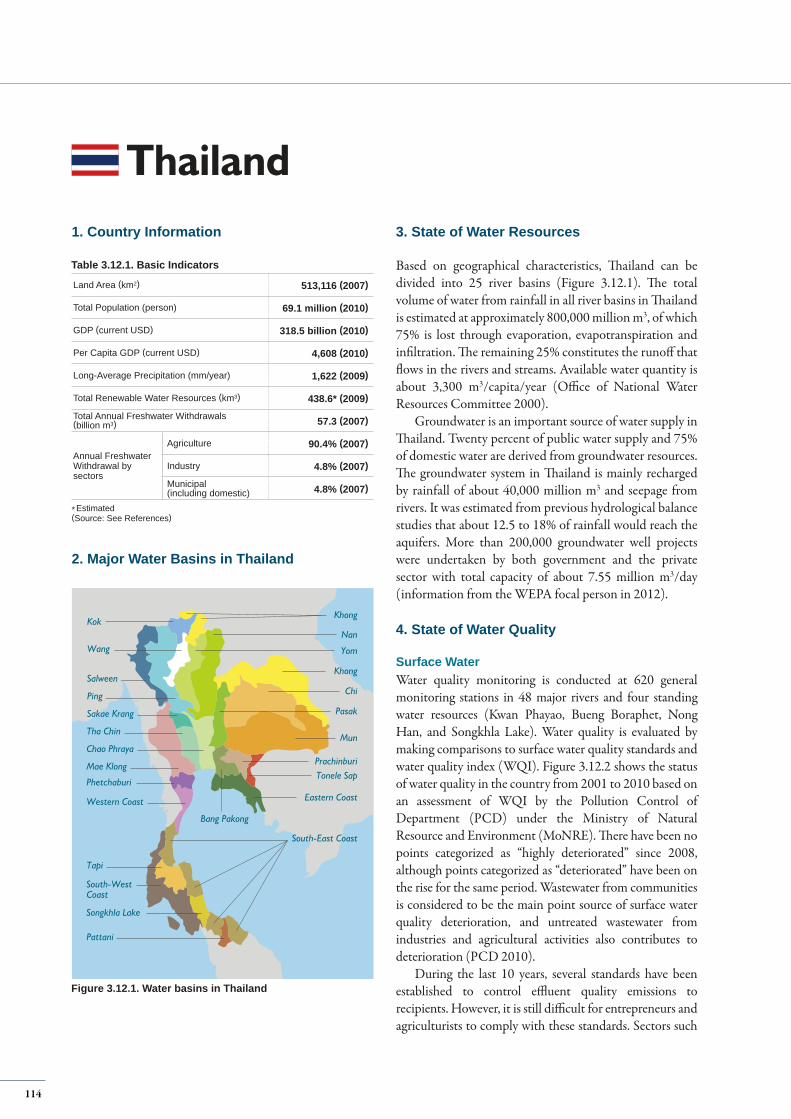
Land Area (km2) 513,116 (2007)
Total Population (person) 69.1 million (2010)
GDP (current USD) 318.5 billion (2010)
Per Capita GDP (current USD) 4,608 (2010)
Long-Average Precipitation (mm/year) 1,622 (2009)
Total Renewable Water Resources (km3) 438.6* (2009)
Total Annual Freshwater Withdrawals(billion m3) 57.3 (2007)
Annual FreshwaterWithdrawal bysectors
Agriculture 90.4% (2007)
Industry 4.8% (2007)
Municipal(including domestic) 4.8% (2007)
1. Country Information
* Estimated(Source: See References)
Table 3.12.1. Basic Indicators
3. State of Water Resources
Based on geographical characteristics, Thailand can be divided into 25 river basins (Figure 3.12.1). The total volume of water from rainfall in all river basins in Thailand is estimated at approximately 800,000 million m3, of which 75% is lost through evaporation, evapotranspiration and infiltration. The remaining 25% constitutes the runoff that flows in the rivers and streams. Available water quantity is about 3,300 m3/capita/year (Office of National Water Resources Committee 2000).
Groundwater is an important source of water supply in Thailand. Twenty percent of public water supply and 75% of domestic water are derived from groundwater resources. The groundwater system in Thailand is mainly recharged by rainfall of about 40,000 million m3 and seepage from rivers. It was estimated from previous hydrological balance studies that about 12.5 to 18% of rainfall would reach the aquifers. More than 200,000 groundwater well projects were undertaken by both government and the private sector with total capacity of about 7.55 million m3/day (information from the WEPA focal person in 2012).
4. State of Water Quality
Surface WaterWater quality monitoring is conducted at 620 general monitoring stations in 48 major rivers and four standing water resources (Kwan Phayao, Bueng Boraphet, Nong Han, and Songkhla Lake). Water quality is evaluated by making comparisons to surface water quality standards and water quality index (WQI). Figure 3.12.2 shows the status of water quality in the country from 2001 to 2010 based on an assessment of WQI by the Pollution Control of Department (PCD) under the Ministry of Natural Resource and Environment (MoNRE). There have been no points categorized as “highly deteriorated” since 2008, although points categorized as “deteriorated” have been on the rise for the same period. Wastewater from communities is considered to be the main point source of surface water quality deterioration, and untreated wastewater from industries and agricultural activities also contributes to deterioration (PCD 2010).
During the last 10 years, several standards have been established to control effluent quality emissions to recipients. However, it is still difficult for entrepreneurs and agriculturists to comply with these standards. Sectors such
Thailand
Sakae Krang
Ping
Tha Chin
Chao Phraya
Mae Klong
Phetchaburi
Western Coast
South-WestCoast
Tapi
Songkhla Lake
Pattani
South-East Coast
Tonele SapPrachinburi
Eastern Coast
Bang Pakong
Salween
Kok
WangNan
Yom
Pasak
Khong
Khong
Chi
Mun
2. Major Water Basins in Thailand
Figure 3.12.1. Water basins in Thailand
114
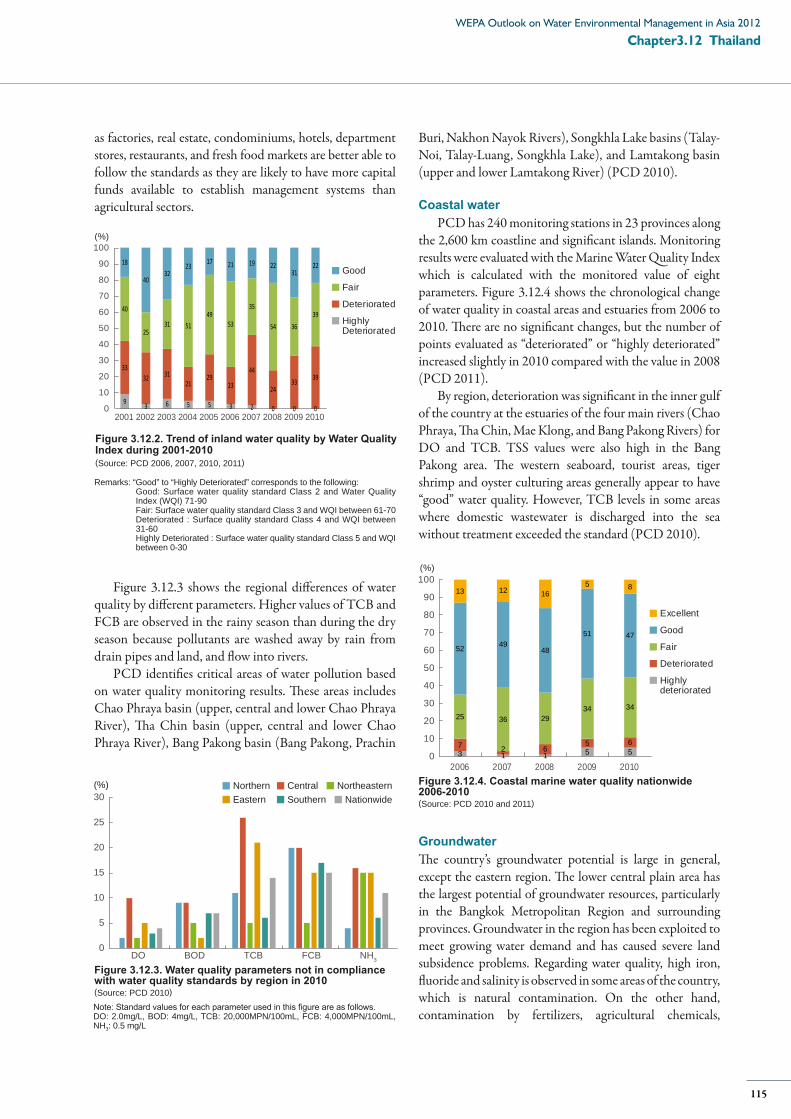
as factories, real estate, condominiums, hotels, department stores, restaurants, and fresh food markets are better able to follow the standards as they are likely to have more capital funds available to establish management systems than agricultural sectors.
Good
Fair
Deteriorated
HighlyDeteriorated
9 3 6 5 5 3 2 0 0 0
3332 31
2129
23
44
2433 39
40
2531 51
4953
35
54 3639
18
4032
23 17 21 19 2231
22
0
10
20
30
40
50
60
70
80
90
100
2001 2002 2003 2004 2005 2006 2007 2008 2009 2010
(%)
Figure 3.12.2. Trend of inland water quality by Water Quality Index during 2001-2010 (Source: PCD 2006, 2007, 2010, 2011)
Figure 3.12.3 shows the regional differences of water quality by different parameters. Higher values of TCB and FCB are observed in the rainy season than during the dry season because pollutants are washed away by rain from drain pipes and land, and flow into rivers.
PCD identifies critical areas of water pollution based on water quality monitoring results. These areas includes Chao Phraya basin (upper, central and lower Chao Phraya River), Tha Chin basin (upper, central and lower Chao Phraya River), Bang Pakong basin (Bang Pakong, Prachin
0
5
10
15
20
25
30
DO BOD TCB FCB NH3
(%) Northern Central NortheasternEastern Southern Nationwide
Note: Standard values for each parameter used in this figure are as follows. DO: 2.0mg/L, BOD: 4mg/L, TCB: 20,000MPN/100mL, FCB: 4,000MPN/100mL, NH3: 0.5 mg/L
Figure 3.12.3. Water quality parameters not in compliance with water quality standards by region in 2010(Source: PCD 2010)
Buri, Nakhon Nayok Rivers), Songkhla Lake basins (Talay-Noi, Talay-Luang, Songkhla Lake), and Lamtakong basin (upper and lower Lamtakong River) (PCD 2010).
Coastal water PCD has 240 monitoring stations in 23 provinces along
the 2,600 km coastline and significant islands. Monitoring results were evaluated with the Marine Water Quality Index which is calculated with the monitored value of eight parameters. Figure 3.12.4 shows the chronological change of water quality in coastal areas and estuaries from 2006 to 2010. There are no significant changes, but the number of points evaluated as “deteriorated” or “highly deteriorated” increased slightly in 2010 compared with the value in 2008 (PCD 2011).
By region, deterioration was significant in the inner gulf of the country at the estuaries of the four main rivers (Chao Phraya, Tha Chin, Mae Klong, and Bang Pakong Rivers) for DO and TCB. TSS values were also high in the Bang Pakong area. The western seaboard, tourist areas, tiger shrimp and oyster culturing areas generally appear to have “good” water quality. However, TCB levels in some areas where domestic wastewater is discharged into the sea without treatment exceeded the standard (PCD 2010).
Excellent
Good
Fair
Deteriorated
Highlydeteriorated
3 1 1 5 57 2 6
5 6
25 36 2934 34
52 4948
51 47
13 12 165 8
0
10
20
30
40
50
60
70
80
90
100
2006 2007 2008 2009 2010
(%)
Figure 3.12.4. Coastal marine water quality nationwide 2006-2010(Source: PCD 2010 and 2011)
Groundwater The country’s groundwater potential is large in general, except the eastern region. The lower central plain area has the largest potential of groundwater resources, particularly in the Bangkok Metropolitan Region and surrounding provinces. Groundwater in the region has been exploited to meet growing water demand and has caused severe land subsidence problems. Regarding water quality, high iron, fluoride and salinity is observed in some areas of the country, which is natural contamination. On the other hand, contamination by fertilizers, agricultural chemicals,
Remarks: “Good” to “Highly Deteriorated” corresponds to the following:Good: Surface water quality standard Class 2 and Water Quality Index (WQI) 71-90 Fair: Surface water quality standard Class 3 and WQI between 61-70 Deteriorated : Surface quality standard Class 4 and WQI between 31-60 Highly Deteriorated : Surface water quality standard Class 5 and WQI between 0-30
115
Chapter3.12 ThailandWEPA Outlook on Water Environmental Management in Asia 2012

aquaculture and animal wastes have been identified in some regions. Leakage from waste dumping sites and petroleum wastes are also a cause of contamination. Examples have been observed in Pak Chong district (petroleum waste), Sating Phra and Songkhla Lakes (freshwater animal farming), Muang district, Lanphun, Rayong and Chon Buri provinces (VOCs), and Bang Pakong and Tha Chin River basins (agricultural wastes) (PCD 2010).
Sources of Water PollutionThe main sources of water pollution can be divided into three types as follows: 1) Domestic wastewater: The general public which
generates domestic sewage that is discharged into rivers and other bodies of water after undergoing primary treatment or no treatment at all. It was estimated that approximately 15 million m3/day or 2.77 million kg of BOD/day of wastewater generated by the population across the country is discharged into receiving waters and the environment. This includes the 2,008 municipalities considerably generating approximately 3.8 million m3/day, Bangkok Metropolis and Pattaya city generating about 2.7 million m3/day, and the areas of 5,767 local administration organizations contributing about 8.5 million m3/day.
2) Industrial wastewater: Industries which discharge processed wastes including by-products of various types of industrial operations. At present, many industries are located in high population density areas or mixed with residential areas in the city. Across the country, there are more than 120,000 industrial establishments of varying
sizes, carrying on a wide range of activities, located within the Inner Gulf. They produce a range of products.
3) Agricultural activities: Agricultural activities such as the use of chemical fertilizers, pesticides and animal wastes from feedlots. A considerable part of the fertilizer used for rice paddy fields is washed away by irrigation water and flows into rivers, estuaries, or other bodies of water. This fertilizer causes eutrophication and supports the growth of water hyacinths. This unwanted plant grows very fast, covering major areas of water bodies.
5. Frameworks for Water Environment Management
The constitution of Thailand (2007) stipulates that environmental protection and conservation under sustainable development principles and elimination of pollution which affects human health and welfare is the responsibility of the state (Section 5, part 8). Since 1992, the five-year national economic and social development plans have emphasized environmental conservation of the country. The 10th National Economic and Social Development Plan (2007-2011) emphasized the rehabilitation of natural resources and the environment by strengthening environmental management and increasing local community participation as key areas. The national plan does not include a detailed implementation or action plan, and in order to bring the environmental strategies in the plan into action, the related agencies have to formulate programmes, projects and measures based on the national plan (Box. 3.12.1).
Box. 3.12.1. Water environmental management policy in Thailand
Policy:1) Reduce BOD loads from domestic wastewater by using
Grease Traps and On-site method
2) Rehabilitate existing municipal wastewater facilities
3) Build wastewater treatment facilities where there is a water pollution crisis
4) Unite the Metropolitan Waterworks Authority and Wastewater Management Authority
5) Enforce Polluter Pays Principal (PPP): Producers of polluted water must be responsible for paying for the management of water pollution.
6) Promote and support private sector/public participation in co-investing and solving water pollution problems
The environmental policy on water pollution control for 2010-2014 was approved by the National Environmental Board on 30 October 2009. The summary of this policy is shown below.
(Source: Information from the WEPA focal person in 2012)
Prioritizing operational areas:Classifying wastewater management based on the result of prioritization of river basins and importance of municipal areas, which will help establish implementation plans into four phases as below (in order of priority):
Phase 1 : 2010-2011Phase 2 : 2012-2016Phase 3 : 2017-2031Phase 4 : 2032-2041
116
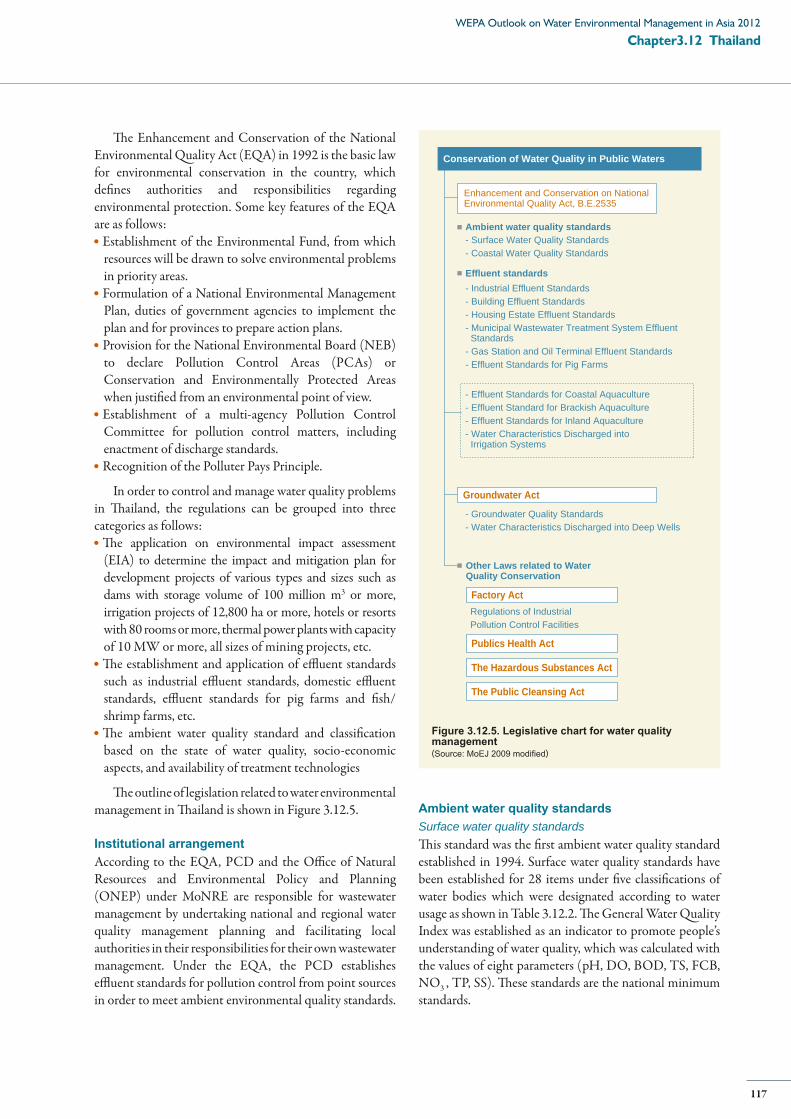
The Enhancement and Conservation of the National Environmental Quality Act (EQA) in 1992 is the basic law for environmental conservation in the country, which defines authorities and responsibilities regarding environmental protection. Some key features of the EQA are as follows:
Establishment of the Environmental Fund, from which resources will be drawn to solve environmental problems in priority areas.Formulation of a National Environmental Management Plan, duties of government agencies to implement the plan and for provinces to prepare action plans.Provision for the National Environmental Board (NEB) to declare Pollution Control Areas (PCAs) or Conservation and Environmentally Protected Areas when justified from an environmental point of view.Establishment of a multi-agency Pollution Control Committee for pollution control matters, including enactment of discharge standards.Recognition of the Polluter Pays Principle.
In order to control and manage water quality problems in Thailand, the regulations can be grouped into three categories as follows:
The application on environmental impact assessment (EIA) to determine the impact and mitigation plan for development projects of various types and sizes such as dams with storage volume of 100 million m3 or more, irrigation projects of 12,800 ha or more, hotels or resorts with 80 rooms or more, thermal power plants with capacity of 10 MW or more, all sizes of mining projects, etc.The establishment and application of effluent standards such as industrial effluent standards, domestic effluent standards, effluent standards for pig farms and fish/shrimp farms, etc.The ambient water quality standard and classification based on the state of water quality, socio-economic aspects, and availability of treatment technologies
The outline of legislation related to water environmental management in Thailand is shown in Figure 3.12.5.
Institutional arrangementAccording to the EQA, PCD and the Office of Natural Resources and Environmental Policy and Planning (ONEP) under MoNRE are responsible for wastewater management by undertaking national and regional water quality management planning and facilitating local authorities in their responsibilities for their own wastewater management. Under the EQA, the PCD establishes effluent standards for pollution control from point sources in order to meet ambient environmental quality standards.
Conservation of Water Quality in Public Waters
Enhancement and Conservation on NationalEnvironmental Quality Act, B.E.2535
Ambient water quality standards- Surface Water Quality Standards- Coastal Water Quality Standards
Effluent standards
- Groundwater Quality Standards- Water Characteristics Discharged into Deep Wells
Regulations of Industrial Pollution Control Facilities
- Effluent Standards for Coastal Aquaculture- Effluent Standard for Brackish Aquaculture- Effluent Standards for Inland Aquaculture- Water Characteristics Discharged into Irrigation Systems
Groundwater Act
Other Laws related to WaterQuality Conservation
Factory Act
Publics Health Act
The Hazardous Substances Act
The Public Cleansing Act
- Industrial Effluent Standards- Building Effluent Standards- Housing Estate Effluent Standards- Municipal Wastewater Treatment System Effluent Standards- Gas Station and Oil Terminal Effluent Standards- Effluent Standards for Pig Farms
Figure 3.12.5. Legislative chart for water quality management (Source: MoEJ 2009 modified)
Ambient water quality standards Surface water quality standards This standard was the first ambient water quality standard established in 1994. Surface water quality standards have been established for 28 items under five classifications of water bodies which were designated according to water usage as shown in Table 3.12.2. The General Water Quality Index was established as an indicator to promote people’s understanding of water quality, which was calculated with the values of eight parameters (pH, DO, BOD, TS, FCB, NO3 , TP, SS). These standards are the national minimum standards.
117
Chapter3.12 ThailandWEPA Outlook on Water Environmental Management in Asia 2012
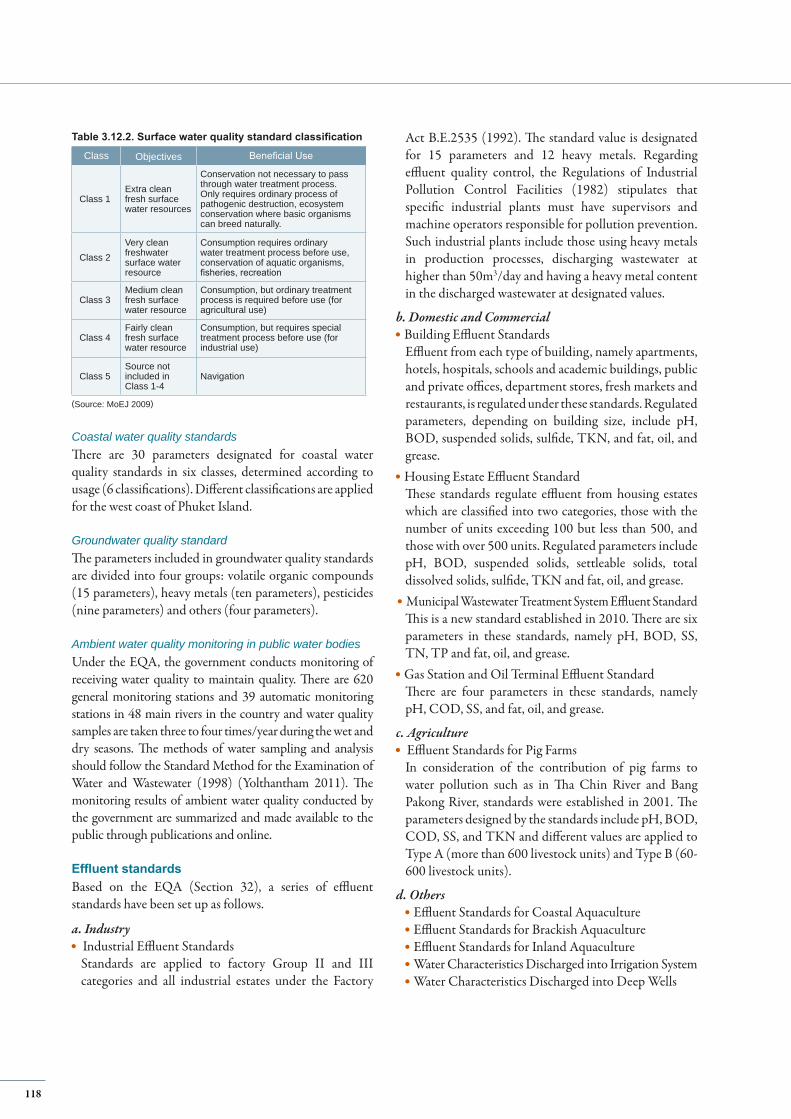
(Source: MoEJ 2009)
Class Objectives Beneficial Use
Class 1 Extra clean fresh surface water resources
Conservation not necessary to pass through water treatment process. Only requires ordinary process of pathogenic destruction, ecosystem conservation where basic organisms can breed naturally.
Class 2 Very clean freshwater surface water resource
Consumption requires ordinary water treatment process before use, conservation of aquatic organisms, fisheries, recreation
Class 3 Medium clean fresh surface water resource
Consumption, but ordinary treatment process is required before use (for agricultural use)
Class 4 Fairly clean fresh surface water resource
Consumption, but requires special treatment process before use (for industrial use)
Class 5 Source not included in Class 1-4
Navigation
Table 3.12.2. Surface water quality standard classification
Coastal water quality standards There are 30 parameters designated for coastal water quality standards in six classes, determined according to usage (6 classifications). Different classifications are applied for the west coast of Phuket Island.
Groundwater quality standardThe parameters included in groundwater quality standards are divided into four groups: volatile organic compounds (15 parameters), heavy metals (ten parameters), pesticides (nine parameters) and others (four parameters).
Ambient water quality monitoring in public water bodiesUnder the EQA, the government conducts monitoring of receiving water quality to maintain quality. There are 620 general monitoring stations and 39 automatic monitoring stations in 48 main rivers in the country and water quality samples are taken three to four times/year during the wet and dry seasons. The methods of water sampling and analysis should follow the Standard Method for the Examination of Water and Wastewater (1998) (Yolthantham 2011). The monitoring results of ambient water quality conducted by the government are summarized and made available to the public through publications and online.
Effluent standards Based on the EQA (Section 32), a series of effluent standards have been set up as follows.
a. Industry Industrial Effluent StandardsStandards are applied to factory Group II and III categories and all industrial estates under the Factory
Act B.E.2535 (1992). The standard value is designated for 15 parameters and 12 heavy metals. Regarding effluent quality control, the Regulations of Industrial Pollution Control Facilities (1982) stipulates that specific industrial plants must have supervisors and machine operators responsible for pollution prevention. Such industrial plants include those using heavy metals in production processes, discharging wastewater at higher than 50m3/day and having a heavy metal content in the discharged wastewater at designated values.
b. Domestic and CommercialBuilding Effluent Standards Effluent from each type of building, namely apartments, hotels, hospitals, schools and academic buildings, public and private offices, department stores, fresh markets and restaurants, is regulated under these standards. Regulated parameters, depending on building size, include pH, BOD, suspended solids, sulfide, TKN, and fat, oil, and grease.Housing Estate Effluent StandardThese standards regulate effluent from housing estates which are classified into two categories, those with the number of units exceeding 100 but less than 500, and those with over 500 units. Regulated parameters include pH, BOD, suspended solids, settleable solids, total dissolved solids, sulfide, TKN and fat, oil, and grease.
Municipal Wastewater Treatment System Effluent StandardThis is a new standard established in 2010. There are six parameters in these standards, namely pH, BOD, SS, TN, TP and fat, oil, and grease. Gas Station and Oil Terminal Effluent StandardThere are four parameters in these standards, namely pH, COD, SS, and fat, oil, and grease.
c. Agriculture Effluent Standards for Pig Farms In consideration of the contribution of pig farms to water pollution such as in Tha Chin River and Bang Pakong River, standards were established in 2001. The parameters designed by the standards include pH, BOD, COD, SS, and TKN and different values are applied to Type A (more than 600 livestock units) and Type B (60-600 livestock units).
d. OthersEffluent Standards for Coastal Aquaculture Effluent Standards for Brackish Aquaculture Effluent Standards for Inland Aquaculture Water Characteristics Discharged into Irrigation SystemWater Characteristics Discharged into Deep Wells
118
Effluent monitoringThe EQA requires the owner or possessor of point sources of pollution designated under the act to monitor the quality of effluent and collect statistics and data, as well as submit notes and reports (Section 70 and 80). The types of effluent to be monitored are categorized into four types: sewage-swine farms; land development, industrial estates and industrial zones, and Class A buildings (hotels, hospitals, condominiums, department stores, markets and restaurants). The point sources of water pollution were also monitored in three river basins such as Chao Phraya, Tha Chin, and Bang Pakong.
If the capability to treat or dispose wastewater fails to meet applicable standards, the owner has a duty to modify or improve it in conformity with the pollution control official’s directions. Fees, fines and civil liability and penal provisions are applied if violation are found or owners refuse to comply. It is a promising trend that all the sectors are willing to comply with the standards as it can be advantageous for business agreements as well as for better environmental quality which reflects the quality of life.
6. Existing and Future Challenges
Water environmental management in Thailand has been a priority for the country since 1992, in particular. Legislative frameworks have been developed and improved to promote implementation. The following aspects are pointed out as key issues for improvement and further promotion of water environmental conservation efforts (Yolthantham 2011).
Strengthening wastewater treatment Promotion of wastewater treatment remains a challenge in water environmental management in Thailand. In urbanized areas such as Bangkok, water pollution mainly caused by domestic wastewater remains a serious problem and therefore, sewage development has been promoted to mitigate water pollution. However, there have been a number of challenges in the operation and maintenance of wastewater treatment facilities, including lack of knowledgeable staff, enough funds for operation and maintenance, tariff setting and collection. To solve such problems and to ensure that the existing and future wastewater treatment systems can be operated and maintained effectively and sustainably, the Polluter Pays Principle (PPP) has been introduced and user charges imposed.
Promotion of public participation and voluntary approachIn the policy of the country, public participation and voluntary approaches by the private sector are encouraged to improve water quality in public waters. There are a lot of positive actions related to public participation. However, the communities and people still lack an understanding of waste water problems and awareness to protect the environment. Regarding the promotion of voluntary approaches by the private sector, a green procurement project for small and medium enterprises (SMEs) is now under development by the Thai government.
Promotion of basin management approachPromotion of basin management approaches is an emerging challenge for water environmental management, and water quality and water quantity management should be integrated to improve water quality by promoting the basin approach. The integration of various activities and policy measures related to water environmental conservation should be also be built upon current efforts and addressed further. Actions at the basin level are encouraged in community projects to promote such positive actions through the coordination of local actions, as seen in the Tha Chin River basin (Box. 3.12.2).
Box 3.12.2. River Basin Management Approach
New directions for urban water quality management are being considered based upon the assimilative capacity of receiving waters, budget availability, and prioritized projects within the basin-wide approach. The most flexible means of water quality management are being practiced such as simulation models, geographic information systems, and database management systems. Waste load allocation is being considered based upon the assimilative capacity of water bodies and guidelines to attain receiving water quality standards.
For areas where water pollution is serious, the Ministry of Natural Resources and Environment (MoNRE) set basin-level policies, which include the “Master Plan of Songkhla Lake Basin Development (2002)” and “Preventive Measures and Solving Water Quality in Chao Phraya, Bang Pakong, and Tha Chin River Basins (2007).” As a project-based activity, MoNRE “Prevention and Reclamation of Wastewater Problems in Lamtakong River Basins” was started in collaboration with other related ministries and local and regional authorities. Thus, river basin management approaches are being practiced, such as in the Tha Chin River Basin. Details can be found at http://welcome.to/thachin.(Source: Information from the WEPA focal person in 2012)
119
Chapter3.12 ThailandWEPA Outlook on Water Environmental Management in Asia 2012
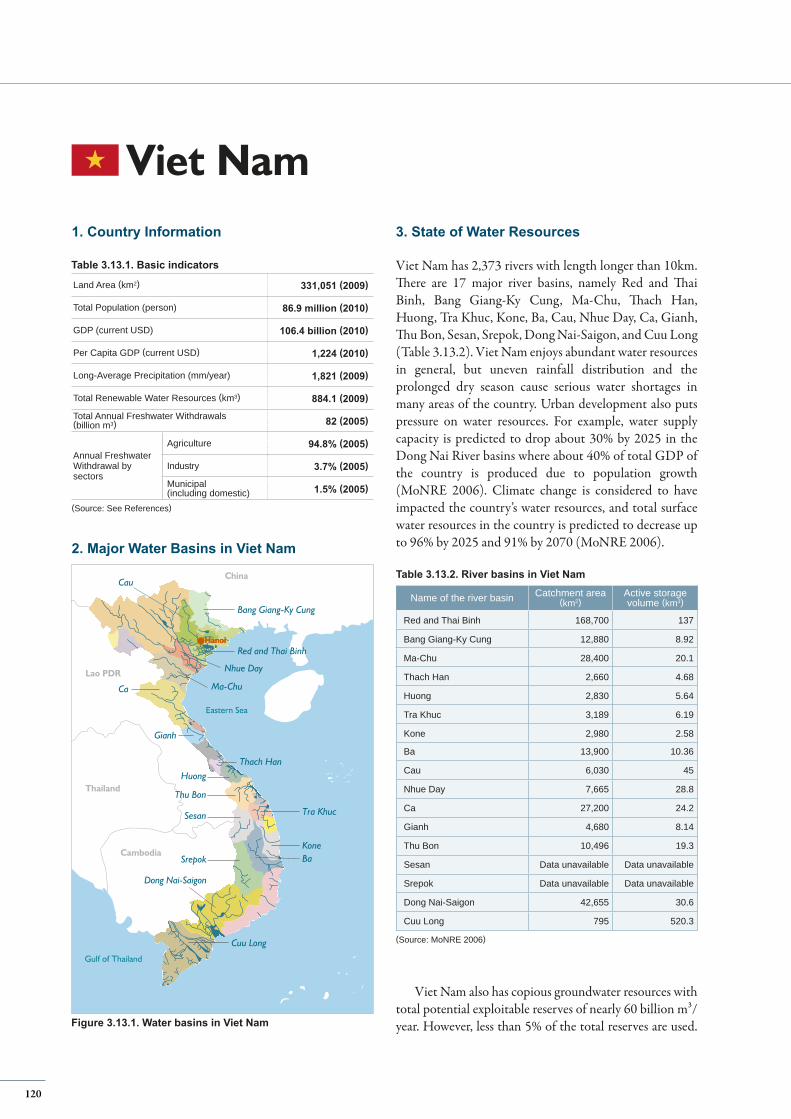
3. State of Water Resources
Viet Nam has 2,373 rivers with length longer than 10km. There are 17 major river basins, namely Red and Thai Binh, Bang Giang-Ky Cung, Ma-Chu, Thach Han, Huong, Tra Khuc, Kone, Ba, Cau, Nhue Day, Ca, Gianh, Thu Bon, Sesan, Srepok, Dong Nai-Saigon, and Cuu Long (Table 3.13.2). Viet Nam enjoys abundant water resources in general, but uneven rainfall distribution and the prolonged dry season cause serious water shortages in many areas of the country. Urban development also puts pressure on water resources. For example, water supply capacity is predicted to drop about 30% by 2025 in the Dong Nai River basins where about 40% of total GDP of the country is produced due to population growth (MoNRE 2006). Climate change is considered to have impacted the country’s water resources, and total surface water resources in the country is predicted to decrease up to 96% by 2025 and 91% by 2070 (MoNRE 2006).
Viet Nam also has copious groundwater resources with total potential exploitable reserves of nearly 60 billion m³/year. However, less than 5% of the total reserves are used.
Viet Nam
Lao PDR
China
Gulf of Thailand
Cambodia
Thailand
Cau
Dong Nai-Saigon
Ca
Red and Thai Binh
Ma-Chu
Thach Han
Ba
Bang Giang-Ky Cung
Gianh
SesanSesan
Srepok
Cuu Long
Thu BonThu Bon
Huong
Tra Khuc
Kone
Nhue Day
Eastern Sea
HanoiHanoi
1. Country Information
2. Major Water Basins in Viet Nam
(Source: See References)
Figure 3.13.1. Water basins in Viet Nam
Table 3.13.1. Basic indicators
Land Area (km2) 331,051 (2009)
Total Population (person) 86.9 million (2010)
GDP (current USD) 106.4 billion (2010)
Per Capita GDP (current USD) 1,224 (2010)
Long-Average Precipitation (mm/year) 1,821 (2009)
Total Renewable Water Resources (km3) 884.1 (2009)
Total Annual Freshwater Withdrawals(billion m3) 82 (2005)
Annual FreshwaterWithdrawal bysectors
Agriculture 94.8% (2005)
Industry 3.7% (2005)
Municipal(including domestic) 1.5% (2005)
Name of the river basin Catchment area (km2)
Active storage volume (km3)
Red and Thai Binh 168,700 137
Bang Giang-Ky Cung 12,880 8.92
Ma-Chu 28,400 20.1
Thach Han 2,660 4.68
Huong 2,830 5.64
Tra Khuc 3,189 6.19
Kone 2,980 2.58
Ba 13,900 10.36
Cau 6,030 45
Nhue Day 7,665 28.8
Ca 27,200 24.2
Gianh 4,680 8.14
Thu Bon 10,496 19.3
Sesan Data unavailable Data unavailable
Srepok Data unavailable Data unavailable
Dong Nai-Saigon 42,655 30.6
Cuu Long 795 520.3
Table 3.13.2. River basins in Viet Nam
(Source: MoNRE 2006)
120

On the other hand, groundwater is intensively exploited in some areas of the country such as in the Mekong Delta, and overexploitation of groundwater has resulted in falling water tables, associated further land subsidence, and salinity intrusion.
The use of water for agriculture is higher than other sectors. In urban areas, the need for water for domestic, service, and production purposes is increasing and has caused a depletion in water resources. Other environment degradations such as deforestation, inadequate solid waste management and impacts from development activities also affect the state of water resources in both quantity and quality.
4. State of Water Quality
Water quality in public water bodies is generally good in the upstream of rivers (MoNRE 2005). On the other hand, the downstream areas of major rivers, especially in cities, face serious water pollution which has accelerated due to increasing populations and growing economic activities. Wastewater from both industrial and domestic sources is not well treated and has become the source of organic pollution. Ninety percent of wastewater discharged from domestic sources and 70% from industrial zones and parks is not served by a centralized wastewater treatment system (Nguyen 2010). Poor sanitation elicits high E-coli values,
Figure 3.13.3 also shows water quality in surface water bodies in the country’s urban inner precincts and districts. Most lakes, ponds, canals and rivers have exceeded the BOD standard set by the National Technical Regulation on Surface Water Quality 08:2008/MoNRE, Type B2. Many rivers and canals have become receptacles for
seasonal changes in water quantity also affect the state of water quality—water quality in dry seasons is more deteriorated than that in rainy seasons.
The water quality of coastal waters has also deteriorated as a result of polluted river water flowing into the sea, and human activities such as aquaculture, waste dumping and oil spills increase pressure. Details on groundwater quality are not well defined due to a lack of information, but some parameters such as ammonia and coliform exceed standard values.
Rivers and lakes River water quality has declined in the downstream, especially in growing urban areas. Figure 3.13.2 shows the value of BOD5 at some monitoring points in the major rivers in urban areas. The trend shows the gradual improvement of water quality over a period of five years, but the value still exceeds 4mg/L, the currently permitted national standard for Category A1 (water for domestic water supply with appropriate treatment) at most points. Pollution in some canals is also serious in cities. For example, the BOD5 level of the Tham Luong-Vam Thuat canal in Ho Chi Minh City in 2009 greatly exceeded standards; it was eight times higher than the ambient water quality standard for Category B2 (water for water transportation and other purposes with demand for low-quality water). Untreated or insufficiently treated wastewater from industries and households is a major source of pollution.
wastewater and ambient water quality standards and many lakes in inner cities are affected by eutrophication. The surface water in these lakes becomes muddy and emits a strong odour which spoils the environment and appearance of Viet Nam’s cities.
121
Chapter3.13 Viet NamWEPA Outlook on Water Environmental Management in Asia 2012
BOD (mg/L) 2005 2006 2007 2008 2009 QCVN 08:2008(A1) QCVN 08:2008(B1)
16
14
12
10
8
6
4
2
0Red Riverin Hanoi
Cam Riverin Hai Phong
Lam Riverin Nghe An
Perfume Riverin Hue
Han Riverin Da Nang
Dong Nai Riverin Dong Nai
Sai Gon Riverin HCMC
Tien Riverin Tien Giang
Hau Riverin Can Tho
(Source: MoNRE 2010)Figure 3.13.2. Changes in annual average BOD5 content in major rivers (2005-2009)
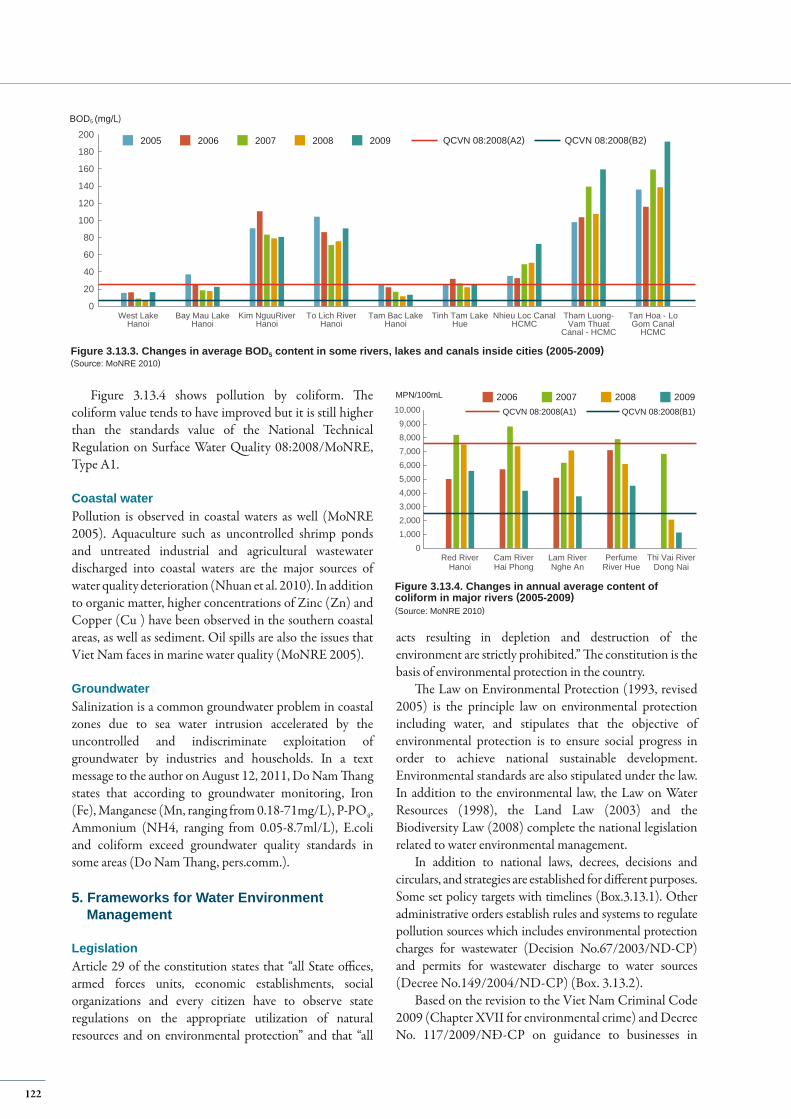
0
20
40
60
80
100
120
140
160
180
200
West LakeHanoi
Bay Mau LakeHanoi
Kim NguuRiverHanoi
To Lich RiverHanoi
Tam Bac LakeHanoi
Tinh Tam LakeHue
Nhieu Loc CanalHCMC
Tham Luong-Vam Thuat
Canal - HCMC
Tan Hoa - LoGom Canal
HCMC
2005 2006 2007 2008 2009 QCVN 08:2008(A2)
BOD5 (mg/L)
QCVN 08:2008(B2)
Figure 3.13.4 shows pollution by coliform. The coliform value tends to have improved but it is still higher than the standards value of the National Technical Regulation on Surface Water Quality 08:2008/MoNRE, Type A1.
Coastal water Pollution is observed in coastal waters as well (MoNRE 2005). Aquaculture such as uncontrolled shrimp ponds and untreated industrial and agricultural wastewater discharged into coastal waters are the major sources of water quality deterioration (Nhuan et al. 2010). In addition to organic matter, higher concentrations of Zinc (Zn) and Copper (Cu ) have been observed in the southern coastal areas, as well as sediment. Oil spills are also the issues that Viet Nam faces in marine water quality (MoNRE 2005).
Groundwater Salinization is a common groundwater problem in coastal zones due to sea water intrusion accelerated by the uncontrolled and indiscriminate exploitation of groundwater by industries and households. In a text message to the author on August 12, 2011, Do Nam Thang states that according to groundwater monitoring, Iron (Fe), Manganese (Mn, ranging from 0.18-71mg/L), P-PO4, Ammonium (NH4, ranging from 0.05-8.7ml/L), E.coli and coliform exceed groundwater quality standards in some areas (Do Nam Thang, pers.comm.).
5. Frameworks for Water Environment Management
Legislation Article 29 of the constitution states that “all State offices, armed forces units, economic establishments, social organizations and every citizen have to observe state regulations on the appropriate utilization of natural resources and on environmental protection” and that “all
acts resulting in depletion and destruction of the environment are strictly prohibited.” The constitution is the basis of environmental protection in the country.
The Law on Environmental Protection (1993, revised 2005) is the principle law on environmental protection including water, and stipulates that the objective of environmental protection is to ensure social progress in order to achieve national sustainable development. Environmental standards are also stipulated under the law. In addition to the environmental law, the Law on Water Resources (1998), the Land Law (2003) and the Biodiversity Law (2008) complete the national legislation related to water environmental management.
In addition to national laws, decrees, decisions and circulars, and strategies are established for different purposes. Some set policy targets with timelines (Box.3.13.1). Other administrative orders establish rules and systems to regulate pollution sources which includes environmental protection charges for wastewater (Decision No.67/2003/ND-CP) and permits for wastewater discharge to water sources (Decree No.149/2004/ND-CP) (Box. 3.13.2).
Based on the revision to the Viet Nam Criminal Code 2009 (Chapter XVII for environmental crime) and Decree No. 117/2009/NĐ-CP on guidance to businesses in
Red RiverHanoi
Cam RiverHai Phong
Lam RiverNghe An
PerfumeRiver Hue
Thi Vai RiverDong Nai
01,0002,0003,0004,0005,0006,0007,0008,0009,000
10,0002006 2007 2008 2009
QCVN 08:2008(A1)
MPN/100mL
QCVN 08:2008(B1)
Figure 3.13.4. Changes in annual average content of coliform in major rivers (2005-2009)(Source: MoNRE 2010)
122
(Source: MoNRE 2010)Figure 3.13.3. Changes in average BOD5 content in some rivers, lakes and canals inside cities (2005-2009)
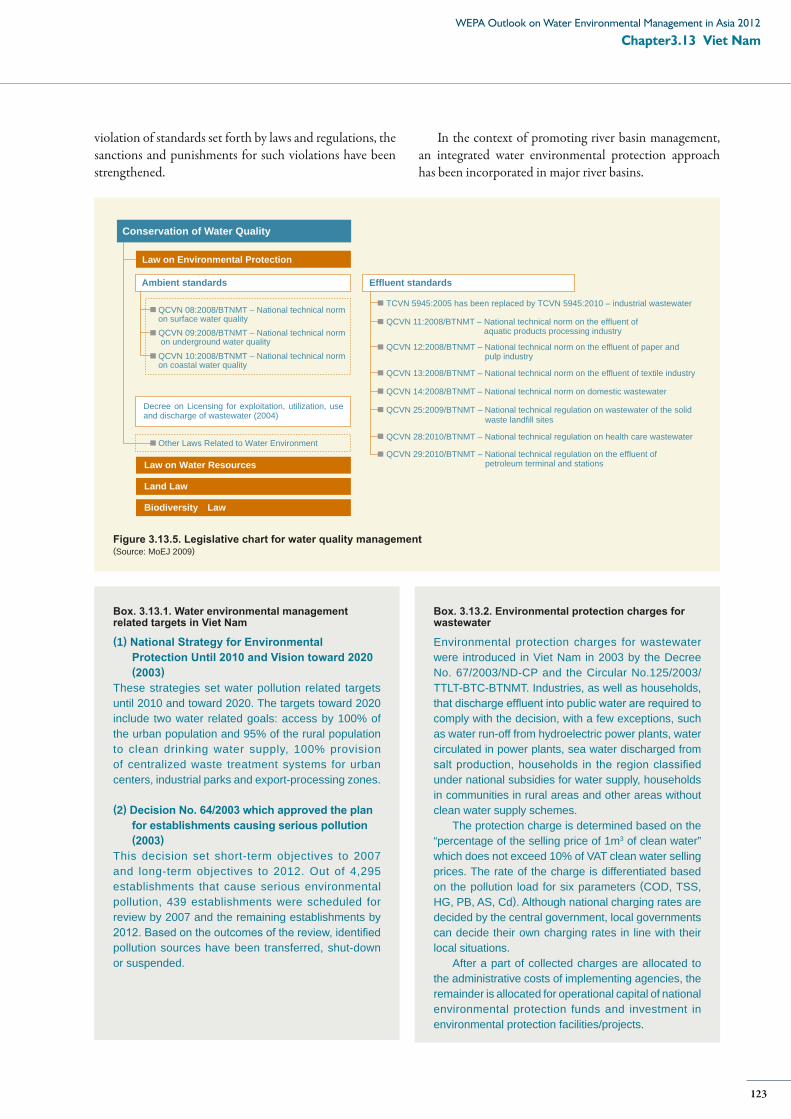
Box. 3.13.1. Water environmental management related targets in Viet Nam
Box. 3.13.2. Environmental protection charges for wastewater
(1) National Strategy for Environmental Protection Until 2010 and Vision toward 2020 (2003)
These strategies set water pollution related targets until 2010 and toward 2020. The targets toward 2020 include two water related goals: access by 100% of the urban population and 95% of the rural population to clean drinking water supply, 100% provision of centralized waste treatment systems for urban centers, industrial parks and export-processing zones.
(2) Decision No. 64/2003 which approved the plan for establishments causing serious pollution (2003)
This decision set short-term objectives to 2007 and long-term objectives to 2012. Out of 4,295 establishments that cause serious environmental pollution, 439 establishments were scheduled for review by 2007 and the remaining establishments by 2012. Based on the outcomes of the review, identified pollution sources have been transferred, shut-down or suspended.
Environmental protection charges for wastewater were introduced in Viet Nam in 2003 by the Decree No. 67/2003/ND-CP and the Circular No.125/2003/TTLT-BTC-BTNMT. Industries, as well as households, that discharge effluent into public water are required to comply with the decision, with a few exceptions, such as water run-off from hydroelectric power plants, water circulated in power plants, sea water discharged from salt production, households in the region classified under national subsidies for water supply, households in communities in rural areas and other areas without clean water supply schemes.
The protection charge is determined based on the “percentage of the selling price of 1m3 of clean water” which does not exceed 10% of VAT clean water selling prices. The rate of the charge is differentiated based on the pollution load for six parameters (COD, TSS, HG, PB, AS, Cd). Although national charging rates are decided by the central government, local governments can decide their own charging rates in line with their local situations.
After a part of collected charges are allocated to the administrative costs of implementing agencies, the remainder is allocated for operational capital of national environmental protection funds and investment in environmental protection facilities/projects.
violation of standards set forth by laws and regulations, the sanctions and punishments for such violations have been strengthened.
In the context of promoting river basin management, an integrated water environmental protection approach has been incorporated in major river basins.
123
Chapter3.13 Viet NamWEPA Outlook on Water Environmental Management in Asia 2012
Land Law
QCVN 08:2008/BTNMT – National technical normon surface water qualityQCVN 09:2008/BTNMT – National technical norm on underground water quality
QCVN 10:2008/BTNMT – National technical normon coastal water quality
TCVN 5945:2005 has been replaced by TCVN 5945:2010 – industrial wastewater
QCVN 11:2008/BTNMT – National technical norm on the effluent of aquatic products processing industry
QCVN 12:2008/BTNMT – National technical norm on the effluent of paper and pulp industry
QCVN 13:2008/BTNMT – National technical norm on the effluent of textile industry
QCVN 14:2008/BTNMT – National technical norm on domestic wastewater
Other Laws Related to Water Environment
Decree on Licensing for exploitation, utilization, use and discharge of wastewater (2004)
QCVN 25:2009/BTNMT – National technical regulation on wastewater of the solid waste landfill sites
QCVN 28:2010/BTNMT – National technical regulation on health care wastewater
QCVN 29:2010/BTNMT – National technical regulation on the effluent of petroleum terminal and stations
Biodiversity Law
Law on Water Resources
Law on Environmental Protection
Ambient standards Effluent standards
Conservation of Water Quality
(Source: MoEJ 2009)Figure 3.13.5. Legislative chart for water quality management
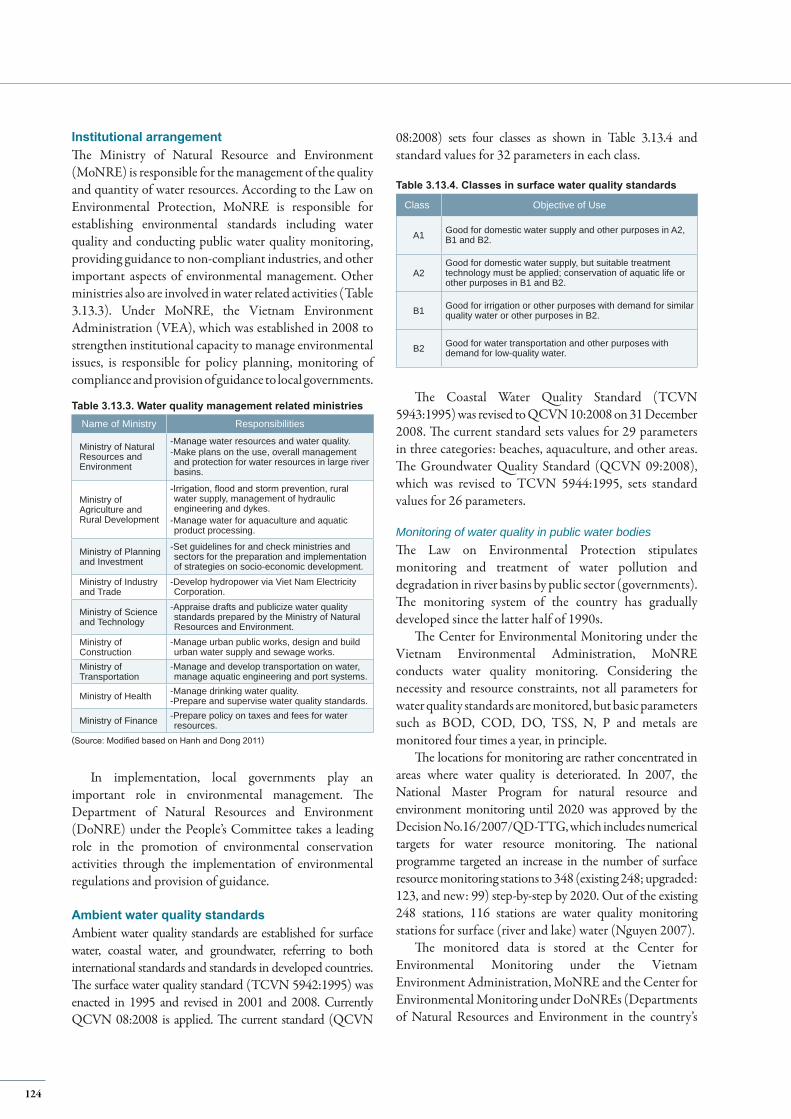
124
Institutional arrangementThe Ministry of Natural Resource and Environment (MoNRE) is responsible for the management of the quality and quantity of water resources. According to the Law on Environmental Protection, MoNRE is responsible for establishing environmental standards including water quality and conducting public water quality monitoring, providing guidance to non-compliant industries, and other important aspects of environmental management. Other ministries also are involved in water related activities (Table 3.13.3). Under MoNRE, the Vietnam Environment Administration (VEA), which was established in 2008 to strengthen institutional capacity to manage environmental issues, is responsible for policy planning, monitoring of compliance and provision of guidance to local governments.
Name of Ministry Responsibilities
Ministry of Natural Resources and Environment
-Manage water resources and water quality. -Make plans on the use, overall management and protection for water resources in large river basins.
Ministry of Agriculture and Rural Development
-Irrigation, flood and storm prevention, rural water supply, management of hydraulic engineering and dykes.
-Manage water for aquaculture and aquatic product processing.
Ministry of Planning and Investment
-Set guidelines for and check ministries and sectors for the preparation and implementation of strategies on socio-economic development.
Ministry of Industry and Trade
-Develop hydropower via Viet Nam Electricity Corporation.
Ministry of Science and Technology
-Appraise drafts and publicize water quality standards prepared by the Ministry of Natural Resources and Environment.
Ministry of Construction
-Manage urban public works, design and build urban water supply and sewage works.
Ministry of Transportation
-Manage and develop transportation on water, manage aquatic engineering and port systems.
Ministry of Health -Manage drinking water quality. -Prepare and supervise water quality standards.
Ministry of Finance -Prepare policy on taxes and fees for water resources.
Table 3.13.3. Water quality management related ministries
(Source: Modified based on Hanh and Dong 2011)
In implementation, local governments play an important role in environmental management. The Department of Natural Resources and Environment (DoNRE) under the People’s Committee takes a leading role in the promotion of environmental conservation activities through the implementation of environmental regulations and provision of guidance.
Ambient water quality standards Ambient water quality standards are established for surface water, coastal water, and groundwater, referring to both international standards and standards in developed countries. The surface water quality standard (TCVN 5942:1995) was enacted in 1995 and revised in 2001 and 2008. Currently QCVN 08:2008 is applied. The current standard (QCVN
08:2008) sets four classes as shown in Table 3.13.4 and standard values for 32 parameters in each class.
Class Objective of Use
A1 Good for domestic water supply and other purposes in A2, B1 and B2.
A2 Good for domestic water supply, but suitable treatment technology must be applied; conservation of aquatic life or other purposes in B1 and B2.
B1 Good for irrigation or other purposes with demand for similar quality water or other purposes in B2.
B2 Good for water transportation and other purposes with demand for low-quality water.
Table 3.13.4. Classes in surface water quality standards
The Coastal Water Quality Standard (TCVN 5943:1995) was revised to QCVN 10:2008 on 31 December 2008. The current standard sets values for 29 parameters in three categories: beaches, aquaculture, and other areas. The Groundwater Quality Standard (QCVN 09:2008), which was revised to TCVN 5944:1995, sets standard values for 26 parameters.
Monitoring of water quality in public water bodiesThe Law on Environmental Protection stipulates monitoring and treatment of water pollution and degradation in river basins by public sector (governments). The monitoring system of the country has gradually developed since the latter half of 1990s.
The Center for Environmental Monitoring under the Vietnam Environmental Administration, MoNRE conducts water quality monitoring. Considering the necessity and resource constraints, not all parameters for water quality standards are monitored, but basic parameters such as BOD, COD, DO, TSS, N, P and metals are monitored four times a year, in principle.
The locations for monitoring are rather concentrated in areas where water quality is deteriorated. In 2007, the National Master Program for natural resource and environment monitoring until 2020 was approved by the Decision No.16/2007/QD-TTG, which includes numerical targets for water resource monitoring. The national programme targeted an increase in the number of surface resource monitoring stations to 348 (existing 248; upgraded: 123, and new: 99) step-by-step by 2020. Out of the existing 248 stations, 116 stations are water quality monitoring stations for surface (river and lake) water (Nguyen 2007).
The monitored data is stored at the Center for Environmental Monitoring under the Vietnam Environment Administration, MoNRE and the Center for Environmental Monitoring under DoNREs (Departments of Natural Resources and Environment in the country’s
125
Chapter3.13 Viet NamWEPA Outlook on Water Environmental Management in Asia 2012
provinces). Monitoring data is used to review and revise policies and measures for water quality conservation. MoNRE issues the State of the Environment Report annually in which major data is made public.
Effluent standards There are various effluent standards in Viet Nam as shown in Figure 3.13.5. Industrial wastewater discharge standards were established in 1995 (TCVN 5945:1995), and revised in 2005. The revised standards (TCVN 5945:2005) set less strict effluent quality targets than previous targets in consideration of the best technology available in the country. In 2009, the standard of 2005 was replaced by the National Technical Regulation on Industrial Wastewater (QCVN 24:2009/BTNMT). The new technical regulation set the formula and necessary concentration value and coefficients to calculate the maximum values of pollutants (32 parameters) to be discharged into public water bodies. Different concentration values were set for the water bodies that are the source of domestic water use and other water bodies, respectively.
All industries and industrial activities, business entities, and service providers should conform to the new technical standard except industrial sectors which have different effluent standards. The specific industries/activities which have different standards include the natural rubber processing industry (QCVN 01:2008/BTNMT), pulp and paper mills (QCVN 12:2008/BTNMT), domestic wastewater sector (QCVN 14:2008/BTNMT), and healthcare sector (QCVN 29:2010).
Industries that are required to carry out environmental impact assessments (EIA) will have to commit to self-monitoring four times/year, in accordance with a circular issued by the national government. Inspection of compliance with industrial effluent standards is conducted by MoNRE, VEA or/and DoNRE two times/year. The inspection is carried out with prior announcement and not more than twice a year. In cases where a violation is suspected, “environmental police” from the Ministry of Public Security have authority to conduct compulsory investigations without prior notice, and therefore have more opportunities to identify possible non-compliance.
6. Existing and Future Challenges
Viet Nam has developed its water quality management system since 1990s. In 2000 in particular, the environmental legislation of the country was amplified—refining environmental and effluent standards, strengthening non-compliance responses and applying environmental protection charges. Now, Viet Nam must work on ensuring and enforcing implementation by strengthening systems and
capacity of water environment management by addressing the following challenges (Nguen 2010; Nga 2011).
To further improve legislative systems (such as elimination of overlapping or uncoordinated provisions): Strengthen economic incentives.
To strengthen compliance: Redouble inspection, improvement and strengthening of technical/administrate guidelines, socialization of environmental protection and sustainable development, further strengthening of administrative sanctions against non-compliance
To enhance organizational arrangements: Facilitate coordination and minimize overlapping of functions and duties of different ministries, sectors and local authorities on water quality management
To improve institutional capacity at national and local level to implement water quality management, especially in the field of water quality monitoring, control and investigation of pollution sources, how to impose sanction at ground level, etc.);
To promote basin-management approach: Improve and strengthen water environment management at the basin level, especially in the three main river basins (Cau, Nhue-Day, and Don Nai)
To develop a sound information base: Develop reliable information systems of the state of water quality and management
To choose and introduce appropriate technology to improve water quality, especially introduction of wastewater treatment technology which is appropriate for different local settings:
To increase of budget for environmental protection: Target is 2% of total state budget allocated for environmental activities
To strengthen capacity of human resources both in number and capacity and financial status.

126

Appendix
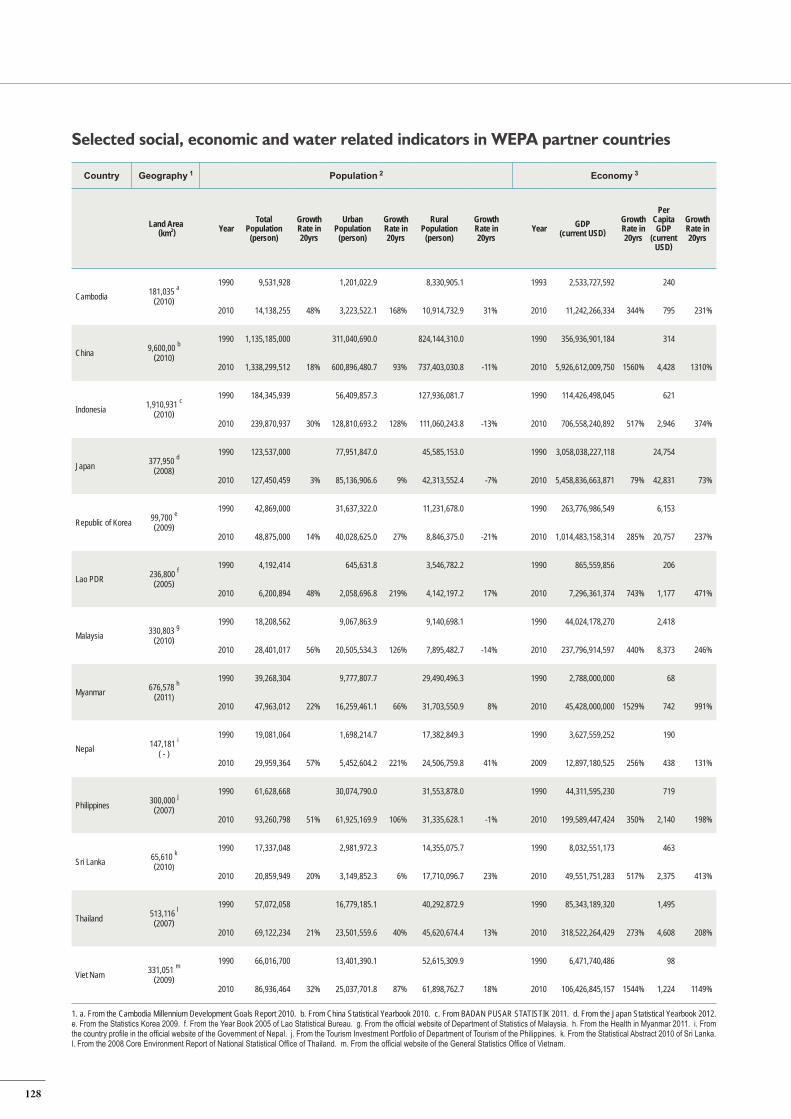
128
Country Geography 1 Population 2 Economy 3
Land Area (km2) Year
Total Population
(person)
Growth Rate in 20yrs
Urban Population
(person)
Growth Rate in 20yrs
Rural Population
(person)
Growth Rate in 20yrs
Year GDP (current USD)
Growth Rate in 20yrs
Per Capita GDP
(current USD)
Growth Rate in 20yrs
Cambodia 181,035 a(2010)
1990 9,531,928 1,201,022.9 8,330,905.1 1993 2,533,727,592 240
2010 14,138,255 48% 3,223,522.1 168% 10,914,732.9 31% 2010 11,242,266,334 344% 795 231%
China 9,600,00 b(2010)
1990 1,135,185,000 311,040,690.0 824,144,310.0 1990 356,936,901,184 314
2010 1,338,299,512 18% 600,896,480.7 93% 737,403,030.8 -11% 2010 5,926,612,009,750 1560% 4,428 1310%
Indonesia 1,910,931 c(2010)
1990 184,345,939 56,409,857.3 127,936,081.7 1990 114,426,498,045 621
2010 239,870,937 30% 128,810,693.2 128% 111,060,243.8 -13% 2010 706,558,240,892 517% 2,946 374%
Japan 377,950 d(2008)
1990 123,537,000 77,951,847.0 45,585,153.0 1990 3,058,038,227,118 24,754
2010 127,450,459 3% 85,136,906.6 9% 42,313,552.4 -7% 2010 5,458,836,663,871 79% 42,831 73%
Republic of Korea 99,700 e(2009)
1990 42,869,000 31,637,322.0 11,231,678.0 1990 263,776,986,549 6,153
2010 48,875,000 14% 40,028,625.0 27% 8,846,375.0 -21% 2010 1,014,483,158,314 285% 20,757 237%
Lao PDR 236,800 f(2005)
1990 4,192,414 645,631.8 3,546,782.2 1990 865,559,856 206
2010 6,200,894 48% 2,058,696.8 219% 4,142,197.2 17% 2010 7,296,361,374 743% 1,177 471%
Malaysia 330,803 g(2010)
1990 18,208,562 9,067,863.9 9,140,698.1 1990 44,024,178,270 2,418
2010 28,401,017 56% 20,505,534.3 126% 7,895,482.7 -14% 2010 237,796,914,597 440% 8,373 246%
Myanmar 676,578 h(2011)
1990 39,268,304 9,777,807.7 29,490,496.3 1990 2,788,000,000 68
2010 47,963,012 22% 16,259,461.1 66% 31,703,550.9 8% 2010 45,428,000,000 1529% 742 991%
Nepal 147,181 i( - )
1990 19,081,064 1,698,214.7 17,382,849.3 1990 3,627,559,252 190
2010 29,959,364 57% 5,452,604.2 221% 24,506,759.8 41% 2009 12,897,180,525 256% 438 131%
Philippines 300,000 j(2007)
1990 61,628,668 30,074,790.0 31,553,878.0 1990 44,311,595,230 719
2010 93,260,798 51% 61,925,169.9 106% 31,335,628.1 -1% 2010 199,589,447,424 350% 2,140 198%
Sri Lanka 65,610 k(2010)
1990 17,337,048 2,981,972.3 14,355,075.7 1990 8,032,551,173 463
2010 20,859,949 20% 3,149,852.3 6% 17,710,096.7 23% 2010 49,551,751,283 517% 2,375 413%
Thailand 513,116 l(2007)
1990 57,072,058 16,779,185.1 40,292,872.9 1990 85,343,189,320 1,495
2010 69,122,234 21% 23,501,559.6 40% 45,620,674.4 13% 2010 318,522,264,429 273% 4,608 208%
Viet Nam 331,051 m(2009)
1990 66,016,700 13,401,390.1 52,615,309.9 1990 6,471,740,486 98
2010 86,936,464 32% 25,037,701.8 87% 61,898,762.7 18% 2010 106,426,845,157 1544% 1,224 1149%
1. a. From the Cambodia Millennium Development Goals Report 2010. b. From China Statistical Yearbook 2010. c. From BADAN PUSAR STATISTIK 2011. d. From the Japan Statistical Yearbook 2012. e. From the Statistics Korea 2009. f. From the Year Book 2005 of Lao Statistical Bureau. g. From the official website of Department of Statistics of Malaysia. h. From the Health in Myanmar 2011. i. From the country profile in the official website of the Government of Nepal. j. From the Tourism Investment Portfolio of Department of Tourism of the Philippines. k. From the Statistical Abstract 2010 of Sri Lanka. l. From the 2008 Core Environment Report of National Statistical Office of Thailand. m. From the official website of the General Statistics Office of Vietnam.
Selected social, economic and water related indicators in WEPA partner countries
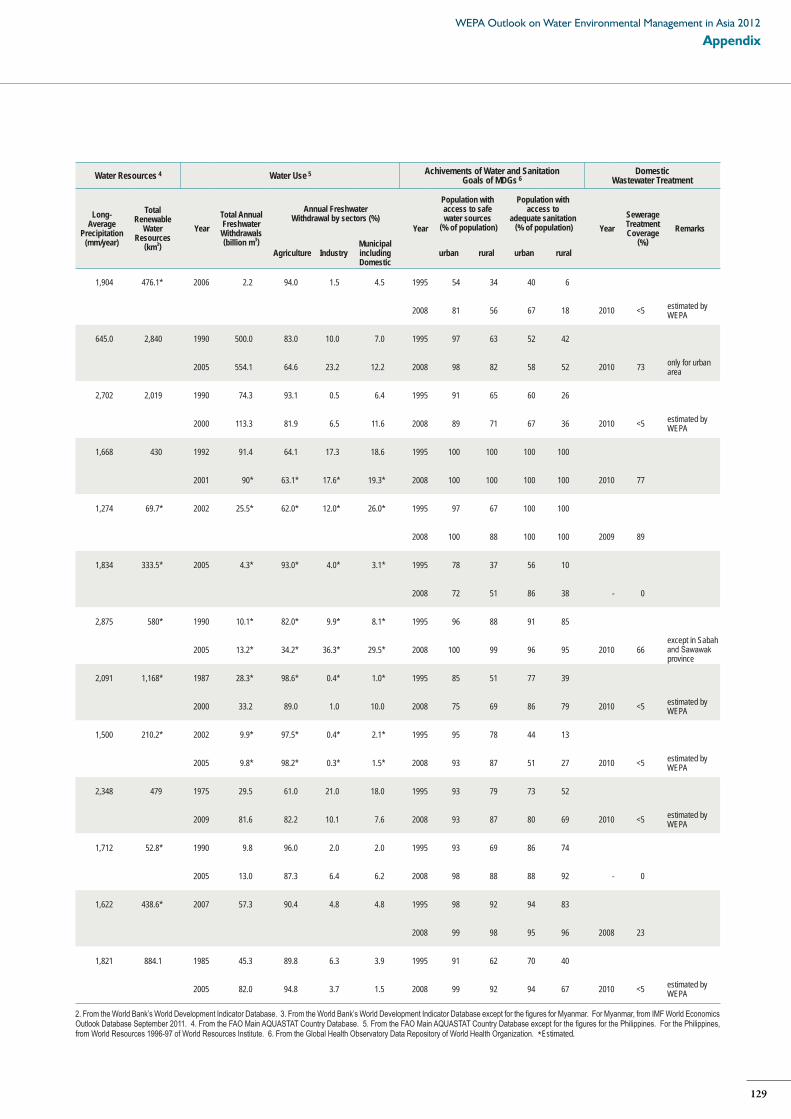
129
AppendixWEPA Outlook on Water Environmental Management in Asia 2012
Water Resources 4 Water Use 5 Achivements of Water and SanitationGoals of MDGs 6
Domestic Wastewater Treatment
Long-Average
Precipitation (mm/year)
Total Renewable
Water Resources
(km3)
YearTotal Annual Freshwater Withdrawals (billion m3)
Annual FreshwaterWithdrawal by sectors (%)
Year
Population with access to safe water sources
(% of population)
Population withaccess to
adequate sanitation (% of population) Year
Sewerage Treatment Coverage
(%)Remarks
Agriculture IndustryMunicipal including Domestic
urban rural urban rural
1,904 476.1* 2006 2.2 94.0 1.5 4.5 1995 54 34 40 6
2008 81 56 67 18 2010 <5 estimated by WEPA
645.0 2,840 1990 500.0 83.0 10.0 7.0 1995 97 63 52 42
2005 554.1 64.6 23.2 12.2 2008 98 82 58 52 2010 73 only for urban area
2,702 2,019 1990 74.3 93.1 0.5 6.4 1995 91 65 60 26
2000 113.3 81.9 6.5 11.6 2008 89 71 67 36 2010 <5 estimated by WEPA
1,668 430 1992 91.4 64.1 17.3 18.6 1995 100 100 100 100
2001 90* 63.1* 17.6* 19.3* 2008 100 100 100 100 2010 77
1,274 69.7* 2002 25.5* 62.0* 12.0* 26.0* 1995 97 67 100 100
2008 100 88 100 100 2009 89
1,834 333.5* 2005 4.3* 93.0* 4.0* 3.1* 1995 78 37 56 10
2008 72 51 86 38 - 0
2,875 580* 1990 10.1* 82.0* 9.9* 8.1* 1995 96 88 91 85
2005 13.2* 34.2* 36.3* 29.5* 2008 100 99 96 95 2010 66 except in Sabah and Sawawak province
2,091 1,168* 1987 28.3* 98.6* 0.4* 1.0* 1995 85 51 77 39
2000 33.2 89.0 1.0 10.0 2008 75 69 86 79 2010 <5 estimated by WEPA
1,500 210.2* 2002 9.9* 97.5* 0.4* 2.1* 1995 95 78 44 13
2005 9.8* 98.2* 0.3* 1.5* 2008 93 87 51 27 2010 <5 estimated by WEPA
2,348 479 1975 29.5 61.0 21.0 18.0 1995 93 79 73 52
2009 81.6 82.2 10.1 7.6 2008 93 87 80 69 2010 <5 estimated by WEPA
1,712 52.8* 1990 9.8 96.0 2.0 2.0 1995 93 69 86 74
2005 13.0 87.3 6.4 6.2 2008 98 88 88 92 - 0
1,622 438.6* 2007 57.3 90.4 4.8 4.8 1995 98 92 94 83
2008 99 98 95 96 2008 23
1,821 884.1 1985 45.3 89.8 6.3 3.9 1995 91 62 70 40
2005 82.0 94.8 3.7 1.5 2008 99 92 94 67 2010 <5 estimated by WEPA
2. From the World Bank’s World Development Indicator Database. 3. From the World Bank’s World Development Indicator Database except for the figures for Myanmar. For Myanmar, from IMF World Economics Outlook Database September 2011. 4. From the FAO Main AQUASTAT Country Database. 5. From the FAO Main AQUASTAT Country Database except for the figures for the Philippines. For the Philippines, from World Resources 1996-97 of World Resources Institute. 6. From the Global Health Observatory Data Repository of World Health Organization. * Estimated.

130

References
132
Coverage with Access to Domestic Wastewater Treatment Facility at the end of FY 2009 by Type of Treatment Facility. Tokyo.
Republic of KoreaMinistry of Environment of Republic of Korea.2009. ECOREA
Environmental Review 2008. Gyeonggi-do.MalaysiaThe Malaysian Water Association.2011.Malaysia Water Industry Guide
2011. Kuala LumpurThailandWangwongwatnana, Supat. 2010. “Presentation at International Conference
on Construction and Environment” Tokyo, Japan, 4 FebruaryOther CountriesEstimated by the WEPA Secretariat based on the information provided by each WEPA country.
Figure 2.1.7. Historical change of service coverage ratio for sewerage treatment in selected Asian countries
ChinaMinistry of Environmental Protection of the People’s Republic of China.
2002. Report on the State of the Environment in China 2001 (in Chinese). http://zls.mep.gov.cn/hjtj/qghjtjgb/200206/t20020605_83097.htm. Accessed 18 February 2012.
. 2003. Report on the State of the Environment in China 2002 (in Chinese). http://zls.mep.gov.cn/hjtj/qghjtjgb/200306/t20030605_85524.htm. Accessed 18 February 2012.
. 2004. Report on the State of the Environment in China 2003 (in Chinese). http://zls.mep.gov.cn/hjtj/qghjtjgb/200406/t20040602_90393.htm. Accessed 18 February 2012.
. 2005. Report on the State of the Environment in China 2004 (in Chinese). http://zls.mep.gov.cn/hjtj/qghjtjgb/200506/t20050610_67563.htm. Accessed 18 February 2012.
. 2006. Report on the State of the Environment in China 2005 (in Chinese). http://zls.mep.gov.cn/hjtj/qghjtjgb/200606/t20060612_77318.htm. Accessed 18 February 2012.
. 2007. Report on the State of the Environment in China 2006 (in Chinese). http://zls.mep.gov.cn/hjtj/qghjtjgb/200709/t20070924_109497.htm. Accessed 18 February 2012.
. 2008. Report on the State of the Environment in China 2007 (in Chinese). http://zls.mep.gov.cn/hjtj/qghjtjgb/200809/t20080924_129355.htm. Accessed 18 February 2012.
. 2009. Report on the State of the Environment in China 2008 (in Chinese). http://zls.mep.gov.cn/hjtj/qghjtjgb/200909/t20090928_161740.htm. Accessed 18 February 2012.
. 2012a. Report on the State of the Environment in China 2009 (in Chinese). http://zls.mep.gov.cn/hjtj/qghjtjgb/201201/t20120118_222702.htm. Accessed 18 February 2012.
. 2012b. Report on the State of the Environment in China 2010 (in Chinese). http://zls.mep.gov.cn/hjtj/qghjtjgb/201201/t20120118_222703.htm. Accessed 18 February 2012.
JapanJapan Sewage Works Association.2011. Sewerage Statistics 2009. Tokyo. . 2009. Sewerage Statistics 2007. Tokyo.Ministry of the Environment of Japan. 2001. Heisei 12 Nendo no Shori
Shisetsu betsu Osui Shori Jinko Fukyuu Jyokyou (Population Coverage with Access to Domestic Wastewater Treatment Facility at the end of FY 2000 by Type of Treatment Facility). Tokyo.
. 2002. Heisei 13 Nendo no Shori Shisetsu betsu Osui Shori Jinko Fukyuu Jyokyou (Population Coverage with Access to Domestic Wastewater Treatment Facility at the end of FY 2001 by Type of Treatment Facility). Tokyo.
. 2003. Heisei 14 Nendo no Shori Shisetsu betsu Osui Shori Jinko Fukyuu Jyokyou (Population Coverage with Access to Domestic Wastewater Treatment Facility at the end of FY 2002 by Type of Treatment Facility). Tokyo.
References
Chapter 2.1Domestic Wastewater Treatment in Asia
FAO (Food and Agriculture Organization of the United Nations). 2012. AQUASTAT. http://www.fao.org/nr/water/aquastat/main/index.stm. Accessed 18 February 2012
Malaysian Water Association. 2011. Malaysia Water Industry Guide 2011. Kuala Lumpur.
MoEJ (Ministry of the Environment of Japan). (n.d.). Night Soil Treatment and Decentralized Wastewater Treatment System in Japan. Tokyo.
UNDESA (United Nations Department of Economic and Social Affairs). 2011. World Population Prospects, the 2009 Revision and the 2010 Revision. http://esa.un.org/wpp/Excel-Data/population.htm. Accessed 18 February 2012.
. 2012. Millennium Development Goals Indicators. http://mdgs.un.org/unsd/mdg/Default.aspx. Accessed 18 February 2012.
UNDP (United Nations Development Programme). 2006. Human Development Report 2006. New York.
Word Bank. 2012. World Development Indicators (WDI) Online Database. http://data.worldbank.org/indicator. Accessed 18 February 2012.
Figure 2.1.4. BOD load from domestic sector in selected countries and catchment areas of WEPA countries
IndonesiaWorld Bank. 2003. Indonesia Environment Monitor 2003. http://www-
wds.worldbank.org/external/default/WDSContentServer/WDSP/IB/2003/07/16/000012009_20030716161307/Rendered/PDF/263330PAPER0En1ronment0Monitor02003.pdf. Accessed 18 February 2012.
JapanSuishitu Kaizen Senmon Bukai, Kyu-to-ken Shuno Kaigi (Expert
Committee on Water Quality Improvement of Nine Prefectures Summitt). 2007. Kirei na Tokyo wan wo Mezashite (For Clean Tokyo Bay). Power point presentation, updated November 2010. http://www.pref.saitama.lg.jp/uploaded/attachment/424012.pdf. Accessed 18 February 2012.
Republic of KoreaYang-Seok Cho. 2010.Urbanization and Water Quality Control for the
Source of Water in Seoul. Presentation at the 1st WEPA international workshop, Hanoi, Viet Nam, 8 March.
PhilippinesWorld Bank.2003. Philippines Environment Monitor 2003. http://
www-wds.worldbank.org/external/default/WDSContentServer/WDSP/IB/2004/05/24/000012009_20040524135608/Rendered/PDF/282970PH0Environment0monitor.pdf. Accessed 18 February 2012.
Viet NamWorld Bank.2006. Viet Nam Environment Monitor 2006. http://www-
wds.worldbank.org/external/default/WDSContentServer/WDSP/IB/2007/07/26/000310607_20070726124200/Rendered/PDF/404180VN0Env0M19190001PUBLIC1optmzd.pdf. Accessed 18 February 2012.
Figure 2.1.6. Sewerage coverage ratio of sewerage treatment in Asia
ChinaMinistry of Environmental Protection of the People’s Republic of
China.2012. Report on the State of the Environment in China 2010 (in Chinese). http://zls.mep.gov.cn/hjtj/qghjtjgb/201201/t20120118_222703.htm. Accessed 18 February 2012.
JapanMinistry of the Environment of Japan. 2010. Heisei 21 Nendo no
Shorishisetsu betsu Osui Shori Jinko Fukyuu Jyokyo (Population
133
ReferencesWEPA Outlook on Water Environmental Management in Asia 2012
. 2004. Heisei 15 Nendo no Shori Shisetsu betsu Osui Shori Jinko Fukyuu Jyokyou (Population Coverage with Access to Domestic Wastewater Treatment Facility at the end of FY 2003 by Type of Treatment Facility). Tokyo.
. 2005. Heisei 16 Nendo no Shori Shisetsu betsu Osui Shori Jinko Fukyuu Jyokyou (Population Coverage with Access to Domestic Wastewater Treatment Facility at the end of FY 2004 by Type of Treatment Facility). Tokyo.
. 2006. Heisei 17 Nendo no Shori Shisetsu betsu Osui Shori Jinko Fukyuu Jyokyou (Population Coverage with Access to Domestic Wastewater Treatment Facility at the end of FY 2005 by Type of Treatment Facility). Tokyo.
. 2007. Heisei 18 Nendo no Shori Shisetsu betsu Osui Shori Jinko Fukyuu Jyokyou (Population Coverage with Access to Domestic Wastewater Treatment Facility at the end of FY 2006 by Type of Treatment Facility). Tokyo.
. 2008. Heisei 19 Nendo no Shori Shisetsu betsu Osui Shori Jinko Fukyuu Jyokyou (Population Coverage with Access to Domestic Wastewater Treatment Facility at the end of FY 2007 by Type of Treatment Facility). Tokyo.
. 2009. Heisei 20 Nendo no Shori Shisetsu betsu Osui Shori Jinko Fukyuu Jyokyou (Population Coverage with Access to Domestic Wastewater Treatment Facility at the end of FY 2008 by Type of Treatment Facility). Tokyo.
. 2010. Heisei 21 Nendo no Shori Shisetsu betsu Osui Shori Jinko Fukyuu Jyokyou (Population Coverage with Access to Domestic Wastewater Treatment Facility at the end of FY 2009 by Type of Treatment Facility). Tokyo.
Republic of KoreaJaehoon Kim. 2011. “Policy of Domestic Wastewater Treatment in
KOREA.” Presentation at the 3rd WEPA Workshop, Manila, Philippines, 22 September.
Ministry of Construction & Transportation et al.. 1996. Infrastructure Development and Prospect in Korea. Country Report for the Ministerial Meeting on Infrastructure, New Delhi, India 23 to 29 October.
Ministry of Environment of Republic of Korea.2007. Green Korea 2006. Gyeonggi-do.
. 2009. ECOREA Environmental Review 2008. Gyeonggi-do. . 2012. Korea’s Sewage Policies and Private Investment. Gyeonggi-do.Sung Kim. 2004. “Research Strategy to Cope with Water Shortage Problem
during Drought in Korea.” Presentation for International Workshop and Symposium for Water Hazard and Risk Management. 20-23 January.
Soon-u Yu. 2011. “Progress of Water Environment Management and Future Challenges in Korea.” Presentation at the 6th WEPA Annual Meeting, Tokyo, Japan, 24 February.
MalaysiaThe Malaysian Water Association.2011.Malaysia Water Industry
Guide2011. Kuala Lumpur. . 2009. Malaysia Water Industry Guide2009. Kuala Lumpur.ThailandEstimated by the WEPA Secretariat based on the information provided by
the WEPA countries.
Figure 2.1.8. Relationship between sewerage treatment coverage ratio and GDP per capita in WEPA countries
[Data for GDP per capita]Word Bank. 2012. World Bank Indicators. http://data.worldbank.org/
indicator. Accessed 18 February 2012.[Data for sewage treatment ratio]ChinaMinistry of Environmental Protection of the People’s Republic of
China.2012. Report on the State of the Environment in China 2010 (in Chinese). http://zls.mep.gov.cn/hjtj/qghjtjgb/201201/t20120118_222703.htm.. Accessed 18 February 2012.
JapanMinistry of the Environment of Japan. 2010. Heisei 21 Nendo no
Shorishisetsu betsu Osui Shori Jinko Fukyuu Jyokyo (Population
Coverage with Access to Domestic Wastewater Treatment Facility at the end of FY 2009 by Type of Treatment Facility. Tokyo.
Republic of KoreaMinistry of Environment of Republic of Korea.2009. ECOREA
Environment Review 2008 Korea. Gyeonggi-do.MalaysiaThe Malaysian Water Association.2011.Malaysia Water Industry Guide
2011. Kuala LumpurThailandWangwongwatnana, Supat. 2010. “Presentation at International Conference
on Construction and Environment.” Tokyo, Japan, 4 February.Other CountriesEstimated by the WEPA Secretariat based on the information provided by each WEPA country.
Table 2.1.3: Septic tank coverage ratio in selected areas/countries
Malaysia The Malaysian Water Association. 2011. Malaysia Water Industry
Guide2011. Kuala Lumpur.PhilippinesLeonor C. Cleofas. 2011. “Pollution Reduction Program in Metro Manila:
Sewerage and Sanitation Master Plan of MWSS.” Presentation at 6th Regional Training Workshop on Integrated River Basin and Coastal Area Management, Dalian, China. 20 May.
Sri LankaHidenori Harada. 2001. Asia 9 Toshi ni Okeru Mizu Eisei Kankyo Kanri
Seiyaku Joken no Ruikeika to Kaizen Tejun no Sakutei ni Muketa Torikumi (Categorization of Constraint Conditions for Management of Sanitation and Water Environment in nine Asian cities and Formulation of Improvement Strategies). Gekkyan Jokasou. No. 424: 21-24.
Viet NamGeneral Statistics Office of Viet Nam. 2008. Results of the survey on
household living standards 2008. http://www.gso.gov.vn/default_en.aspx?tabid=515&idmid=5&ItemID=9647. Accessed 18 February 2012.
Table 2.1.4. BOD reduction rates of different treatment measures for domestic wastewater
Boyer, James A., and C.A. Rock. 1992. “Performance of Septic Tanks.” Proceedings of 7th Northwest On-Site Wastewater Treatment Short Course and Equipment Exhibition. Seattle.
DENR-EMB (Department of Environment and Natural Resources, Environmental Management Bureau) et al.. 2005. Philippines Sanitation Sourcebook and Decision Aid. http://esa.un.org/iys/docs/san_lib_docs/Philippines_sanitation.pdf. Accessed 18 February 2012
Japan Sewage Works Association. 1984. Gesuido Shisetsu Keikaku Sekkei Shishin to Kaisetsu 1984 nenban (Guideline for Plan and Design of Sewerage Works, 1984). Tokyo.
Seabloom, Robert W., D.A. Carlson, and J. Engeset. 1982. “Septic Tank Performance, Compartmentation, Efficiency and Stressing.” Proceedings of 4th Northwest On-Site Wastewater Disposal Short Course. University of Washington, Seattle.
WEPA (Water Environment Partnership in Asia). 2012. WEPA Database of technologies in operation. http://www.wepa-db.net/technologies/top.htm, Accessed 18 February 2012
Chapter 2.2Climate Change and the Water Environment
Agustiyan, Dwi. 2007. Climate change impact on water water quality in Citarum River, West Java, Indonesia. The 1st International Workshop on Climate Change Impact on Surface Water Quality in East Asian Watersheds, Chuncheon, Korea, 7-9 October.
Bate, Bryson. C., Z.W. Kundzewicz, S. Wu and J.P. Palutikof, eds.. 2008. Climate Change and Water. Technical Paper of the Intergovernmental Panel on Climate Change. Geneva: IPCC Secretariat.
134
Connor, Richard, G. Gallopin, M. Hellmuth and W. Rast. 2009. “Climate Change and Possible Futures.” Chapter 5 of The United Nations World Water Development Report 3: Water in a Changing World. World Water Assessment Programme. Paris: UNESCO, and London: Earthscan
Cruz, R.Victor, H. Harasawa, M. Lal, S. Wu, Y. Anokhin, B. Punsalmaa, Y. Honda, M. Jafari, C. Li and N. Huu Ninh, 2007. Asia. “Climate Change 2007: Impacts, Adaptation and Vulnerability.” Contribution of Working Group II to the Fourth Assessment Report of the Intergovernmental Panel on Climate Change, M.L. Parry, O.F. Canziani, J.P. Palutikof, P.J. van der Linden and C.E. Hanson, eds., Cambridge: Cambridge University Press: 469-506.
Jung, Eun. 2005. “Global Warming Impacts Korean Fisheries Industry.” Arirang News, 6 November.http://www.arirang.co.kr/News/News_View.asp?nseq=56813&code=Ne4&category=3. Accessed 23 June 2011.
Hoeksema, Bert W. and D.F.R. Cleary. (n.d.) “Climate change and Indonesian coral reef biota.” http://www.nwo.nl/nwohome.nsf/pages/NWOA_79NMMP. Accessed 13 June 2011.
IPCC (Intergovernmental Panel on Climate Change). 2007. Fourth Assessment Report: Climate change 2007. Cambridge: Cambridge University Press.
Kundzewicz, Zbigniew W., L.J. Mata, N.W. Arnell, P. Döll, P. Kabat, B. Jiménez, K.A. Miller, T. Oki, Z. Sen and I.A. Shiklomanov. 2007. “Freshwater resources and their management. Climate Change 2007: Impacts, Adaptation and Vulnerability. Contribution of Working Group II to the Fourth Assessment Report of the Intergovernmental Panel on Climate Change, M.L. Parry, O.F. Canziani, J.P. Palutikof, P.J. van der Linden and C.E. Hanson, Eds., Cambridge: Cambridge University Press: 173-210.
Kumagai, Michio, K. Ishikawa, and N. Ishiguro. 2003. “Impact of global warming on large lakes.” In Water Resources Systems? Water availability and global change. Franks, S., G. Bloschl, M. Kumagai, K. Musiake, D. Rosbjerg, eds., IAHS Res Book 280: 65-69.
Ma, Ronghua, H. Duan, C. Hu, X. Feng, A. Li, W. Ju, J. Jian, and G. Yang. 2010. “A Half-centry of changes in China's Lakes: Global Warming or Human Influence?” Geophsical Research Letters 37(24):2-7.
McMullen, Catherine, P. (Eds.). 2009. Climate Change Science Compendium 2009. United Nations Environment Programme (UNEP)
Park, Ji-Hyung et al.. 2009. “Regional Collaborative Research on Climate Change Impacts on Surface Water Quality in Eastern Monsoon Asia: Towards Sound Management of Climate Risks.” Asia-Pacific Network for Global Change Research (APN). http://www.apn-gcr.org/newAPN/resources/projectBulletinOutputs/finalProjectReports/2008/ARCP2008-04CMY-Park-Final%20Report.pdf. Accessed 24 February 2012.
Sarjiya, Antonius and Dwi Agustiyani Nurleili. 2009. “Regional long-term data monitoring of Brantas River-Indonesia: trend of water quality and its implication.” Presentation at the 2nd International Workshop on Climate Change Impacts on Surface Water Quality in East Asian Watersheds, Sabah, Malaysia, 18-20 February.
Wipatayotin, Apinya. 2010. “Andaman Sea coral reefs hit by bleaching.” Bangkok Post, 8 May. http://www.bangkokpost.com/news/local/36984/andaman-sea-coral-reefs-hit-by-bleaching. Accessed 18 June 2011.
Wirojanagud, Wanpen, Suwannakom, S. and Sthiannopkao, S. 2007. “Impact of Ambient Temperature Change on Water Quality: A Case Study of the Pong River, Northeast, Thailand.” Presentation at the 1st International Workshop on Climate Change Impacts on Surface Water Quality in East Asian Watersheds, Chuncheon, Republic of Korea, 7-10 October.
WWF (World Wide Fund For Nature). 2010. WWF-Malaysia’s statement on coral bleaching. 22 July. http://www.wwf.org.my/media_and_information/newsroom_main/?11180/WWF-Malaysias-statement-on-Coral-Bleaching. Accessed 24 February 2012.
Yuasa, Takashi, Y. Kirihara, M. Okada, T. Wakou, and O. Oyama. 2011. Impacts of Climate Change on Lakes in Japan. A paper submitted to the 14th World Lake Conference, Austin, Texas USA, October 31–November 4.
Yamaguchi, Atsuko, K. Furumitsu, N. Yagishita and G. Kume . 2010. Biology of herbivorous fish in coastal areas of western Japan. Coastal environmental and ecosystem issues of the East China Sea. A. Ishimatsu and H.-J. Lie. Eds.,pp. 181-190.
Chapter 3 Country Profiles of Water Environmental Management in WEPA Countries
Land Area CambodiaRoyal Government of Cambodia. 2009. National Strategic Development
Plan Update 2009-2013. Phnom Penh. ChinaNational Bureau of Statistics of China. 2011. China Statistical Yearbook
2010. http://www.stats.gov.cn/tjsj/ndsj/2010/indexeh.htm. Accessed 19 January 2012.
IndonesiaStatistic Indonesia. 2010. Trends of the Selected Socio-Economic Indicators
of Indonesia. http://www.bps.go.id/booklet/Boklet_Agustus_2010.pdf. Accessed 19 January 2012.
JapanMinistry of Internal Affairs and Communications. 2012. Japan Statistical
Yearbook 2012. http://www.stat.go.jp/english/data/nenkan/1431-01.htm. Accessed 19 January 2012.
Republic of KoreaNational Statistics Office. 2009. Explore Korea through Statistics 2009.
http://kostat.go.kr/eng2009/emain/explore09_eng/EBook.htm. Accessed 19 January 2012.
Lao PDRLao Statistics Bureau. 2012. “Statistics.”http://nsc.gov.la/index2.
php?option=com_content&view=article&id=37&Itemid=38&lang=en. Accessed 19 January 2012.
MalaysiaDepartment of Statistics, Malaysia. 2012. “Malaysia @ a Glance.”http://
www.statistics.gov.my/portal/index.php?option=com_content&view=article&id=472%3Amalaysia-glance-test&catid=115%3A-glance&Itemid=164&lang=en. Accessed 19 January 2012.
MyanmarMinistry of Health. 2011. “Country Profile.” Health in Myanmar.http://
www.moh.gov.mm/file/country%20profile.pdf. Accessed 19 January 2012.
NepalGovernment of Nepal. 2012. “Country Profile.”http://www.nepalgov.gov.np
/?option=ngdir&page=countryprofile. Accessed 19 January 2012.PhilippinesDENR-EMB (Department of Environment and Natural Resources,
Environmental Management Bureau). (n.d). Compendium of Basic ENR Statistics for Operations and Management (Second Edition) (2000-2008). Manila.
Sri LankaDepartment of Census and Statistics. 2012. “Chapter 1- Area and Climate.”
Statistical Abstract 2010.http://www.statistics.gov.lk/abstract2010/chapters/chap1/AB1-1.pdf. Accessed 19 January 2012.
ThailandNational Statistics Office Thailand. 2012. “Chapter 1 Background Data.”
The 2008 Core Environment.http://web.nso.go.th/indicator/environ/bg.pdf. Accessed 19 January 2012.
Viet NamGeneral Statistics Office of Viet Nam. “Land use (As of 1 January 2009).”
http://www.gso.gov.vn/default_en.aspx?tabid=466&idmid=3&ItemID=9846. Accessed 19 January 2012.
135
ReferencesWEPA Outlook on Water Environmental Management in Asia 2012
Total Population[Data for Philippines]NSO (National Statistics Office of Philippines). 2012. “Philippines in
Figures.” Official Website. http://www.census.gov.ph/. Accessed 20 February 2012.
[Data for Other Countries] World Bank. 2012. World Development Indicators (WDI) Online
Database. http://data.worldbank.org/indicator. Accessed 19 January 2012.
GDP and Per Capita GDP[Data for Myanmar]IMF (International Monetary Fund). 2011. World Economic Outlook
Database. September Edition. http://www.imf.org/external/pubs/ft/weo/2011/02/weodata/index.aspx. Accessed 19 January 2012.
[Data for Other Countries] World Bank. 2012. World Development Indicators (WDI) Online
Database. http://data.worldbank.org/indicator. Accessed 19 January 2012.
Long-Average Precipitation, Total Renewable Water Resources, Total Annual Freshwater Withdrawals, Annual Freshwater Withdrawal by sectors
[Data for Japan]MLIT (Ministry of Land, Infrastructure, Transport and Tourism of Japan).
2011. Heisei 23 Nen Ban Nihon no Mizu Shigen (Water Resources of Japan 2011). Tokyo. http://www.mlit.go.jp/tochimizushigen/mizsei/tochimizushigen_mizsei_tk2_000002.html. Accessed 20 January 2012.
[Data for Other Countries]FAO (Food and Agriculture Organization of the United Nations). 2012.
Main AQUASTAT Country Database. http://www.fao.org/nr/water/aquastat/data/query/index.html?lang=en. Accessed 19 January 2012.
Chapter 3.1 CambodiaArsenic Center of Cambodia. 2010. National Arsenic database. http://www.
arseniccenter.com. Accessed 6 October, 2010 (The database is currently unavailable as of 24 February 2012).
MoE (Ministry of Environment of Cambodia). 2006. Water Quality in Coastal Rivers and Near Shore Coastal Waters of Cambodia-Second Annual Monitoring Report. Phnom Penh. http://www.czmcam.org/content/documents/Report_WQM_CZM_Final%20_ENG-KH_.pdf. Accessed 5 December 2011.
. 2009. Cambodia Environment Outlook. Phnom Penh. . 2010. Annual Environment Report (in Khmer). Phnom Penh.MoEJ (Ministry of the Environment of Japan).2009. WEPA Outlook on
Environmental Management Strategies in Asia. Hayama: Institute for Global Environmental Strategies.
MoWRAM (Ministry of Water Resource and Meteorology of Cambodia). 2008. Master Plan of Water Resource Development in Cambodia. Phnom Penh.
Sokha, Chrin. 2005. Environmental Hazards and Risks in Cambodia: An Analysis. Phnom Penh: Ministry of Environment of Cambodia.
. 2011. “Progress of Water Environment Management and Future Challenges in Cambodia.” Presentation at the 6th WEPA Annual Meeting, Tokyo, Japan, 24 February.
Chapter 3.2 ChinaChinese Government’s Official Web Portal. 2011. “China’s State Council
orders underground water safety, protection.” 24 August. http://english.gov.cn/2011-08/24/content_1932057.htm. Accessed 15 December 2011.
Gang, Chen. 2011. “Water Environment Protection in China.” Presentation at the 6th WEPA Annual Meeting, Tokyo, Japan, 24 February.
Jin, Zhu. 2011. “Govt Eyes Safety on Underground Water.” China Daily. 25 August. http://www.chinadaily.com.cn/cndy/2011-08/25/content_13184850.htm. Accessed 15 December 2011.
MEP (Ministry of Environmental Protection of the People’s Republic of China). 2007. “Appendix IV: Explanatory Notes on Main Statistical Indicators.” China Environmental Statistical Yearbook 2006. http://english.mep.gov.cn/standards_reports/EnvironmentalStatistics/yearbook2006/200712/t20071217_114397.htm. Accessed 16 December 2011.
. 2010a. Report on the State of the Environment in China 2009. Beijing.http://english.mep.gov.cn/standards_reports/soe/soe2009/201104/t20110411_208979.htm. Accessed 14 December 2011.
. 2010b. “The First National Census on Pollution Sources Completes in Success.” 10 February. http://english.mep.gov.cn/News_service/infocus/201005/t20100531_190101.htm. Accessed 15 December 2011.
. 2011a. Report on the State of the Environment in China 2010 (in Chinese). Beijing. http://www.mep.gov.cn/pv_obj_cache/pv_obj_id_2664F11057268A0849A1871670B91BB09D7C1200/filename/P020110603390794821945.pdf. Accessed 14 December 2011.
. 2011b. “The Tasks for Reducing the Total Amount of Major Pollutants in the 11th Five-Year Plan Period (2006-2010) Accomplished.” 29 August. http://english.mep.gov.cn/News_service/news_release/201108/t20110831_216799.htm. Accessed 14 December 2011.
. 2011c. “Discharge Standard.” http://english.mep.gov.cn/standards_reports/standards/water_environment/Discharge_standard/?4049701387=2310839348. Accessed 15 December 2011.
. 2011d. “The Exhibition on Environmental Protection Achievement during the ‘11th Five-Year Plan’ Period & 12th CIEPEC Opened in Beijing.” 8 June. http://english.mep.gov.cn/News_service/infocus/201106/t20110615_212565.htm?2641070603=2310839348. Accessed 15 December 2011.
MoEJ (Ministry of the Environment of Japan). 2009. WEPA Outlook on Environmental Management Strategies in Asia. Hayama: Institute for Global Environmental Strategies.
MWR (Ministry of Water Resources of the People’s Republic of china). (n.d.). “Facts and Figures.” http://www.mwr.gov.cn/english/cpws.html. Accessed 15 October 2011.
SEPA (State Environmental Protection Administration). 2006. The State of Environment Report 2005. Beijing. http://english.mep.gov.cn/standards_reports/soe/soe2005/200706/t20070622_105622.htm. Accessed 15 October 2011.
UNEP (United Nations Environmental Programme). 2010. Final Review of Scientific Information on Cadmium. UNEP Chemicals Branch, Division of Technology, Industry and Economics. Version of December 2010. http://www.unep.org/hazardoussubstances/Portals/9/Lead_Cadmium/docs/Interim_reviews/UNEP_GC26_INF_11_Add_2_Final_UNEP_Cadmium_review_and_apppendix_Dec_2010.pdf. Accessed 15 December 2011.
Wang, Qian. 2011. “Challenges in environmental protection still serious.” China Daily, 4 June. http://www.chinadaily.com.cn/china/2011-06/04/content_12640598.htm. Accessed 15 December 2011.
World Bank. 2008. Mid-term Evaluation of China’s 11th Five-Year Plan. http://siteresources.worldbank.org/CHINAEXTN/Resources/318949-1121421890573/China_11th_Five_Year_Plan_main_report_en.pdf. Accessed 15 October 2011.
Chapter 3.3 IndonesiaEnvironmental Management Agency of DKI Jakarta. 2007. Jakarta State of
Environment Report 2006. Jakarta.MoE (Ministry of Environment of Indonesia). 2008. State of Environment
Report in Indonesia 2007. Jakarta. . 2011. State of Environmental Report in Indonesia 2010. JakartaMoEJ (Ministry of the Environment of Japan).2009. WEPA Outlook on
Environmental Management Strategies in Asia. Hayama: Institute for Global Environmental Strategies.
Statistics Indonesia. 2011. Statistical Year Book of Indonesia 2010. Jakarta. http://dds.bps.go.id/eng/aboutus.php?pub=1&pubs=45. Accessed 9 September 2011.
136
Syarif. L.M. 2010. “Current Development of Indonesian Environmental Law.” IUCN Academy of Environmental Law eJournal 2010 (1).
Chapter 3.4 JapanMLIT (Ministry of Land, Infrastructure, Transport and Tourism of Japan).
2011. “Nihon no Mizushigen no Genjo Kadai (State and Issues of Water Resources in Japan).” Last modified 1 August. http://www.mlit.go.jp/tochimizushigen/mizsei/c_actual/index.html. Accessed 20 January 2012.
MoEJ (Ministry of the Environment of Japan).2009. WEPA Outlook on Environmental Management Strategies in Asia. Hayama: Institute for Global Environmental Strategies.
. 2011a. “Heisei 22 nendo Kokyoyo Suiiki Suishitsu Sokutei Kekka (Result of Measurement of Water Quality in Public Water Bodies 2010).” Tokyo.http://www.env.go.jp/water/suiiki/h22/full.pdf. Accessed 20 January 2012.
. 2011b. “Heisei 21 nendo Chikasuishitsu Sokutei Kekka (Result of Measurement of Groundwater Quality 2009).” Tokyo. http://www.env.go.jp/water/report/h22-01/01.pdf. Accessed 20 January 2012.
. 2011c. “Mizu Kankyo Sogo Joho Saito (Information Site on Water Environment).” http://www.env.go.jp/water/mizu_site/index.html. Accessed 20 January 2012.
Chapter 3.5 Republic of KoreaChung, Eu Gene. 2010. “Water Quality Monitoring Using IT.” Korea
Environmental Policy Bulletin Issue 4, Volume VII. Gyeonggi-do: Ministry of Environment-ROK and Korean Environment Institute. http://eng.me.go.kr/board.do?method=view&docSeq=9188&bbsCode=res_mat_pub_bulletin¤tPage=1&searchType=&searchText=. Accessed 30 November 2011.
FAO (Food and Agriculture Organization of the United Nations). 2012. Main AQUASTAT Country Database. http://www.fao.org/nr/water/aquastat/data/query/index.html?lang=en. Accessed 19 January 2012.
MoCT (Ministry of Construction and Transportation of Republic of Korea). 2007. Water Resources in Korea 2007. http://www.adb.org/Documents/Books/AWDO/2007/br04.pdf. Accessed 20 February 2012.
MoE (Ministry of Environment of Republic of Korea). 2006. Environmental Statistics Yearbook 2006. Gyeonggi-do. http://eng.me.go.kr/board.do?method=view&docSeq=8058&bbsCode=law_law_paper¤tPage=1&searchType=&searchText=. Accessed 30 November 2011.
. 2011. Environmental Statistics Yearbook 2010. Gyeonggi-do. http://eng.me.go.kr/board.do?method=view&docSeq=9348&bbsCode=law_law_statistics¤tPage=1&searchType=&searchText=. Accessed 30 November 2011.
. 2012. ECOREA Environmental Review 2011. Gyeonggi-do. http://eng.me.go.kr/board.do?method=view&docSeq=8675&bbsCode=law_law_paper¤tPage=1&searchType=&searchText=. Accessed 30 November 2011.
MoEJ (Ministry of the Environment of Japan).2009. WEPA Outlook on Environmental Management Strategies in Asia. Hayama: Institute for Global Environmental Strategies.
Yu, Soon-Ju. 2010. “Progress of Water Environment Management and Future Challenges in KOREA.” Presentation at the 6th WEPA Annual Meeting, Tokyo, Japan, 24 February.
Chapter 3.6 Lao PDRFAO (Food and Agriculture Organization of the United Nations). 2011.
Main AQUASTAT Country Database. http://www.fao.org/nr/water/aquastat/data/query/index.html?lang=en. Accessed 20 December 2011.
Chanthavong, Phouvong. 2011. “Groundwater for Water Supply in Laos.” Presentation at the Launch Meeting of Asia-Pacific Water Forum Knowledge Hub for Groundwater Management, Bangkok, Thailand, 2 June.
Komany, Souphasay. 2008. “Water Quality Monitoring and Management in Lao PDR: The Case Study of Nam Ngum River Basin.” In Oral Presentation Proceedings, the 3rd WEPA International Forum on Water Environmental Governance in Asia, Tokyo: Ministry of the Environment of Japan.
. 2011. “Water Quality Monitoring at Reservoir of Nam Ngum 2 Hydropower Dam and Upper Reservoir of Nam Ngum 1 Hydropower Dam.” Presentation at the 3rd WEPA International Workshop, Manila, the Philippines, 21 September.
MoEJ (Ministry of the Environment of Japan).2009. WEPA Outlook on Environmental Management Strategies in Asia. Hayama: Institute for Global Environmental Strategies.
MoNRE (Ministry of Natural Resources and Environment of Lao PDR). 2011. “MoNRE Plan for 2011-2015.” A Presentation Material on 11 July.http://www.rtm.org.la/documents/SWG/Agriculture/MoNRE%20Plan%20for%202011-2015.pdf. Accessed 20 January 2012.
MRC (Mekong River Commission). 2010. State of Basin Report 2010. Vientiane. http://www.mrcmekong.org/assets/Publications/basin-reports/MRC-SOB-Summary-reportEnglish.pdf. Accessed 20 January 2012.
Phonvisai, Phengkhamla. 2011. “Water Quality Monitoring in Vientiane Capital City.” Vientiane: Unpublished material.
WEPA (Water Environment Partnership in Asia) database. (n.d). http://www.wepa-db.net/policies/measures/currentsystem/laos.htm. Accessed 20 January 2012.
WREA (Water Resources and Environment Administration of Lao PDR). 2010. Agreement on the National Environmental Standards. Vientiane.
Chapter 3.7 MalaysiaDoE (Department of Environment, Ministry of Natural Resources and
Environment of Malaysia). 2011. Environment Quality Report (EQR) 2010. Kuala Lumpur.http://www.doe.gov.my/portal/publication-2/browse/Publication%20-%20Penerbitan/. Accessed 10 January 2012.
. 2010. Environmental Requirements: A Guide for Investors 11th Edition. October. http://www.doe.gov.my/portal/wp-content/uploads/2010/12/A-Guide-For-Investors1.pdf. Accessed 10 January 2012.
Economic Planning Unit of Prime Minister’s Department. 2010. 10th Malaysian Plan 2011-15. http://www.pmo.gov.my/dokumenattached/RMK/RMK10_Eds.pdf. Accessed 10 October 2011.
How, Tan Sieow. 2008. “Success Story on Benefits and Issues in Implementing Performance Monitoring of Industrial Effluent Treatment Systems (IETS).” Industrial Effluents Issue 1/2008: 22-28. Kuala Lumpur: Department of Environment, Malaysia. http://www.doe.gov.my/portal/wp-content/uploads/2010/07/e-magazine01A4.pdf. Accessed 20 October 2011.
Keong, Loh Chee. 2008. “Success Story on Benefits and Issues in Implementing Performance Monitoring of Industrial Effluent Treatment Systems (IETS).” Industrial Effluents Issue 1/2008: 12-21. Kuala Lumpur: Department of Environment, Malaysia http://www.doe.gov.my/portal/wp-content/uploads/2010/07/e-magazine01A4.pdf. Accessed 20 October 2011.
Ministry of Science, Technology and the Environment of Malaysia. 2002. Dasar Alam Sekitar Negara (National Policy on the Environment). http://www.doe.gov.my/portal/wp-content/uploads/2010/07/dasar_alam_sekitar_negara.pdf. Accessed 10 October 2011.
MoEJ (Ministry of the Environment of Japan).2009. WEPA Outlook on Environmental Management Strategies in Asia. Hayama: Institute for Global Environmental Strategies.
MoSTI (Ministry of Science, Technology and Innovation of Malaysia). 2010. Official Portal Malaysian Meteorological Department. http://www.met.gov.my/index.php?option=com_content&task=view&id=69&Itemid=160&lang=english. Accessed 23 February 2012.
Shariffuddin, Syazrin Syima. 2011. “Progress of water environmental governance/management and future challenges in Malaysia.” Presentation at the 6th WEPA Annual Meeting, Tokyo, Japan, 24 February . http://www.doe.gov.my/portal/wp-content/uploads/2010/07/dasar_alam_sekitar_negara.pdf. Accessed 20 October 2011.
137
ReferencesWEPA Outlook on Water Environmental Management in Asia 2012
Chapter 3.8 MyanmarAkaishi, Fumiko., M. Satake, M. Otaki, and N. Tomonaga. 2006. Surface
Water Quality and Information about the Environment Surrounding Inle Lake in Myanmar. Limnology 7(1): 57-62.
Khin Lay Swe. 2011. “Development of Clean Water and Sanitation in Inle Lake, Myanmar.” Presentation at the Seminar on Water and Environment in Asia’s Developing Communities, Singapore International Water Week, Singapore, 6 July. http://endeavour.newri.ntu.edu.sg/Documents/seminar110706-105.pdf. Accessed 10 August 2011.
MoEJ (Ministry of the Environment of Japan).2009. WEPA Outlook on Environmental Management Strategies in Asia. Hayama: Institute for Global Environmental Strategies.
Ra, Khon. 2011. “Water Quality Management at River Basin in Myanmar.” Presentation at the 3rd WEPA International Workshop, Manila, the Philippines, 21 September. http://www.wepa-db.net/pdf/0712forum/paper38.pdf. Accessed 10 August 2011.
Than, Mu Mu. 2007. “Community Activities Contribution to Water Environment Conservation of Inle Lake.” Presentation at the 2nd WEPA International Forum, Beppu, Japan, 4 December. http://www.wepa-db.net/pdf/0712forum/paper38.pdf. Accessed 9 September 2011.
Chapter 3.9 NepalCBS (Central Bureau of Statistics). 2008. Environmental Statistics of Nepal.
Kathmandu.Government of Nepal. 2002. National Water Plan. Kathmandu. http://www.wec.gov.np/hkk/noticefile/national_water_plan_1301399606_1303997281.pdf. Accessed 10 September 2011.
ICIMOD (International Centre for Integrated Mountain Development). 2007. Kathmandu Valley Environment Outlook. Kathmandu. http://books.icimod.org/uploads/ftp/KVEO-Full-text.pdf. Accessed 10 September 2011.
NTNC (National Trust for Nature Conservation). 2009. Bagmati Action Plan. http://wldb.ilec.or.jp/ILBMTrainingMaterials/resources/nepal_strategy.pdf. Accessed 10 September 2011.
Sharma, Subodh, R.M. Bajracharya, B.K. Sitaula and J. Merz. 2005. “Water Quality in the Central Himalaya.” Current Science 89 (5): 774-786.
WECS (Water and Energy Commission Secretariat). 2000. Water Resources Strategy Formulation Phase II Study. Prepared by WRSF Consortium for Water and Energy Commission Secretariat, Kathmandu
. 2011. Water Resources of Nepal in the Context of Climate Change. Kathmandu.
WEPA (Water Environment Partnership in Asia) database. (n.d). http://www.wepa-db.net/policies/state/nepal/overview.htm. Accessed 10 September 2011.
Chapter 3.10 PhilippinesCuna, Juan Miguel T. 2011. “Current Policy Responses to Attain National
Water Quality Target and Future Challenge: Experiences in the Philippines.” Presentation at the 3rd WEPA International Workshop, Manila, Philippines, 21 September.
DENR-EMB (Department of Environment and Natural Resources, Environmental Management Bureau). 2007. Nation Water Quality Status Report 2001-2005.
. 2009. WATER QUALITY MONITORING MANUAL VOLUME 2: Manual on Effluent Water Quality Monitoring. http://emb.gov.ph/wqms/policies/Procedural%20Manual%20for%20WQMA%20Designation-%205%20Oct%202009-rev4.pdf. Accessed 12 February 2012.
MoEJ (Ministry of the Environment of Japan).2009. WEPA Outlook on Environmental Management Strategies in Asia. Hayama: Institute for Global Environmental Strategies.
Tuddao, Vicente. B. Jr. 2011. “Water Quality Management in the Context of Basin Management: Water Quality, River Basin Management and Governance Dynamics in the Philippines.” Presentation at the 3rd WEPA International Workshop, Manila, Philippines, 21 September.
Chapter 3.11 Sri LankaCEA (Central Environmental Authority). 2011. Review of the water quality
of Bolgoda Lake. Colombo.
. (n.d.). Concept paper on continuation of Pavithra Ganga Programme Colombo.
IGES (Institute for Global Environmental Strategies). 2007. Sustainable groundwater management in Asian cities. Hayama: IGES.
MENR (Ministry of Environment and Natural Resources). 2008. Caring For Environment 2008-2012. Colombo. http://www.environmentmin.gov.lk/temporary_files/Caring%20for%20the%20Environment%20(Action%20Plan%202008-2012.pdf. Accessed 10 December 2011.
MENR and UNEP (MENR and United Nations Environment Programme). 2009. Sri Lanka Environment Outlook 2009. Battaramulla.
Nandalal, K.D.W. 2010. “Groundwater Resources.” In Proceedings of the National Forum on Water Research Identification of Gaps and Priorities. 16-17 September, Colombo, Sri Lanka.
NCSD (National Council for Sustainable Development) and Presidential Secretariat. 2009. National Action Plan for the Haritha Lanka Programme. Colombo.
Ratnayake, R.M.S.K. 2010. “Urbanization and Water Quality Control for the Source of
Water in Colombo City, Sri Lanka.” Paper submitted to the 1st WEPA International Workshop, Hanoi, Viet Nam, 8-9 March.
UNESCO (United Nations Educational, Scientific and Cultural Organization) and MoAIMD (UNESCO and Ministry of Agriculture, Irrigation and Mahaweli Development). 2006. Sri Lanka Water Development Report. http://unesdoc.unesco.org/images/0014/001476/147683E.pdf. Accessed 10 January 2012.
Chapter 3.12 ThailandMoEJ (Ministry of the Environment of Japan).2009. WEPA Outlook on
Environmental Management Strategies in Asia. Hayama: Institute for Global Environmental Strategies.
Office of National Water Resources Committee. 2000. National Water Vision: A Case Study of Thailand.
PCD (Pollution Control Department). 2006. State of Thailand Pollution in Year 2005 (in Thai). Bangkok.
. 2007. State of Thailand Pollution in Year 2006 (in Thai). Bangkok. . 2010. Thailand State of Pollution Report 2008 (in Thai). Bangkok. . 2011. Thailand State of Pollution Report 2010 (in Thai). Bangkok.Yolthantham, T. 2011. “Water Environmental Governance/Management
and Future Challenges of Thailand.” Presentation at the 2nd WEPA International Workshop, Tokyo, Japan, 23 February.
Chapter 3.13 Viet NamHanh, Hoand Duc and Nguyen The Dong. 2011. “Progress of Water
Environmental Governance/Management and Future Challenges in Viet Nam.” Presentation at the 6th WEPA Annual Meeting, Tokyo, Japan, 23-24 February.
MoEJ (Ministry of the Environment of Japan).2009. WEPA Outlook on Environmental Management Strategies in Asia. Hayama: Institute for Global Environmental Strategies.
MoNRE (Ministry of Natural Resources and Environment of Viet Nam). 2005. State of the Environment Report 2005. Hanoi.
. 2006. State of Environment Report 2006. Hanoi. . 2010. State of the Environment Report 2010. Hanoi.Nga, Pham Thi Nguyet. 2011. “Current situation of water quality in Viet
Nam and recent policy responses.” Presentation at the 3rd WEPA International Workshop. Manila, Philippines, 21-22 September.
Nguyen, Hoang Anh. 2010. “Wastewater management and treatment in urban areas in Viet Nam. “Presentation at the 1st WEPA International Workshop, Hanoi, Viet Nam, 9 March 9.
Ngueyn, Minh Son. 2007. “Report on Water Quality Component.” A Consultant’s Report for the Water Sector Review Project. http://www.vnwatersectorreview.com/files/Water_quality_EN.pdf. Accessed 17 January 2012.
Nhuan, Mai Trong, Tran Ngoc Anh, Truong Quang Hoc and Pham Van Cu. 2010. “Water Environment in Viet Nam: opportunities and challenges for sustainable management in the context of climate change. “Presentation at the 1st WEPA International Workshop, Hanoi. Viet Nam, 9 March.

138

www.wepa-db.net
Ministry of the Environment, JapanWater Environment DivisionEnvironmental Management Bureau
1-2-2 Kasumigaseki, Chiyoda-ku, Tokyo, 100-8975, JapanTEL: +81 3 3581 3351, FAX: +81 3 3593 1438URL: http://www.env.go.jp/en/
Institute for Global Environmental Strategies (IGES)Freshwater Sub-group
2108-11 Kamiyamaguchi, Hayama, Kanagawa, 240-0115, JapanTEL: +81 46 855 3700, FAX: +81 46 855 3809E-mail: [email protected], URL: http://www.iges.or.jp/
[ WEPA Secretariat ]