welfare state legitimacy: the republic of ireland in ... · pdf filewelfare state legitimacy:...
TRANSCRIPT
Geary WP 2005/10 1
GGEEAARRYY DDIISSCCUUSSSSIIOONN PPAAPPEERR
SSEERRIIEESS
Welfare State Legitimacy: The Republic of Ireland in Comparative Perspective
Diane Payne (Geary Institute, University College Dublin)
Anthony McCashin (Trinity College Dublin) This paper is produced as part of the Public Opinion and Political Behaviour research programme at Geary; however the views expressed here do not necessarily reflect those of the Geary Institute. All errors and omissions remain those of the author.
Geary WP 2005/10 2
Welfare State Legitimacy: The Republic of Ireland in Comparative Perspective
Diane Payne (Geary Institute, University College Dublin) Anthony McCashin (Trinity College Dublin)
Paper presented at the ESPAnet05 Conference at the University of
Fribourg, Switzerland, on 22nd to 24th September 2005.
Introduction This paper arises from two recent, inter-related strands in the comparative analysis of welfare states. First, Esping-Andersen’s (1990) celebrated Three Worlds analysis has spawned a rich literature on welfare regimes and the place of individual countries (and groups) of countries in his typology. Ireland’s place in the worlds of welfare is ambiguous. Esping-Andersen (1990: 35-78) locates Ireland in the liberal category on the basis of its low de-commodification score. However, in analyzing the detailed attributes of welfare states he describes Ireland as having low scores on socialist regime attributes, low scores on liberal attributes and medium scores on conservatism. A standard work on comparative social policy, however, unambiguously describes Ireland as ‘Catholic corporatist’ (Cochrane and Clarke, 1993), a description that owes much to the role of the Catholic church in one well-documented instance of Church–state conflict in social policy and to the persistent adherence of the population to Catholic moral norms and religious practice well in to the 1980s. Recent commentaries on specific aspects of social policy also allude to the corporatist elements in Irish social policy. For example, Millar and Adshead elaborate on Cochrane and Clarke’s analysis and in an institutionalist analysis of the health care regime conclude that the “‘Catholic corporatist’ paradigm is still a fruitful one in investigations of the Irish welfare state” (Millar and Adshead, 2004: 18). In the case of social security, Daly and Yeates point to the strong British influence in the emergence and later development of the system, but they also highlight a “new corporatism” as an important factor in the recent development of social security policy (Daly and Yeates, 2001:94). This account rests on the existence of formal, national social pacts in which some aspects of social protection policy are formulated in a consultative process involving the government and the social partners. Cousins’ (1997) observations on Esping- Andersen emphasize aspects of the Irish welfare state that highlight some similarities with the Mediterranean and semi-peripheral states- late industrialization, clientilist and populist politics, strong agrarian influences and
Geary WP 2005/10 3
centralized state structures. More recently, Bonoli (1997) offered a ‘two dimensional’ analysis of both the scale of state social spending and the source of revenue (whether taxation or social insurance). This exercise identifies Ireland as having a low level of state spending and a low share of social insurance in social spending, and therefore firmly locates Ireland in the liberal world. Indigenous analysts have tended to focus on Ireland’s late, state-sponsored industrialization in an already globalised world economy. This perspective, stressing the role of the state in simultaneously achieving economic development and social improvement, has given rise to the recent characterization ‘developmental welfare state’ (O’Riain and O’ Connell, 2000; Breen, Hannan, et al, 1990, NESC, 2005). Second, the welfare regime literature has been enriched by the search for the normative basis of various regimes. A number of researchers have analysed international data sets with a view to ‘matching’ the three-worlds typology with cross-national variations in normative support for the welfare state. (Papadikis, 1992; Peillon, 1995; Svallors, 1997; Gelissen, 2000; Gelissen, 2001; Bonoli, 2000; Quadagno and Blekesaune, 2003). To date, the outcomes of this research have been somewhat inconclusive. On the one hand, Gelissen (2000:298-299), reports from his study that “ [no] evidence was found for the thesis of there being a relationship between the type of welfare state, as defined by Esping-Andersen, and levels of popular support for the welfare state”. On the other, Svallors (1997: 295) found support for regimes in the form of “rather clear-cut configurations regarding the aggregated levels of attitudes” (albeit four rather than three regimes in this study). Likewise, Andrefs and Theien (2001) offer support for regime-consistent variation in welfare state attitudes. Taylor-Gooby (1991) suggested that welfare regimes’ norms might be distinguished not by their overall level of legitimation, but by the patterns of cleavage within regimes; corporatist regimes, for example, will display strong support for employment and social insurance based welfare. This line of reasoning has yet to be confirmed or refuted. Ireland’s profile in these comparative studies is puzzling: in the limited evidence available it is consistently recorded as having a very high level of welfare state legitimacy – one that is intuitively implausible, or at least puzzling. The next section outlines this in more detail. Against this background, Bonoli (2000) argued that the inconclusiveness in the comparative studies derives from a reliance on an overly narrow definition of welfare state legitimacy. Pointing out that much of the comparative work relies on the ISSP items about the role of government specifically in relation to social protection, he suggests (2000:432) that:
the analysis of welfare regimes cannot be limited to the welfare state only, but must be expanded and encompass other sources of non-market based economic security, such as labour laws and collective bargaining by labour market actors. These sources of economic security play an important role in many European countries and do affect people’s perceptions of what is appropriate practice in given areas of social
Geary WP 2005/10 4
protection. They are part of the traditional political economy of nations, and can be expected to translate into observable patterns of what mass publics expect from their governments in terms of social protection.
Bonoli analysed public attitudes towards a range of political economy issues- as distinct from social protection – and showed that when this wider definition of social protection is adopted, it is possible to clearly identify welfare regimes. Our analysis bridges these two concerns. We draw on national survey data about attitudes to social policy in an attempt to clarify the dimensions of welfare state attitudes, and we offer a view, based on these data, about what ‘type’ of welfare state the Irish population legitimizes. We go beyond Bonoli’s approach and set out a framework for the analysis of the link between the welfare state and cultural values, offering an analysis of welfare state legitimacy in Ireland based on a wide range of survey data. To anticipate our findings, we confirm the value of a ‘broad’ approach, and we report a legitimation picture of Ireland that is somewhat liberal in orientation. This leads us to conclude that accounts of Ireland that emphasise its so-called corporatist traits require revision, and that the liberal patterns of legitimation are strongly consistent with policy and observed outcomes. Ireland in the ISSP Table 1 below summarises the existing published data on the aggregate levels of welfare state support in Ireland along with selected data from countries representing the three worlds- West Germany (Corporatist), Norway (Social Democratic), United Kingdom (Anglo-Saxon) These data record very high levels of welfare legitimacy for Ireland. Peillon’s study based on the 1990 ISSP role of government items shows that its welfare legitimacy equates with that of the former GDR, leading him to note “striking popular support for the welfare state in Ireland” (Peillon, 1995: 3) Support for social protection in Ireland is significantly higher in these data than that for the UK, and yet Irish provisions and policies have remained close to their British origins. In each of the rows of the table the overall level of welfare legitimacy is as high – or higher- than the figure for the social democratic regime. This picture contrasts with Ireland’s allocation to the liberal category in most of the welfare regime literature (Bonoli, 1997: Castles and Mitchell, 1993: Esping-Andersen, 1990). The details of welfare state support in the table report the figures in Peillon’s (1995) paper. A similar pattern is evident in the 1996 unpublished ISSP data (data not given here). On the corresponding items in this later data set the aggregate levels of welfare support are as high in Ireland – or higher- than corporatist or social democratic countries. Following Gelissen’s (2001: 495-501) discussion, we can note two broad approaches to understanding cross-national differences in beliefs about redistribution. The institutionalist model argues that beliefs and opinions are influenced by social structure: what people consider fair and legitimate will reflect the actual distribution of rewards and outcomes. In contrast, the ideology model argues that societies have specific cultural traditions, relations and values that affect the development of attitudes. These values then underpin the institutions, attitudes, and social and economic regulation that comprise
Geary WP 2005/10 5
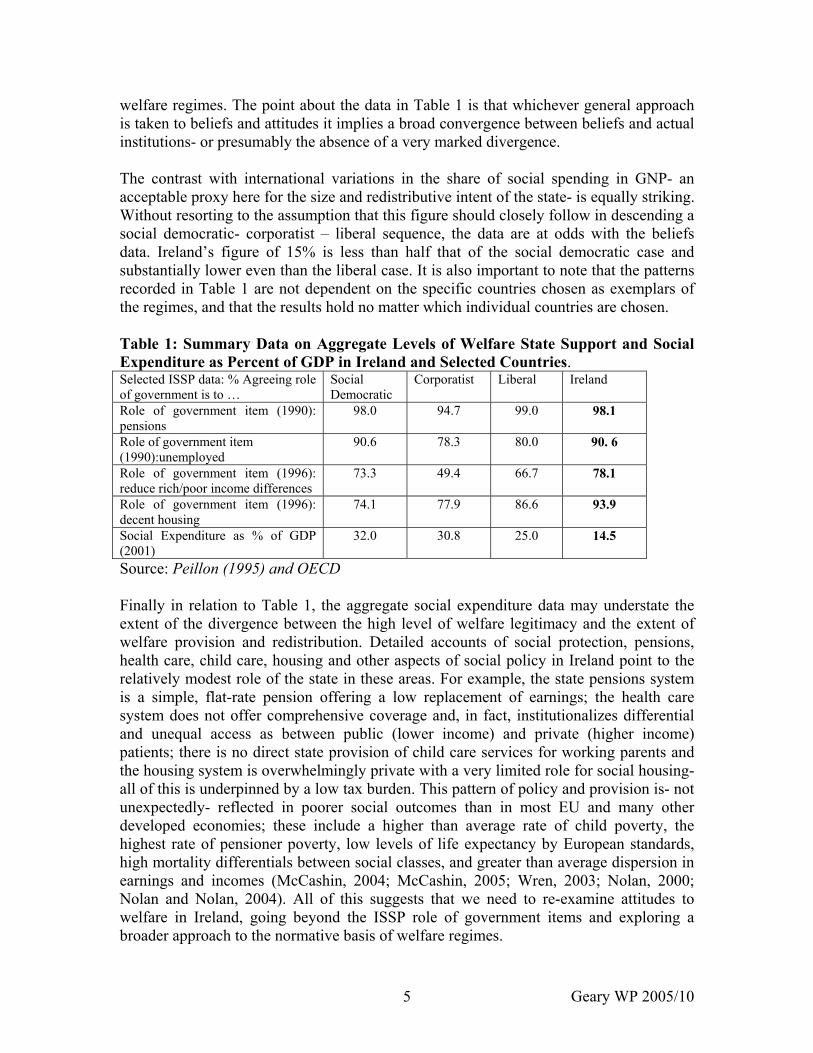
welfare regimes. The point about the data in Table 1 is that whichever general approach is taken to beliefs and attitudes it implies a broad convergence between beliefs and actual institutions- or presumably the absence of a very marked divergence. The contrast with international variations in the share of social spending in GNP- an acceptable proxy here for the size and redistributive intent of the state- is equally striking. Without resorting to the assumption that this figure should closely follow in descending a social democratic- corporatist – liberal sequence, the data are at odds with the beliefs data. Ireland’s figure of 15% is less than half that of the social democratic case and substantially lower even than the liberal case. It is also important to note that the patterns recorded in Table 1 are not dependent on the specific countries chosen as exemplars of the regimes, and that the results hold no matter which individual countries are chosen. Table 1: Summary Data on Aggregate Levels of Welfare State Support and Social Expenditure as Percent of GDP in Ireland and Selected Countries. Selected ISSP data: % Agreeing role of government is to …
Social Democratic
Corporatist Liberal
Ireland
Role of government item (1990): pensions
98.0 94.7 99.0 98.1
Role of government item (1990):unemployed
90.6 78.3 80.0 90. 6
Role of government item (1996): reduce rich/poor income differences
73.3 49.4 66.7 78.1
Role of government item (1996): decent housing
74.1 77.9 86.6 93.9
Social Expenditure as % of GDP (2001)
32.0 30.8 25.0 14.5
Source: Peillon (1995) and OECD Finally in relation to Table 1, the aggregate social expenditure data may understate the extent of the divergence between the high level of welfare legitimacy and the extent of welfare provision and redistribution. Detailed accounts of social protection, pensions, health care, child care, housing and other aspects of social policy in Ireland point to the relatively modest role of the state in these areas. For example, the state pensions system is a simple, flat-rate pension offering a low replacement of earnings; the health care system does not offer comprehensive coverage and, in fact, institutionalizes differential and unequal access as between public (lower income) and private (higher income) patients; there is no direct state provision of child care services for working parents and the housing system is overwhelmingly private with a very limited role for social housing- all of this is underpinned by a low tax burden. This pattern of policy and provision is- not unexpectedly- reflected in poorer social outcomes than in most EU and many other developed economies; these include a higher than average rate of child poverty, the highest rate of pensioner poverty, low levels of life expectancy by European standards, high mortality differentials between social classes, and greater than average dispersion in earnings and incomes (McCashin, 2004; McCashin, 2005; Wren, 2003; Nolan, 2000; Nolan and Nolan, 2004). All of this suggests that we need to re-examine attitudes to welfare in Ireland, going beyond the ISSP role of government items and exploring a broader approach to the normative basis of welfare regimes.
Geary WP 2005/10 6
A Broader Approach Our analysis of the normative basis of the welfare state builds on the framework elaborated by Pfau-Effinger (2005). She argues that - notwithstanding the growing body of empirical cross-national work on attitudes to welfare – there has been insufficient conceptual clarity about the role of culture in the welfare state. Invoking the concept of ‘welfare culture’ as the ‘relevant ideas in a given society surrounding the welfare state and the way it is embedded in society’, Pfau-Effinger points out that there are three levels of welfare culture: values and models as a basis for policy; cultural values and beliefs in the population at large; and public and political discourses that mediate between the attitudes of the public, on the one hand, and political decisions, on the other (2005: 4-10). The implication of this distinction between levels of culture is that existing research on welfare regimes and legitimacy is focused only on one level of culture- popular beliefs. This may help to explain the inconclusive findings in the research to date. Turning to the specific content of welfare culture, Pfau-Effinger outlines the key domains of welfare beliefs and ideals. The cultural foundations of policies towards work and employment: this refers to ideas about the role of employment in peoples’ lives, expectations about which social groups should be integrated into employment, and ideas about how social protection and employment should be connected; Cultural ideas about citizenship and social inclusion: here the point is that welfare states’ policies are based on notions of ‘solidarity’ and ‘integration’ and these may vary. Cultural basis of redistribution: welfare policies reflect, in part, underlying beliefs about justice and redistribution, and populations will vary in the relative importance they ascribe to need, fairness, personal responsibility, incentives and so on, as the criteria for structuring remuneration systems, and tax and social policies generally. Cultural values about poverty: Differences across countries in beliefs about the causes of poverty may be related to differences in welfare states’ policies. Specifically, the extent to which poverty is regarded as the fault of the individual rather than inflicted by society may be a crucial factor in shaping a welfare state. For example, those cultures (typically the US) that emphasise individual effort are unlikely to sustain strongly interventionist or redistributive social policies. Cultural ideas about state-market relationships: Populations may differ about the roles of the state and the market in the economy, both in terms of the general beliefs about the state and beliefs about state versus market provision in specific areas of policy (health, employment, price control, wage determination, income inequality, taxation etc.) Cultural ideas about services, the welfare mix and the family: Populations differ in terms of cultural preferences about the mix of family, state and market in the production of
Geary WP 2005/10 7
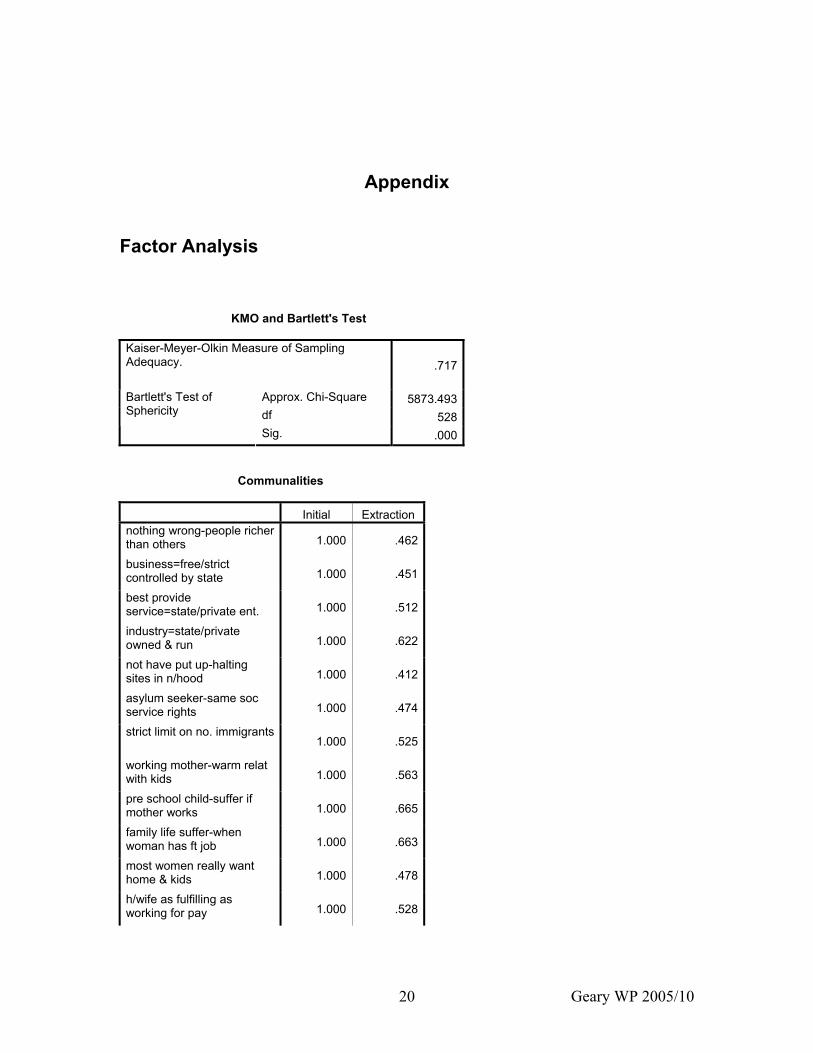
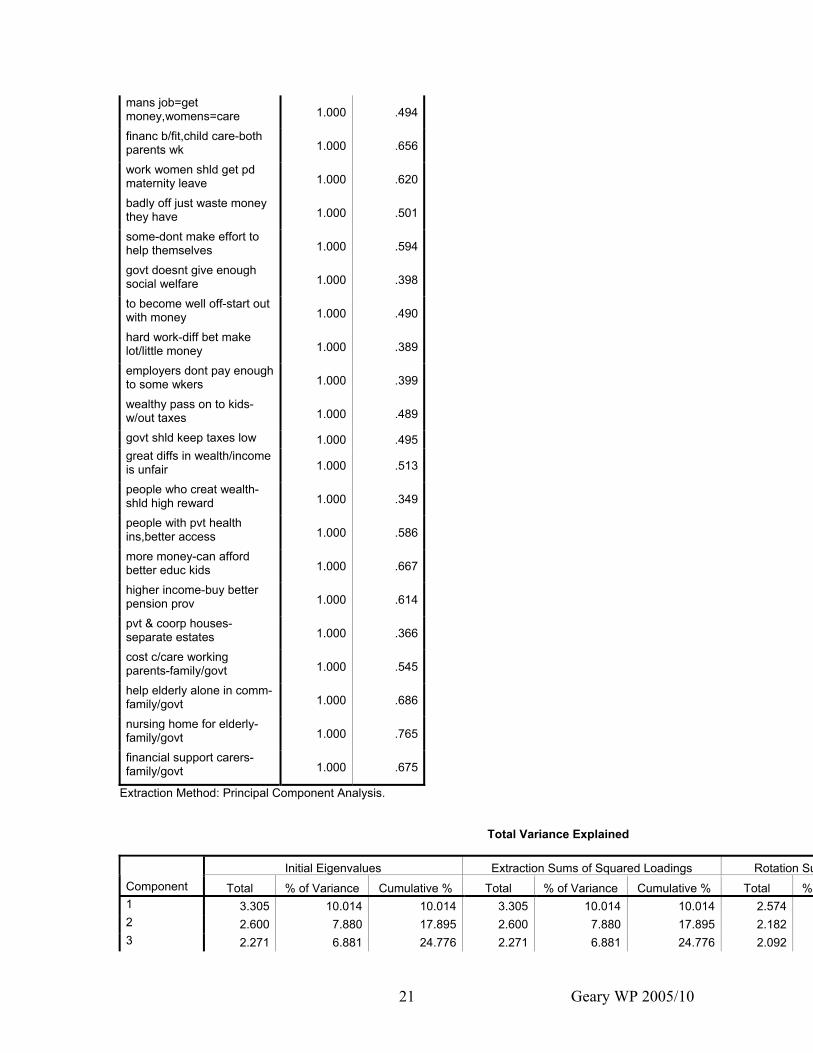
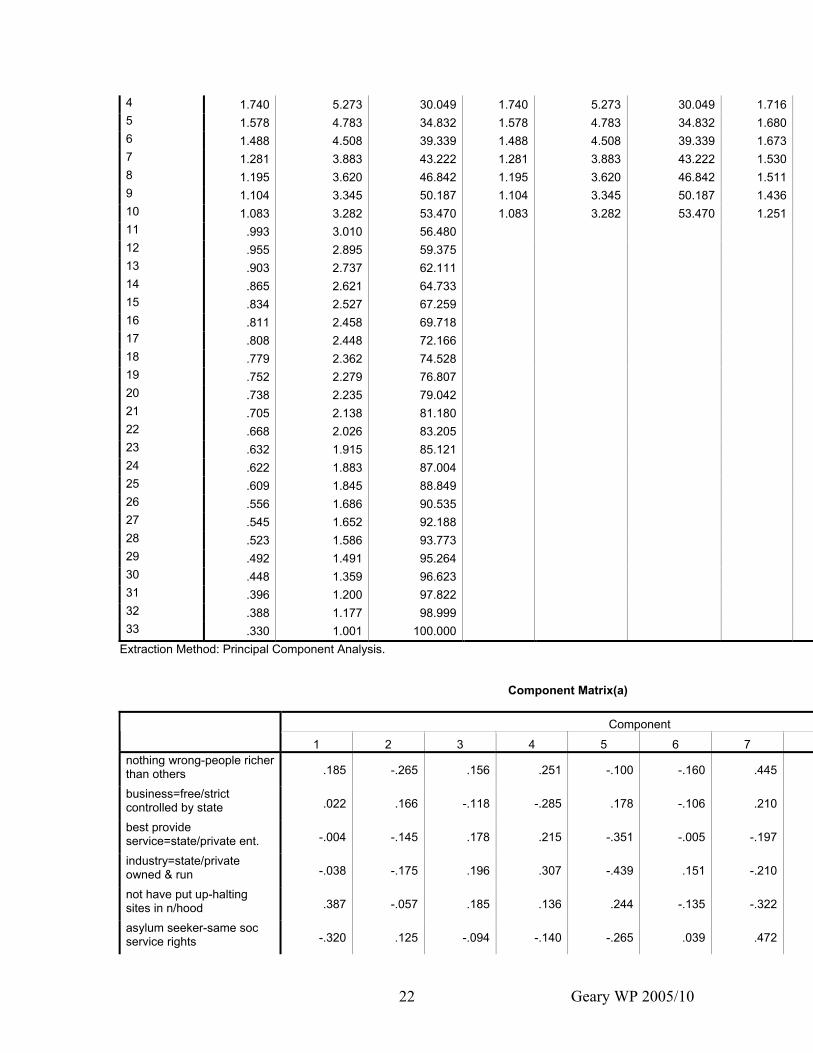
welfare, and this may lead to quite different types and levels of provision of social services in relation to the elderly, children, and so on. At a conceptual level, it is obviously possible to debate the underlying logic of the separate elements of welfare culture. Equally, it is a matter for empirical research to determine whether, and to what extent, these a priori elements of welfare culture exist in reality in specific contexts, and whether these supposed elements of welfare culture can be identified statistically as specific dimensions of public attitudes. For our purposes, we will use the framework outlined above and give an overview of the welfare culture in Ireland. In this exercise we draw on a national representative survey of social and political attitudes in (the Republic of Ireland), the Irish Social and Political Attitudes Survey (ISPAS). This survey was undertaken in Spring 2002 and had a total sample of 2,500 persons aged 18 and over drawn from the electoral register. The survey questionnaire was administered by the fieldwork team of the Economic and Social Research Institute and contained a core questionnaire covering demographic and related variables and four attitudinal modules: using a split-design sample, one half of the total (1250) were administered the core questionnaire and two modules on race/ethnicity and the environment; the other half were administered the core and two other modules- one on gender and the family and one on attitudes to social justice. Our analysis is therefore based on the 1,250 respondents in the latter half of the sample design whose views we elicited on a range of social justice items. A full account of the research design, sampling strategy, and details of the attitude items is given in a forthcoming publication (Garry, Payne, and Hardiman, 2005). In this exploratory exercise we merely attempted to identify the dimensions of welfare state attitudes in Ireland, leaving it to later work to undertake a multivariate analysis. To this end we applied factor analysis to a wide range of material in the ISPAS. It should be stated that the attitude items were not formulated with a view to testing the specific elements outlined in Pfau- Effinger, but taken as a whole our data span many of the domains she outlines. The ISPAS survey elicited respondents’ beliefs about inequality, the role of the state in the economy, the relationship between gender, family and work, the causes of individuals’ poverty- whether personal or societal, the relative roles of the family and state in care provisions, the role of private market provisions and incentives, wealth, and welfare provisions for minorities. Although ISPAS contained many questions about specific aspects of current policies in Ireland, we confine ourselves to material about general beliefs (following Bonoli’s strategy). The relevant details about the factor analysis are given in the appendix. After a variety of analyses the results there, based on a Principal Component Analysis using Varimax Rotation, represent what might be close to the most satisfactory analysis possible. First, the KMO (0.717) and Bartlett’s (chi-square = 5873.49, df=528, sig .000) tests confirm the statistical adequacy of the factoring exercise; although ideally the KMO should be in the range above 0.8, a value of 0.5 is an acceptable minimum. Second, the factors explain 54% of the variance, when thirty three items are included in the analysis. Third, the number of factors is a far from ideal solution: specifications limiting the number of factors gave useful results but at the cost of a noticeable reduction in the proportion of
Geary WP 2005/10 8
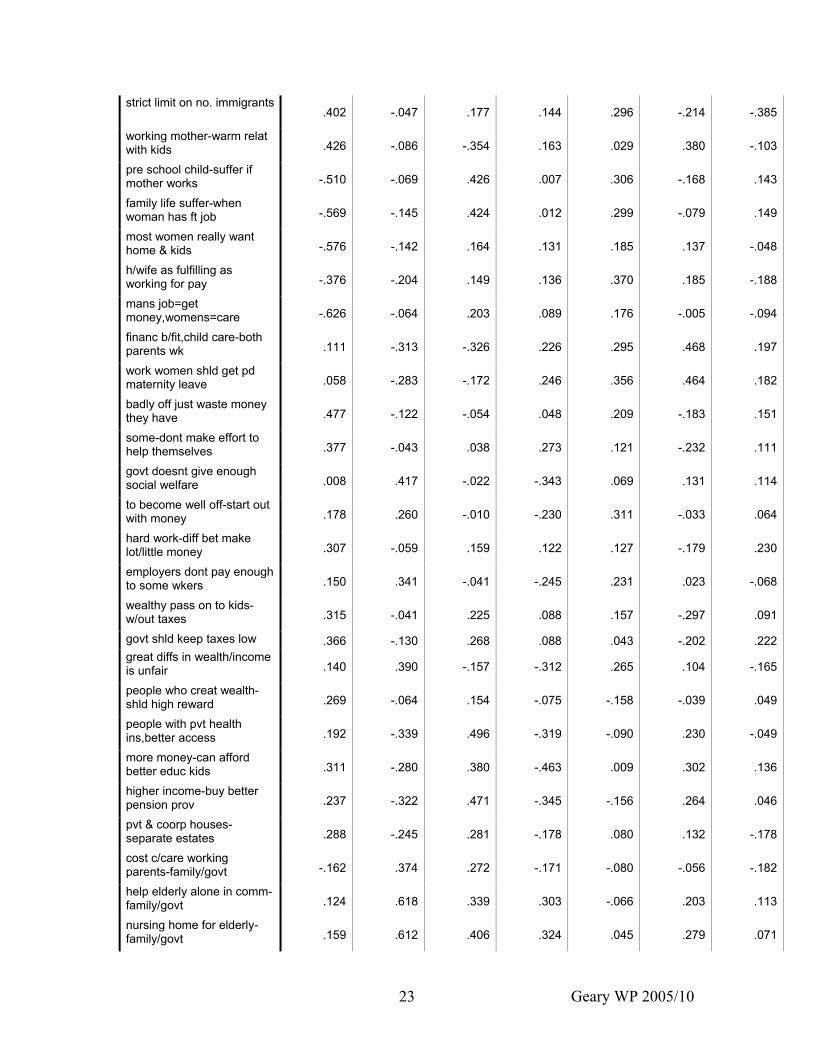
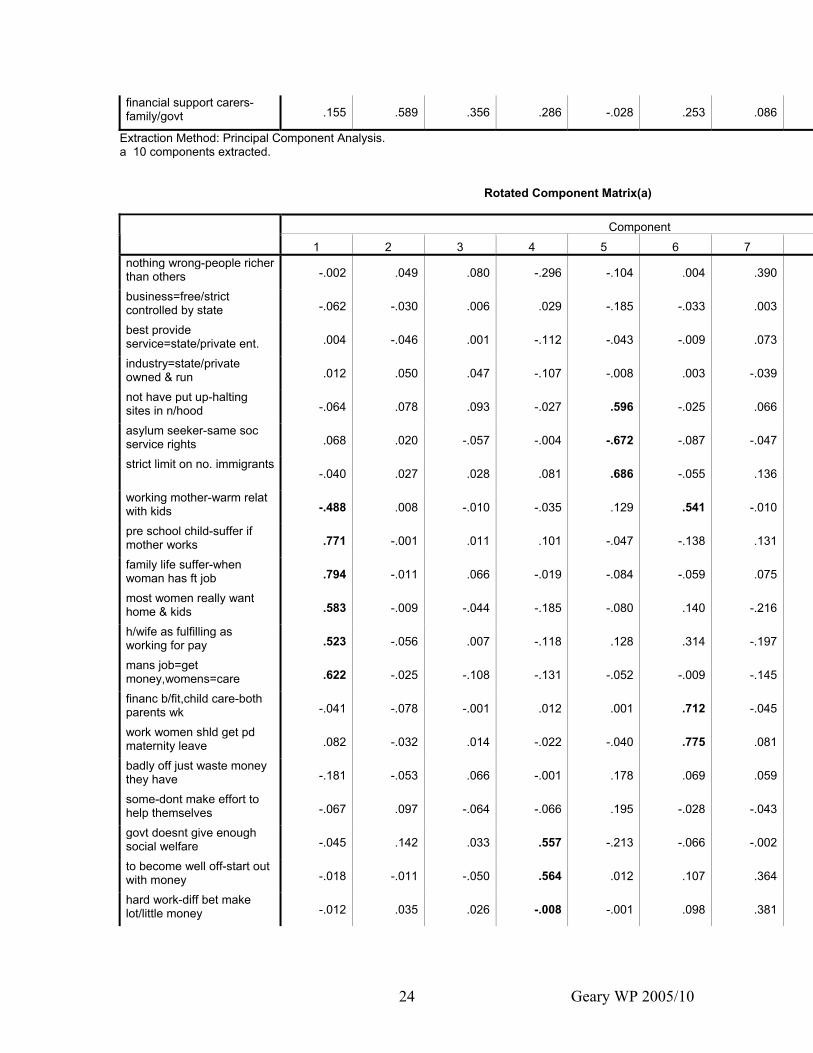
variance explained. The sharp ‘scree’ diagram in the appendix allows an intuitive understanding of the factors and their relative importance. Fourth, as this is an exploratory analysis, we are less concerned to distill technically clear results than to generate data that allow us to consider the dimensions of welfare state legitimacy. Before turning to the details about individual items, we offer an overview of the factors and comment on their implications. The first factor is the familiar Familialism/Male Breadwinner syndrome. This reflects items about women’s role in the home, views about the impact on the family of married women’s labour market participation, and so on. The relevant items here all have loadings in the range .5 to .8. It is important to note that the questionnaire contained an entire module on aspects of the family and public policy. Hence the importance of this factor may be, in part, an artifact of the sheer number of relevant items. However, the factor stubbornly asserts itself in a variety of factor analyses using different items and varying numbers of items. Second, a Social Care factor emerges from the items that asked respondents to choose the relative importance (on a scale from 0 to 10) of the state or the family in responding to these care needs: the costs of supporting older people at home, giving financial support to carers, helping older people in the community, and meeting the costs of child care for working parents. All three items in relation to the elderly load highly on this factor, while the loading on working parents’ child care needs is very low. The third factor, which we term Private Welfare emerges from the items that identify beliefs about fairness. Here respondents were asked about whether private provision and its associated inequalities in terms of access to health, education, pensions and housing is fair. These items comprise one factor, although the loading for the housing item was below 0.5. The logic underpinning these items is that issues of social equity and fairness are articulated in Ireland the context of the hybrid, public-private mix in Irish social policy. A number of items about poverty and wealth load on the fourth factor, Income Equality. Three of the items here relate to the question about why respondents believe some people are poor and some are well off. These items are indicative of a societal dimension to respondents’ perception of why some people are poor and some are well-off; because the government does not give enough money to people on social security, or employers do not pay enough, or because people only do well if they have money to begin with. The loadings here are approximately 0.6. A fourth item reaches a loading close to 0.7: this is a separate item (great differences in wealth and income are unfair) from a battery of six that elicited views on wealth and how it should be shared. The fifth factor may reflect what Pfau-Effinger refers to as cultural beliefs about Social Inclusion and Integration, and incorporates attitudes towards immigration and resettlement provisions and policies towards Ireland’s indigenous, nomadic minority, the Travelers. A longer, more detailed questionnaire would have allowed us to explore this dimension further. Clearly, it is pointing to a ladder, or hierarchy, of willingness to provide welfare, documented in Davis’s (1977) now dated psychological survey. It is
Geary WP 2005/10 9
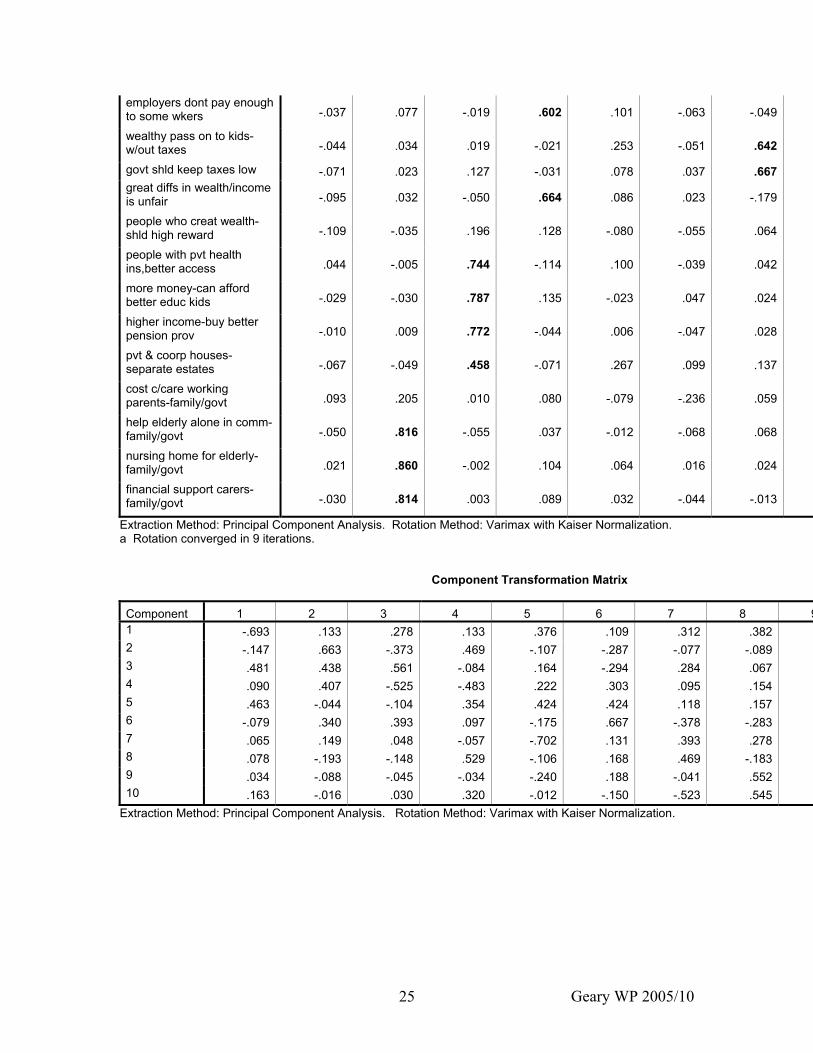
possible that further detailed items on the unemployed, lone parent families, and so on, would reveal quite conditional, stigmatizing attitudes towards certain social groups. A sixth factor, Maternal Employment, emerges quite separately from the general familialism factor. The former has two items that load heavily; first, ‘there should be financial benefits for child care when both parents work’, and, second, ‘working mothers should get paid maternity leave’. A third item loads moderately (.54), ‘working mothers can have just as warm a relationship with their children as non working mothers’. Strikingly, these items do not load on familialism no matter what combination of items is included, nor do they load in specifications with a smaller number of factors. This result echoes the gender-based analyses of welfare states in Lewis (1992) and Siaroff (1994). The latter offered a four-category typology of countries one of which was Late Female Mobilisation: this category included Ireland, Greece, Italy, Japan, Portugal and Spain. Our data seems to support the notion that the later development of women’s work participation – and social and political discourses associated with this transition- may be a defining characteristic of some welfare states. The seventh and eight factors concern Wealth and Individual Effort respectively. In the former case the two important items refer to wealth and taxation. Here one of the items asked respondents to agree (or otherwise) that wealthy people should be allowed to pass on wealth to their children without the government imposing taxes, and another item posed the statement that taxes should kept low to encourage people to work even if this means greater income inequality. The individual effort factor arises largely from the questions about why some are poor and some well-off, and the factor is quite straightforward. It expresses an individualist explanation of poverty; people are poor because they waste money, or do not work hard enough. Neither of the last two factors explains more than 5% of the variance. One of these (factor nine) we can label Corporatism. This factor embodies items which all relate to government intervention in the production rather than the distribution aspects of the economy: for example, should industry be free of state control, should essential services be provided by the state or the private sector? Interestingly, the items about ensuring adequate pay for all workers, about differentiating pay according to family needs, and other items tapping support for non-market criteria for pay, did not emerge in this factor. The items in this factor, combined with its limited explanatory power, suggest that corporatism, in the terms illustrated by Bonoli, is not an important dimension of welfare culture in Ireland. Before turning to a preliminary account of the results, some general points about the analysis should be noted. While we did not set out to formally identify the elements of welfare culture in Pfau-Effinger’s framework, the results seem to support a broad notion of welfare culture of the type she outlines. We established that there are clear dimensions related to family/labour market attitudes and to notions of state versus family responsibility for care services. We examined attitudes to distributional issues and found that there are clear dimensions related to people’s notions of fairness, to their beliefs about why people are poor, and to social integration. As regards the efforts in existing
Geary WP 2005/10 10
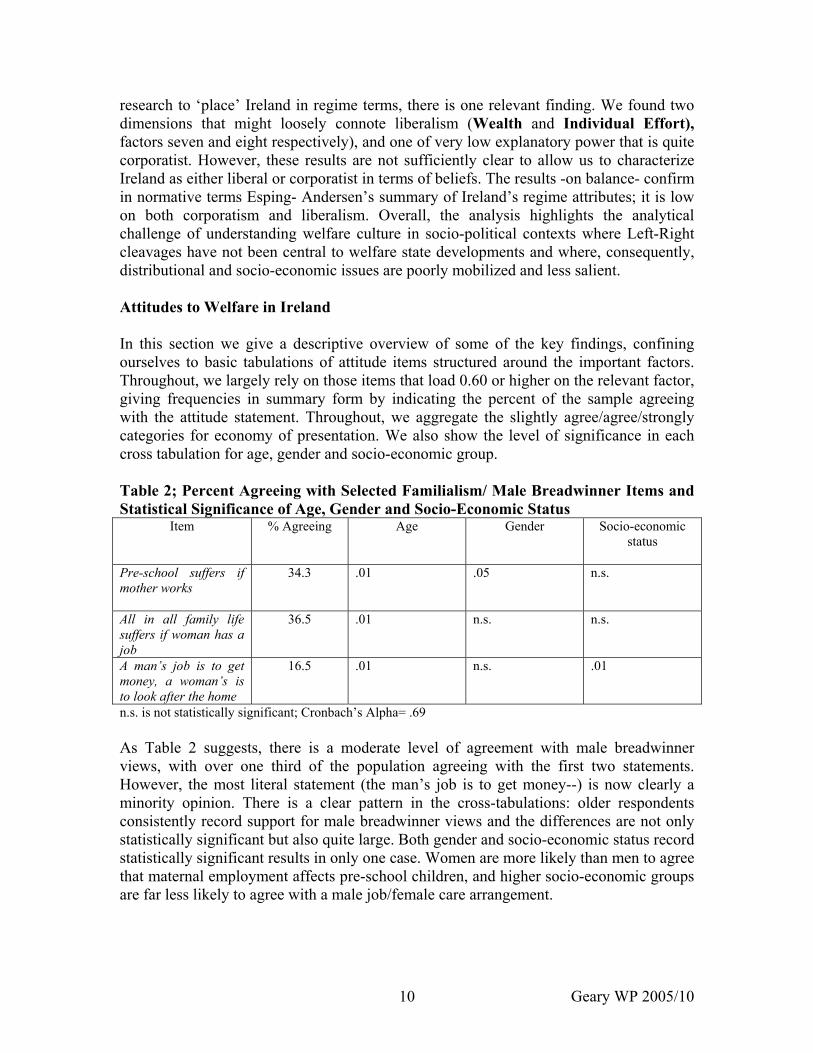
research to ‘place’ Ireland in regime terms, there is one relevant finding. We found two dimensions that might loosely connote liberalism (Wealth and Individual Effort), factors seven and eight respectively), and one of very low explanatory power that is quite corporatist. However, these results are not sufficiently clear to allow us to characterize Ireland as either liberal or corporatist in terms of beliefs. The results -on balance- confirm in normative terms Esping- Andersen’s summary of Ireland’s regime attributes; it is low on both corporatism and liberalism. Overall, the analysis highlights the analytical challenge of understanding welfare culture in socio-political contexts where Left-Right cleavages have not been central to welfare state developments and where, consequently, distributional and socio-economic issues are poorly mobilized and less salient. Attitudes to Welfare in Ireland In this section we give a descriptive overview of some of the key findings, confining ourselves to basic tabulations of attitude items structured around the important factors. Throughout, we largely rely on those items that load 0.60 or higher on the relevant factor, giving frequencies in summary form by indicating the percent of the sample agreeing with the attitude statement. Throughout, we aggregate the slightly agree/agree/strongly categories for economy of presentation. We also show the level of significance in each cross tabulation for age, gender and socio-economic group. Table 2; Percent Agreeing with Selected Familialism/ Male Breadwinner Items and Statistical Significance of Age, Gender and Socio-Economic Status
Item % Agreeing Age Gender Socio-economic status
Pre-school suffers if mother works
34.3 .01 .05 n.s.
All in all family life suffers if woman has a job
36.5 .01 n.s. n.s.
A man’s job is to get money, a woman’s is to look after the home
16.5 .01 n.s. .01
n.s. is not statistically significant; Cronbach’s Alpha= .69 As Table 2 suggests, there is a moderate level of agreement with male breadwinner views, with over one third of the population agreeing with the first two statements. However, the most literal statement (the man’s job is to get money--) is now clearly a minority opinion. There is a clear pattern in the cross-tabulations: older respondents consistently record support for male breadwinner views and the differences are not only statistically significant but also quite large. Both gender and socio-economic status record statistically significant results in only one case. Women are more likely than men to agree that maternal employment affects pre-school children, and higher socio-economic groups are far less likely to agree with a male job/female care arrangement.
Geary WP 2005/10 11
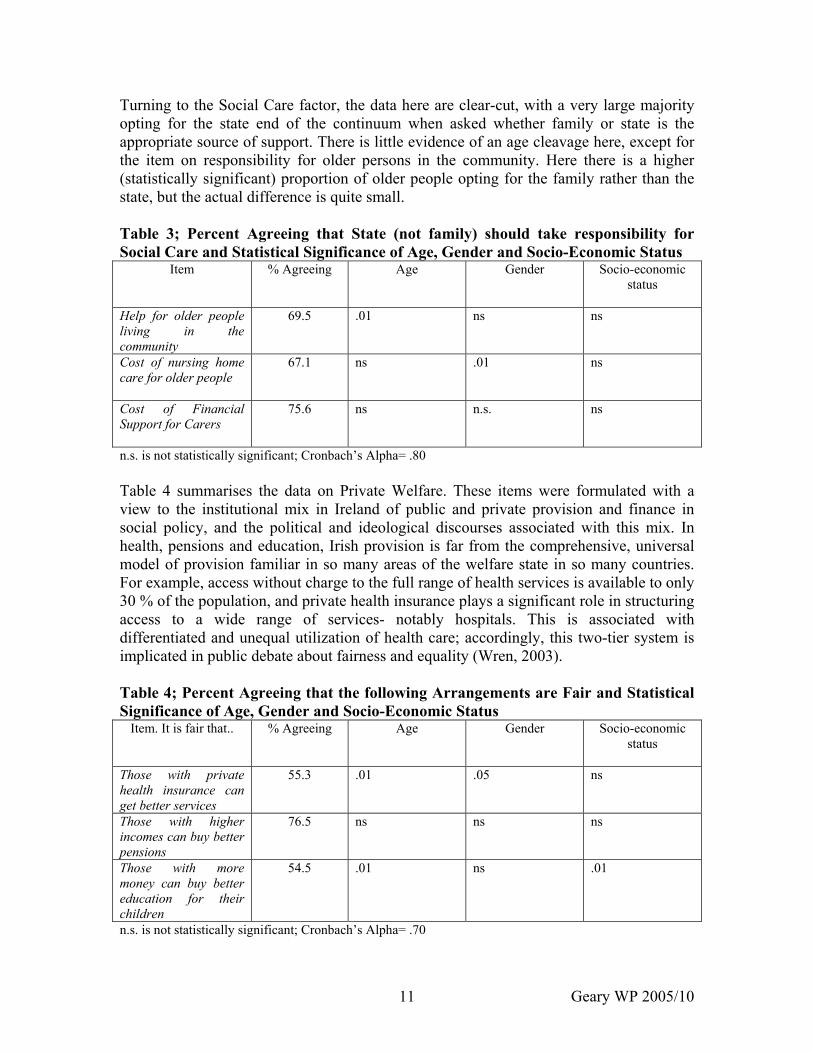
Turning to the Social Care factor, the data here are clear-cut, with a very large majority opting for the state end of the continuum when asked whether family or state is the appropriate source of support. There is little evidence of an age cleavage here, except for the item on responsibility for older persons in the community. Here there is a higher (statistically significant) proportion of older people opting for the family rather than the state, but the actual difference is quite small. Table 3; Percent Agreeing that State (not family) should take responsibility for Social Care and Statistical Significance of Age, Gender and Socio-Economic Status
Item % Agreeing Age Gender Socio-economic status
Help for older people living in the community
69.5 .01 ns ns
Cost of nursing home care for older people
67.1 ns .01 ns
Cost of Financial Support for Carers
75.6 ns n.s. ns
n.s. is not statistically significant; Cronbach’s Alpha= .80 Table 4 summarises the data on Private Welfare. These items were formulated with a view to the institutional mix in Ireland of public and private provision and finance in social policy, and the political and ideological discourses associated with this mix. In health, pensions and education, Irish provision is far from the comprehensive, universal model of provision familiar in so many areas of the welfare state in so many countries. For example, access without charge to the full range of health services is available to only 30 % of the population, and private health insurance plays a significant role in structuring access to a wide range of services- notably hospitals. This is associated with differentiated and unequal utilization of health care; accordingly, this two-tier system is implicated in public debate about fairness and equality (Wren, 2003). Table 4; Percent Agreeing that the following Arrangements are Fair and Statistical Significance of Age, Gender and Socio-Economic Status
Item. It is fair that.. % Agreeing Age Gender Socio-economic status
Those with private health insurance can get better services
55.3 .01 .05 ns
Those with higher incomes can buy better pensions
76.5 ns ns ns
Those with more money can buy better education for their children
54.5 .01 ns .01
n.s. is not statistically significant; Cronbach’s Alpha= .70
Geary WP 2005/10 12
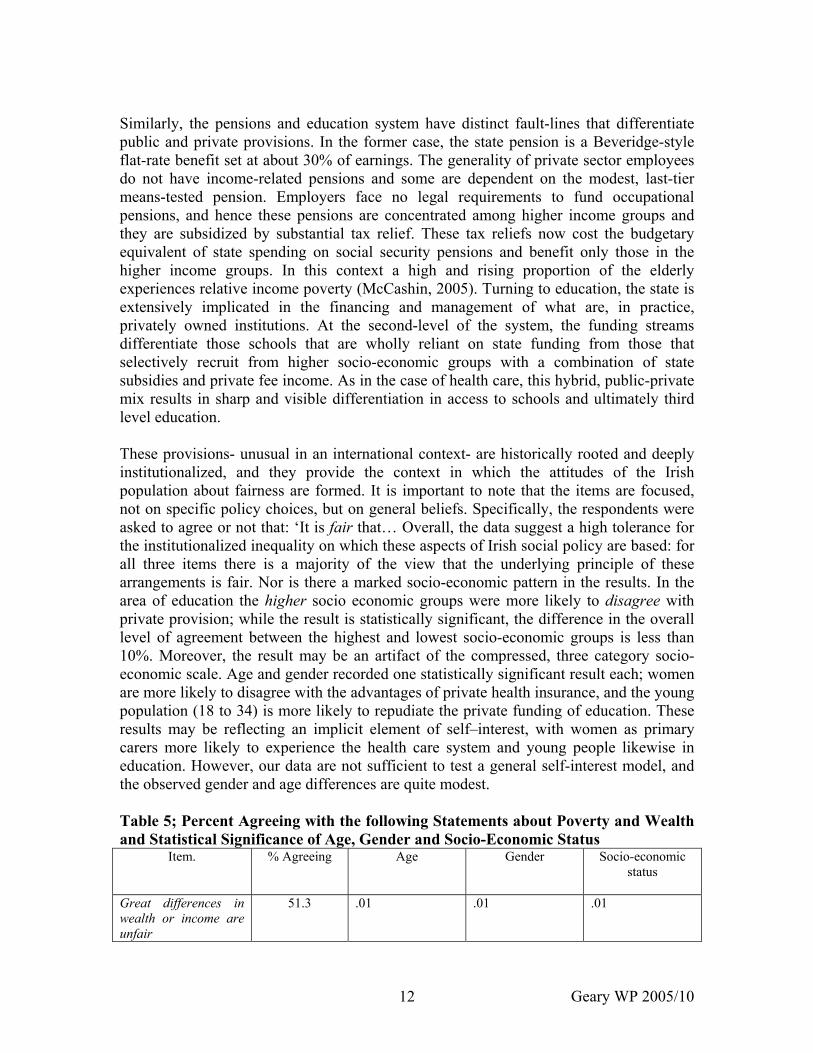
Similarly, the pensions and education system have distinct fault-lines that differentiate public and private provisions. In the former case, the state pension is a Beveridge-style flat-rate benefit set at about 30% of earnings. The generality of private sector employees do not have income-related pensions and some are dependent on the modest, last-tier means-tested pension. Employers face no legal requirements to fund occupational pensions, and hence these pensions are concentrated among higher income groups and they are subsidized by substantial tax relief. These tax reliefs now cost the budgetary equivalent of state spending on social security pensions and benefit only those in the higher income groups. In this context a high and rising proportion of the elderly experiences relative income poverty (McCashin, 2005). Turning to education, the state is extensively implicated in the financing and management of what are, in practice, privately owned institutions. At the second-level of the system, the funding streams differentiate those schools that are wholly reliant on state funding from those that selectively recruit from higher socio-economic groups with a combination of state subsidies and private fee income. As in the case of health care, this hybrid, public-private mix results in sharp and visible differentiation in access to schools and ultimately third level education. These provisions- unusual in an international context- are historically rooted and deeply institutionalized, and they provide the context in which the attitudes of the Irish population about fairness are formed. It is important to note that the items are focused, not on specific policy choices, but on general beliefs. Specifically, the respondents were asked to agree or not that: ‘It is fair that… Overall, the data suggest a high tolerance for the institutionalized inequality on which these aspects of Irish social policy are based: for all three items there is a majority of the view that the underlying principle of these arrangements is fair. Nor is there a marked socio-economic pattern in the results. In the area of education the higher socio economic groups were more likely to disagree with private provision; while the result is statistically significant, the difference in the overall level of agreement between the highest and lowest socio-economic groups is less than 10%. Moreover, the result may be an artifact of the compressed, three category socio-economic scale. Age and gender recorded one statistically significant result each; women are more likely to disagree with the advantages of private health insurance, and the young population (18 to 34) is more likely to repudiate the private funding of education. These results may be reflecting an implicit element of self–interest, with women as primary carers more likely to experience the health care system and young people likewise in education. However, our data are not sufficient to test a general self-interest model, and the observed gender and age differences are quite modest. Table 5; Percent Agreeing with the following Statements about Poverty and Wealth and Statistical Significance of Age, Gender and Socio-Economic Status
Item. % Agreeing Age Gender Socio-economic status
Great differences in wealth or income are unfair
51.3 .01 .01 .01

Geary WP 2005/10 13
Employers don’t pay enough to some workers
78.2 ns ns .01
To become well-off you have to start out with money
60.2 .01 ns .01
n.s. is not statistically significant; Cronbach’s Alpha= .42 Table 5 reports on items comprising the Income Equality Factor. Three of the items refer to the question about why respondents think some people are poor, and the fourth item is one of a series about wealth and fairness. There were two items here with loadings over 0.6 and two in the range 0.55 to 0.60: the inclusion of all four items yields an alpha reliability figure of 0.49, and removing the item with the smallest loading reduces it to 0.42. The figures show pervasive sympathy for a societal perspective on poverty and wealth, with a very substantial majority indicting employers’ low pay rates as a cause of poverty. However, these data hardly amount to legitimation for redistributive policies, nor do they express class based attitudes. First, only half agree that great disparities in wealth are unfair; second, while the socio-economic differences are statistically significant, the actual percent differences between high and low socio-economic groups are again quite small- in all cases less than 10%; third, the moderate level of the reliability coefficient cautions against over interpretation. Table 6; Percent Agreeing with the following Statements about integration of Travelers and Asylum seekers and Statistical Significance of Age, Gender and Socio-Economic Status
Item. % Agreeing Age Gender Socio-economic status
People should not have Traveler/gypsy sites in their neighborhood
52.1 .01 ns ns
Asylum seekers should have the same rights to social services as others
48.5 ns ns .01
There should be strict limits on the number of immigrants coming to live in Ireland
79.1 ns ns .01
n.s. is not statistically significant; Cronbach’s Alpha= .51 The items on the Social Integration factor are somewhat more acceptable in terms of scale reliability (alpha= .51) although it is not in the preferred range of 0.7 or above. Table 6 follows the format of the previous tables, and reports a noticeable variation in the attitudes of the population. The immigration and asylum seeker items record some not unexpected findings. There is very general support for immigration restriction and socio-economic variation in attitudes; for both items the lower socio-economic groups were substantially more restrictive in their attitudes. In relation to the integration of the indigenous Traveler/Gypsy minority there is a 50/50 division. This does not emerge as a socio-economic variation in our data, but more refined analysis examining housing tenure
Geary WP 2005/10 14
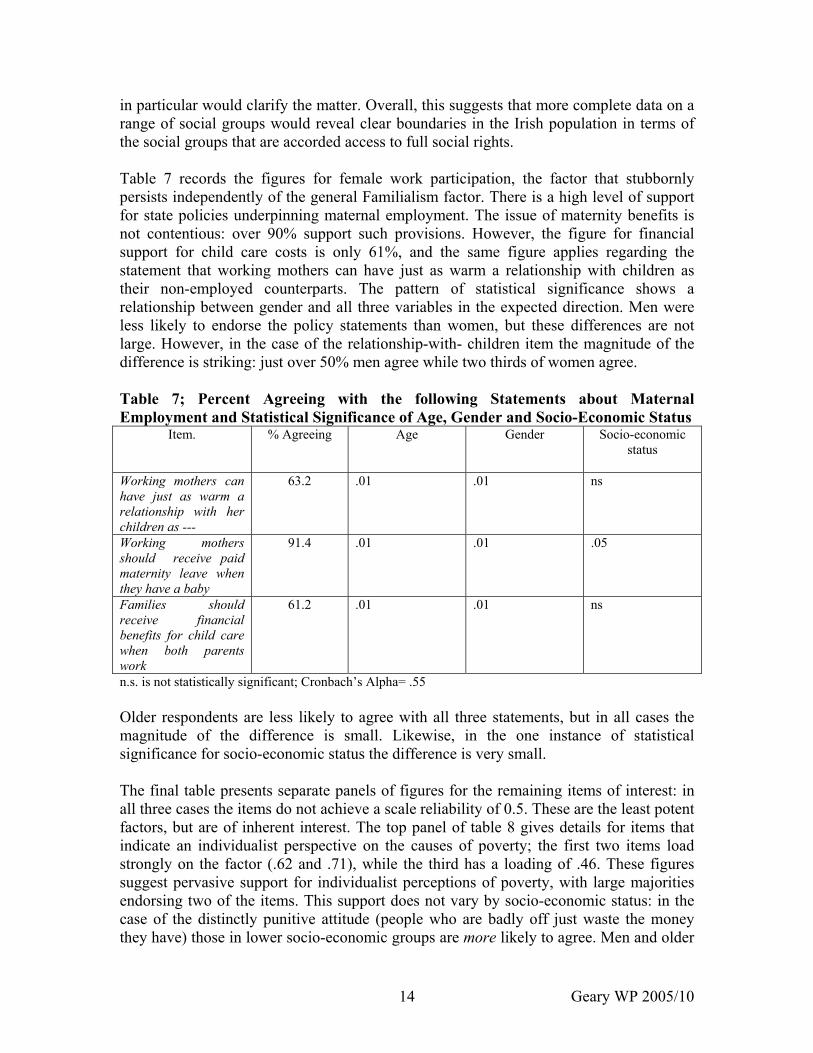
in particular would clarify the matter. Overall, this suggests that more complete data on a range of social groups would reveal clear boundaries in the Irish population in terms of the social groups that are accorded access to full social rights. Table 7 records the figures for female work participation, the factor that stubbornly persists independently of the general Familialism factor. There is a high level of support for state policies underpinning maternal employment. The issue of maternity benefits is not contentious: over 90% support such provisions. However, the figure for financial support for child care costs is only 61%, and the same figure applies regarding the statement that working mothers can have just as warm a relationship with children as their non-employed counterparts. The pattern of statistical significance shows a relationship between gender and all three variables in the expected direction. Men were less likely to endorse the policy statements than women, but these differences are not large. However, in the case of the relationship-with- children item the magnitude of the difference is striking: just over 50% men agree while two thirds of women agree. Table 7; Percent Agreeing with the following Statements about Maternal Employment and Statistical Significance of Age, Gender and Socio-Economic Status
Item. % Agreeing Age Gender Socio-economic status
Working mothers can have just as warm a relationship with her children as ---
63.2 .01 .01 ns
Working mothers should receive paid maternity leave when they have a baby
91.4 .01 .01 .05
Families should receive financial benefits for child care when both parents work
61.2 .01 .01 ns
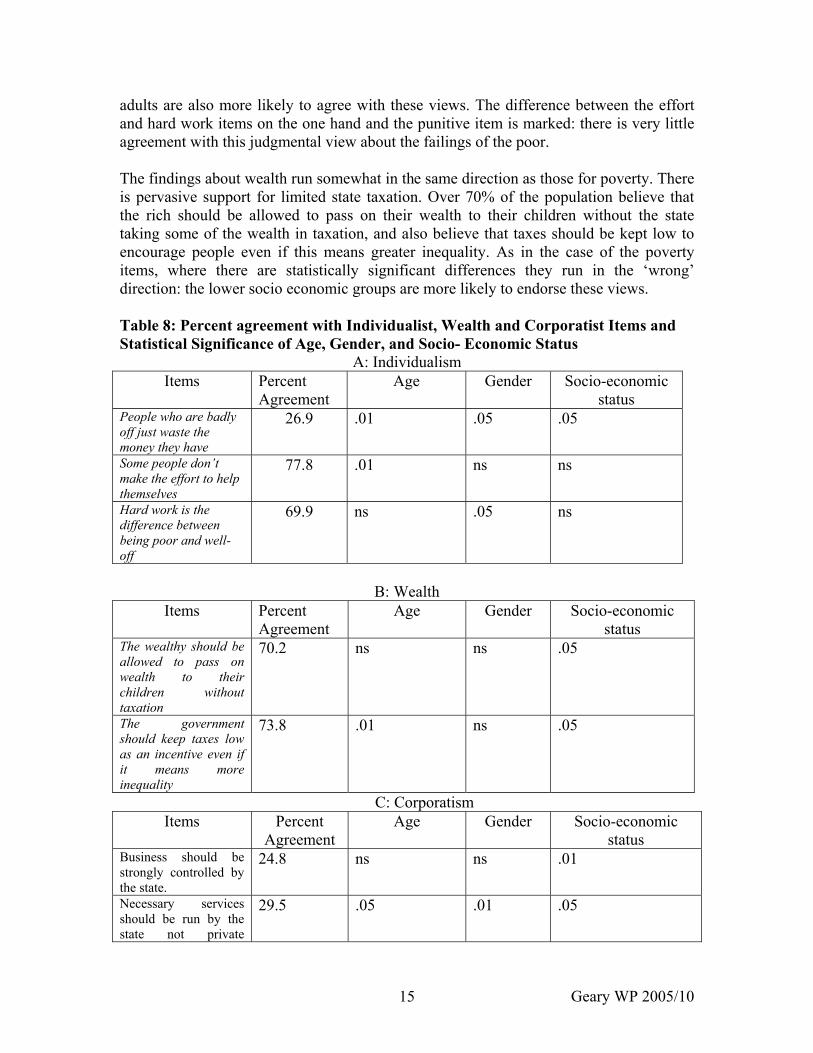
n.s. is not statistically significant; Cronbach’s Alpha= .55 Older respondents are less likely to agree with all three statements, but in all cases the magnitude of the difference is small. Likewise, in the one instance of statistical significance for socio-economic status the difference is very small. The final table presents separate panels of figures for the remaining items of interest: in all three cases the items do not achieve a scale reliability of 0.5. These are the least potent factors, but are of inherent interest. The top panel of table 8 gives details for items that indicate an individualist perspective on the causes of poverty; the first two items load strongly on the factor (.62 and .71), while the third has a loading of .46. These figures suggest pervasive support for individualist perceptions of poverty, with large majorities endorsing two of the items. This support does not vary by socio-economic status: in the case of the distinctly punitive attitude (people who are badly off just waste the money they have) those in lower socio-economic groups are more likely to agree. Men and older
Geary WP 2005/10 15
adults are also more likely to agree with these views. The difference between the effort and hard work items on the one hand and the punitive item is marked: there is very little agreement with this judgmental view about the failings of the poor. The findings about wealth run somewhat in the same direction as those for poverty. There is pervasive support for limited state taxation. Over 70% of the population believe that the rich should be allowed to pass on their wealth to their children without the state taking some of the wealth in taxation, and also believe that taxes should be kept low to encourage people even if this means greater inequality. As in the case of the poverty items, where there are statistically significant differences they run in the ‘wrong’ direction: the lower socio economic groups are more likely to endorse these views. Table 8: Percent agreement with Individualist, Wealth and Corporatist Items and Statistical Significance of Age, Gender, and Socio- Economic Status
A: Individualism Items Percent
Agreement Age Gender Socio-economic
status People who are badly off just waste the money they have
26.9 .01 .05 .05
Some people don’t make the effort to help themselves
77.8 .01 ns ns
Hard work is the difference between being poor and well-off
69.9 ns .05 ns
B: Wealth
Items Percent Agreement
Age Gender
Socio-economic status
The wealthy should be allowed to pass on wealth to their children without taxation
70.2 ns ns .05
The government should keep taxes low as an incentive even if it means more inequality
73.8 .01 ns .05
C: Corporatism Items Percent
Agreement Age Gender Socio-economic
status Business should be strongly controlled by the state.
24.8 ns ns .01
Necessary services should be run by the state not private
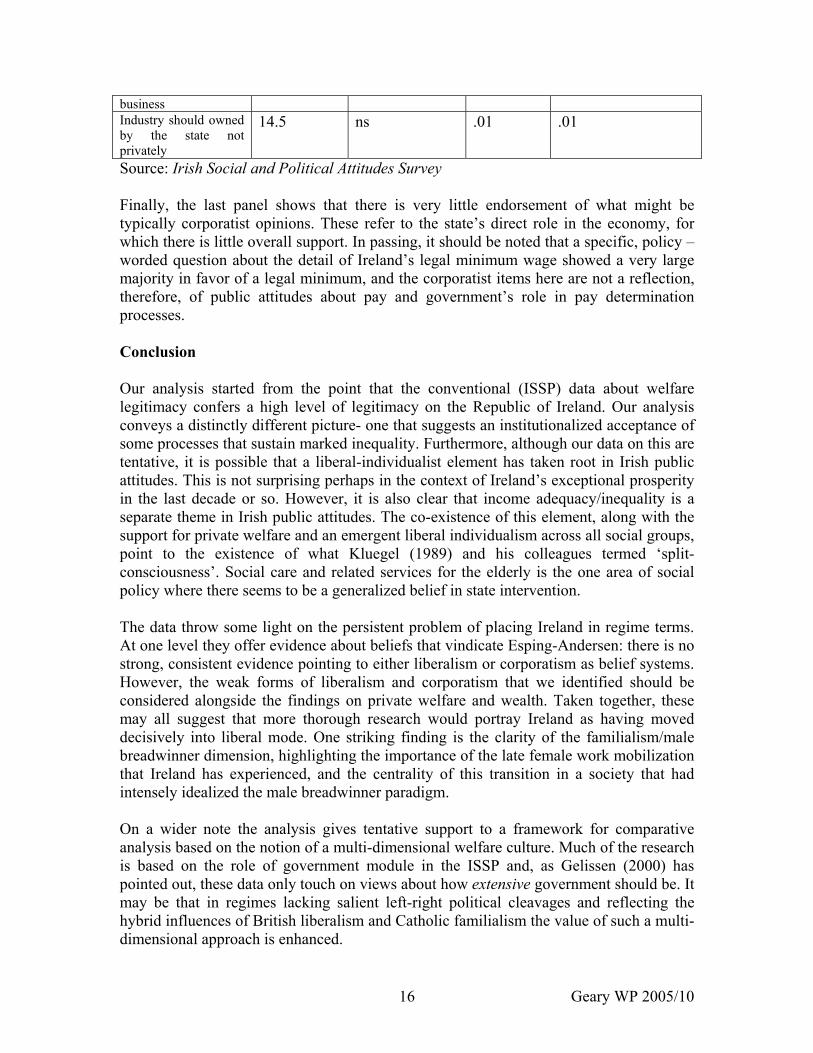
29.5 .05 .01 .05
Geary WP 2005/10 16
business Industry should owned by the state not privately
14.5 ns .01 .01
Source: Irish Social and Political Attitudes Survey Finally, the last panel shows that there is very little endorsement of what might be typically corporatist opinions. These refer to the state’s direct role in the economy, for which there is little overall support. In passing, it should be noted that a specific, policy –worded question about the detail of Ireland’s legal minimum wage showed a very large majority in favor of a legal minimum, and the corporatist items here are not a reflection, therefore, of public attitudes about pay and government’s role in pay determination processes. Conclusion Our analysis started from the point that the conventional (ISSP) data about welfare legitimacy confers a high level of legitimacy on the Republic of Ireland. Our analysis conveys a distinctly different picture- one that suggests an institutionalized acceptance of some processes that sustain marked inequality. Furthermore, although our data on this are tentative, it is possible that a liberal-individualist element has taken root in Irish public attitudes. This is not surprising perhaps in the context of Ireland’s exceptional prosperity in the last decade or so. However, it is also clear that income adequacy/inequality is a separate theme in Irish public attitudes. The co-existence of this element, along with the support for private welfare and an emergent liberal individualism across all social groups, point to the existence of what Kluegel (1989) and his colleagues termed ‘split-consciousness’. Social care and related services for the elderly is the one area of social policy where there seems to be a generalized belief in state intervention. The data throw some light on the persistent problem of placing Ireland in regime terms. At one level they offer evidence about beliefs that vindicate Esping-Andersen: there is no strong, consistent evidence pointing to either liberalism or corporatism as belief systems. However, the weak forms of liberalism and corporatism that we identified should be considered alongside the findings on private welfare and wealth. Taken together, these may all suggest that more thorough research would portray Ireland as having moved decisively into liberal mode. One striking finding is the clarity of the familialism/male breadwinner dimension, highlighting the importance of the late female work mobilization that Ireland has experienced, and the centrality of this transition in a society that had intensely idealized the male breadwinner paradigm. On a wider note the analysis gives tentative support to a framework for comparative analysis based on the notion of a multi-dimensional welfare culture. Much of the research is based on the role of government module in the ISSP and, as Gelissen (2000) has pointed out, these data only touch on views about how extensive government should be. It may be that in regimes lacking salient left-right political cleavages and reflecting the hybrid influences of British liberalism and Catholic familialism the value of such a multi-dimensional approach is enhanced.
Geary WP 2005/10 17
References
Arts, W. and J. Gelissen (2002), “Three Worlds of Welfare Capitalism or More? A State-
of-the-Art Report” Journal of European Social Policy, Vol. 12, No. 2, pp. 137-158 Andrefs, H. and T. Heien (2001). “Four Worlds of Welfare State Attitudes: A
Comparison of Germany, Norway, and the United States”, European Sociological Review, Vol. 17, No. 4, pp. 337-356
Blekasaune, M. and J. Quadagno (2003), “Public Attitudes toward Welfare State Policies:
A Comparative Analysis of 24 Nations” European Sociological Review, Vol. 19, No. 5 Bonoli, G. (1997) “Classifying Welfare States: A Two-dimensional Analysis”, Journal of
Social Policy, Vol. 26, No.3, pp. 351-372 Bonoli, G. (2000) “Public Attitudes to Social Protection and Political Economy
Traditions in Western Europe”, European Societies, Vol. 2, No. 4, pp. 431-452 Breen, R., D. Hannan, C.T. Whelan, D. Rottman, Understanding Contemporary Ireland.
Class, State and Development in the Republic of Ireland. London: Macmillan Castles, F. and D. Mitchell (1993) “Worlds of Welfare and Families of Nations”, in
Castles, F. (ed.) Families of Nations. Patterns of Public Policy in Western Democracies. Aldershot. Dartmouth Publishing.
Cochrane, A. and J. Clarke (1993) Comparing Welfare States. London: Sage Cousins, M. (1997) “Ireland’s Place in the Worlds of Welfare Capitalism” Journal of
European Social Policy Vol. 7, No.3, pp. 223-235 Daly. M. and N. Yeates (2003) “Common Origins, different paths: adaptation and change
in social security in Britain and Ireland”, Policy and Politics, Vol. 31, No. 1, pp. 85-97 Esping-Andersen, G. (1990) The Three Worlds of Welfare Capitalism. Cambridge: Polity
Press Garry, J., N. Hardiman and D. Payne (2005) Social and Political Attitudes in Ireland.
Liverpool: Liverpool University Press Gelissen, J. (2000), “Popular Support for institutionalized solidarity: a comparison
between European welfare states”, International Journal of Social Welfare, Vol. 9, pp.289-300
Geary WP 2005/10 18
Gelissen, J. (2001), “Old Age Pensions: Individual of Collective Responsibility? An investigation of public opinion across European welfare states”, European Societies, Vol. 3, No.4, pp.495-523
Kluegel, J. and M. Miyano (1989) “Justice Beliefs and Support for the Welfare State in
Advanced Capitalism” in Kluegel, J. , E. Smith, B. Wegener (eds.), Social Justice and Political Change: Public Opinion in Capitalist and Post-Communist States. New York: Aldine de Gruyter
McCashin, A. (2004) Social Security in Ireland. Dublin: Gill and Macmillan McCashin A. (2005) “Towards a Basic Income for the Elderly” in Stewart, J. (ed.), For
Richer, For Poorer. Dublin: New Island Millar, M. and M. Adshead (2004), “Health Care in Ireland: applying Esping-
Andersen’s typology of welfare to the Irish case” Paper to Political Studies Association Conference, University of Lincoln
NESC (2005) The Developmental Welfare State. Dublin: National Economic and Social
Council Nolan, B., B. Maitre, D. O’Neill, O. Sweetman (2000) Income Distribution in Ireland.
Dublin: Oaktree Press O’Riain, S. and P.O’Connell (2000) “The Role of the State in Growth and Welfare”, in Nolan, B., P. O’Connell and C.T. Whelan eds. Bust to Boom? The Irish Experience of
Growth and Inequality. Dublin: Institute of Public Administration Papadakis, E. (1992) “Public Opinion, Public Policy and the Welfare State”, Political
Studies, Vol. 19, No. 1. pp. 21-37 Pfau-Effinger, B. (2005), “Culture and Welfare State Policies: Reflections on a Complex
Interrelation”, Journal of Social Policy, Vol. 34. No. 1, pp.2-20 Peillon, M. (1995), “Support of Welfare in Ireland: Legitimacy and Interest”.
Administration, Vol. 43, No. 3, pp. 3-21 Quadagno, J and M. Blekesaune (2003), “Public Attitudes towards Welfare State
Policies”, European Sociological Review, Vol. 19, No.5 Siaroff, A. (1994), “Work, Welfare and Gender Equality: A New Typology” in
Sainsbury, D. (ed.) Gendering Welfare States. London: Sage Svallfors, S. (1997) “Worlds of Welfare and Attitudes to Redistribution”, European
Sociological Review, Vol. 13, No. 3, pp.283-304
Geary WP 2005/10 19
Taylor-Gooby, P. (1991) “Welfare State Regimes and Welfare Citizenship” Journal of European Social Policy, Vol. 1, pp.93-105
Wren, M. (2003) Unhealthy State. Dublin: New Island
Geary WP 2005/10 20
Appendix Factor Analysis KMO and Bartlett's Test Kaiser-Meyer-Olkin Measure of Sampling Adequacy. .717
Approx. Chi-Square 5873.493df 528
Bartlett's Test of Sphericity
Sig. .000 Communalities Initial Extraction nothing wrong-people richer than others 1.000 .462
business=free/strict controlled by state 1.000 .451
best provide service=state/private ent. 1.000 .512
industry=state/private owned & run 1.000 .622
not have put up-halting sites in n/hood 1.000 .412
asylum seeker-same soc service rights 1.000 .474
strict limit on no. immigrants 1.000 .525
working mother-warm relat with kids 1.000 .563
pre school child-suffer if mother works 1.000 .665
family life suffer-when woman has ft job 1.000 .663
most women really want home & kids 1.000 .478
h/wife as fulfilling as working for pay 1.000 .528
Geary WP 2005/10 21
mans job=get money,womens=care 1.000 .494
financ b/fit,child care-both parents wk 1.000 .656
work women shld get pd maternity leave 1.000 .620
badly off just waste money they have 1.000 .501
some-dont make effort to help themselves 1.000 .594
govt doesnt give enough social welfare 1.000 .398
to become well off-start out with money 1.000 .490
hard work-diff bet make lot/little money 1.000 .389
employers dont pay enough to some wkers 1.000 .399
wealthy pass on to kids-w/out taxes 1.000 .489
govt shld keep taxes low 1.000 .495great diffs in wealth/income is unfair 1.000 .513
people who creat wealth-shld high reward 1.000 .349
people with pvt health ins,better access 1.000 .586
more money-can afford better educ kids 1.000 .667
higher income-buy better pension prov 1.000 .614
pvt & coorp houses-separate estates 1.000 .366
cost c/care working parents-family/govt 1.000 .545
help elderly alone in comm-family/govt 1.000 .686
nursing home for elderly-family/govt 1.000 .765
financial support carers-family/govt 1.000 .675
Extraction Method: Principal Component Analysis. Total Variance Explained
Initial Eigenvalues Extraction Sums of Squared Loadings Rotation SuComponent Total % of Variance Cumulative % Total % of Variance Cumulative % Total % 1 3.305 10.014 10.014 3.305 10.014 10.014 2.5742 2.600 7.880 17.895 2.600 7.880 17.895 2.1823 2.271 6.881 24.776 2.271 6.881 24.776 2.092
Geary WP 2005/10 22
4 1.740 5.273 30.049 1.740 5.273 30.049 1.7165 1.578 4.783 34.832 1.578 4.783 34.832 1.6806 1.488 4.508 39.339 1.488 4.508 39.339 1.6737 1.281 3.883 43.222 1.281 3.883 43.222 1.5308 1.195 3.620 46.842 1.195 3.620 46.842 1.5119 1.104 3.345 50.187 1.104 3.345 50.187 1.43610 1.083 3.282 53.470 1.083 3.282 53.470 1.25111 .993 3.010 56.480 12 .955 2.895 59.375 13 .903 2.737 62.111 14 .865 2.621 64.733 15 .834 2.527 67.259 16 .811 2.458 69.718 17 .808 2.448 72.166 18 .779 2.362 74.528 19 .752 2.279 76.807 20 .738 2.235 79.042 21 .705 2.138 81.180 22 .668 2.026 83.205 23 .632 1.915 85.121 24 .622 1.883 87.004 25 .609 1.845 88.849 26 .556 1.686 90.535 27 .545 1.652 92.188 28 .523 1.586 93.773 29 .492 1.491 95.264 30 .448 1.359 96.623 31 .396 1.200 97.822 32 .388 1.177 98.999 33 .330 1.001 100.000
Extraction Method: Principal Component Analysis. Component Matrix(a)
Component 1 2 3 4 5 6 7 nothing wrong-people richer than others .185 -.265 .156 .251 -.100 -.160 .445
business=free/strict controlled by state .022 .166 -.118 -.285 .178 -.106 .210
best provide service=state/private ent. -.004 -.145 .178 .215 -.351 -.005 -.197
industry=state/private owned & run -.038 -.175 .196 .307 -.439 .151 -.210
not have put up-halting sites in n/hood .387 -.057 .185 .136 .244 -.135 -.322
asylum seeker-same soc service rights -.320 .125 -.094 -.140 -.265 .039 .472
Geary WP 2005/10 23
strict limit on no. immigrants .402 -.047 .177 .144 .296 -.214 -.385
working mother-warm relat with kids .426 -.086 -.354 .163 .029 .380 -.103
pre school child-suffer if mother works -.510 -.069 .426 .007 .306 -.168 .143
family life suffer-when woman has ft job -.569 -.145 .424 .012 .299 -.079 .149
most women really want home & kids -.576 -.142 .164 .131 .185 .137 -.048
h/wife as fulfilling as working for pay -.376 -.204 .149 .136 .370 .185 -.188
mans job=get money,womens=care -.626 -.064 .203 .089 .176 -.005 -.094
financ b/fit,child care-both parents wk .111 -.313 -.326 .226 .295 .468 .197
work women shld get pd maternity leave .058 -.283 -.172 .246 .356 .464 .182
badly off just waste money they have .477 -.122 -.054 .048 .209 -.183 .151
some-dont make effort to help themselves .377 -.043 .038 .273 .121 -.232 .111
govt doesnt give enough social welfare .008 .417 -.022 -.343 .069 .131 .114
to become well off-start out with money .178 .260 -.010 -.230 .311 -.033 .064
hard work-diff bet make lot/little money .307 -.059 .159 .122 .127 -.179 .230
employers dont pay enough to some wkers .150 .341 -.041 -.245 .231 .023 -.068
wealthy pass on to kids-w/out taxes .315 -.041 .225 .088 .157 -.297 .091
govt shld keep taxes low .366 -.130 .268 .088 .043 -.202 .222great diffs in wealth/income is unfair .140 .390 -.157 -.312 .265 .104 -.165
people who creat wealth-shld high reward .269 -.064 .154 -.075 -.158 -.039 .049
people with pvt health ins,better access .192 -.339 .496 -.319 -.090 .230 -.049
more money-can afford better educ kids .311 -.280 .380 -.463 .009 .302 .136
higher income-buy better pension prov .237 -.322 .471 -.345 -.156 .264 .046
pvt & coorp houses-separate estates .288 -.245 .281 -.178 .080 .132 -.178
cost c/care working parents-family/govt -.162 .374 .272 -.171 -.080 -.056 -.182
help elderly alone in comm-family/govt .124 .618 .339 .303 -.066 .203 .113
nursing home for elderly-family/govt .159 .612 .406 .324 .045 .279 .071
Geary WP 2005/10 24
financial support carers-family/govt .155 .589 .356 .286 -.028 .253 .086
Extraction Method: Principal Component Analysis. a 10 components extracted. Rotated Component Matrix(a)
Component 1 2 3 4 5 6 7 nothing wrong-people richer than others -.002 .049 .080 -.296 -.104 .004 .390
business=free/strict controlled by state -.062 -.030 .006 .029 -.185 -.033 .003
best provide service=state/private ent. .004 -.046 .001 -.112 -.043 -.009 .073
industry=state/private owned & run .012 .050 .047 -.107 -.008 .003 -.039
not have put up-halting sites in n/hood -.064 .078 .093 -.027 .596 -.025 .066
asylum seeker-same soc service rights .068 .020 -.057 -.004 -.672 -.087 -.047
strict limit on no. immigrants -.040 .027 .028 .081 .686 -.055 .136
working mother-warm relat with kids -.488 .008 -.010 -.035 .129 .541 -.010
pre school child-suffer if mother works .771 -.001 .011 .101 -.047 -.138 .131
family life suffer-when woman has ft job .794 -.011 .066 -.019 -.084 -.059 .075
most women really want home & kids .583 -.009 -.044 -.185 -.080 .140 -.216
h/wife as fulfilling as working for pay .523 -.056 .007 -.118 .128 .314 -.197
mans job=get money,womens=care .622 -.025 -.108 -.131 -.052 -.009 -.145
financ b/fit,child care-both parents wk -.041 -.078 -.001 .012 .001 .712 -.045
work women shld get pd maternity leave .082 -.032 .014 -.022 -.040 .775 .081
badly off just waste money they have -.181 -.053 .066 -.001 .178 .069 .059
some-dont make effort to help themselves -.067 .097 -.064 -.066 .195 -.028 -.043
govt doesnt give enough social welfare -.045 .142 .033 .557 -.213 -.066 -.002
to become well off-start out with money -.018 -.011 -.050 .564 .012 .107 .364
hard work-diff bet make lot/little money -.012 .035 .026 -.008 -.001 .098 .381
Geary WP 2005/10 25
employers dont pay enough to some wkers -.037 .077 -.019 .602 .101 -.063 -.049
wealthy pass on to kids-w/out taxes -.044 .034 .019 -.021 .253 -.051 .642
govt shld keep taxes low -.071 .023 .127 -.031 .078 .037 .667great diffs in wealth/income is unfair -.095 .032 -.050 .664 .086 .023 -.179
people who creat wealth-shld high reward -.109 -.035 .196 .128 -.080 -.055 .064
people with pvt health ins,better access .044 -.005 .744 -.114 .100 -.039 .042
more money-can afford better educ kids -.029 -.030 .787 .135 -.023 .047 .024
higher income-buy better pension prov -.010 .009 .772 -.044 .006 -.047 .028
pvt & coorp houses-separate estates -.067 -.049 .458 -.071 .267 .099 .137
cost c/care working parents-family/govt .093 .205 .010 .080 -.079 -.236 .059
help elderly alone in comm-family/govt -.050 .816 -.055 .037 -.012 -.068 .068
nursing home for elderly-family/govt .021 .860 -.002 .104 .064 .016 .024
financial support carers-family/govt -.030 .814 .003 .089 .032 -.044 -.013
Extraction Method: Principal Component Analysis. Rotation Method: Varimax with Kaiser Normalization. a Rotation converged in 9 iterations. Component Transformation Matrix Component 1 2 3 4 5 6 7 8 91 -.693 .133 .278 .133 .376 .109 .312 .3822 -.147 .663 -.373 .469 -.107 -.287 -.077 -.0893 .481 .438 .561 -.084 .164 -.294 .284 .0674 .090 .407 -.525 -.483 .222 .303 .095 .1545 .463 -.044 -.104 .354 .424 .424 .118 .1576 -.079 .340 .393 .097 -.175 .667 -.378 -.2837 .065 .149 .048 -.057 -.702 .131 .393 .2788 .078 -.193 -.148 .529 -.106 .168 .469 -.1839 .034 -.088 -.045 -.034 -.240 .188 -.041 .55210 .163 -.016 .030 .320 -.012 -.150 -.523 .545
Extraction Method: Principal Component Analysis. Rotation Method: Varimax with Kaiser Normalization.

Geary WP 2005/10 26