weight loss and mortality: a gender-specific analysis of the tromsø study
TRANSCRIPT
GENDER MEDICINE/VOL. 6, NO. 4, 2009
575
Accepted for publication April 21, 2009. doi:10.1016/j.genm.2009.12.003© 2009 Excerpta Medica Inc. All rights reserved. 1550-8579/$ - see front matter
Weight Loss and Mortality: A Gender-Specific Analysis of the Tromsø StudyTom Wilsgaard, PhD1; Bjarne K. Jacobsen, PhD1; Ellisiv B. Mathiesen, MD, PhD2; and Inger Njølstad, MD, PhD1
1Institute of Community Medicine, University of Tromsø, Tromsø, Norway; and 2Institute of Clinical Medicine, University of Tromsø, Tromsø, Norway
ABSTRACTBackground: Weight loss has been associated with increased mortality, but findings have been inconsistent. Objective: The aim of this study was to examine the association between weight loss and mortality, with
a focus on gender differences.Methods: This was a population-based cohort study in northern Norway of adults, aged 20 to 54 years
in 1979, who participated in 2 or 3 consecutive health surveys in 1979–80, 1986–87, and 1994–95. Weight and height were measured at each survey. The Cox proportional hazards regression model was used to estimate hazard ratios for mortality between levels of body mass index (BMI) change during 11 years of follow-up. Participants with prior cardiovascular disease or cancer, or incident cancer within the first 2 years of follow-up, were excluded, as were participants who were pregnant, had missing data, or did not give written consent.
Results: A total of 4881 men and 5051 women participated in the present study. The mean age at start of follow-up was 50.8 years (range, 35–70 years) in men and 49.2 years (range, 35–65 years) in women. In men, weight loss was associated with increased all-cause, cardiovascular, and noncardiovascular mortality. The hazard ratio for men for all-cause mortality with a 10-year BMI decrease of 2 kg/m2 versus a BMI increase of 1 kg/m2 was 2.09 (95% CI, 1.56–2.81). The association was not significantly modified by initial BMI, age, smoking status, or self-reported attempts of weight loss, or by exclusion of subjects with self-reported poor health, diabetes mellitus, high blood pressure, or high alcohol intake. In women, no association between BMI change and mortality was observed. However, in the subgroup of women who reported no weight-loss attempts, BMI change was significantly associated with mortality risk (P = 0.022).
Conclusions: In this study of a Norwegian population, weight loss was associated with excess mortality in men in all subgroups of weight-loss attempts, daily smoking, and overweight. In women, the only significant effect of BMI change on mortality was observed in those who reported no weight-loss attempts. The observed findings could not be explained by preexisting disease. (Gend Med. 2009;6:575–586) © 2009 Excerpta Medica Inc.
Key words: body mass index, body weight changes, gender, longitudinal studies.
576
Gender Medicine
pality of Tromsø, Norway, were invited to partici-pate. All participants were recruited by mail.
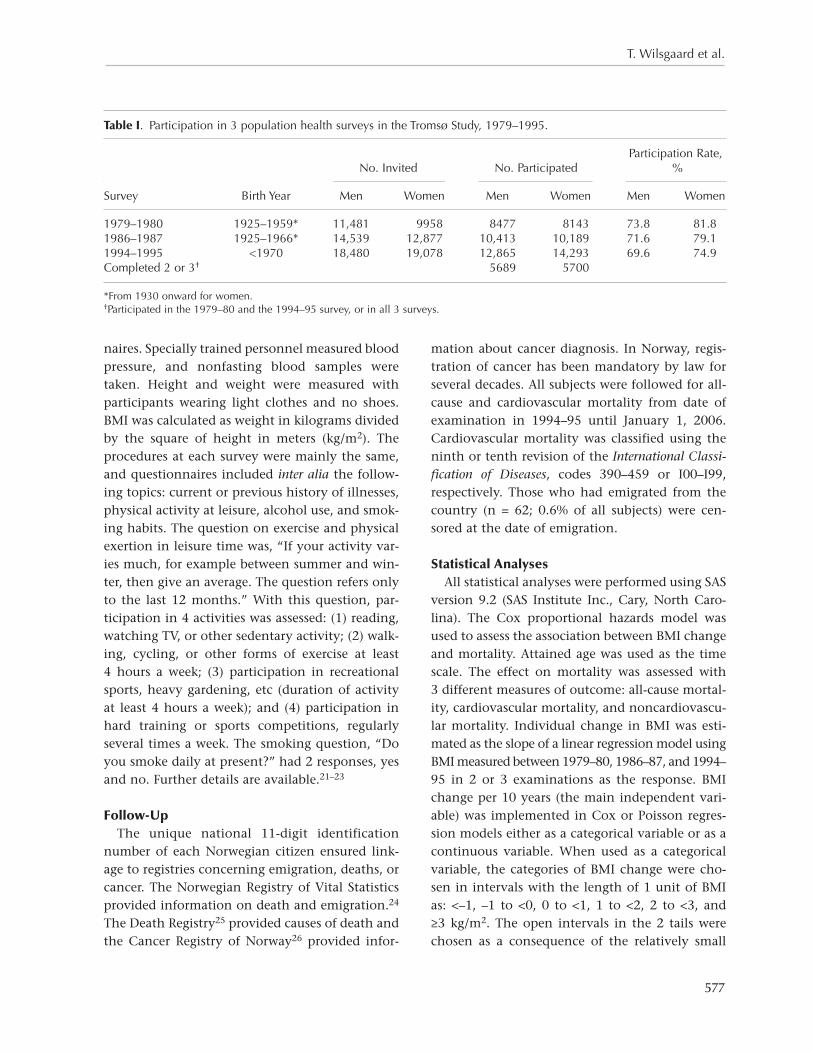
The first survey (1974) included only men aged 20 to 49 years, whereas both men and women were invited to participate in the subsequent sur-veys. In the second survey (1979–80), all men born between 1925 and 1959 (ie, aged 20–54 years) and all women born between 1930 and 1959 (ie, aged 20–49 years) were invited (Table I), and 16,620 subjects, or 77.5% of the eligible popula-tion, participated. In the third survey (1986–87), the invited birth cohort was expanded to also include those born between 1960 and 1966, men and women aged 20 to 61 and 20 to 56 years, re- spectively, for a total of 20,602 subjects or 75.1% participation. At the fourth survey (1994–95), all subjects born prior to 1970 (ie, aged ≥25 years) were invited, yielding a total of 27,158 subjects participating or 72.3% of the population.
Eligible for the present study were those 11,389 sub-jects who either participated in all 3 surveys in 1979–80, 1986–87, and 1994–95 (n = 10,471), or in the 1979–80 and the 1994–95 survey only (n = 918). These participants comprised 53.1% of the invited population in 1979–80. Subjects who did not give full written informed consent (n = 119), who in any of the surveys reported a history of angina pectoris, myocardial infarction, or stroke (681); with incomplete data on weight or height (238); with missing data on physical activity or smoking status (14); or who were pregnant (71) in the 1979–80 or the 1994–95 survey were excluded from the analyses. Also excluded were those with a verified history of cancer before the start of fol-low-up in 1994–95, and those who were diagnosed with cancer during the first 2 years of follow-up (n = 334). Thus, the present analyses comprised 9932 subjects. The regional board of research eth-ics and the Norwegian Data Inspectorate approved the Tromsø Study. The surveys were conducted by the University of Tromsø and local health author-ities in cooperation with the National Health Screening Service, Oslo, Norway.
MeasurementsAt each survey, the participants attended a
clinical examination and completed 2 question-
INTRODUCTIONOverweight and obesity have become public health concerns in both developed and developing coun-tries.1 The prevalence of obese persons in Western countries varies, but has been estimated at a prev-alence of 15% to 20%.2 In the United States, 2 of 3 adults are overweight (body mass index [BMI] ≥25 kg/m2), and 1 of 3 is obese (BMI ≥30 kg/m2).3 Underweight and obesity have been associated with both adverse health outcomes and increased mortality.4–6 A J- or U-shaped relationship has typically been found, but results have varied.4,7–12 The findings concerning the effect of overweight on mortality are divergent, possibly because abdomi-nal adiposity may be a better predictor of mortal-ity, independent of BMI.4,8,13
The effect of weight change on mortality has also been assessed in several studies.7,14–19 Most studies reported that weight loss was associated with in- creased mortality7,14–17; but the results were incon-sistent, particularly those from studies that includ-ed women only.10,18,19 Most previous studies either did not focus on gender differences or included men only.7,14–18 Therefore, studies that address dif-ferences between men and women in a general population would add to the current body of litera-ture. In addition, a recent systematic review on long-term weight-loss effects on all-cause mortality has indicated that gender differences may exist and that further studies are warranted.20
Thus, the aim of the present study was to assess the association between BMI change and all-cause, cardiovascular or noncardiovascular mortality in a longitudinal study comprising >11,000 men and women who have had their weight and height measured at 2 or 3 surveys between 1979–80 and 1994–95 and were then followed for 11 years until January 1, 2006.
SUBJECTS AND METHODSStudy Population
The Tromsø Study was initiated in 1974 with a main focus on cardiovascular diseases.21–23 The study design included 6 repeated population health surveys, in 1974, 1979–80, 1986–87, 1994–95, 2001, and 2007–08. Total birth cohorts and additional 5% to 10% samples of adult inhabitants of the munici-
577
T. Wilsgaard et al.
mation about cancer diagnosis. In Norway, regis-tration of cancer has been mandatory by law for several decades. All subjects were followed for all-cause and cardiovascular mortality from date of examination in 1994–95 until January 1, 2006. Cardiovascular mortality was classified using the ninth or tenth revision of the International Classi- fication of Diseases, codes 390–459 or I00–I99, respectively. Those who had emigrated from the country (n = 62; 0.6% of all subjects) were cen-sored at the date of emigration.
Statistical AnalysesAll statistical analyses were performed using SAS
version 9.2 (SAS Institute Inc., Cary, North Caro- lina). The Cox proportional hazards model was used to assess the association between BMI change and mortality. Attained age was used as the time scale. The effect on mortality was assessed with 3 different measures of outcome: all-cause mortal-ity, cardiovascular mortality, and noncardiovascu-lar mortality. Individual change in BMI was esti-mated as the slope of a linear regression model using BMI measured between 1979–80, 1986–87, and 1994– 95 in 2 or 3 examinations as the response. BMI change per 10 years (the main independent vari-able) was implemented in Cox or Poisson regres-sion models either as a categorical variable or as a continuous variable. When used as a categorical variable, the categories of BMI change were cho-sen in intervals with the length of 1 unit of BMI as: <–1, –1 to <0, 0 to <1, 1 to <2, 2 to <3, and ≥3 kg/m2. The open intervals in the 2 tails were chosen as a consequence of the relatively small
naires. Specially trained personnel measured blood pressure, and nonfasting blood samples were taken. Height and weight were measured with participants wearing light clothes and no shoes. BMI was calculated as weight in kilograms divided by the square of height in meters (kg/m2). The procedures at each survey were mainly the same, and questionnaires included inter alia the follow-ing topics: current or previous history of illnesses, physical activity at leisure, alcohol use, and smok-ing habits. The question on exercise and physical exertion in leisure time was, “If your activity var-ies much, for example between summer and win-ter, then give an average. The question refers only to the last 12 months.” With this question, par-ticipation in 4 activities was assessed: (1) reading, watching TV, or other sedentary activity; (2) walk-ing, cycling, or other forms of exercise at least 4 hours a week; (3) participation in recreational sports, heavy gardening, etc (duration of activity at least 4 hours a week); and (4) participation in hard training or sports competitions, regularly several times a week. The smoking question, “Do you smoke daily at present?” had 2 responses, yes and no. Further details are available.21–23
Follow-UpThe unique national 11-digit identification
number of each Norwegian citizen ensured link-age to registries concerning emigration, deaths, or cancer. The Norwegian Registry of Vital Statistics provided information on death and emigration.24 The Death Registry25 provided causes of death and the Cancer Registry of Norway26 provided infor-
Table I. Participation in 3 population health surveys in the Tromsø Study, 1979–1995.
Participation Rate, No. Invited No. Participated %
Survey Birth Year Men Women Men Women Men Women
1979–1980 1925–1959* 11,481 9958 8477 8143 73.8 81.81986–1987 1925–1966* 14,539 12,877 10,413 10,189 71.6 79.11994–1995 <1970 18,480 19,078 12,865 14,293 69.6 74.9Completed 2 or 3† 5689 5700
*From 1930 onward for women.†Participated in the 1979–80 and the 1994–95 survey, or in all 3 surveys.
578
Gender Medicine
mation from the 1994–95 survey), initial daily smokers (yes/no), and presence of overweight (BMI ≥25 kg/m2) (yes/no). The proportional haz-ards assumption was assessed by graphical inspec-tion and by verifying that the Schoenfeld residuals were not significantly associated with time scale.
An overall association between BMI change and mortality was assessed by a likelihood ratio test comparing 2 nested models, with and without 2 fractional polynomial terms of BMI change. Tests of interactions between BMI change and the covariates initial BMI, initial smoking status, ini-tial age, sex, and weight-loss attempts (yes/no) were assessed by including the product of each covariate and the 2 fractional polynomial terms of BMI change.
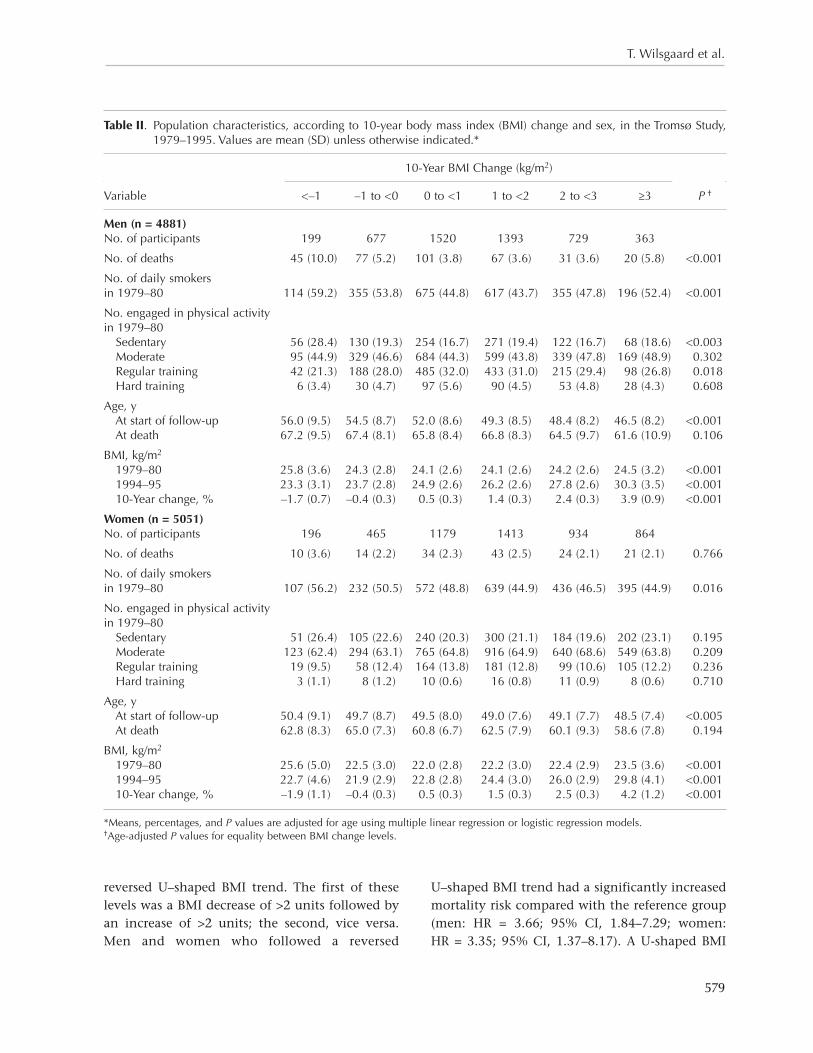
RESULTSTable II shows the population characteristics, by groups of BMI change, of the 4881 men and 5051 women included in the study. The mean age at start of follow-up was 50.8 years (range, 35–70 years) in men and 49.2 years (range, 35–65 years) in women. In men, the age-adjusted mortality rates were highest among those who lost weight, at 10.0% of those who lost >1 kg/m2 over a period of 10 years. Men who lost weight were also more frequently smokers, reported less leisure-time physical activ-ity, had the highest initial BMI, and were, on aver-age, older than men who gained weight. In women, other patterns were observed. There was no sig-nificant difference in the proportions of deaths between the categories of BMI change in women, and the differences in leisure-time physical activi-ty levels and in mean age at the start of follow-up were smaller than those differences in men.
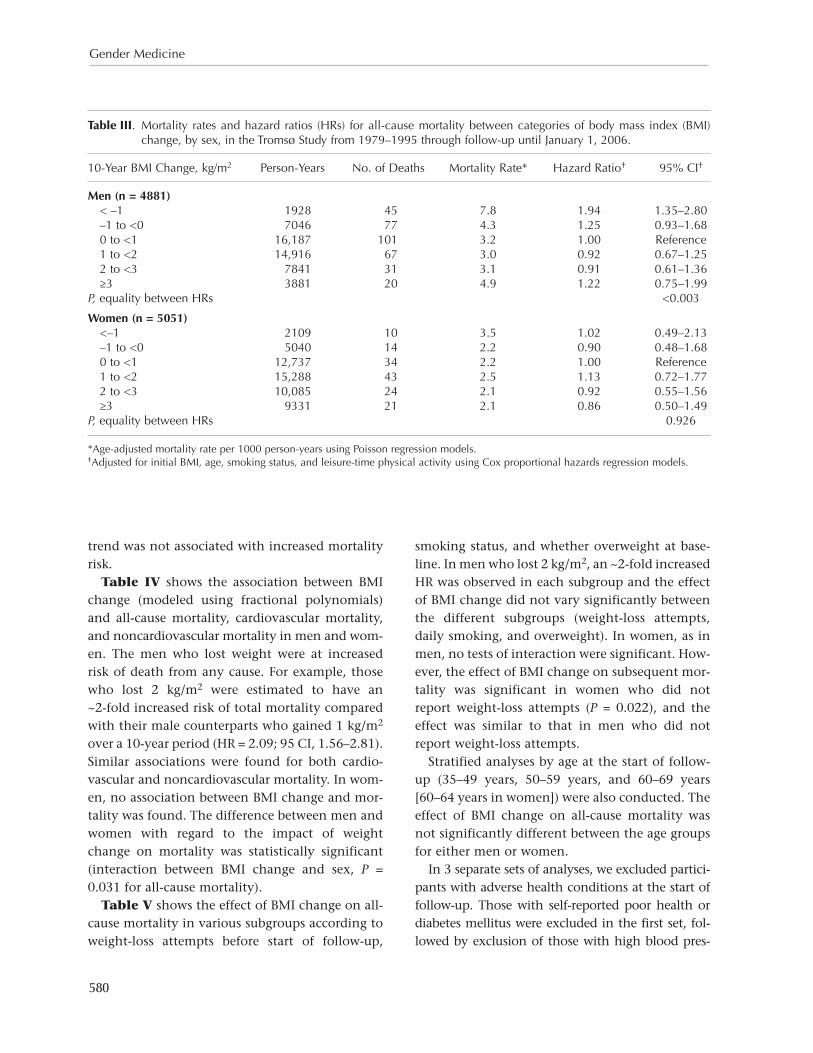
The age-adjusted mortality rate was 7.8 per 1000 person-years in men who lost >1 kg/m2 compared with 3.2 in men who gained between 0 and 1 kg/m2 (Table III). The multivariable HR between the 2 groups of men was 1.94 (95% CI, 1.35–2.80). In women, smaller differences in mortality rate were observed between the groups of BMI change, and the HRs were not significantly different.
To assess the effect of weight cycling, the 6 lev-els of BMI change seen in Table III were expand-ed with 2 more levels defined as a U-shaped or a
numbers of deaths in these intervals, especially in women. Hazard ratios (HRs) for mortality were estimated for each category using BMI change level 0 to <1 kg/m2 as the reference group. When used as a continuous variable, second-degree frac-tional polynomials were fitted. The powers for fractional polynomials were chosen from a set ϕ = (−2, −1, −1/2, 0, 1/2, 1, 2, 3).27 Because some of the assessed powers require that the exposure vari-ables are nonnegative and because BMI change may take negative values, BMI change was cen-tered on –11 to ensure that all values are greater than zero. The best-fitting fractional polynomials were of degree 2 with powers 2 and 3. An example of a proportional hazards model would then be:
h(t) = h0(t)exp(β1ΔBMI2 + β2ΔBMI3 + β3χ),
where h is the hazard function, h0 is the base- line hazard, t is the time scale, ΔBMI is BMI change, χ is a covariate, and the βis are the regression coefficients.
HRs for mortality were estimated for specific values of BMI change using the BMI increase of 1 kg/m2 as the reference group. The choice of ref-erence is somewhat arbitrary but does not influ-ence the statistical models, and was chosen be- cause a small BMI increase was anticipated to be more common than no increase in a 10- to 15-year period. The analyses were sex specific and initial values of BMI, age, daily smoking (yes/no), and leisure-time physical activity were included as co- variates because they are plausible confounders. Both smoking and physical activity were antici-pated to be associated with both mortality and BMI change, and age was controlled for due to its strong relationship with mortality. Initial BMI was included to control for each subject’s initial value when assessing the association between BMI change and mortality. Fractional polynomials were also assessed for the covariates initial BMI and initial age. However, none of these models gave a better fit than models in which the covariates were treat-ed as linear. In further analyses, we also assessed the effect of BMI change on mortality in the fol-lowing groups: weight-loss attempts after the age of 20 (yes/no) (according to questionnaire infor-
579
T. Wilsgaard et al.
U–shaped BMI trend had a significantly increased mortality risk compared with the reference group (men: HR = 3.66; 95% CI, 1.84–7.29; women: HR = 3.35; 95% CI, 1.37–8.17). A U-shaped BMI
reversed U–shaped BMI trend. The first of these levels was a BMI decrease of >2 units followed by an increase of >2 units; the second, vice versa. Men and women who followed a reversed
Table II. Population characteristics, according to 10-year body mass index (BMI) change and sex, in the Tromsø Study, 1979–1995. Values are mean (SD) unless otherwise indicated.*
10-Year BMI Change (kg/m2)
Variable <–1 –1 to <0 0 to <1 1 to <2 2 to <3 ≥3 P †
Men (n = 4881)No. of participants 199 677 1520 1393 729 363
No. of deaths 45 (10.0) 77 (5.2) 101 (3.8) 67 (3.6) 31 (3.6) 20 (5.8) <0.001
No. of daily smokers in 1979–80 114 (59.2) 355 (53.8) 675 (44.8) 617 (43.7) 355 (47.8) 196 (52.4) <0.001
No. engaged in physical activity in 1979–80 Sedentary 56 (28.4) 130 (19.3) 254 (16.7) 271 (19.4) 122 (16.7) 68 (18.6) <0.003 Moderate 95 (44.9) 329 (46.6) 684 (44.3) 599 (43.8) 339 (47.8) 169 (48.9) 0.302 Regular training 42 (21.3) 188 (28.0) 485 (32.0) 433 (31.0) 215 (29.4) 98 (26.8) 0.018 Hard training 6 (3.4) 30 (4.7) 97 (5.6) 90 (4.5) 53 (4.8) 28 (4.3) 0.608
Age, y At start of follow-up 56.0 (9.5) 54.5 (8.7) 52.0 (8.6) 49.3 (8.5) 48.4 (8.2) 46.5 (8.2) <0.001 At death 67.2 (9.5) 67.4 (8.1) 65.8 (8.4) 66.8 (8.3) 64.5 (9.7) 61.6 (10.9) 0.106
BMI, kg/m2
1979–80 25.8 (3.6) 24.3 (2.8) 24.1 (2.6) 24.1 (2.6) 24.2 (2.6) 24.5 (3.2) <0.001 1994–95 23.3 (3.1) 23.7 (2.8) 24.9 (2.6) 26.2 (2.6) 27.8 (2.6) 30.3 (3.5) <0.001 10-Year change, % –1.7 (0.7) –0.4 (0.3) 0.5 (0.3) 1.4 (0.3) 2.4 (0.3) 3.9 (0.9) <0.001
Women (n = 5051) No. of participants 196 465 1179 1413 934 864
No. of deaths 10 (3.6) 14 (2.2) 34 (2.3) 43 (2.5) 24 (2.1) 21 (2.1) 0.766
No. of daily smokers in 1979–80 107 (56.2) 232 (50.5) 572 (48.8) 639 (44.9) 436 (46.5) 395 (44.9) 0.016
No. engaged in physical activity in 1979–80 Sedentary 51 (26.4) 105 (22.6) 240 (20.3) 300 (21.1) 184 (19.6) 202 (23.1) 0.195 Moderate 123 (62.4) 294 (63.1) 765 (64.8) 916 (64.9) 640 (68.6) 549 (63.8) 0.209 Regular training 19 (9.5) 58 (12.4) 164 (13.8) 181 (12.8) 99 (10.6) 105 (12.2) 0.236 Hard training 3 (1.1) 8 (1.2) 10 (0.6) 16 (0.8) 11 (0.9) 8 (0.6) 0.710
Age, y At start of follow-up 50.4 (9.1) 49.7 (8.7) 49.5 (8.0) 49.0 (7.6) 49.1 (7.7) 48.5 (7.4) <0.005 At death 62.8 (8.3) 65.0 (7.3) 60.8 (6.7) 62.5 (7.9) 60.1 (9.3) 58.6 (7.8) 0.194
BMI, kg/m2
1979–80 25.6 (5.0) 22.5 (3.0) 22.0 (2.8) 22.2 (3.0) 22.4 (2.9) 23.5 (3.6) <0.001 1994–95 22.7 (4.6) 21.9 (2.9) 22.8 (2.8) 24.4 (3.0) 26.0 (2.9) 29.8 (4.1) <0.001 10-Year change, % –1.9 (1.1) –0.4 (0.3) 0.5 (0.3) 1.5 (0.3) 2.5 (0.3) 4.2 (1.2) <0.001
*Means, percentages, and P values are adjusted for age using multiple linear regression or logistic regression models.†Age-adjusted P values for equality between BMI change levels.
580
Gender Medicine
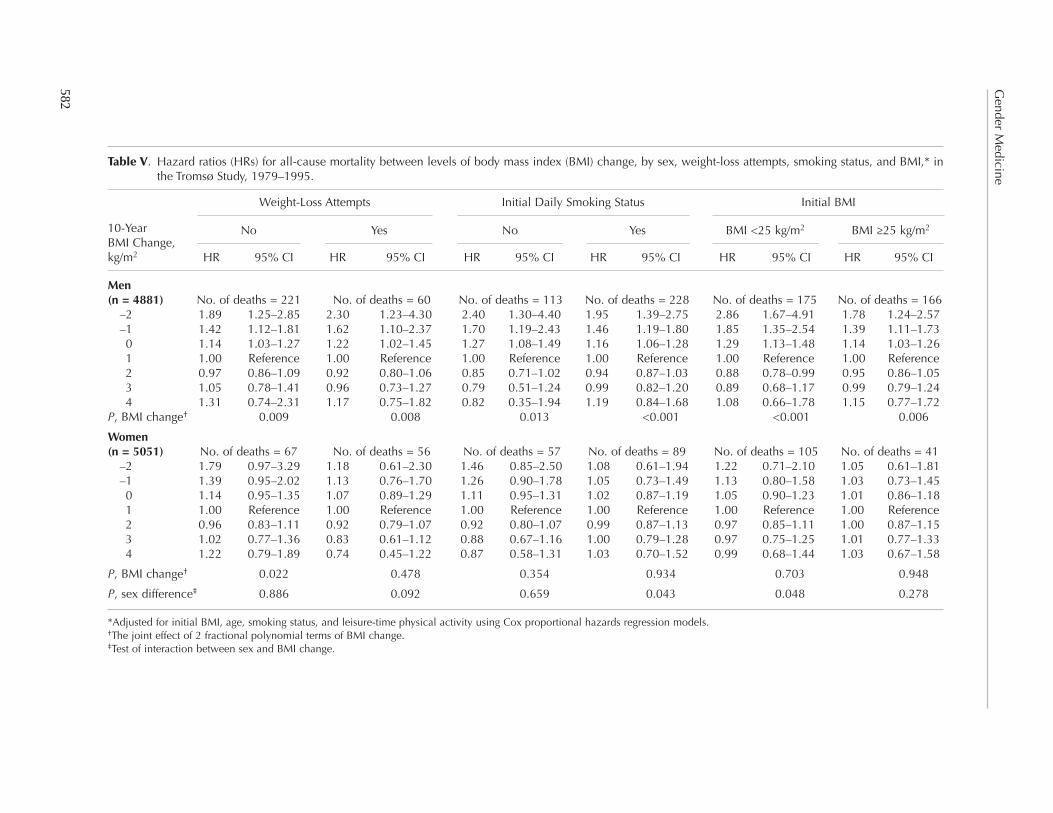
smoking status, and whether overweight at base-line. In men who lost 2 kg/m2, an ~2-fold increased HR was observed in each subgroup and the effect of BMI change did not vary significantly between the different subgroups (weight-loss attempts, daily smoking, and overweight). In women, as in men, no tests of interaction were significant. How- ever, the effect of BMI change on subsequent mor-tality was significant in women who did not report weight-loss attempts (P = 0.022), and the effect was similar to that in men who did not report weight-loss attempts.
Stratified analyses by age at the start of follow-up (35–49 years, 50–59 years, and 60–69 years [60–64 years in women]) were also conducted. The effect of BMI change on all-cause mortality was not significantly different between the age groups for either men or women.
In 3 separate sets of analyses, we excluded partici-pants with adverse health conditions at the start of follow-up. Those with self-reported poor health or diabetes mellitus were excluded in the first set, fol-lowed by exclusion of those with high blood pres-
trend was not associated with increased mortality risk.
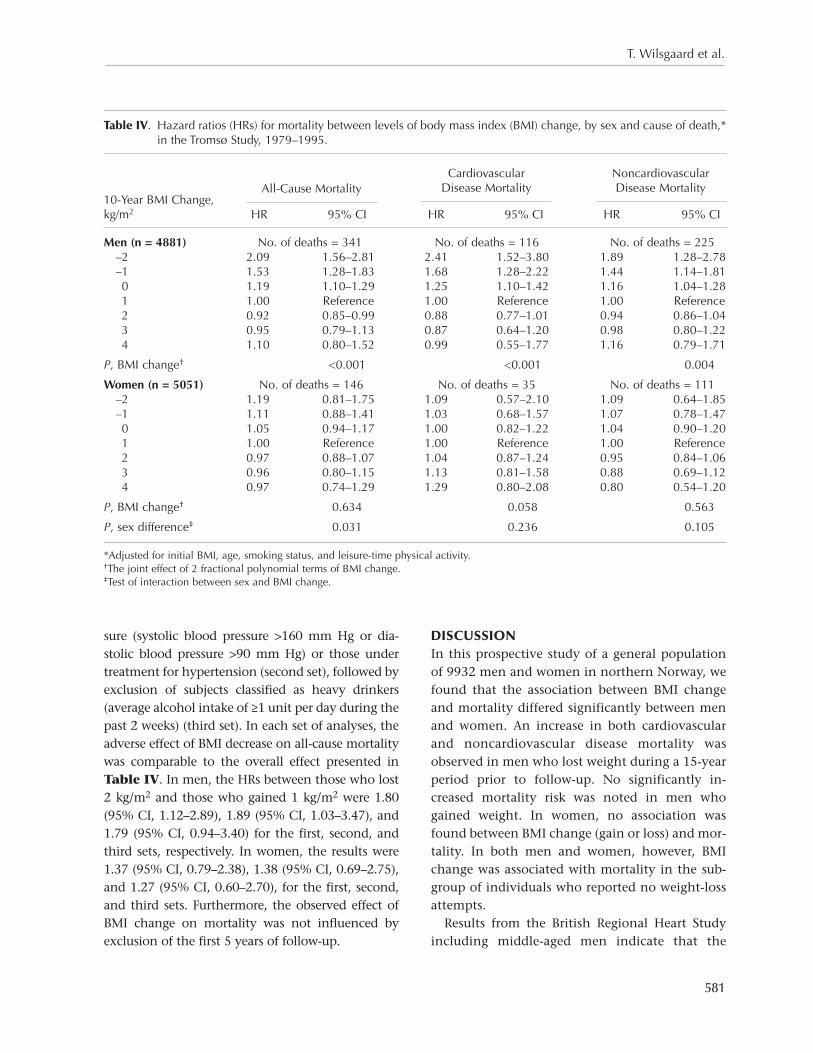
Table IV shows the association between BMI change (modeled using fractional polynomials) and all-cause mortality, cardiovascular mortality, and noncardiovascular mortality in men and wom- en. The men who lost weight were at increased risk of death from any cause. For example, those who lost 2 kg/m2 were estimated to have an ~2-fold increased risk of total mortality compared with their male counterparts who gained 1 kg/m2 over a 10-year period (HR = 2.09; 95 CI, 1.56–2.81). Similar associations were found for both cardio-vascular and noncardiovascular mortality. In wom- en, no association between BMI change and mor-tality was found. The difference between men and women with regard to the impact of weight change on mortality was statistically significant (interaction between BMI change and sex, P = 0.031 for all-cause mortality).
Table V shows the effect of BMI change on all-cause mortality in various subgroups according to weight-loss attempts before start of follow-up,
Table III. Mortality rates and hazard ratios (HRs) for all-cause mortality between categories of body mass index (BMI) change, by sex, in the Tromsø Study from 1979–1995 through follow-up until January 1, 2006.
10-Year BMI Change, kg/m2 Person-Years No. of Deaths Mortality Rate* Hazard Ratio† 95% CI†
Men (n = 4881) < –1 1928 45 7.8 1.94 1.35–2.80 –1 to <0 7046 77 4.3 1.25 0.93–1.68 0 to <1 16,187 101 3.2 1.00 Reference 1 to <2 14,916 67 3.0 0.92 0.67–1.25 2 to <3 7841 31 3.1 0.91 0.61–1.36 ≥3 3881 20 4.9 1.22 0.75–1.99P, equality between HRs <0.003
Women (n = 5051) <–1 2109 10 3.5 1.02 0.49–2.13 –1 to <0 5040 14 2.2 0.90 0.48–1.68 0 to <1 12,737 34 2.2 1.00 Reference 1 to <2 15,288 43 2.5 1.13 0.72–1.77 2 to <3 10,085 24 2.1 0.92 0.55–1.56 ≥3 9331 21 2.1 0.86 0.50–1.49P, equality between HRs 0.926
*Age-adjusted mortality rate per 1000 person-years using Poisson regression models.†Adjusted for initial BMI, age, smoking status, and leisure-time physical activity using Cox proportional hazards regression models.
581
T. Wilsgaard et al.
DISCUSSIONIn this prospective study of a general population of 9932 men and women in northern Norway, we found that the association between BMI change and mortality differed significantly between men and women. An increase in both cardiovascular and noncardiovascular disease mortality was observed in men who lost weight during a 15-year period prior to follow-up. No significantly in- creased mortality risk was noted in men who gained weight. In women, no association was found between BMI change (gain or loss) and mor-tality. In both men and women, however, BMI change was associated with mortality in the sub-group of individuals who reported no weight-loss attempts.
Results from the British Regional Heart Study including middle-aged men indicate that the
sure (systolic blood pressure >160 mm Hg or dia-stolic blood pressure >90 mm Hg) or those under treatment for hypertension (second set), followed by exclusion of subjects classified as heavy drinkers (average alcohol intake of ≥1 unit per day during the past 2 weeks) (third set). In each set of analyses, the adverse effect of BMI decrease on all-cause mortality was comparable to the overall effect presented in Table IV. In men, the HRs between those who lost 2 kg/m2 and those who gained 1 kg/m2 were 1.80 (95% CI, 1.12–2.89), 1.89 (95% CI, 1.03–3.47), and 1.79 (95% CI, 0.94–3.40) for the first, second, and third sets, respectively. In women, the results were 1.37 (95% CI, 0.79–2.38), 1.38 (95% CI, 0.69–2.75), and 1.27 (95% CI, 0.60–2.70), for the first, second, and third sets. Furthermore, the observed effect of BMI change on mortality was not influenced by exclusion of the first 5 years of follow-up.
Table IV. Hazard ratios (HRs) for mortality between levels of body mass index (BMI) change, by sex and cause of death,* in the Tromsø Study, 1979–1995.
10-Year BMI Change, kg/m2 HR 95% CI HR 95% CI HR 95% CI
Men (n = 4881) No. of deaths = 341 No. of deaths = 116 No. of deaths = 225 –2 2.09 1.56–2.81 2.41 1.52–3.80 1.89 1.28–2.78 –1 1.53 1.28–1.83 1.68 1.28–2.22 1.44 1.14–1.81 0 1.19 1.10–1.29 1.25 1.10–1.42 1.16 1.04–1.28 1 1.00 Reference 1.00 Reference 1.00 Reference 2 0.92 0.85–0.99 0.88 0.77–1.01 0.94 0.86–1.04 3 0.95 0.79–1.13 0.87 0.64–1.20 0.98 0.80–1.22 4 1.10 0.80–1.52 0.99 0.55–1.77 1.16 0.79–1.71
P, BMI change† <0.001 <0.001 0.004
Women (n = 5051) No. of deaths = 146 No. of deaths = 35 No. of deaths = 111 –2 1.19 0.81–1.75 1.09 0.57–2.10 1.09 0.64–1.85 –1 1.11 0.88–1.41 1.03 0.68–1.57 1.07 0.78–1.47 0 1.05 0.94–1.17 1.00 0.82–1.22 1.04 0.90–1.20 1 1.00 Reference 1.00 Reference 1.00 Reference 2 0.97 0.88–1.07 1.04 0.87–1.24 0.95 0.84–1.06 3 0.96 0.80–1.15 1.13 0.81–1.58 0.88 0.69–1.12 4 0.97 0.74–1.29 1.29 0.80–2.08 0.80 0.54–1.20
P, BMI change† 0.634 0.058 0.563
P, sex difference‡ 0.031 0.236 0.105
*Adjusted for initial BMI, age, smoking status, and leisure-time physical activity.†The joint effect of 2 fractional polynomial terms of BMI change.‡Test of interaction between sex and BMI change.
All-Cause Mortality
Cardiovascular Disease Mortality
Noncardiovascular Disease Mortality
582
Gender M
edicine
Table V. Hazard ratios (HRs) for all-cause mortality between levels of body mass index (BMI) change, by sex, weight-loss attempts, smoking status, and BMI,* in the Tromsø Study, 1979–1995.
10-Year BMI Change, kg/m2 HR 95% CI HR 95% CI HR 95% CI HR 95% CI HR 95% CI HR 95% CI
Men (n = 4881) No. of deaths = 221 No. of deaths = 60 No. of deaths = 113 No. of deaths = 228 No. of deaths = 175 No. of deaths = 166 –2 1.89 1.25–2.85 2.30 1.23–4.30 2.40 1.30–4.40 1.95 1.39–2.75 2.86 1.67–4.91 1.78 1.24–2.57 –1 1.42 1.12–1.81 1.62 1.10–2.37 1.70 1.19–2.43 1.46 1.19–1.80 1.85 1.35–2.54 1.39 1.11–1.73 0 1.14 1.03–1.27 1.22 1.02–1.45 1.27 1.08–1.49 1.16 1.06–1.28 1.29 1.13–1.48 1.14 1.03–1.26 1 1.00 Reference 1.00 Reference 1.00 Reference 1.00 Reference 1.00 Reference 1.00 Reference 2 0.97 0.86–1.09 0.92 0.80–1.06 0.85 0.71–1.02 0.94 0.87–1.03 0.88 0.78–0.99 0.95 0.86–1.05 3 1.05 0.78–1.41 0.96 0.73–1.27 0.79 0.51–1.24 0.99 0.82–1.20 0.89 0.68–1.17 0.99 0.79–1.24 4 1.31 0.74–2.31 1.17 0.75–1.82 0.82 0.35–1.94 1.19 0.84–1.68 1.08 0.66–1.78 1.15 0.77–1.72P, BMI change† 0.009 0.008 0.013 <0.001 <0.001 0.006
Women (n = 5051) No. of deaths = 67 No. of deaths = 56 No. of deaths = 57 No. of deaths = 89 No. of deaths = 105 No. of deaths = 41 –2 1.79 0.97–3.29 1.18 0.61–2.30 1.46 0.85–2.50 1.08 0.61–1.94 1.22 0.71–2.10 1.05 0.61–1.81 –1 1.39 0.95–2.02 1.13 0.76–1.70 1.26 0.90–1.78 1.05 0.73–1.49 1.13 0.80–1.58 1.03 0.73–1.45 0 1.14 0.95–1.35 1.07 0.89–1.29 1.11 0.95–1.31 1.02 0.87–1.19 1.05 0.90–1.23 1.01 0.86–1.18 1 1.00 Reference 1.00 Reference 1.00 Reference 1.00 Reference 1.00 Reference 1.00 Reference 2 0.96 0.83–1.11 0.92 0.79–1.07 0.92 0.80–1.07 0.99 0.87–1.13 0.97 0.85–1.11 1.00 0.87–1.15 3 1.02 0.77–1.36 0.83 0.61–1.12 0.88 0.67–1.16 1.00 0.79–1.28 0.97 0.75–1.25 1.01 0.77–1.33 4 1.22 0.79–1.89 0.74 0.45–1.22 0.87 0.58–1.31 1.03 0.70–1.52 0.99 0.68–1.44 1.03 0.67–1.58
P, BMI change† 0.022 0.478 0.354 0.934 0.703 0.948
P, sex difference‡ 0.886 0.092 0.659 0.043 0.048 0.278
*Adjusted for initial BMI, age, smoking status, and leisure-time physical activity using Cox proportional hazards regression models.†The joint effect of 2 fractional polynomial terms of BMI change.‡Test of interaction between sex and BMI change.
No No BMI <25 kg/m2Yes Yes BMI ≥25 kg/m2
Weight-Loss Attempts Initial Daily Smoking Status Initial BMI
583
T. Wilsgaard et al.
include them in our models because they are mech-anisms by which BMI affects vascular mortality.
Sex differences could also be attributed to differ-ences in BMI measured at the start of follow-up in 1994–95. Separate sets of analyses were therefore conducted. In analyses stratified on BMI at the start of follow-up, the association between BMI change and mortality was stronger in men with a BMI <25 kg/m2 compared with men with a BMI ≥25 kg/m2; however, the difference was not sig-nificant. In women, no association was observed in the 2 strata. These results are comparable to the strata-specific results of initial BMI measured in 1979–80 and presented in Table V. It is also of interest to assess the effect of weight loss among the obese (BMI ≥30 kg/m2). However, separate analy-ses restricted to those who were obese at start of follow-up (477 men and 37 deaths, 571 women and 24 deaths) revealed no different effect of BMI change compared with the effect observed in other subgroups. The estimated HRs for those who were obese and had a BMI decrease of 2 kg/m2 were 2.93 (95% CI, 0.99–8.70) in men and 0.62 (95% CI, 0.25–1.56) in women.
To assess individuals in the extreme tail of the BMI change distribution, we focused on those who lost >1 BMI unit (199 men and 196 women) and categorized BMI at the start of follow-up as <18.5, 18.5 to 20, 20 to 25, 25 to 30, or >30. It was evident that the prevalence of underweight and low weight was higher in women than in men. The observed distributions in the aforementioned categories were 3.0%, 8.5%, 59.3%, 26.1%, and 3.0% in men, and 14.8%, 11.7%, 49.5%, 14.3%, and 9.7% in women, respectively. These distribu-tions do not indicate that the men who lost weight prior to follow-up were at an unhealthy low weight at the start of follow-up, and they do not indicate that men had a more unhealthy weight compared with women. Furthermore, a χ2 test comparing the number of deaths within each category was not significant for either men or women.
Few studies have included both men and women,15,16,30 and even fewer studies have pre-sented sex-specific results or addressed sex differ-ences in the associations between weight change and mortality.16,30 The Nord-Trøndelag Health Study
increased mortality associated with weight loss is a direct consequence of ill health.14 According to our findings, this question remains unclear, as we minimized the effect of preexisting disease on weight change by excluding participants with can-cer before the start of, and within the first 2 years of, follow-up as well as those with a self-reported history of myocardial infarction, stroke, or angina in any of the 3 surveys. In 2 additional sets of analyses, we further excluded participants with self-reported poor health and diabetes mellitus or we excluded the first 5 years of follow-up. The main result, an increased mortality in men with weight loss, was not influenced.
A recent study by Pischon et al4 concluded that both general and abdominal adiposity were inde-pendently related to the risk of death. Our study could thus have been strengthened if we had been able to include repeated measures of abdominal adiposity (such as waist circumference) in addi-tion to BMI. The effect of a decrease in waist cir-cumference may have been different and perhaps more favorable compared with the present finding that a decrease in BMI in men is associated with an increased risk of mortality.
The observed sex differences are striking. Why did we find a higher mortality associated with weight loss in men than in women? If weight loss is only a marker of ill health, why didn’t we find similar results in men and women? Metabolic and other health consequences of weight change may, however, depend on sex. Selective loss of fat mass is beneficial, loss of fat-free mass is deleterious,28 and weight changes have been associated with more unfavorable relative changes in fat-free mass in men than in women.29 It is possible that the excess mortality due to weight loss in men may be explained by a relatively higher degree of loss of fat-free mass in men.
Physical activity, smoking, age, and BMI were all assessed both as confounders and effect modifiers. These variables did not explain the observed effects, nor did our attempts to control for preexisting disease. Other variables that are well-known risk factors for morbidity and mortality and that may differ between men and women are blood pressure and blood lipids. However, we have chosen not to
584
Gender Medicine
4977 subjects (30% of the 1979–80 cohort) had no repeated measurements of height and weight. Of these individuals, ~62% had not been invited because they had moved from Tromsø, and 10% had died. In a separate set of analyses, we com-pared these subjects with those who were included in the final analyses. Although those not included were significantly younger, with a mean of 1.4 years in men and 2.8 years in women, adjusting for this age discrepancy did not significantly influence the initial BMI findings in men and women, and no differences were observed for initial smoking sta-tus and physical activity in women.
Information bias could have been present because of errors and misclassifications, and unmeasured confounding is always a consideration. However, BMI was measured with high validity and repro-ducibility, and the primary end point, all-cause mortality, was measured without error. The cause-specific mortality may be subject to some misclas-sification. References to data collection, concepts, and methods can be found at Statistics Norway.25
Nondifferential misclassification with regard to the confounders (such as smoking and leisure-time physical activity) undoubtedly occurred, because most habits are reported with some error and habits indubitably change. Misclassification of physical activity level is most likely more preva-lent than misclassification of smoking status. Group-specific analyses revealed no difference in the association between BMI change and mortality between smokers and nonsmokers (Table V). Similar analyses according to physical activity did not show different relationships between individ-uals in the 2 lowest compared with the 2 highest levels of physical activity. It is not possible to pre-dict the direction or the degree of the residual confounding caused by the misclassification. How- ever, the group-specific analyses indicated that our findings cannot be explained by these 2 variables.
CONCLUSIONSIn this study in Norwegian men and women, we found that weight loss was associated with excess mortality in men in all subgroups of weight-loss attempts, daily smoking, and overweight. In women, the only significant effect of BMI change
observed a significant detrimental effect of weight loss both in men (HR = 1.6; 95% CI, 1.4–1.8) and women (HR = 1.7; 95% CI, 1.5–2.0).16 Mikkelsen et al30 reported an overall adverse effect of weight loss in men and women, but did not present sex-specific results.
Studies of women only have reported results concordant with our findings.10,18,19 It is necessary to distinguish between intentional and uninten-tional weight loss. Unintentional weight loss may reflect disease and is associated with excess mor-tality, while intentional weight loss is assumed to be beneficial, because obesity is associated with increased mortality. Results from different reviews have been inconsistent.20,31 One study indicated that overweight/obese women with no obesity-related illness, who intentionally lost ≥9.1 kg in 1 year, had a 25% reduction in mortality rate.32 We performed analyses in subgroups of patients who reported weight-loss attempts or no attempts. In men, weight loss was associated with increased mortal-ity in both groups. In women, no association was observed in those who reported weight-loss attempts, whereas the impact of weight change on mortality in women who unintentionally lost weight was similar to that observed in men.
In the present study, most subgroup analyses revealed a significant association between BMI change and mortality in men but not in women. However, not all subgroup-specific analyses of interaction between sex and BMI change were sig-nificant. These findings may have been nonsig-nificant because of the relatively small numbers of deaths in women. Furthermore, the tests of in- teraction between BMI change and subgroups in women could also be hampered by low power.
Strengths of the present study include the sam-pling frame, where the entire population of young adults and middle-aged inhabitants were invited to consecutive examinations, the high participa-tion rates, and the standardized measurements of height and weight.
Sources of bias include selection bias, informa-tion bias, and unmeasured confounding. The high participation rate reduced the possibility of selec-tion bias. Only 62 of the included subjects were lost to follow-up due to emigration. However,
585
T. Wilsgaard et al.
women. Risk within the ‘normal’ weight range.
JAMA. 1995;273:461–465.
11. Manson JE, Willett WC, Stampfer MJ, et al. Body
weight and mortality among women. N Engl J Med.
1995;333:677–685.
12. Zhang X, Shu XO, Yang G, et al. Abdominal adipos-
ity and mortality in Chinese women. Arch Intern
Med. 2007;167:886–892.
13. Björntorp P. Obesity and the risk of cardiovascular
disease. Ann Clin Res. 1985;17:3–9.
14. Wannamethee SG, Shaper AG, Walker M. Weight
change, body weight and mortality: The impact of
smoking and ill health. Int J Epidemiol. 2001;30:777–
786.
15. Diaz VA, Mainous AG III, Everett CJ. The associa-
tion between weight fluctuation and mortality:
Results from a population-based cohort study.
J Community Health. 2005;30:153–165.
16. Drøyvold WB, Lund Nilsen TI, Lydersen S, et al, for
the Nord-Trøndelag Health Study. Weight change
and mortality: The Nord-Trøndelag Health Study.
J Intern Med. 2005;257:338–345.
17. Dyer AR, Stamler J, Greenland P. Associations of
weight change and weight variability with cardio-
vascular and all-cause mortality in the Chicago
Western Electric Company Study. Am J Epidemiol.
2000;152:324–333.
18. Elliott AM, Aucott LS, Hannaford PC, Smith WC.
Weight change in adult life and health outcomes.
Obes Res. 2005;13:1784–1792.
19. Maru S, van der Schouw YT, Gimbrère CH, et al.
Body mass index and short-term weight change in
relation to mortality in Dutch women after age
50 y. Am J Clin Nutr. 2004;80:231–236.
20. Poobalan AS, Aucott LS, Smith WC, et al. Long-
term weight loss effects on all cause mortality in
overweight/obese populations. Obes Rev. 2007;8:
503–513.
21. Bønaa KH, Arnesen E. Association between heart
rate and atherogenic blood lipid fractions in a
population. The Tromsø Study. Circulation. 1992;86:
394–405.
22. Bønaa KH, Thelle DS. Association between blood
pressure and serum lipids in a population. The
Tromsø Study. Circulation. 1991;83:1305–1314.
23. Wilsgaard T, Jacobsen BK, Schirmer H, et al.
Tracking of cardiovascular risk factors: The Tromsø
on mortality was observed in those who reported no weight-loss attempts. The observed findings could not be explained by preexisting disease.
ACKNOWLEDGMENTSThe National Health Screening Service helped organize and carry out the surveys. The authors have indicated that they have no conflicts of interest regarding the content of this article.
REFERENCES 1. Diet, nutrition and the prevention of chronic dis-
eases. World Health Organ Tech Rep Ser. 2003;916:1–
149.
2. Seidell JC. Obesity, insulin resistance and diabetes—
a worldwide epidemic. Br J Nutr. 2000;83(Suppl 1):
S5–S8.
3. Ogden CL, Carroll MD, Curtin LR, et al. Prevalence
of overweight and obesity in the United States,
1999–2004. JAMA. 2006;295:1549–1555.
4. Pischon T, Boeing H, Hoffmann K, et al. General
and abdominal adiposity and risk of death in
Europe. N Engl J Med. 2008;359:2105–2120.
5. Flegal KM, Graubard BI, Williamson DF, Gail
MH. Excess deaths associated with underweight,
overweight, and obesity. JAMA. 2005;293:1861–
1867.
6. Bibbins-Domingo K, Coxson P, Pletcher MJ, et al.
Adolescent overweight and future adult coronary
heart disease. N Engl J Med. 2007;357:2371–2379.
7. Rosengren A, Wedel H, Wilhelmsen L. Body weight
and weight gain during adult life in men in rela-
tion to coronary heart disease and mortality. A
prospective population study. Eur Heart J. 1999;20:
269–277.
8. Rimm EB, Stampfer MJ, Giovannucci E, et al. Body
size and fat distribution as predictors of coronary
heart disease among middle-aged and older US
men. Am J Epidemiol. 1995;141:1117–1127.
9. Hubert HB, Feinleib M, McNamara PM, Castelli
WP. Obesity as an independent risk factor for car-
diovascular disease: A 26-year follow-up of partici-
pants in the Framingham Heart Study. Circulation.
1983;67:968–977.
10. Willett WC, Manson JE, Stampfer MJ, et al. Weight,
weight change, and coronary heart disease in
586
Gender Medicine
28. Allison DB, Zannolli R, Faith MS, et al. Weight loss
increases and fat loss decreases all-cause mortality
rate: Results from two independent cohort stud-
ies. Int J Obes Relat Metab Disord. 1999;23:603–611.
29. Heitmann BL, Garby L. Composition (lean and fat
tissue) of weight changes in adult Danes. Am J Clin
Nutr. 2002;75:840–847.
30. Mikkelsen KL, Heitmann BL, Keiding N, Sørensen
TI. Independent effects of stable and changing
body weight on total mortality. Epidemiology.
1999;10:671–678.
31. Fontaine KR, Allison DB. Does intentional weight
loss affect mortality rate? Eat Behav. 2001;2:87–95.
32. Williamson DF, Pamuk E, Thun M, et al. Prospective
study of intentional weight loss and mortality in
never-smoking overweight US white women aged
40–64 years [published correction appears in Am J
Epidemiol. 1995;142:369]. Am J Epidemiol. 1995;141:
1128–1141.
study, 1979–1995. Am J Epidemiol. 2001;154:418–
426.
24. Statistics Norway. Statistical yearbook 2009. Oslo
Kongsvinger, 2009. http://www.ssb.no/english/
yearbook/. Accessed December 7, 2009.
25. Statistics Norway. Causes of death 1995–2006.
http://www.ssb.no/english/subjects/03/01/10/nos_
dodsarsak_en/nos_d412_en/nos_d412_en.pdf.
Accessed November 23, 2009.
26. Cancer Registry of Norway. Cancer in Norway
2007: Cancer incidence, mortality, survival and
prevalence in Norway. http://www.kreftregisteret.
no/Global/Publikasjoner%20og%20rapporter/
CiN2007_hele_web.pdf. Accessed November 23,
2009.
27. Royston P, Altman DG. Regression using fractional
polynomials of continuous covariates: Parsimo-
nious parametric modelling (with Discussion).
Appl Statist. 1994;43:429–467.
Address correspondence to: Tom Wilsgaard, PhD, Institute of Community Medicine, University of Tromsø,
N-9037 Tromsø, Norway. E-mail: [email protected]