week #7 novel pharmaceutical particles · nus presentation title 2001 novel fabrication of...
TRANSCRIPT

Week #7 Novel Pharmaceutical
ParticlesChi-Hwa Wang
Department of Chemical and Biomolecular Engineering, National
University of Singapore, 4 Engineering Drive 4, Singapore, 117576,
Singapore. E-mail: [email protected].

Advanced Drug Delivery Systems
Optimized Strategy for
Cancer Therapy
Computation Simulation and Optimization
Patient Specific
Treatment
Novel Fabrication of
Nano-/Micro-particles

NUS Presentation Title 2001
Novel Fabrication of Pharmaceutical Particles
Electrohydrodynamic atomization applications
Micro- and nanofibers.
Thin films.
Micro- and nanoparticles.
Microencapsulation of living cells, DNA etc.
Paclitaxel
Chemotherapy & radiotherapy for brain tumors.
Penetrates the blood-brain barrier poorly.
Ijsebaert J. C., K. B. Geerse, J. C. M. Marijnissen, J. J. Lammers, P. Zanen. Electro-hydrodynamic atomization of drug
solutions for inhalation purposes, J. Appl. Physiol. (2001) 91: 2735-2741.
Loscertales I. G., A. Barrero, I. Guerrero, R. Cortijo, M. Marquez, A. M. Ganan-Calvo. Micro/nano encapsulation via
electrified coaxial liquid jets, Science (2002) 295: 1695-1698.
Ding L. N., T. Lee, C. H. Wang. Fabrication of monodispersed Taxol-loaded particles using electrohydrodynamic
atomization, J. Control. Rel. (2005) 102(2):.395-413.
Xie J., C.M.M Jan, C.H. Wang. Microparticles developed by electrohydrodynamic atomization for the local delivery of
anticancer drug to treat C6 glioma in vitro. Biomaterials (2006) 27: 3321-3332
Xie J., C.H. Wang, “Electrospun micro- and nanofibers for sustained delivery of paclitaxel to treat C6 glioma in vitro”
Pharmaceutical Research , (2006) 23, 1817-1826.
Xie J., L.K. Lim, Y. Phua, J. Hua, C.H. Wang “Electrohydrodynamic atomization for biodegradable polymeric particle
production” J. Colloid & Interface Sci., 302, 103–112 (2006).

NUS Presentation Title 2001
: the trace of protective Nitrogen;
: solvent with polymer & drugs;
: volatilized solvent;
: collected polymer & drug particles;
Vn : high voltage used to break liquid drops;
Vr : high voltage applied to metal hoop;
Syringe
Using electric field to break liquid drops into fine droplets
Vn
Vr
Vacuum
pump
Filter
Particles
2N
Electro-hydrodynamic Atomization Process

NUS Presentation Title 2001Electrohydrodynamic atomization process
0gV
Electrohydrodynamic atomization is an atomization method based on the application of an electrical stress on the fluid that emerges from the tip of the nozzle. A Taylor cone, which is formed due to the acceleration of the fluid by the applied electrical stress, reduces the diameter of the jet, so that a thin jet is formed at the tip of the Taylor cone. Depending on the solution properties, either discrete particles or strands of fibers can be formed using the same equipment.
0
0
n n g n n
r r g r r
V V V V V
V V V V V

Droplet Size Variation with Different Ring
Electrical Potential (Vr)
0
20
40
60
80
100
120
140
1.5 3.5 5.5 7.5 9.5Vr (kV)
Dro
ple
t S
ize (
mic
ron)
Vn=5kV, 3ml/h
Vn=8kV, 3ml/h
Linear (Vn=5kV, 3ml/h)
Linear (Vn=8kV, 3ml/h)
I: changes in droplet size when Vn is kept at 5kV.
II: changes in droplet size when Vn is kept at 8kV.
II
I
Particle Size Droplet Size Varying VrMass balance Modulation

Taylor Cone, jet and droplet formation process
320 micron
Taylor Cone
Jet
Droplet
Formation
Nozzle Wall
The Front Tracking/Finite Difference CFD simulation wasable to replicate all observable phenomenon of the EHDAprocess, including the Taylor Cone, Jet and the dropletformation process.Since the electrical charge resides on the surface of theliquid, the electrical field accelerates the surface of theliquid, and results in the formation of the circulating fluidinside the Taylor cone.
Fluid: Dichloromethane; Flowrate: 6ml/h; Vn=8kV, Vr=8.9kV
Nozzle inner radius: 110 micron; Nozzle outer radius: 170 micron
Nozzle to Ring: 10mm; Nozzle to Ground: 100mm; Ring Diameter: 40mm

Taylor Cone, jet and droplet formation process
Nozzle Diameter ~ 340micron Droplet Diameter ~ 50micron
A: Eggers, J. Fluid. Mech., 262, 205, 1994;
B: CFD simulation results;
C: Chaudhary, J. Fluid. Mech., 96, 275, 1980
A B CA transient CFD simulation was done, so that the formation of the Taylor Cone, jet and droplet was captured with time. Droplet formation was also simulated and the simulated droplet size can be obtained directly from the simulation data.
Fluid: Dichloromethane; Flowrate: 6ml/h; Vn=8kV, Vr=8.9kV
Nozzle inner radius: 110 micron; Nozzle outer radius: 170 micron
Nozzle to Ring: 10mm; Nozzle to Ground: 100mm;
Ring Diameter: 40mm

Closer look of Taylor Cone formation
CFD simulation Experimental
Fluid flow field
Fluid: Dichloromethane; Flowrate: 6ml/h; Vn=8kV, Vr=8.9kV
Nozzle inner radius: 110 micron; Nozzle outer radius: 170 micron
Nozzle to Ring: 10mm; Nozzle to Ground: 100mm;
Ring Diameter: 40mm
The Taylor Cone is an important phenomenon in the EHDA process, enabling the formation of thin jet that is at least one order of magnitude smaller than the inner diameter of the nozzle, resulting in droplets that is smaller than the inner diameter of the nozzle. The Taylor cone angle is also a useful parameter for comparison between the experimental and the simulation results.

NUS Presentation Title 2001
Taylor cone
Jet
Charged droplets
J. Xie, J. C. M. Marijnissen, C. H. Wang. Biomaterials. 27: 3321-3332 (2006).
J. Xie, L. K. Lim, Y. Y. Phua, J. Hua, C. H. Wang. Journal of Colloids and Interface Science. 302, 103–112 (2006).
Electrohydrodynamic Atomization
NUS Presentation Title 2001
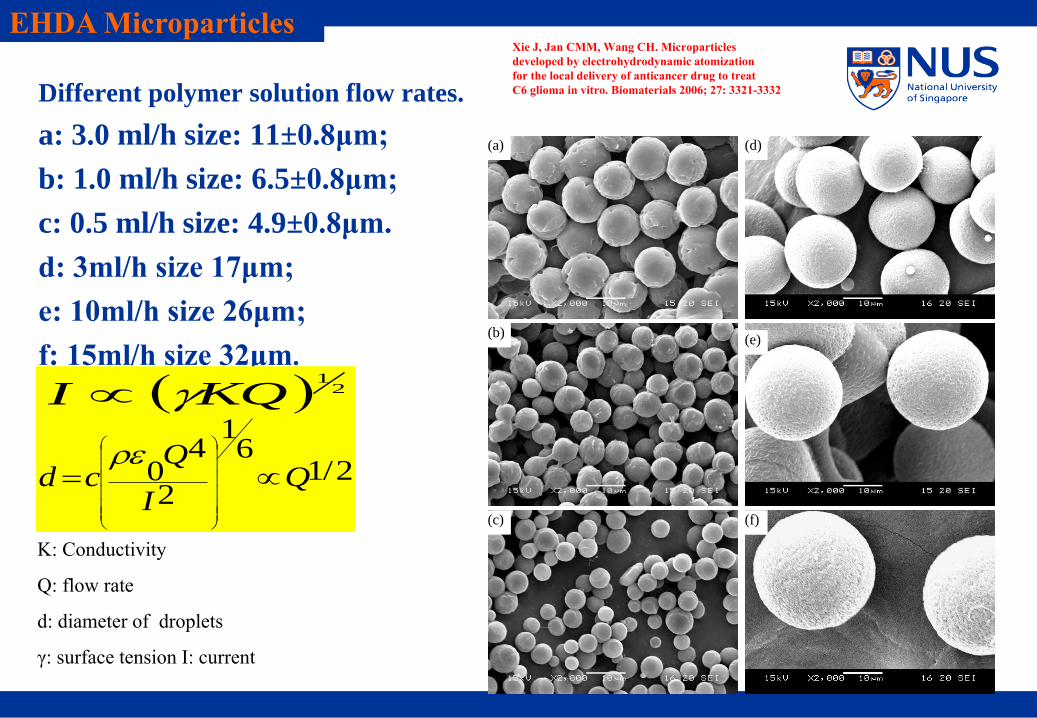
Different polymer solution flow rates.
a: 3.0 ml/h size: 11±0.8μm;
b: 1.0 ml/h size: 6.5±0.8μm;
c: 0.5 ml/h size: 4.9±0.8μm.
d: 3ml/h size 17μm;
e: 10ml/h size 26μm;
f: 15ml/h size 32μm.
(a)
(b)
(c)
(d)
(e)
(f)
2/16
1
2
40 QI
Qcd
21
KQI
EHDA Microparticles
K: Conductivity
Q: flow rate
d: diameter of droplets
γ: surface tension I: current
Xie J, Jan CMM, Wang CH. Microparticles
developed by electrohydrodynamic atomization
for the local delivery of anticancer drug to treat
C6 glioma in vitro. Biomaterials 2006; 27: 3321-3332

NUS Presentation Title 2001
c d
e f
a b
g
SEM images microparticles (a, b:
S1; c, d: S2; e, f: S3; g, h: S4)
Operating Polymer Polymer Polymer solution Air flow The voltage The voltage Nozzle
parameters concentration flow rate rate of nozzle of ring size
Samples
S1 PCL 6% 3ml/h 25L/min 9.8kV 7.1kV 0.91mm
S2 PLGA 8% 5ml/h 25L/min 10.0kV 9.0kV 0.91mm
S3 PLGA 8% 5ml/h 25L/min 10.0kV 9.0kV 0.91mm
S4 PLGA 8% 5ml/h 25L/min 10.0kV 9.0kV 0.91mm
Variation of operating parameters results
in controllable size and morphology of
microparticles.
EHDA Microparticles
h
Xie J, Jan CMM, Wang CH. Microparticles
developed by electrohydrodynamic atomization
for the local delivery of anticancer drug to treat
C6 glioma in vitro. Biomaterials 2006; 27: 3321-3332.

NUS Presentation Title 2001
Characterization for samples S1 – S5.
Samples Drug loading (%) Encapsulation Efficiency (%) Particle size (μm) ± SD
S1 8.1 81.3 11.4 ± 0.9
S2 7.9 82.3 15.2 ± 1.7
S3 8.4 84.1 14.2 ± 2.2
S4 15.8 78.1 15.1 ± 0.7
S5 0 - 12.6 ± 0.8
S1 - Paclitaxel-loaded PCL microspheres
S2 - Paclitaxel-loaded PLGA microspheres
S3 - Paclitaxel-loaded PLGA particles of biconcave shape
S4 – Paclitaxel-loaded PLGA microspheres
S5 – Blank PLGA microspheres
EHDA Microparticles
Xie J, Jan CMM, Wang CH. Microparticles developed by electrohydrodynamic
atomization for the local delivery of anticancer drug to treat C6 glioma in vitro.
Biomaterials 2006; 27: 3321-3332.

NUS Presentation Title 2001
In vitro release
0
10
20
30
40
50
60
70
80
0 5 10 15 20 25 30 35
Time (day)
Cu
mu
lati
ve r
elea
se (
%)
S1
S2
S3
S4
S1: 10% PCL Microspheres
S2: 10% PLGA Microspheres
S3: 10% PLGA Biconcave
S4: 20% PLGA Microspheres
EHDA Microparticles
Paclitaxel-loaded PLGA microparticles could release faster than
paclitaxel-loaded PCL microparticles. Biconcave-shaped PLGA
microparticles may release slightly faster than PLGA microspheres.
20% paclitaxel-loaded PLGA microparticles could release slightly
faster than 10% paclitaxel-loaded samples. The total amount of
paclitaxel released seemed to be less than 60% of the total amount
of drug in the microparticles.
Initial burst due to dissolution and diffusion
of paclitaxel on the surface layer of the
microspheres proved by XPS results.
Xie J, Jan CMM, Wang CH. Microparticles developed
by electrohydrodynamic atomization for the local
delivery of anticancer drug to treat C6 glioma in vitro.
Biomaterials 2006; 27: 3321-3332.

NUS Presentation Title 2001(a)
(b)
(c)
(d)
(e)
(f)
(g)
(h)
(i)
Representative optical images of C6 glioma cells after being treated by paclitaxel-loaded PLGA microparticles
( 50μm). a, b, c: 250μg/ml 1, 2, 5 day; d, e, f: 1250μg/ml 1, 2, 5day; g, h, i: 2000μg/ml 1, 2, 5 day.
EHDA Microparticles
Optical microscope

NUS Presentation Title 2001
Cell viability
0%
20%
40%
60%
80%
100%
120%
0 20 40 60 80 100 120 140 160
Taxol concentration
Cell
via
bil
ity (
%)
1day
2days
3days
4days
5days
0%
20%
40%
60%
80%
100%
120%
0 250 500 750 1000 1250 1500 1750 2000 2250 2500 2750
Paclitaxel-loaded PLGA microparticle concentration
Cell
via
bil
ity (
%)
1day
2days
3days
4days
5days
EHDA Microparticles
The values of IC50 for Taxol and paclitaxel-loaded microspheres after 5days are around
14μg/ml and 160μg/ml, respectively. (Actual amount of paclitaxel: 160×10%*0.8=12.8
μg/ml). IC50 (inhibitory concentration 50%) represents the concentration of a drug that is required for 50% inhibition in vitro.
(μg/ml) (μg/ml)
Xie J, Jan CMM, Wang CH. Microparticles developed by electrohydrodynamic
atomization for the local delivery of anticancer drug to treat C6 glioma in vitro.
Biomaterials 2006; 27: 3321-3332.

NUS Presentation Title 2001
Electrospinning
Taylor cone
Jet
Fibers
Representative image of electrospinning jet
with the exposure time of 10ms.Schematic of electrospinning setup

NUS Presentation Title 2001
0mM 1mM 5mM
0mM 10mM 15mM
0mM 1mM 5mM
1mM 5mM 15mM
15%
10%
2%
110±16nm 100±14nm
82±11nm
45±7nm 31±5nm
Tetrabutylammonium
tetraphenylborate
(TATPB)
Ionic surfactant
Increasing conductivity
Polymer
concentration
5%

NUS Presentation Title 2001
SEM images of paclitaxel-loaded PLGA Fibers
before release
Electrospun Micro- and Nano-fibers
10% paclitaxel-loaded
PLGA microfiber
10% paclitaxel-loaded
PLGA nanofiber
Diameter: 14.5mm
Thickness: 1mm
http://www.drugs.com/PDR/Gliadel_Wafer.html
Samples Fibers mean diameter Drug loading (%) Encapsulation efficiency (%)
PLGA MF (s1) 2.5±0.32 µm 9.9±0.1 99.0±1.0
PLGA NF (s2) 770±13 nm 9.2±0.03 92.0±0.3
Characterization of paclitaxel-loaded fibers
Cross section
NUS Presentation Title 2001
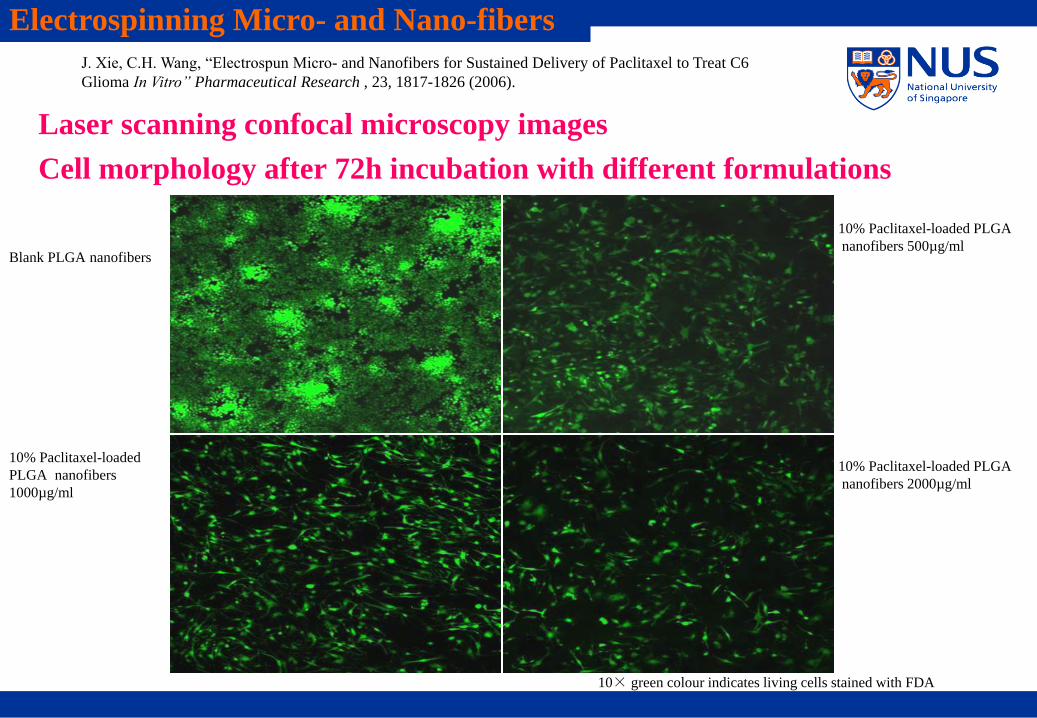
Results and discussion
Laser scanning confocal microscopy images
Cell morphology after 72h incubation with different formulations
Blank PLGA nanofibers
10% Paclitaxel-loaded PLGA
nanofibers 500µg/ml
10% Paclitaxel-loaded
PLGA nanofibers
1000µg/ml
10% Paclitaxel-loaded PLGA
nanofibers 2000µg/ml
10× green colour indicates living cells stained with FDA
Electrospinning Micro- and Nano-fibers
J. Xie, C.H. Wang, “Electrospun Micro- and Nanofibers for Sustained Delivery of Paclitaxel to Treat C6
Glioma In Vitro” Pharmaceutical Research , 23, 1817-1826 (2006).

NUS Presentation Title 2001
Cell viability after 72h incubation with different formulations.
0
20
40
60
80
100
120
Control Blank PLGA NF PLGA NF 500 PLGA NF 1000 PLGA NF 2000
Different formulations
Cel
l v
iab
ilit
y (
%)
PLGA NF500: 500µg/ml; PLGA NF 1000: 1000µg/ml; PLGA NF 2000: 2000µg/ml.
Results and discussion
The IC50 value of paclitaxel-loaded PLGA
nanofibers was around 1200µg/well.
IC50 of paclitaxel of this formulation was
about 36µg/ml, which was comparable to
the commercial paclitaxel formulation
Taxol® (30µg/ml).
Electrospinning Micro- and Nano-fibers
J. Xie, C.H. Wang, “Electrospun Micro- and Nanofibers for Sustained Delivery of Paclitaxel to Treat C6
Glioma In Vitro” Pharmaceutical Research , 23, 1817-1826 (2006).

NUS Presentation Title 2001
In-Vovo Experiment Overview: Tumor Volume Response
Subcutaneous
Inoculation with
1x 10⁶ C6
giloma cells
After period of tumor growth,
Microparticles, Discs or
Microspheres are implanted
Disc (Surgical Implantation)
Microspheres (Surgical Implantation)
Microparticles
(Intra-tumor injection)
Balb/c Nude mice
2
6
1_ abVolTumor
b
a

Representative pictures of tumours after 21days of C6 glioma cells implantation
Blank
Microspheres
Taxol®
10% Taxol
loading EHDA
Microparticles
20% Taxol
loading EHDA
Microparticles
In-Vovo Experiment Overview: Tumor Volume Response

NUS Presentation Title 2001
Tumor volume response: Paclitaxel EHDA Microparticles
0
10
20
30
40
50
60
70
0 5 10 15 20 25 30 35 40
Time (day)
Cum
ulat
ive
rele
ase
(%)
10% PLGA EHDA Microparticles
20% PLGA EHDA Microparticles
EHDA Microparticles in
vitro release profile
Tumor was allowed to grow for a period of 14
days before 1st injection of microparticles and
commercial taxol (for control were administered)
directly into the tumor mass.
20% Taxol Loading group had 1 mg taxol
administered in two doses of 0.5 mg as injection
directly into the tumor on Day 14 & 21.
Significant tumor growth suppression for at least
7 days after first injection (30 % in vitro release
reached).
Tumor volume is among lowest of treatment (see
next slide).
No significant variation of animal weight from
controls were observed. Indicating minimal or no
systemic toxicity effects.
0
1000
2000
3000
4000
5000
6000
0 5 10 15 20 25 30 35 40Time (days)
Tu
mo
re v
olu
me (
mm
3)
Blank Microparticles
Commercial Taxol - 1 mg Taxol
Microparticle 20% Taxol Loading - 1 mg Taxol

NUS Presentation Title 2001
Weight loss observed in control group
over first seven days.
No weight loss observed for EHDA
group.
Control group showed Paclitaxel
cleared from Plasma after 10 days.
Sustained delivery observed for
Experimental group for up to 28 days.
In vivo release profile of EHDA microparticles
In vivo release profile for 14.8% Drug Loaded EHDA Microparticles
0.00
0.50
1.00
1.50
2.00
2.50
3.00
3.50
2 7 10 14 17 21 28
Days after Implantation
ng
Paclita
xel/ m
l P
lasm
a
EHDA Microparticles
Control
23.6 ± 6.5 ng/ml
EHDA microparticles
Control
Days after implantation
14% drug loaded EHDA microparticles
In-Vovo Experiment Overview: Tumor Volume Response

The research efforts of this project are to
develop various biomedical devices for
applications in controlled release of
bioactive materials using
electrohydrodynamic atomization
techniques. Through investigation of the
processing parameters during the EHDA
process, controllable size and
morphology of particles, controllable
diameters of fibers and controllable
thicknesses of films were successfully
achieved.
Electrohydrodynamic atomization (EHDA) is a process, also called electrospray, where a
liquid jet breaks up into fine droplets under the influence of electrical forces. With increasing
electric forces, different spray modes can be obtained from dripping mode, single cone-jet
mode to multiple-cone mode. After the solvent evaporates, polymeric particles can be obtained.
Electrospinning of liquids involves the introduction of electrostatic charges to a stream of
polymeric fluid in the presence of strong electric field. After the fluid evaporates, fibers can be
formed.
Typical biomedical devices including gel microbeads, microparticles, films and
fibers.
Representative optical images of C6 glioma cells after
being treated by different concentrations of
paclitaxel-loaded PLGA microparticles
Typical jet of electrospray and electrospinning
Tumor volume variation with time
Biomedical Devices Developed by Electrohydrodynamic Atomization (EHDA) Technique
Particle Fabrication Techniques for Pharmaceutical Applications

Singapore-MIT Alliance
Nanoparticle fabrication of biodegradable polymers using supercritical antisolvent: Effects of mixing and thermodynamic properties

Nanoparticle fabricationMethods of Fabrication
Emulsion methods (O/W; W1/O/W2)
Electrohydrodynamic atomization (EHDA)(Micro and nanopartices)
Dialysis (nanoparticles)
Spray drying (Microparticles)
Supercritical fluid techniques
(Micro and nanoparticles)
RESS Rapid Expansion of Supercritical Solutions(Debenedetti et al. (1993) Fluid Phase Equilibria 82, 311-321)
ASES Aerosol Solvent Extraction System(Bleich et al. (1993) Int. J. Pharma., 97, 111-117)
SEDS Solution Enhanced Dispersion by Supercritical
Fluids(Ghaderi et al. (1999) Pharma. Res., 16(5), 676 – 681)
SAS Supercritical AntiSolvent(Reverchon et al. (2003) Ind. Eng, Chem. Res., 42, 6405 – 6414)
SASEM Supercritical Antisolvent with Enhanced Mass
Transfer(Chattopadhyay et al. (2002) Ind Eng Chem Res., 41, 6049 – 6058)
Advantages of CO2
•“green” solvent, environmentally benign•Readily available and inexpensive
•Low critical pressure and temperatures

Supercritical antisolventMost organic solvents are soluble in supercritical CO2
Low critical temperature (31.1 deg C)
Suitable for processing thermally labile pharmaceuticals
Removal of organic solvent from productOrganic
solvent
Polymer Drug
Capillary nozzle
Small orifice
Coaxial nozzles
Assisted jet breakup
Enhanced mixing
Ultrasonic nozzles
Uniform atomization
Enhanced mass transfer in vessel

Hydrodynamics and thermodynamics
Both hydrodynamics and thermodynamics play a role in influencing the Supercritical antisolvent process for polymer particle formation
Diego and coworkers (2005) identified the two regimes of particle formation for precipitation of polymers in the PCA process
Below mixture critical pressure, the solution droplets were obtained and mass transfer takes place between the solution droplets and CO2
Initial size of droplets influences the particle size
Above mixture critical pressure, solution enters the supercritical CO2 as a gaseous plume
Turbulent mixing of solution and CO2
Mass transfer and mixing influence the particle size
Fibers or discrete particle may be obtained
Diego et al. (2005) Operating regimes and mechanism of particle formation during the precipitation of polymers using the PCA process. J. Supercritical fluids, 35, 147 - 156

HydrodynamicsCarretier and coworkers (2003) investigated the hydrodynamics of the SAS process for precipitation of PLA particles from methylene chloride (DCM) solutionJet formation and breakup at supercritical pressures
Varying liquid flow rates (0.25 – 3 ml/min)Jet breakup length dependent on the spray Reynolds numberFibers or microparticles were obtained depending on liquid flow rates
Chattopadhyay and Gupta (2001) developed the supercritical antisolvent with enhanced mass transfer (SASEM) for production of uniform sized nanoparticles
Ultrasonic assisted atomization of jetEnhanced mass transfer between organic solution and supercritical CO2 phases
E. Carretier et al. (2003) Hydrodynamics of Supercritical Antisolvent Precipitation: Characterization and influence on particle morphology. Ind. Eng, Chem, Res, 42, 331 – 338
P. Chattopadhyay and R. B. Gupta, Production of griseofulvin nanoparticles using supercritical CO2 antisolvent with enhanced mass transfer. Int. J. Pharma. 228 (2001) 19 – 31

ObjectivesFabrication of nanoparticles of biodegradable polymers
Controlled release purposesModel drug: Paclitaxel (hydrophobic)Polymer studied: Poly L lactide (PLA)Organic solvent used: Methylene chloride (DCM)
1. Effect of thermodynamic conditions on particle propertiesConstant operating temperature
35 deg C
Varying operating pressure73.8 bar – 95 bar
2. Effect of hydrodynamicsJet formation in supercritical fluid
Jet flow rate
3. Effect of mixing on particle formationSupercritical antisolvent (SAS) processUltrasonication for mixing with the high pressure vessel

SAS setup
P1
P2 TC
PI
V2
V1
V3F2
F1
C2
CO2
C1

Modified SASEM setup
U1
P1
P2 TC
PI
V2
V1
V3F2
F1
C2
CO2
C1
U1: Ultrasonic system; Branson sonifier and converter,Sonics and Materials probe (3/8” probe tip diameter)

Particle fabrication1. Pressurization (CO2)
High pressure pump was used to deliver liquefied CO2 to high pressure vesselTemperature in high pressure vessel was maintained using circulating water bath
2. Spraying (Organic solution jet)High pressure liquid pump was used to deliver organic solution (Solvent + pharmaceutical) into the high pressure vessel via a capillary nozzle
Vertical jet (SAS)Horizontal jet (modified SASEM with ultrasonication)
Flowrate may be controlled by HPLC pump
3. VentingOrganic solvent – CO2 mixture was vented off to a fume cupboard from the bottom of the vesselFilter frit (0.22mm) was placed at bottom of the vessel to collect particles
4. PurgingVessel was purged using fresh CO2 to remove any remaining organic solvent

SAS setupJet breakup after
entering high pressure CO2
Jet breakup length is dependent on spray Reynolds
number
No external mixing in the high pressure
vessel during precipitation
Flow rate = 4ml/minReynolds number = 292

Effect of varying pressureExperimental conditions
Solution flow rate was kept constant at 4ml/min
System temperature was maintained at 35 deg C
2% polymer loading in DCM
Pressure varied from 73.8 to 95 bars
73.8 bars 80 bars
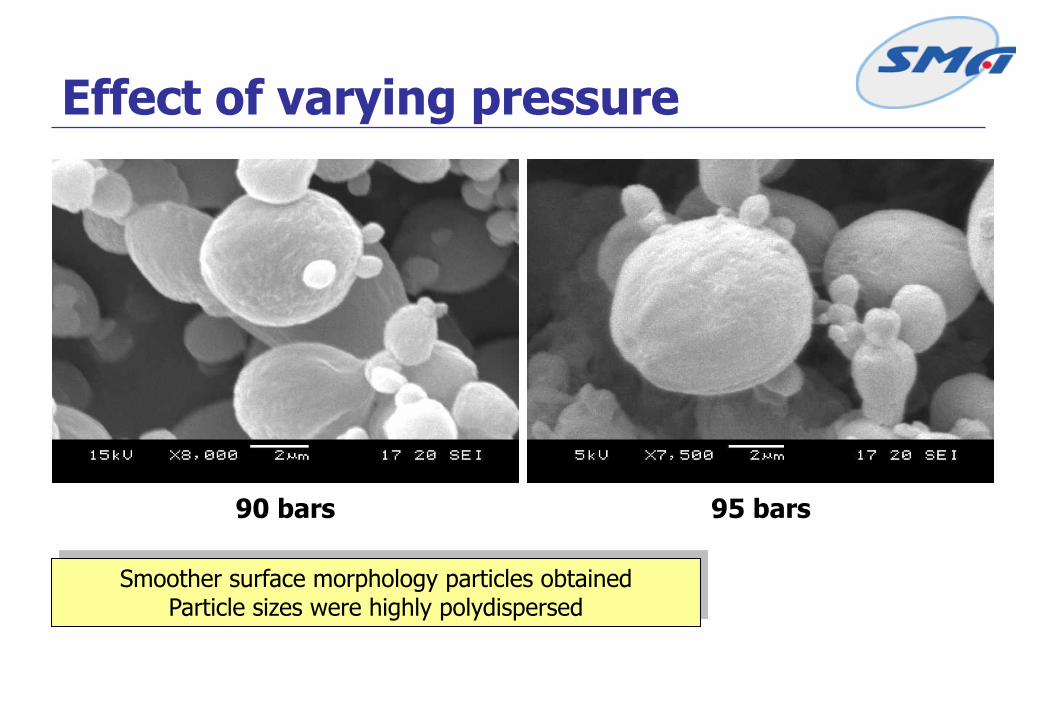
Effect of varying pressure
90 bars 95 bars
Smoother surface morphology particles obtainedParticle sizes were highly polydispersed

Effect of varying pressure
Results obtainedParticle sizes of 5 – 10 mm were obtainedAt 73.8 bars, particles obtained were agglomerated and surfaces were very roughAt 80 bars and above, spherical particles with little agglomeration were achievedAs supercritical pressure increases, particle morphology improves
For particles obtained at 90 and 95 bars, smooth surface morphology were obtained
This suggests that as pressure increases, better mass transfer between CO2 and DCM during the spraying process
More rapid precipitationLess agglomeration

Effect of varying solution flowrateTemperature: 35 deg CPressure: 90 bars2% polymer loading in DCMSolution flowrate of 2, 4, 6 ml/min
2 ml/min
4 ml/min
6 ml/min

Effect of varying solution flowrate
Mean Size: 3.03 mmSD: 2.25 mm
Mean Size: 2.05 mmSD: 1.21 mm
0
2
4
6
8
10
12
14
16
18
0.6 1.2 1.8 2.4 3 3.6 4.2 4.8 5.4 6 6.6 7.2 7.8 8.4 9 9.6
Particle size (mm)
Coun
t int
ensi
ty (%
)
6ml/min
0
2
4
6
8
10
12
0.6 1.2 1.8 2.4 3 3.6 4.2 4.8 5.4 6 6.6 7.2 7.8 8.4 9 9.6
Particle size (mm)
Coun
t int
ensit
y (%
)4ml/min

Effect of varying flowrate
Results obtainedAt 90 bar and 35 deg C, powdery particles with little/no agglomeration were obtained
Particles obtained have similar surface morphologies
Polydispersed particlesClusters of small particles (< 2 mm)
Larger particles (2-10 mm)
Higher liquid flowrate generally decreases the particle size for the larger particles
Shorter jet breakup length
Better mass transfer between the organic solvent and supercritical CO2

Modified SASEM setup
Jet breakup is not due to liquid film
disintegration from ultrasonic vibrating
surface
Jet break up Turbulence and mixing
Enhanced turbulence and
mixing of jet in the high pressure cell due to ultrasonic
vibration

Effect of ultrasonicationComparison of SAS (No external mixing) and modified SASEM
10w/w% paclitaxel loaded PLA particles
2% polymer loading in DCM
No ultrasonication
Polydispersed particles obtained
Mean Size: 4.13 mmSD: 1.98 mm

Effect of ultrasonication
Particles obtained with ultrasonication
30 mm vibration amplitude 10% of maximum vibration
60 mm vibration amplitude 20% of maximum vibration

Effect of ultrasonication
Particles obtained with ultrasonication
90 mm vibration amplitude 30% of maximum vibration
120 mm vibration amplitude 40% of maximum vibration

Particle propertiesParticle size and size distribution tends to decrease as vibration amplitude increases
Recovery yield was comparable to conventional spray drying methods
Differential scanning calorimetry was performed to determine the crystalline state of particles fabricated using the SAS/ modified SASEM setup
Encapsulation efficiency and in vitro release profile of the particles were determined
EE% of as high as 80% were obtained
0
10
20
30
40
50
60
70
80
90
0 30 60 90 120
Ultrasonic vibration amplitude (micron)
(%)
Recovery yield (%)
Encapsulatution efficiency (%)
0
500
1000
1500
2000
2500
3000
3500
4000
4500
5000
0 30 60 90 120
Ultrasonic vibration amplitude (micron)
Part
icle
siz
e (
nm
)

Differential scanning calorimetry analysis
Thermogram analysis is an useful tool to determine whether paclitaxel is molecularly dispersed in the polymer matrix or phase separated as paclitaxel crystals
DSC analysisTemperature range = 20 – 280 deg CTemperature ramp speed = 10 deg C/minNitrogen flow rate = 5ml/min
Literature valuesPure paclitaxel
Endothermic peak @ 223.0 deg C
PLLAMelting point @ 172-178 deg C

Thermogram properties
-20
-15
-10
-5
0
5
10
15
20
0 50 100 150 200 250 300
Temperature (oC)
Ex
oth
erm
(m
W)
Raw paclitaxel
raw PLA (before SAS process)
Paclitaxel loaded PLA withultrasonication
Blank PLA with ultrasonication

In vitro release profiles
0
10
20
30
40
50
60
0 5 10 15 20 25 30 35 40
Release time (days)
Cu
mu
lati
ve
re
lea
se (
%)
S1
S2
S3
Particles suspended in phosphate buffered saline (PBS)
Placed in shaker bath (120 rpm, 37 deg C)
Removed at predetermined time intervalsSolution was centrifuged and buffer solution was removed
Fresh PBS was added
Paclitaxel content in PBS was extracted and analysed using HPLC
Paclitaxel loaded PLA samples obtained using modified SASEM process
Sample
Ultrasonic
vibration
amplitude (mm)
Recovery
Yield (%)
Encapsulation
efficiency (%) Size (nm)
S1 0 21.1 70.0 ±3.5 4130 ± 198
S2 30 18.1 67.7 ± 1.4 769 ± 210
S3 60 14.6 56.4 ± 14.4 506 ± 163
S4 90 12.8 83.5 ± 0.8 486 ± 134

ConclusionsWe have successfully fabricated micro and nanoparticles of PLA for potential application in controlled release purposesThe effect of thermodynamic properties and hydrodynamics on particle formation was investigated in SAS process
Varying the operating pressure from 73.8 bar (critical pressure) to 95 bar significantly alters the surface morphology of microparticles obtained Increasing liquid flowrate reduces particle size and size distribution
The effect of ultrasonic vibration amplitude on particle size and properties was investigated
Nanoparticles were obtained using the modified SASEM setupParticle size may be altered by applying different ultrasonic vibration amplitude

The research efforts of our group are to develop controlled-release drug delivery devices using supercritical fluid techniques for
chemotherapy to treat brain and liver cancers. Through investigation of the operating parameters of the SAS and Foaming process,
controllable particle size with anticancer drug encapsulation and foams with tailored pore size have been achieved respectively. As
such, the drug release profile may be modulated.
60 bars 70 bars 80 bars
0
10
20
30
40
50
60
70
80
0 5 10 15 20 25 30 35
Time (days)
Cum
ulat
ive
rele
ase
(%)
S3A
S5A
S1A
SEM images of different morphology particles
obtained using SAS technique
Phase diagram for carbon dioxide
In vitro release of paclitaxel from PLA microparticlesInvestigation of Various flow regimes of
organic solution entering supercritical CO2
PLGA foams with different mean pore sizes
achieved using Supercritical gas foaming technique
Contact:
Prof. Wang, Chi-Hwa
Tel: 6516-5079
E-mail: [email protected]
A supercritical fluid is any substance at a temperature and pressure above its thermodynamic
critical point. Supercritical fluids offer favourable gas-like transport properties and liquid-like
solubility. Supercritical CO2 is used to fabricate biodegradable polymeric controlled release
devices using Poly L lactide (PLA) and Poly DL lactide-co-glycolide (PLGA). CO2 was chosen
as it has accessible critical temperature (31.1 deg C) and pressure (73.8 Bars), tunable properties
near the critical region, is inexpensive, non-flammable, and generally environmentally benign.
The supercritical fluid fabrication techniques employed in our research group include
fabrication of microparticles using supercritical antisolvent (SAS) process, and the fabrication of
micro-porous polymeric foams using supercritical gas foaming technique. In the supercritical
antisolvent process, the jet disintegration process at near critical conditions was investigated. In
vitro release profiles and other properties of the controlled release devices were also
characterized.
Drug Delivery Devices Developed by Supercritical Fluid Technique