webinar presentation: neiman marcus group ltd …€¦ · webinar presentation: neiman marcus group...
TRANSCRIPT
Webinar Presentation:
NEIMAN MARCUS GROUP LTD INC.
Robert C. Pike, Senior Industry Analyst May 13, 2014
CONFIDENTIAL
NEIMAN MARCUS Today’s Agenda
1. Economic Overview
2. Company Profile & 2Q14 Summary
3. Financial History
4. Key Developments & Dates in History
5. Strategic Initiatives
6. Issues, Observations & Conclusions
7. Q&A
CONFIDENTIAL May 13, 2014 2
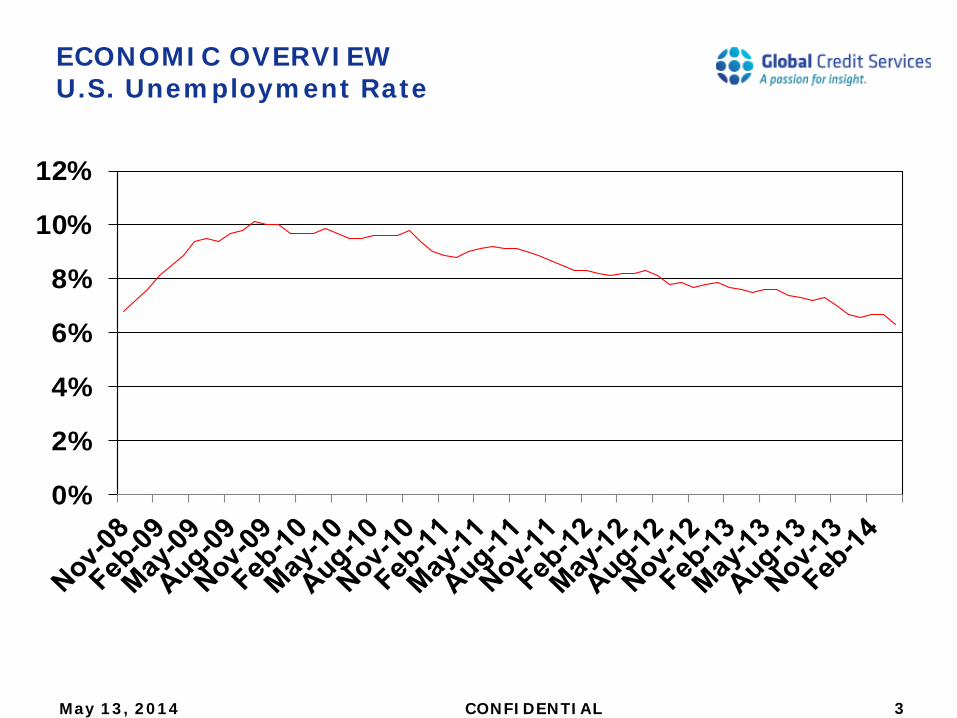
ECONOMIC OVERVIEW U.S. Unemployment Rate
May 13, 2014 CONFIDENTIAL 3
0%
2%
4%
6%
8%
10%
12%
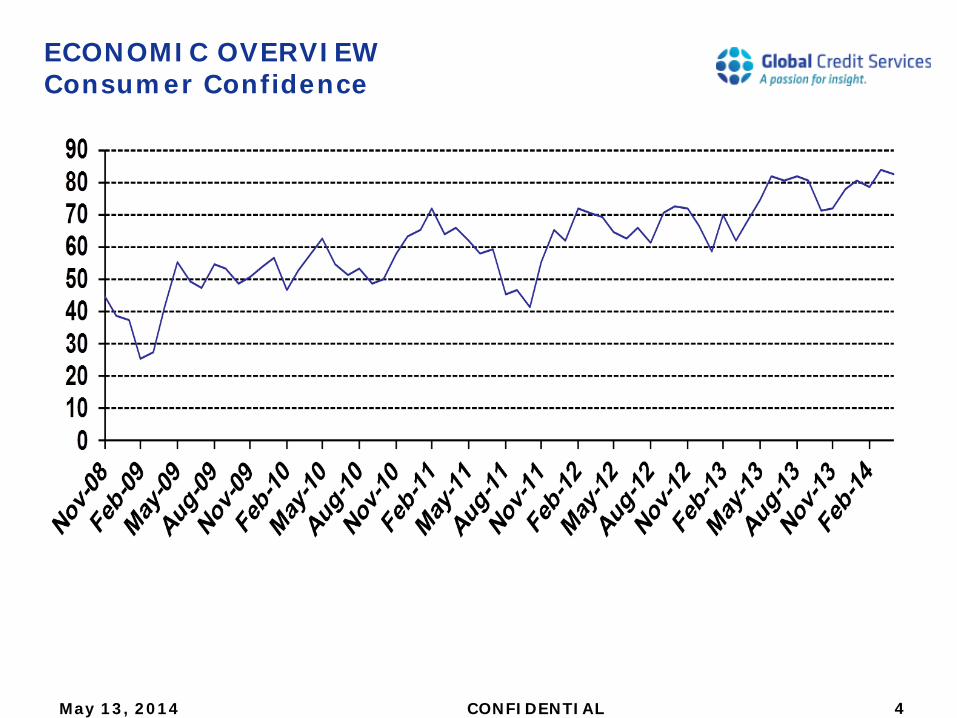
ECONOMIC OVERVIEW Consumer Confidence
May 13, 2014 CONFIDENTIAL 4
NEIMAN MARCUS Profile
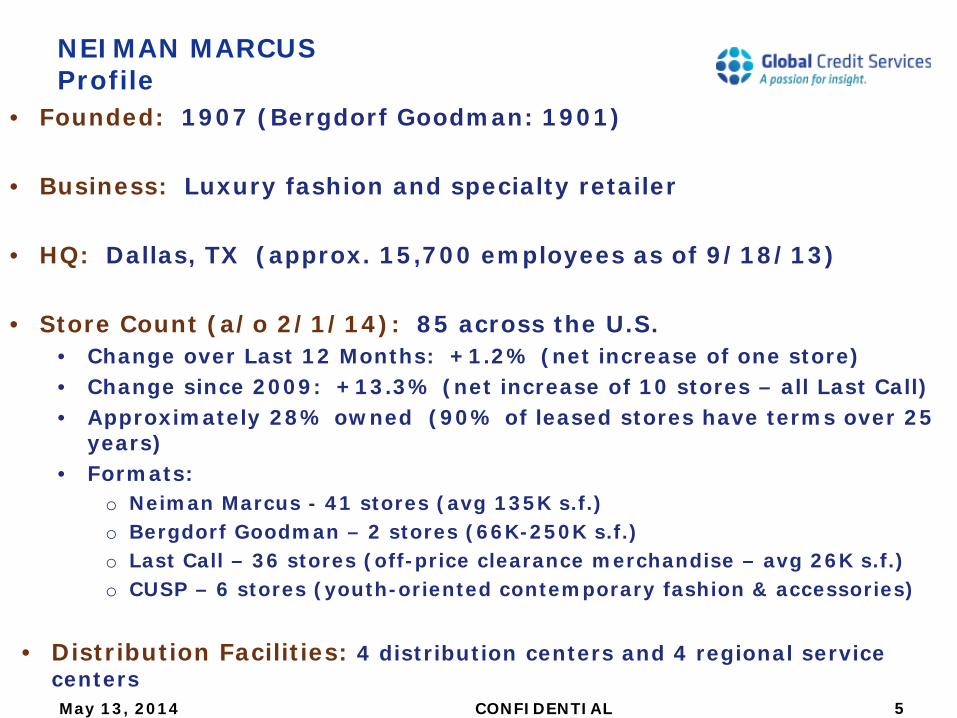
• Founded: 1907 (Bergdorf Goodman: 1901) • Business: Luxury fashion and specialty retailer
• HQ: Dallas, TX (approx. 15,700 employees as of 9/18/13)
• Store Count (a/o 2/1/14): 85 across the U.S.
• Change over Last 12 Months: +1.2% (net increase of one store) • Change since 2009: +13.3% (net increase of 10 stores – all Last Call) • Approximately 28% owned (90% of leased stores have terms over 25
years) • Formats:
o Neiman Marcus - 41 stores (avg 135K s.f.) o Bergdorf Goodman – 2 stores (66K-250K s.f.) o Last Call – 36 stores (off-price clearance merchandise – avg 26K s.f.) o CUSP – 6 stores (youth-oriented contemporary fashion & accessories)
• Distribution Facilities: 4 distribution centers and 4 regional service
centers May 13, 2014 CONFIDENTIAL 5
NEIMAN MARCUS Profile
BUSINESS SEGMENTS
May 7, 2013 CONFIDENTIAL 6
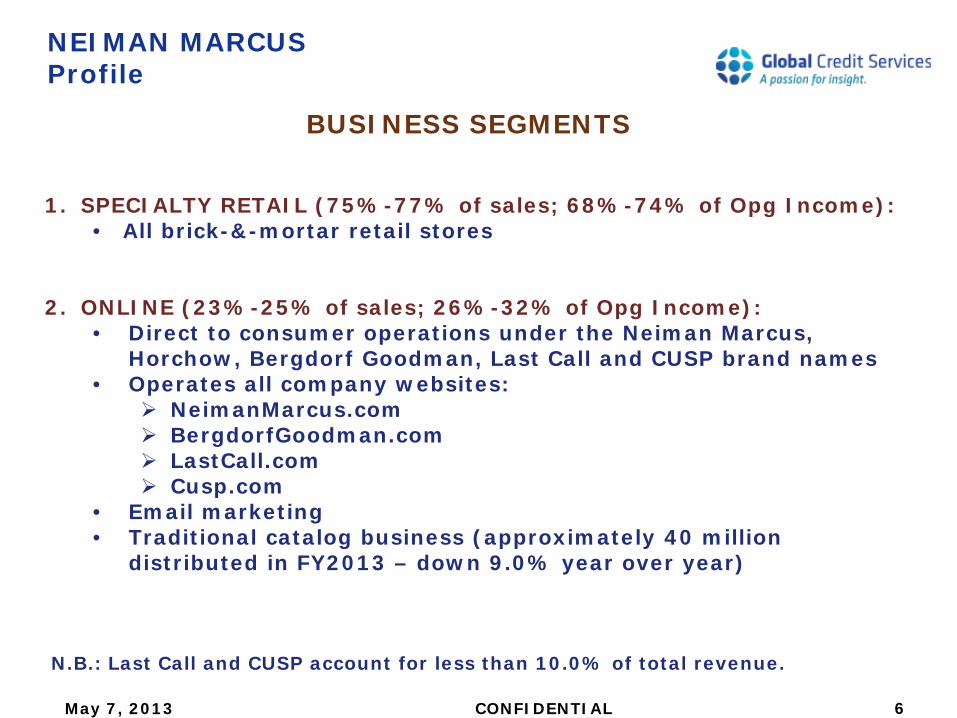
1. SPECIALTY RETAIL (75%-77% of sales; 68%-74% of Opg Income):
• All brick-&-mortar retail stores
2. ONLINE (23%-25% of sales; 26%-32% of Opg Income): • Direct to consumer operations under the Neiman Marcus,
Horchow, Bergdorf Goodman, Last Call and CUSP brand names • Operates all company websites:
NeimanMarcus.com BergdorfGoodman.com LastCall.com Cusp.com
• Email marketing • Traditional catalog business (approximately 40 million
distributed in FY2013 – down 9.0% year over year)
N.B.: Last Call and CUSP account for less than 10.0% of total revenue.
NEIMAN MARCUS Profile, con’t.
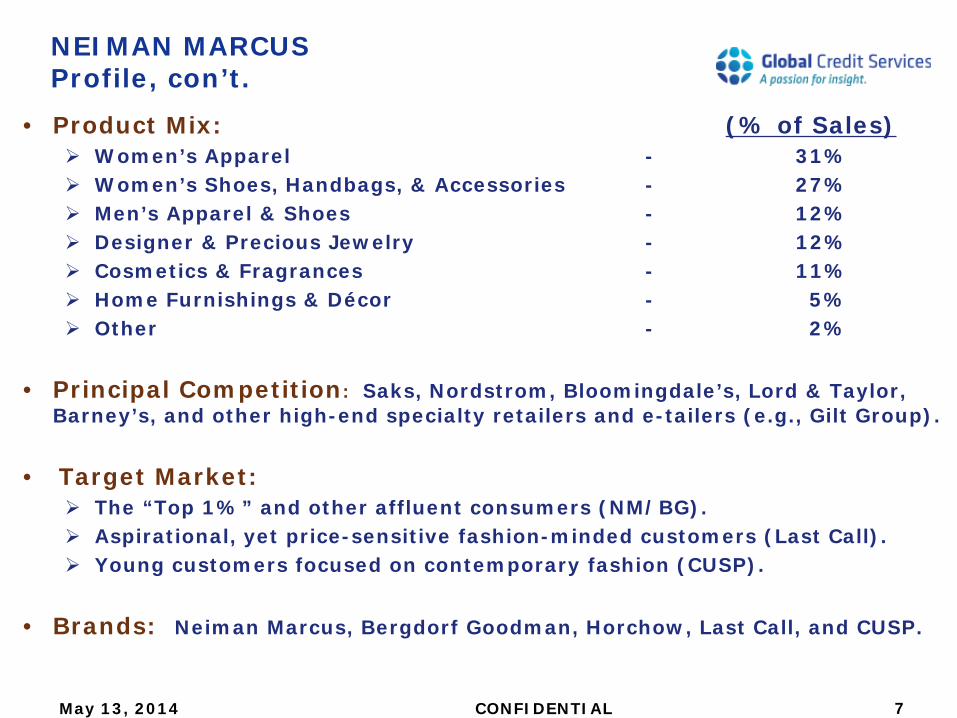
• Product Mix: (% of Sales) Women’s Apparel - 31% Women’s Shoes, Handbags, & Accessories - 27% Men’s Apparel & Shoes - 12% Designer & Precious Jewelry - 12% Cosmetics & Fragrances - 11% Home Furnishings & Décor - 5% Other - 2%
• Principal Competition: Saks, Nordstrom, Bloomingdale’s, Lord & Taylor,
Barney’s, and other high-end specialty retailers and e-tailers (e.g., Gilt Group).
• Target Market: The “Top 1%” and other affluent consumers (NM/BG). Aspirational, yet price-sensitive fashion-minded customers (Last Call). Young customers focused on contemporary fashion (CUSP).
• Brands: Neiman Marcus, Bergdorf Goodman, Horchow, Last Call, and CUSP.
May 13, 2014 CONFIDENTIAL 7
NEIMAN MARCUS Profile, con’t.
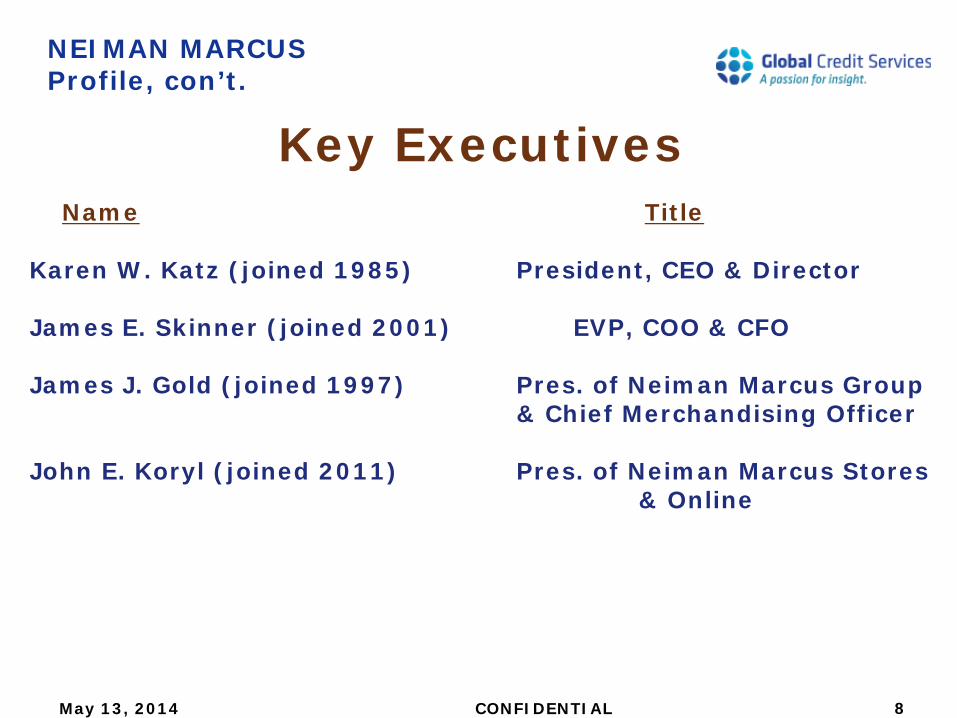
Key Executives
May 13, 2014 CONFIDENTIAL
Name Title
Karen W. Katz (joined 1985) President, CEO & Director James E. Skinner (joined 2001) EVP, COO & CFO James J. Gold (joined 1997) Pres. of Neiman Marcus Group & Chief Merchandising Officer John E. Koryl (joined 2011) Pres. of Neiman Marcus Stores & Online
8
NEIMAN MARCUS Profile, con’t.
Key Shareholders
May 13, 2014 CONFIDENTIAL
Ares Management LLC * Canada Pension Plan Investment Board (“CPPIB”) * * Together, Ares and CPPIB control effectively 100% of the company.
9
NEIMAN MARCUS 2Q14 Summary – Operating Performance
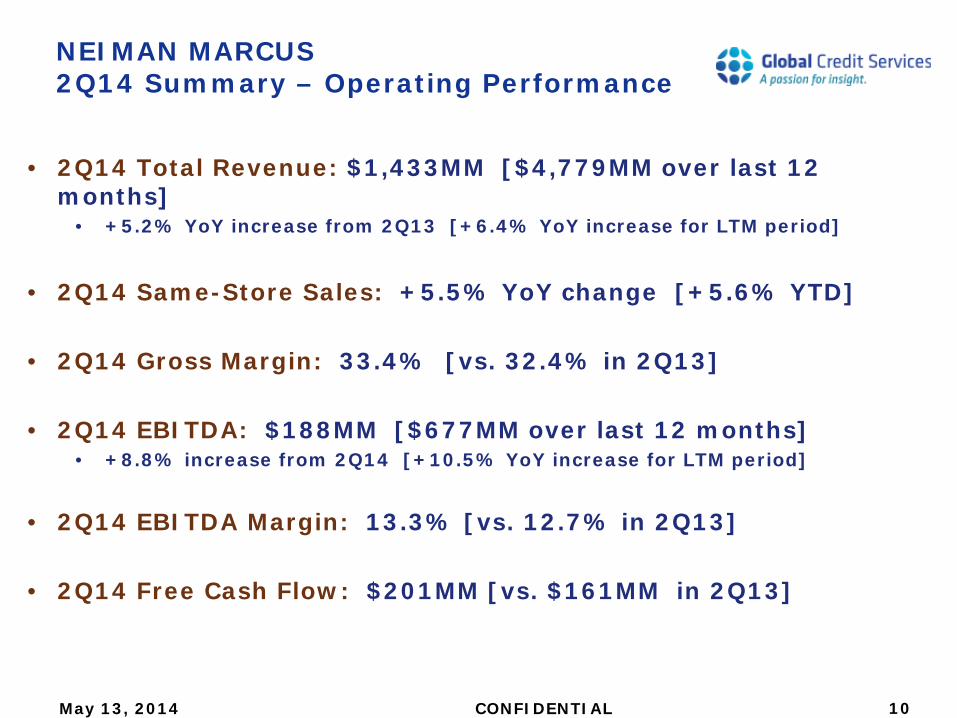
• 2Q14 Total Revenue: $1,433MM [$4,779MM over last 12
months] • +5.2% YoY increase from 2Q13 [+6.4% YoY increase for LTM period]
• 2Q14 Same-Store Sales: +5.5% YoY change [+5.6% YTD]
• 2Q14 Gross Margin: 33.4% [vs. 32.4% in 2Q13]
• 2Q14 EBITDA: $188MM [$677MM over last 12 months]
• +8.8% increase from 2Q14 [+10.5% YoY increase for LTM period]
• 2Q14 EBITDA Margin: 13.3% [vs. 12.7% in 2Q13]
• 2Q14 Free Cash Flow: $201MM [vs. $161MM in 2Q13]
May 13, 2014 CONFIDENTIAL 10
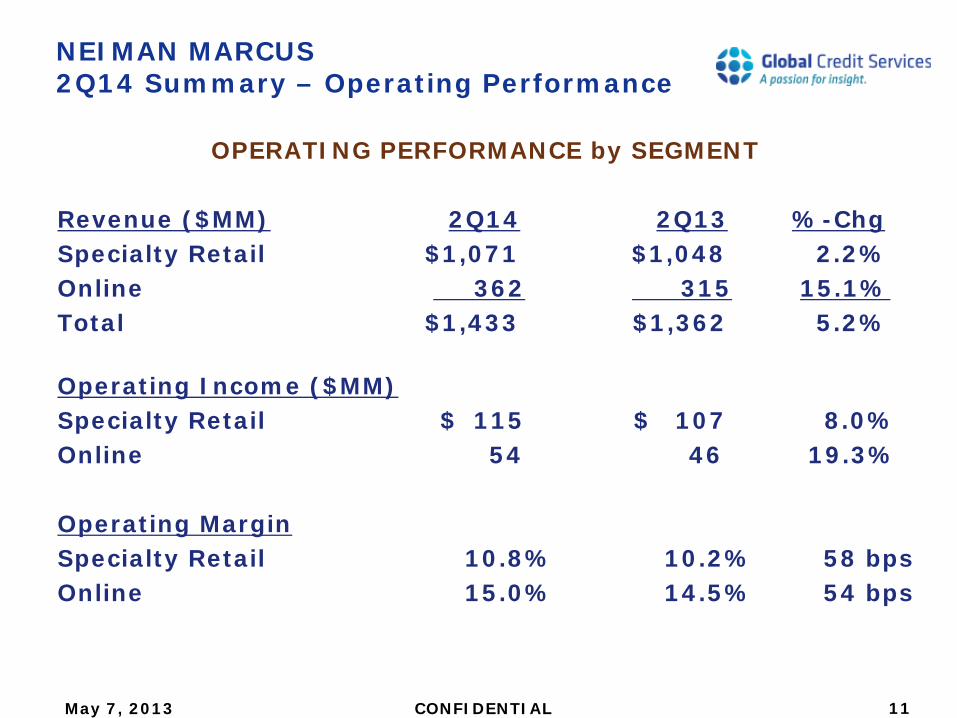
OPERATING PERFORMANCE by SEGMENT Revenue ($MM) 2Q14 2Q13 %-Chg Specialty Retail $1,071 $1,048 2.2% Online 362 315 15.1% Total $1,433 $1,362 5.2%
Operating Income ($MM) Specialty Retail $ 115 $ 107 8.0% Online 54 46 19.3% Operating Margin Specialty Retail 10.8% 10.2% 58 bps Online 15.0% 14.5% 54 bps
11 CONFIDENTIAL May 7, 2013
NEIMAN MARCUS 2Q14 Summary – Operating Performance
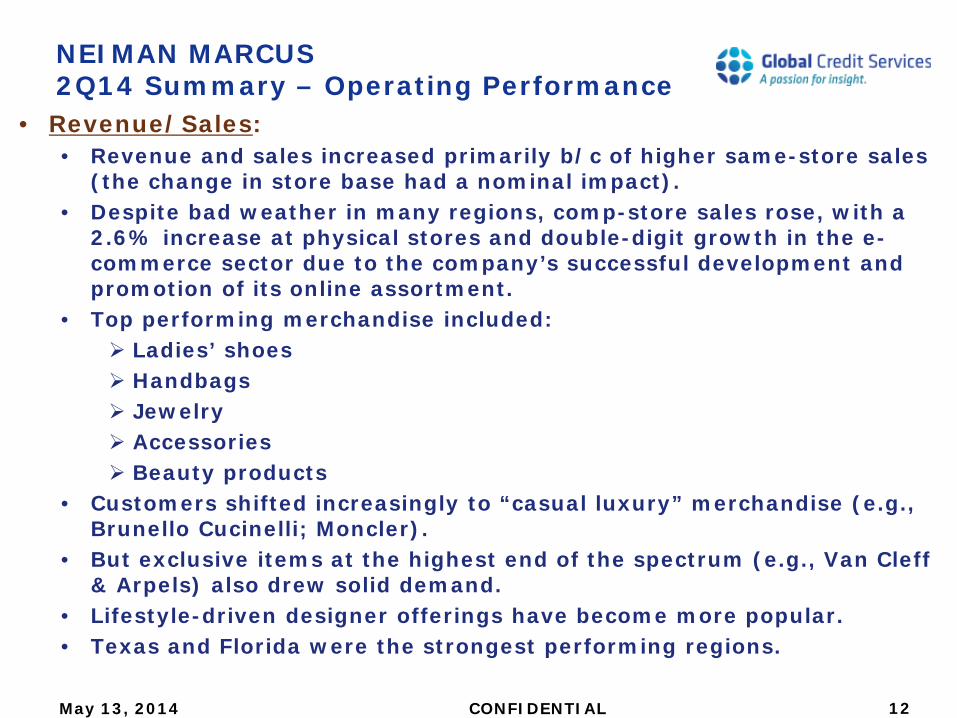
• Revenue/Sales: • Revenue and sales increased primarily b/c of higher same-store sales
(the change in store base had a nominal impact). • Despite bad weather in many regions, comp-store sales rose, with a
2.6% increase at physical stores and double-digit growth in the e-commerce sector due to the company’s successful development and promotion of its online assortment.
• Top performing merchandise included: Ladies’ shoes Handbags Jewelry Accessories Beauty products
• Customers shifted increasingly to “casual luxury” merchandise (e.g., Brunello Cucinelli; Moncler).
• But exclusive items at the highest end of the spectrum (e.g., Van Cleff & Arpels) also drew solid demand.
• Lifestyle-driven designer offerings have become more popular. • Texas and Florida were the strongest performing regions.
NEIMAN MARCUS 2Q14 Summary – Operating Performance
May 13, 2014 CONFIDENTIAL 12
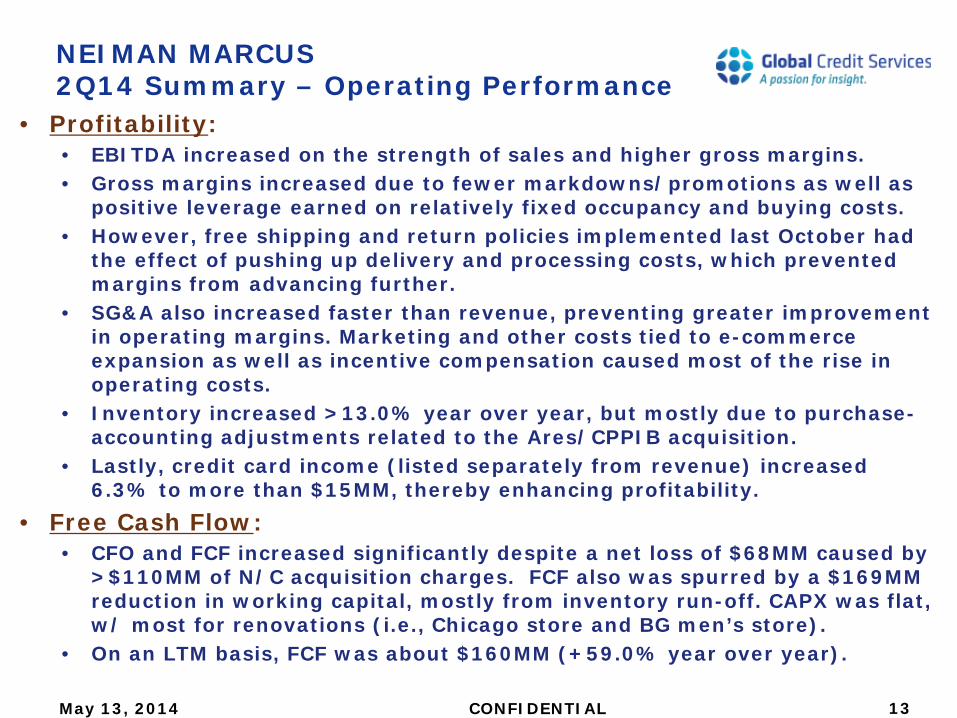
• Profitability: • EBITDA increased on the strength of sales and higher gross margins. • Gross margins increased due to fewer markdowns/promotions as well as
positive leverage earned on relatively fixed occupancy and buying costs. • However, free shipping and return policies implemented last October had
the effect of pushing up delivery and processing costs, which prevented margins from advancing further.
• SG&A also increased faster than revenue, preventing greater improvement in operating margins. Marketing and other costs tied to e-commerce expansion as well as incentive compensation caused most of the rise in operating costs.
• Inventory increased >13.0% year over year, but mostly due to purchase-accounting adjustments related to the Ares/CPPIB acquisition.
• Lastly, credit card income (listed separately from revenue) increased 6.3% to more than $15MM, thereby enhancing profitability.
• Free Cash Flow: • CFO and FCF increased significantly despite a net loss of $68MM caused by
>$110MM of N/C acquisition charges. FCF also was spurred by a $169MM reduction in working capital, mostly from inventory run-off. CAPX was flat, w/ most for renovations (i.e., Chicago store and BG men’s store).
• On an LTM basis, FCF was about $160MM (+59.0% year over year).
NEIMAN MARCUS 2Q14 Summary – Operating Performance
May 13, 2014 CONFIDENTIAL 13
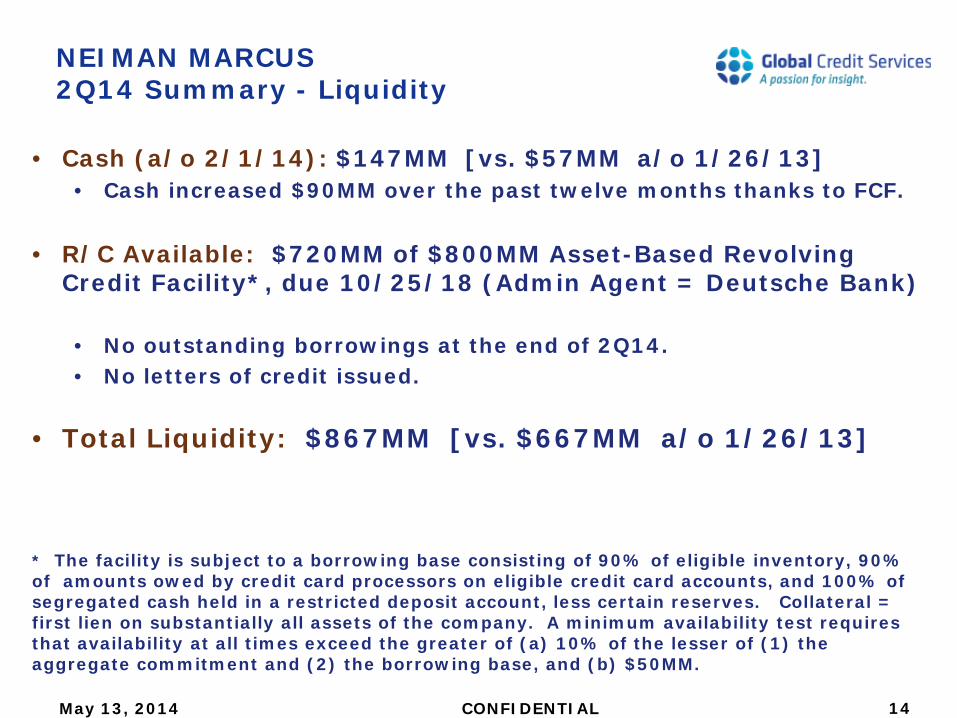
• Cash (a/o 2/1/14): $147MM [vs. $57MM a/o 1/26/13]
• Cash increased $90MM over the past twelve months thanks to FCF. • R/C Available: $720MM of $800MM Asset-Based Revolving
Credit Facility*, due 10/25/18 (Admin Agent = Deutsche Bank)
• No outstanding borrowings at the end of 2Q14. • No letters of credit issued.
• Total Liquidity: $867MM [vs. $667MM a/o 1/26/13] * The facility is subject to a borrowing base consisting of 90% of eligible inventory, 90% of amounts owed by credit card processors on eligible credit card accounts, and 100% of segregated cash held in a restricted deposit account, less certain reserves. Collateral = first lien on substantially all assets of the company. A minimum availability test requires that availability at all times exceed the greater of (a) 10% of the lesser of (1) the aggregate commitment and (2) the borrowing base, and (b) $50MM.
NEIMAN MARCUS 2Q14 Summary - Liquidity
May 13, 2014 CONFIDENTIAL 14
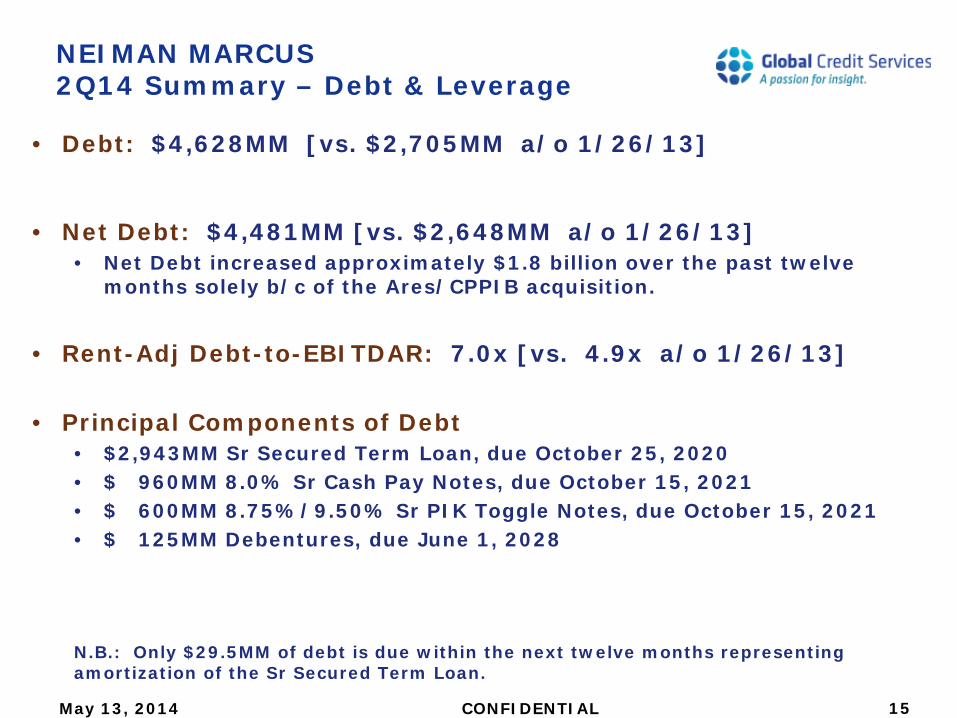
• Debt: $4,628MM [vs. $2,705MM a/o 1/26/13]
• Net Debt: $4,481MM [vs. $2,648MM a/o 1/26/13] • Net Debt increased approximately $1.8 billion over the past twelve
months solely b/c of the Ares/CPPIB acquisition.
• Rent-Adj Debt-to-EBITDAR: 7.0x [vs. 4.9x a/o 1/26/13]
• Principal Components of Debt • $2,943MM Sr Secured Term Loan, due October 25, 2020 • $ 960MM 8.0% Sr Cash Pay Notes, due October 15, 2021 • $ 600MM 8.75%/9.50% Sr PIK Toggle Notes, due October 15, 2021 • $ 125MM Debentures, due June 1, 2028
N.B.: Only $29.5MM of debt is due within the next twelve months representing amortization of the Sr Secured Term Loan.
NEIMAN MARCUS 2Q14 Summary – Debt & Leverage
May 13, 2014 CONFIDENTIAL 15
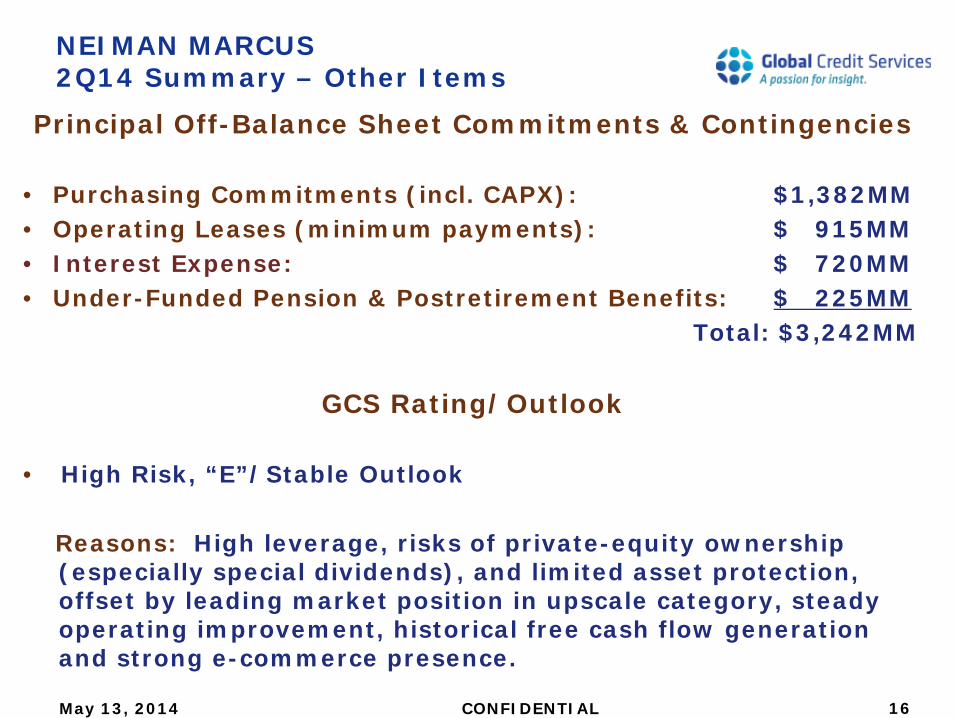
Principal Off-Balance Sheet Commitments & Contingencies
• Purchasing Commitments (incl. CAPX): $1,382MM • Operating Leases (minimum payments): $ 915MM • Interest Expense: $ 720MM • Under-Funded Pension & Postretirement Benefits: $ 225MM Total: $3,242MM
GCS Rating/Outlook
• High Risk, “E”/Stable Outlook
Reasons: High leverage, risks of private-equity ownership (especially special dividends), and limited asset protection, offset by leading market position in upscale category, steady operating improvement, historical free cash flow generation and strong e-commerce presence.
NEIMAN MARCUS 2Q14 Summary – Other Items
May 13, 2014 CONFIDENTIAL 16
Financial History
NEIMAN MARCUS
May 13, 2014 CONFIDENTIAL 17
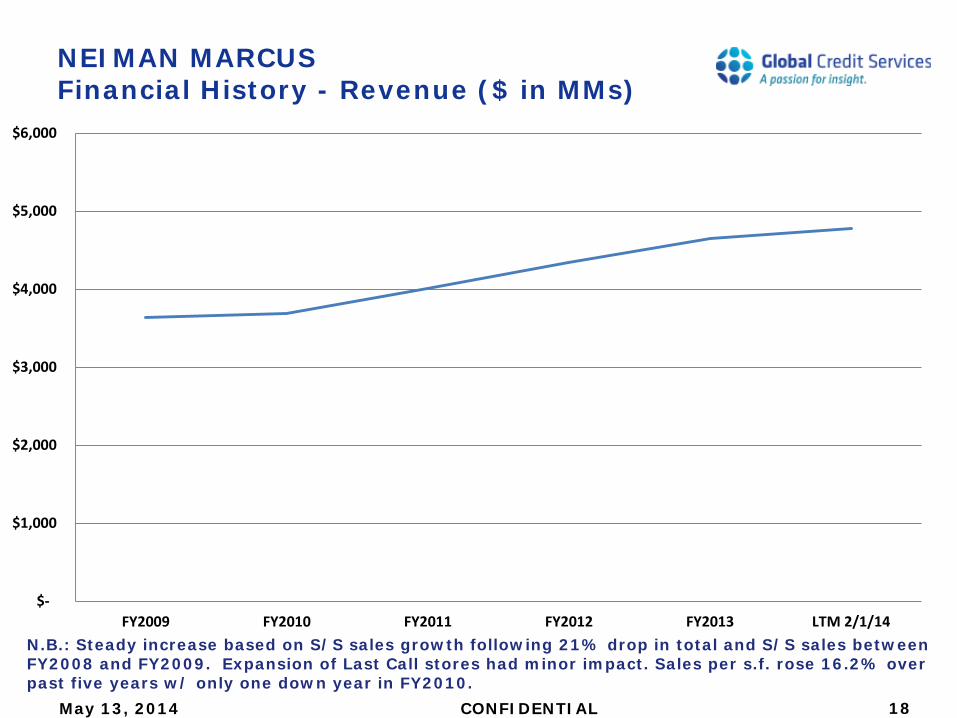
NEIMAN MARCUS Financial History - Revenue ($ in MMs)
May 13, 2014 CONFIDENTIAL
N.B.: Steady increase based on S/S sales growth following 21% drop in total and S/S sales between FY2008 and FY2009. Expansion of Last Call stores had minor impact. Sales per s.f. rose 16.2% over past five years w/ only one down year in FY2010.
18
$-
$1,000
$2,000
$3,000
$4,000
$5,000
$6,000
FY2009 FY2010 FY2011 FY2012 FY2013 LTM 2/1/14
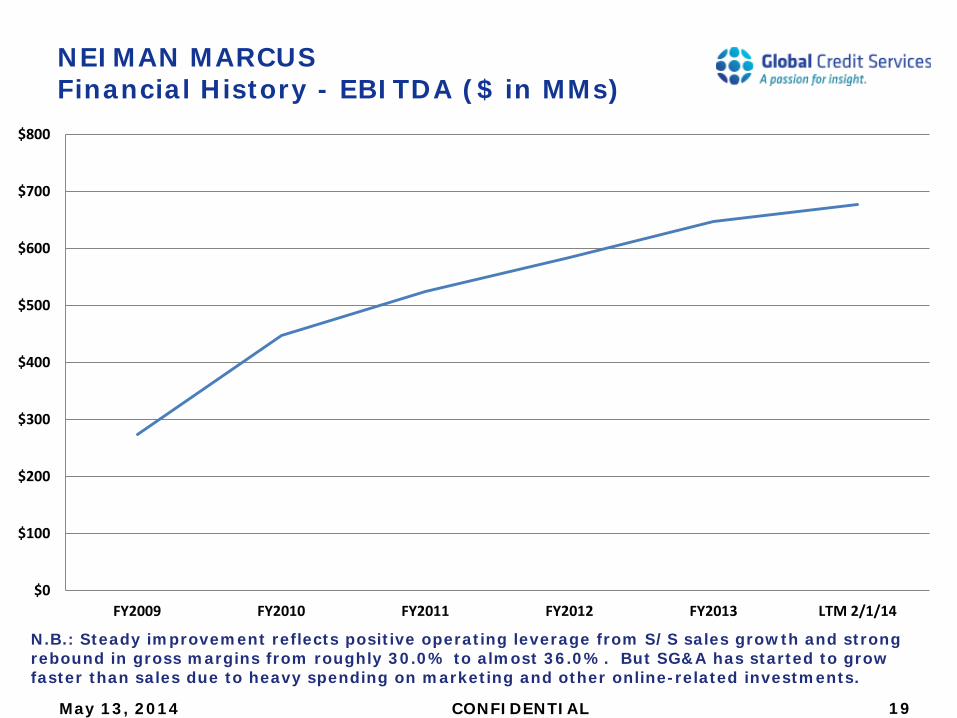
NEIMAN MARCUS Financial History - EBITDA ($ in MMs)
May 13, 2014 CONFIDENTIAL
N.B.: Steady improvement reflects positive operating leverage from S/S sales growth and strong rebound in gross margins from roughly 30.0% to almost 36.0%. But SG&A has started to grow faster than sales due to heavy spending on marketing and other online-related investments.
19
$0
$100
$200
$300
$400
$500
$600
$700
$800
FY2009 FY2010 FY2011 FY2012 FY2013 LTM 2/1/14
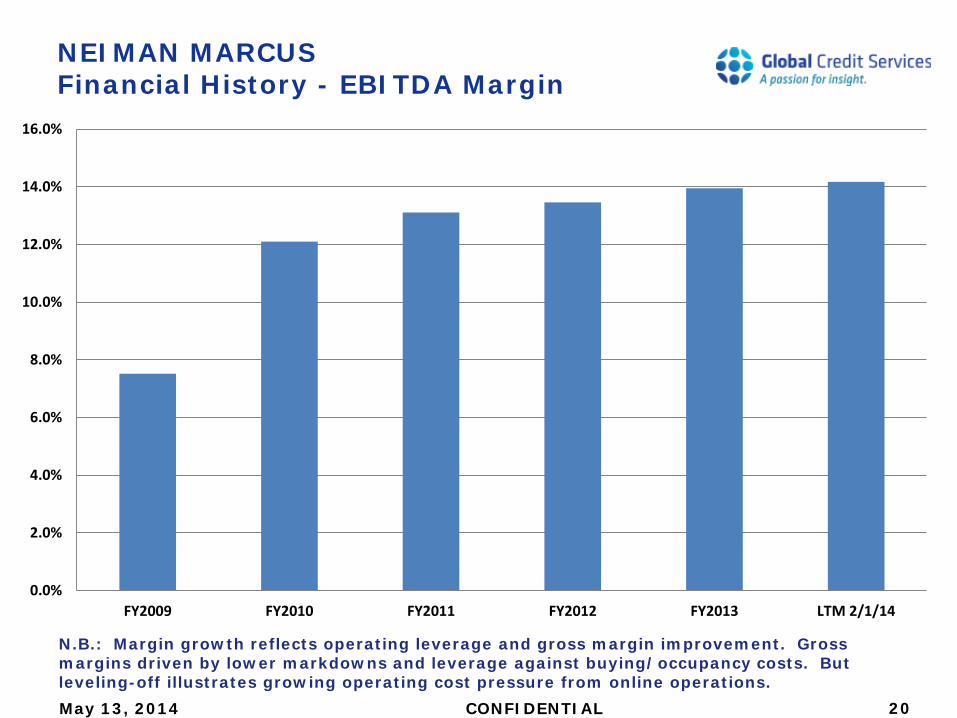
NEIMAN MARCUS Financial History - EBITDA Margin
May 13, 2014 CONFIDENTIAL 20
N.B.: Margin growth reflects operating leverage and gross margin improvement. Gross margins driven by lower markdowns and leverage against buying/occupancy costs. But leveling-off illustrates growing operating cost pressure from online operations.
0.0%
2.0%
4.0%
6.0%
8.0%
10.0%
12.0%
14.0%
16.0%
FY2009 FY2010 FY2011 FY2012 FY2013 LTM 2/1/14
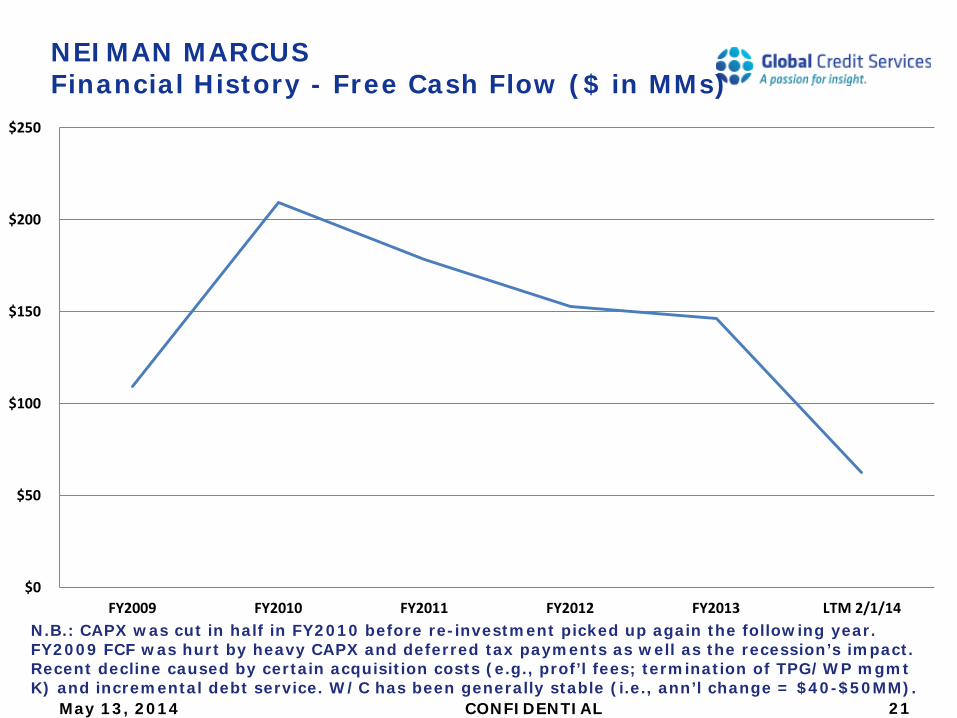
NEIMAN MARCUS Financial History - Free Cash Flow ($ in MMs)
May 13, 2014 CONFIDENTIAL
N.B.: CAPX was cut in half in FY2010 before re-investment picked up again the following year. FY2009 FCF was hurt by heavy CAPX and deferred tax payments as well as the recession’s impact. Recent decline caused by certain acquisition costs (e.g., prof’l fees; termination of TPG/WP mgmt K) and incremental debt service. W/C has been generally stable (i.e., ann’l change = $40-$50MM).
21
$0
$50
$100
$150
$200
$250
FY2009 FY2010 FY2011 FY2012 FY2013 LTM 2/1/14
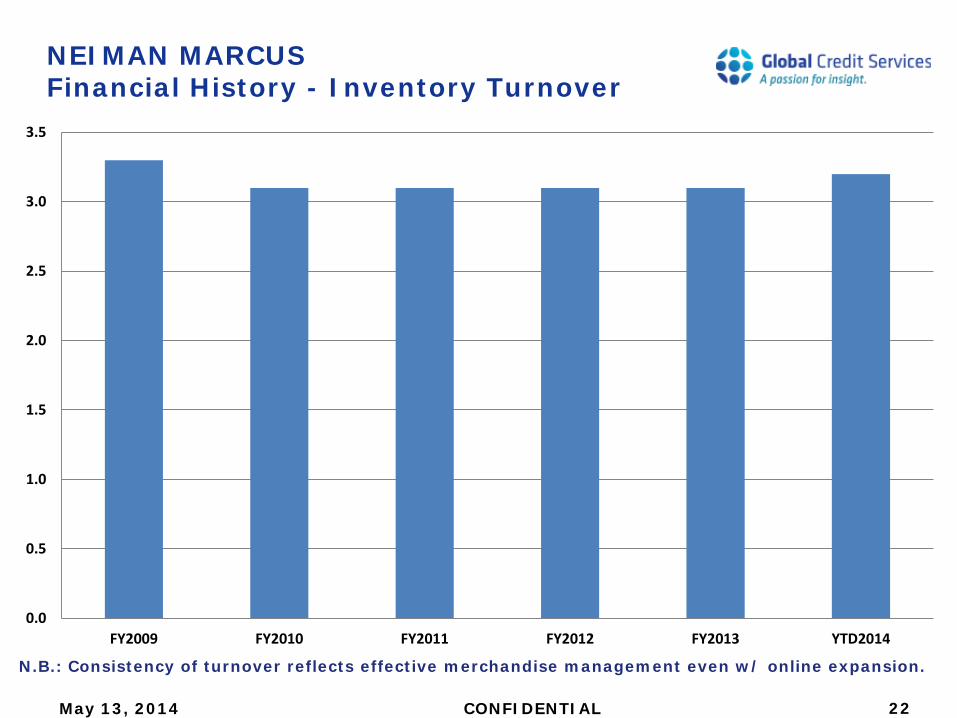
NEIMAN MARCUS Financial History - Inventory Turnover
May 13, 2014 CONFIDENTIAL
N.B.: Consistency of turnover reflects effective merchandise management even w/ online expansion.
22
0.0
0.5
1.0
1.5
2.0
2.5
3.0
3.5
FY2009 FY2010 FY2011 FY2012 FY2013 YTD2014
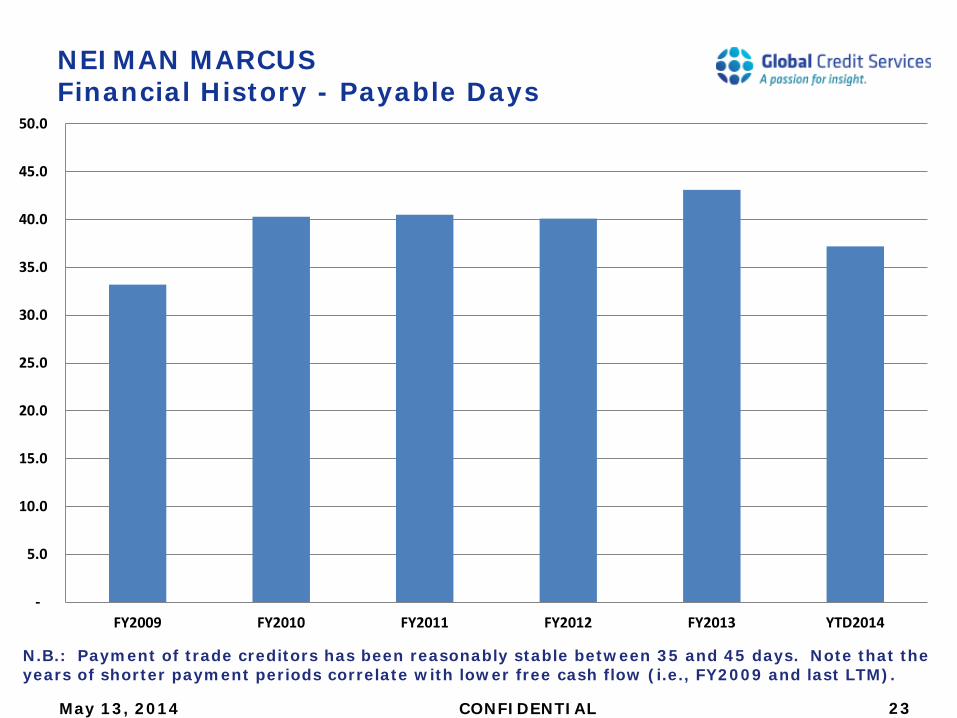
NEIMAN MARCUS Financial History - Payable Days
May 13, 2014 CONFIDENTIAL
N.B.: Payment of trade creditors has been reasonably stable between 35 and 45 days. Note that the years of shorter payment periods correlate with lower free cash flow (i.e., FY2009 and last LTM).
23
-
5.0
10.0
15.0
20.0
25.0
30.0
35.0
40.0
45.0
50.0
FY2009 FY2010 FY2011 FY2012 FY2013 YTD2014
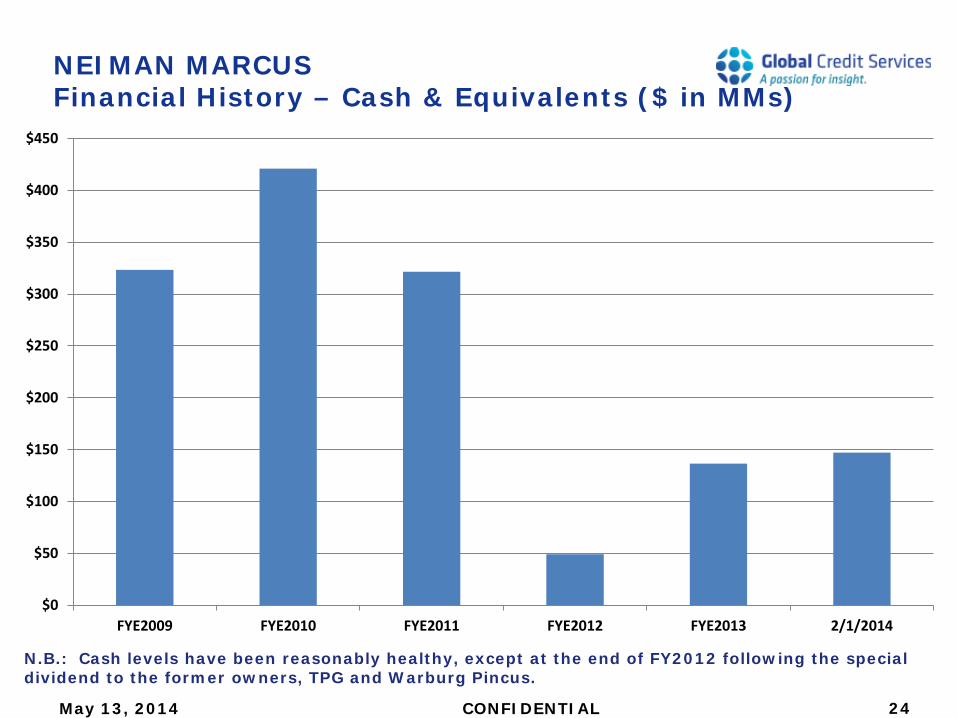
NEIMAN MARCUS Financial History – Cash & Equivalents ($ in MMs)
May 13, 2014 CONFIDENTIAL
N.B.: Cash levels have been reasonably healthy, except at the end of FY2012 following the special dividend to the former owners, TPG and Warburg Pincus.
24
$0
$50
$100
$150
$200
$250
$300
$350
$400
$450
FYE2009 FYE2010 FYE2011 FYE2012 FYE2013 2/1/2014
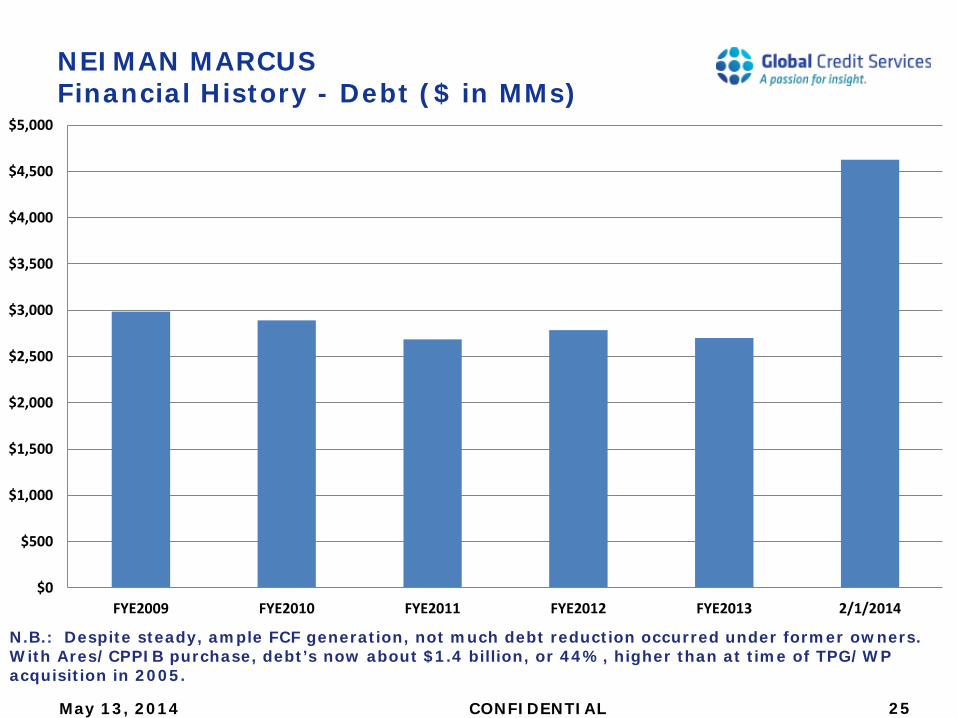
NEIMAN MARCUS Financial History - Debt ($ in MMs)
May 13, 2014 CONFIDENTIAL
N.B.: Despite steady, ample FCF generation, not much debt reduction occurred under former owners. With Ares/CPPIB purchase, debt’s now about $1.4 billion, or 44%, higher than at time of TPG/WP acquisition in 2005.
25
$0
$500
$1,000
$1,500
$2,000
$2,500
$3,000
$3,500
$4,000
$4,500
$5,000
FYE2009 FYE2010 FYE2011 FYE2012 FYE2013 2/1/2014
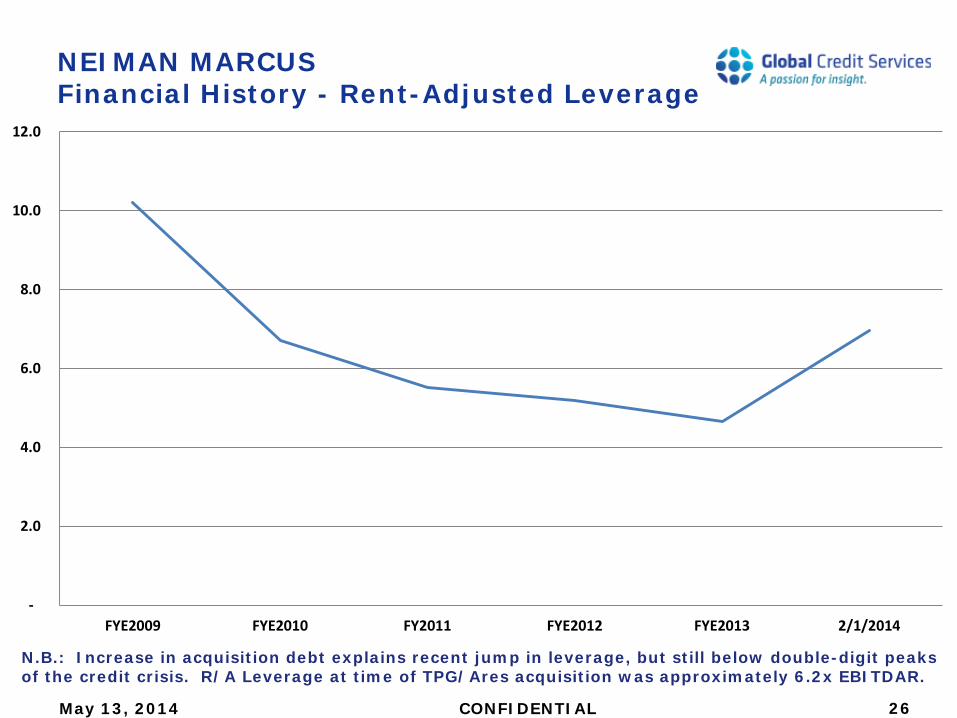
NEIMAN MARCUS Financial History - Rent-Adjusted Leverage
May 13, 2014 CONFIDENTIAL
N.B.: Increase in acquisition debt explains recent jump in leverage, but still below double-digit peaks of the credit crisis. R/A Leverage at time of TPG/Ares acquisition was approximately 6.2x EBITDAR.
26
-
2.0
4.0
6.0
8.0
10.0
12.0
FYE2009 FYE2010 FY2011 FYE2012 FYE2013 2/1/2014

• 1907: Company founded by Herbert Marcus, Sr., his sister Carrie, and her then-husband, A.L. Neiman.
• 1928: Marcus family assumed full control after Carrie and A.L. divorce.
• 1971: Opened the first store outside of Texas in Bal Harbour, Florida.
• 1972: Carter Hawley Hale bought Bergdorf Goodman.
• 1984: Started “InCircle,” the industry’s first customer loyalty program.
• 1987: General Cinema (now Harcourt General) bought Bergdorf Goodman and Neiman Marcus
• 1999: Harcourt General spun off Neiman Marcus and Bergdorf Goodman as a separate company.
• 1999: Launched the NeimanMarcus.com website.
NEIMAN MARCUS Key Developments & Dates in History
May 13, 2014 CONFIDENTIAL 27
• 2005: TPG and Warburg Pincus acquired the company in a leveraged buyout.
• 2006: Opened the first CUSP store.
• 2010: Promoted Karen Katz to the position of president and CEO, the first female chief of the company.
• March 2012: Paid a $449MM special dividend to its shareholders.
• March 2012: Made the first of several investments in Glamour Sales Holdings, owner/operator of flash-sale websites in Asia, in an effort to establish a direct presence in the China e-commerce market with a dedicated website.
• May 2012: The company’s credit card program was assigned from HSBC to Capital One, with contract expiration subsequently extended to no earlier than 2020.
NEIMAN MARCUS Key Developments & Dates in History, con’t.
May 13, 2014 CONFIDENTIAL 28
• July 2012: Embarked on a partnership w/ Target, whereby they agreed to offer a joint product line of select merchandise in an attempt to attract younger shoppers and exploit certain sourcing and production capabilities.
• October 2012: Began major renovation of its flagship Chicago store, expected to last two years.
• May 2013: Rejected a proposed merger with Saks sponsored by Kohlberg Kravis Roberts.
• May 2013: Effectively ended its direct e-commerce venture in China, opting instead to sell to customers in that country through it existing primary website and fulfilling orders from the U.S.
• 3Q2013: Launched a partnership w/ Borderfree, allowing the company to ship online merchandise to customers in >100 countries.
• 3Q2013: Opened a new state-of-the-art distribution center in Pennsylvania that replaced another facility in New Jersey.
NEIMAN MARCUS Key Developments & Dates in History, con’t.
May 13, 2014 CONFIDENTIAL 29
• September 2013: Agreed to sell the company to Ares and CPPIB for approximately $6.2 billion, thereby terminating plans to pursue an IPO initiated just a few months earlier.
• October 2013: Announced free shipping and return policies for all domestic online and in-store purchases on a year-round basis.
• October 2013: Launched $100MM program to expand omni-channel capabilities over the next 3-5 years, including a new single-platform merchandising system called “NMG One.”
• October 2013: Completed the acquisition by Ares and CPPIB.
• February 2014: Launched the new “NM” shopping app for iPhones, allowing customers to, among other things shop, communicate w/ sales associates, keep track of reward programs, and read the company blog.
• March 2014: Amended Sr Secured Term Loan to lower pricing.
• April 2014: Sold its 44% stake in Glamour Sales Holdings.
NEIMAN MARCUS Key Developments & Dates in History, con’t.
May 13, 2014 CONFIDENTIAL 30
UPDATE on CYBER-SECURITY ATTACK
• In January 2014, the company disclosed that hackers had gained access to its computer systems, downloaded malicious malware and stolen proprietary information from certain customer credit card accounts.
• The period of exposure, or “incubation period,” ran from July 16, 2013, through October 30, 2013.
• Initial estimates of approximately 1.1 million at-risk customers were subsequently reduced to about 350,000.
• Only about 9,200 customer cards were used in fraudulent transactions, none of which involved Neiman Marcus’ proprietary cards.
• NO social security numbers or birth dates were compromised. Additionally, no PINS were at risk since the company does not use PIN technology in its stores.
• Not all stores were impacted, and NO online customers were exposed. • The company’s notified all in-store and online customers that shopped
during 2013 of the incident. • In response and compensation, the company’s offered one year of free
credit monitoring and identity-theft protection. • To date, three lawsuits have been filed against the company, but
prospective damages are uncertain at this time.
NEIMAN MARCUS Key Developments & Dates in History, con’t.
May 13, 2014 CONFIDENTIAL 31
STORE RENOVATIONS
• Chicago, IL (Michigan Avenue flagship): in final stages of completion, scheduled for June 2014.
• Oak Brook, IL: store remodeling commenced in April 2014, with completion targeted for the end of 2014.
• Palo Alto, CA: extensive renovation planned to begin in Fall 2014, with completion by Spring 2016.
• Bergdorf Goodman’s men’s store (NYC): recently updated.
NEIMAN MARCUS Key Developments & Dates in History, con’t.
May 13, 2014 CONFIDENTIAL 32
• Maintain Focus on Luxury Apparel & Accessories Segment of Retail Industry: Partner with most elite established and emerging fashion
vendors such as Chanel, Gucci, Giorgio Armani, Brioni, Van Cleef & Arpels and Tom Ford, among others.
Offer limited distribution of merchandise intended to maximize exclusivity and premium pricing, while developing concepts intended to attract younger, aspirational, but more price-sensitive clientele.
Heavy emphasis on providing the highest level of customer service.
Each store strategically located and individually designed to cater to unique characteristics of its market with high-end finishings, artwork and, often, restaurants. Most importantly, highly curated merchandise assortments are customized at the store level based on local market research and online data analytics.
Sales per square feet >$550 exceeds that of virtually all other luxury and premium multi-branded retailers.
“InCircle” Loyalty Program: 40% of total revenue generated from 143,000 members in FY2013.
NEIMAN MARCUS Strategic Initiatives
May 13, 2014 CONFIDENTIAL 33
• Omni-Channel Business Model: Invest $100MM over 3-5 years in technology to advance
customers’ ability to “shop anywhere, anytime, on any device,” establishing a “seamless” shopping experience across all channels.
Objective: Optimize customers’ recognition of company brands and strengthen their relationship with the company.
New NMG One merchandising platform will combine all brands and channels to improve customer access to all inventory.
Online sales as a percentage of total revenue is the highest of all department stores covered by Global Credit.
10-Yr Online Sales CAGR: approximately 15%. Maintain physical presence in major U.S. markets, especially
“gate-way” cities that draw people from around the world. Fill the geographic “void” between affluent regions with heavy
promotion of e-commerce sites. Approximately 40% of online customers were located outside the trade areas of full-line stores in FY2013.
Distribution partnerships (e.g., Borderfree) extend the company’s market to >100 countries.
Online promotions drive customer traffic to retail stores.
NEIMAN MARCUS Strategic Initiatives, con’t.
May 13, 2014 CONFIDENTIAL 34
• Enhanced Technology Efforts: Company’s been a leader in developing the most up-to-date online
and mobile capabilities to complement in-store operations (e.g., new “NM” iPhone app; 2-hour in-store pickup for online orders).
All store associates carry iPhones. >75% communicate w/ customers by texting. Email sent regularly to over 6MM contacts.
All stores have iPad Lookbooks in select departments to facilitate browsing and shopping.
• Combining Store and Online Management:
Acknowledging the blurring lines between traditional retail and e-commerce, the company recently made senior management changes reflecting its commitment to manage the two units jointly.
Jim Gold, president of Specialty Retail, was named president of the Neiman Marcus Group and chief merchandising officer.
John Koryl, president of Neiman Marcus Direct, was named president of Neiman Marcus stores and online.
Divisional merchandise managers for certain product categories will now be responsible for both store and online product offerings.
Better alignment of store and online merchandise mix facilitates omni-channel capabilities (e.g., “buy online/ship from store”).
NEIMAN MARCUS Strategic Initiatives, con’t.
May 13, 2014 CONFIDENTIAL 35
• Modernizing the Brand: Objective: To increase traffic and transactions by reaching a
new set of younger customers. The company’s launched VISA and MasterCard acceptance in its
stores in an effort to sign up more customers. Expanding social media presence through Facebook (600,000
“fans”), Twitter (>85,000 followers), Pinterest (>22,000 followers) and the company’s new “NM Daily Blog,” which publishes fashion and lifestyle posts (>800,000 visits).
Contemporary departments were rebranded under the CUSP name in 2012.
Last Call: experimenting with new smaller “Studio” format with modified merchandise mix that goes beyond NM/BG clearance. Six already exist with six more planned by the end of 2014.
NEIMAN MARCUS Strategic Initiatives, con’t.
May 13, 2014 CONFIDENTIAL 36
• Private-Equity Ownership & Leverage: Company acquired at high price. Undue reliance on debt to fund acquisition. Cost structure burdened with management fees charged for
dubious services. Risk of special dividends or dividend recaps are ever-present,
especially with liberal capital markets - has the tendency to effectively moot the progress the company’s made (e.g., TPG/WP dividend in 2012).
Leverage likely to stay high, creating chronic competitive disadvantage (i.e., company more vulnerable in economic downturn).
Cash flows will be compressed by additional debt service unless company can expand on already industry-leading margins.
Private equity shops typically seek to grow their investments quickly and cash out within 5 years so their interests may not be entirely aligned with the longer term interests of the company. Example: building stores simply for the sake of top-line growth without regard to the risk of cannibalization and reduced profitability and cash flow.
NEIMAN MARCUS Issues, Observations & Conclusions
May 13, 2014 CONFIDENTIAL 37
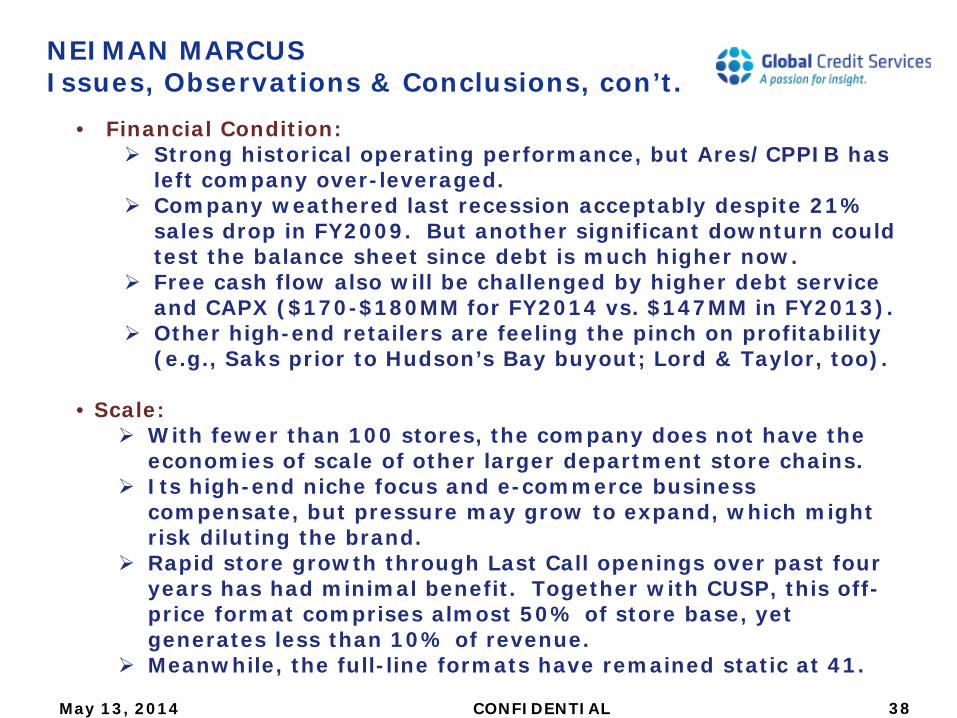
• Financial Condition: Strong historical operating performance, but Ares/CPPIB has
left company over-leveraged. Company weathered last recession acceptably despite 21%
sales drop in FY2009. But another significant downturn could test the balance sheet since debt is much higher now.
Free cash flow also will be challenged by higher debt service and CAPX ($170-$180MM for FY2014 vs. $147MM in FY2013).
Other high-end retailers are feeling the pinch on profitability (e.g., Saks prior to Hudson’s Bay buyout; Lord & Taylor, too).
• Scale: With fewer than 100 stores, the company does not have the
economies of scale of other larger department store chains. Its high-end niche focus and e-commerce business
compensate, but pressure may grow to expand, which might risk diluting the brand.
Rapid store growth through Last Call openings over past four years has had minimal benefit. Together with CUSP, this off-price format comprises almost 50% of store base, yet generates less than 10% of revenue.
Meanwhile, the full-line formats have remained static at 41.
NEIMAN MARCUS Issues, Observations & Conclusions, con’t.
May 13, 2014 CONFIDENTIAL 38
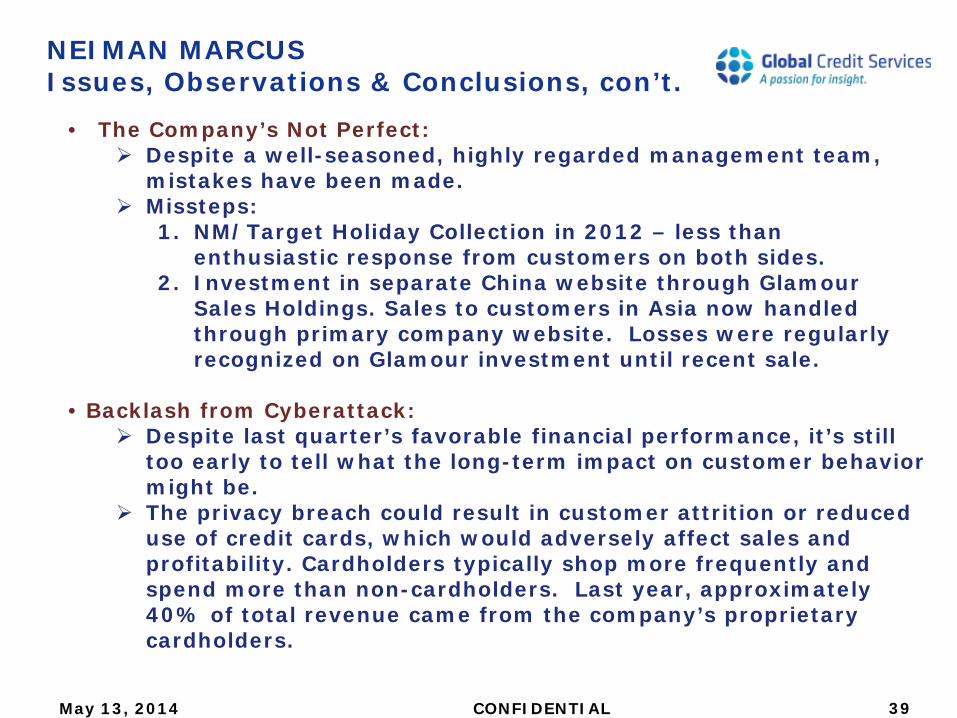
• The Company’s Not Perfect: Despite a well-seasoned, highly regarded management team,
mistakes have been made. Missteps:
1. NM/Target Holiday Collection in 2012 – less than enthusiastic response from customers on both sides.
2. Investment in separate China website through Glamour Sales Holdings. Sales to customers in Asia now handled through primary company website. Losses were regularly recognized on Glamour investment until recent sale.
• Backlash from Cyberattack: Despite last quarter’s favorable financial performance, it’s still
too early to tell what the long-term impact on customer behavior might be.
The privacy breach could result in customer attrition or reduced use of credit cards, which would adversely affect sales and profitability. Cardholders typically shop more frequently and spend more than non-cardholders. Last year, approximately 40% of total revenue came from the company’s proprietary cardholders.
NEIMAN MARCUS Issues, Observations & Conclusions, con’t.
May 13, 2014 CONFIDENTIAL 39
NEIMAN MARCUS Issues, Observations & Conclusions, con’t.
May 13, 2014 CONFIDENTIAL 40
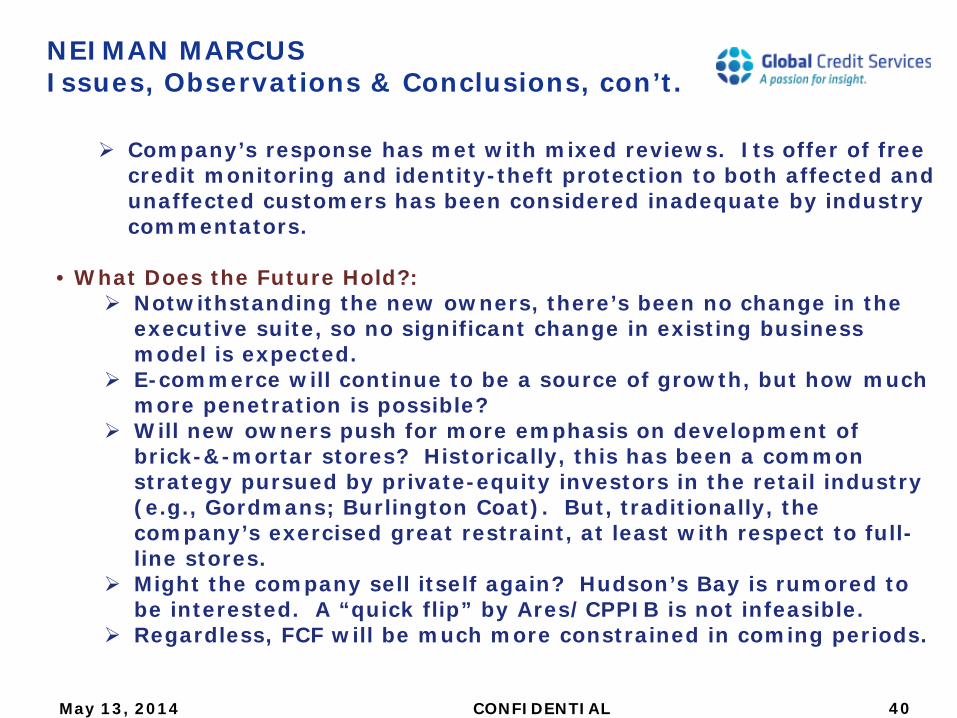
Company’s response has met with mixed reviews. Its offer of free credit monitoring and identity-theft protection to both affected and unaffected customers has been considered inadequate by industry commentators.
• What Does the Future Hold?: Notwithstanding the new owners, there’s been no change in the
executive suite, so no significant change in existing business model is expected.
E-commerce will continue to be a source of growth, but how much more penetration is possible?
Will new owners push for more emphasis on development of brick-&-mortar stores? Historically, this has been a common strategy pursued by private-equity investors in the retail industry (e.g., Gordmans; Burlington Coat). But, traditionally, the company’s exercised great restraint, at least with respect to full-line stores.
Might the company sell itself again? Hudson’s Bay is rumored to be interested. A “quick flip” by Ares/CPPIB is not infeasible.
Regardless, FCF will be much more constrained in coming periods.
NEIMAN MARCUS Comparable Company Analysis
May 13, 2014 CONFIDENTIAL 41
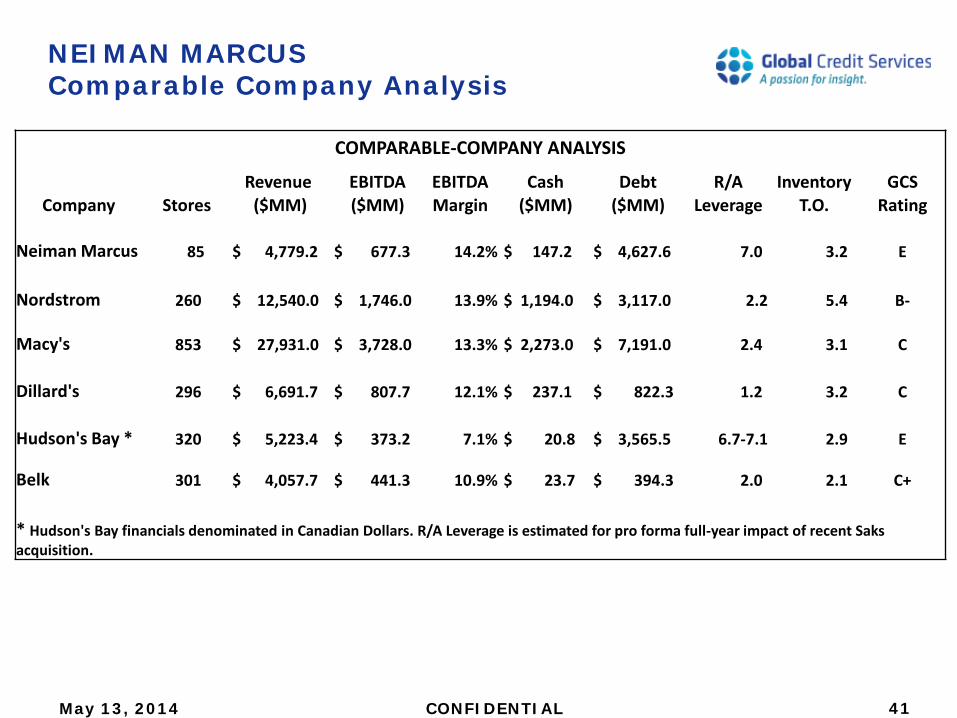
COMPARABLE-COMPANY ANALYSIS
Revenue EBITDA EBITDA Cash Debt R/A Inventory GCS Company Stores ($MM) ($MM) Margin ($MM) ($MM) Leverage T.O. Rating
Neiman Marcus 85 $ 4,779.2 $ 677.3 14.2% $ 147.2 $ 4,627.6 7.0 3.2 E
Nordstrom 260 $ 12,540.0 $ 1,746.0 13.9% $ 1,194.0 $ 3,117.0 2.2 5.4 B-
Macy's 853 $ 27,931.0 $ 3,728.0 13.3% $ 2,273.0 $ 7,191.0 2.4 3.1 C
Dillard's 296 $ 6,691.7 $ 807.7 12.1% $ 237.1 $ 822.3 1.2 3.2 C
Hudson's Bay * 320 $ 5,223.4 $ 373.2 7.1% $ 20.8 $ 3,565.5 6.7-7.1 2.9 E
Belk 301 $ 4,057.7 $ 441.3 10.9% $ 23.7 $ 394.3 2.0 2.1 C+
* Hudson's Bay financials denominated in Canadian Dollars. R/A Leverage is estimated for pro forma full-year impact of recent Saks acquisition.
Questions &
Answers
NEIMAN MARCUS
May 13, 2014 CONFIDENTIAL 42
ADMINISTRATIVE ITEMS Contact Information
• Robert C. Pike – Senior Industry Analyst - Phone: (917) 388-8835 - Email: [email protected]
May 13, 2014 CONFIDENTIAL 43
ADMINISTRATIVE ITEMS Upcoming Webinars
• Ace Hardware & Tractor Supply
- Wednesday, May 21, 2014 @ 2PM Eastern - Eugene Shiller, Industry Analyst
• Delhaize Group & SpartanNash - Thursday, June 5, 2014 @ 2PM Eastern - Jonathan Kanarek, CFA, Director of Analysis
• Toys R Us - Thursday, June 19, 2014 @ 2PM Eastern - Iwan Juwana, CFA, Senior Industry Analyst
May 13, 2014 CONFIDENTIAL 44
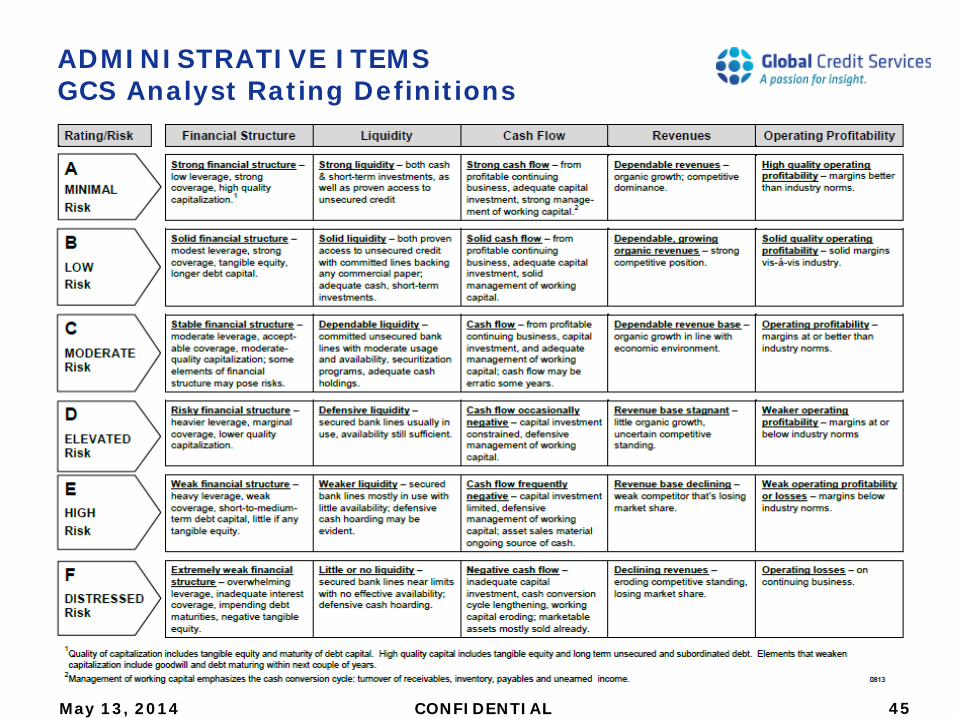
ADMINISTRATIVE ITEMS GCS Analyst Rating Definitions
45 CONFIDENTIAL May 13, 2014
CONFIDENTIAL
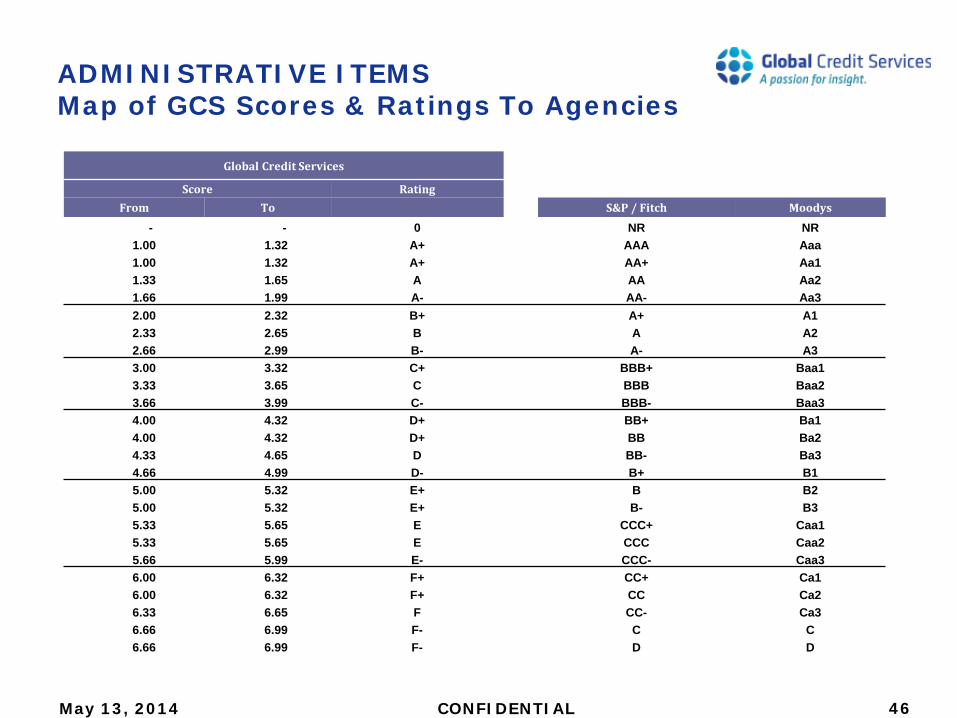
ADMINISTRATIVE ITEMS Map of GCS Scores & Ratings To Agencies
Global Credit Services
Score Rating From To S&P / Fitch Moodys
- - 0 NR NR 1.00 1.32 A+ AAA Aaa 1.00 1.32 A+ AA+ Aa1 1.33 1.65 A AA Aa2 1.66 1.99 A- AA- Aa3 2.00 2.32 B+ A+ A1 2.33 2.65 B A A2 2.66 2.99 B- A- A3 3.00 3.32 C+ BBB+ Baa1 3.33 3.65 C BBB Baa2 3.66 3.99 C- BBB- Baa3 4.00 4.32 D+ BB+ Ba1 4.00 4.32 D+ BB Ba2 4.33 4.65 D BB- Ba3 4.66 4.99 D- B+ B1 5.00 5.32 E+ B B2 5.00 5.32 E+ B- B3 5.33 5.65 E CCC+ Caa1 5.33 5.65 E CCC Caa2 5.66 5.99 E- CCC- Caa3 6.00 6.32 F+ CC+ Ca1 6.00 6.32 F+ CC Ca2 6.33 6.65 F CC- Ca3 6.66 6.99 F- C C 6.66 6.99 F- D D
May 13, 2014 46