webcast - 1q14 results
TRANSCRIPT
OPERATIONAL AND FINANCIAL RESULTS1st Quarter 2014__
Conference Call / WebcastMay 12th 2014
DISCLAIMER
FORWARD-LOOKING STATEMENTS:
DISCLAIMER
The presentation may contain forward-looking statements about futureevents within the meaning of Section 27A of the Securities Act of 1933, asamended, and Section 21E of the Securities Exchange Act of 1934, asamended, that are not based on historical facts and are not assurances offuture results. Such forward-looking statements merely reflect theCompany’s current views and estimates of future economic circumstances,industry conditions, company performance and financial results. Suchterms as "anticipate", "believe", "expect", "forecast", "intend", "plan","project", "seek", "should", along with similar or analogous expressions, areused to identify such forward-looking statements. Readers are cautionedthat these statements are only projections and may differ materially fromactual future results or events. Readers are referred to the documents filedby the Company with the SEC, specifically the Company’s most recentAnnual Report on Form 20-F, which identify important risk factors thatcould cause actual results to differ from those contained in the forward-looking statements, including, among other things, risks relating to generaleconomic and business conditions, including crude oil and othercommodity prices, refining margins and prevailing exchange rates,uncertainties inherent in making estimates of our oil and gas reservesincluding recently discovered oil and gas reserves, international andBrazilian political, economic and social developments, receipt ofgovernmental approvals and licenses and our ability to obtain financing.
We undertake no obligation to publicly update or revise any forward-looking statements, whether as a result of new information or futureevents or for any other reason. Figures for 2014 on are estimates ortargets.
All forward-looking statements are expressly qualified in their entiretyby this cautionary statement, and you should not place reliance on anyforward-looking statement contained in this presentation.
NON-SEC COMPLIANT OIL AND GAS RESERVES:
CAUTIONARY STATEMENT FOR US INVESTORS
We present certain data in this presentation, such as oil and gasresources, that we are not permitted to present in documents filed withthe United States Securities and Exchange Commission (SEC) undernew Subpart 1200 to Regulation S-K because such terms do notqualify as proved, probable or possible reserves under Rule 4-10(a) ofRegulation S-X.
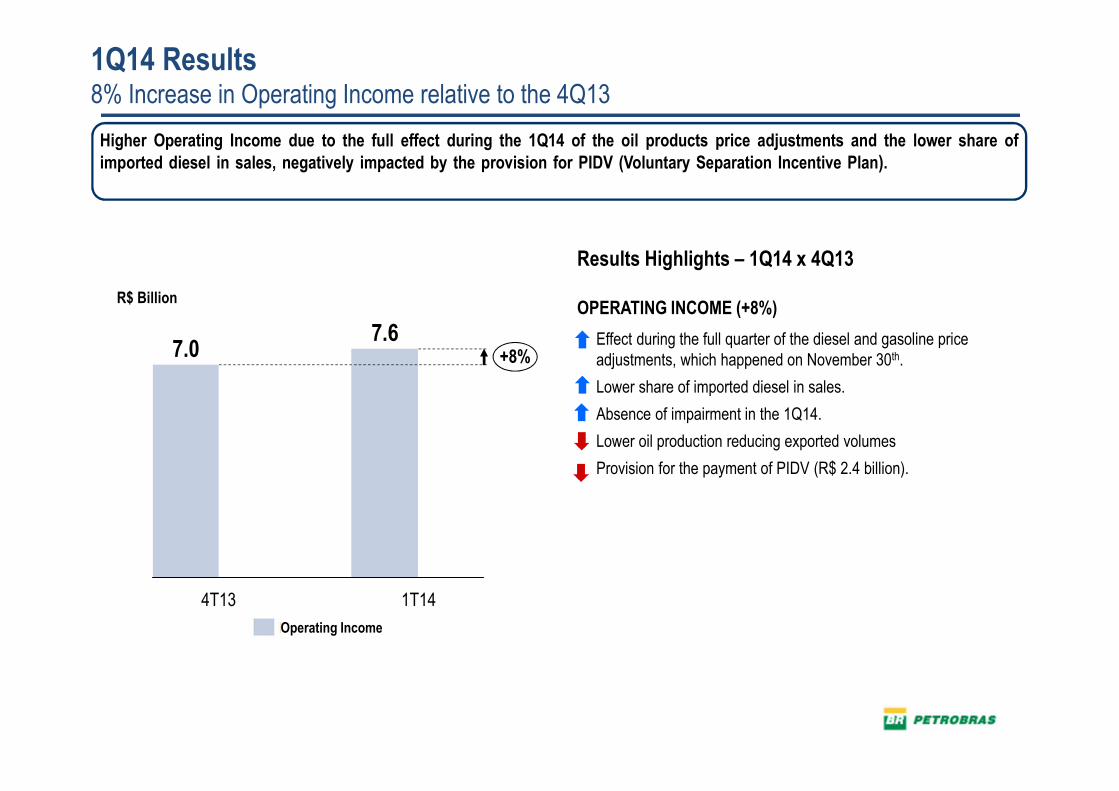
1Q14 Results8% Increase in Operating Income relative to the 4Q13
+8%7.6
7.0
R$ Billion
4T13 1T14
Results Highlights – 1Q14 x 4Q13
OPERATING INCOME (+8%)
� Effect during the full quarter of the diesel and gasoline price adjustments, which happened on November 30th.
� Lower share of imported diesel in sales.
� Absence of impairment in the 1Q14.
� Lower oil production reducing exported volumes
� Provision for the payment of PIDV (R$ 2.4 billion).
Higher Operating Income due to the full effect during the 1Q14 of the oil products price adjustments and the lower share of
imported diesel in sales, negatively impacted by the provision for PIDV (Voluntary Separation Incentive Plan). A queda do lucrolíquido foi função do efeito positivo, no 4T13, do benefício fiscal dos juros sobre capital próprio no valor de R$ 3,2 bilhões.
Operating Income
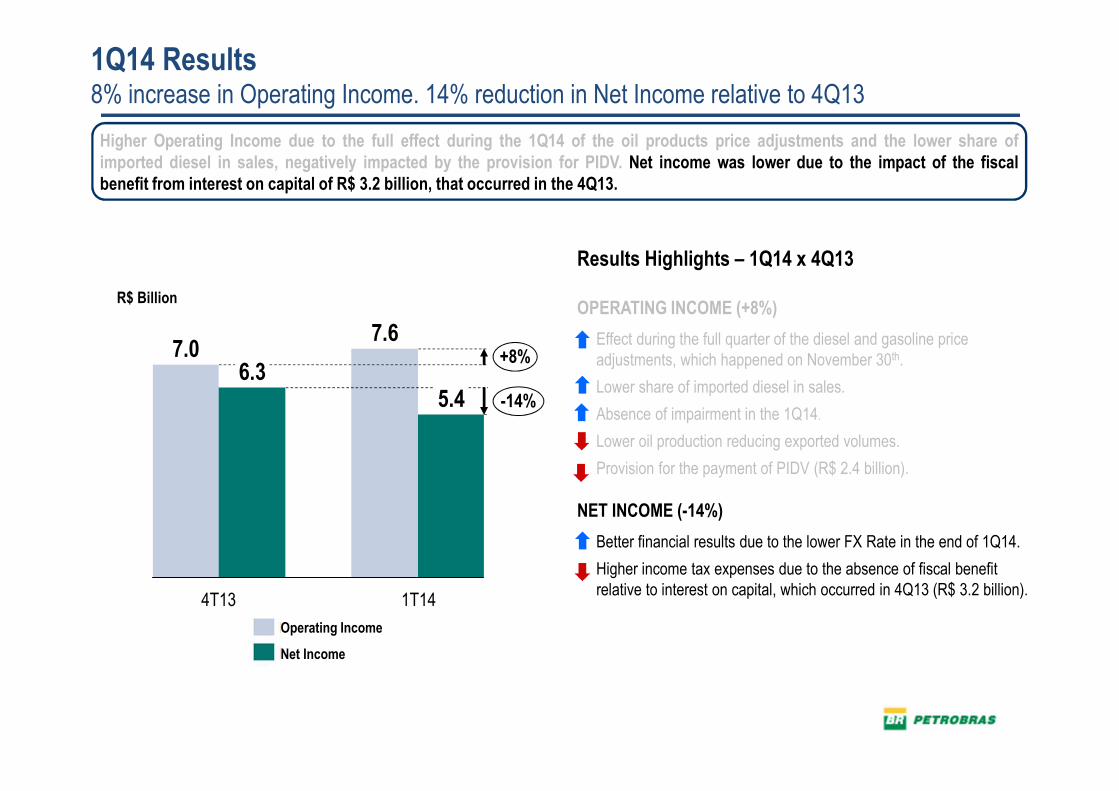
1Q14 Results8% increase in Operating Income. 14% reduction in Net Income relative to 4Q13
-14%5.4
+8%7.6
6.37.0
R$ Billion
4T13 1T14
Results Highlights – 1Q14 x 4Q13
OPERATING INCOME (+8%)
� Effect during the full quarter of the diesel and gasoline price adjustments, which happened on November 30th.
� Lower share of imported diesel in sales.
� Absence of impairment in the 1Q14.
� Lower oil production reducing exported volumes.
� Provision for the payment of PIDV (R$ 2.4 billion).
NET INCOME (-14%)
� Better financial results due to the lower FX Rate in the end of 1Q14.
� Higher income tax expenses due to the absence of fiscal benefit relative to interest on capital, which occurred in 4Q13 (R$ 3.2 billion).
Higher Operating Income due to the full effect during the 1Q14 of the oil products price adjustments and the lower share ofimported diesel in sales, negatively impacted by the provision for PIDV. Net income was lower due to the impact of the fiscalbenefit from interest on capital of R$ 3.2 billion, that occurred in the 4Q13.
Operating Income
Net Income
FPSO Cid. São Paulo(Sapinhoá)
2,150
2,100
2,050
2,000
1,950
1,900
1,850
2,200
2,022
Aug-13
1,951
Jul-13 Mar-14Jun-13
2,021
May-13
1,925
Apr-13
1,929
1,974
Mar-13
1,890
1,955
Jan-13
1,994
Feb-13 Sep-13
2,014
Feb-14
2,009
Jan-14
1,988
Dec-13
2,027
Nov-13
2,009
Oct-13
1,994
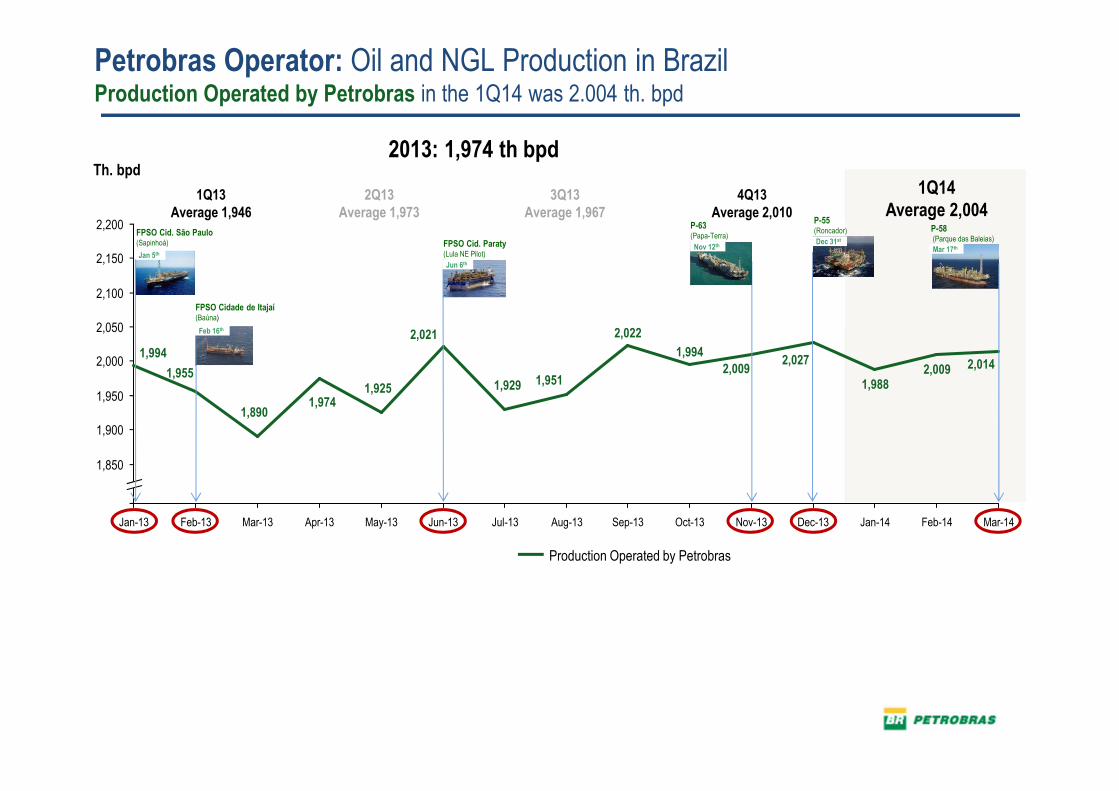
Th. bpd2013: 1,974 th bpd
1Q13Average 1,946
2Q13Average 1,973
4Q13Average 2,010
1Q14Average 2,004
3Q13Average 1,967
P-58(Parque das Baleias)
P-55(Roncador)
P-63(Papa-Terra)
Nov 12thFPSO Cid. Paraty(Lula NE Pilot)
FPSO Cidade de Itajaí(Baúna)
Feb 16th
Jan 5thMar 17th
Dec 31st
Production Operated by PetrobrasPetrobras Production
Jun 6th
Petrobras Operator: Oil and NGL Production in BrazilProduction Operated by Petrobras in the 1Q14 was 2.004 th. bpd
FPSO Cid. São Paulo(Sapinhoá)
2,200
2,000
2,100
2,050
2,150
1,850
1,950
1,900
1,974
1,924
Mar-13
1,890
1,846
Fev-13
1,955
Jan-13
1,994
1,965
Jan-14
2,009
1,920 1,923
Dec-13
1,926
Mar-14
1,964
Feb-14
1,917
2,014
Apr-13
1,892
Nov-13
1,957
2,027
1,988
Oct-13
1,925
1,994
1,960
Sep-13
2,022
1,979
Aug-13
1,9512,009
Jul-13
1,929
1,888
Jun-13
2,021
1,979
May-13
1,908
Th. bpd
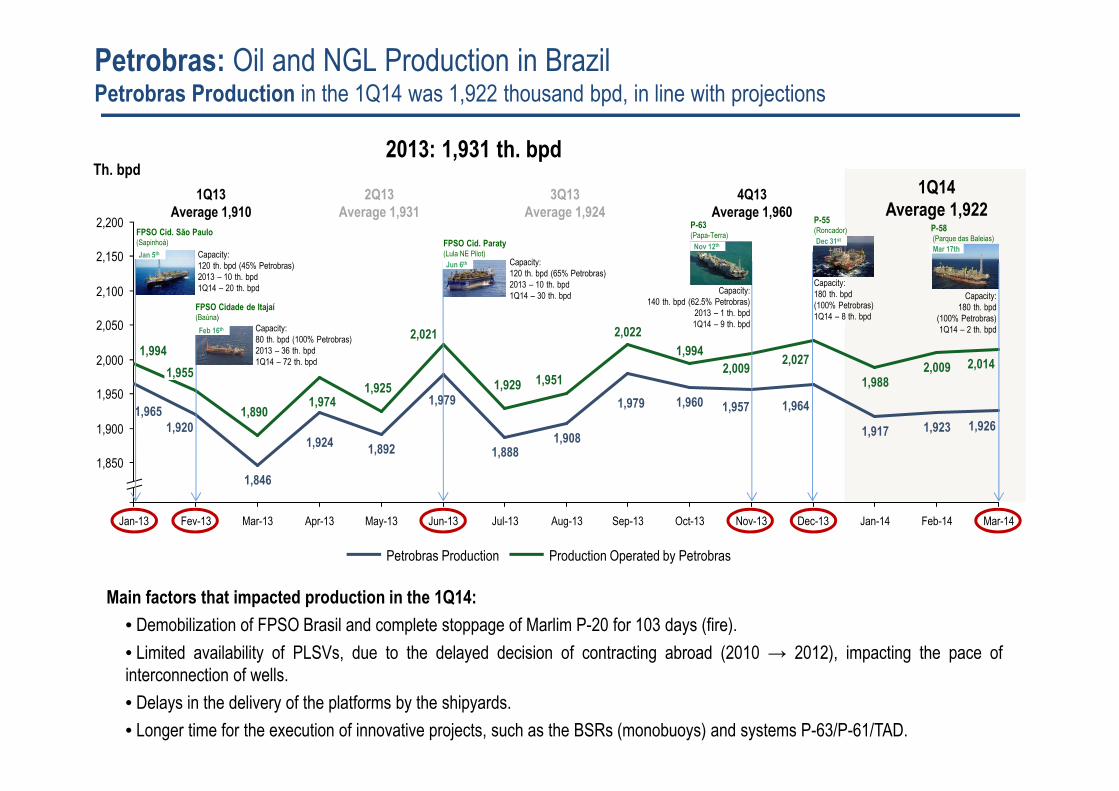
Petrobras: Oil and NGL Production in BrazilPetrobras Production in the 1Q14 was 1,922 thousand bpd, in line with projections
1Q13Average 1,910
2Q13Average 1,931
4Q13Average 1,960
1Q14Average 1,922
3Q13Average 1,924
P-58(Parque das Baleias)
P-55(Roncador)
P-63(Papa-Terra)
Nov 12thFPSO Cid. Paraty(Lula NE Pilot)
FPSO Cidade de Itajaí(Baúna)
Feb 16th
Jan 5thMar 17th
Dec 31st
Capacity:120 th. bpd (45% Petrobras)2013 – 10 th. bpd1Q14 – 20 th. bpd
Capacity:80 th. bpd (100% Petrobras)2013 – 36 th. bpd1Q14 – 72 th. bpd
Capacity:120 th. bpd (65% Petrobras)2013 – 10 th. bpd1Q14 – 30 th. bpd
Capacity:140 th. bpd (62.5% Petrobras)
2013 – 1 th. bpd1Q14 – 9 th. bpd
Capacity:180 th. bpd (100% Petrobras)1Q14 – 8 th. bpd
Capacity:180 th. bpd
(100% Petrobras)1Q14 – 2 th. bpd
Petrobras Production Production Operated by Petrobras
Jun 6th
Main factors that impacted production in the 1Q14:
• Demobilization of FPSO Brasil and complete stoppage of Marlim P-20 for 103 days (fire).
• Limited availability of PLSVs, due to the delayed decision of contracting abroad (2010 → 2012), impacting the pace ofinterconnection of wells.
• Delays in the delivery of the platforms by the shipyards.
• Longer time for the execution of innovative projects, such as the BSRs (monobuoys) and systems P-63/P-61/TAD.
2013: 1,931 th. bpd
302
169
119
41153
444
0
50
100
150
200
250
300
350
400
450
20122011 2014201320102009200820072006200520042003
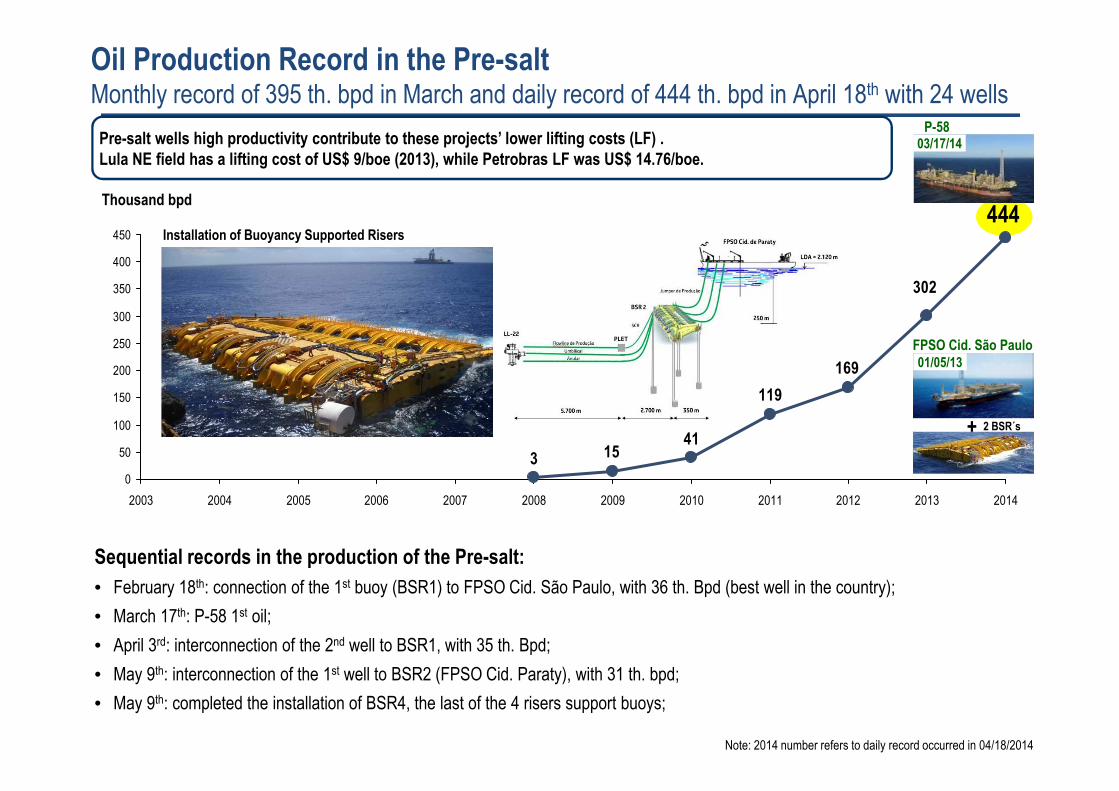
Oil Production Record in the Pre-saltMonthly record of 395 th. bpd in March and daily record of 444 th. bpd in April 18th with 24 wells
Thousand bpd
Note: 2014 number refers to daily record occurred in 04/18/2014
P-5803/17/14
FPSO Cid. São Paulo01/05/13
+
Installation of Buoyancy Supported Risers
Pre-salt wells high productivity contribute to these projects’ lower lifting costs (LF) .Lula NE field has a lifting cost of US$ 9/boe (2013), while Petrobras LF was US$ 14.76/boe.
2 BSR´s
Sequential records in the production of the Pre-salt:
• February 18th: connection of the 1st buoy (BSR1) to FPSO Cid. São Paulo, with 36 th. Bpd (best well in the country);
• March 17th: P-58 1st oil;
• April 3rd: interconnection of the 2nd well to BSR1, with 35 th. Bpd;
• May 9th: interconnection of the 1st well to BSR2 (FPSO Cid. Paraty), with 31 th. bpd;
• May 9th: completed the installation of BSR4, the last of the 4 risers support buoys;
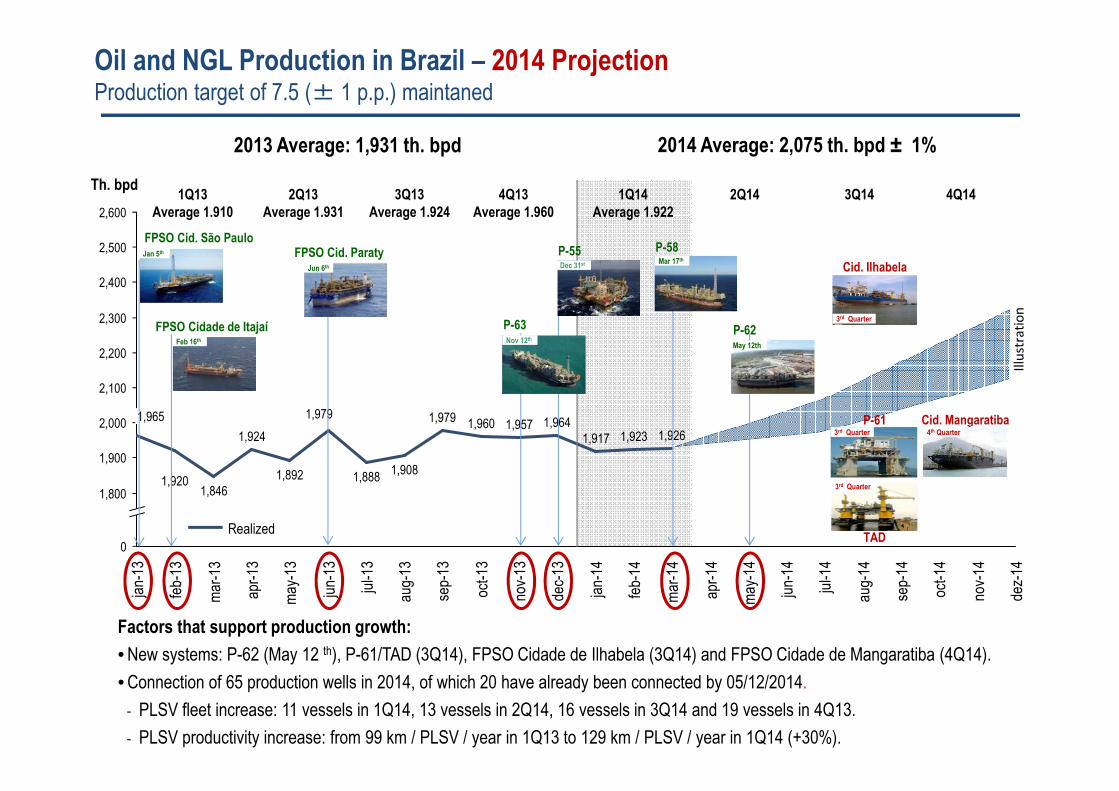
Oil and NGL Production in Brazil – 2014 ProjectionProduction target of 7.5 (± 1 p.p.) maintaned
2Q14 3Q14 4Q14
2014 Average: 2,075 th. bpd ± 1%
Factors that support production growth:
• New systems: P-62 (May 12 th), P-61/TAD (3Q14), FPSO Cidade de Ilhabela (3Q14) and FPSO Cidade de Mangaratiba (4Q14).
• Connection of 65 production wells in 2014, of which 20 have already been connected by 05/12/2014.
- PLSV fleet increase: 11 vessels in 1Q14, 13 vessels in 2Q14, 16 vessels in 3Q14 and 19 vessels in 4Q13.
- PLSV productivity increase: from 99 km / PLSV / year in 1Q13 to 129 km / PLSV / year in 1Q14 (+30%).
Th. bpd
2,400
2,600
2,500
2,300
2,200
2,100
2,000
1,900
1,800
0
jul-1
4
may
-14
aug-
14
jun-
14
apr-
14
oct-
14
dez-
14
nov-
14
sep-
14
mar
-14
1,926
feb-
14
1,923
jan-
14
1,917
dec-
13
1,964
nov-
13
1,957
oct-
13
1,960
sep-
13
1,979au
g-13
1,908
jul-1
3
1,888
jun-
13
1,979
may
-13
1,892
apr-
13
1,924
mar
-13
1,846
feb-
13
1,920
jan-
13
1,965
2Q13Average 1.931
3Q13Average 1.924
4Q13Average 1.960
2013 Average: 1,931 th. bpd
1Q13Average 1.910
1Q14Average 1.922
P-62
Realized
FPSO Cid. São PauloFPSO Cid. Paraty
FPSO Cidade de Itajaí
Jan 5th P-55
P-63
Cid. Ilhabela
Cid. Mangaratiba4th Quarter
3rd Quarter
3rd Quarter
3rd Quarter
P-61
TAD
P-58
May 12th
Jun 6th
Feb 16th Nov 12th
Dec 31st Mar 17th
3rd Quarter
Illustration
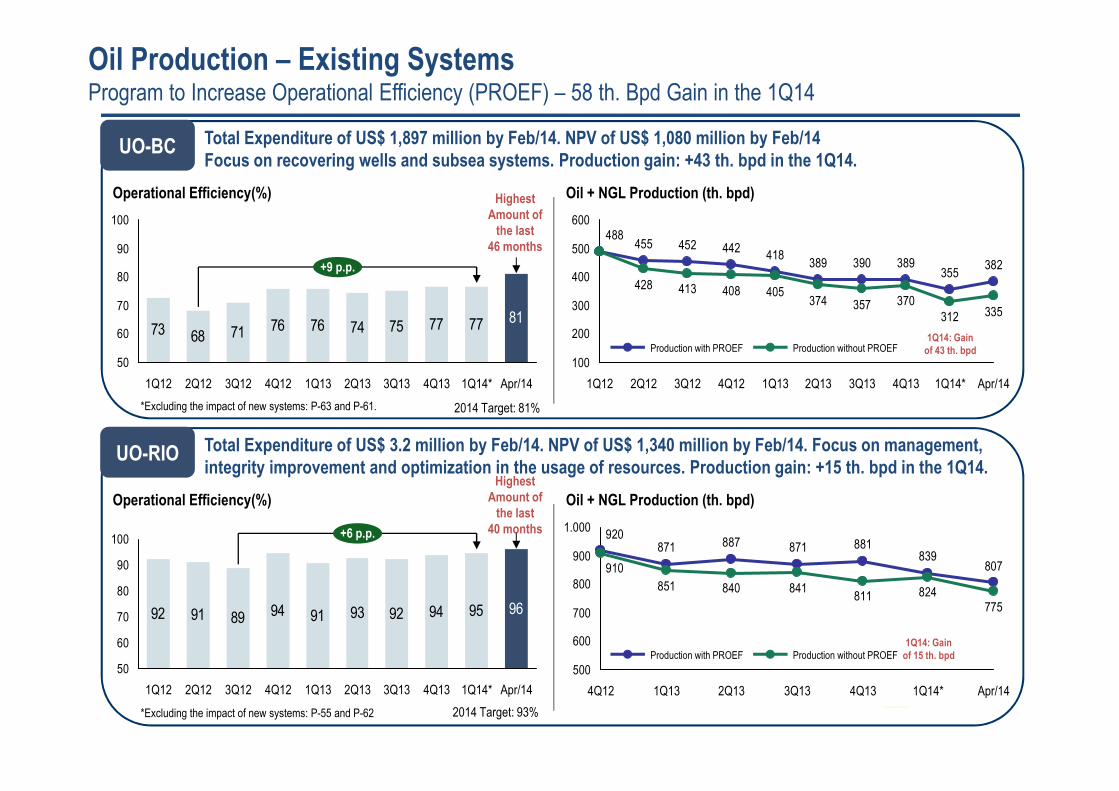
Oil Production – Existing SystemsProgram to Increase Operational Efficiency (PROEF) – 58 th. Bpd Gain in the 1Q14
UO-BC
Oil + NGL Production (th. bpd) Operational Efficiency(%)
73 68 71 76 76 74 75 77 77 81
50
60
70
80
90
100
+9 p.p.
Apr/141Q14*4Q133Q132Q131Q134Q123Q122Q121Q12
382355
389390389418
442452455488
335312370357374
405408413428
100
200
300
400
500
600
Apr/141Q14*4Q133Q132Q131Q134Q123Q122Q121Q12
Production without PROEFProduction with PROEF
Total Expenditure of US$ 1,897 million by Feb/14. NPV of US$ 1,080 million by Feb/14Focus on recovering wells and subsea systems. Production gain: +43 th. bpd in the 1Q14.
*Excluding the impact of new systems: P-63 and P-61.
1Q14: Gainof 43 th. bpd
UO-RIO
Oil + NGL Production (th. bpd) Operational Efficiency(%)
92 91 89 94 91 93 92 94 95 96
50
60
70
80
90
100 +6 p.p.
Apr/141Q14*4Q133Q132Q131Q134Q123Q122Q121Q12
807839
881871887871920
775824811
841840851
910
500
600
700
800
900
1.000
Apr/141Q14*4Q133Q132Q131Q134Q12
Production without PROEFProduction with PROEF
Total Expenditure of US$ 3.2 million by Feb/14. NPV of US$ 1,340 million by Feb/14. Focus on management, integrity improvement and optimization in the usage of resources. Production gain: +15 th. bpd in the 1Q14.
*Excluding the impact of new systems: P-55 and P-62
1Q14: Gainof 15 th. bpd
2014 Target: 93%
2014 Target: 81%
HighestAmount of
the last46 months
HighestAmount of
the last40 months
10
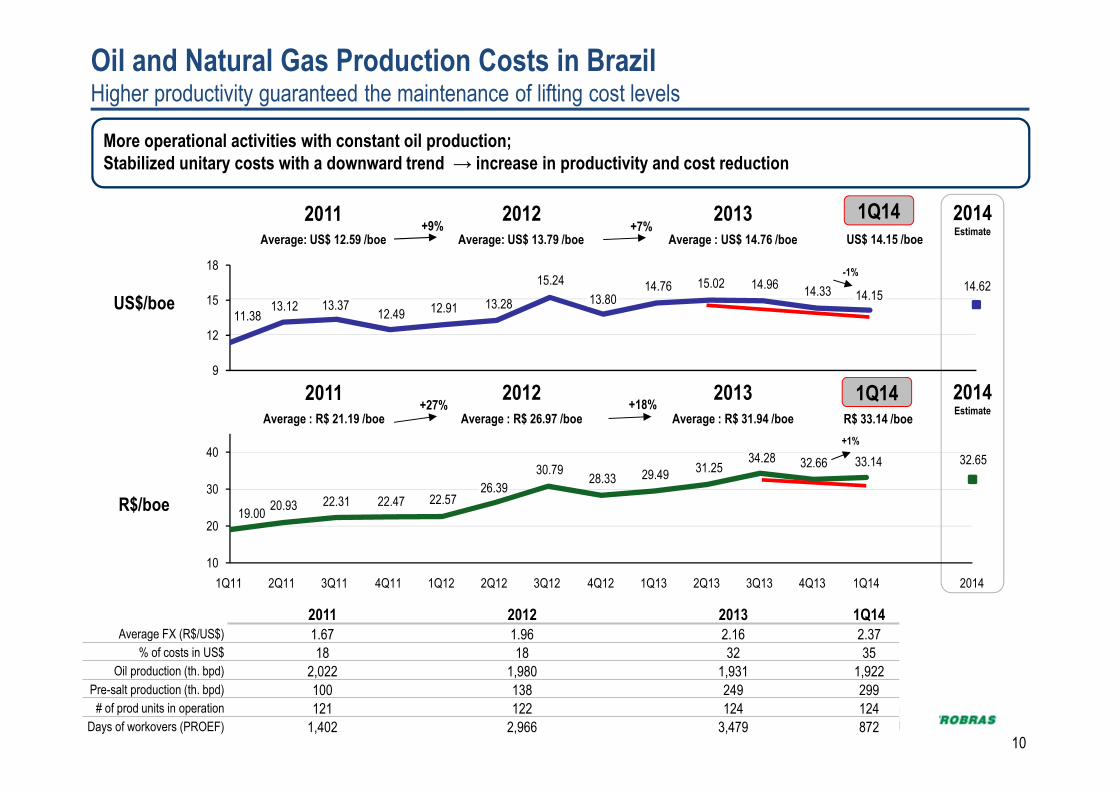
Oil and Natural Gas Production Costs in BrazilHigher productivity guaranteed the maintenance of lifting cost levels
1Q14
More operational activities with constant oil production;Stabilized unitary costs with a downward trend → increase in productivity and cost reduction
11.3813.12
12.49 12.91 13.28
15.24 14.76 15.02 14.9614.33 14.62
9
12
15
18
13.37 13.80 14.15
2012 20132011
19.0020.93 22.31 22.47 22.57
30.7928.33 29.49
31.2534.28 32.66 33.14 32.65
10
20
30
40
2Q124Q113Q11 1Q122Q111Q11 3Q12
26.39
20141Q144Q133Q132Q131Q134Q12
US$/boe
2014Estimate
R$/boe
Average: US$ 12.59 /boe Average: US$ 13.79 /boe Average : US$ 14.76 /boe+9% +7%
US$ 14.15 /boe
2012 20132011 2014Estimate
Average : R$ 21.19 /boe Average : R$ 26.97 /boe Average : R$ 31.94 /boe+27% +18%
R$ 33.14 /boe
2011 2012 2013 1Q14Average FX (R$/US$) 1.67 1.96 2.16 2.37
% of costs in US$ 18 18 32 35Oil production (th. bpd) 2,022 1,980 1,931 1,922
Pre-salt production (th. bpd) 100 138 249 299# of prod units in operation 121 122 124 124
Days of workovers (PROEF) 1,402 2,966 3,479 872
1Q14
-1%
+1%
11
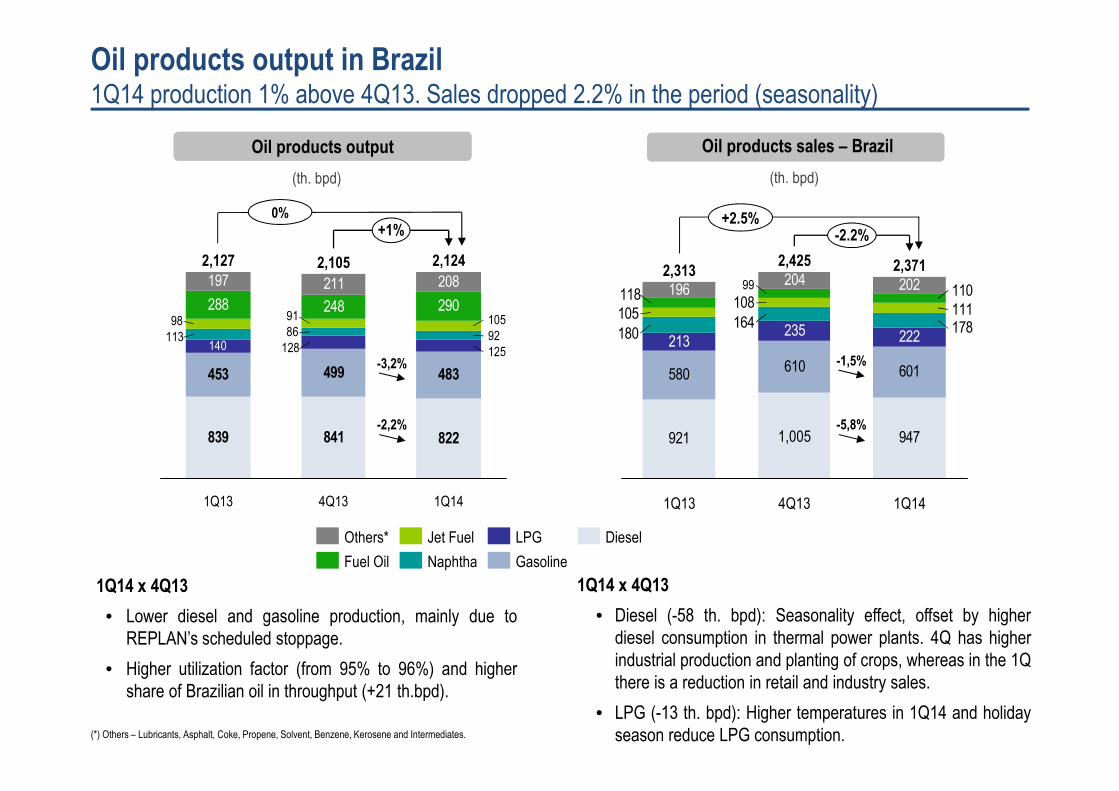
Oil products output in Brazil1Q14 production 1% above 4Q13. Sales dropped 2.2% in the period (seasonality)
1Q14 x 4Q13
• Lower diesel and gasoline production, mainly due toREPLAN’s scheduled stoppage.
• Higher utilization factor (from 95% to 96%) and highershare of Brazilian oil in throughput (+21 th.bpd).
Oil products output
0%
839 841 822
453 499 483
288 248 290
197 211 208
1251281409286113
1059198
2,127
1Q13
+1%
1Q14
2,124
4Q13
2,105
-2,2%
-3,2%
Oil products sales – Brazil
LPG Diesel
Gasoline
Jet Fuel
NaphthaFuel Oil
Others*
(th. bpd)(th. bpd)
921 947
580610 601
213235 222
196204 202
178164180
111108105
11011899
1Q14
2,371
-2.2%
4Q13
2,425
1,005
1Q13
2,313
+2.5%
-5,8%
-1,5%
1Q14 x 4Q13
• Diesel (-58 th. bpd): Seasonality effect, offset by higherdiesel consumption in thermal power plants. 4Q has higherindustrial production and planting of crops, whereas in the 1Qthere is a reduction in retail and industry sales.
• LPG (-13 th. bpd): Higher temperatures in 1Q14 and holidayseason reduce LPG consumption.(*) Others – Lubricants, Asphalt, Coke, Propene, Solvent, Benzene, Kerosene and Intermediates.
12
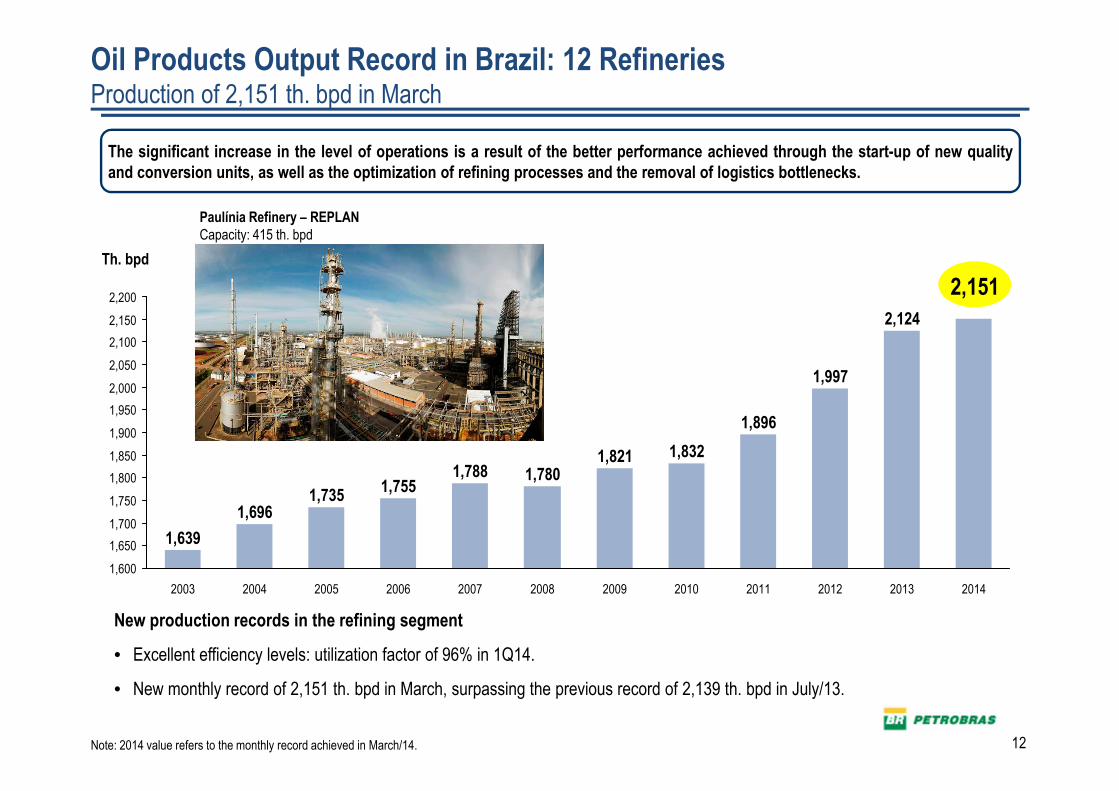
Oil Products Output Record in Brazil: 12 RefineriesProduction of 2,151 th. bpd in March
2,200
2,150
2,100
2,050
2,000
1,950
1,900
1,850
1,800
1,750
1,700
1,650
1,600
20142013
2,124
2012
1,997
2011
1,896
2010
1,832
2009
1,821
2008
1,780
2007
1,788
2006
1,755
2005
1,735
2004
1,696
2003
1,639
Note: 2014 value refers to the monthly record achieved in March/14.
Th. bpd
2,151
New production records in the refining segment
• Excellent efficiency levels: utilization factor of 96% in 1Q14.
• New monthly record of 2,151 th. bpd in March, surpassing the previous record of 2,139 th. bpd in July/13.
Paulínia Refinery – REPLANCapacity: 415 th. bpd
The significant increase in the level of operations is a result of the better performance achieved through the start-up of new qualityand conversion units, as well as the optimization of refining processes and the removal of logistics bottlenecks.
13
3.47 3.914.20
3.83
3.143.37
3.14 3.083.26
2.88 2.75 2.83
2
3
4
5
6
3.503.74
2012 20132011
5.806.25
7.00 6.946.60
6.256.98
6.24 6.37 6.62 6.486.63
4
6
8
10
4Q13 1Q14 20141Q134Q123Q12
7.07
2Q121Q124Q113Q112Q111Q11
7.45
3Q132Q13
US$/bbl
R$/bbl
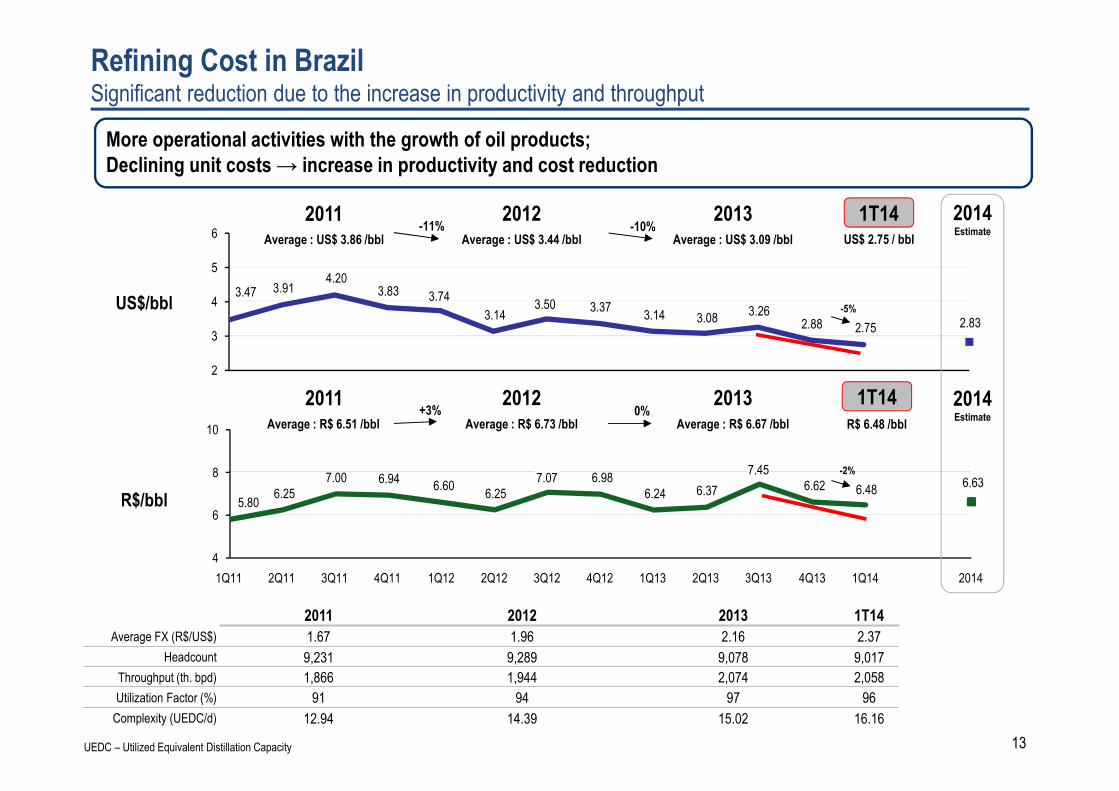
Average : US$ 3.86 /bbl Average : US$ 3.44 /bbl Average : US$ 3.09 /bbl-11% -10%
US$ 2.75 / bbl
2012 20132011Average : R$ 6.51 /bbl Average : R$ 6.73 /bbl Average : R$ 6.67 /bbl
+3% 0%R$ 6.48 /bbl
Refining Cost in BrazilSignificant reduction due to the increase in productivity and throughput
More operational activities with the growth of oil products;Declining unit costs → increase in productivity and cost reduction
2011 2012 2013 1T14
Average FX (R$/US$) 1.67 1.96 2.16 2.37
Headcount 9,231 9,289 9,078 9,017
Throughput (th. bpd) 1,866 1,944 2,074 2,058
Utilization Factor (%) 91 94 97 96
Complexity (UEDC/d) 12.94 14.39 15.02 16.16
1T14
1T14
-5%
-2%
2014Estimate
2014Estimate
UEDC – Utilized Equivalent Distillation Capacity
14
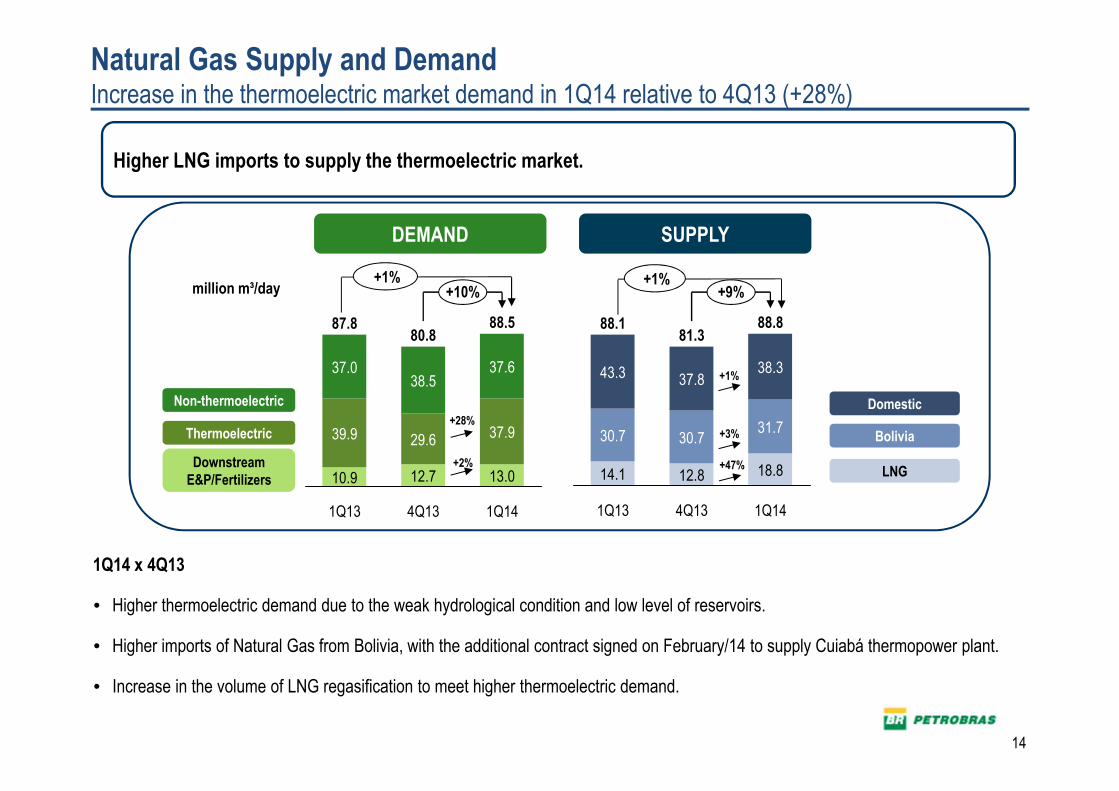
Natural Gas Supply and DemandIncrease in the thermoelectric market demand in 1Q14 relative to 4Q13 (+28%)
Higher LNG imports to supply the thermoelectric market.
1Q14 x 4Q13
• Higher thermoelectric demand due to the weak hydrological condition and low level of reservoirs.
• Higher imports of Natural Gas from Bolivia, with the additional contract signed on February/14 to supply Cuiabá thermopower plant.
• Increase in the volume of LNG regasification to meet higher thermoelectric demand.
million m³/day
SUPPLYDEMAND
40,2
37,0
11,7
39,3
+1% +1% +10%
1Q14
88.5
13.0
37.9
37.6
4Q13
80.8
12.7
29.6
38.5
1Q13
87.8
10.9
39.9
37.0 38.3
4Q13
88.8
18.8
31.7
+9%
1Q14
81.3
12.8
30.7
37.8
1Q13
88.1
14.1
30.7
43.3
+28%
+2%
+3%
+47%
+1%
39,9
Non-thermoelectric
Thermoelectric
Downstream E&P/Fertilizers
Domestic
Bolivia
LNG
15
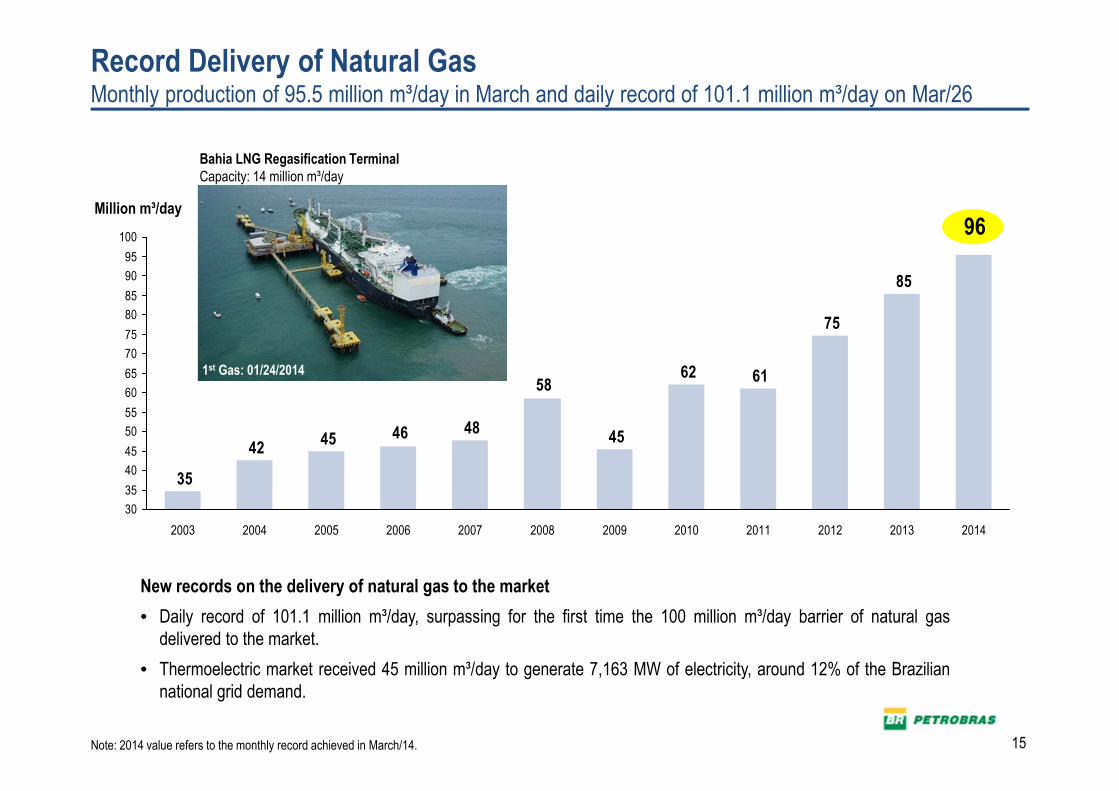
Record Delivery of Natural GasMonthly production of 95.5 million m³/day in March and daily record of 101.1 million m³/day on Mar/26
85
75
6162
45
58
48464542
35
30
35
40
45
50
55
60
65
70
75
80
85
90
95
100
201420132012201120102009200820072006200520042003
Note: 2014 value refers to the monthly record achieved in March/14.
Million m³/day
96
New records on the delivery of natural gas to the market
• Daily record of 101.1 million m³/day, surpassing for the first time the 100 million m³/day barrier of natural gasdelivered to the market.
• Thermoelectric market received 45 million m³/day to generate 7,163 MW of electricity, around 12% of the Braziliannational grid demand.
Bahia LNG Regasification TerminalCapacity: 14 million m³/day
1st Gas: 01/24/2014
16
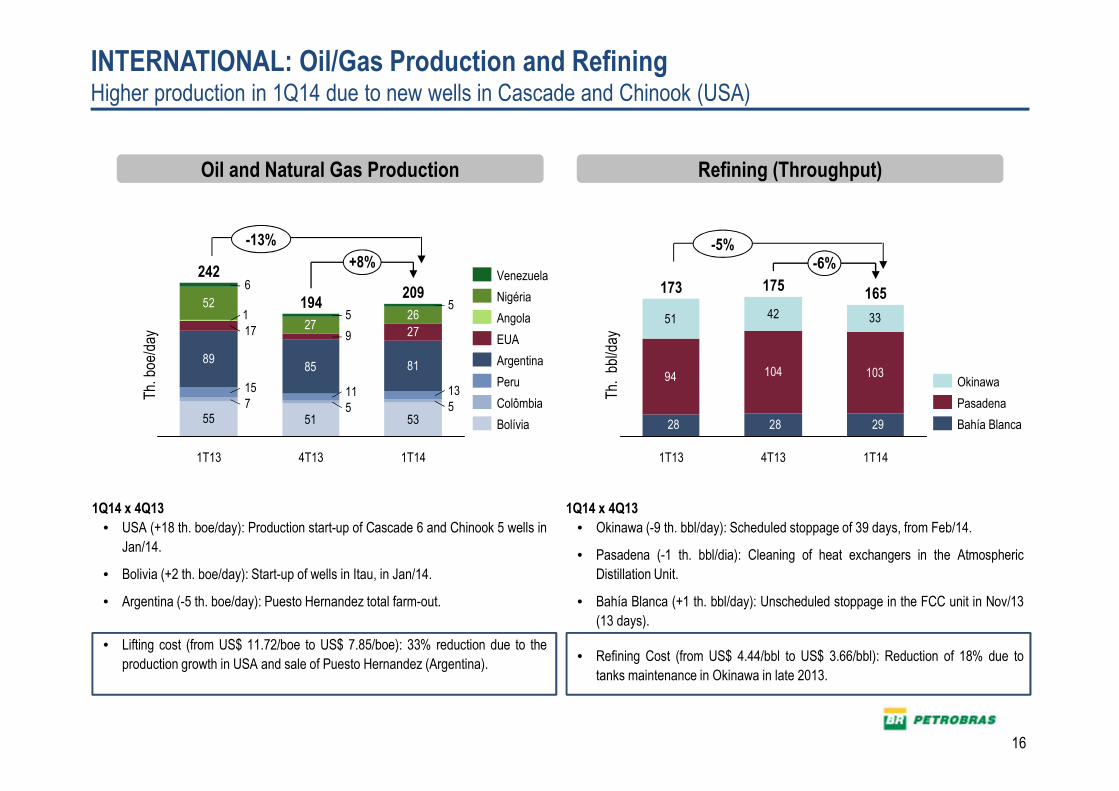
INTERNATIONAL: Oil/Gas Production and RefiningHigher production in 1Q14 due to new wells in Cascade and Chinook (USA)
Oil and Natural Gas Production Refining (Throughput)
Th.
bbl
/day
94 104 103
51 42 33
292828
-6%
1T14
165
4T13
175
1T13
173
Bahía Blanca
Pasadena
Okinawa
-5%
1Q14 x 4Q13
• USA (+18 th. boe/day): Production start-up of Cascade 6 and Chinook 5 wells in
Jan/14.
• Bolivia (+2 th. boe/day): Start-up of wells in Itau, in Jan/14.
• Argentina (-5 th. boe/day): Puesto Hernandez total farm-out.
• Lifting cost (from US$ 11.72/boe to US$ 7.85/boe): 33% reduction due to the
production growth in USA and sale of Puesto Hernandez (Argentina).
1Q14 x 4Q13
• Okinawa (-9 th. bbl/day): Scheduled stoppage of 39 days, from Feb/14.
• Pasadena (-1 th. bbl/dia): Cleaning of heat exchangers in the Atmospheric
Distillation Unit.
• Bahía Blanca (+1 th. bbl/day): Unscheduled stoppage in the FCC unit in Nov/13
(13 days).
• Refining Cost (from US$ 4.44/bbl to US$ 3.66/bbl): Reduction of 18% due to
tanks maintenance in Okinawa in late 2013.
55 51 53
8985 81
52
2726
557131115
917 27
15
5
6
+8%
1T14
209
4T13
194
1T13
242
Bolívia
Colômbia
Peru
Argentina
EUA
Angola
Nigéria
Venezuela
Th.
boe
/day
-13%
17
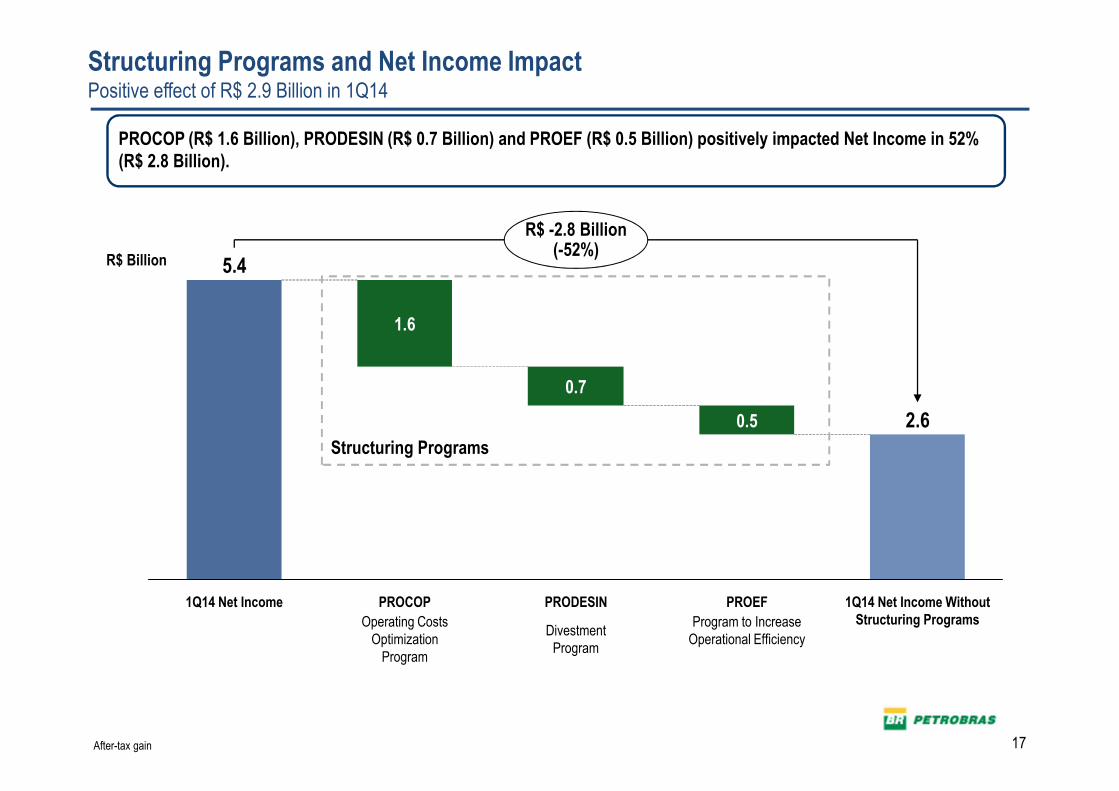
Structuring Programs and Net Income ImpactPositive effect of R$ 2.9 Billion in 1Q14
0.5
PRODESIN
0.7
PROCOP
1.6
1Q14 Net Income
5.4
R$ -2.8 Billion(-52%)
1Q14 Net Income Without Structuring Programs
2.6
PROEF
R$ Billion
PROCOP (R$ 1.6 Billion), PRODESIN (R$ 0.7 Billion) and PROEF (R$ 0.5 Billion) positively impacted Net Income in 52% (R$ 2.8 Billion).
Structuring Programs
Divestment Program
Operating Costs Optimization
Program
Program to IncreaseOperational Efficiency
After-tax gain
18
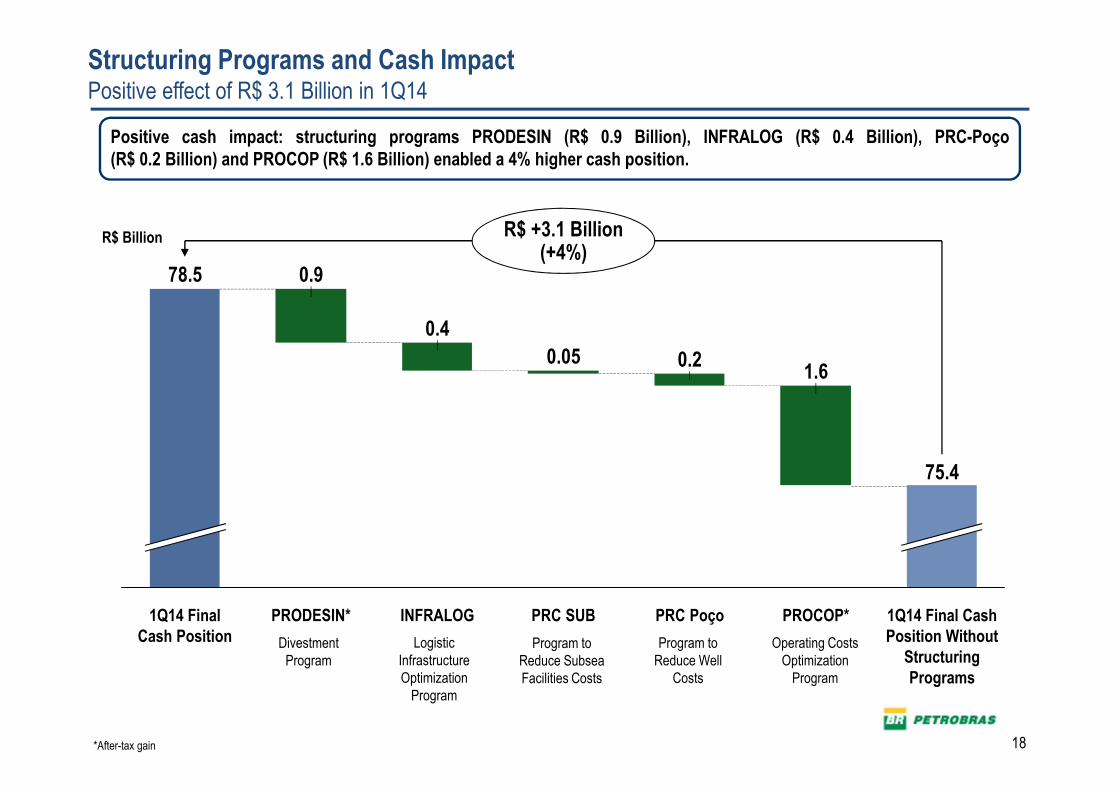
Positive cash impact: structuring programs PRODESIN (R$ 0.9 Billion), INFRALOG (R$ 0.4 Billion), PRC-Poço(R$ 0.2 Billion) and PROCOP (R$ 1.6 Billion) enabled a 4% higher cash position.
INFRALOG
0.4
PRODESIN*
0.9
PROCOP* 1Q14 Final Cash Position Without
Structuring Programs
0.2
PRC SUB PRC Poço
R$ +3.1 Billion (+4%)
1.6
75.4
78.5
1Q14 Final Cash Position
0.05
*After-tax gain
R$ Billion
Structuring Programs and Cash ImpactPositive effect of R$ 3.1 Billion in 1Q14
Divestment Program
Program to Reduce Subsea Facilities Costs
Program to Reduce Well
Costs
Operating Costs Optimization
Program
Logistic Infrastructure Optimization
Program
19
3,52
4,00
39% 39%
-10%
0%
10%
20%
30%
40%
50%
1,5
2,5
3,5
4,5
4Q13 1Q14
Net Debt / EBITDA ¹Net Debt / Net Capitalization ²
LEV
ER
AG
E
ND
/ EB
ITD
A
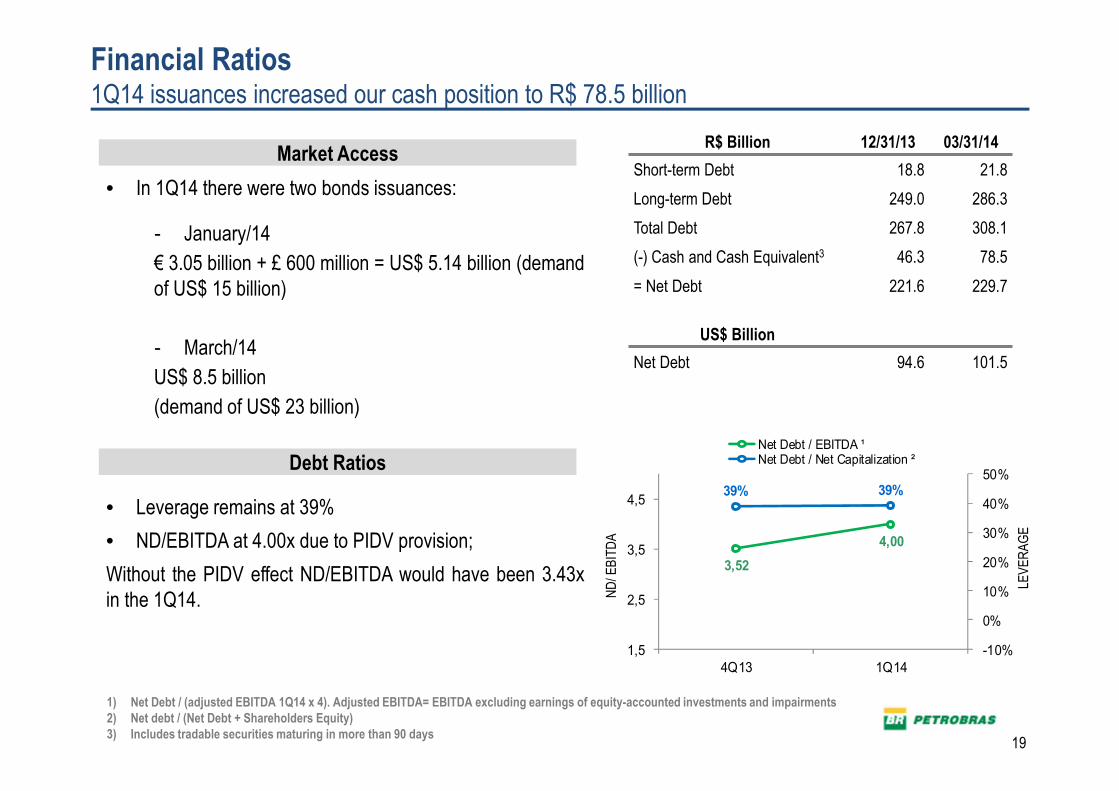
Financial Ratios1Q14 issuances increased our cash position to R$ 78.5 billion
• In 1Q14 there were two bonds issuances:
- January/14
€ 3.05 billion + £ 600 million = US$ 5.14 billion (demandof US$ 15 billion)
- March/14
US$ 8.5 billion
(demand of US$ 23 billion)
• Leverage remains at 39%
• ND/EBITDA at 4.00x due to PIDV provision;
Without the PIDV effect ND/EBITDA would have been 3.43xin the 1Q14.
Market Access
Debt Ratios
R$ Billion 12/31/13 03/31/14
Short-term Debt 18.8 21.8
Long-term Debt 249.0 286.3
Total Debt 267.8 308.1
(-) Cash and Cash Equivalent3 46.3 78.5
= Net Debt 221.6 229.7
US$ Billion
Net Debt 94.6 101.5
1) Net Debt / (adjusted EBITDA 1Q14 x 4). Adjusted EBITDA= EBITDA excluding earnings of equity-accounted investments and impairments 2) Net debt / (Net Debt + Shareholders Equity)3) Includes tradable securities maturing in more than 90 days
20
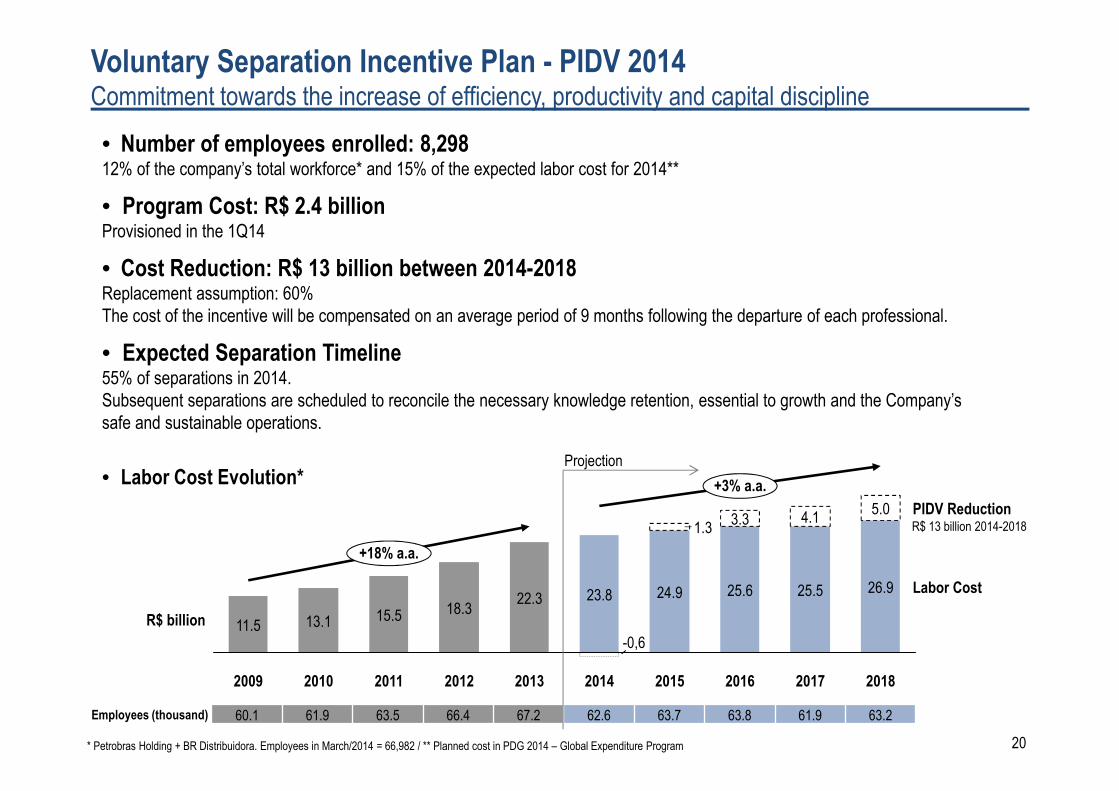
• Number of employees enrolled: 8,29812% of the company’s total workforce* and 15% of the expected labor cost for 2014**
• Program Cost: R$ 2.4 billionProvisioned in the 1Q14
• Cost Reduction: R$ 13 billion between 2014-2018Replacement assumption: 60% The cost of the incentive will be compensated on an average period of 9 months following the departure of each professional.
• Expected Separation Timeline55% of separations in 2014. Subsequent separations are scheduled to reconcile the necessary knowledge retention, essential to growth and the Company’s safe and sustainable operations.
• Labor Cost Evolution*
* Petrobras Holding + BR Distribuidora. Employees in March/2014 = 66,982 / ** Planned cost in PDG 2014 – Global Expenditure Program
Voluntary Separation Incentive Plan - PIDV 2014Commitment towards the increase of efficiency, productivity and capital discipline
2009
11.5
2010
13.118.3
2011
15.5
PIDV Reduction
26.9
2012
+3% a.a.
5.0
2015
25.6
2016
25.524.9
4.13.3
Labor Cost
2017
+18% a.a.
2018
1.3
2014
23.8
2013
22.3
R$ billion
Employees (thousand) 60.1 61.9 63.5 66.4 67.2 62.6 63.7 63.8 61.9 63.2
R$ 13 billion 2014-2018
-0,6
Projection
21
Information:
Investor Relations
+55 21 3224-1510
OPERATIONAL AND FINANCIAL RESULTS1st Quarter 2014__