weather radar observations of the hekla 2000 eruption...
TRANSCRIPT

Bull Volcanol (2004) 66:457–473DOI 10.1007/s00445-003-0329-3
R E S E A R C H A R T I C L E
C. Lacasse · S. Karlsd�ttir · G. Larsen · H. Soosalu ·W. I. Rose · G. G. J. Ernst
Weather radar observations of the Hekla 2000 eruption cloud, Iceland
Received: 10 May 2003 / Accepted: 23 October 2003 / Published online: 12 December 2003� Springer-Verlag 2003
Abstract The Hekla eruption cloud on 26–27 February2000 was the first volcanic cloud to be continuously andcompletely monitored advecting above Iceland, using theC-band weather radar near the Keflav�k internationalairport. Real-time radar observations of the onset, advec-tion, and waning of the eruption cloud were studied usingtime series of PPI (plan-position indicator) radar images,including VMI normal, Echotop, and Cappi level 2
displays. The reflectivity of the entire volcanic cloudranges from 0 to >60 dBz. The eruption column above thevent is essentially characterised by VMI normal andCappi level 2 values, >30 dBz, due to the dominantinfluence of lapilli and ash (tephra) on the overallreflected signal. The cloud generated by the column wasadvected downwind to the north-northeast. It is charac-terised by values between 0 and 30 dBz, and thepersistence of these reflections likely result from contin-uing water condensation and freezing on ash particles.Echotop radar images of the eruption onset document arapid ascent of the plume head with a mean velocity of~30 to 50 m s�1, before it reached an altitude of ~11–12 km. The evolution of the reflected cloud was studiedfrom the area change in pixels of its highly reflectedportions, >30 dBz, and tied to recorded volcanic tremoramplitudes. The synchronous initial variation of bothradar and seismic signals documents the abrupt increasein tephra emission and magma discharge rate from 18:20to 19:00 UTC on 26 February. From 19:00 the >45 dBzand 30–45 dBz portions of the reflected cloud decreaseand disappear at about 7 and 10.5 h, respectively, after theeruption began, indicating the end of the decayingexplosive phase. The advection and extent of the reflectederuption cloud were compared with eyewitness accountsof tephra fall onset and the measured mass of tephradeposited on the ground during the first 12 h. Differencesin the deposit map and volcanic cloud radar map are dueto the fact that the greater part of the deposit originates byfallout off the column margins and from the base of thecloud followed by advection of falling particle in lowerlevel winds.
Keywords Hekla 2000 eruption · Iceland · Volcaniccloud · Radar observations · Tephra fall · Volcanictremor · Aircraft safety
Editorial responsibility: P. Mouginis-Mark
C. Lacasse ())Volcano Dynamics Group, Department of Earth Sciences,The Open University,Walton Hall, Milton Keynes, MK7 6AA, UKe-mail: [email protected].: +44-1908-652118Fax: +44-1908-655151
S. Karlsd�ttirIcelandic Meteorological Office,Bustadavegur 9, 150 Reykjav�k, Iceland
G. LarsenScience Institute,University of Iceland,Dunhaga 3, 107 Reykjav�k, Iceland
H. SoosaluNordic Volcanological Institute,Grens�svegur 50, 108 Reykjav�k, Iceland
W. I. Rose · G. G. J. ErnstDepartment of Geological Engineering and Sciences,Michigan Technological University,1400 Townsend Drive, Houghton, Michigan 49931, USA
G. G. J. ErnstCentre for Environmental and Geophysical Flows,Department of Earth Sciences,University of Bristol,Wills Memorial Building, Queen’s Road, Bristol, BS8 1RJ, UK
Present address:G. G. J. Ernst, Department of Geology and Soil Science,Research Centre for Eruption Dynamics,University of Ghent,Krijgslaan 281, S8, 9000, Ghent, Belgium
Introduction
In a recent paper by Grindle and Burcham (2002), theencounter of the Hekla 2000 eruption cloud with a NASAMcDonnell-Douglas DC8 research aircraft was reported,with the degree of damage being severe enough that allfour engines had to be refurbished. Although there wascontroversy about the interpretations at first [see discus-sion in Pieri et al. (2002)], atmospheric instrumentparticle sampling data and IR remote sensing reportedby Rose et al. (2003) and SEM analyses of aircraftventilation filters (Pieri et al. 2002) are all consistent withthere being volcanic ash in the encountered eruptioncloud. Rose et al. (2003) estimated the mass of fine ash atabout 100 kT. Ice nucleated on the surface of ash particlesand it is likely that most of the particle mass in the Heklaeruption cloud is ice [see Rose et al. (2003) for discussionon this topic]. This incident brought to attention the factthat complete avoidance of volcanic clouds is indeed theonly procedure that guarantees flight safety (Cantor1998). Volcanic eruptions in Iceland pose a major hazardto the traffic of jet aircraft in the subpolar North Atlantic-Arctic region, which is one of the most heavily traffickedair corridors in the world. Prior to this recent incident andin spite of eruptions occurring in Iceland once every 4 or5 years on average, no encounter between commercialaircraft and eruption clouds had been officially reportedin the region. On average, about 250 jet planes per day flyacross the Icelandic Oceanic Control Area (IOCA) in theNorth Atlantic and in favourable meteorological condi-tions this number can double (Sveinbj�rnsson 2001).Thus, there is an urgent need to improve the capability ofmeasuring and tracking volcanic clouds from Icelandusing radar and satellite remote sensing (see Rose et al.2003). The Hekla eruption cloud in January 1991 was thefirst to be detected over Iceland by the Keflav�k C-bandweather radar. The radar located near the internationalairport began operation a few days prior to the eruption(Larsen et al. 1992). However, as the Hekla 2000 radardata set is more complete than that of 1991, weconcentrate here instead on the 2000 eruption. The radardetected the Hekla 2000 eruption cloud and also com-prehensively monitored its advection and waning phasesabove Iceland. The data set is also the first extensive C-band radar data set of a volcanic cloud to be documentedwith such high time resolution, and provides new andunique constraints for the future evaluation of models onvolcanic plume dynamics and microphysics. This studymakes a strong case for a more extensive use of weatherradars in future monitoring and studies of volcanic cloudsand their dynamics. In this paper, we present the firstresults of real-time radar observations of the 2000 Heklaeruption cloud using the C-band Keflav�k weather radaroperated by the Icelandic Meteorological Office (IMO).Radar images of the eruption cloud, acquired every 5 minduring the first 12 h after the eruption’s onset at 18:17,were studied and compared with ground observations ofthe tephra fall (�rnason 2002; Haraldsson 2001; Haralds-son et al. 2002; G. Larsen, unpublished data, 2003) and
recorded volcanic tremor amplitudes (Soosalu et al. 2002;H. Soosalu, unpublished data, 2003). For consistency inour study we use the term “volcanic (eruption) cloud” togenerically refer to both the eruption column and thederived wind-advected cloud, whereas the term “volcanic(eruption) plume” was used to describe its buoyancy-dominated region (Sparks et al. 1997).
Specifications and detection limitsof the weather radar at Keflav�k, SW Iceland
Specifications
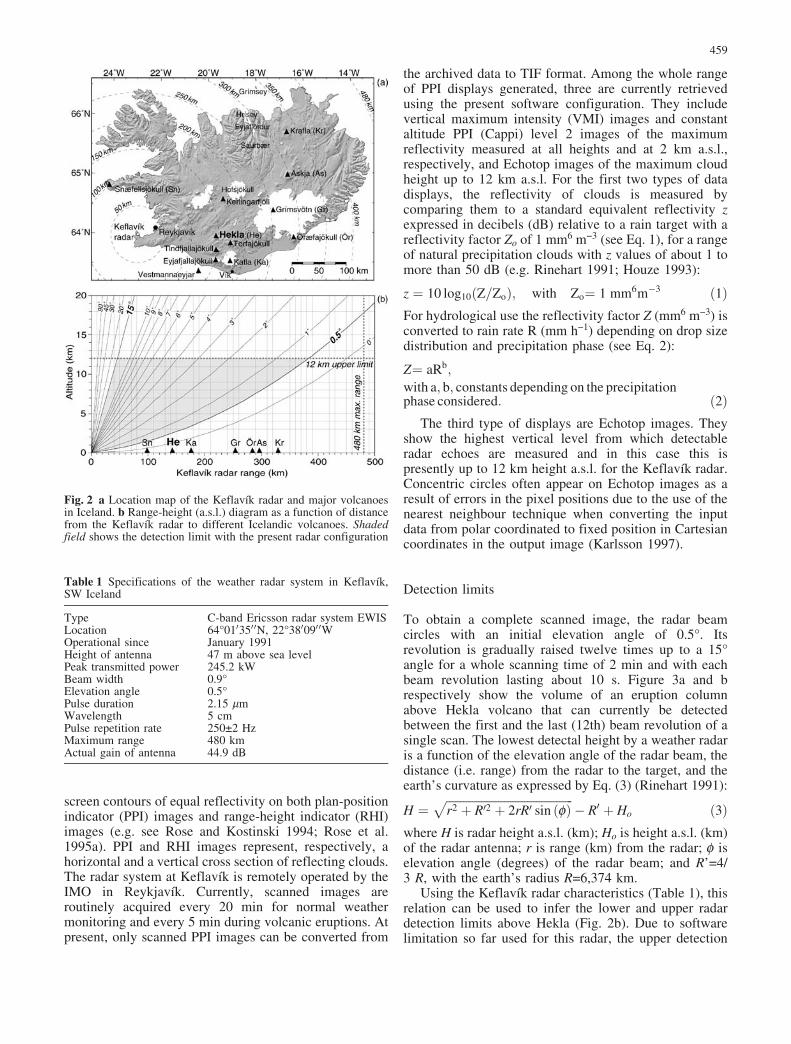
The weather radar is an Ericsson C-band radar (EWIS II).It is located about 3 km north of the Keflav�k internationalairport in southwest Iceland and has been in operationsince January 1991 (Figs. 1 and 2a). It monitors cloudcover and precipitation within a maximum radius of480 km from its location. Description and specificationsof the radar system are given in Table 1 and its range isillustrated in Fig. 2b. Weather radars usually display on-
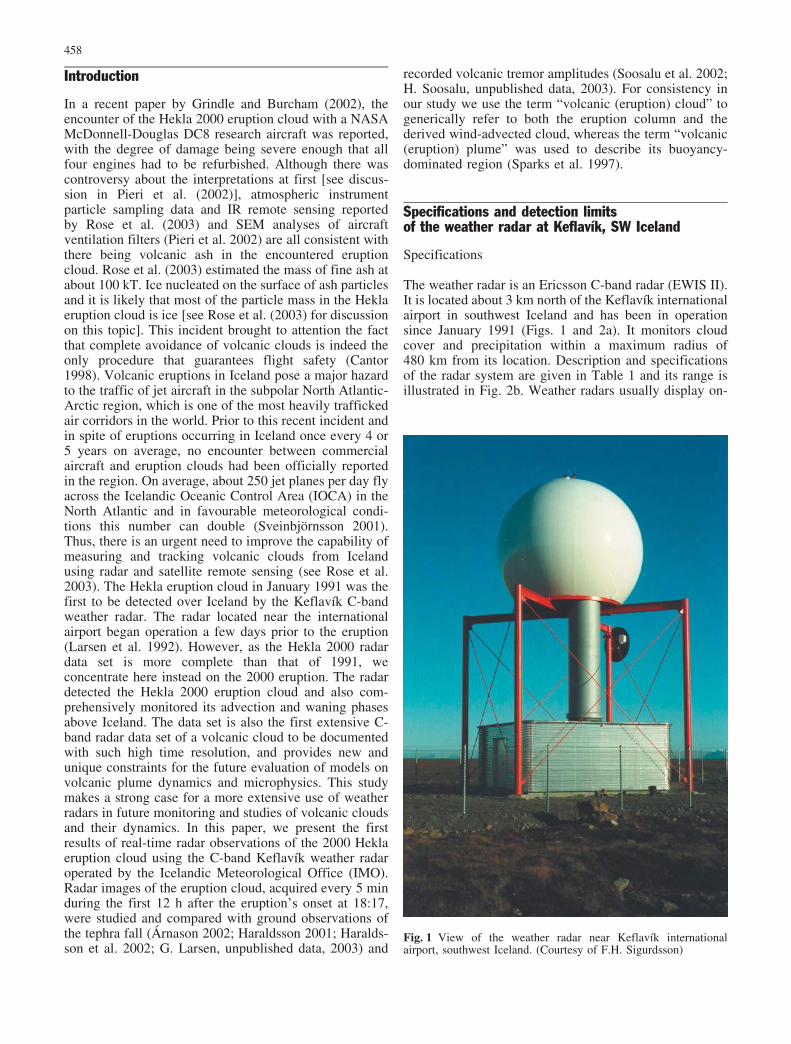
Fig. 1 View of the weather radar near Keflav�k internationalairport, southwest Iceland. (Courtesy of F.H. Sigurdsson)
458
screen contours of equal reflectivity on both plan-positionindicator (PPI) images and range-height indicator (RHI)images (e.g. see Rose and Kostinski 1994; Rose et al.1995a). PPI and RHI images represent, respectively, ahorizontal and a vertical cross section of reflecting clouds.The radar system at Keflav�k is remotely operated by theIMO in Reykjav�k. Currently, scanned images areroutinely acquired every 20 min for normal weathermonitoring and every 5 min during volcanic eruptions. Atpresent, only scanned PPI images can be converted from
the archived data to TIF format. Among the whole rangeof PPI displays generated, three are currently retrievedusing the present software configuration. They includevertical maximum intensity (VMI) images and constantaltitude PPI (Cappi) level 2 images of the maximumreflectivity measured at all heights and at 2 km a.s.l.,respectively, and Echotop images of the maximum cloudheight up to 12 km a.s.l. For the first two types of datadisplays, the reflectivity of clouds is measured bycomparing them to a standard equivalent reflectivity zexpressed in decibels (dB) relative to a rain target with areflectivity factor Zo of 1 mm6 m�3 (see Eq. 1), for a rangeof natural precipitation clouds with z values of about 1 tomore than 50 dB (e.g. Rinehart 1991; Houze 1993):
z ¼ 10 log10 Z=Zoð Þ; with Zo¼ 1 mm6m�3 ð1ÞFor hydrological use the reflectivity factor Z (mm6 m�3) isconverted to rain rate R (mm h�1) depending on drop sizedistribution and precipitation phase (see Eq. 2):
Z¼ aRb;
with a; b; constants depending on the precipitationphase considered: ð2Þ
The third type of displays are Echotop images. Theyshow the highest vertical level from which detectableradar echoes are measured and in this case this ispresently up to 12 km height a.s.l. for the Keflav�k radar.Concentric circles often appear on Echotop images as aresult of errors in the pixel positions due to the use of thenearest neighbour technique when converting the inputdata from polar coordinated to fixed position in Cartesiancoordinates in the output image (Karlsson 1997).
Detection limits
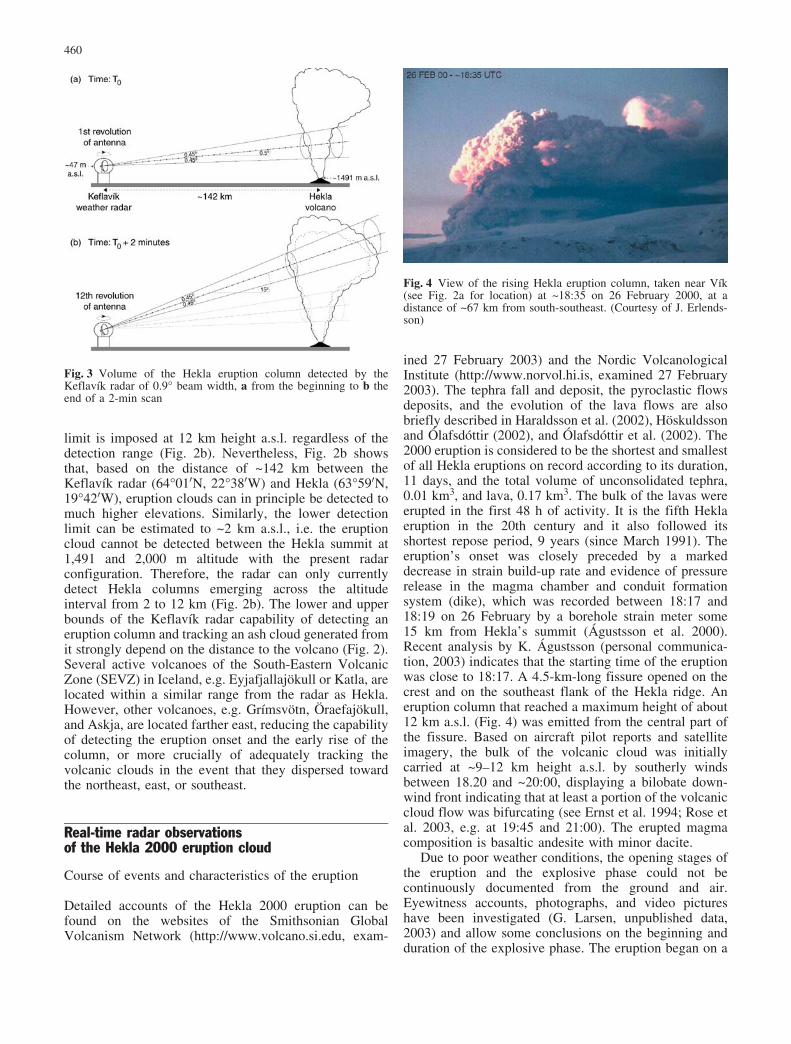
To obtain a complete scanned image, the radar beamcircles with an initial elevation angle of 0.5�. Itsrevolution is gradually raised twelve times up to a 15�angle for a whole scanning time of 2 min and with eachbeam revolution lasting about 10 s. Figure 3a and brespectively show the volume of an eruption columnabove Hekla volcano that can currently be detectedbetween the first and the last (12th) beam revolution of asingle scan. The lowest detectal height by a weather radaris a function of the elevation angle of the radar beam, thedistance (i.e. range) from the radar to the target, and theearth’s curvature as expressed by Eq. (3) (Rinehart 1991):
H ¼ffiffiffiffiffiffiffiffiffiffiffiffiffiffiffiffiffiffiffiffiffiffiffiffiffiffiffiffiffiffiffiffiffiffiffiffiffiffiffiffiffiffiffiffi
r2 þ R02 þ 2rR0 sin fð Þp
� R0 þ Ho ð3Þwhere H is radar height a.s.l. (km); Ho is height a.s.l. (km)of the radar antenna; r is range (km) from the radar; f iselevation angle (degrees) of the radar beam; and R’=4/3 R, with the earth’s radius R=6,374 km.
Using the Keflav�k radar characteristics (Table 1), thisrelation can be used to infer the lower and upper radardetection limits above Hekla (Fig. 2b). Due to softwarelimitation so far used for this radar, the upper detection
Table 1 Specifications of the weather radar system in Keflav�k,SW Iceland
Type C-band Ericsson radar system EWISLocation 64�010350 0N, 22�380090 0WOperational since January 1991Height of antenna 47 m above sea levelPeak transmitted power 245.2 kWBeam width 0.9�Elevation angle 0.5�Pulse duration 2.15 mmWavelength 5 cmPulse repetition rate 250€2 HzMaximum range 480 kmActual gain of antenna 44.9 dB
Fig. 2 a Location map of the Keflav�k radar and major volcanoesin Iceland. b Range-height (a.s.l.) diagram as a function of distancefrom the Keflav�k radar to different Icelandic volcanoes. Shadedfield shows the detection limit with the present radar configuration
459
limit is imposed at 12 km height a.s.l. regardless of thedetection range (Fig. 2b). Nevertheless, Fig. 2b showsthat, based on the distance of ~142 km between theKeflav�k radar (64�010N, 22�380W) and Hekla (63�590N,19�420W), eruption clouds can in principle be detected tomuch higher elevations. Similarly, the lower detectionlimit can be estimated to ~2 km a.s.l., i.e. the eruptioncloud cannot be detected between the Hekla summit at1,491 and 2,000 m altitude with the present radarconfiguration. Therefore, the radar can only currentlydetect Hekla columns emerging across the altitudeinterval from 2 to 12 km (Fig. 2b). The lower and upperbounds of the Keflav�k radar capability of detecting aneruption column and tracking an ash cloud generated fromit strongly depend on the distance to the volcano (Fig. 2).Several active volcanoes of the South-Eastern VolcanicZone (SEVZ) in Iceland, e.g. Eyjafjallaj�kull or Katla, arelocated within a similar range from the radar as Hekla.However, other volcanoes, e.g. Gr�msv�tn, raefaj�kull,and Askja, are located farther east, reducing the capabilityof detecting the eruption onset and the early rise of thecolumn, or more crucially of adequately tracking thevolcanic clouds in the event that they dispersed towardthe northeast, east, or southeast.
Real-time radar observationsof the Hekla 2000 eruption cloud
Course of events and characteristics of the eruption
Detailed accounts of the Hekla 2000 eruption can befound on the websites of the Smithsonian GlobalVolcanism Network (http://www.volcano.si.edu, exam-
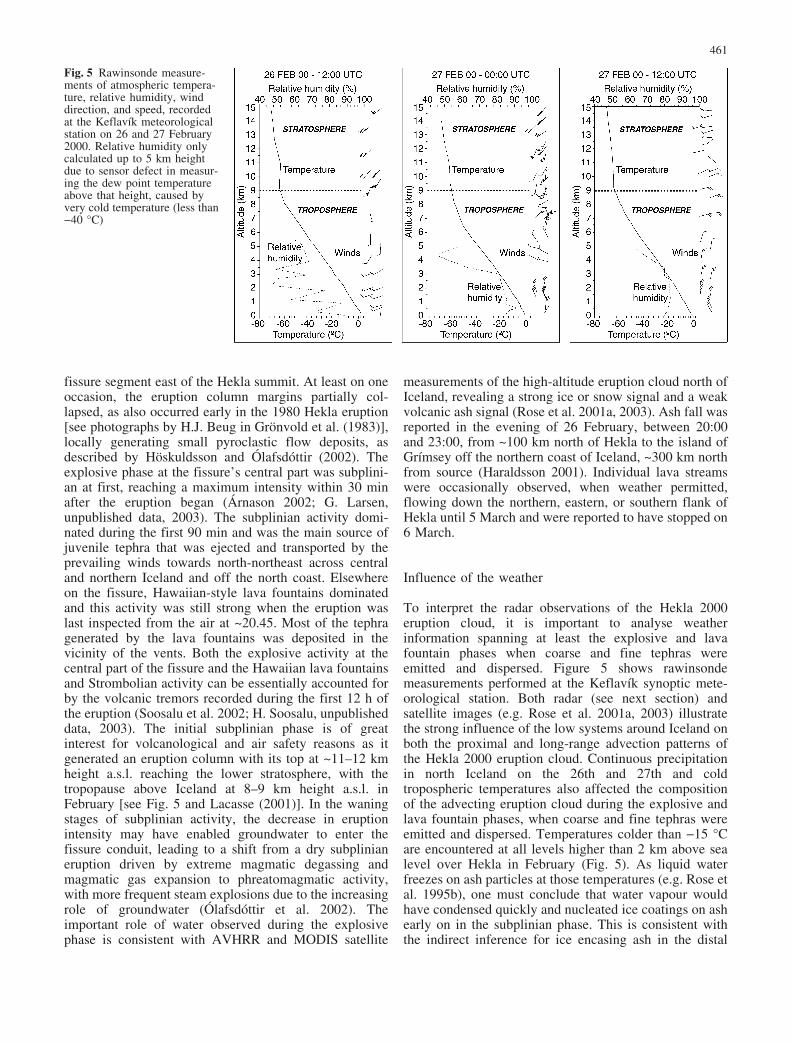
ined 27 February 2003) and the Nordic VolcanologicalInstitute (http://www.norvol.hi.is, examined 27 February2003). The tephra fall and deposit, the pyroclastic flowsdeposits, and the evolution of the lava flows are alsobriefly described in Haraldsson et al. (2002), H�skuldssonand lafsd�ttir (2002), and lafsd�ttir et al. (2002). The2000 eruption is considered to be the shortest and smallestof all Hekla eruptions on record according to its duration,11 days, and the total volume of unconsolidated tephra,0.01 km3, and lava, 0.17 km3. The bulk of the lavas wereerupted in the first 48 h of activity. It is the fifth Heklaeruption in the 20th century and it also followed itsshortest repose period, 9 years (since March 1991). Theeruption’s onset was closely preceded by a markeddecrease in strain build-up rate and evidence of pressurerelease in the magma chamber and conduit formationsystem (dike), which was recorded between 18:17 and18:19 on 26 February by a borehole strain meter some15 km from Hekla’s summit (�gustsson et al. 2000).Recent analysis by K. �gustsson (personal communica-tion, 2003) indicates that the starting time of the eruptionwas close to 18:17. A 4.5-km-long fissure opened on thecrest and on the southeast flank of the Hekla ridge. Aneruption column that reached a maximum height of about12 km a.s.l. (Fig. 4) was emitted from the central part ofthe fissure. Based on aircraft pilot reports and satelliteimagery, the bulk of the volcanic cloud was initiallycarried at ~9–12 km height a.s.l. by southerly windsbetween 18.20 and ~20:00, displaying a bilobate down-wind front indicating that at least a portion of the volcaniccloud flow was bifurcating (see Ernst et al. 1994; Rose etal. 2003, e.g. at 19:45 and 21:00). The erupted magmacomposition is basaltic andesite with minor dacite.
Due to poor weather conditions, the opening stages ofthe eruption and the explosive phase could not becontinuously documented from the ground and air.Eyewitness accounts, photographs, and video pictureshave been investigated (G. Larsen, unpublished data,2003) and allow some conclusions on the beginning andduration of the explosive phase. The eruption began on a
Fig. 4 View of the rising Hekla eruption column, taken near V�k(see Fig. 2a for location) at ~18:35 on 26 February 2000, at adistance of ~67 km from south-southeast. (Courtesy of J. Erlends-son)
Fig. 3 Volume of the Hekla eruption column detected by theKeflav�k radar of 0.9� beam width, a from the beginning to b theend of a 2-min scan
460
fissure segment east of the Hekla summit. At least on oneoccasion, the eruption column margins partially col-lapsed, as also occurred early in the 1980 Hekla eruption[see photographs by H.J. Beug in Gr�nvold et al. (1983)],locally generating small pyroclastic flow deposits, asdescribed by H�skuldsson and lafsd�ttir (2002). Theexplosive phase at the fissure’s central part was subplini-an at first, reaching a maximum intensity within 30 minafter the eruption began (�rnason 2002; G. Larsen,unpublished data, 2003). The subplinian activity domi-nated during the first 90 min and was the main source ofjuvenile tephra that was ejected and transported by theprevailing winds towards north-northeast across centraland northern Iceland and off the north coast. Elsewhereon the fissure, Hawaiian-style lava fountains dominatedand this activity was still strong when the eruption waslast inspected from the air at ~20.45. Most of the tephragenerated by the lava fountains was deposited in thevicinity of the vents. Both the explosive activity at thecentral part of the fissure and the Hawaiian lava fountainsand Strombolian activity can be essentially accounted forby the volcanic tremors recorded during the first 12 h ofthe eruption (Soosalu et al. 2002; H. Soosalu, unpublisheddata, 2003). The initial subplinian phase is of greatinterest for volcanological and air safety reasons as itgenerated an eruption column with its top at ~11–12 kmheight a.s.l. reaching the lower stratosphere, with thetropopause above Iceland at 8–9 km height a.s.l. inFebruary [see Fig. 5 and Lacasse (2001)]. In the waningstages of subplinian activity, the decrease in eruptionintensity may have enabled groundwater to enter thefissure conduit, leading to a shift from a dry subplinianeruption driven by extreme magmatic degassing andmagmatic gas expansion to phreatomagmatic activity,with more frequent steam explosions due to the increasingrole of groundwater (lafsd�ttir et al. 2002). Theimportant role of water observed during the explosivephase is consistent with AVHRR and MODIS satellite
measurements of the high-altitude eruption cloud north ofIceland, revealing a strong ice or snow signal and a weakvolcanic ash signal (Rose et al. 2001a, 2003). Ash fall wasreported in the evening of 26 February, between 20:00and 23:00, from ~100 km north of Hekla to the island ofGr�msey off the northern coast of Iceland, ~300 km northfrom source (Haraldsson 2001). Individual lava streamswere occasionally observed, when weather permitted,flowing down the northern, eastern, or southern flank ofHekla until 5 March and were reported to have stopped on6 March.
Influence of the weather
To interpret the radar observations of the Hekla 2000eruption cloud, it is important to analyse weatherinformation spanning at least the explosive and lavafountain phases when coarse and fine tephras wereemitted and dispersed. Figure 5 shows rawinsondemeasurements performed at the Keflav�k synoptic mete-orological station. Both radar (see next section) andsatellite images (e.g. Rose et al. 2001a, 2003) illustratethe strong influence of the low systems around Iceland onboth the proximal and long-range advection patterns ofthe Hekla 2000 eruption cloud. Continuous precipitationin north Iceland on the 26th and 27th and coldtropospheric temperatures also affected the compositionof the advecting eruption cloud during the explosive andlava fountain phases, when coarse and fine tephras wereemitted and dispersed. Temperatures colder than �15 �Care encountered at all levels higher than 2 km above sealevel over Hekla in February (Fig. 5). As liquid waterfreezes on ash particles at those temperatures (e.g. Rose etal. 1995b), one must conclude that water vapour wouldhave condensed quickly and nucleated ice coatings on ashearly on in the subplinian phase. This is consistent withthe indirect inference for ice encasing ash in the distal
Fig. 5 Rawinsonde measure-ments of atmospheric tempera-ture, relative humidity, winddirection, and speed, recordedat the Keflav�k meteorologicalstation on 26 and 27 February2000. Relative humidity onlycalculated up to 5 km heightdue to sensor defect in measur-ing the dew point temperatureabove that height, caused byvery cold temperature (less than�40 �C)
461
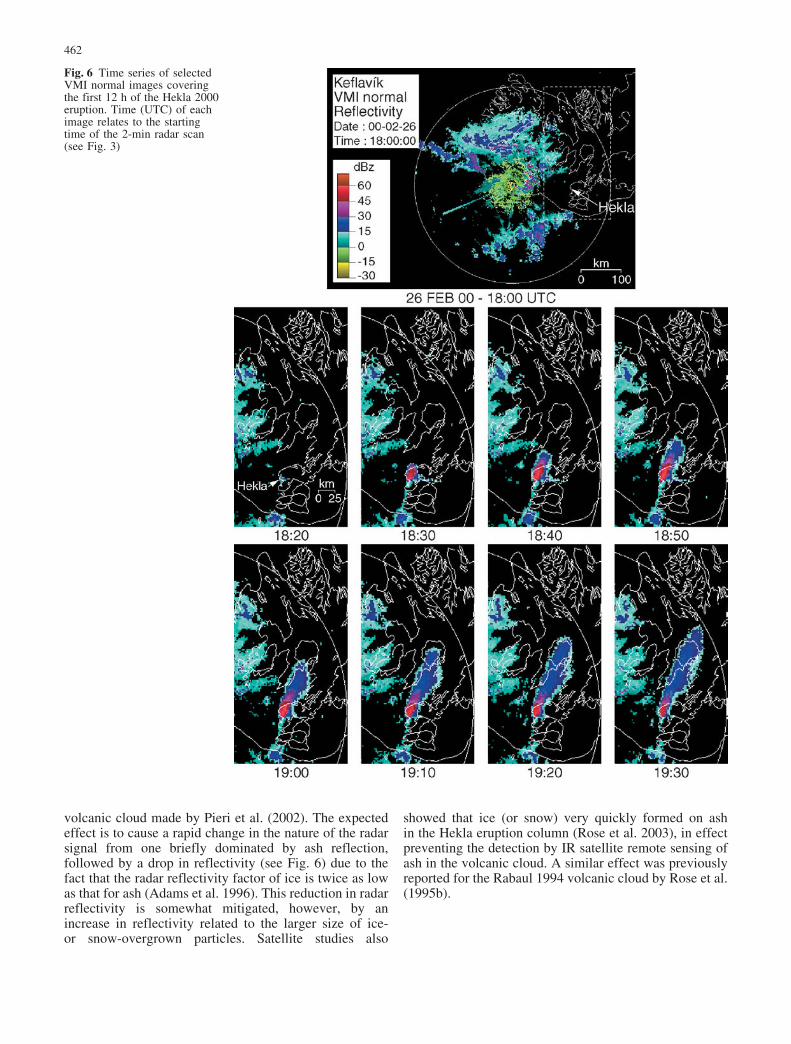
volcanic cloud made by Pieri et al. (2002). The expectedeffect is to cause a rapid change in the nature of the radarsignal from one briefly dominated by ash reflection,followed by a drop in reflectivity (see Fig. 6) due to thefact that the radar reflectivity factor of ice is twice as lowas that for ash (Adams et al. 1996). This reduction in radarreflectivity is somewhat mitigated, however, by anincrease in reflectivity related to the larger size of ice-or snow-overgrown particles. Satellite studies also
showed that ice (or snow) very quickly formed on ashin the Hekla eruption column (Rose et al. 2003), in effectpreventing the detection by IR satellite remote sensing ofash in the volcanic cloud. A similar effect was previouslyreported for the Rabaul 1994 volcanic cloud by Rose et al.(1995b).
Fig. 6 Time series of selectedVMI normal images coveringthe first 12 h of the Hekla 2000eruption. Time (UTC) of eachimage relates to the startingtime of the 2-min radar scan(see Fig. 3)
462

Real-time radar observations during the first 12 hof the eruption
Selected PPI images displayed by VMI normal andEchotop screens are shown in Figs. 6 and 7. The firstradar echo of the Hekla 2000 eruption cloud was detectedat 18:20 on 26 February. The echo is represented by asmall region with strong reflectivity between 45 and60 dBz, attributed to high initial column concentrations ofice- or snow-encased lapilli and coarse ash, and possible
large snowflakes containing ash (snowflakes containingash were observed falling near Hekla at ~ 20:00–22:00;H. Mattson, personal communication, 2003). Taking intoaccount the 2-min revolution of the radar antenna (Fig. 3),information from the corresponding Echotop image onFig. 7 indicates that the head of the eruption columnreached over 11–12 km height a.s.l., between the third(18:20) and fifth minute (18:22) after eruption onset(18:17). The mean ascent velocity of the plume head is
Fig. 6 (continued)
463

estimated to have ranged between ~30 and ~50 m s�1
during this early stage of the explosive phase.A systematic documentation of the highly reflected
plume during the first 12 h of the eruption is laterpresented and tied to the continuous volcanic tremorrecord (Soosalu et al. 2002; H. Soosalu, unpublished data,2003). Figure 8 shows that the >45-dBz portion of theemerging eruption column continues to grow crosswindand downwind until 18:50, with the highest echo of>60 dBz observed at 18:30 above Hekla. The highest
initial reflectivity is attributed to high concentration in thecolumn of small ice- or snow-encased lapilli and coarseash. Similar high radar return levels have been documentfor the 1992 Spurr eruptions (Rose et al. 1995a), andcorresponded to 2- to 20-mm particles there. An impor-tant difference was that the Hekla cloud produced a radarreturn for a considerably longer time and imaged area, of2.5 h and over 300 km downwind distance, as opposed to30 min and 20–30 km downwind distance for the Spurrcloud. We attribute this difference to the continuing
Fig. 7 Time series of selectedEchotop images covering thefirst 12 h of the Hekla 2000eruption. Concentric circles re-sult from errors in pixel posi-tions due to use of the nearestneighbour technique, whenconverting input data from po-lar co-ordinated to fixed posi-tion in Cartesian coordinates inthe output image (Karlsson1997)
464

presence of abundant ice or snow encasing ash and theovergrowing of these mixed particles in the advectedHekla cloud. Surrounding the >30-dBz reflected portionof the eruption column, an external envelope of lowreflectivity, between 0 and 30 dBz, widened from 18:25as the eruption cloud began to spread and to be advectedin the lower stratosphere at an average speed of ~30 m s�1
to the north-northeast (Fig. 6). At 18:40 the cloud reachedapproximately 64�200N, with its top height at ~11–12 kma.s.l. and its edges reaching up to ~9–10 km height a.s.l.
(Fig. 7), i.e. slightly above the tropopause. At 19:00 thereflected cloud edge at 0–15 dBz reached the southernmargin of Hofsj�kull glacier and slightly dropped to anelevation of ~7–8 km (Figs. 6 and 7). As the eruptioncloud advected over the glacier, it became asymmetricalwith a secondary lobe of low reflectivity at 0–30 dBz,developing on its eastern side. The secondary lobe did notprogress farther than the southern ice margin of Hofs-j�kull and reached its maximum lateral extent between19:15 and 19:25 based on the analysis of the whole radar
Fig. 7 (continued)
465

data set. At the same time, the main cloud continued to beadvected at a near-constant speed of ~30 m s�1 towardsthe north-northeast along a ~N20�E azimuth, to reachSaurbaer in Eyjafj�rdur at 19:45, ~65�300N and 18�150W(Figs. 2 and 6). However, a spot reflecting 15–30 dBz andreaching ~10 km height a.s.l. was located east of Hr�sey inEyjafj�rdur, ~66�N and 18�150W. This may indicate thata portion of the cloud advecting in lower-level windsreached ~66�N at this time but at an altitude generallybelow the radar detection limit at this location, i.e. below7–8 km height a.s.l. (Fig. 2). At 20:05 another spot wasseen farther north than the main eruption cloud at~65�500N and 17�400W, reflecting at 15–30 dBz andreaching 8–9 km height a.s.l. It is unlikely that theseradar-detected spots were from precipitation clouds even
though it was snowing at this time in northern Iceland.The Echotop images on Fig. 7 show that, in a 200-kmradius from the radar, the top of precipitation clouds didnot exceed 3–5 km height a.s.l. overall. Thus, once again,these spots may correspond with the radar detecting someash at the edge of its height range.
By investigating the radar images thoroughly there aremore indications that the outer limit of the eruption cloudwas wider than generally seen in Fig. 6. For instance, at20:20 a reflected spot was seen west of the main flow andeast of it at 21:00. This is in good agreement with themaximum extent of the eruption cloud observed by theMODIS sensor at 21:00 [see Fig. 2 in Rose et al. (2003)].A limitation of the radar data is illustrated by comparingthe data with the MODIS satellite image. The MODIS
Fig. 8 Time series of selectedCappi level 2 images showingevolution of the highly reflectedportion of the eruption columnduring the first 12 h of theHekla 2000 eruption. Image notavailable at 22:30
466

image displays a bifurcation pattern in the extremenortheast of Iceland that is not at all apparent on theradar image for that time and location, most likelybecause bifurcation becomes more apparent beyond theKeflav�k radar range.
A key pattern of the eruption cloud, reflected by theradar, is that the strongest reflection is seen during theearly eruption stage, i.e. approximately during the first90 min (Fig. 6). This correlates very closely with thephase of fastest increase in total mass retrieved by IRsatellite sensors (Rose et al. 2003). After that, themaximum echo of >30 dBz is only seen over the ventand just north of it. Despite this, an increase in thereflection is observed north of the vent at ~64�200N and19�300W. The spot is clearly seen between 20:35 and01:00 on 27 February and the reflection is >30 dBz, whilein the surroundings it reflected at 15–30 dBz (Figs. 6 and8). The possible origin of this second highly reflectiveportion of the eruption cloud is later discussed and relatedto mixed-phase aggregation, i.e. between ice-encased orsnowflake-encased ash particles (see Textor et al. 2003a,2003b). From about 20:30 the azimuth of the advectingeruption cloud gradually shifted towards the north-northwest as a result of change in wind direction(Figs. 5 and 6). By 21:00 the reflected cloud coveredonly the western part of Hofsj�kull glacier. Its extentdiminished and 1 h later its northern limit is seen west ofHofsj�kull glacier at ~65�200N. At 01:00 the eruptioncloud only reached 64�200N along a ~N10�E azimuth(Fig. 6). Volcanic activity continued to decrease and 12 hafter its start there was only seen reflection above the ventand east and east-southeast of it (Figs. 6 and 8). Cloudheight was between 5 and 7 km a.s.l. at this time (Fig. 7).This corresponds closely to the time when the total massof particles retrieved by IR satellite sensors started toplunge (Rose et al. 2003).
Volcanic tremor and evolution of the reflected plumeand proximal fallout
Hekla volcano is located at the eastern tip of the SouthIceland Seismic Zone (SISZ). The earthquake activity ofthis region has been continuously monitored since 1990after a network of seismograph stations was installed byIMO in 1988 (Stef�nsson et al. 1993). The South IcelandLowland (SIL) project was originally aimed at recordingthe magnitude and the location of earthquakes occurringalong the SISZ. The 1991 Hekla eruption showed that theuse of the SIL network of seismograph stations can beextended, beyond the normal recording of earthquakeactivity, to study the intensity and amplitude of volcanictremor in different frequency bands (Soosalu and Einars-son 2002; Soosalu et al. 2003). The same investigationwas repeated during the Hekla 2000 eruption (Soosalu etal. 2002; H. Soosalu, unpublished data, 2003). Out of thethree operational seismograph stations used in the Hekla2000 study, the Haukadalur station (HAU) is the nearest,only 14 km from Hekla, and recorded the highest
amplitude of volcanic tremor during the eruption(Fig. 9b). The simultaneous variations of the volcanictremor amplitude and the reflected cross-sectional area ofthe eruption column and proximal fallout region show thatboth the seismic and radar signals are related to the sameoverall magmatic process occurring from the magmachamber to the open vent of Hekla. Both the tremoramplitudes and the denser portion of >45 dBz reach theirmaximum at ~18:50 before beginning to decrease.Tremor amplitudes continued to gradually decrease until7 March, to reach similar values as those measured priorto the start of the eruption (H. Soosalu, unpublished data,2003).
The volcanic tremor amplitude is found to increasewith increasing plume height according to the empiricalrelation (Eq. 4) (McNutt 1994a, 1994b; McNutt et al.1995).
log10Affiffiffiffi
lrp
2ffiffiffi
2p
M
� �
¼ 1:80 log10 Hð Þ � 0:08;
e:g: for surface waves ð4Þwhere A is amplitude (cm) peak-to-peak; l is wavelength(cm); r is distance (cm) from source to seismic station; Mis seismograph magnification at the tremor frequency; andH is eruption column height (km).
An estimate of the magma mass discharge rate can beinferred from the maximum eruption column height usingthe Morton et al. (1956) equation (Eq. 5) (e.g. Carey andBursik 2000):
Ht¼ 1:67Q0:259 ð5Þwhere Ht is maximum eruption column height (km)and Q is magma volume discharge rate (m3 s�1) ofmagma.
Equations (4) and (5) indicate that the recorded tremoramplitude and the volume discharge rate of magma can belinked empirically.
From PPI radar images intersecting the Hekla 2000eruption column at the lowest possible detection height of~2 km a.s.l. (i.e. Cappi level 2), ~500 m above the 1,491-m-high vent, >30-dBz portions are thought to reflect thecross-sectional area of both the eruption column andproximal fallout region. Their area variation can be usedas a rough indicator of the change in magma dischargerate (Fig. 8). As already described, the 30- to 45-dBz and>45-dBz portions are characterised by their short appear-ance and limited extent above the vent. The areas of thetwo highly reflected portions fluctuate over time, with asharp increase from 18:20 until ~19:00 when they cover amaximum total area of 107 pixels or ~428 km2 (Fig. 9a).The trough observed at 18:55 is interpreted to result froma defect in the reflected radar signal which affects thewhole image. From ~19:00 the total area of the 30- to 45-dBz and >45-dBz portions (i.e. >30-dBz portion) rapidlydecreases to about 30% of the maximum extent at ~19:20,only 1 h after the eruption onset, illustrating a rapidwaning of tephra emission and fallout near the vent ormore probably that the ash in the column even at this low
467

elevation becomes increasingly hidden by ice or snow-flakes nucleating and growing on the ash particles. From~01:00 on 27 February, the >45-dBz portion completelydisappears while the 30- to 45-dBz signal lasts until~04:30.
Reflected cloud and ground-based observationsof tephra fall
The reflected wind-advected cloud of the Hekla 2000eruption can be compared with the associated tephrafallout on the ground, from both eyewitness accounts andstudy of the primary deposit (Fig. 10). The onset of tephrafall, as the eruption cloud advected to the north-northeastof Hekla towards the island of Gr�msey, off the northerncoast of Iceland, was recorded at several localities. From~20:00 until 23:00, tephra fall was reported from thenorthern margin of Hofsj�kull glacier to the island ofGr�msey, ~120 and ~300 km downwind from Hekla,respectively (Fig. 10b). Rough estimates of ash modalsize at these two locations are ~200 and ~63 mm,respectively (Haraldsson 2001; G. Larsen, unpublisheddata, 2003). The size distribution of ash fall contains acoarse tail of larger particles which are the ones thatdominate the radar return. The mean speed of theadvancing fallout front is estimated to ~18 m s�1 alonga main ~N10�E azimuth. The timing and direction of the
advancing fallout front differs from that of the observedreflected advecting cloud on VMI normal images(Fig. 10). PPI images indicate an early advection directionto the north-northeast from ~18:20, shifting towards anorth direction at ~23:00 (Fig. 6). The radar detectionheight exceeds 7 km a.s.l. at 280 km from the antenna(Fig. 2b). Any portion of the advected ash cloud belowthis height cannot be detected by the radar beam, i.e.north of the southern part of Eyjafj�rdur (Fig. 2a). Thelack of any significant radar signal beyond this rangeindicates that most of the ash cloud already drifts below
Fig. 10 a Advancing edge of the 0–15 dBz reflected Hekla 2000eruption cloud (VMI normal). b Ground-based observation of theonset of the Hekla 2000 tephra fall (Haraldsson 2001). c Compositereflectivity (VMI normal) of the Hekla 2000 eruption cloud for thefirst 12 h. d Isomass map of the Hekla 2000 tephra fall (Haraldsson2001; G. Larsen, unpublished data, 2003)
Fig. 9 a Evolution of the highly reflected portions of the eruptioncolumn during the first 10 h of the Hekla 2000 eruption, with the>45 and 30–45 dBz reflectivity fields (Cappi level 2) represented asstacked areas. b Variations of the >45 dBz reflectivity (Cappi level2) of the Hekla eruption column and the 5-min average amplitudeof tremor recorded at Haukadalur seismograph station (H. Soosalu,unpublished data, 2003)
468

an elevation of 7 km over Eyjafj�rdur and the island ofGr�msey. South of this detection range, the advancing 0-to 15-dBz front of the reflected plume can be mapped atregular time intervals in a similar manner as for the onsetof tephra fall (Fig. 10a). This indicates that the reflectedfront of the advected cloud front precedes the onset oftephra fall by about 30 min at the northern margin ofHofsj�kull, and by about 2 h just south of Eyjafj�rdur,indicating that tephra mainly fell out from the eruptioncolumn and was advected to the ground by lower-levelwinds (Lacasse 2001). It is assumed that most of thetephra fell within the first 12 h, covering an area of~18,000 km2 (Haraldsson et al. 2002). In order tocompare the radar observation with the distribution andcharacteristic of the primary tephra fall deposit on snow[i.e. in terms of mass loading or thickness (Haraldsson2001; G. Larsen, unpublished data, 2003)], a map of thecomposite reflectivity is reconstructed by integrating allthe VMI normal snapshots from Fig. 6 (Fig. 10c). Thecomposite reflected cloud is oriented along an ~N25�Eazimuth and entirely overshadows the Hofsj�kull glacier.In comparison, the isomass contours indicate that tephradeposition occurred along an ~N15�E azimuth and onlyaffected the western half of Hofsj�kull as shown by the<0.001-kg m�2 outermost envelope (Fig. 10d). Thisreflects the observation made earlier on the azimuthchange of the low-level winds into which falling particlesare advected on their way to the ground as well as theazimuth change of the reflected cloud axis and resultingash dispersal over time (Fig. 6). Differences between theradar- and ground-based observations of ash dispersalmost likely result from the more easterly and northerlydirections of the lower-level winds on the evening of 26February. They are consistent with the fact that the greaterpart of the on-land fall deposit in Iceland is from particlesfalling off the column margins and advected to the groundby lower-level winds (e.g. Ernst 1997; Lacasse 2001).
Discussion
Particle size and concentrationwithin the reflected volcanic cloud
With RHI images available, the height of the volcaniccloud can be determined together with the signal decreasewith time due to gravitational settling of coarse particles(Harris et al. 1981; Harris and Rose 1983; Rose et al.1995a). This only works provided that a sufficient numberof large particles is kept in the column and carried all theway to its very top, as experimentally and theoreticallysupported by Ernst et al. (1996). Harris and Rose (1983)estimated the size of the falling tephras from the 19March 1982 Mount St. Helens eruption, by looking at theRHI reflected top of the eruption cloud at different timesas it advects downwind, assuming no vertical air motion.The latter assumption is reasonable for relatively weakeruption columns such as the 1982 Mount St. Helenseruption (Harris and Rose 1983) and most likely during
the 2000 Hekla eruption. The initial decrease in elevationof the reflected cloud top, after the eruption columnreached its maximum elevation, is thought to mainlyresult from settling of the coarsest particles with fewsmall ones that are scavenged. As shown by the Probert-Jones’ (1962) equation (Eq. 6), the radar echo, or receivedreflected power Pr, from a radar target composed ofrandomly distributed targets, i.e. ice, snow, or small lapilliand coarse ash in this case, is mainly controlled by theirparticle size or, for a given modal size, by theirconcentration (number density) in the cloud:
Pr ¼p3
16 ln 2Poh
l2
G2qfR2
e� 1eþ 2
�
�
�
�
�
�
�
�
2X
r6 ð6Þ
where Pr is received power (kW); Po is peak transmittedpower (kW); h is radar pulse length (km) in space; G isactual gain of antenna (dB); q is horizontal beam width(degrees) to the �3-dB level for one-way transmission; fis vertical beam width (degrees) to the �3-dB level forone-way transmission; e is dielectric constant of sphericalparticles; l is wavelength (cm); R is range or distance(km) to the target; and r is radius (mm) of sphericalparticles.
With the return radar signal dominated by the largestmost abundant particles suspended in the cloud, theirterminal settling velocities can be calculated by measur-ing the initial decrease in height of the most highlyreflected portion of the cloud on RHI images. Particlesizes in the cloud can then be estimated from the apparentsettling velocities, e.g. in the order of 300 cm s�1 about20 min after the 1982 Mount St. Helens eruption columnreached its maximum height (Harris and Rose 1983).Using an empirical relationship between terminal settlingvelocity, diameter, density of spherical tephra, andaltitude (e.g. Wilson 1972), the particle sizes wereinferred, suggesting a mean 250-mm diameter in the caseof vesicular tephra and plagioclase crystal of 2.5 g cm�3
bulk density. Similarly, smaller particles, ~180 mm indiameter, were inferred from the slower height decreaseof the plume top, ~170 cm s�1, later during the course ofthe eruption. The lower and upper bounds for the ashconcentrations of the 1982 Mount St. Helens cloud werealso estimated, e.g. between 0.2 and 0.6 g m�3 forparticles larger than 180 mm (Harris and Rose 1983). Incomparison and from ground-based observation alone, thegrain size of the Hekla 2000 tephra fall decreases rapidlyalong the axis of thickness, from a mean of 4.3 mm(~�2.12 phi unit) at 11 km from source (Hekla summit) to204 mm (~2.29 phi unit) at 80 km and 165 mm (~2.60 phiunit) at 170 km. Corresponding sorting values decreasefrom 1.95 to 0.89 and 0.80, respectively, whereasmaximum grain size decreases from 45 mm (fragments,largest bomb 96 mm) to 2 mm, and 0.8 mm (�rnason2002; G. Larsen, unpublished data, 2003).
469

Effects of water phase, particle size,and silica content on the reflected signal
The height of the advecting Hekla 2000 eruption cloudcannot be accurately monitored by the radar as in the1982 Mount St. Helens case due to the unavailability ofRHI vertical radar profiles. Therefore, particle sizes andconcentrations within the reflected Hekla cloud cannot beinferred using the Harris and Rose (1983) procedure. Ashaggregates and ice- or snow-coated ash particles due tothe large amount of water in the plume would make suchestimate most likely inconclusive in any case. The highwater content of the 2000 Hekla cloud has at least fourpossible origins: (1) the dissolved water content in themagma prior to eruption, (2) magmatic water which hasbeen derived from crystallization of stored magma underthe volcano and which is then trapped by a hydrothermalcap or some other means until eruption (Giggenbach et al.1990), (3) the presence of groundwater within the volcanoedifice (lafsd�ttir et al. 2002), and (4) entrained ambientatmospheric humidity and resulting precipitation (e.g.snow). Ice or snow most likely began to form early withinthe eruption column itself once its temperature equili-brated to the ambient freezing temperature (Fig. 5). Themean reflectivity factor K for volcanic ash is 0.39, 2.4times less than liquid water droplets (0.93) and two timesmore than ice (0.197) for the same particle size and radarwavelength (Rose and Kostinski 1994; Adams et al.1996). The VMI normal images integrate the maximumreflectivity measured from ~2 to ~12 km height a.s.l.across the rising column and advected cloud (Fig. 3).However, the reflected signal from larger particles isdominant by far over effects of the reflectivity factor.Thus the sustained duration and larger extent of cloudreflectivity and the secondary maxima detected mostlikely are due to continuing growth of ice (or snow)around ash particles in the advecting cloud. We suggestthat the >30-dBz portions of the eruption column itselfobserved above the vent and its vicinity (Fig. 8) mainlyreflect high abundance of small lapilli (5–20 mm in size)and coarse ash (hundreds of microns in size) encased byice, and large unmelted snowflakes that nucleated on ash[likely size, 2–20 mm; Graedel and Crutzen (1993)].Reflectivity between 0 and 30 dBz observed in theadvected cloud and fallout zone in the eruption columnwake is mainly consistent with lower particle concentra-tions there compared to the column core, and with thesmaller sizes of ice- or snow-coated particles undergoingpartial melting or sublimation [100 mm to 2 mm in size;Graedel and Crutzen (1993); Fig. 6]. The influence of thesmall composition range of tephras, from basaltic andesiteto dacite, on the reflected signal can be considered asinsignificant (Adams et al. 1996).
A second >30-dBz portion of the advecting cloud canbe observed ~30 km north of Hekla volcano on the VMInormal and Cappi level 2 images, from ~20:45 on the26th until ~01:00 on the 27th February (Figs. 6 and 8). Itsmaximum extent is ~60 km2 at 22:25. Both the extendedsignal for the Hekla cloud for about 2.5 h [i.e. five times
longer than for the Spurr cloud; Rose et al. (1995a)] andits second reflective portion suggest a possible increase inthe diameter of the suspended particles due to growth ofhydrometeors and/or buildup of ice/ash aggregates (Tex-tor et al. 2003a, 2003b). Due to the lack of field data, theextend of aggregation cannot be matched with thepossible development of secondary ash accumulation onthe ground. Study of the radar data set for the Hekla 1991eruption cloud shows a second high-reflectivity portionwithin the advecting cloud on VMI normal images, fromthe same region extending farther north to the southernmargin of Hofsj�kull glacier, with no apparent secondarythickening observed for the associated tephra fall deposit(Larsen et al. 1992). Similar radar observations weremade by Harris et al. (1981) for the 18 May 1980 eruptionof Mount St. Helens, but in that case secondary downwinddeposit thickening was observed (Carey and Sigurdsson1982). Both the 1991 and 2000 radar observations, madeunder similar weather conditions and above the sameregion, are consistent with enhanced ice or snow particlegrowth in the advected cloud, following the large releaseof magmatic or hydrothermal water suggested by Rose etal. (2003).
Potential use and limitations of weather radarfor eruption cloud tracking
Although the weather radar we used is designed tomonitor precipitation clouds and not specifically designedfor volcanological use, as, for example, the NEXRADsystem developed in the Cook Inlet volcanic region ofAlaska (e.g. see Krohn et al. 1995; Rose et al. 2001b), wedemonstrated that the Keflav�k radar can also be used tolocate and track volcanic clouds over the Iceland region.Near-real-time monitoring of volcanic clouds can beachieved and provides invaluable information for relevantmeteorological centres and aviation authorities [e.g.Icelandic Civil Aviation Administration (CAA), AirTraffic Control Centres, and London, Toulouse, andMontreal Volcanic Ash Advisory Centres (VAAC)]) thatare concerned with preventing encounters of aircrafts withvolcanic clouds. For volcanoes like Hekla, located within150 km of the radar, eruption column rise can theoret-ically be detected within a few minutes of eruption onset,thereby providing one of the most crucial pieces ofinformation for forecasting models: the eruption onsettime. The eruption clouds can be tracked from somehundreds of meters above the volcano up to the current12-km elevation limit imposed by the existing radarsoftware system. The real-time observation of the Hekla2000 eruption is an optimum case in Iceland for thevolcanological application of the present radar configu-ration. The eruption column above the vent and associatedash cloud advected to the north-northeast were almostcompletely and continuously detected. Both phases of therising eruption column and advecting cloud have beenmonitored from the time series analyses of PPI (plan-position indicator) radar images that included VMI
470
normal, Cappi level 2, and Echotop displays. From thereflectivity values of the first two modes of data output,the relative role of ash and water phases in the volcaniccloud can be assessed on a qualitative basis by checkingthem against ground-based observations of the ash falldeposit.
In the case of the Hekla 2000 eruption, values of>30 dBz can be essentially accounted for in terms of radarreflectivity returns dominated by high concentrations inthe column itself of small lapilli (expected modal size of~0.5–5 mm based on fall data), and possibly includingcoarse ash particles encased in ice or snow (ice-coatedparticles of up to 0.5–2 mm), and large unmeltedsnowflakes [expected size up to 5–20 mm; Graedel andCrutzen 1993; Houze 1993)] or snowflake aggregatescontaining ash. Radar return values between 0 and 30 dBzfor regions of the cloud with longer atmospheric residence(0.5–3 h) are explained as the result of hydrometeors and/or aggregates which are also the size of small lapilli butless numerous than the particles in the eruption columndue to fallout, with the hydrometeor size decreasing as aresult of partial melting and/or sublimation. Secondaryincreases in reflectivity downwind from vent in the Heklacloud, which, for example, were also well documented inthe 18 May 1980 Mount St. Helens cloud (Harris et al.1981), are most easily accounted for in terms of increasein effective particle size originating from mixed phaseaggregation taking place in the volcanic cloud (see Textoret al. 2003a, 2003b).
As shown by Eqs. (4) and (5), an empirical relation canbe established between the evolution of the highlyreflected portion of the eruption column, >30 dBz, andthe variation of the volcanic tremor amplitude, bothreflecting the change in tephra emission or magmadischarge rate during the course of the explosive phaseof the eruption. The time series analysis of the reflectedHekla eruption cloud as it drifted away from source showssome differences with the timing and distribution of ashfall deposition due to the influence of winds in the lowertroposphere and the boundary layer above the ground. Inthe absence of RHI (range-height indicator) images anddespite some errors in the pixel positions, the Echotopimages are, to date, the primordial source of informationon the height variation of the ascending eruption columnhead and the advecting eruption cloud.
In the light of the detection limits just outlined and ofthe growing volume of air traffic in the region, there is anurgent need to upgrade the Keflav�k radar system for bothmeteorological and volcanological monitoring. As Fig. 2clearly shows, a radar at a fixed location can only monitora limited number of active volcanic systems in Iceland,i.e. those located within 150 km of Keflav�k: Hekla,Tindfjallaj�kull, Eyjafjallaj�kull, and Vestmannaeyjar(Heimaey). Several of these volcanoes are potentialsources of subplinian and plinian eruption columns andadvected clouds much higher than 12 km altitude. In 1947Hekla produced an eruption cloud initially rising to 30 kmelevation (Th�rarinsson 1954). If such an eruption occurstoday, the Keflav�k radar would detect less than half of its
column (Fig. 2). The current upper detection limit of12 km for the Keflav�k radar prevents any tracking ofthese future eruption columns and is therefore inadequatefor aircraft safety use. Eruption plumes from volcanoeslocated at least 250 km farther east, i.e. Gr�msv�tn,raefaj�kull, Askja, and Krafla, will also not be ade-quately detected by the radar (Fig. 2). The retrieval ofRHI images in addition to PPI images up to at least 20 kmheight a.s.l. must be made achievable as soon as possible.Seismic unrest and inflation of the caldera of Katlavolcano (M�rdalsj�kull glacier), at a distance of ~180 kmfrom the radar (Fig. 2), are ongoing and becoming a majorconcern for volcanic hazard in Iceland as this volcano isknown to have generated major subglacial and explosiveeruptions in the past, e.g. the Katla 1918 eruption with arecorded eruption column height of at least 14 km (Larsen2000) and sometimes columns reaching up to 20–30 kmelevation (e.g. Lacasse et al. 2002). In this particularscenario, the Keflav�k radar would detect less than half ofthe Katla eruption column (Fig. 2). A major fissureeruption such as the 1783–1784 Laki eruption, which hadperhaps the most severe atmospheric effects of allIcelandic eruptions (Th�rdarson and Self 2003), wouldbe at the limit of the radar range.
Conclusion
In this paper the first 12 h of development of the Hekla2000 eruption cloud have been described. The data setand analysis closely complements in-situ sampling datafrom a brief encounter with the distal Hekla cloud asreported by Pieri et al. (2002) and the integrated multi-sensor satellite study of the same cloud by Rose et al.(2003). We have focused here on the informationretrieved from the only weather radar operated by theIcelandic Meteorological Office (IMO). We illustratedthat the radar can be used, in addition to monitoringprecipitation clouds, to locate and track volcanic clouds innear-real-time over Iceland. The radar proves to be one ofthe most valuable and cost-effective tools for the mete-orological agencies and aviation authorities in terms ofpreventing encounters of hazardous volcanic particleswith aircrafts. From this study and the work of Rose et al.(2003), the Hekla 2000 volcanic cloud is the most closelydocumented to date by radar and satellite remote sensing,with the added benefit of a considerable wealth ofgeophysical, meteorological, and field deposit observa-tions. The results are now available for testing oftheoretical models on the dynamics of volcanic cloudsand ash fallout.
Currently, there are also undesirable limitations in theexisting radar software system limiting the monitoringcapability of tracking volcanic clouds. The maximumheight displayed is only 12 km a.s.l. and the RHI imagesare not available. Considering future eruptions in Icelandand the growing volume of air traffic in the IcelandicOceanic Control Area over the North Atlantic-Arcticregion, an upgrade of the radar software system is most
471
urgent. IMO is currently working towards upgrading theradar software, which will be operational by early spring2004. The new software will be more flexible, i.e. allavailable information that can be retrieved by the currentradar will be accessible and there will be no restriction inthe vertical. More accurate information on eruption cloudheights and their near-real-time change will becomeavailable. This information is one of the most crucial foraviation safety and provides a near-real-time input ofrelevant data for trajectory and dispersion modelsexpected to lead to improved forecasts of ash dispersal.RHI images will also be available, providing crucialinformation (e.g. vertical cross section) on the initialdevelopment and vertical distribution of erupted materialin the eruption column and advected cloud generatedfrom it. RHI data will enable some estimation of theeffective grain size distribution of falling material.Despite these planned improvements, others are alsoneeded. Due to its fixed location, the radar covers only thewestern half of Iceland. For full coverage three additionalradars are needed to encompass the eastern, northern, andsouthern flight sectors over Iceland. This will not onlyimprove the monitoring of volcanic clouds but mostimportantly be very valuable for daily meteorological useover Iceland and its surroundings, by providing invaluableinformation for air traffic safety related to non-volcanichazards (e.g. icing condition, air turbulence). Some ofthese efforts, as well as volcanological monitoring andstudies, would greatly benefit from more sophisticatedradar systems including higher beam resolution (e.g.NEXRAD), Doppler-shift capabilities, and polarizationretrievals (e.g. see Houze 1993).
Acknowledgements The authors would like to thank the IcelandicMeteorological Office and the Science Institute at the University ofIceland for their support, and especially Philippe Crochet, HreinnHjartarson, Hrafn Gudmundsson, Erik Sturkell, Kjartan Haraldsson,and Stef�n �rnason for fruitful discussions and for giving access tounpublished data. The Icelandic Civil Aviation Administrationprovided very constructive comments throughout the study. C.L.’sresearch work was supported by internal funds from the OpenUniversity. G.G.J.E. acknowledges the support of the FondationBelge de la Vocation, the Belgian NSF (FWO-Vlaanderen), andGhent colleagues. Peter Mouginis-Mark, David Pieri, and ananonymous reviewer are acknowledged for thorough reviews of themanuscript.
References
Adams RJ, Perger WF, Rose WI, Kostinski A (1996) Measure-ments of the complex dielectric constant of volcanic ash from 4to 19 GHz. J Geophys Res 101:8175–8185
�gustsson K, Stef�nsson R, Linde AT, Einarsson P, Sacks IS,Gudmundsson GB, Thorbjarnard�ttir B (2000) Successfulprediction and warning of the 2000 eruption of Hekla basedon seismicity and strain changes. In: Proc AGU 2000 FallMeeting, Eos 81, F1337, Abstract.
�rnason SG (2002) Heklugosid 2000: Kornastaerd, berggerd ogkornal�gun gj�skunnar (in Icelandic) (The Hekla 2000 erup-tion: grain size, composition and shape of ash particles). BScThesis, University of Iceland, 81 pp
Cantor R (1998) Complete avoidance of volcanic ash is the onlyprocedure that guarantees flight safety. ICAO J 53:18–19
Carey SN, Bursik M (2000) Volcanic plumes. In: Sigurdsson H,Houghton B, McNutt S, Rymer H, Stix J (eds) Encyclopedia ofvolcanoes. Academic Press, San Diego, pp 527–544
Carey SN, Sigurdsson H (1982) Transport and deposition of distaltephra from the May 18, 1980 Mount St. Helens. J GeophysRes: 87:7061–7072
Ernst GGJ (1997) Dynamics of sediment-laden plumes. PhDThesis, Department of Earth Sciences, University of Bristol,223 pp
Ernst GGJ, Davis JP, Sparks RSJ (1994) Bifurcation of volcanicplumes in a crosswind. Bull Volcanol 56:159–169
Ernst GGJ, Sparks RSJ, Carey SN, Bursik MI (1996) Sedimentationfrom turbulent jets and plumes. J Geophys Res 101:5575–5589
Giggenbach WF, Garcia PN, Londo�o CA, Rodriguez VL, RojasGN, Calvache VML (1990) The chemistry of fumarolic vaporand thermal spring discharges from the Nevado del Ruizvolcanic-magmatic-hydrothermal system. J Volcanol GeothermRes 42:13–40
Graedel TE, Crutzen PJ (1993) Atmospheric change: an earthsystem perspective. Freeman, New York, 446 pp
Grindle TJ, Burcham FW (2002) Even minor volcanic ashencounters can cause major damage to aircraft. ICAO J 2:12–30
Gr�nvold K, Larsen G, Einarsson P, Th�rarinsson S, SaemundssonK (1983) The Hekla eruption 1980–1981. Bull Volcanol46:349–363
Haraldsson K (2001) Heklugosid 2000—Dreifing gj�sku fr�fyrsta gosdegi � landi (in Icelandic) (The Hekla 2000eruption—distribution of ash from the first days of theeruption). BSc Thesis, University of Iceland, 34 pp
Haraldsson K, �rnason SG, Larsen G, Eir�ksson J (2002) TheHekla eruption of 2000—tephra fall. In: Proc 25th NordicGeological Winter Meeting, Reykjav�k, Abstract
Harris DM, Rose WI (1983) Estimating particles sizes, concentra-tions, and total mass of ash in volcanic clouds using weatherradar. J Geophys Res 88:10969–10983
Harris DM, Rose WI, Roe R, Thompson MR (1981) Radarobservations of ash eruptions. In: Lipman PW, Mulineaux DR(eds) The 1980 eruptions of Mount St. Helens, Washington. USGeol Surv Prof Pap 1250:323–333
H�skuldsson �, lafsd�ttir R (2002) Pyroclastic flows formed inthe eruption of Hekla 2000. In: Proc 25th Nordic GeologicalWinter Meeting, Reykjav�k, Abstract
Houze RA (1993) Cloud dynamics. Academic Press, New York,573 pp
Karlsson KG (1997) An introduction to remote sensing inmeteorology. Swedish Meteorological and Hydrological Insti-tute, Norrk�ping, pp 95–129
Krohn MD, Lemon LR, Perry J (1995) WSR-88D applications tovolcanic ash detection. In: Proc 1st National NEXRAD UsersConf, Norman, Oklahoma, 11–15 Oct 1994
Lacasse C (2001) Influence of climate variability on the atmo-spheric transport of Icelandic tephra in the subpolar NorthAtlantic. Global Plan Change 29:31–55
Lacasse C, Thomas LE, Bj�rnsson H, Gudmundsson MT, Gud-mundsson H (2002) Potential hazards to Great Britain frommajor explosive eruptions: a cross-disciplinary study of thesubglacial Katla volcano (S. Iceland). In: Proc Chapman Confon Volcanism and the Earth’s Atmosphere, Abstract, p 41
Larsen G (2000) Holocene eruptions within the Katla volcanicsystem, south Iceland: characteristics and environmental im-pact. J�kull 49:1–28
Larsen G, Vilmundard�ttir EG, Thorkelsson B (1992) Heklugosid1991: Gj�skufallid og gj�sskulagid fr� fyrsta degi gossins (inIcelandic) (The 1991 Hekla eruption: ash fall and ash layerfrom the first days of the eruption). N�ttfflrufraedinngurinn61(3–4):159–176
McNutt SR (1994a) Volcanic tremor amplitude correlated witheruption explosivity and its potential use in determining ashhazards to aviation. In: Proc 1st Int Symp on Volcanic Ash andAviation Safety. US Geol Surv Bull 2047:377–385
472

McNutt SR (1994b) Volcanic tremor amplitude correlated with theVolcanic Explosivity Index and its potential use in determiningash hazards to aviation. Acta Vulcanol 5:193–196
McNutt SR, Tytgat GC, Power JA (1995) Preliminary analyses ofvolcanic tremor associated with 1992 eruptions of Crater Peak,Mount Spurr, Alaska. US Geol Surv 2139:161–178
Morton B, Taylor GI, Turner JS (1956) Turbulent gravitationalconvection from maintained and instantaneous source. Proc RSoc Ser A 234:1–23
lafsd�ttir R, H�skuldsson �, Gr�nvold K (2002) The evolution ofthe lava flow from Hekla eruption 2000. In: Proc 25th NordicGeological Winter Meeting, Reykjav�k, Abstract
Pieri D, Ma C, Simpson JJ, Hufford G, Grindle T, Grove C (2002)Analyses of in-situ airborne volcanic ash from the February2000 eruption of Hekla volcano, Iceland. Geophys Res Lett29(16)
Probert-Jones JR (1962) The radar equation in meteorology. Quat JR Met Soc 88:485–495
Rinehart R (1991) Radar for meteorologists, 2nd edn. Departmentof Atmospheric Sciences, University of North Dakota, GrandForks, 334 pp
Rose WI, Kostinski AB (1994) Radar remote sensing of volcanicclouds. In: Proc 1st Int Symp on Volcanic Ash and AviationSafety. US Geol Surv Bull 2047:391–396
Rose WI, Kostinski AB, Kelley L (1995a) Real-rime C-band radarobservations of 1992 eruption clouds from Crater Peak, MountSpurr volcano, Alaska. US Geol Surv Bull 2139:19–26
Rose WI, Delene DJ, Schneider DJ, Bluth GJS, Krueger AJ, SprodI, McKee C, Davies HL, Ernst GGJ (1995b) Ice in the Rabauleruption cloud: implications for volcano hazard and atmo-spheric effects. Nature 375:477–479
Rose WI, Bluth GJ, Watson IM, Yu T, Gu Y (2001a) Hekla’sFebruary 26, 2000 eruption as seen and measured from spaceusing MODIS, TOMS and AVHRR. In: Proc AGU 2001 FallMeeting, Eos 82, F1355, Abstract
Rose WI, Bluth GJ, Schneider DJ, Ernst GGJ, Riley CM,Henderson LJ, McGimsey RG (2001b) Observations of 1992Crater Peak/Spurr volcanic clouds in their first few days ofatmospheric residence. J Geol 109:677–694
Rose WI, Gu Y, Watson IM, Yu T, Bluth GJS, Prata AJ, KruegerAJ, Krotkov N, Carn S, Fromm MD, Hundon DE, ViggianoAA, Miller TM, Ballentin JO, Ernst GGJ, Reeves JM, Wilson
C, Anderson BE (2003) The February–March 2000 eruption ofHekla, Iceland, from a satellite perspective. In: Robock A,Oppenheimer C (eds) Volcanism and the earth atmosphere.AGU Geophys Monogr (in press)
Soosalu H, Einarsson P (2002) Earthquake activity related to the1991 eruption of the Hekla volcano, Iceland. Bull Volcanol63:536–544
Soosalu H, Einarsson P, Thorbjarnard�ttir BS (2002) Volcanictremor related to the 2000 Hekla eruption. In: Proc Geol SocIceland, Spring Meeting, Abstract
Soosalu H, Einarsson P, Jakobsd�ttir S (2003) Volcanic tremorrelated to the 1991 eruption of the Hekla volcano, Iceland. BullVolcanol 65:562–577
Sparks RSJ, Bursik, MI, Carey SN, Gilbert JS, Glaze LS,Sigurdsson H, Woods AW (1997) Volcanic plumes. Wiley,Chichester, 574 pp
Stef�nsson R, B�dvarsson R, Slunga R, Einarsson P, Jakobsd�ttir S,Bungum H, Gregersen S, Havskov J, Hjelme J, Korhonen H(1993) Earthquake prediction research in the South IcelandSeismic Zone and the SIL project. Bull Seismol Soc Am83:696–716
Sveinbj�rnsson M (2001) Volcanic eruptions in Iceland: potentialhazards and aviation safety. MSc Thesis, University of Iceland,71 pp
Textor C, Graf H-F, Herzog M, Oberhuber JM, Rose WI, ErnstGGJ (2003a) Volcanic particles in explosive eruption columns.Part I: parameterisation of ash aggregation. J VolcanolGeotherm Res (in press)
Textor C, Graf H-F, Herzog M, Oberhuber JM, Rose WI, ErnstGGJ (2003b) Hydrometeor-ash particle growth in volcaniceruption column. Part II: numerical experiments. J VolcanolGeotherm Res (in press)
Th�rarinsson S (1954) The tephra fall from Hekla on March 29th1947. The eruption of Hekla 1947–1948. Soc Sci Islandica2(3):68
Th�rdarson Th, Self S (2003) Atmospheric and environmentaleffects of the 1783–1784 Laki eruption: a review andreassessment. J Geophys Res 108(D1)
Wilson L (1972) Explosive volcanic eruptions—II: the atmospherictrajectories of pyroclasts. Geophys J R Astron Soc 30:381–392
473