watertown, ny fire department study
DESCRIPTION
A study of the Watertown Fire DepartmentTRANSCRIPT
Fire Services Operations and Data Analysis
Watertown, New York March 2015
474 K Street, NW, Suite 702 Washington, DC 20001
www.cpsm.us – 716-969-1360
Exclusive Provider of Public Safety Technical Assistance for the International City/County Management Association
Center for Public Safety Management
FIRE EMS Operational Analysis
General Information
About ICMA The International City/County Management Association (ICMA) is a 100-year-old nonprofit professional association of local government administrators and managers, with approximately 9,000 members located in 28 countries.
Since its inception in 1914, ICMA has been dedicated to assisting local governments in providing services to their citizens in an efficient and effective manner. Our work spans all of the activities of local government: parks, libraries, recreation, public works, economic development, code enforcement, brownfields, public safety, and a host of other critical areas.
ICMA advances the knowledge of local government best practices across a wide range of platforms, including publications, research, training, and technical assistance. Our work includes both domestic and international activities in partnership with local, state, and federal governments, as well as private foundations. For example, we are involved in a major library research project funded by the Bill & Melinda Gates Foundation and are providing community policing training in El Salvador, Mexico, and Panama with funding from the United States Agency for International Development. We have personnel in Afghanistan helping to build wastewater treatment plants and have teams working with the United States Southern Command (SOUTHCOM) in Central America on conducting assessments and developing training programs for disaster preparedness.
Center for Public Safety Management The ICMA Center for Public Safety Management (ICMA/CPSM) is one of four Centers within the Information and Assistance Division of ICMA providing support to local governments in the areas of police, fire, EMS, emergency management, and homeland security. In addition to providing technical assistance in these areas we also represent local governments at the federal level and are involved in numerous projects with the Department of Justice and the Department of Homeland Security. In each of these Centers, ICMA has selected to partner with nationally recognized individuals or companies to provide services that ICMA has previously provided directly. Doing so will provide a higher level of services, greater flexibility, and reduced costs in meeting members’ needs as we will be expanding the services that ICMA can offer to local government. For example, the Center for Productivity Management (CPM) is now working exclusively with SAS, one of the world’s leaders in data management and analysis. And the Center for Strategic Management (CSM) is now partnering with nationally recognized experts and academics in local government management and finance.
The Center for Public Safety Management, LLC (CPSM) is the exclusive provider of public safety technical assistance for ICMA and continues to provide training and research for the association’s members and represents ICMA in its transactions with the federal government and other public safety professional associations.
Fire Services Operations and Data Analysis, Watertown, New York page ii
CPSM’s local government technical assistance experience includes workload and deployment analysis, using our unique methodology and subject matter experts to examine department organizational structure and culture, identify workload and staffing needs, and advance industry best practices. We have conducted more than 175 such studies in 35 states and 135 communities ranging in size from 8,000 population (Boone, Iowa) to 800,000 population (Indianapolis, Ind.).
Thomas Wieczorek is the Director of the Center for Public Safety Management. Leonard Matarese serves as the Director of Research & Program Development. Dr. Dov Chelst is the Director of Quantitative Analysis. Joseph Pozzo is the Senior Manager for Fire/EMS.
Methodology The ICMA Center for Public Safety Management team follows a standardized approach to conducting analyses of fire, police, and other departments involved in providing services to the public. We have developed this approach by combining the experience sets of dozens of subject matter experts in the areas of police, fire, and EMS. Our collective team has several hundred years of experience leading and managing public safety agencies, and conducting research in these areas for cities in and beyond the United States.
The reports generated by the operations and data analysis team are based upon key performance indicators that have been identified in standards and safety regulations and by special interest groups such as the International Association of Fire Chiefs (IAFC), the International Association of Fire Fighters (IAFF), and the Association of Public-Safety Communication Officials International, and through ICMA’s Center for Performance Measurement. These performance measures have been developed following decades of research and are applicable in all communities. For this reason, the data yield similar reporting formats, but each community’s data are analyzed on an individual basis by the CPSM specialists and represent the unique information for that community.
The CPSM team begins most projects by extracting calls for service and raw data from a public safety agency’s computer-aided dispatch system. The data are sorted and analyzed for comparison with nationally developed performance indicators. These performance indicators (e.g., response times, workload by time, multiple-unit dispatching) are valuable measures of agency performance regardless of departmental size. The findings are shown in tables and graphs organized in a logical format. Despite the size and complexity of the documents, a consistent approach to structuring the findings allows for simple, clean reporting. The categories for the performance indicators and the overall structure of the data and documents follow a standard format, but the data and recommendations are unique to the organization under scrutiny.
The team conducts an operational review in conjunction with the data analysis. The performance indicators serve as the basis for the operational review. The review process follows a standardized approach comparable to that of national accreditation agencies. Before the arrival of an on-site team, agencies are asked to provide the team with key operational documents (policies and procedures, asset lists, etc.). The team visits each jurisdiction to interview agency management and supervisory personnel, rank-and-file officers, and local government staff.
Fire Services Operations and Data Analysis, Watertown, New York page iii
The information collected during the site visits and through data analysis results in a set of observations and recommendations that highlight the strengths, weaknesses, and opportunities of—and threats to—the organization and operations under review. To generate recommendations, the team reviews operational documents; interviews key stakeholders; observes physical facilities; and reviews relevant literature, statutes and regulations, industry standards, and other information and/or materials specifically included in a project’s scope of work.
The standardized approach ensures that the Center for Public Safety Management measures and observes all of the critical components of an agency, which in turn provides substance to benchmark against localities with similar profiles. Although agencies may vary in size, priorities, and challenges, there are basic commonalities that enable comparison. The approach also enables the team to identify best practices and innovative approaches.
In general, the standardized approach adopts the principles of the scientific method: We ask questions and request documentation upon project start-up; confirm accuracy of information received; deploy operations and data analysis teams to research each unique environment; perform data modeling; share preliminary findings with the jurisdiction; assess inconsistencies reported by client jurisdictions; follow up on areas of concern; and communicate our results in a formal written report.
ICMA/CPSM Project Contributors Thomas J. Wieczorek, Director Leonard A. Matarese, Director of Research and Program Development Dov N. Chelst, Ph.D., Director of Quantitative Analysis Joseph E. Pozzo, Senior Manager for Fire and EMS Gerard Hoetmer, Senior Associate Gang Wang, Ph.D., Senior Quantitative Analyst Sarita Vasudevan, Quantitative Analyst Dennis Kouba, Editor
Fire Services Operations and Data Analysis, Watertown, New York page iv
Contents General Information ........................................................................................................................ii About ICMA ................................................................................................................................................... ii
Center for Public Safety Management .......................................................................................................... ii
Methodology ................................................................................................................................................ iii
ICMA/CPSM Project Contributors ................................................................................................................ iv
Contents ........................................................................................................................................... v
City of Watertown ........................................................................................................................... 1
Executive Summary ......................................................................................................................... 3
Recommendations and Considerations ........................................................................................................ 4
Overview ....................................................................................................................................... 10
Fire Department Staffing and Deployment................................................................................................. 10
Watertown Fire Department ...................................................................................................................... 12
Fire Services ................................................................................................................................... 13
Emergency Medical Services .......................................................................................................... 17
Population, Demand for Services, and Operational Workload ................................................................... 18
Organizational Analysis ................................................................................................................. 24
Internal Planning ......................................................................................................................................... 24
Fiscal Review ............................................................................................................................................... 26
Infrastructure Overview .............................................................................................................................. 28
Fleet ............................................................................................................................................... 28
Facilities ......................................................................................................................................... 30
Training and Education ............................................................................................................................... 31
Fire Prevention ............................................................................................................................................ 31
Operational Analysis ..................................................................................................................... 33
Risk Assessment for Fire Services ............................................................................................................... 33
Station and Response Time Analysis ........................................................................................................... 34
Current Station and Response Time Analysis ............................................................................................. 38
External System Relationships .................................................................................................................... 41
Operational Staffing and Deployment ........................................................................................................ 42
Appendix I: Data and Workload Analysis ...................................................................................... 47
Introduction ................................................................................................................................................ 47
Methodology .................................................................................................................................. 47
Aggregate Call Totals and Dispatches ......................................................................................................... 48
Fire Services Operations and Data Analysis, Watertown, New York page v
Workload by Individual Unit—Calls and Total Time Spent ......................................................................... 62
Analysis of Busiest Hours ............................................................................................................................ 67
Dispatch Time and Response Time ............................................................................................................. 71
Attachment I: Workload of Support Units .................................................................................................. 85
Attachment II: Property and Content Loss Analysis for Structure and Outside Fire Calls .......................... 86
Attachment III: Actions Taken Analysis for Structure and Outside Fire Calls ............................................. 87
Attachment IV: False Alarm Calls by Description ........................................................................................ 88
Fire Services Operations and Data Analysis, Watertown, New York page vi
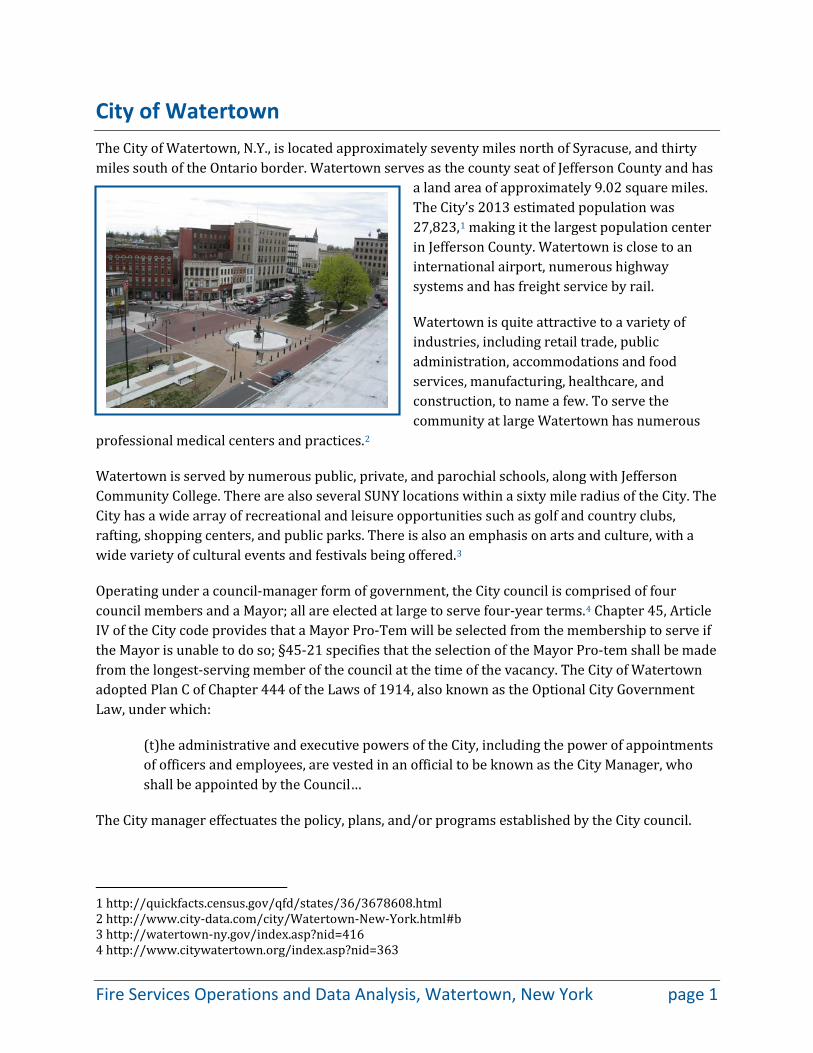
City of Watertown The City of Watertown, N.Y., is located approximately seventy miles north of Syracuse, and thirty miles south of the Ontario border. Watertown serves as the county seat of Jefferson County and has
a land area of approximately 9.02 square miles. The City’s 2013 estimated population was 27,823,1 making it the largest population center in Jefferson County. Watertown is close to an international airport, numerous highway systems and has freight service by rail.
Watertown is quite attractive to a variety of industries, including retail trade, public administration, accommodations and food services, manufacturing, healthcare, and construction, to name a few. To serve the community at large Watertown has numerous
professional medical centers and practices.2
Watertown is served by numerous public, private, and parochial schools, along with Jefferson Community College. There are also several SUNY locations within a sixty mile radius of the City. The City has a wide array of recreational and leisure opportunities such as golf and country clubs, rafting, shopping centers, and public parks. There is also an emphasis on arts and culture, with a wide variety of cultural events and festivals being offered.3
Operating under a council-manager form of government, the City council is comprised of four council members and a Mayor; all are elected at large to serve four-year terms.4 Chapter 45, Article IV of the City code provides that a Mayor Pro-Tem will be selected from the membership to serve if the Mayor is unable to do so; §45-21 specifies that the selection of the Mayor Pro-tem shall be made from the longest-serving member of the council at the time of the vacancy. The City of Watertown adopted Plan C of Chapter 444 of the Laws of 1914, also known as the Optional City Government Law, under which:
(t)he administrative and executive powers of the City, including the power of appointments of officers and employees, are vested in an official to be known as the City Manager, who shall be appointed by the Council…
The City manager effectuates the policy, plans, and/or programs established by the City council.
1 http://quickfacts.census.gov/qfd/states/36/3678608.html 2 http://www.city-data.com/city/Watertown-New-York.html#b 3 http://watertown-ny.gov/index.asp?nid=416 4 http://www.citywatertown.org/index.asp?nid=363
Fire Services Operations and Data Analysis, Watertown, New York page 1
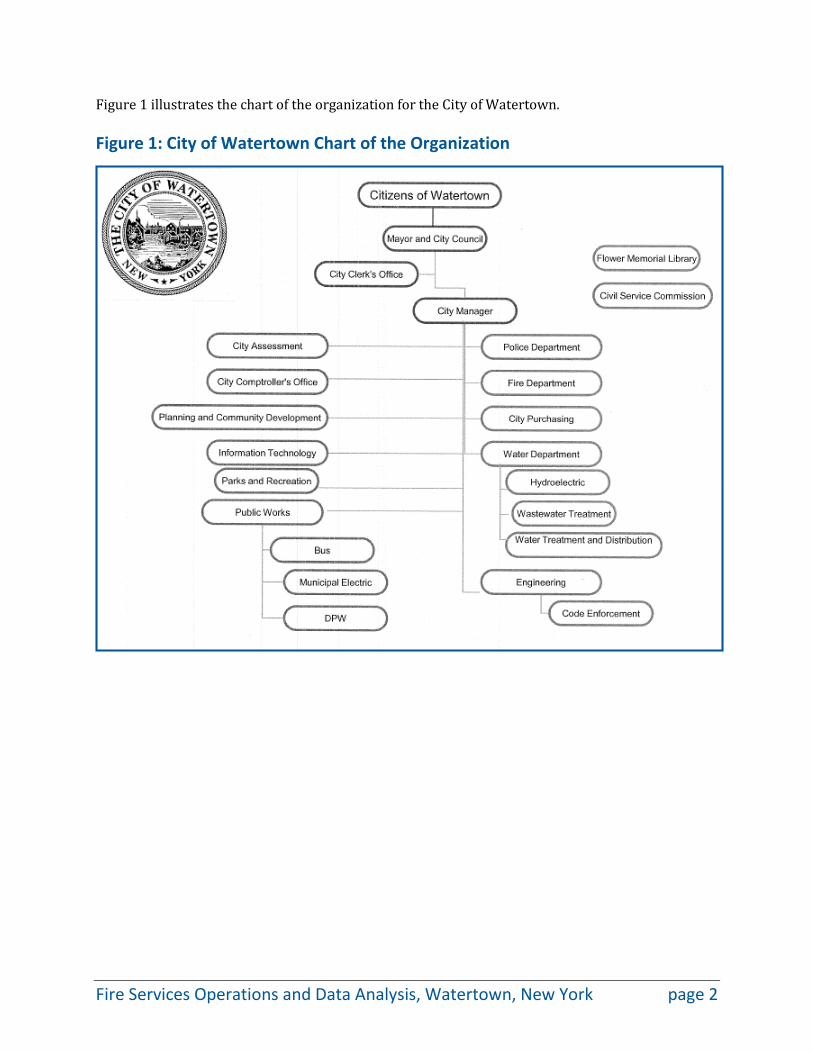
Figure 1 illustrates the chart of the organization for the City of Watertown.
Figure 1: City of Watertown Chart of the Organization
Fire Services Operations and Data Analysis, Watertown, New York page 2
Executive Summary The Center for Public Safety Management, LLC (CPSM) was retained by the City of Watertown to complete a comprehensive analysis of the City’s fire service and fire department. This analysis is designed to provide the City with a thorough and unbiased review of services provided by the Watertown Fire Department (WFD). The report further provides a benchmark of the WFD’s existing service delivery performance as analyzed in the accompanying comprehensive data analysis, which was performed utilizing information provided by the WFD. This data analysis in itself provides significant value to the City as it now has a workload analysis from which to move forward with future planning efforts. Also included in this report is the use of geographic information systems (GIS) data mapping to support the operational discussion and recommendations.
During the study, CPSM analyzed performance data provided by the WFD and also examined firsthand the department’s operations. Fire departments tend to deploy resources utilizing traditional approaches, which are rarely reviewed. To begin the review, project staff asked the City for certain documents, data, and information. The project staff used this information/data to familiarize themselves with the department’s structure, assets, and operations. The provided information was also used in conjunction with the raw performance data collected to determine the existing performance of the department, and to compare that performance to national benchmarks. These benchmarks have been developed by organizations such as the National Fire Protection Association (NFPA), Center for Public Safety Excellence, Inc. (CPSE), and the ICMA Center for Performance Measurement. WFD staff was also provided an electronic shared information folder to upload information for analysis and use by the CPSM project management staff.
Project staff conducted a site visit on September 23-24, 2014, for the purpose of observing fire department and agency-connected supportive operations, interviewing key department staff, and reviewing preliminary data and operations. Telephone conference calls were conducted as were e-mail exchanges between CPSM project management staff, the City, and the WFD so that CPSM staff could affirm the project scope, and elicit further discussion regarding this operational analysis.
Recommendations and considerations for continuous improvement of services are presented next and in the order in which they appear in the report. CPSM recognizes there may be recommendations and considerations offered that have to be bargained, budgeted for, and/or for which processes must be developed prior to implementation.
In our recommendations, reference is made to NFPA 1710, Standard for the Organization and Deployment of Fire Suppression Operations, Emergency Medical Operations, and Special Operations to the Public by Career Departments, 2010 Edition. This national consensus standard is utilized by CPSM as a benchmark for service delivery and in the overall staffing and deployment considerations of a fire department. NFPA 1710 is not being put forth as a CPSM recommendation as a single criterion for adoption and implementation. Further, the adoption of a national consensus standard such as NFPA 1710 is a formal policy decision and should be discussed thoroughly, as there are potential initial, on-going, and legacy costs associated with its adoption. The City of Watertown has not formally adopted this standard.
Fire Services Operations and Data Analysis, Watertown, New York page 3
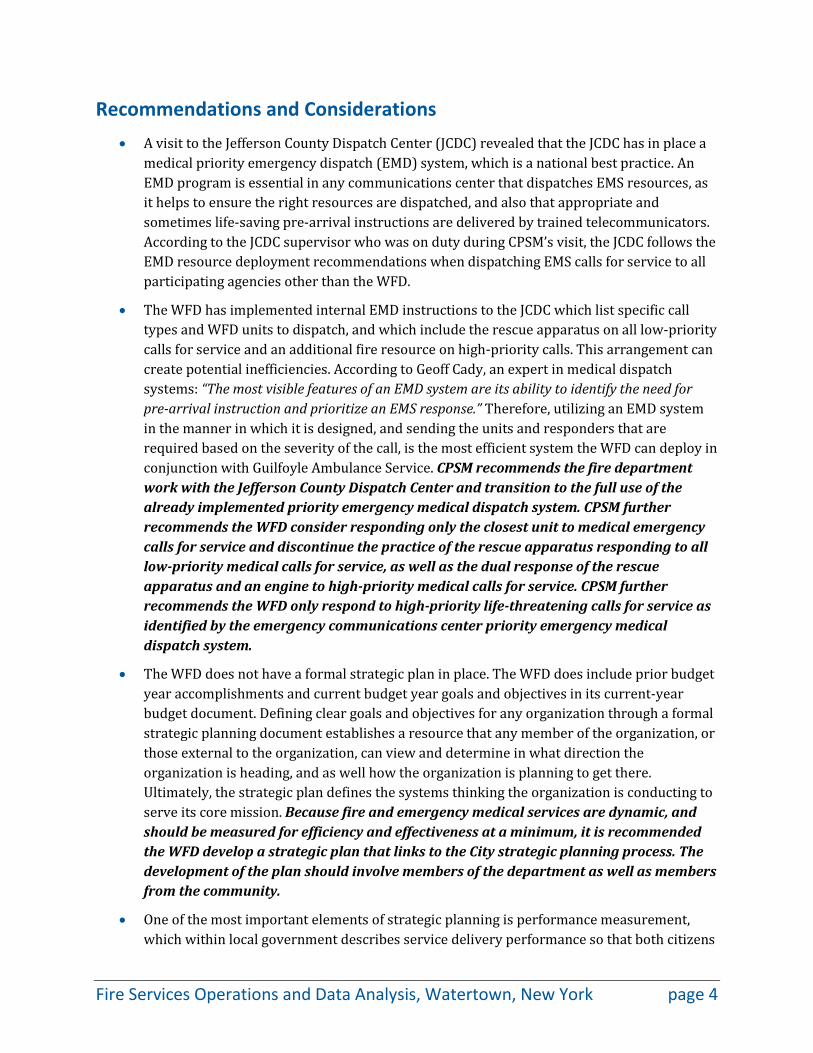
Recommendations and Considerations • A visit to the Jefferson County Dispatch Center (JCDC) revealed that the JCDC has in place a
medical priority emergency dispatch (EMD) system, which is a national best practice. An EMD program is essential in any communications center that dispatches EMS resources, as it helps to ensure the right resources are dispatched, and also that appropriate and sometimes life-saving pre-arrival instructions are delivered by trained telecommunicators. According to the JCDC supervisor who was on duty during CPSM’s visit, the JCDC follows the EMD resource deployment recommendations when dispatching EMS calls for service to all participating agencies other than the WFD.
• The WFD has implemented internal EMD instructions to the JCDC which list specific call types and WFD units to dispatch, and which include the rescue apparatus on all low-priority calls for service and an additional fire resource on high-priority calls. This arrangement can create potential inefficiencies. According to Geoff Cady, an expert in medical dispatch systems: “The most visible features of an EMD system are its ability to identify the need for pre-arrival instruction and prioritize an EMS response.” Therefore, utilizing an EMD system in the manner in which it is designed, and sending the units and responders that are required based on the severity of the call, is the most efficient system the WFD can deploy in conjunction with Guilfoyle Ambulance Service. CPSM recommends the fire department work with the Jefferson County Dispatch Center and transition to the full use of the already implemented priority emergency medical dispatch system. CPSM further recommends the WFD consider responding only the closest unit to medical emergency calls for service and discontinue the practice of the rescue apparatus responding to all low-priority medical calls for service, as well as the dual response of the rescue apparatus and an engine to high-priority medical calls for service. CPSM further recommends the WFD only respond to high-priority life-threatening calls for service as identified by the emergency communications center priority emergency medical dispatch system.
• The WFD does not have a formal strategic plan in place. The WFD does include prior budget year accomplishments and current budget year goals and objectives in its current-year budget document. Defining clear goals and objectives for any organization through a formal strategic planning document establishes a resource that any member of the organization, or those external to the organization, can view and determine in what direction the organization is heading, and as well how the organization is planning to get there. Ultimately, the strategic plan defines the systems thinking the organization is conducting to serve its core mission. Because fire and emergency medical services are dynamic, and should be measured for efficiency and effectiveness at a minimum, it is recommended the WFD develop a strategic plan that links to the City strategic planning process. The development of the plan should involve members of the department as well as members from the community.
• One of the most important elements of strategic planning is performance measurement, which within local government describes service delivery performance so that both citizens
Fire Services Operations and Data Analysis, Watertown, New York page 4
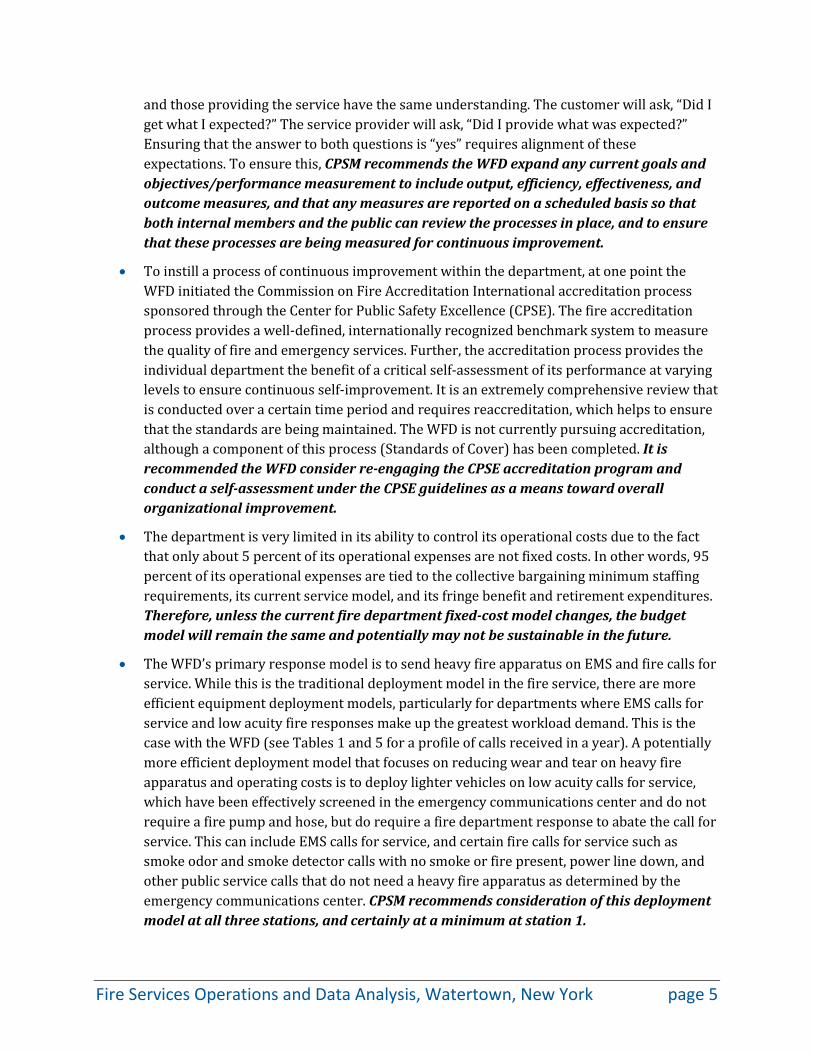
and those providing the service have the same understanding. The customer will ask, “Did I get what I expected?” The service provider will ask, “Did I provide what was expected?” Ensuring that the answer to both questions is “yes” requires alignment of these expectations. To ensure this, CPSM recommends the WFD expand any current goals and objectives/performance measurement to include output, efficiency, effectiveness, and outcome measures, and that any measures are reported on a scheduled basis so that both internal members and the public can review the processes in place, and to ensure that these processes are being measured for continuous improvement.
• To instill a process of continuous improvement within the department, at one point the WFD initiated the Commission on Fire Accreditation International accreditation process sponsored through the Center for Public Safety Excellence (CPSE). The fire accreditation process provides a well-defined, internationally recognized benchmark system to measure the quality of fire and emergency services. Further, the accreditation process provides the individual department the benefit of a critical self-assessment of its performance at varying levels to ensure continuous self-improvement. It is an extremely comprehensive review that is conducted over a certain time period and requires reaccreditation, which helps to ensure that the standards are being maintained. The WFD is not currently pursuing accreditation, although a component of this process (Standards of Cover) has been completed. It is recommended the WFD consider re-engaging the CPSE accreditation program and conduct a self-assessment under the CPSE guidelines as a means toward overall organizational improvement.
• The department is very limited in its ability to control its operational costs due to the fact that only about 5 percent of its operational expenses are not fixed costs. In other words, 95 percent of its operational expenses are tied to the collective bargaining minimum staffing requirements, its current service model, and its fringe benefit and retirement expenditures. Therefore, unless the current fire department fixed-cost model changes, the budget model will remain the same and potentially may not be sustainable in the future.
• The WFD’s primary response model is to send heavy fire apparatus on EMS and fire calls for service. While this is the traditional deployment model in the fire service, there are more efficient equipment deployment models, particularly for departments where EMS calls for service and low acuity fire responses make up the greatest workload demand. This is the case with the WFD (see Tables 1 and 5 for a profile of calls received in a year). A potentially more efficient deployment model that focuses on reducing wear and tear on heavy fire apparatus and operating costs is to deploy lighter vehicles on low acuity calls for service, which have been effectively screened in the emergency communications center and do not require a fire pump and hose, but do require a fire department response to abate the call for service. This can include EMS calls for service, and certain fire calls for service such as smoke odor and smoke detector calls with no smoke or fire present, power line down, and other public service calls that do not need a heavy fire apparatus as determined by the emergency communications center. CPSM recommends consideration of this deployment model at all three stations, and certainly at a minimum at station 1.
Fire Services Operations and Data Analysis, Watertown, New York page 5
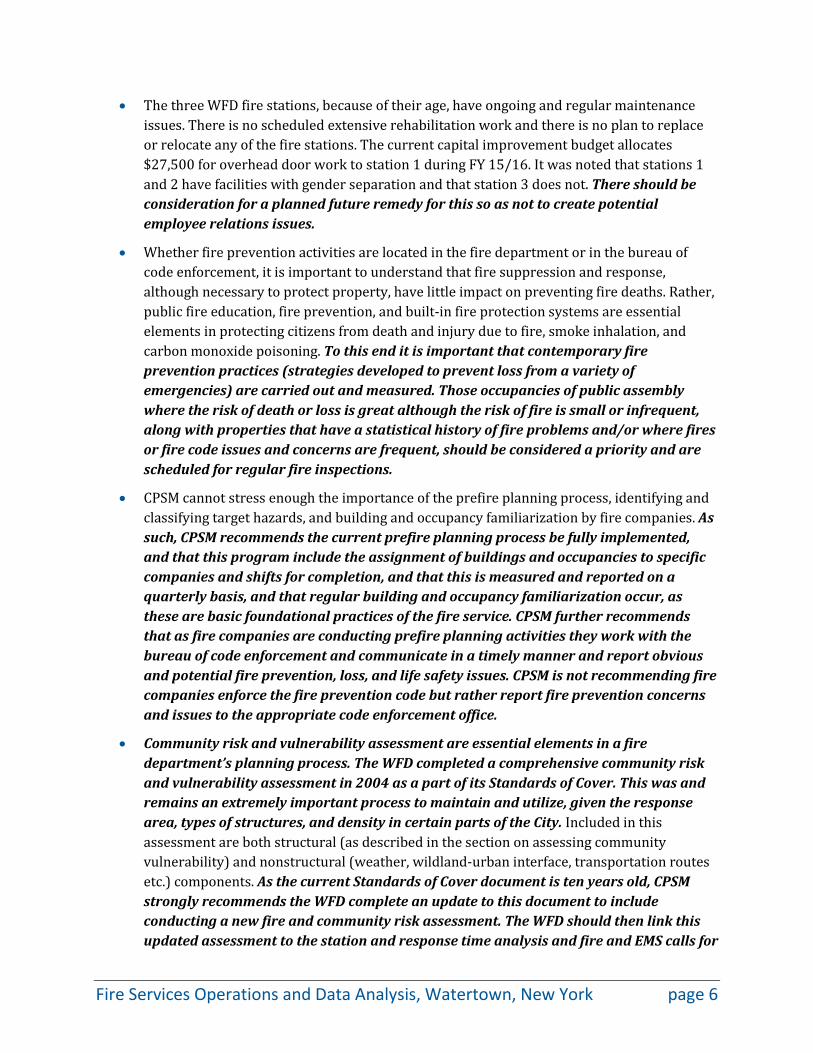
• The three WFD fire stations, because of their age, have ongoing and regular maintenance issues. There is no scheduled extensive rehabilitation work and there is no plan to replace or relocate any of the fire stations. The current capital improvement budget allocates $27,500 for overhead door work to station 1 during FY 15/16. It was noted that stations 1 and 2 have facilities with gender separation and that station 3 does not. There should be consideration for a planned future remedy for this so as not to create potential employee relations issues.
• Whether fire prevention activities are located in the fire department or in the bureau of code enforcement, it is important to understand that fire suppression and response, although necessary to protect property, have little impact on preventing fire deaths. Rather, public fire education, fire prevention, and built-in fire protection systems are essential elements in protecting citizens from death and injury due to fire, smoke inhalation, and carbon monoxide poisoning. To this end it is important that contemporary fire prevention practices (strategies developed to prevent loss from a variety of emergencies) are carried out and measured. Those occupancies of public assembly where the risk of death or loss is great although the risk of fire is small or infrequent, along with properties that have a statistical history of fire problems and/or where fires or fire code issues and concerns are frequent, should be considered a priority and are scheduled for regular fire inspections.
• CPSM cannot stress enough the importance of the prefire planning process, identifying and classifying target hazards, and building and occupancy familiarization by fire companies. As such, CPSM recommends the current prefire planning process be fully implemented, and that this program include the assignment of buildings and occupancies to specific companies and shifts for completion, and that this is measured and reported on a quarterly basis, and that regular building and occupancy familiarization occur, as these are basic foundational practices of the fire service. CPSM further recommends that as fire companies are conducting prefire planning activities they work with the bureau of code enforcement and communicate in a timely manner and report obvious and potential fire prevention, loss, and life safety issues. CPSM is not recommending fire companies enforce the fire prevention code but rather report fire prevention concerns and issues to the appropriate code enforcement office.
• Community risk and vulnerability assessment are essential elements in a fire department’s planning process. The WFD completed a comprehensive community risk and vulnerability assessment in 2004 as a part of its Standards of Cover. This was and remains an extremely important process to maintain and utilize, given the response area, types of structures, and density in certain parts of the City. Included in this assessment are both structural (as described in the section on assessing community vulnerability) and nonstructural (weather, wildland-urban interface, transportation routes etc.) components. As the current Standards of Cover document is ten years old, CPSM strongly recommends the WFD complete an update to this document to include conducting a new fire and community risk assessment. The WFD should then link this updated assessment to the station and response time analysis and fire and EMS calls for
Fire Services Operations and Data Analysis, Watertown, New York page 6
service demand analysis provided in this report and include this information in the updated Standards of Cover.
• The dispatch of calls for service for the WFD is a function of Jefferson County. In the response and workload analysis section of this report, it can be seen that the most glaring response time concern is dispatch time. When comparing against the 90th percentile, dispatch time for the WFD is in excess of three times the national benchmark discussed herein (NFPA 1710’s standard of 60 seconds versus the current experience of 204 seconds). While such an elapsed time is understandable when processing EMS calls for service and utilizing priority medical dispatch algorithms, the fire dispatch time is equally high. It is critical this time element be addressed and managed, as it adds considerably to the overall WFD response time and thus affects the service levels of the WFD. CPSM recommends the WFD address the dispatch time concerns with the Jefferson County Dispatch Center with a goal of aligning dispatch time closer to national benchmarking.
• Overall turnout time (114 seconds) and travel time (258 seconds) for the WFD are near the national benchmarking figures at the 90th percentile. Some improvement can occur in turnout time as, again, this element of response time is controllable by the fire department, and as such should be monitored on a continual basis with a goal of continuous improvement. Travel time at the 90th percentile is only slightly greater than the NFPA 1710 benchmark; however, this is not as controllable as dispatch and turnout time as the existing road network and the environment are contributing factors that can pose issues for emergency response. Response time is, however, affected overall by the dispatch time.
• The three current fire stations are properly placed, with each providing good travel times at each of the NFPA 1710 national benchmarks. CPSM does not recommend additional fire stations at this time.
• As with any agreement or memorandum of understanding in place in a local government and which is interlocal or otherwise, it is a best practice to routinely review and update in-place agreements or memorandums of understanding. While there is no standard for this, reviews of agreements that include revenue or expenditures generally occur or are driven by the agreement expiration. Those agreements such as discussed herein generally do not have a termination or expiration date and renew automatically or without review for many years (the county mutual aid fire plan calls for an annual review). Over this period of time leadership and management positions change. Therefore, it is recommended that the WFD review all interlocal agreements, MOUs, and memorandums that are in-place and which affect response of assets into another jurisdiction or which call for response into the City. This review should ensure the information is current, meets all legal and risk management components, and that all the parties can continue to provide stated services, or, as the case may be, if services can be enhanced or changed.
• Aside from the staffing alternatives discussed in this report, CPSM does not recommend any addition to the minimum unit staffing currently in place.
Fire Services Operations and Data Analysis, Watertown, New York page 7
• The WFD does not utilize volunteer members as a surge capacity asset and should consider this as an alternative to career member recall. Utilizing volunteer members engages potential and available community members, creates efficiencies in surge staffing, and avails the department of trained volunteer members for other, related staffing assignments.
• CPSM recommends the City consider alternatives to the current staffing model, and which include demand or peak-load staffing of the rescue apparatus, or cross-staffing between the truck and rescue apparatus.
• It should be acknowledged that the scope of NFPA 1710 is designed to establish the minimum requirements relating to the organization and deployment of fire and EMS operations for career fire departments. NFPA 1710 is meant to create a universal level of service for communities serviced by a career fire department. When considering the applicability of this standard several factors must be taken into consideration, including the level of risk, demand, demographics, and community expectation. While these factors must be considered, the local government has the ultimate responsibility and the authority to establish the level of service within a community. The WFD addressed the level of risk and demographics, and to some degree, demand, in its 2004 report. This CPSM report addresses demand and response times more succinctly, as well as current demographics and socioeconomic research. Coupled with the WFD 2004 report, this CPSM report provides policy makers a better understanding and more contemporary information from which to draw conclusions on staffing and deployment of fire services.
Therefore with regards to WFD staffing and deployment, CPSM recommends:
• No additional operational (shift work) staffing be added at this time.
• No further reduction in operational (shift work) staffing at this time.
• Consider cross-staffing the rescue and the truck (ladder apparatus) with a single crew of three.
• Consider peak-load staffing of the rescue unit with a crew of two between the hours of 8:00 a.m. and 10:00 p.m.
• Based on available funding, fill any funded operational vacancies at this time and maintain operational staffing at full strength as consistently as possible. This will reduce the reliance on overtime that is caused by built-in overstaffing designed to fill daily vacancies created by scheduled and unscheduled leave.
• Bargain the inclusion of battalion chiefs into Article 6, Section 1b. The battalion chiefs are represented by the collective bargaining agreement and thus should be included in the daily leave count.
• Bargain the number of available leave positions from six to five (including the battalion chief) during one 24-hour period. This will decrease overtime expenditures and adjust the actual approved leave positions from nine to eight (six annual leave and one Kelley day and Kelley night) per 24-hour period.
Fire Services Operations and Data Analysis, Watertown, New York page 8
• Bargain an increase in the work week as delineated in Article 5, Section 1a of the current collective bargaining agreement from forty hours to forty-two hours. This includes eliminating the one 10-hour Kelley Day and one 14-hour Kelley Day per operational (shift work) member over a twelve week cycle.
• Bargain the permanent reassignment of the uniformed fire prevention staff currently assigned to the bureau of code enforcement to the fire department. Transfer the appropriate budget and personnel count (fire to codes) to accommodate civilianization of these positions.
• Develop and implement policy that more definitively prescribes when an emergency recall should occur. CPSM further recommends Article 5, Sections 4b and 8 be removed through the bargaining process. While it is auspicious to maintain a certain level of personnel on duty at all times for continuous staffing, this comes with a cost. The staffing and deployment of fire services and the emergency recall of personnel is and should be both a management decision process and council policy. Further, the emergency recall of personnel should be managed by the on-duty battalion chief through approved policy.
Fire Services Operations and Data Analysis, Watertown, New York page 9
Overview
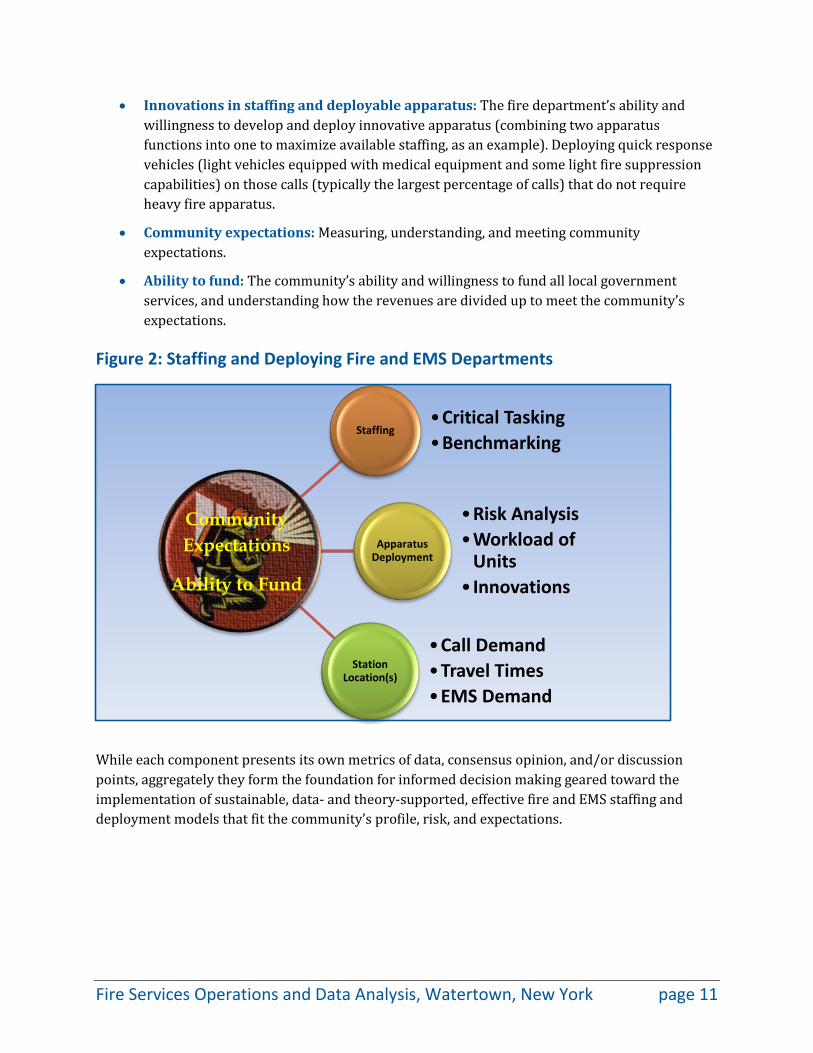
Fire Department Staffing and Deployment The staffing and deployment of fire services is ultimately a management decision. The decision-making process includes many factors that contribute to the overall staffing and deployment of fire and EMS departments. Staffing is one component, and the type of apparatus on which the staff is deployed and from where (station locations) are the other two components that determine how fire and EMS services are delivered. Linked to these components of staffing and deployment are ten critical factors that drive various levels and models from which fire and EMS departments staff and deploy. These factors are:
• Fire risk and vulnerability of the community: A fire department collects and organizes risk evaluation information about individual properties, and on the basis of the rated factors then derives a “fire risk score” for each property. The community risk and vulnerability assessment evaluates the community as a whole, and with regard to property, measures all property and the risk associated with that property and then segregates the property as either a high-, medium-, or low-hazard property depending on factors such as the life and building content hazard, and the potential fire flow, staffing, and apparatus types required to mitigate an emergency in the specific property. Factors such as fire protection systems are considered in each building evaluation. Included in this assessment should be both a structural and nonstructural (weather, wildland-urban interface, transportation routes, etc.) analysis.
• Call demand: Types of calls to which units are responding and where the calls are occurring. This drives workload and station siting considerations.
• Workload of units: Types of calls to which units are responding and the workload of each unit in the deployment model.
• Travel times from fire stations: Ability to cover the response area in a reasonable and acceptable travel time when measured against national benchmarks. This links to demand and risk assessment.
• NFPA standards, ISO, national technical studies: National benchmarking.
• EMS demand: Community demand; demand on available units and crews; demand on non-EMS units responding to calls for service (fire units); availability of crews in departments that utilize cross-trained EMS staff to perform fire suppression.
• Critical tasking: The ability of a fire and EMS department to comprise an effective response force when confronted with the need to perform required tasks on a fire or EMS incident scene and its ability to provide adequate resources to mitigate each event. Department-developed and measured against national benchmarks. This information links to risk and vulnerability analysis.
Fire Services Operations and Data Analysis, Watertown, New York page 10
• Innovations in staffing and deployable apparatus: The fire department’s ability and willingness to develop and deploy innovative apparatus (combining two apparatus functions into one to maximize available staffing, as an example). Deploying quick response vehicles (light vehicles equipped with medical equipment and some light fire suppression capabilities) on those calls (typically the largest percentage of calls) that do not require heavy fire apparatus.
• Community expectations: Measuring, understanding, and meeting community expectations.
• Ability to fund: The community’s ability and willingness to fund all local government services, and understanding how the revenues are divided up to meet the community’s expectations.
Figure 2: Staffing and Deploying Fire and EMS Departments
While each component presents its own metrics of data, consensus opinion, and/or discussion points, aggregately they form the foundation for informed decision making geared toward the implementation of sustainable, data- and theory-supported, effective fire and EMS staffing and deployment models that fit the community’s profile, risk, and expectations.
Staffing•Critical Tasking•Benchmarking
Apparatus Deployment
•Risk Analysis•Workload of
Units• Innovations
Station Location(s)
•Call Demand•Travel Times•EMS Demand
Community Expectations
Ability to Fund
Fire Services Operations and Data Analysis, Watertown, New York page 11
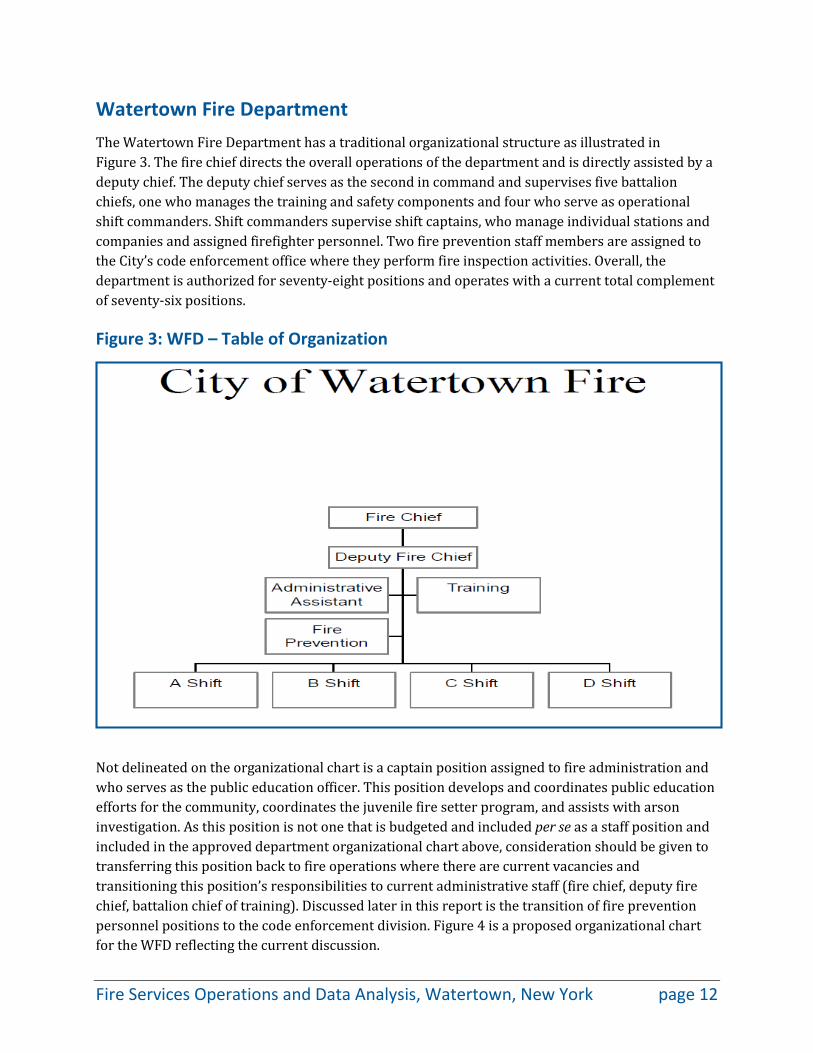
Watertown Fire Department The Watertown Fire Department has a traditional organizational structure as illustrated in Figure 3. The fire chief directs the overall operations of the department and is directly assisted by a deputy chief. The deputy chief serves as the second in command and supervises five battalion chiefs, one who manages the training and safety components and four who serve as operational shift commanders. Shift commanders supervise shift captains, who manage individual stations and companies and assigned firefighter personnel. Two fire prevention staff members are assigned to the City’s code enforcement office where they perform fire inspection activities. Overall, the department is authorized for seventy-eight positions and operates with a current total complement of seventy-six positions.
Figure 3: WFD – Table of Organization
Not delineated on the organizational chart is a captain position assigned to fire administration and who serves as the public education officer. This position develops and coordinates public education efforts for the community, coordinates the juvenile fire setter program, and assists with arson investigation. As this position is not one that is budgeted and included per se as a staff position and included in the approved department organizational chart above, consideration should be given to transferring this position back to fire operations where there are current vacancies and transitioning this position’s responsibilities to current administrative staff (fire chief, deputy fire chief, battalion chief of training). Discussed later in this report is the transition of fire prevention personnel positions to the code enforcement division. Figure 4 is a proposed organizational chart for the WFD reflecting the current discussion.
Fire Services Operations and Data Analysis, Watertown, New York page 12
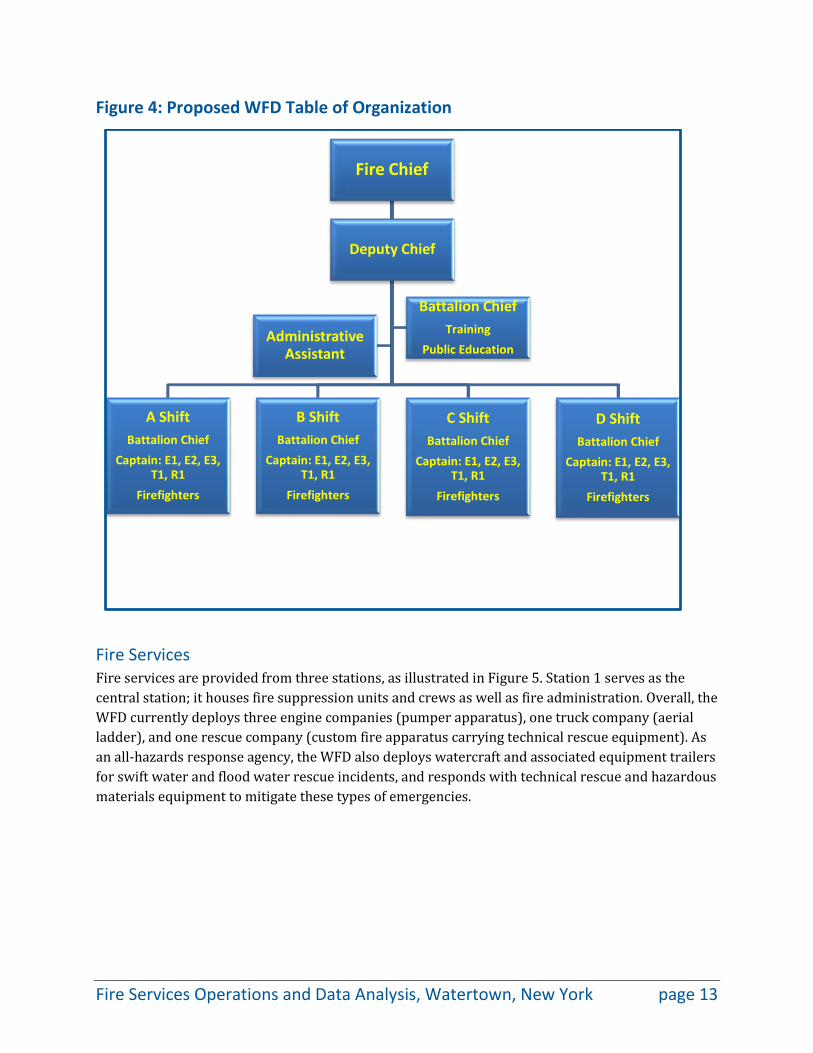
Figure 4: Proposed WFD Table of Organization
Fire Services Fire services are provided from three stations, as illustrated in Figure 5. Station 1 serves as the central station; it houses fire suppression units and crews as well as fire administration. Overall, the WFD currently deploys three engine companies (pumper apparatus), one truck company (aerial ladder), and one rescue company (custom fire apparatus carrying technical rescue equipment). As an all-hazards response agency, the WFD also deploys watercraft and associated equipment trailers for swift water and flood water rescue incidents, and responds with technical rescue and hazardous materials equipment to mitigate these types of emergencies.
Fire Chief
A ShiftBattalion Chief
Captain: E1, E2, E3, T1, R1
Firefighters
B ShiftBattalion Chief
Captain: E1, E2, E3, T1, R1
Firefighters
C ShiftBattalion Chief
Captain: E1, E2, E3, T1, R1
Firefighters
D ShiftBattalion Chief
Captain: E1, E2, E3, T1, R1
Firefighters
Administrative Assistant
Battalion ChiefTraining
Public Education
Deputy Chief
Fire Services Operations and Data Analysis, Watertown, New York page 13
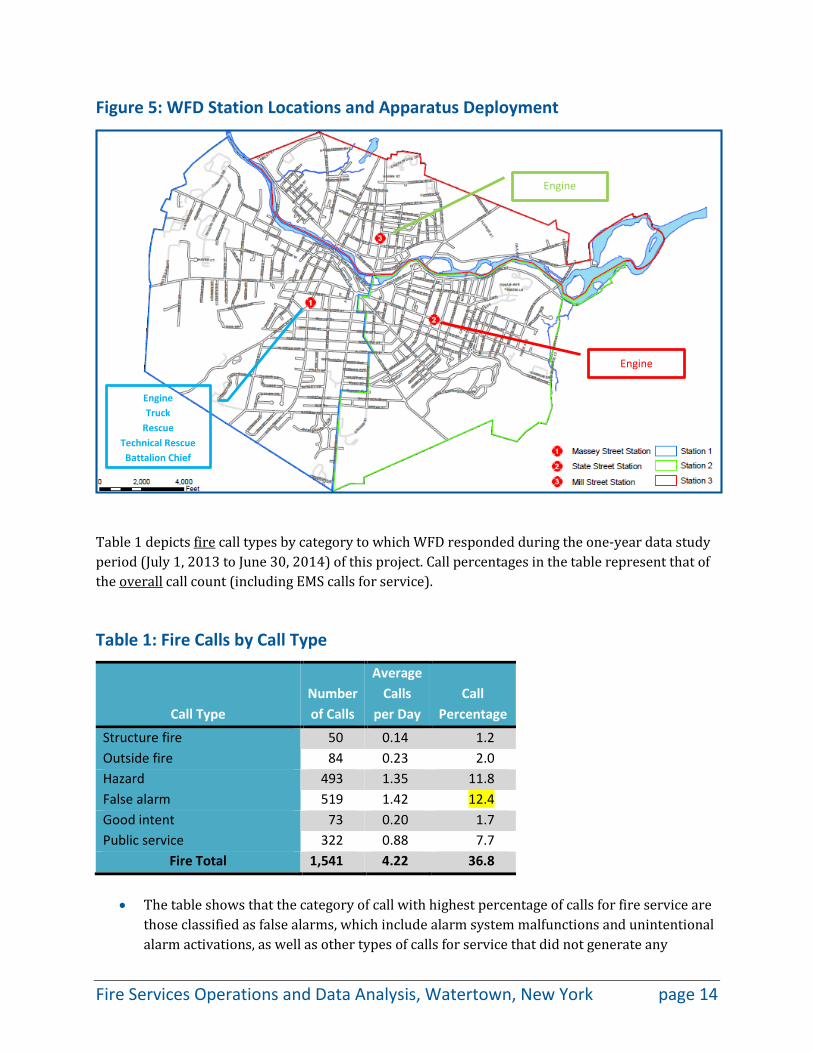
Figure 5: WFD Station Locations and Apparatus Deployment
Table 1 depicts fire call types by category to which WFD responded during the one-year data study period (July 1, 2013 to June 30, 2014) of this project. Call percentages in the table represent that of the overall call count (including EMS calls for service).
Table 1: Fire Calls by Call Type
Call Type Number of Calls
Average Calls
per Day Call
Percentage
Structure fire 50 0.14 1.2 Outside fire 84 0.23 2.0 Hazard 493 1.35 11.8 False alarm 519 1.42 12.4 Good intent 73 0.20 1.7 Public service 322 0.88 7.7
Fire Total 1,541 4.22 36.8
• The table shows that the category of call with highest percentage of calls for fire service are
those classified as false alarms, which include alarm system malfunctions and unintentional alarm activations, as well as other types of calls for service that did not generate any
Engine
Engine
Engine Truck
Rescue Technical Rescue Battalion Chief
Fire Services Operations and Data Analysis, Watertown, New York page 14
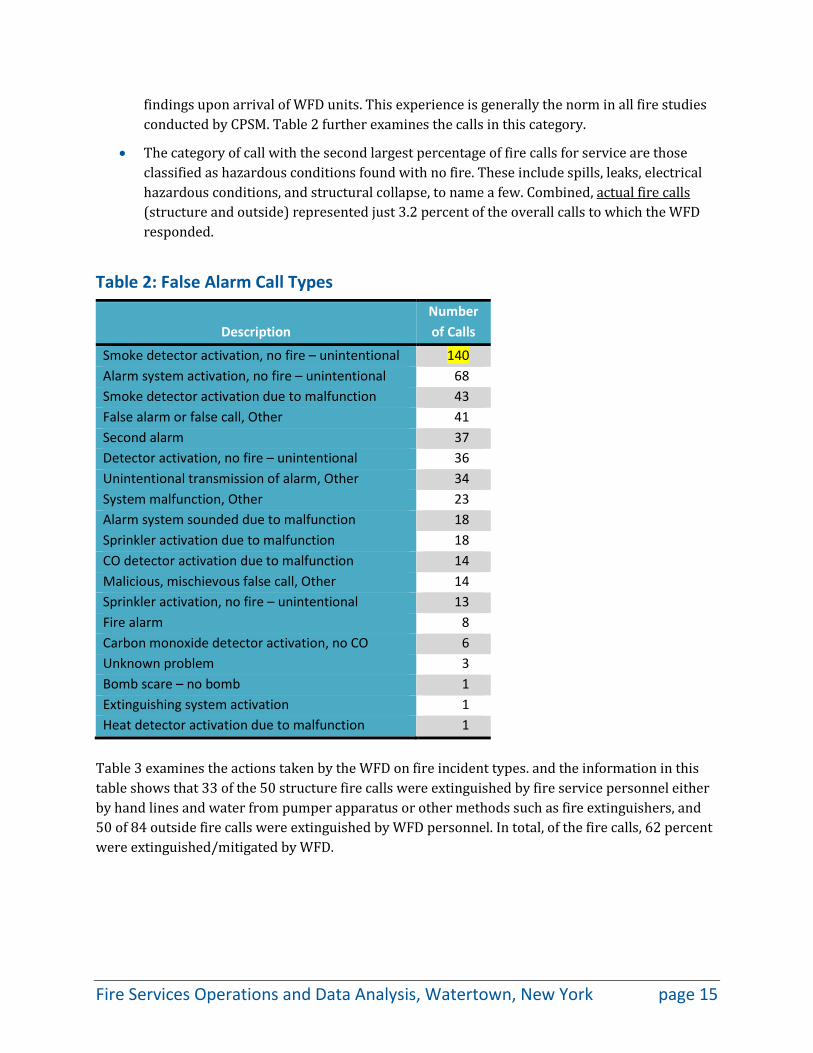
findings upon arrival of WFD units. This experience is generally the norm in all fire studies conducted by CPSM. Table 2 further examines the calls in this category.
• The category of call with the second largest percentage of fire calls for service are those classified as hazardous conditions found with no fire. These include spills, leaks, electrical hazardous conditions, and structural collapse, to name a few. Combined, actual fire calls (structure and outside) represented just 3.2 percent of the overall calls to which the WFD responded.
Table 2: False Alarm Call Types
Description Number of Calls
Smoke detector activation, no fire – unintentional 140 Alarm system activation, no fire – unintentional 68 Smoke detector activation due to malfunction 43 False alarm or false call, Other 41 Second alarm 37 Detector activation, no fire – unintentional 36 Unintentional transmission of alarm, Other 34 System malfunction, Other 23 Alarm system sounded due to malfunction 18 Sprinkler activation due to malfunction 18 CO detector activation due to malfunction 14 Malicious, mischievous false call, Other 14 Sprinkler activation, no fire – unintentional 13 Fire alarm 8 Carbon monoxide detector activation, no CO 6 Unknown problem 3 Bomb scare – no bomb 1 Extinguishing system activation 1 Heat detector activation due to malfunction 1
Table 3 examines the actions taken by the WFD on fire incident types. and the information in this table shows that 33 of the 50 structure fire calls were extinguished by fire service personnel either by hand lines and water from pumper apparatus or other methods such as fire extinguishers, and 50 of 84 outside fire calls were extinguished by WFD personnel. In total, of the fire calls, 62 percent were extinguished/mitigated by WFD.
Fire Services Operations and Data Analysis, Watertown, New York page 15
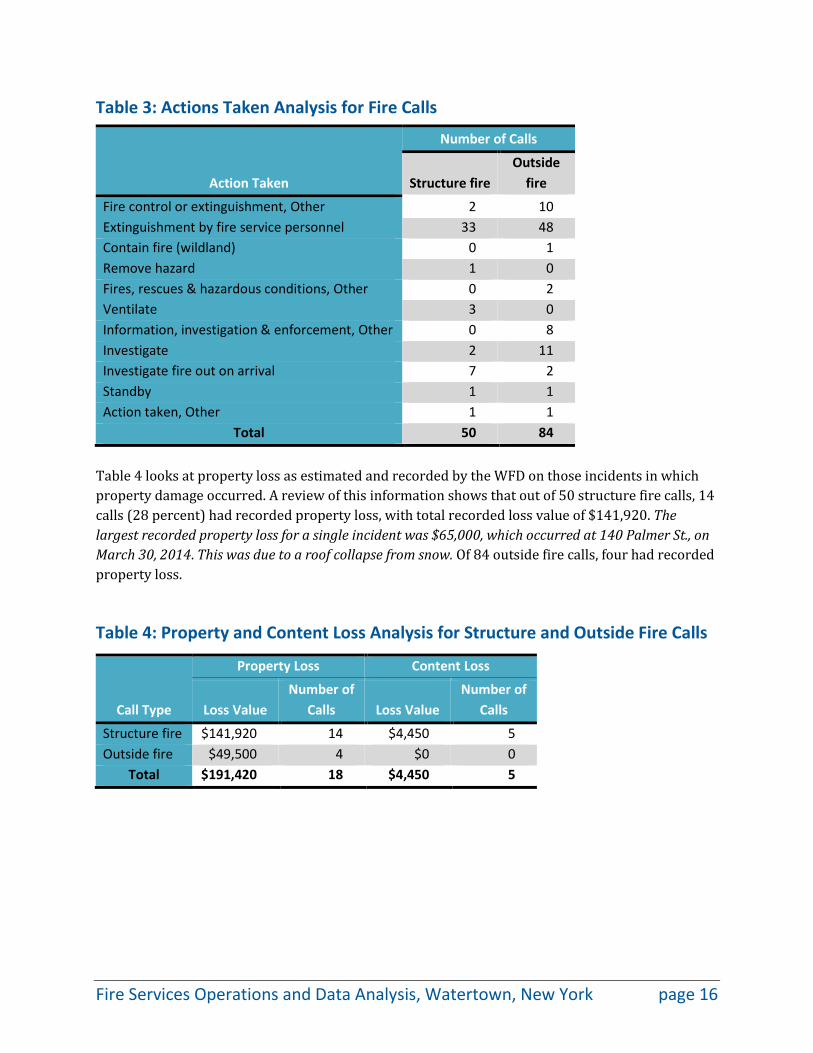
Table 3: Actions Taken Analysis for Fire Calls
Action Taken
Number of Calls
Structure fire Outside
fire
Fire control or extinguishment, Other 2 10 Extinguishment by fire service personnel 33 48 Contain fire (wildland) 0 1 Remove hazard 1 0 Fires, rescues & hazardous conditions, Other 0 2 Ventilate 3 0 Information, investigation & enforcement, Other 0 8 Investigate 2 11 Investigate fire out on arrival 7 2 Standby 1 1 Action taken, Other 1 1
Total 50 84
Table 4 looks at property loss as estimated and recorded by the WFD on those incidents in which property damage occurred. A review of this information shows that out of 50 structure fire calls, 14 calls (28 percent) had recorded property loss, with total recorded loss value of $141,920. The largest recorded property loss for a single incident was $65,000, which occurred at 140 Palmer St., on March 30, 2014. This was due to a roof collapse from snow. Of 84 outside fire calls, four had recorded property loss.
Table 4: Property and Content Loss Analysis for Structure and Outside Fire Calls
Call Type
Property Loss Content Loss
Loss Value Number of
Calls Loss Value Number of
Calls
Structure fire $141,920 14 $4,450 5 Outside fire $49,500 4 $0 0
Total $191,420 18 $4,450 5
Fire Services Operations and Data Analysis, Watertown, New York page 16
Emergency Medical Services Emergency medical services (EMS) transport for Watertown is provided by Guilfoyle Ambulance Service, Inc. Guilfoyle Ambulance is located in Watertown and operates sixteen advanced life support ambulances, three paramedic fly cars, and two advanced life support fly cars. Guilfoyle also provides other nonemergency and emergency transport services as well. Guilfoyle responds to more than 8,000 calls per year and has a New York state certificate of need to provide service to all of Jefferson County as well as many townships that are contiguous to the county.5
The WFD provides first response EMS from each of its fire stations. The majority of operational staff is certified at the emergency medical technician level. Each fire apparatus carries an automated external defibrillator and basic emergency medical kit and other ancillary medical splinting equipment. The WFD does provide a third person to Guilfoyle Ambulance Service on certain calls when needed.
The response matrix to EMS calls for service by the WFD is as follows:
• Low-priority EMS calls: Rescue apparatus from station 1 (this is citywide).
• High-priority EMS calls: Rescue apparatus from station 1 and closest engine by district.
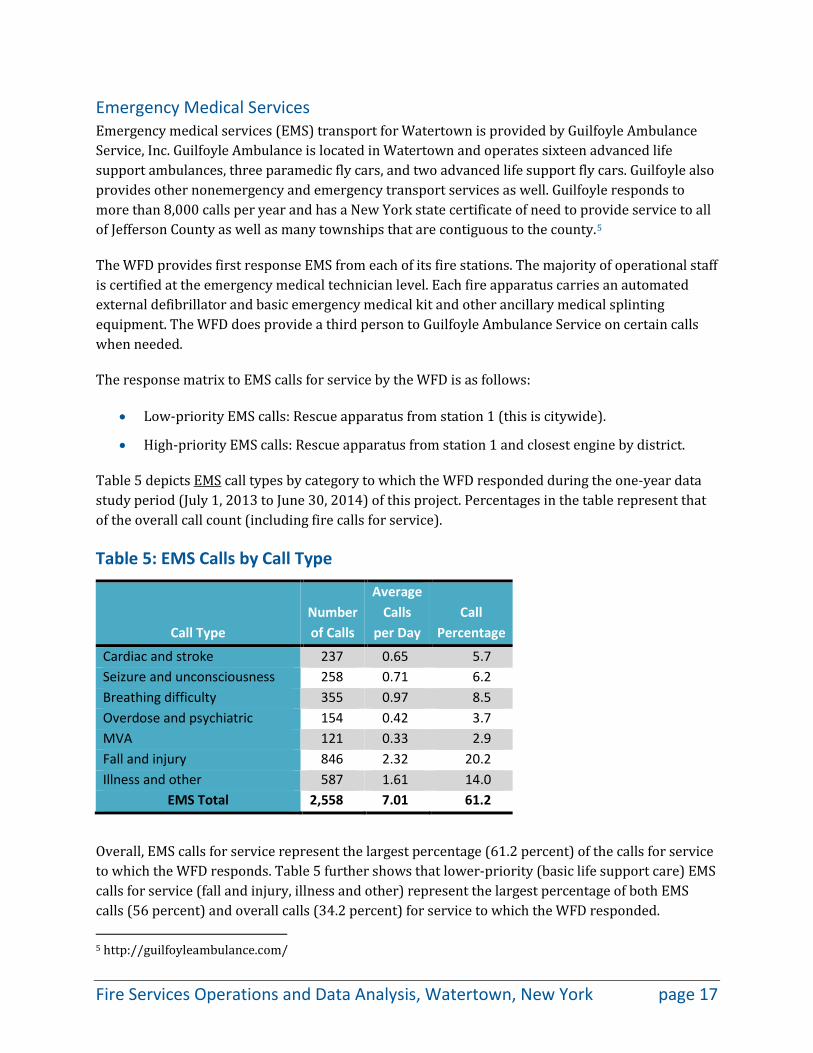
Table 5 depicts EMS call types by category to which the WFD responded during the one-year data study period (July 1, 2013 to June 30, 2014) of this project. Percentages in the table represent that of the overall call count (including fire calls for service).
Table 5: EMS Calls by Call Type
Call Type Number of Calls
Average Calls
per Day Call
Percentage
Cardiac and stroke 237 0.65 5.7 Seizure and unconsciousness 258 0.71 6.2 Breathing difficulty 355 0.97 8.5 Overdose and psychiatric 154 0.42 3.7 MVA 121 0.33 2.9 Fall and injury 846 2.32 20.2 Illness and other 587 1.61 14.0
EMS Total 2,558 7.01 61.2
Overall, EMS calls for service represent the largest percentage (61.2 percent) of the calls for service to which the WFD responds. Table 5 further shows that lower-priority (basic life support care) EMS calls for service (fall and injury, illness and other) represent the largest percentage of both EMS calls (56 percent) and overall calls (34.2 percent) for service to which the WFD responded.
5 http://guilfoyleambulance.com/
Fire Services Operations and Data Analysis, Watertown, New York page 17
Potentially higher-priority (advanced life support care) EMS calls for service, such as cardiac and stroke, seizure and unconsciousness, and breathing difficulty, represent 20.4 percent of all calls. This is not to say the typical lower-priority call type cannot be a higher-priority call upon arrival and a higher-priority call type cannot be a lower-priority call upon arrival, as this does occur.
A visit to the Jefferson County Dispatch Center (JCDC) revealed that the JCDC has in place an emergency medical dispatch (EMD) system, which is a national best practice. An EMD program is essential in any communications center that dispatches EMS resources, as it helps to ensure the right resources are dispatched, and that the appropriate and sometimes life-saving pre-arrival instructions are delivered by trained telecommunicators.6 According to the JCDC supervisor who was on duty during CPSM’s visit, the JCDC follows the EMD resource deployment recommendations when dispatching EMS calls for service to all participating agencies other than the WFD.
The WFD has implemented internal EMD instructions to the JCDC which lists specific call types and WFD units to dispatch, and which include the rescue apparatus on all low-priority calls for service and an additional fire resource on high-priority calls. This arrangement can create potential inefficiencies. According to Geoff Cady,7 an expert in medical dispatch systems: “The most visible features of an EMD system are its ability to identify the need for pre-arrival instruction and prioritize an EMS response.” Therefore, utilizing an EMD system in the manner for which it is designed, and sending the units and responders that are required based on the severity of the call, is the most efficient system the WFD can deploy in conjunction with Guilfoyle Ambulance Service. CPSM recommends the fire department work with the Jefferson County Dispatch Center and transition to the full use of the already implemented priority emergency medical dispatch system. CPSM further recommends the WFD consider responding only the closest unit to medical emergency calls for service and discontinue the practice of the rescue apparatus responding to all low-priority medical calls for service, as well as the dual response of the rescue apparatus and an engine to high-priority medical calls for service. CPSM further recommends the WFD only respond to high-priority life-threatening calls for service as identified by the emergency communications center priority emergency medical dispatch system.
Population, Demand for Services, and Operational Workload According to the U.S. Census Bureau, the City of Watertown had an estimated population in 2013 of 27,823. The official 2010 U.S. Census population was 27,031. Demographically, the City is 86.2 percent white, 6.0 percent African-American, 0.6 percent American Indian and Alaskan native, 1.8 percent Asian, and 5.6 percent Hispanic or Latino. As of the 2010 Census there were 12,562 total housing units in the City. Housing units in multi-unit structures (for the period 2008-2012) made up 56.3 percent of the total housing units. The average number of people per household was 2.25
6 ASTM Standard F1258, 2006, “Standard Practice for Emergency Medical Dispatch,” ASTM International, West Conshohocken, PA, 2003. www.astm.org. 7 Geoff Cady, “The Medical Priority Dispatch System:-A System and Product Overview,” http://www.emergencydispatch.org/articles/ArticleMPDS (Cady).html.
Fire Services Operations and Data Analysis, Watertown, New York page 18
people. Of the total population, 9.0 percent were below the age of five, 13.2 percent above the age of 65, and 52.2 percent female. The median household income (2008-2012) was reported as $38,511, with 19.8 percent of the population reported to be under the federal poverty level during the same period. When evaluating risk in a community, the demographic and socioeconomic components as depicted above must be considered in the total risk evaluation when considering staffing and deploying resources.
A December 2004 topical fire research paper released through the United States Fire Administration (USFA) found that:8
• Children under the age of 5 and the population over the age of 54 are at the highest risk of death in fires.
• Men are 1.6 times more likely to die in a fire than women.
• African-Americans and American Indians are at much greater risk of dying in a fire than the general population.
• The risk of dying in the South is higher than in other areas on the United States. The Midwest has the second highest risk.
• Populations at the lowest income levels are at a greater risk of dying in a fire than those with higher incomes.
It is concluded from this paper that when determining fire risk, factors such as age, demographic, and socio-economic factors are relevant. People in the Southeast (17.9 percent) and the Midwest (15.3 percent) were at higher risk than other regions of the country during the research period of this USFA paper. Further, certain demographic groups as noted above have a considerably higher risk of death or injury from fire than does the population as a whole. Lastly, one can see that the risk from fire is not the same for everybody.
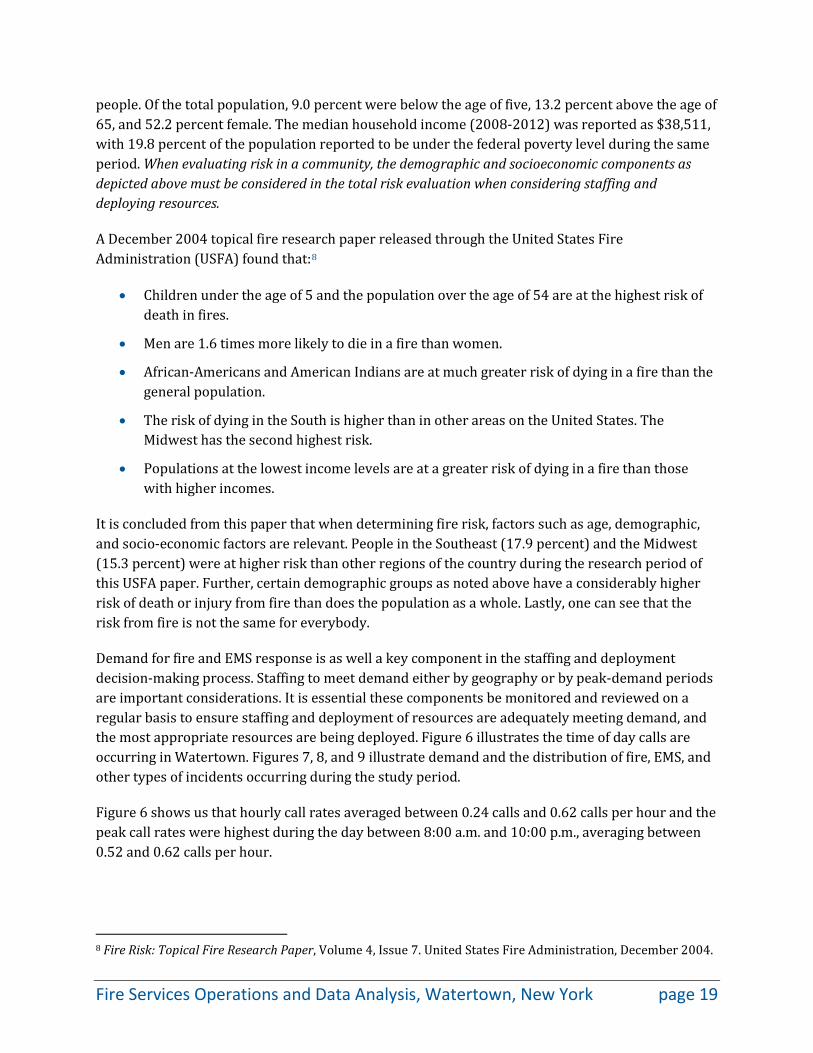
Demand for fire and EMS response is as well a key component in the staffing and deployment decision-making process. Staffing to meet demand either by geography or by peak-demand periods are important considerations. It is essential these components be monitored and reviewed on a regular basis to ensure staffing and deployment of resources are adequately meeting demand, and the most appropriate resources are being deployed. Figure 6 illustrates the time of day calls are occurring in Watertown. Figures 7, 8, and 9 illustrate demand and the distribution of fire, EMS, and other types of incidents occurring during the study period.
Figure 6 shows us that hourly call rates averaged between 0.24 calls and 0.62 calls per hour and the peak call rates were highest during the day between 8:00 a.m. and 10:00 p.m., averaging between 0.52 and 0.62 calls per hour.
8 Fire Risk: Topical Fire Research Paper, Volume 4, Issue 7. United States Fire Administration, December 2004.
Fire Services Operations and Data Analysis, Watertown, New York page 19
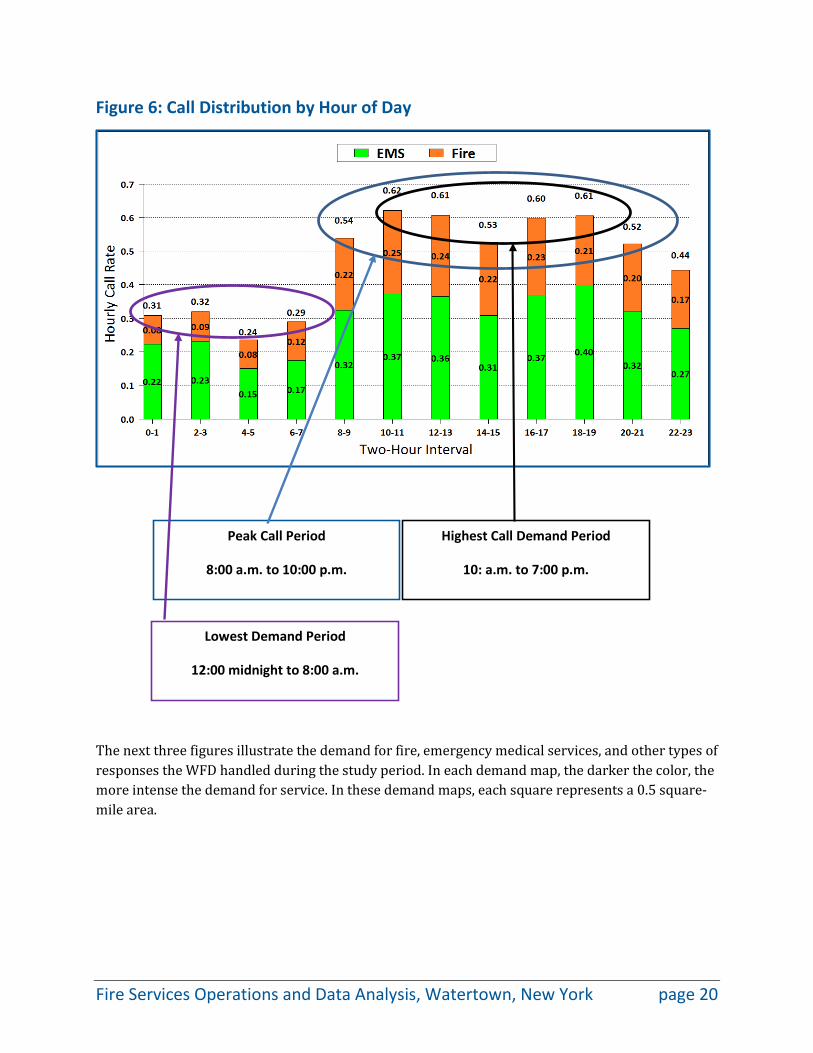
Figure 6: Call Distribution by Hour of Day
The next three figures illustrate the demand for fire, emergency medical services, and other types of responses the WFD handled during the study period. In each demand map, the darker the color, the more intense the demand for service. In these demand maps, each square represents a 0.5 square-mile area.
Peak Call Period
8:00 a.m. to 10:00 p.m.
Highest Call Demand Period
10: a.m. to 7:00 p.m.
Lowest Demand Period
12:00 midnight to 8:00 a.m.
Fire Services Operations and Data Analysis, Watertown, New York page 20
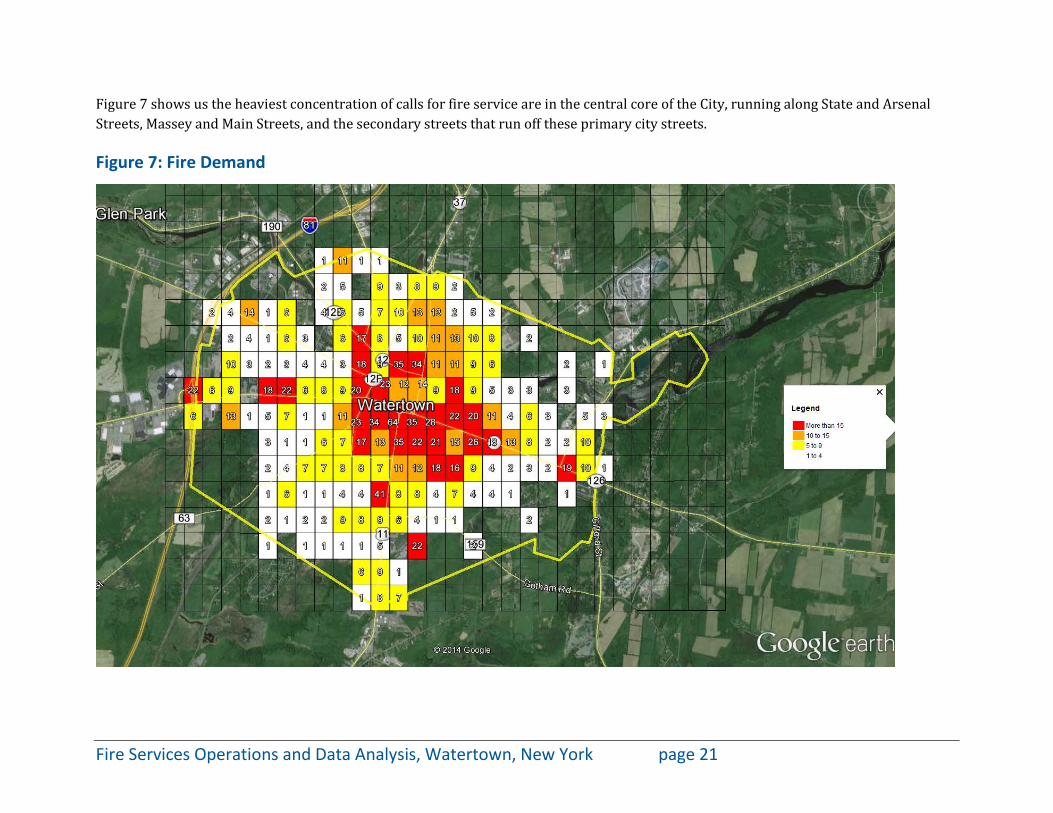
Figure 7 shows us the heaviest concentration of calls for fire service are in the central core of the City, running along State and Arsenal Streets, Massey and Main Streets, and the secondary streets that run off these primary city streets.
Figure 7: Fire Demand
Fire Services Operations and Data Analysis, Watertown, New York page 21
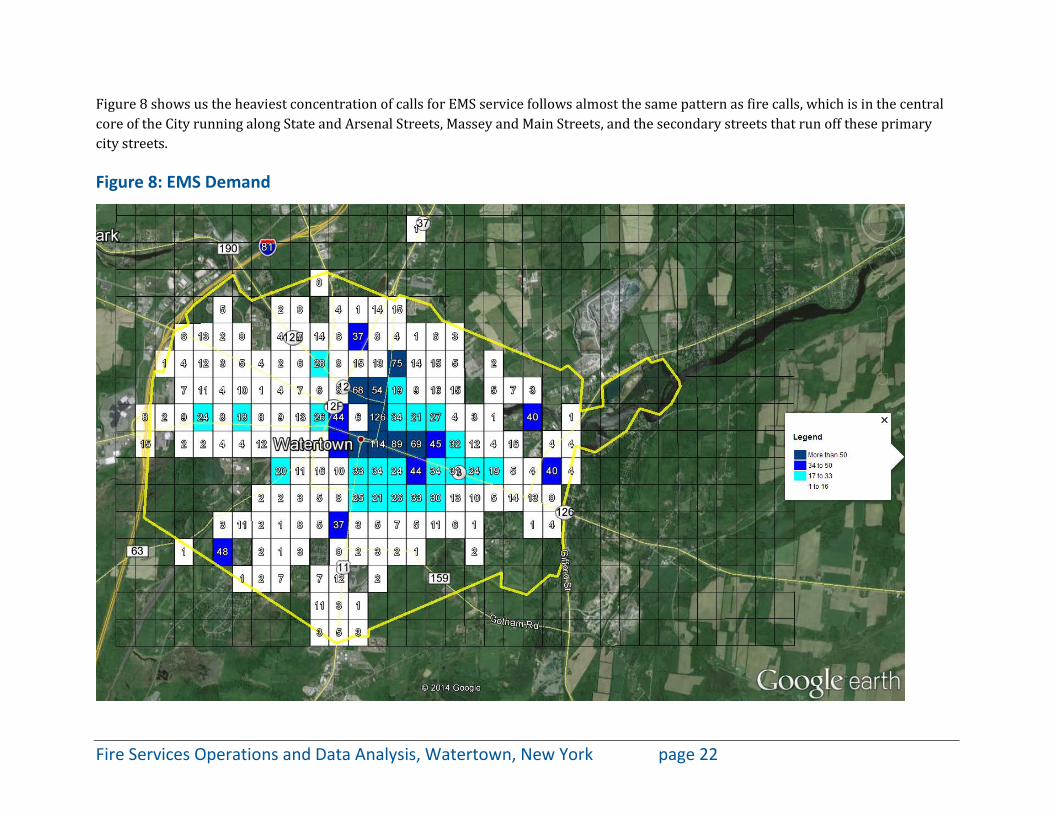
Figure 8 shows us the heaviest concentration of calls for EMS service follows almost the same pattern as fire calls, which is in the central core of the City running along State and Arsenal Streets, Massey and Main Streets, and the secondary streets that run off these primary city streets.
Figure 8: EMS Demand
Fire Services Operations and Data Analysis, Watertown, New York page 22
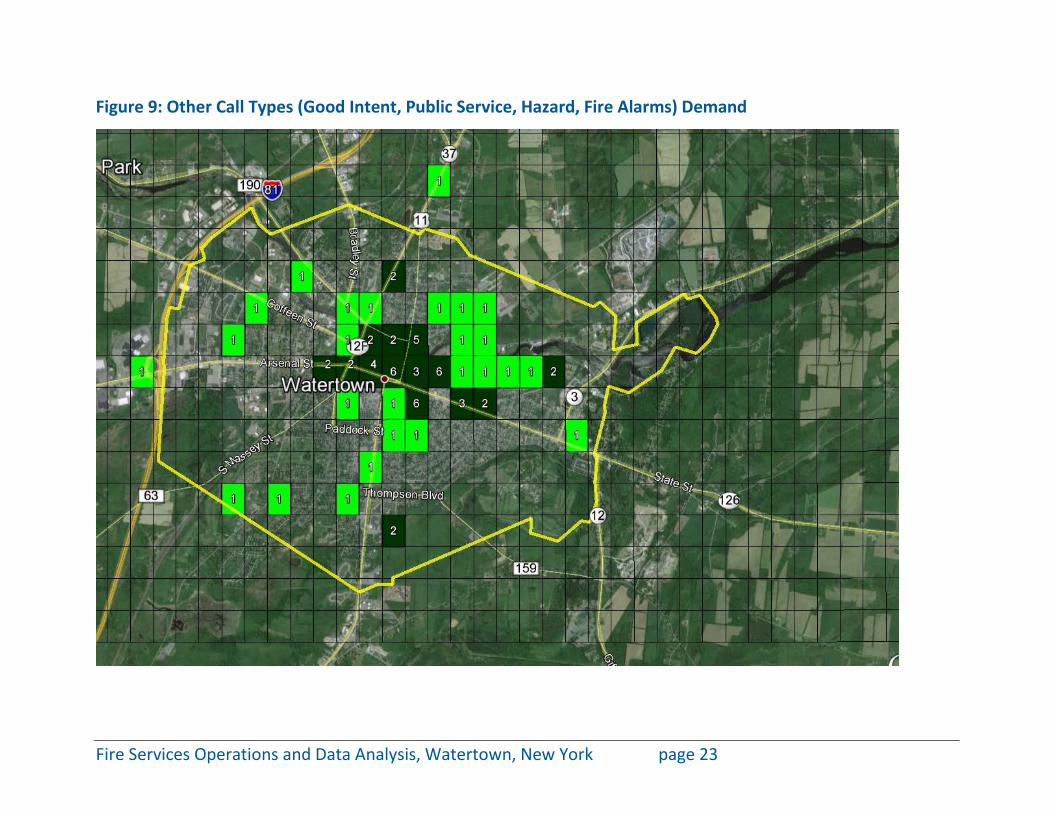
Figure 9: Other Call Types (Good Intent, Public Service, Hazard, Fire Alarms) Demand
Fire Services Operations and Data Analysis, Watertown, New York page 23
Organizational Analysis
Internal Planning Organizing and managing a contemporary fire and emergency medical services agency requires an optimal organizational structure as discussed previously in this report, and results-oriented and well-thought-out and achievable goals and objectives. In addition, to determine how well an organization or program is doing requires that these goals be measurable and that they are measured against desired results. Included in a fire organization’s key internal planning components should be a formal strategic plan, community risk and vulnerability assessment and plan, performance measures, and a succession plan.
The WFD does not have a formal strategic plan in place. The WFD does include prior budget year accomplishments and current budget year goals and objectives within its current year budget document. Defining clear goals and objectives for any organization through a formal strategic planning document establishes a resource that any member of the organization, or those external to the organization, can view and determine in what direction the organization is heading, and as well how the organization is planning to get there. Ultimately, the strategic plan defines the systems thinking the organization is conducting to serve its core mission.
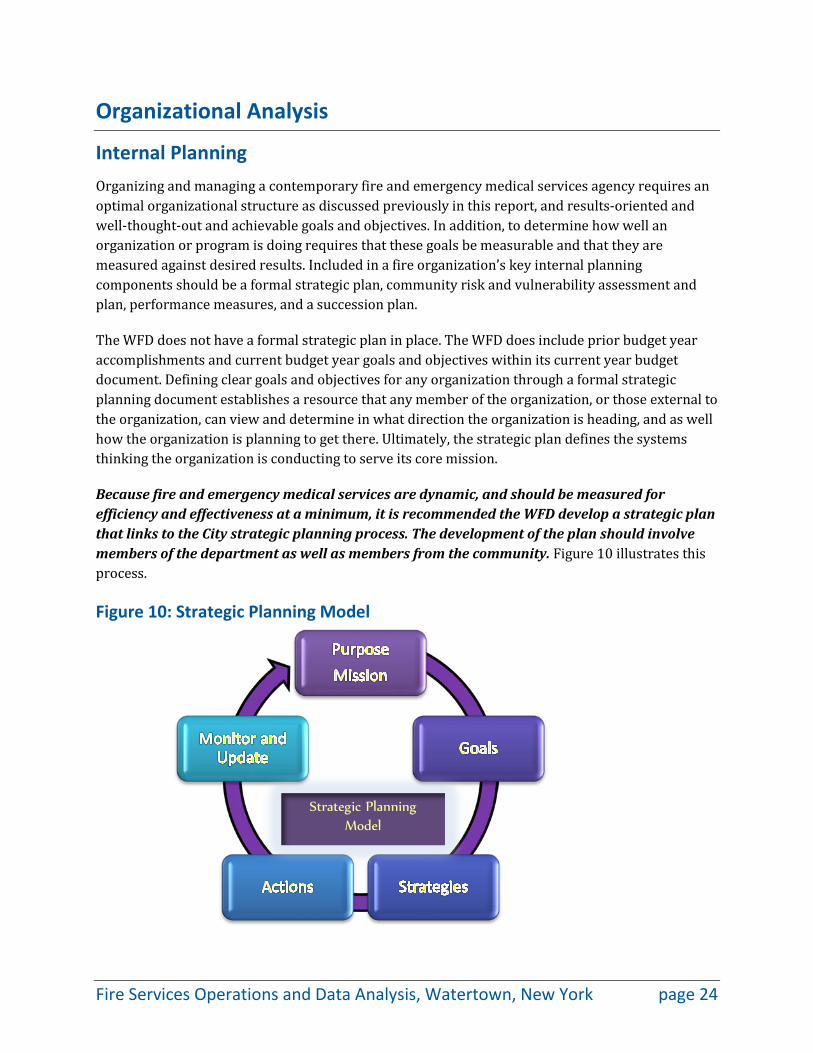
Because fire and emergency medical services are dynamic, and should be measured for efficiency and effectiveness at a minimum, it is recommended the WFD develop a strategic plan that links to the City strategic planning process. The development of the plan should involve members of the department as well as members from the community. Figure 10 illustrates this process.
Figure 10: Strategic Planning Model
Strategic Planning Model
Fire Services Operations and Data Analysis, Watertown, New York page 24

As there is no perfect strategic planning model for an organization, the above model provides an alternative from which the organization can begin to develop a strategic planning process, and eventually a strategic plan. Listed below are the steps for a successful approach to this critical process:9
Purpose-Mission: This is the statement that describes why an organization exists. This statement should describe what customer needs are intended to be met and with what services. Top-level management should agree what the mission statement/purpose is, understanding this will change over the years as the organization changes.
Selection of goals the organization must meet to accomplish its mission: Goals are general statements about what needs to be accomplished to meet the purpose, or mission, and address major issues facing the organization.
Identify specific approaches or strategies that must be implemented to reach each goal: The strategies are often what change the most as the organization eventually conducts more robust strategic planning, particularly by more closely examining the external and internal organizational environments.
Identify specific actions to implement each strategy: An organization must identify specific activities each division or major function must undertake to ensure it is effectively implementing each strategy. Objectives should be clearly worded to the extent that staff and the community can assess if the objectives have been met or not. Ideally, top management develops specific committees that each have a work plan, or set of objectives.
Monitor and update the plan: Regularly reflect on the extent to which the goals are being met and whether action plans are being implemented. Perhaps the most important feedback is positive feedback from customers, both internal and external.
Finally, one of the most important elements of strategic planning is performance measurement, which within local government describes service delivery performance so that both citizens and those providing the service have the same understanding. The customer will ask, “Did I get what I expected?” The service provider will ask, “Did I provide what was expected?” Ensuring that the answer to both questions is “yes” requires alignment of these expectations. To ensure this, CPSM recommends the WFD expand any current goals and objectives/performance measurement to include output, efficiency, effectiveness, and outcome measures, and that any measures are reported on a scheduled basis so that both internal members and the public can review the processes in place, and to ensure that these processes are being measured for continuous improvement. Performance measures as developed by the Governmental Accounting Standards Board are shown in Table 6.
9 McNamara, C.: (1996-2007) Basic Overview of Various Strategic Planning Models. Adapted from the Field Guide to Nonprofit Strategic Planning and Facilitation. (Minneapolis, MN: Authenticity Consulting, LLC).
Fire Services Operations and Data Analysis, Watertown, New York page 25
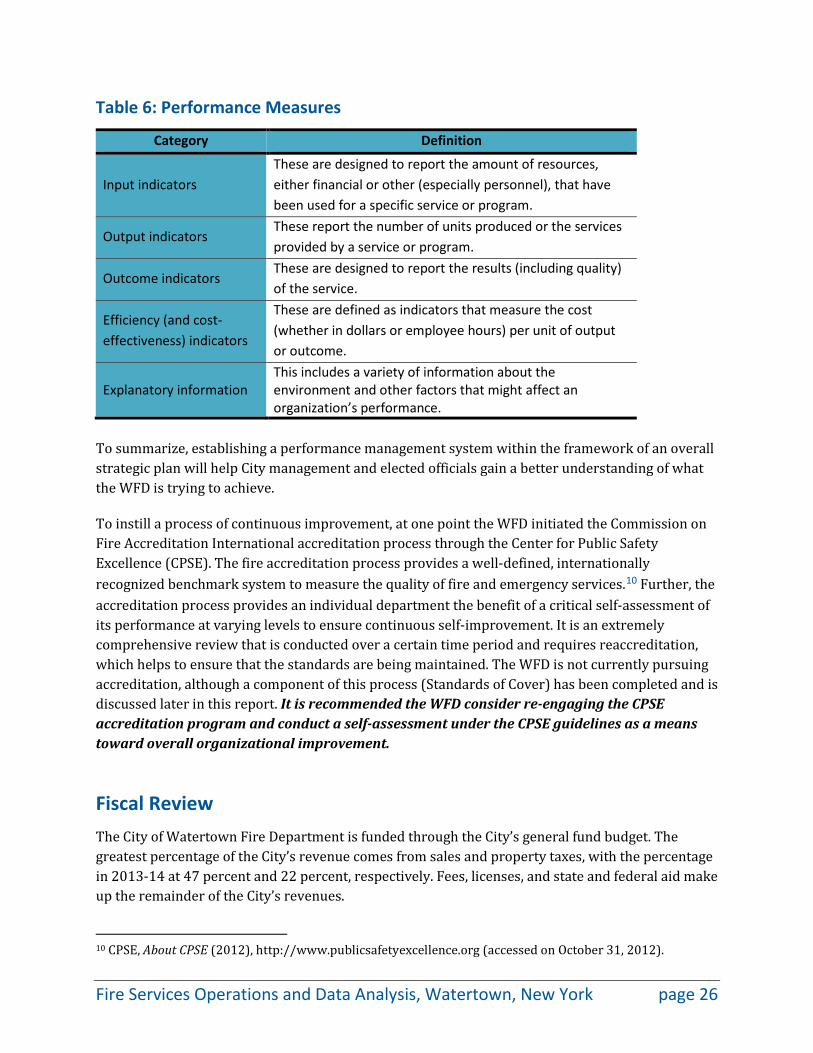
Table 6: Performance Measures
Category Definition
Input indicators These are designed to report the amount of resources, either financial or other (especially personnel), that have been used for a specific service or program.
Output indicators These report the number of units produced or the services provided by a service or program.
Outcome indicators These are designed to report the results (including quality) of the service.
Efficiency (and cost-effectiveness) indicators
These are defined as indicators that measure the cost (whether in dollars or employee hours) per unit of output or outcome.
Explanatory information This includes a variety of information about the environment and other factors that might affect an organization’s performance.
To summarize, establishing a performance management system within the framework of an overall strategic plan will help City management and elected officials gain a better understanding of what the WFD is trying to achieve.
To instill a process of continuous improvement, at one point the WFD initiated the Commission on Fire Accreditation International accreditation process through the Center for Public Safety Excellence (CPSE). The fire accreditation process provides a well-defined, internationally recognized benchmark system to measure the quality of fire and emergency services.10 Further, the accreditation process provides an individual department the benefit of a critical self-assessment of its performance at varying levels to ensure continuous self-improvement. It is an extremely comprehensive review that is conducted over a certain time period and requires reaccreditation, which helps to ensure that the standards are being maintained. The WFD is not currently pursuing accreditation, although a component of this process (Standards of Cover) has been completed and is discussed later in this report. It is recommended the WFD consider re-engaging the CPSE accreditation program and conduct a self-assessment under the CPSE guidelines as a means toward overall organizational improvement.
Fiscal Review The City of Watertown Fire Department is funded through the City’s general fund budget. The greatest percentage of the City’s revenue comes from sales and property taxes, with the percentage in 2013-14 at 47 percent and 22 percent, respectively. Fees, licenses, and state and federal aid make up the remainder of the City’s revenues.
10 CPSE, About CPSE (2012), http://www.publicsafetyexcellence.org (accessed on October 31, 2012).
Fire Services Operations and Data Analysis, Watertown, New York page 26
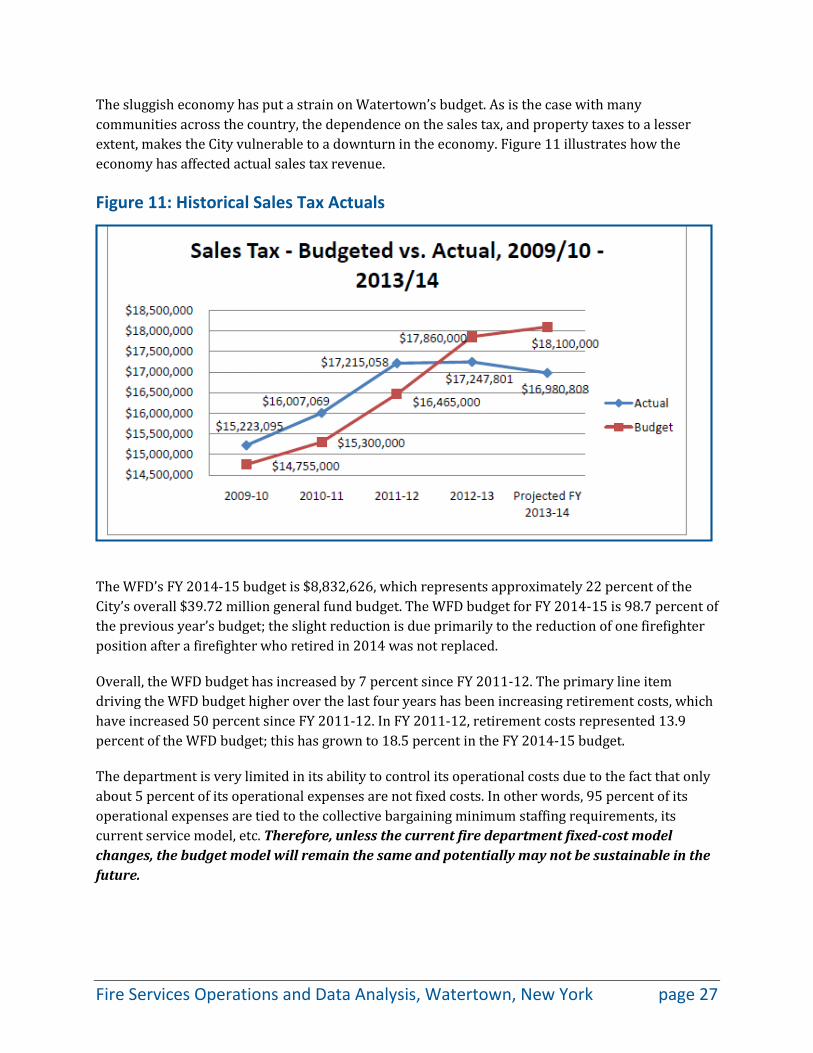
The sluggish economy has put a strain on Watertown’s budget. As is the case with many communities across the country, the dependence on the sales tax, and property taxes to a lesser extent, makes the City vulnerable to a downturn in the economy. Figure 11 illustrates how the economy has affected actual sales tax revenue.
Figure 11: Historical Sales Tax Actuals
The WFD’s FY 2014-15 budget is $8,832,626, which represents approximately 22 percent of the City’s overall $39.72 million general fund budget. The WFD budget for FY 2014-15 is 98.7 percent of the previous year’s budget; the slight reduction is due primarily to the reduction of one firefighter position after a firefighter who retired in 2014 was not replaced.
Overall, the WFD budget has increased by 7 percent since FY 2011-12. The primary line item driving the WFD budget higher over the last four years has been increasing retirement costs, which have increased 50 percent since FY 2011-12. In FY 2011-12, retirement costs represented 13.9 percent of the WFD budget; this has grown to 18.5 percent in the FY 2014-15 budget.
The department is very limited in its ability to control its operational costs due to the fact that only about 5 percent of its operational expenses are not fixed costs. In other words, 95 percent of its operational expenses are tied to the collective bargaining minimum staffing requirements, its current service model, etc. Therefore, unless the current fire department fixed-cost model changes, the budget model will remain the same and potentially may not be sustainable in the future.
Fire Services Operations and Data Analysis, Watertown, New York page 27
Infrastructure Overview
Fleet The provision of an operationally ready and strategically located fleet of mission-essential fire-rescue vehicles is fundamental to the ability of a fire-rescue department to deliver reliable and efficient public safety within a community.
The procurement, maintenance, and eventual replacement of aging response vehicles is one of the largest expenses incurred in sustaining a community’s fire-rescue department. While it is the personnel of the WFD who provide emergency services within the community, the department’s fleet of response vehicles is essential to operational success, delivering responders and the equipment/materials they employ to the scene of dispatched emergencies.
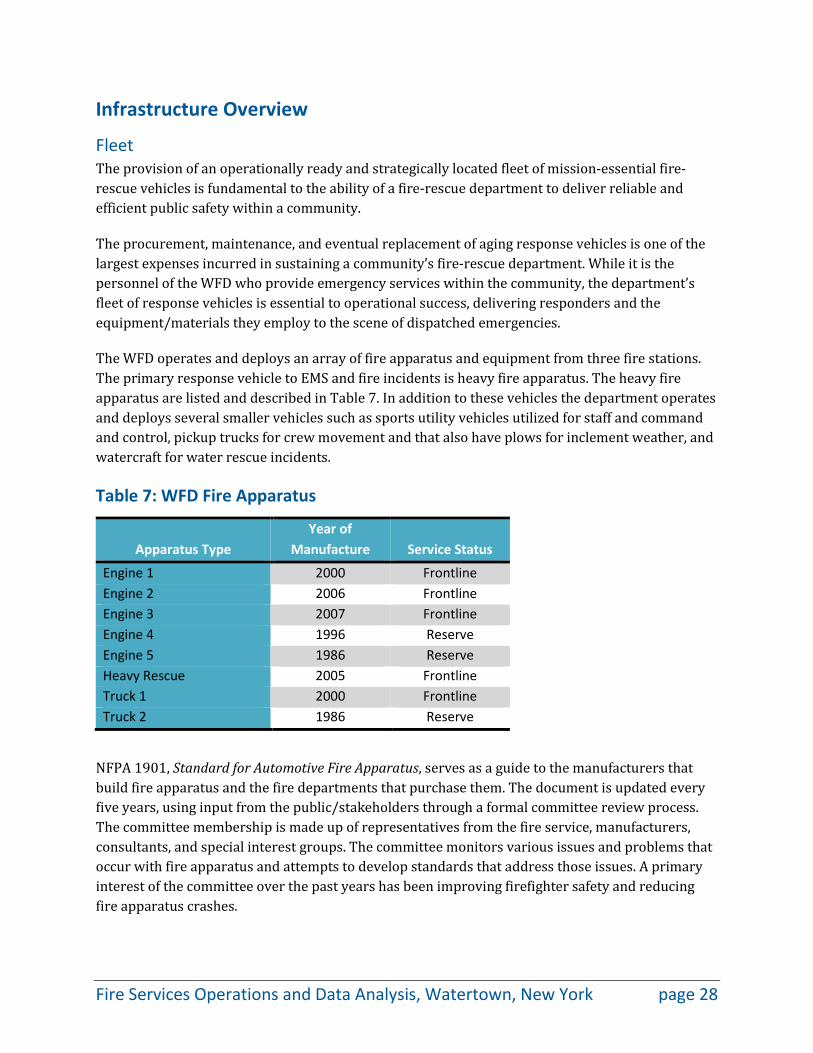
The WFD operates and deploys an array of fire apparatus and equipment from three fire stations. The primary response vehicle to EMS and fire incidents is heavy fire apparatus. The heavy fire apparatus are listed and described in Table 7. In addition to these vehicles the department operates and deploys several smaller vehicles such as sports utility vehicles utilized for staff and command and control, pickup trucks for crew movement and that also have plows for inclement weather, and watercraft for water rescue incidents.
Table 7: WFD Fire Apparatus
Apparatus Type Year of
Manufacture Service Status
Engine 1 2000 Frontline Engine 2 2006 Frontline Engine 3 2007 Frontline Engine 4 1996 Reserve Engine 5 1986 Reserve Heavy Rescue 2005 Frontline Truck 1 2000 Frontline Truck 2 1986 Reserve
NFPA 1901, Standard for Automotive Fire Apparatus, serves as a guide to the manufacturers that build fire apparatus and the fire departments that purchase them. The document is updated every five years, using input from the public/stakeholders through a formal committee review process. The committee membership is made up of representatives from the fire service, manufacturers, consultants, and special interest groups. The committee monitors various issues and problems that occur with fire apparatus and attempts to develop standards that address those issues. A primary interest of the committee over the past years has been improving firefighter safety and reducing fire apparatus crashes.
Fire Services Operations and Data Analysis, Watertown, New York page 28
The Annex Material in NFPA 1901 contains recommendations and work sheets to assist in decision making in vehicle purchasing. With respect to recommended vehicle service life, the following excerpt is noteworthy:
"It is recommended that apparatus greater than 15 years old that have been properly maintained and that are still in serviceable condition be placed in reserve status and upgraded in accordance with NFPA 1912, Standard for Fire Apparatus Refurbishing, to incorporate as many features as possible of the current fire apparatus standard. This will ensure that, while the apparatus might not totally comply with the current edition of the automotive fire apparatus standards, many improvements and upgrades required by the recent versions of the standards are available to the firefighters who use the apparatus.”
"Apparatus that were not manufactured to the applicable apparatus standards or that are over 25 years old should be replaced."
The impetus for these recommended service life thresholds is continual advances in occupant safety. Despite good stewardship and maintenance of emergency vehicles in sound operating condition, older vehicles simply do not incorporate the many advances in occupant safety like fully enclosed cabs, enhanced rollover protection and air bags, three-point restraints, antilock brakes, higher visibility, cab noise abatement/hearing protection, and a host of other improvements as reflected in each revision of NFPA 1901. These improvements provide safer response vehicles for those providing emergency services within the community, as well those “sharing the road” with these responders.
The current replacement schedule the WFD works from is:
• Engine apparatus: 15 years frontline, 10 years reserve.
• Truck (aerial) apparatus: 20 years frontline, 10 years reserve.
This schedule is in line with the NFPA 1901 benchmark regarding engine apparatus, but not aerial apparatus, and this should be reviewed by the department. In addition to this schedule, the WFD also factors in maintenance cost per year as well as available funding. The current capital improvement plan (CIP) budget is approved to support the fire department replacement plan as follows: engine 5 is scheduled for replacement in FY 14/15; truck 2 is scheduled for replacement in FY 16/17; and heavy rescue is scheduled for replacement in FY 18/19. Additionally, engine 1 is scheduled for refurbishment in FY 15/16. Aggregately, the five-year CIP allots $2,865,500 for fire department fleet replacement/refurbishment (includes some small vehicles as well).
Vehicle maintenance is performed by the City through the public works department. Fire pump and aerial apparatus hydraulic work is performed by a third-party vendor that specializes in this type of maintenance and repair. Required annual testing on ground and aerial ladders, fire pumps, and other equipment requiring such testing is performed by qualified third-party vendors.
As discussed within this report, the WFD primarily responds heavy fire apparatus on EMS and fire calls for service. While this is the traditional deployment model in the fire service, there are more
Fire Services Operations and Data Analysis, Watertown, New York page 29
efficient equipment deployment models, particularly for departments where EMS calls for service and low acuity fire responses make up the greatest workload demand. This is the case with the WFD (see Tables 1 and 5, above, for review). A potentially more efficient deployment model that focuses on reducing wear and tear on heavy fire apparatus and operating costs is to deploy lighter vehicles on low acuity calls for service, and which have been effectively screened in the emergency communications center and do not require a fire pump and hose, but do require a fire department response to abate the call for service. This can include EMS calls for service, and certain fire calls for service such as smoke odor and smoke detector calls with no smoke or fire present, power line down, and other public service calls that do not need a heavy fire apparatus as determined in the emergency communications center. CPSM recommends consideration of this this deployment model at all three stations, and certainly at a minimum at station 1.
Facilities Fire department capital facilities are exposed to some of the most intense and demanding uses of any public local government facility, as they are occupied 24 hours a day.11 The WFD operates out of three fire stations. The stations range in age from twenty-six years to thirty-six years, with fire station 1 being the oldest.
The day-to-day cost of operating a fixed capital facility can burden an operating budget. Some building maintenance and utility costs are charged directly to the WFD general operating budget. Any cost incurred for utilities and building repairs and maintenance must be controlled, and department members must be responsible for seeking opportunities for cost savings. Properly maintaining mechanical and structural components is critical to the longevity of the facility. Deferring routine maintenance creates inefficiencies of mechanical systems and increases costs for replacement and repairs.
The three WFD fire stations, because of their age, have ongoing and regular maintenance issues. There is no scheduled extensive rehabilitation work and there is no plan to replace or relocate any of the fire stations. The current capital improvement budget allocates $27,500 for overhead door work to station 1 during FY 15/16. It was noted that stations 1 and 2 have facilities with gender separation and that station 3 does not. There should be consideration for a planned future remedy for this so as not to create potential employee relations issues.
11 Compton and Granito, eds., Managing Fire and Rescue Services (Washington, DC: International City/County Management Association, 2002), 219.
Fire Services Operations and Data Analysis, Watertown, New York page 30
Training and Education A battalion chief serves as the municipal training officer for the WFD. The area of responsibility includes recruit, incumbent, and officer training. Fire training is legislated by the state of New York. Minimum standards are required for combat-level firefighters at the entry, incumbent, and officer level.
Entry-level firefighters are sent to the New York State Firefighter Academy in Montour Falls for initial training, and to receive basic firefighter training certification. An alternative recruit training site is located in Utica. The WFD also provides in-house training for those recruits hired who already possess the minimum standard training; this in-house training is focused on WFD specifics, and it also ensures the entry-level firefighter has the skills and competencies necessary to perform in the role of a firefighter.
Incumbent personnel (permanently appointed firefighters and officers) must annually receive 100 hours of minimum standards in-service training. The majority of this training is conducted in-house utilizing a combination of the municipal training officer, the on-duty battalion chief (shift commander), and the assigned company officer. The required annual training serves as an annual refresher and covers all components of the discipline. The municipal training officer also prepares an annual training schedule for incumbent training. Each platoon is assigned specific training or tasks that serve as training opportunities for almost every shift of the year each is scheduled.
Firefighter level personnel who are promoted to a lieutenant or captain supervisory level position (first-line supervisor) must have completed or must complete the 160-hour First Line Supervisors Training Program. This program is instructed at the New York City Fire Department training academy and satisfies the state requirement for supervisory level I responsibilities.12 The course is offered at no cost to the individual or department as it is funded through the state with cost reimbursement transferred to the City of New York Fire Department.
Emergency medical services training, certifications, and continuing education requirements are legislated by the state of New York and coordinated through the North Country EMS Program Agency.
Fire Prevention Fire prevention inspections are conducted from the bureau of code enforcement. In 1993 the fire prevention office, consisting of a fire captain and fire inspector (uniformed positions), was consolidated into the bureau of code enforcement. Today, this bureau consists of a code enforcement supervisor, two code enforcement officers, and the two uniformed fire department inspectors. This office utilizes the 2010 Fire Code of New York State (International Code Council
12 New York Codes, Rules and Regulations, Part 437.
Fire Services Operations and Data Analysis, Watertown, New York page 31
amended) for fire code compliance. For fire protection system plans review, this office utilizes the 2010 edition of the Building Code of New York State (International Code Council amended).
Whether fire prevention activities are located in the fire department or in the bureau of code enforcement, it is important to understand that fire suppression and response, although necessary to protect property, have little impact on preventing fire deaths. Rather, public fire education, fire prevention, and built-in fire protection systems are essential elements in protecting citizens from death and injury due to fire, smoke inhalation, and carbon monoxide poisoning. To this end it is important that contemporary fire prevention practices (strategies developed to prevent loss from a variety of emergencies) are carried out and measured. Those occupancies of public assembly where the risk of death or loss is great although the risk of fire is small or infrequent, along with properties that have a statistical history of fire problems and/or where fires or fire code issues and concerns are frequent, should be considered a priority and are scheduled for regular fire inspections.
Included in this is prefire planning and identifying certain structures and occupancies as target hazards (locally defined occupancies that pose specific risks to occupants and fire service responders). Prefire planning is the process of gathering and recording information to be used by decision makers (incident commanders) during a fire or other incident at a given property. Property and lives may be saved as the incident commander and decision makers have immediate access to critical information about the building, its contents, and any life safety concerns.
It is important that while conducting prefire planning that the company officer identify the property as a target hazard, gathering and posting the specific information that classifies the property as such. Additionally any peculiarities or obvious fire prevention issues that are identified while conducting prefire planning activities should be communicated to the fire prevention staff, or in the case of Watertown, to the bureau of code enforcement. This will ensure the potential fire code issue will be properly addressed. Prefire planning is also beneficial to responding fire companies in that they become familiar with buildings and occupancies in their district, identifying potential hazards, routes of ingress and egress, water supply and fire protection connections, apparatus positioning, and occupant life safety issues to name a few.
CPSM cannot stress enough the importance of the prefire planning process, identifying and classifying target hazards, and building and occupancy familiarization by fire companies. As such, CPSM recommends the current prefire planning process be fully implemented, and that this program include the assignment of buildings and occupancies to specific companies and shifts for completion, and that this is measured and reported on a quarterly basis, and that regular building and occupancy familiarization occur, as these are basic foundational practices of the fire service. CPSM further recommends that as fire companies are conducting prefire planning activities they work with the bureau of code enforcement and communicate in a timely manner and report obvious and potential fire prevention, loss, and life safety issues. CPSM is not recommending fire companies enforce the fire prevention code but rather report fire prevention concerns and issues to the bureau of code enforcement.
Fire Services Operations and Data Analysis, Watertown, New York page 32
Operational Analysis
Risk Assessment for Fire Services One area of internal planning that is a critical component for determining the proper staffing and deployment model for a fire department is the completion of a Community Fire Risk Assessment. What’s involved in a fire risk analysis? A fire department collects and organizes risk evaluation information about individual properties, and on the basis of the rated factors then derives a “fire risk score” for each property. This is done by assessing the needed fire flow, probability, consequences, a n d occupancy risk, and then establishing fire management zones. The score is then used to categorize the property as one of low-, moderate-, or high/maximum-risk.
The community fire risk assessment may also include determining and defining the differences in fire risk between a detached single-family dwelling, a multifamily dwelling, an industrial building, and a high-rise building by placing each in a separate category. Further, an overall community risk profile can be linked to historical response time data and demand, which is discussed later in this report. This analysis can then be used to informatively establish response time baselines and benchmarks.
Community risk and vulnerability assessment are essential elements in a fire department’s planning process. The WFD completed a comprehensive community risk and vulnerability assessment in 2004 as a part of its Standards of Cover process. This was and remains an extremely important process to maintain and utilize given the response area, types of structures, and density in certain parts of the City. Included in this assessment are both structural and nonstructural (weather, wildland-urban interface, transportation routes, etc.) components.
A Standards of Cover document, such as the WFD developed in 2004, examines a fire department’s ability to respond to and mitigate emergency incidents created by natural or human-made disasters. According to the Center for Public Safety Excellence,13 a Standards of Cover document represents those written procedures that determine the distribution and concentration of the fixed and mobile resources of a fire and EMS organization. A systems approach to deployment, rather than a one-size-fits-all prescriptive formula, allows for local determination of the level of deployment to meet the risks presented in each community. In this comprehensive approach, each agency can match local need (risks and expectations) with the costs of various levels of service.
According to a National Fire Protection Association (NFPA) paper on assessing community vulnerability, fire department operational performance is a function of three considerations: resource availability/reliability, department capability, and operational effectiveness.14 These elements can be further defined as:
13 Center for Public Safety Excellence, Commission on Fire Accreditation International, Chantilly, VA. 14 Fire Service Deployment, Assessing Community Vulnerability: From http://www.nfpa.org/assets/files/pdf/urbanfirevulnerability.pdf.
Fire Services Operations and Data Analysis, Watertown, New York page 33
Resource availability/reliability: The degree to which the resources are ready and available to respond.
Department capability: The ability of the resources deployed to manage an incident.
Operational effectiveness: The product of availability and capability. It is the outcome achieved by the deployed resources or a measure of the ability to match resources deployed to the risk level to which they are responding.15
The community risk and vulnerability assessment evaluates the community as a whole, and with regard to property, measures all property and the risk associated with that property and then segregates the property as either a high-, medium-, or low-hazard depending on factors such as the life and building content hazard, and the potential fire flow and staffing required to mitigate an emergency in the specific property. 16 The 2004 WFD Standards of Cover utilizes maximum, significant, moderate, and low as structural classifications and appropriately defines each in the document, expanding the maximum and significant classifications into separate classifications from the stand-alone high-hazard classification that NFPA utilizes.
As the current Standards of Cover document is ten years old, CPSM strongly recommends the WFD complete an update to this document to include conducting a new fire and community risk assessment. It should then link this updated assessment to the station and response time analysis and fire and EMS calls for service demand analysis provided in this report and include this information in the updated Standards of Cover.
Station and Response Time Analysis This section discusses response time from current stations. Response time and travel time from each station, when coupled with demand for service, are the appropriate drivers for making deployment decisions.
Dispatch time is the difference between the unit dispatch time and call received time. Turnout time is the difference between the unit time en route and the unit dispatch time. The fire department has the greatest control over these segments of the total response time. Travel time is the time interval that initiates when the unit is en route to the call and ends when the unit arrives at the scene. Response time (or total response time) is the time interval that begins when the call is received by the primary dispatch center and ends when the dispatched unit arrives on the scene to initiate action.
Most jurisdictions report all available response data at the mean or average. While the average provides easily understood statistics, a more conservative and stricter measure of total response
15 National Fire Service Data Summit Proceedings, U.S. Department of Commerce, NIST Tech Note 1698, May 2011. 16 Cote, Grant, Hall & Solomon, eds., Fire Protection Handbook (Quincy, MA: National Fire Protection Association, 2008), 12.
Fire Services Operations and Data Analysis, Watertown, New York page 34
time is the 90th percentile measurement. Simply explained, for 90 percent of calls, the first unit arrives within a specified time. A less conservative measure of typical performance is the average. For comparative purposes, the average (mean) in a normal distribution of data will be represented near the 50th percentile. The average is more susceptible to influence from outliers such as zero response times (walk-ins) and delayed responses, so the average will generally reside between the 40th and 60th percentiles.
According to NFPA 1710, Standard for the Organization and Deployment of Fire Suppression Operations, Emergency Medical Operations, and Special Operations to the Public by Career Departments, 2010 Edition, where the primary public safety answering point is the communications center, the alarm processing time or dispatch time should be less than or equal to 60 seconds 90 percent of the time.17 This standard also states that the turnout time should be less than or equal to 60 seconds for emergency medical services 90 percent of the time, and travel time shall be less than or equal to 240 seconds for the first responder basic life support (BLS) 90 percent of the time. The standard further states that the travel times for advanced life support (ALS) service should be 480 seconds 90 percent of the time. Fire responses are afforded an additional 20 seconds (80 seconds) for turnout time due to the impact of donning personal protective gear prior to beginning the travel segment while maintaining the same dispatch and travel requirements as the BLS EMS recommendations. NFPA 1710 response time criterion is utilized by CPSM as a benchmark for service delivery and in the overall staffing and deployment of a fire department. It is not a CPSM recommendation as a single criterion. There are several factors as discussed in this report that CPSM recommends be included in staffing and deployment decisions, such as understanding the fire risk and incident demand of the community, travel times from fire facilities, unit workload, and critical tasking. Table 8 depicts average dispatch, turnout, travel, and total response times of first arriving WFD units for fire and EMS category calls. Table 9 depicts the 90th percentile response time (NFPA 1710 benchmark).
17 NFPA 1710, Standard for the Organization and Deployment of Fire Suppression Operations, Emergency Medical Operations, and Special Operations to the Public by Career Departments, 2010 Edition, 7.
Fire Services Operations and Data Analysis, Watertown, New York page 35
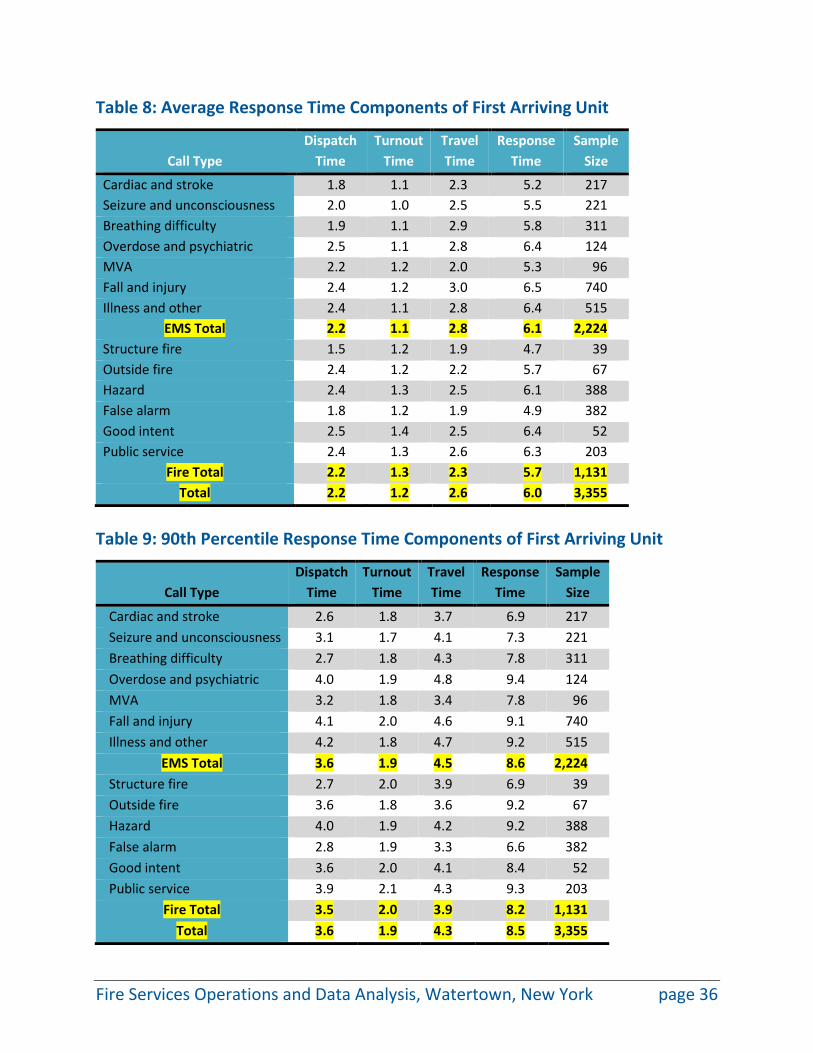
Table 8: Average Response Time Components of First Arriving Unit
Call Type Dispatch
Time Turnout
Time Travel Time
Response Time
Sample Size
Cardiac and stroke 1.8 1.1 2.3 5.2 217 Seizure and unconsciousness 2.0 1.0 2.5 5.5 221 Breathing difficulty 1.9 1.1 2.9 5.8 311 Overdose and psychiatric 2.5 1.1 2.8 6.4 124 MVA 2.2 1.2 2.0 5.3 96 Fall and injury 2.4 1.2 3.0 6.5 740 Illness and other 2.4 1.1 2.8 6.4 515
EMS Total 2.2 1.1 2.8 6.1 2,224 Structure fire 1.5 1.2 1.9 4.7 39 Outside fire 2.4 1.2 2.2 5.7 67 Hazard 2.4 1.3 2.5 6.1 388 False alarm 1.8 1.2 1.9 4.9 382 Good intent 2.5 1.4 2.5 6.4 52 Public service 2.4 1.3 2.6 6.3 203
Fire Total 2.2 1.3 2.3 5.7 1,131 Total 2.2 1.2 2.6 6.0 3,355
Table 9: 90th Percentile Response Time Components of First Arriving Unit
Call Type Dispatch
Time Turnout
Time Travel Time
Response Time
Sample Size
Cardiac and stroke 2.6 1.8 3.7 6.9 217 Seizure and unconsciousness 3.1 1.7 4.1 7.3 221 Breathing difficulty 2.7 1.8 4.3 7.8 311 Overdose and psychiatric 4.0 1.9 4.8 9.4 124 MVA 3.2 1.8 3.4 7.8 96 Fall and injury 4.1 2.0 4.6 9.1 740 Illness and other 4.2 1.8 4.7 9.2 515
EMS Total 3.6 1.9 4.5 8.6 2,224 Structure fire 2.7 2.0 3.9 6.9 39 Outside fire 3.6 1.8 3.6 9.2 67 Hazard 4.0 1.9 4.2 9.2 388 False alarm 2.8 1.9 3.3 6.6 382 Good intent 3.6 2.0 4.1 8.4 52 Public service 3.9 2.1 4.3 9.3 203
Fire Total 3.5 2.0 3.9 8.2 1,131 Total 3.6 1.9 4.3 8.5 3,355
Fire Services Operations and Data Analysis, Watertown, New York page 36
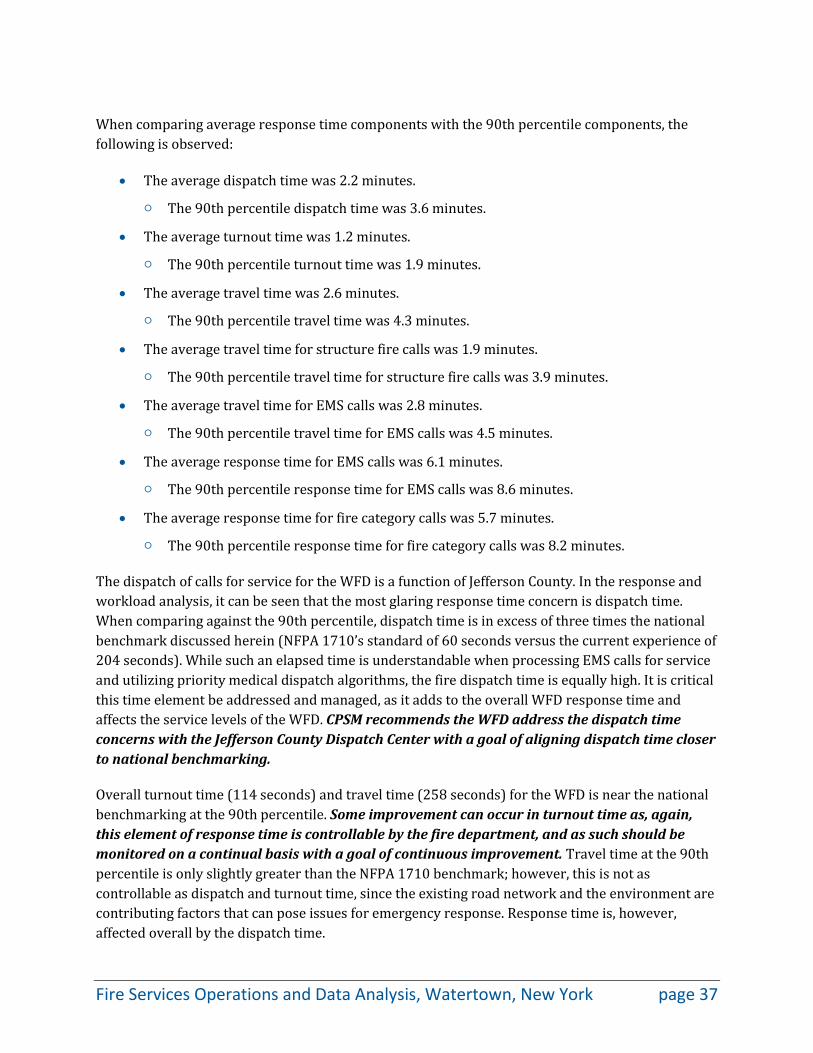
When comparing average response time components with the 90th percentile components, the following is observed:
• The average dispatch time was 2.2 minutes.
○ The 90th percentile dispatch time was 3.6 minutes.
• The average turnout time was 1.2 minutes.
○ The 90th percentile turnout time was 1.9 minutes.
• The average travel time was 2.6 minutes.
○ The 90th percentile travel time was 4.3 minutes.
• The average travel time for structure fire calls was 1.9 minutes.
○ The 90th percentile travel time for structure fire calls was 3.9 minutes.
• The average travel time for EMS calls was 2.8 minutes.
○ The 90th percentile travel time for EMS calls was 4.5 minutes.
• The average response time for EMS calls was 6.1 minutes.
○ The 90th percentile response time for EMS calls was 8.6 minutes.
• The average response time for fire category calls was 5.7 minutes.
○ The 90th percentile response time for fire category calls was 8.2 minutes.
The dispatch of calls for service for the WFD is a function of Jefferson County. In the response and workload analysis, it can be seen that the most glaring response time concern is dispatch time. When comparing against the 90th percentile, dispatch time is in excess of three times the national benchmark discussed herein (NFPA 1710’s standard of 60 seconds versus the current experience of 204 seconds). While such an elapsed time is understandable when processing EMS calls for service and utilizing priority medical dispatch algorithms, the fire dispatch time is equally high. It is critical this time element be addressed and managed, as it adds to the overall WFD response time and affects the service levels of the WFD. CPSM recommends the WFD address the dispatch time concerns with the Jefferson County Dispatch Center with a goal of aligning dispatch time closer to national benchmarking.
Overall turnout time (114 seconds) and travel time (258 seconds) for the WFD is near the national benchmarking at the 90th percentile. Some improvement can occur in turnout time as, again, this element of response time is controllable by the fire department, and as such should be monitored on a continual basis with a goal of continuous improvement. Travel time at the 90th percentile is only slightly greater than the NFPA 1710 benchmark; however, this is not as controllable as dispatch and turnout time, since the existing road network and the environment are contributing factors that can pose issues for emergency response. Response time is, however, affected overall by the dispatch time.
Fire Services Operations and Data Analysis, Watertown, New York page 37
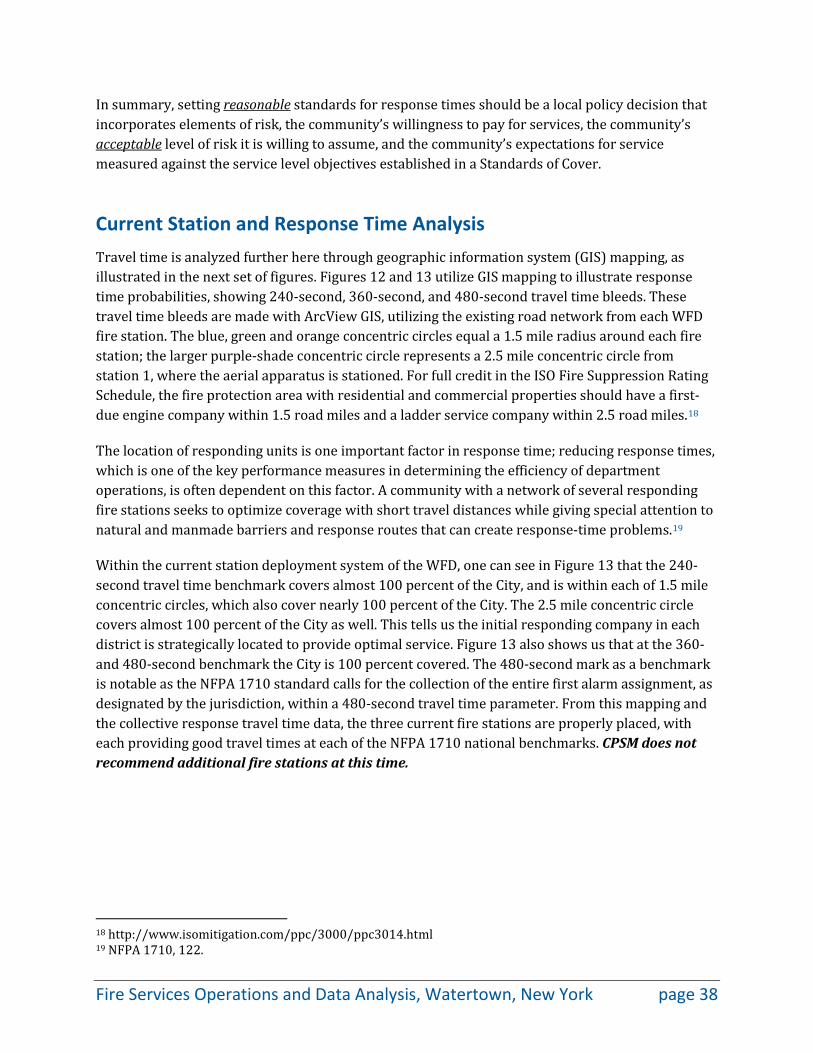
In summary, setting reasonable standards for response times should be a local policy decision that incorporates elements of risk, the community’s willingness to pay for services, the community’s acceptable level of risk it is willing to assume, and the community’s expectations for service measured against the service level objectives established in a Standards of Cover.
Current Station and Response Time Analysis Travel time is analyzed further here through geographic information system (GIS) mapping, as illustrated in the next set of figures. Figures 12 and 13 utilize GIS mapping to illustrate response time probabilities, showing 240-second, 360-second, and 480-second travel time bleeds. These travel time bleeds are made with ArcView GIS, utilizing the existing road network from each WFD fire station. The blue, green and orange concentric circles equal a 1.5 mile radius around each fire station; the larger purple-shade concentric circle represents a 2.5 mile concentric circle from station 1, where the aerial apparatus is stationed. For full credit in the ISO Fire Suppression Rating Schedule, the fire protection area with residential and commercial properties should have a first-due engine company within 1.5 road miles and a ladder service company within 2.5 road miles.18
The location of responding units is one important factor in response time; reducing response times, which is one of the key performance measures in determining the efficiency of department operations, is often dependent on this factor. A community with a network of several responding fire stations seeks to optimize coverage with short travel distances while giving special attention to natural and manmade barriers and response routes that can create response-time problems.19
Within the current station deployment system of the WFD, one can see in Figure 13 that the 240-second travel time benchmark covers almost 100 percent of the City, and is within each of 1.5 mile concentric circles, which also cover nearly 100 percent of the City. The 2.5 mile concentric circle covers almost 100 percent of the City as well. This tells us the initial responding company in each district is strategically located to provide optimal service. Figure 13 also shows us that at the 360- and 480-second benchmark the City is 100 percent covered. The 480-second mark as a benchmark is notable as the NFPA 1710 standard calls for the collection of the entire first alarm assignment, as designated by the jurisdiction, within a 480-second travel time parameter. From this mapping and the collective response travel time data, the three current fire stations are properly placed, with each providing good travel times at each of the NFPA 1710 national benchmarks. CPSM does not recommend additional fire stations at this time.
18 http://www.isomitigation.com/ppc/3000/ppc3014.html 19 NFPA 1710, 122.
Fire Services Operations and Data Analysis, Watertown, New York page 38
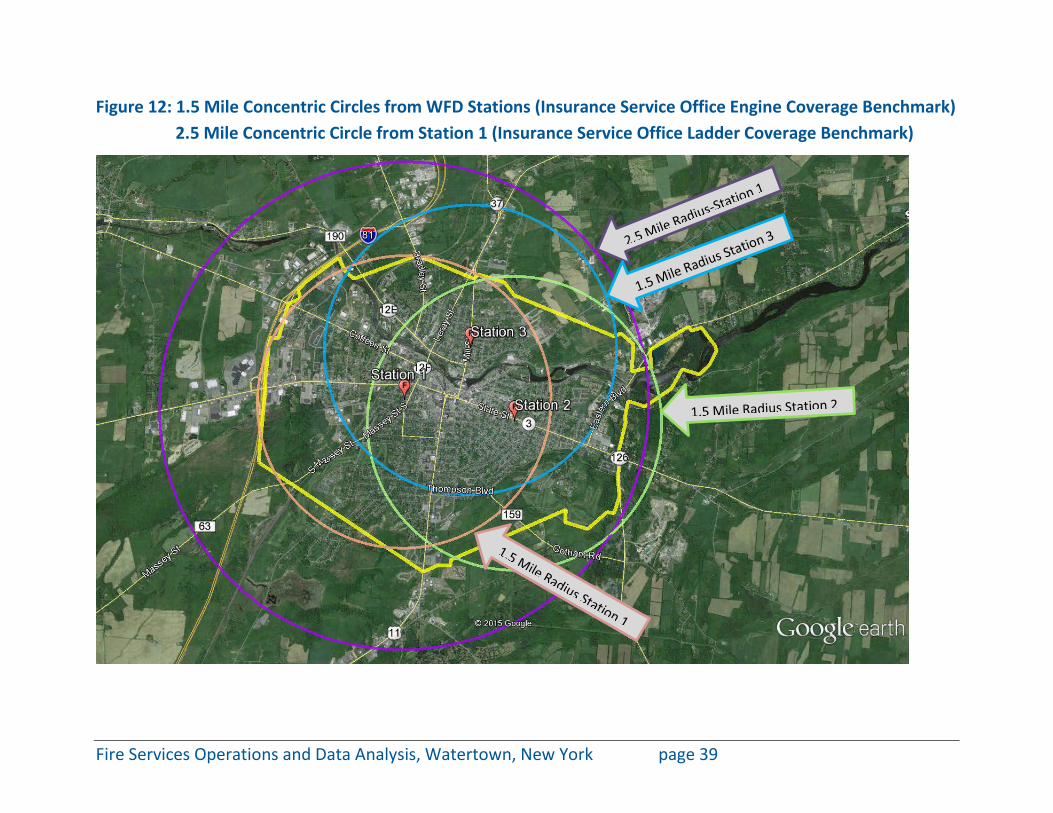
Figure 12: 1.5 Mile Concentric Circles from WFD Stations (Insurance Service Office Engine Coverage Benchmark) 2.5 Mile Concentric Circle from Station 1 (Insurance Service Office Ladder Coverage Benchmark)
Fire Services Operations and Data Analysis, Watertown, New York page 39
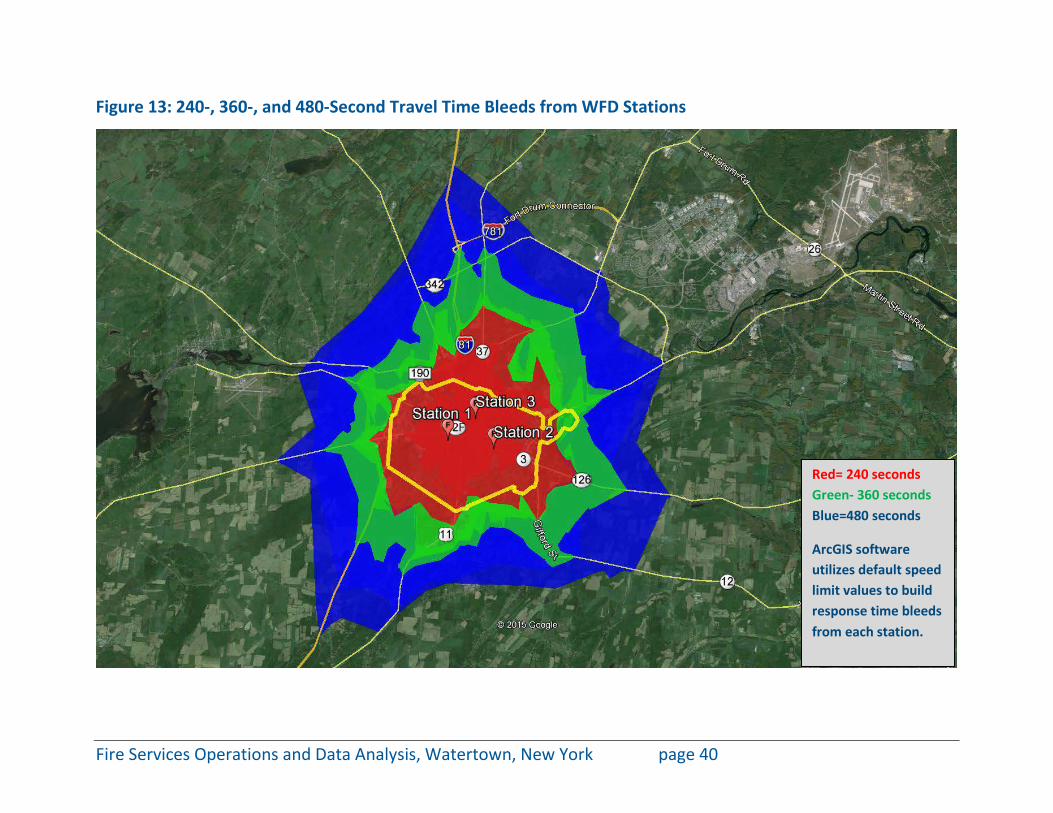
Figure 13: 240-, 360-, and 480-Second Travel Time Bleeds from WFD Stations
Red= 240 seconds Green- 360 seconds Blue=480 seconds
ArcGIS software utilizes default speed limit values to build response time bleeds from each station.
Fire Services Operations and Data Analysis, Watertown, New York page 40
External System Relationships Local governments use many types of intergovernmental agreements to enhance local fire protection, with mutual aid and automatic aid agreements among the most common types of these shared service agreements. In the case of a service delivery system such as the WFD’s, where staffing is maximized through the cross-staffing of units, it is critical that automatic and mutual aid agreements and an understanding of shared services be in place. Communities such as Watertown and those contiguous to Watertown rely on surrounding jurisdictions to augment moderate- and high-risk incident responses.
It is also important that fire departments be able to quickly access extra and/or specialized resources in the aftermath of a disaster or other large-scale event. In addition, because these types of incidents do not respect jurisdictional boundaries, they often require coordinated response. Sharing specialized capabilities, such as aerial ladder apparatus and technical rescue team response personnel and units, also helps departments reduce costs without impacting service delivery. These circumstances point to the critical need for good working relationships with other fire and EMS organizations.
The WFD participates in the Jefferson County Mutual Aid Fire Plan, which is a countywide mutual aid plan. This plan (implemented in 1983 with latest revision in 2004), among other administrative components, provides for service between agencies within Jefferson County when additional resources are needed to mitigate an emergency. The agencies that may participate include all cities, towns, villages, and fire districts of the county. Participating agencies are only obligated to provide requested equipment unless notification has been made that the jurisdiction cannot (see next paragraph). The WFD will respond appropriate resources if these resources are available.
The WFD also is signatory to a memorandum of understanding (MOU) with Jefferson County regarding the storage of certain hazardous material response equipment, periodic inspection of this equipment, and response of the equipment with staffing (when available) and joint training in the hazardous materials discipline. An MOU of this type is common across the country and it serves the City as well as the county in the mitigation of a hazardous materials incident.
Lastly, the WFD is signatory to a water rescue automatic aid agreement with the town of Watertown and the Northpole and Glen Park Fire Departments. These agencies are contiguous to the City and share a common waterway (Black River). The WFD agrees to automatically respond a specified crew, resources, and command officer should a water rescue emergency occur outside of the WFD’s jurisdiction. It is also common for this type of agreement to occur when one jurisdiction staffs, trains, and resources a specific discipline.
As with any agreement or memorandum of understanding in place in a local government and which is interlocal or otherwise, it is a best practice to routinely review and update in-place agreements or memorandums of understanding. While there is no standard for this, reviews of agreements that include revenue or expenditures generally occur or are is driven by the agreement expiration. Those agreements such as discussed herein generally do not have a termination or expiration date
Fire Services Operations and Data Analysis, Watertown, New York page 41
and renew automatically or without review for many years (the county mutual aid fire plan calls for an annual review). Over this period of time leadership and management positions change. Therefore, it is recommended that the WFD review all interlocal agreements, MOUs, and memorandums that are in-place and which affect response of assets into another jurisdiction or which call for response into the City. This review should ensure the information is current, meets all legal and risk management components, and that all the parties can continue to provide stated services, or if services can be enhanced or changed.
Operational Staffing and Deployment The WFD operational staffing personnel are deployed under a 10/14 schedule, meaning a shift/platoon is scheduled for ten hours during the day shift (8:00 a.m. to 6:00 p.m.) and fourteen hours during the night shift (6:00 p.m. to 8:00 a.m.). With this staffing configuration there are four shifts or platoons. Each platoon is scheduled on-duty for three day shifts, is off-duty for three days, and is then scheduled for three night shifts. As delineated in Article 5, Section 1a of the current collective bargaining agreement, this schedule is averaged over a twelve-week period, and with the inclusion of a single 24-hour “Kelley Day” for each operational employee, the average workweek is then forty hours.
As discussed, the WFD is currently budgeted for seventy-eight total personnel, with seventy-two assigned to fire operations. Under this model there are eighteen personnel assigned to each shift when the department is at full strength (at the time of this report there were two vacancies at the firefighter level). Article 5, Section 4b delineates operational shift minimum staffing. The current collective bargaining agreement stipulates a minimum strength of fourteen members, excluding the battalion chief position. Section 4b is further interpreted by the department to mean that when staffing levels fall below fourteen due to a prolonged incident or a mutual aid response that reduces available staffing in the City, off-duty firefighters are recalled to maintain the fourteen-person minimum staffing. If available during staff work hours (Monday through Friday), on-duty administrative staff (training chief, public education officer, fire prevention inspectors) are utilized to meet the fourteen-person minimum staffing.
As discussed, the WFD operates out of three stations. The following units are deployed with the minimum staffing noted, per Article 5, Section 8 of the collective bargaining agreement (minimum of fourteen-personnel excluding the battalion chief):
• Station 1: Engine– Minimum Staffing of 3
○ Truck (aerial apparatus) – Minimum Staffing of 3
○ Rescue- Minimum Staffing of 2
○ Battalion Chief (shift commander) – Minimum Staffing of 1
• Station 2: Engine - Minimum Staffing of 3
• Station 3: Engine - Minimum Staffing of 3
Fire Services Operations and Data Analysis, Watertown, New York page 42
Aside from the staffing alternatives discussed below, CPSM does not recommend any addition to the minimum unit staffing currently in place as described above.
Article 5, Section 8 of the collective bargaining agreement further stipulates that at no time is there to be fewer than eleven operational personnel available to respond to a first alarm assignment. This drives the recall of off-duty operational personnel as well, which is a driver for overtime.
The recall of personnel to meet the intent of Article 5 Sections 4b and 8 is managed through departmental standard operating guidelines (3.25 and 3.37). These guidelines delineate recall methods and define when certain mutual aid responses occur by the WFD when a recall may occur. Recalls associated with in-City deployment (working incidents that commit one or more units for extended periods) are managed by the incident commander. Normally, the two opposite shifts are utilized for recalls and this creates overtime. The WFD does not utilize volunteer members as a surge capacity asset and should consider this as an alternative to career member recall. Utilizing volunteer members engages potential and available community members, creates efficiencies in surge staffing, and avails the department of trained volunteer members for other, related staffing assignments.
As discussed above, there are eighteen personnel assigned to each of the four platoons. The additional three firefighter personnel assigned to each platoon (above the fourteen-person minimum staffing plus the battalion chief) are utilized to fill vacancies created by scheduled and unscheduled leave, and will temporarily fill a vacancy created by an employee separation. Article 6, Section 1b stipulates a maximum of six operational personnel (excluding the battalion chief) are allowed to take annual leave during one period (24 hours or aggregate of a 10-hour and 14-hour period). One additional leave slot is available to the battalion chief as well during a period as described above. The battalion chief is not included in the current leave schedule, but should be as this position is included in the CBA and is allotted three vacation picks, as are all other operational CBA members. There is also one operational person scheduled off on a Kelley day per work segment (10 hours or 14 hours). Potentially then, there can be up to nine operational staff members off on scheduled leave during one twenty-four-hour period. In addition to this, there is the potential for unscheduled leave (sick, FMLA, and bereavement, as examples), and as well scheduled leave such as training and union leave.
As one can see, the three additional personnel per platoon can be absorbed quickly by scheduled and unscheduled leave, which then drives the use of overtime to satisfy minimum staffing in accordance with the collective bargaining agreement.
Deployment of resources for incidents is managed through standard operating guidelines. Other than emergency medical services, which is described above, fire service calls generally deploy the following resources:
• Fire alarms, low/moderate risk: 2 engines/1 truck/1 Battalion Chief.
• Fire alarms, high/substantial risk: 3 engines/1 truck/1 rescue/1 Battalion Chief.
• Structural fires: 3 engines/1 truck/1 rescue/1 Battalion Chief.
Fire Services Operations and Data Analysis, Watertown, New York page 43
• Outside fires: 1 engine (additional units dependent on call type).
• Service calls: 1 engine (1 rescue/1 Battalion Chief, dependent on call type)
Standard operating guidelines prescribe certain actions by either a single company, the actions to be taken by a second engine if deployed with an engine already on scene, the truck and rescue company, and so on. This is a best practice, as it manages expectations and creates expectations and efficient operations for companies and for the incident commander.
Alternatives to the current staffing model include demand or peak-load staffing of the rescue apparatus, or cross-staffing between the truck and rescue apparatus. Currently, the truck responds to 1.9 runs per day on average. Fifty-nine percent of these runs for the truck are false alarms. The truck company averages thirty-five minutes a day on calls for service. The rescue averages 8.7 runs per day; however, 74 percent of these calls are EMS responses and 13 percent are false alarm responses. By utilizing EMS priority medical dispatch and a modified EMS fire response as discussed above, EMS workload for the rescue would be reduced significantly.
Based on the analysis of the current workload and the recommended changes to the WFD response to EMS calls for service, one alternative the City should consider is the cross-staffing of the rescue and the truck with a single crew of three members. The truck would be deployed on those calls where the aerial device would potentially be needed and the rescue would be deployed on those calls where staffing and the complement of standard and specialized equipment and crew resource skills are needed. This deployment model maximizes staffing and deployment of apparatus as well as creates efficiencies in staffing. The additional staffing assigned to the rescue (two per shift) can be utilized as overstaffing to cover scheduled and unscheduled leave. Through time the department can be reduced with a focus on meeting the demand and workload presented in this report.
Another alternative is to staff the rescue with a crew of two during peak-load times, which has been established to be between the hours of 8:00 a.m. and 10:00 p.m. (see Figure 5 above). As this is a fourteen-hour period, some adjustment in hours can be made to maintain the current department 10/14 schedule. The peak call period is between 10:00 a.m. and 8:00 p.m., a ten-hour period. This deployment model requires four members as there are only two platoons of two personnel (currently there are eight assigned as minimum staffing). The additional staffing assigned to the rescue (four members) can be utilized as overstaffing to cover scheduled and unscheduled leave, or through attrition the department can be right-sized with a focus on meeting the demand and workload presented in this report.
In 2001, the National Fire Protection Association (NFPA) released NFPA 1710, Standard for the Organization and Deployment of Fire Suppression Operations, Emergency Medical Operations, and Special Operations to the Public by Career Fire Departments. This significant event marked the first-ever consensus document addressing staffing and response times for the fire service. The goal was to establish an organized approach to defining adequate levels of service and deployment capabilities for the fire service. However, the inherent flaw found in this approach was in creating one set of performance measures for an industry where no two communities or risk portfolios are the same.
Fire Services Operations and Data Analysis, Watertown, New York page 44
Additionally, the City earlier commissioned two reports regarding fire department staffing and deployment. The first was provided in 1986 by Cresap, McCormick and Paget. This report, among other things, recommended a three-station model and a reduction in staffing to fourteen per platoon, with the addition of a battalion chief. This is the current staffing model today. The second report, provided by MMA Consulting Group, recommended with additional findings the decommissioning of station 3 but redistributing the staffing and expanding the equipment deployment model to utilize multifunction equipment rather than single function equipment. This report did not recommend a staffing level less than fifteen. Coincidentally, the MMA report also called for the revision of how the WFD responds to emergency medical calls for service to include emergency medical dispatching and the response of fire equipment on only life-threatening calls for service.
Lastly, the WFD completed a Standards of Cover in 2004 where the minimum number of on-duty operational staffing of fifteen is discussed, in addition to other resources required, dependent on the type of risk associated with the call for service. The 2004 document also includes a risk assessment from which the structural risk of the City is articulated in terms of the numbers of and types of buildings and the risks they pose. The most prevalent risk (12,763) by building type is of the moderate risk category, which in Watertown is largely single-family dwellings. The fire chief believes the moderate risk number of properties as identified in the 2004 report has not changed appreciably. Higher-risk structures and occupancies, if conditions have rapidly progressed prior to arrival of the fire department or after arrival of initial companies, generally cannot be handled entirely by the on-duty Watertown staff. Emergency call-backs and mutual aid will be required. As such, the staffing and deployment for the greatest share of risk in the City (moderate) is appropriate in this case. The current staffing and deployment also provides for an initial complement to begin concentrated mitigation efforts when combatting larger risks. Mutual aid is in place to provide some surge capacity required to mitigate large-scale events, which do not happen routinely.
It should be acknowledged that the scope of NFPA 1710 is designed to establish benchmarks relating to the organization and deployment of fire and EMS operations for career fire departments. In other words, NFPA 1710 is meant to create a universal level of service for communities serviced by a career fire department. When considering the applicability of this standard several factors must be taken into consideration, including the level of risk, demand, demographics, and community expectation. While these factors must be considered, the local government has the ultimate responsibility and the authority to establish the level of service within a community. The WFD addressed the level of risk and demographics, and to some degree, demand, in its 2004 report. This CPSM report addresses demand and response times more succinctly, as well as current demographics and socioeconomic research. Coupled with the WFD 2004 report, this CPSM report provides policy makers a better understanding and more contemporary information from which to draw conclusions on staffing and deployment of fire services.
Fire Services Operations and Data Analysis, Watertown, New York page 45
Therefore, with regards to WFD staffing and deployment, CPSM recommends:
• No additional operational (shift work) staffing be added at this time.
• No further reduction in operational (shift work) staffing at this time.
• Consider cross-staffing of the rescue and the truck (ladder apparatus) with a single crew of three.
• Consider peak-load staffing the rescue unit with a crew of two between the hours of 8:00 a.m. and 10:00 p.m.
• Based on available funding, fill any funded operational vacancies at this time and maintain operational staffing at full strength as consistently as possible. This will reduce the reliance on overtime that is caused by built-in overstaffing designed to fill daily vacancies created by scheduled and unscheduled leave.
• Bargain the inclusion of battalion chiefs into Article 6, Section 1b. The battalion chiefs are represented by the collective bargaining agreement and thus should be included in the daily leave count.
• Bargain the number of available leave positions from six to five (including the battalion chief) during one 24-hour period. This will decrease overtime expenditures and adjust the actual approved leave positions from nine to eight (six annual leave and one Kelley day and Kelley night) per 24-hour period.
• Bargain an increase in the work week as delineated in Article 5, Section 1a of the current collective bargaining agreement from forty hours to forty-two hours. This includes eliminating the one 10-hour Kelley Day and one 14-hour Kelley Day per operational (shift work) member over a twelve week cycle.
• Bargain the permanent reassignment of the uniformed fire prevention staff currently assigned to the bureau of code enforcement to the fire department. Transfer the appropriate budget and personnel count (fire to codes) to accommodate civilianization of these positions.
• Develop and implement policy that more definitively prescribes when an emergency recall should occur. CPSM further recommends Article 5, Sections 4b and 8, be removed through the bargaining process. While it is auspicious to maintain a certain level of personnel on duty at all times for continuous staffing, this comes with a cost. The staffing and deployment of fire services and the emergency recall of personnel is and should be both a management decision process and council policy. Further, the emergency recall of personnel should be managed by the on-duty battalion chief through approved policy.
Fire Services Operations and Data Analysis, Watertown, New York page 46
Appendix I: Data and Workload Analysis
Introduction This data analysis was prepared as a key component of the operational study of the Watertown Fire Department (WFD). This analysis examines all calls for service between July 1, 2013, and June 30, 2014, as recorded in the communications center.
This analysis is divided into four sections: the first section focuses on call types and dispatches; the second section explores time spent and workload of individual units; the third section presents analysis of the busiest hours in a year; and the fourth section provides a response time analysis of WFD units.
During the period covered by this study, the department operated out of three stations. The department deploys three pumpers, one ladder tower, one heavy rescue, and a shift command unit 24 hours a day, 7 days a week. When needed, the department utilizes two reserve pumpers and one reserve ladder tower.
During the study period, the department responded to 4,182 calls, including 9 mutual aid calls. The total combined yearly workload (deployed time) for all WFD units was 2,946 hours. The average estimated dispatch time of the first arriving WFD unit was 2.2 minutes and the average response time of the first arriving WFD unit was 6.0 minutes. The 90th percentile dispatch time was 3.6 minutes and the 90th percentile response time was 8.5 minutes, which means that WFD units had a response time of less than 8.5 minutes for 90 percent of these calls. It should be noted that an ice storm caused a significant increase in emergency incidents on December 22 and 23, 2013, which led to a total of 233 wires and tree down incidents, for which data were not available for this report.
Methodology In this report, we analyze call and run data. A call is an emergency service request or incident. A run is a dispatch of a unit. Thus, a call might include multiple runs.
We received CAD and National Fire Incident Reporting System (NFIRS) data for the Watertown Fire Department. We first validated CAD and NFIRS data, and we removed CAD test calls from analysis. We classified the calls in a series of steps. We first used the NFIRS mutual aid field to accurately identify mutual aid calls from the WFD perspective. Then, we used NFIRS incident type to assign EMS call types, MVA, fire category, and canceled call types. Lastly, we used CAD call nature to further break down NFIRS EMS calls.
A total of eight incidents to which support units (fire chief, deputy fire chief, and support vehicles) were the sole responders are not included in the analysis sections of the report. Nevertheless, the workload of support units is documented in Attachment I. In this report, mutual aid and canceled calls are not included in the analysis of call duration and response time analysis.
Fire Services Operations and Data Analysis, Watertown, New York page 47
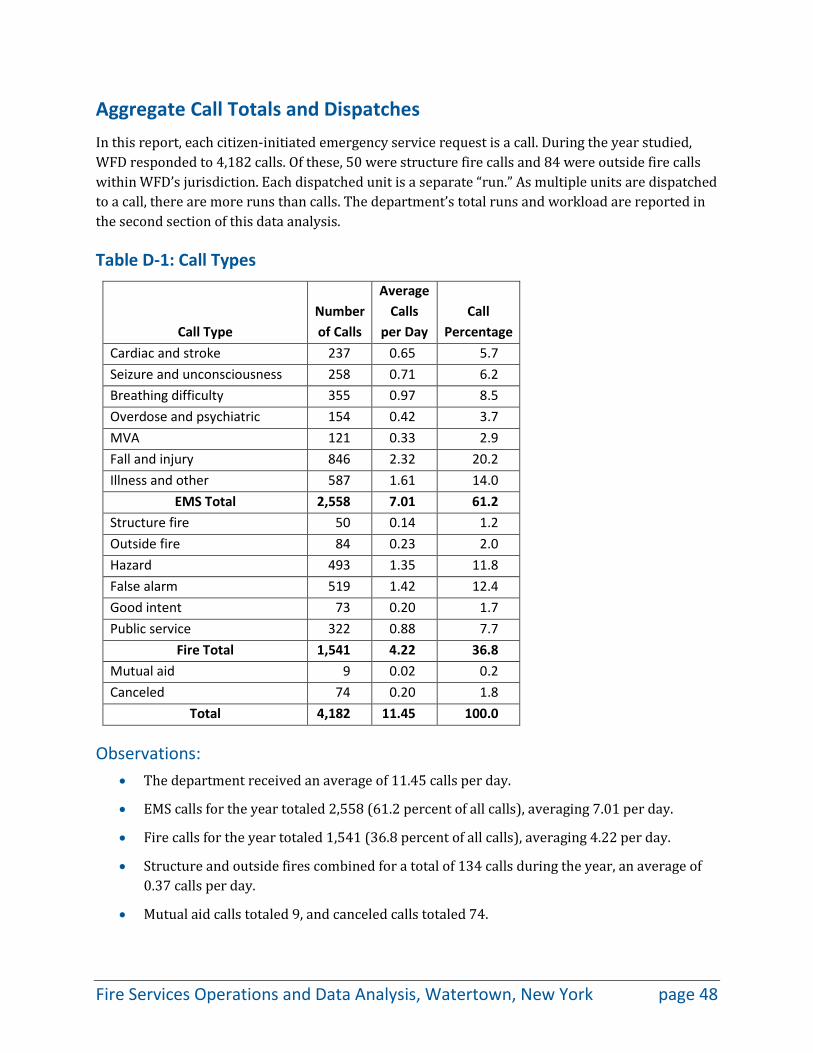
Aggregate Call Totals and Dispatches In this report, each citizen-initiated emergency service request is a call. During the year studied, WFD responded to 4,182 calls. Of these, 50 were structure fire calls and 84 were outside fire calls within WFD’s jurisdiction. Each dispatched unit is a separate “run.” As multiple units are dispatched to a call, there are more runs than calls. The department’s total runs and workload are reported in the second section of this data analysis.
Table D-1: Call Types
Call Type Number of Calls
Average Calls
per Day Call
Percentage Cardiac and stroke 237 0.65 5.7 Seizure and unconsciousness 258 0.71 6.2 Breathing difficulty 355 0.97 8.5 Overdose and psychiatric 154 0.42 3.7 MVA 121 0.33 2.9 Fall and injury 846 2.32 20.2 Illness and other 587 1.61 14.0
EMS Total 2,558 7.01 61.2 Structure fire 50 0.14 1.2 Outside fire 84 0.23 2.0 Hazard 493 1.35 11.8 False alarm 519 1.42 12.4 Good intent 73 0.20 1.7 Public service 322 0.88 7.7
Fire Total 1,541 4.22 36.8 Mutual aid 9 0.02 0.2 Canceled 74 0.20 1.8
Total 4,182 11.45 100.0
Observations: • The department received an average of 11.45 calls per day.
• EMS calls for the year totaled 2,558 (61.2 percent of all calls), averaging 7.01 per day.
• Fire calls for the year totaled 1,541 (36.8 percent of all calls), averaging 4.22 per day.
• Structure and outside fires combined for a total of 134 calls during the year, an average of 0.37 calls per day.
• Mutual aid calls totaled 9, and canceled calls totaled 74.
Fire Services Operations and Data Analysis, Watertown, New York page 48
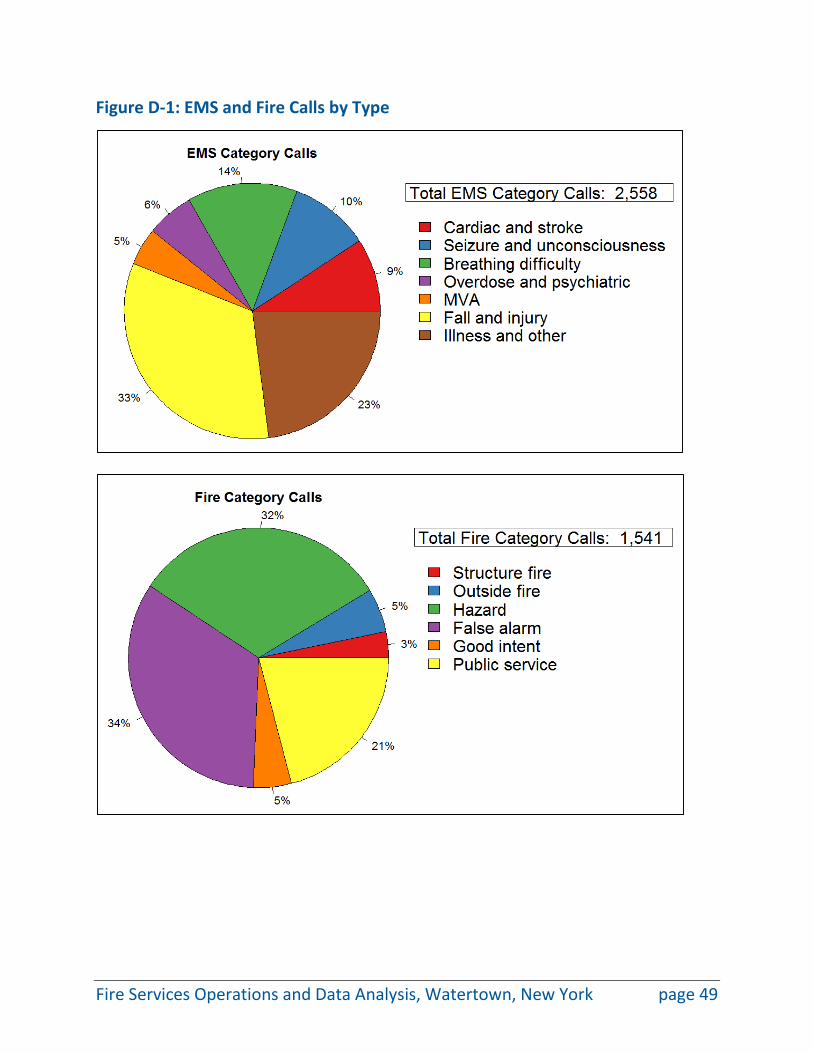
Figure D-1: EMS and Fire Calls by Type
Fire Services Operations and Data Analysis, Watertown, New York page 49
Observations: • A total of 50 structure fire calls accounted for 3 percent of the fire category total.
• A total of 84 outside fire calls accounted for 5 percent of the fire category total.
• False alarm calls were the largest fire call category, making up 34 percent of the fire category total.
• Fall and injury calls were the largest EMS call category and accounted for 33 percent of the EMS category total.
• Cardiac or stroke calls were 9 percent of the EMS category total.
• Motor vehicle accidents calls were 5 percent of the EMS category total.
Fire Services Operations and Data Analysis, Watertown, New York page 50
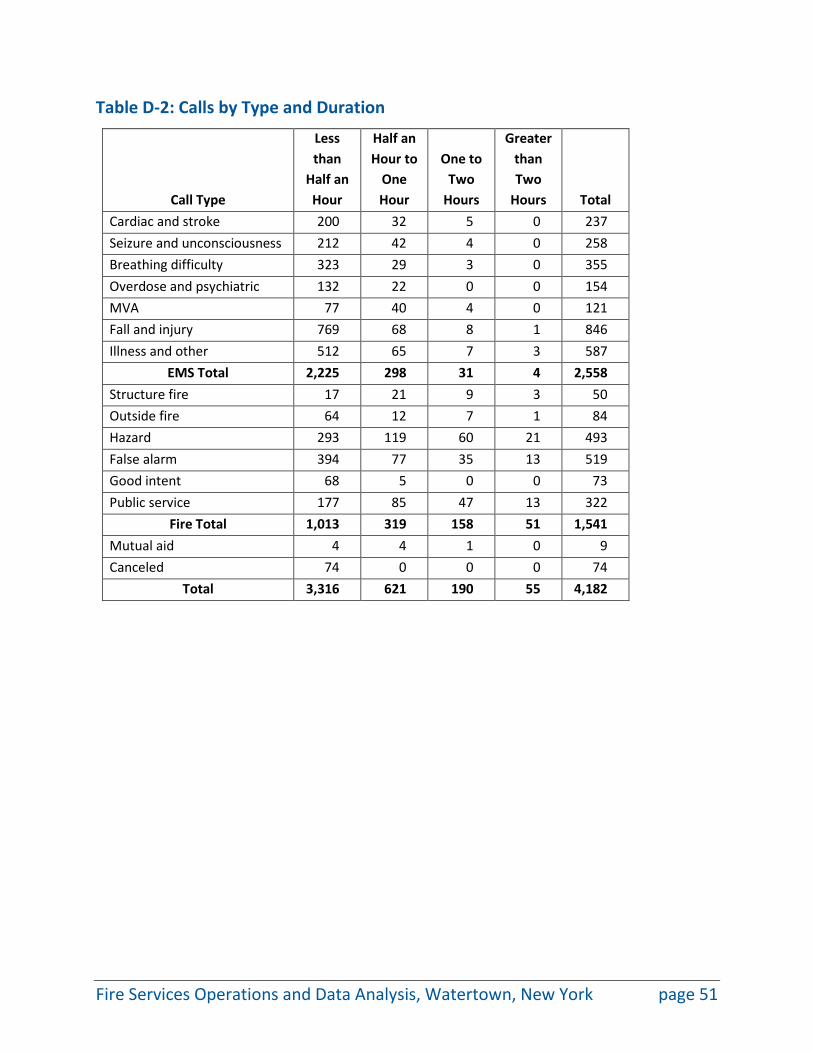
Table D-2: Calls by Type and Duration
Call Type
Less than
Half an Hour
Half an Hour to
One Hour
One to Two
Hours
Greater than Two
Hours Total Cardiac and stroke 200 32 5 0 237 Seizure and unconsciousness 212 42 4 0 258 Breathing difficulty 323 29 3 0 355 Overdose and psychiatric 132 22 0 0 154 MVA 77 40 4 0 121 Fall and injury 769 68 8 1 846 Illness and other 512 65 7 3 587
EMS Total 2,225 298 31 4 2,558 Structure fire 17 21 9 3 50 Outside fire 64 12 7 1 84 Hazard 293 119 60 21 493 False alarm 394 77 35 13 519 Good intent 68 5 0 0 73 Public service 177 85 47 13 322
Fire Total 1,013 319 158 51 1,541 Mutual aid 4 4 1 0 9 Canceled 74 0 0 0 74
Total 3,316 621 190 55 4,182
Fire Services Operations and Data Analysis, Watertown, New York page 51
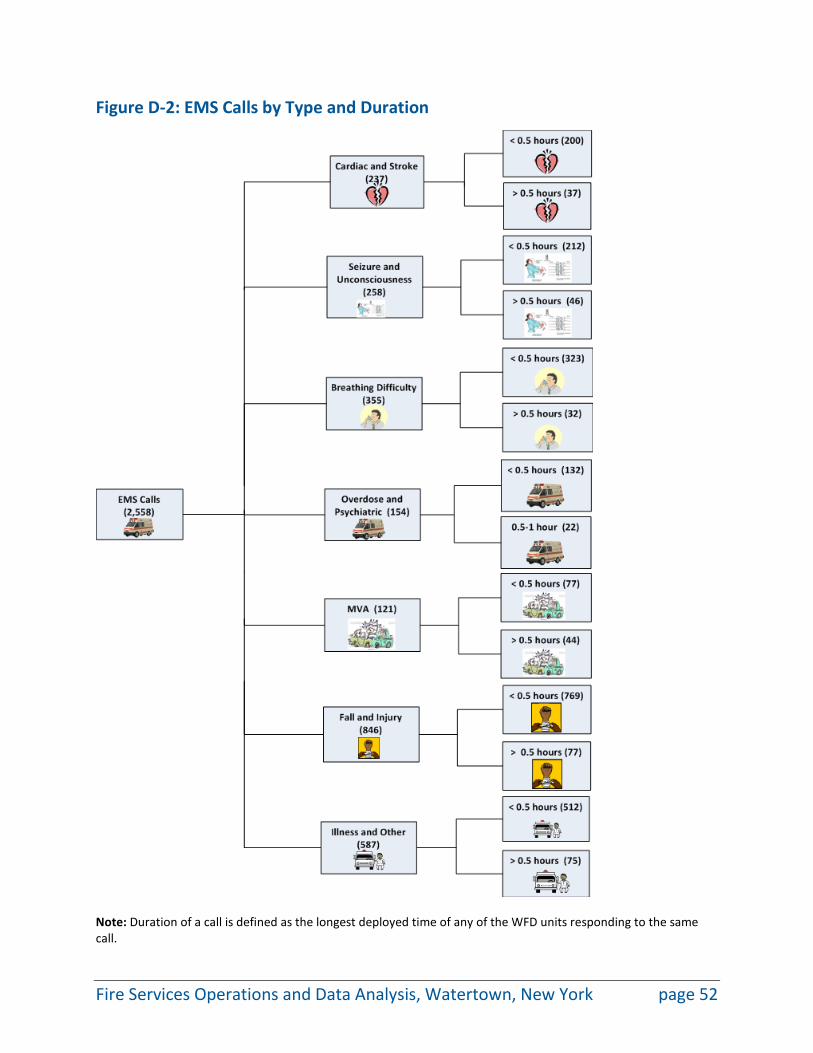
Figure D-2: EMS Calls by Type and Duration
Note: Duration of a call is defined as the longest deployed time of any of the WFD units responding to the same call.
Fire Services Operations and Data Analysis, Watertown, New York page 52
Observations: • A total of 2,225 EMS category calls (87 percent of all calls in this category) lasted less than
half an hour, 298 EMS category calls (12 percent) lasted between half an hour and one hour, and 35 EMS category calls (1 percent) lasted more than one hour.
• A total of 200 cardiac and stroke calls (84 percent of this category of call) lasted less than half an hour, 32 cardiac and stroke calls (14 percent) lasted between half an hour and one hour, and 5 cardiac and stroke calls (2 percent) lasted more than an hour.
• A total of 77 motor vehicle accident calls (64 percent of this category of call) lasted less than half an hour, 40 motor vehicle accident calls (33 percent) lasted between half an hour and one hour, and 4 motor vehicle accident calls (3 percent) lasted more than an hour.
• A total of 769 fall and injury calls (91 percent of this category of call) lasted less than half an hour, 68 fall and injury calls (8 percent) lasted between half an hour and one hour, and 9 fall and injury calls (1 percent) lasted more than an hour.
Fire Services Operations and Data Analysis, Watertown, New York page 53
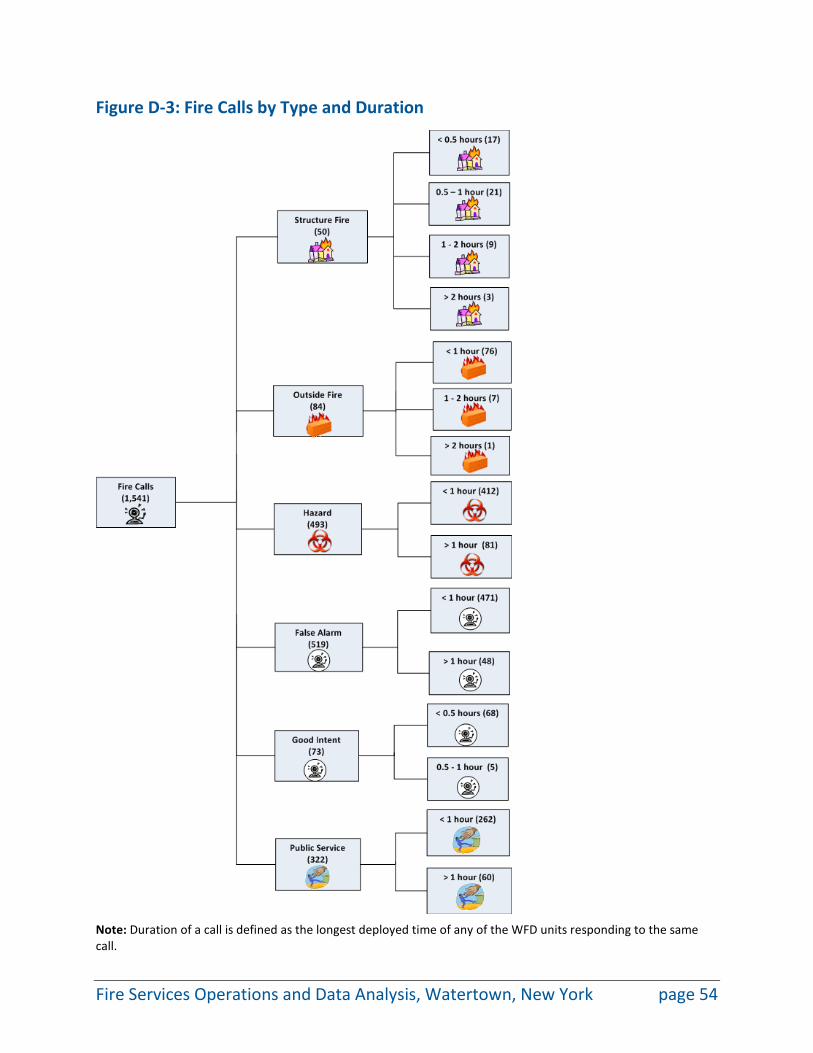
Figure D-3: Fire Calls by Type and Duration
Note: Duration of a call is defined as the longest deployed time of any of the WFD units responding to the same call.
Fire Services Operations and Data Analysis, Watertown, New York page 54
Observations: • A total of 1,013 fire category calls (66 percent of all calls in this category) lasted less than
half an hour, 319 fire category calls (21 percent) lasted between half an hour and one hour, 158 fire category calls (10 percent) lasted between one and two hours, and 51 fire category calls (3 percent) lasted more than two hours.
• A total of 38 structure fire calls (76 percent of this category of call) lasted less than one hour, 9 structure fire calls (18 percent) lasted between one and two hours, and 3 structure fire calls (6 percent) lasted more than two hours.
• A total of 76 outside fire calls (90 percent of this category of call) lasted less than one hour, 7 outside fire calls (8 percent) lasted between one and two hours, and 1 outside fire call (1 percent) lasted more than two hours.
• A total of 471 false alarm calls (91 percent of this category of call) lasted less than one hour, 35 false alarm calls (7 percent) lasted between one and two hours, and 13 false alarm calls (2 percent) lasted more than two hours.
Fire Services Operations and Data Analysis, Watertown, New York page 55
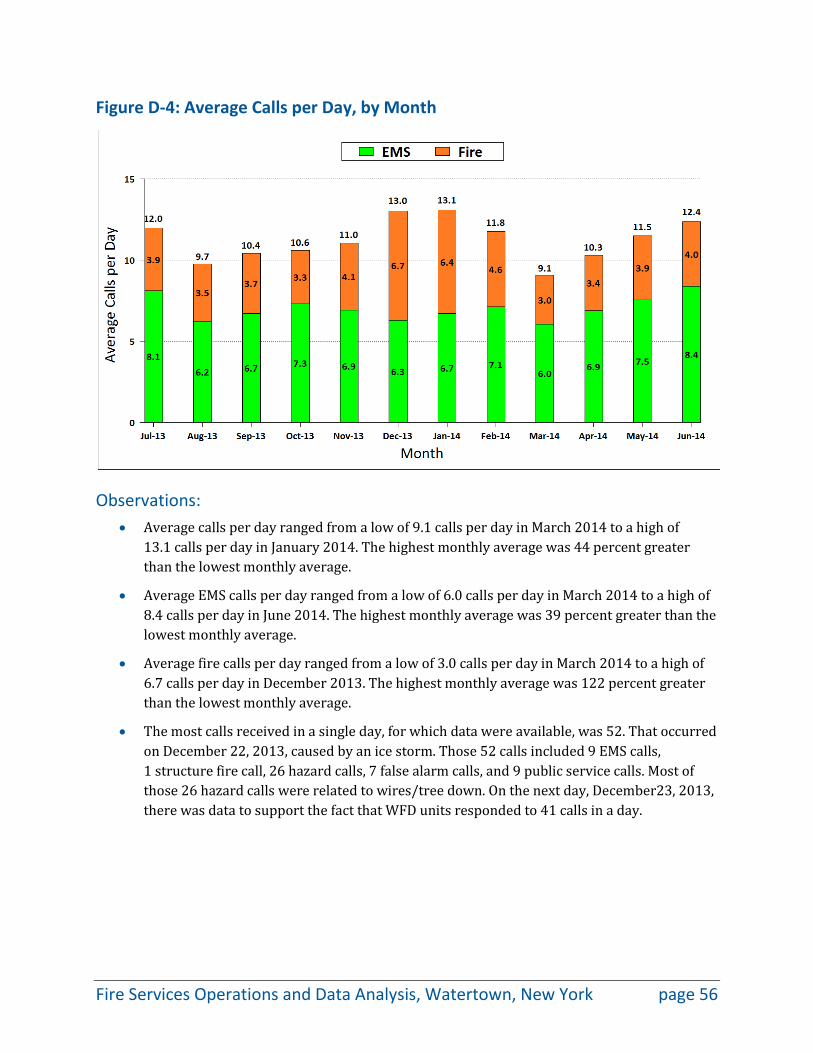
Figure D-4: Average Calls per Day, by Month
Observations: • Average calls per day ranged from a low of 9.1 calls per day in March 2014 to a high of
13.1 calls per day in January 2014. The highest monthly average was 44 percent greater than the lowest monthly average.
• Average EMS calls per day ranged from a low of 6.0 calls per day in March 2014 to a high of 8.4 calls per day in June 2014. The highest monthly average was 39 percent greater than the lowest monthly average.
• Average fire calls per day ranged from a low of 3.0 calls per day in March 2014 to a high of 6.7 calls per day in December 2013. The highest monthly average was 122 percent greater than the lowest monthly average.
• The most calls received in a single day, for which data were available, was 52. That occurred on December 22, 2013, caused by an ice storm. Those 52 calls included 9 EMS calls, 1 structure fire call, 26 hazard calls, 7 false alarm calls, and 9 public service calls. Most of those 26 hazard calls were related to wires/tree down. On the next day, December23, 2013, there was data to support the fact that WFD units responded to 41 calls in a day.
Fire Services Operations and Data Analysis, Watertown, New York page 56
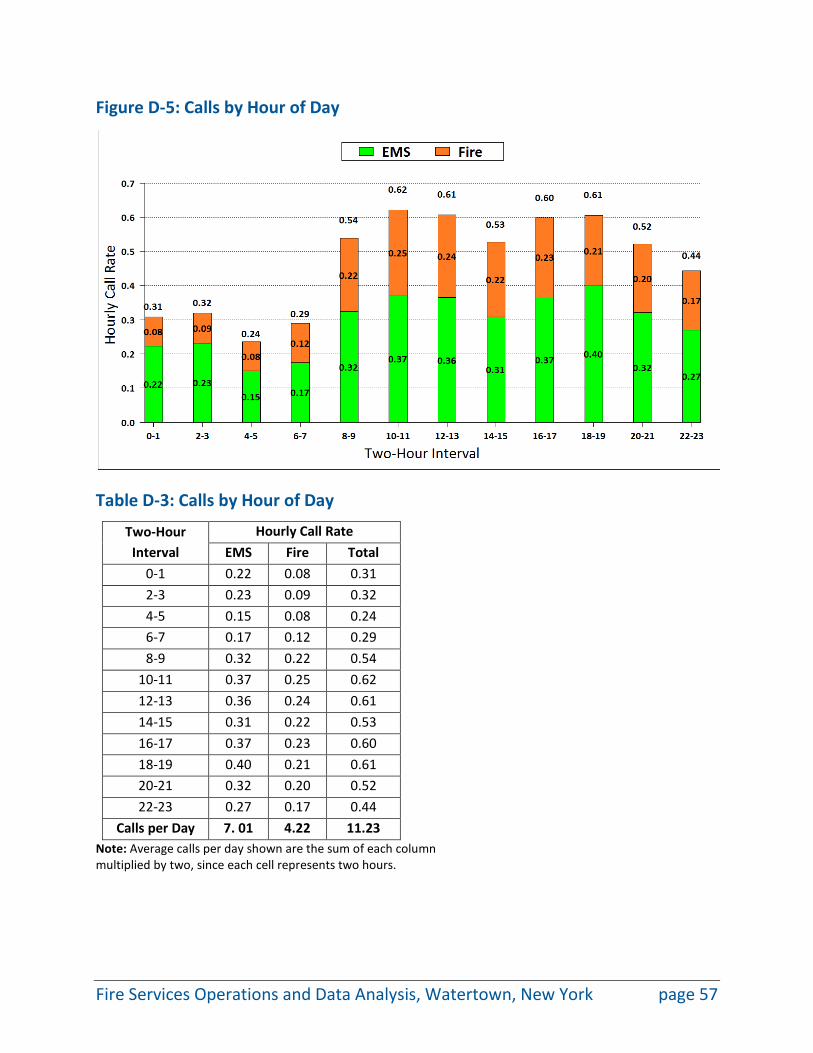
Figure D-5: Calls by Hour of Day
Table D-3: Calls by Hour of Day
Two-Hour Interval
Hourly Call Rate EMS Fire Total
0-1 0.22 0.08 0.31 2-3 0.23 0.09 0.32 4-5 0.15 0.08 0.24 6-7 0.17 0.12 0.29 8-9 0.32 0.22 0.54
10-11 0.37 0.25 0.62 12-13 0.36 0.24 0.61 14-15 0.31 0.22 0.53 16-17 0.37 0.23 0.60 18-19 0.40 0.21 0.61 20-21 0.32 0.20 0.52 22-23 0.27 0.17 0.44
Calls per Day 7. 01 4.22 11.23 Note: Average calls per day shown are the sum of each column multiplied by two, since each cell represents two hours.
Fire Services Operations and Data Analysis, Watertown, New York page 57

Observations: • Hourly call rates averaged between 0.24 calls and 0.62 calls per hour.
• Call rates were highest during the day between 8:00 a.m. and 10:00 p.m., averaging between 0.52 and 0.62 calls per hour.
• Call rates were lowest between midnight and 8:00 a.m., averaging between 0.24 and 0.32 calls per hour.
Fire Services Operations and Data Analysis, Watertown, New York page 58
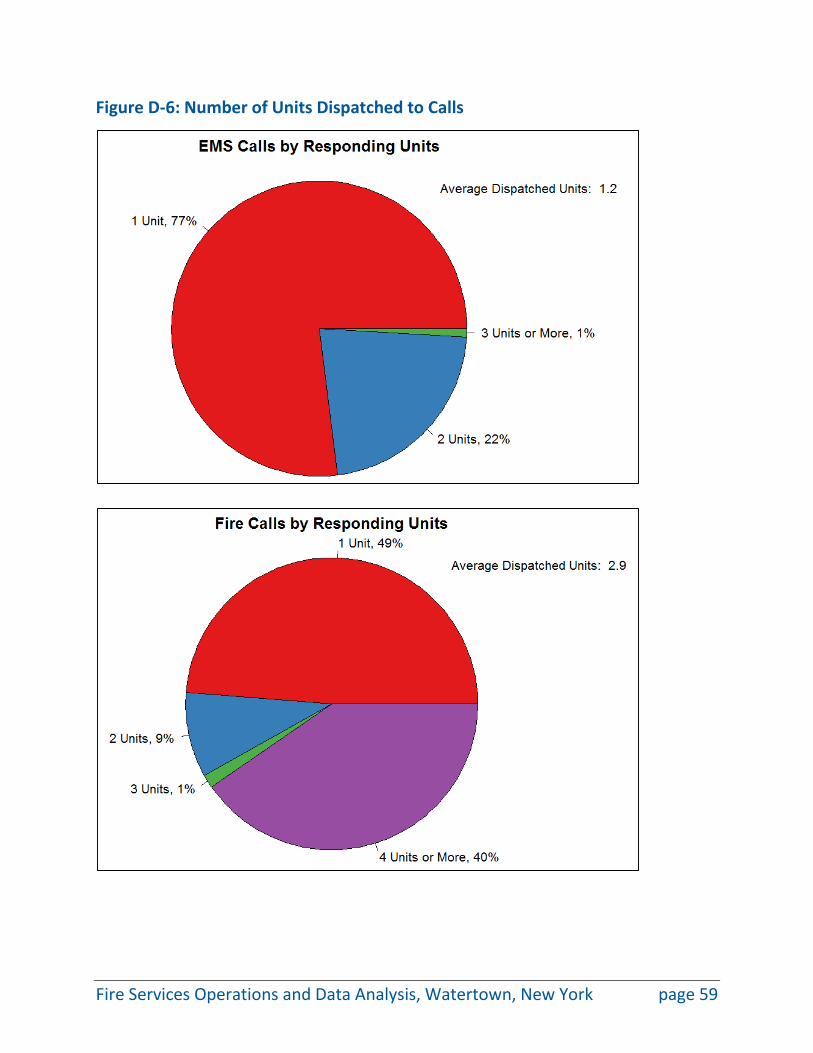
Figure D-6: Number of Units Dispatched to Calls
Fire Services Operations and Data Analysis, Watertown, New York page 59
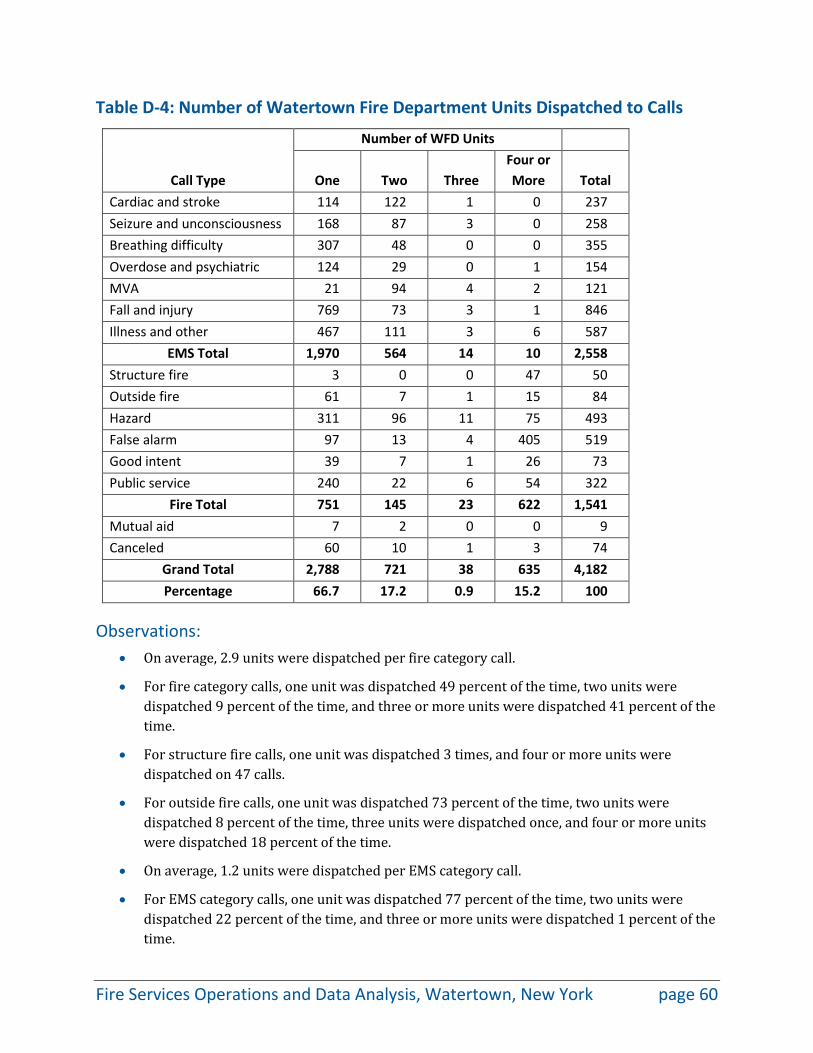
Table D-4: Number of Watertown Fire Department Units Dispatched to Calls
Call Type
Number of WFD Units
One Two Three Four or More Total
Cardiac and stroke 114 122 1 0 237 Seizure and unconsciousness 168 87 3 0 258 Breathing difficulty 307 48 0 0 355 Overdose and psychiatric 124 29 0 1 154 MVA 21 94 4 2 121 Fall and injury 769 73 3 1 846 Illness and other 467 111 3 6 587
EMS Total 1,970 564 14 10 2,558 Structure fire 3 0 0 47 50 Outside fire 61 7 1 15 84 Hazard 311 96 11 75 493 False alarm 97 13 4 405 519 Good intent 39 7 1 26 73 Public service 240 22 6 54 322
Fire Total 751 145 23 622 1,541 Mutual aid 7 2 0 0 9 Canceled 60 10 1 3 74
Grand Total 2,788 721 38 635 4,182 Percentage 66.7 17.2 0.9 15.2 100
Observations: • On average, 2.9 units were dispatched per fire category call.
• For fire category calls, one unit was dispatched 49 percent of the time, two units were dispatched 9 percent of the time, and three or more units were dispatched 41 percent of the time.
• For structure fire calls, one unit was dispatched 3 times, and four or more units were dispatched on 47 calls.
• For outside fire calls, one unit was dispatched 73 percent of the time, two units were dispatched 8 percent of the time, three units were dispatched once, and four or more units were dispatched 18 percent of the time.
• On average, 1.2 units were dispatched per EMS category call.
• For EMS category calls, one unit was dispatched 77 percent of the time, two units were dispatched 22 percent of the time, and three or more units were dispatched 1 percent of the time.
Fire Services Operations and Data Analysis, Watertown, New York page 60
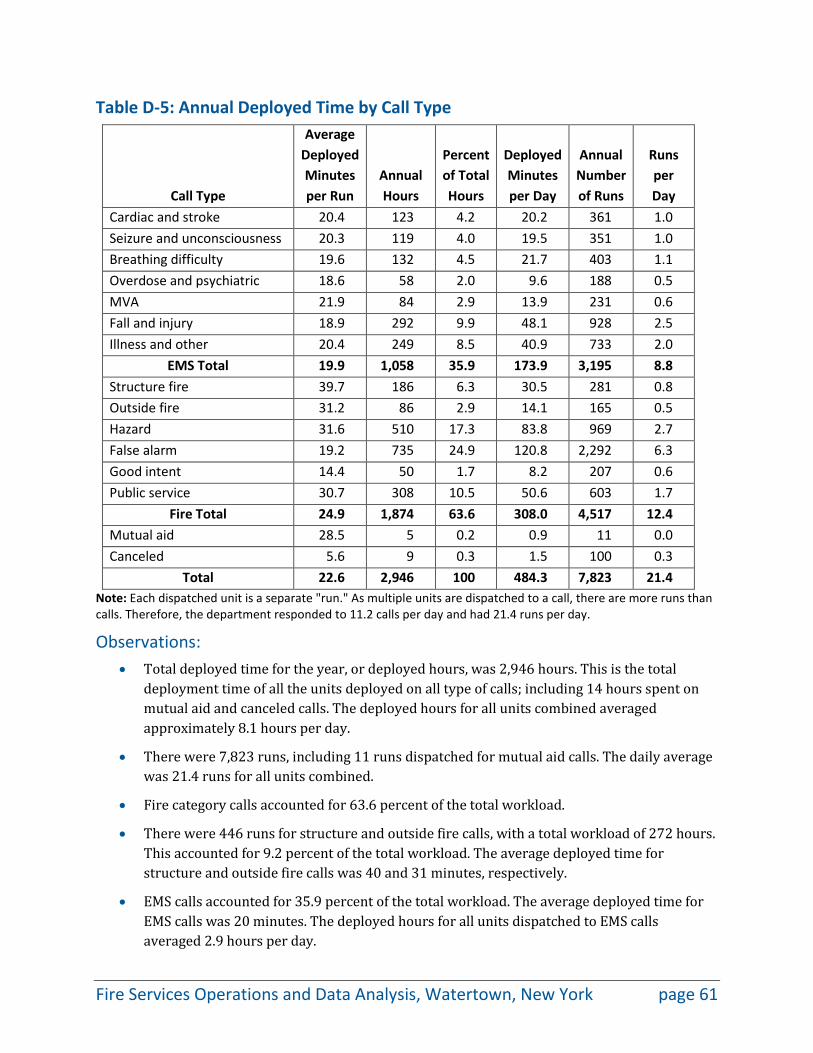
Table D-5: Annual Deployed Time by Call Type
Call Type
Average Deployed Minutes per Run
Annual Hours
Percent of Total Hours
Deployed Minutes per Day
Annual Number of Runs
Runs per Day
Cardiac and stroke 20.4 123 4.2 20.2 361 1.0 Seizure and unconsciousness 20.3 119 4.0 19.5 351 1.0 Breathing difficulty 19.6 132 4.5 21.7 403 1.1 Overdose and psychiatric 18.6 58 2.0 9.6 188 0.5 MVA 21.9 84 2.9 13.9 231 0.6 Fall and injury 18.9 292 9.9 48.1 928 2.5 Illness and other 20.4 249 8.5 40.9 733 2.0
EMS Total 19.9 1,058 35.9 173.9 3,195 8.8 Structure fire 39.7 186 6.3 30.5 281 0.8 Outside fire 31.2 86 2.9 14.1 165 0.5 Hazard 31.6 510 17.3 83.8 969 2.7 False alarm 19.2 735 24.9 120.8 2,292 6.3 Good intent 14.4 50 1.7 8.2 207 0.6 Public service 30.7 308 10.5 50.6 603 1.7
Fire Total 24.9 1,874 63.6 308.0 4,517 12.4 Mutual aid 28.5 5 0.2 0.9 11 0.0 Canceled 5.6 9 0.3 1.5 100 0.3
Total 22.6 2,946 100 484.3 7,823 21.4 Note: Each dispatched unit is a separate "run." As multiple units are dispatched to a call, there are more runs than calls. Therefore, the department responded to 11.2 calls per day and had 21.4 runs per day.
Observations: • Total deployed time for the year, or deployed hours, was 2,946 hours. This is the total
deployment time of all the units deployed on all type of calls; including 14 hours spent on mutual aid and canceled calls. The deployed hours for all units combined averaged approximately 8.1 hours per day.
• There were 7,823 runs, including 11 runs dispatched for mutual aid calls. The daily average was 21.4 runs for all units combined.
• Fire category calls accounted for 63.6 percent of the total workload.
• There were 446 runs for structure and outside fire calls, with a total workload of 272 hours. This accounted for 9.2 percent of the total workload. The average deployed time for structure and outside fire calls was 40 and 31 minutes, respectively.
• EMS calls accounted for 35.9 percent of the total workload. The average deployed time for EMS calls was 20 minutes. The deployed hours for all units dispatched to EMS calls averaged 2.9 hours per day.
Fire Services Operations and Data Analysis, Watertown, New York page 61
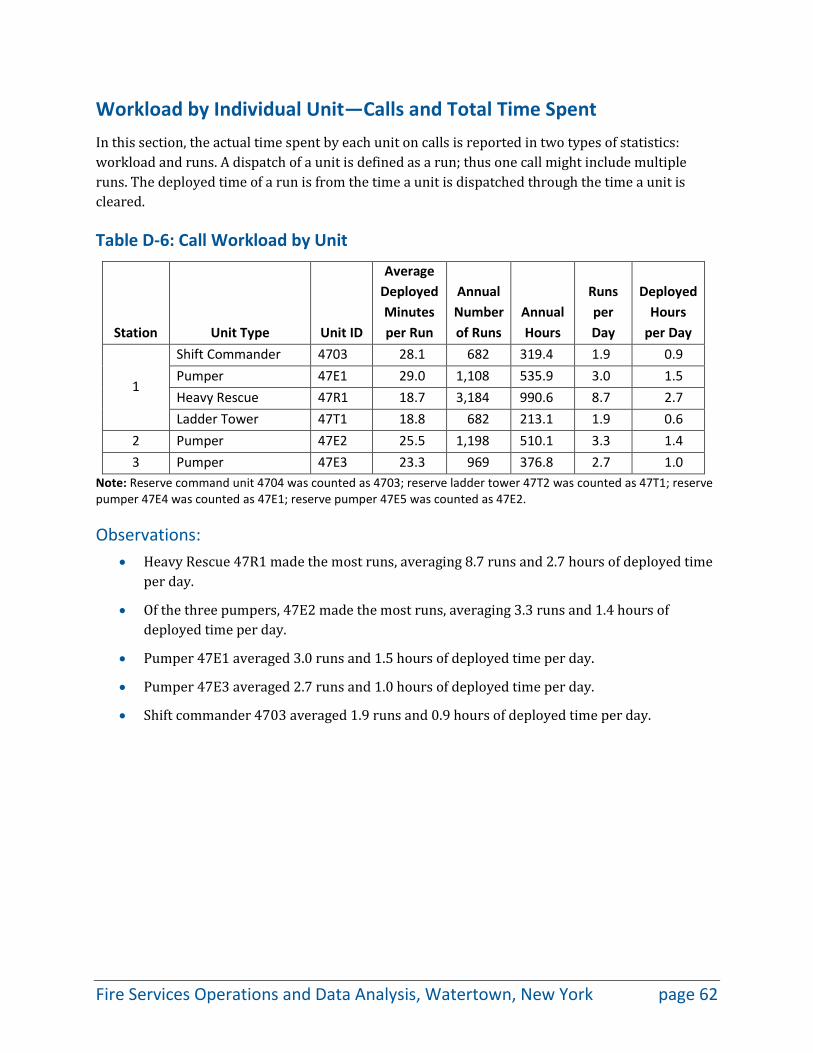
Workload by Individual Unit—Calls and Total Time Spent In this section, the actual time spent by each unit on calls is reported in two types of statistics: workload and runs. A dispatch of a unit is defined as a run; thus one call might include multiple runs. The deployed time of a run is from the time a unit is dispatched through the time a unit is cleared.
Table D-6: Call Workload by Unit
Station Unit Type Unit ID
Average Deployed Minutes per Run
Annual Number of Runs
Annual Hours
Runs per Day
Deployed Hours
per Day
1
Shift Commander 4703 28.1 682 319.4 1.9 0.9 Pumper 47E1 29.0 1,108 535.9 3.0 1.5 Heavy Rescue 47R1 18.7 3,184 990.6 8.7 2.7 Ladder Tower 47T1 18.8 682 213.1 1.9 0.6
2 Pumper 47E2 25.5 1,198 510.1 3.3 1.4 3 Pumper 47E3 23.3 969 376.8 2.7 1.0
Note: Reserve command unit 4704 was counted as 4703; reserve ladder tower 47T2 was counted as 47T1; reserve pumper 47E4 was counted as 47E1; reserve pumper 47E5 was counted as 47E2.
Observations: • Heavy Rescue 47R1 made the most runs, averaging 8.7 runs and 2.7 hours of deployed time
per day.
• Of the three pumpers, 47E2 made the most runs, averaging 3.3 runs and 1.4 hours of deployed time per day.
• Pumper 47E1 averaged 3.0 runs and 1.5 hours of deployed time per day.
• Pumper 47E3 averaged 2.7 runs and 1.0 hours of deployed time per day.
• Shift commander 4703 averaged 1.9 runs and 0.9 hours of deployed time per day.
Fire Services Operations and Data Analysis, Watertown, New York page 62
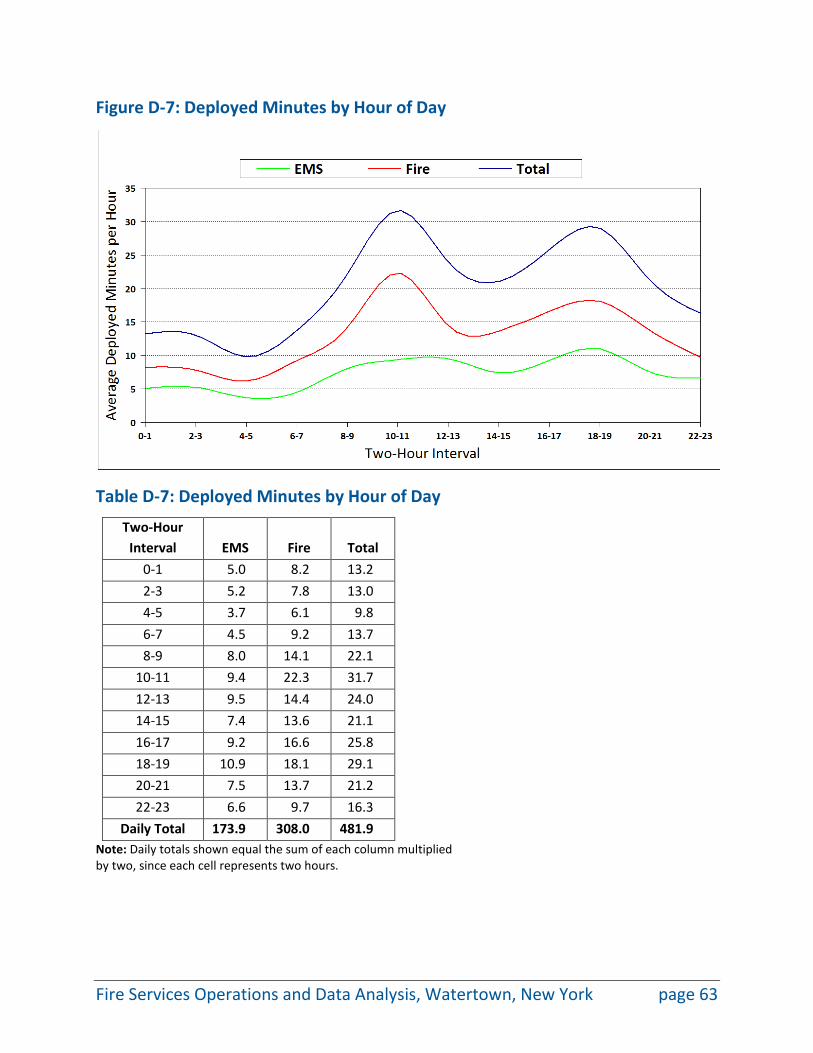
Figure D-7: Deployed Minutes by Hour of Day
Table D-7: Deployed Minutes by Hour of Day
Two-Hour Interval EMS Fire Total
0-1 5.0 8.2 13.2 2-3 5.2 7.8 13.0 4-5 3.7 6.1 9.8 6-7 4.5 9.2 13.7 8-9 8.0 14.1 22.1
10-11 9.4 22.3 31.7 12-13 9.5 14.4 24.0 14-15 7.4 13.6 21.1 16-17 9.2 16.6 25.8 18-19 10.9 18.1 29.1 20-21 7.5 13.7 21.2 22-23 6.6 9.7 16.3
Daily Total 173.9 308.0 481.9 Note: Daily totals shown equal the sum of each column multiplied by two, since each cell represents two hours.
Fire Services Operations and Data Analysis, Watertown, New York page 63

Observations: • Hourly deployed minutes were highest during the day between 8:00 a.m. and 10:00 p.m.,
averaging between 21.1 minutes and 31.7 minutes per hour. Average deployed minutes peaked between 10:00 a.m. and noon, averaging about 31.7 minutes per hour.
• Hourly deployed minutes were the lowest between midnight and 6:00 a.m., averaging between 9.8 minutes and 13.2 minutes per hour.
Fire Services Operations and Data Analysis, Watertown, New York page 64
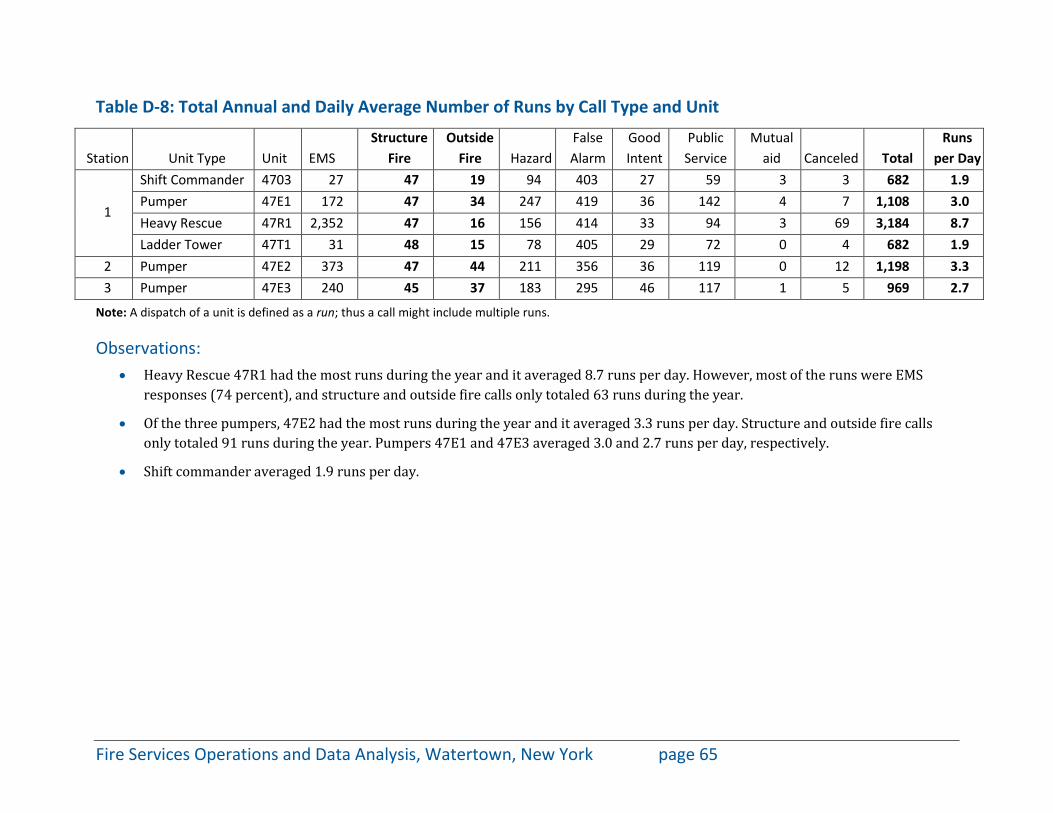
Table D-8: Total Annual and Daily Average Number of Runs by Call Type and Unit
Station Unit Type Unit EMS Structure
Fire Outside
Fire Hazard False Alarm
Good Intent
Public Service
Mutual aid Canceled Total
Runs per Day
1
Shift Commander 4703 27 47 19 94 403 27 59 3 3 682 1.9 Pumper 47E1 172 47 34 247 419 36 142 4 7 1,108 3.0 Heavy Rescue 47R1 2,352 47 16 156 414 33 94 3 69 3,184 8.7 Ladder Tower 47T1 31 48 15 78 405 29 72 0 4 682 1.9
2 Pumper 47E2 373 47 44 211 356 36 119 0 12 1,198 3.3 3 Pumper 47E3 240 45 37 183 295 46 117 1 5 969 2.7
Note: A dispatch of a unit is defined as a run; thus a call might include multiple runs.
Observations: • Heavy Rescue 47R1 had the most runs during the year and it averaged 8.7 runs per day. However, most of the runs were EMS
responses (74 percent), and structure and outside fire calls only totaled 63 runs during the year.
• Of the three pumpers, 47E2 had the most runs during the year and it averaged 3.3 runs per day. Structure and outside fire calls only totaled 91 runs during the year. Pumpers 47E1 and 47E3 averaged 3.0 and 2.7 runs per day, respectively.
• Shift commander averaged 1.9 runs per day.
Fire Services Operations and Data Analysis, Watertown, New York page 65
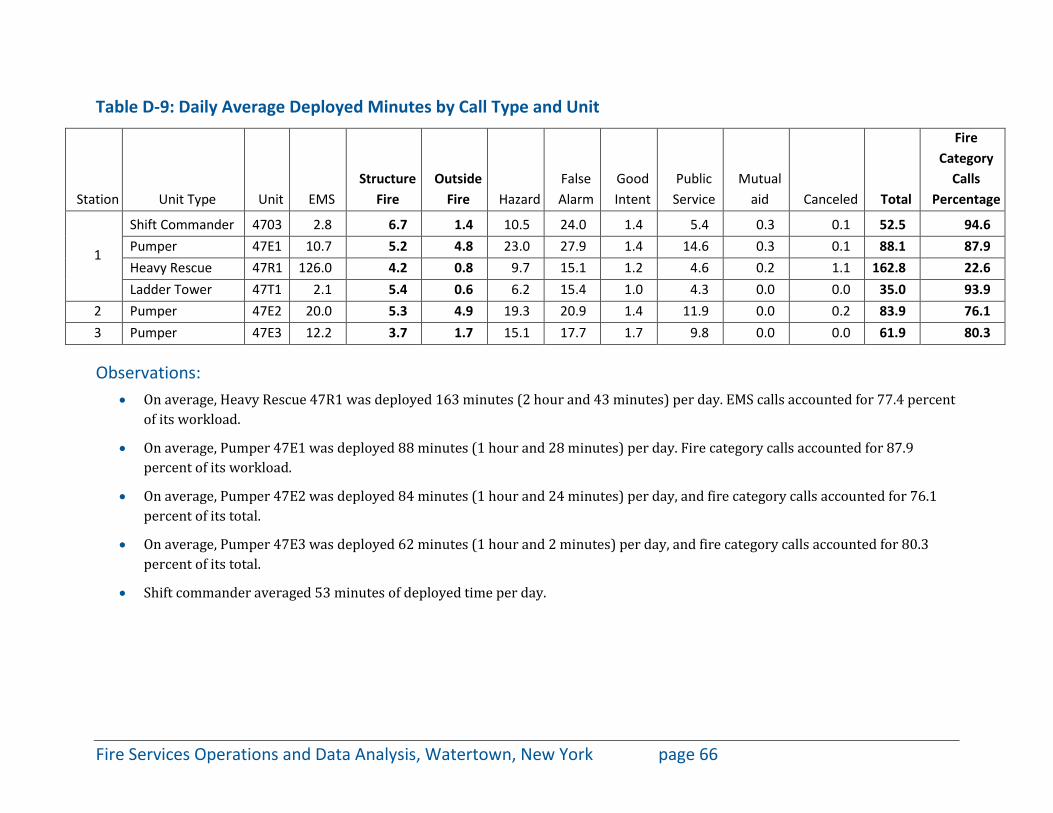
Table D-9: Daily Average Deployed Minutes by Call Type and Unit
Station Unit Type Unit EMS Structure
Fire Outside
Fire Hazard False Alarm
Good Intent
Public Service
Mutual aid Canceled Total
Fire Category
Calls Percentage
1
Shift Commander 4703 2.8 6.7 1.4 10.5 24.0 1.4 5.4 0.3 0.1 52.5 94.6 Pumper 47E1 10.7 5.2 4.8 23.0 27.9 1.4 14.6 0.3 0.1 88.1 87.9 Heavy Rescue 47R1 126.0 4.2 0.8 9.7 15.1 1.2 4.6 0.2 1.1 162.8 22.6 Ladder Tower 47T1 2.1 5.4 0.6 6.2 15.4 1.0 4.3 0.0 0.0 35.0 93.9
2 Pumper 47E2 20.0 5.3 4.9 19.3 20.9 1.4 11.9 0.0 0.2 83.9 76.1 3 Pumper 47E3 12.2 3.7 1.7 15.1 17.7 1.7 9.8 0.0 0.0 61.9 80.3
Observations: • On average, Heavy Rescue 47R1 was deployed 163 minutes (2 hour and 43 minutes) per day. EMS calls accounted for 77.4 percent
of its workload.
• On average, Pumper 47E1 was deployed 88 minutes (1 hour and 28 minutes) per day. Fire category calls accounted for 87.9 percent of its workload.
• On average, Pumper 47E2 was deployed 84 minutes (1 hour and 24 minutes) per day, and fire category calls accounted for 76.1 percent of its total.
• On average, Pumper 47E3 was deployed 62 minutes (1 hour and 2 minutes) per day, and fire category calls accounted for 80.3 percent of its total.
• Shift commander averaged 53 minutes of deployed time per day.
Fire Services Operations and Data Analysis, Watertown, New York page 66
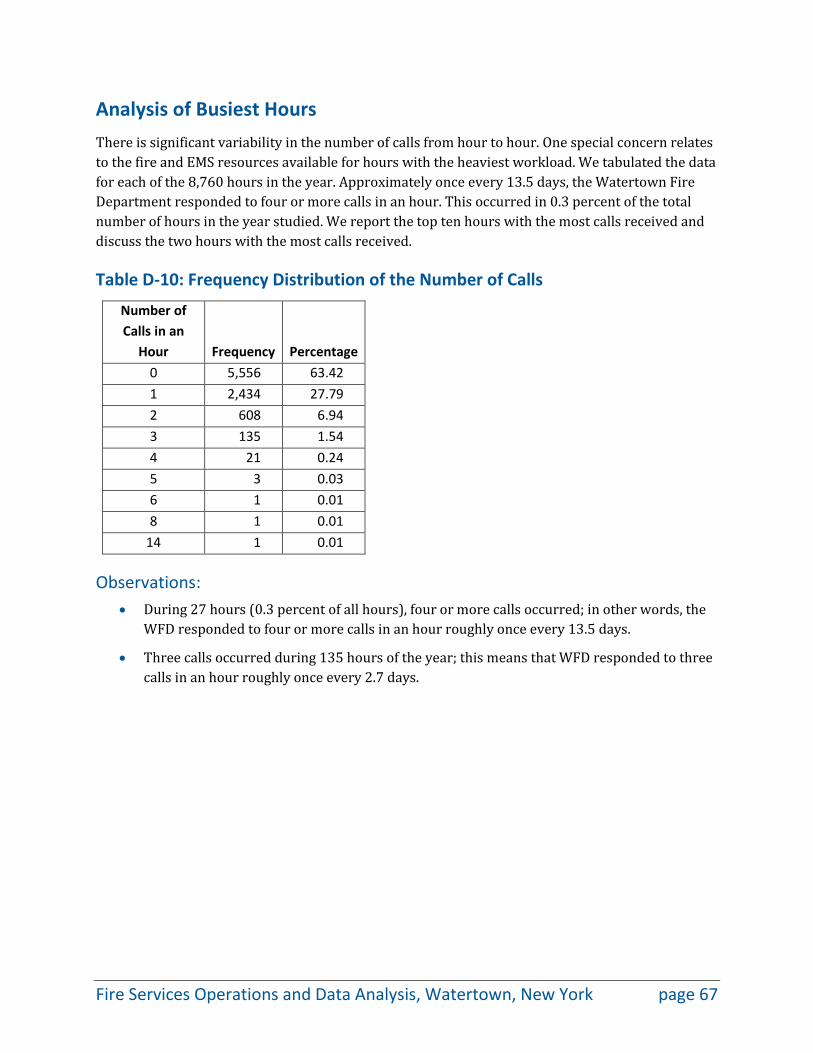
Analysis of Busiest Hours There is significant variability in the number of calls from hour to hour. One special concern relates to the fire and EMS resources available for hours with the heaviest workload. We tabulated the data for each of the 8,760 hours in the year. Approximately once every 13.5 days, the Watertown Fire Department responded to four or more calls in an hour. This occurred in 0.3 percent of the total number of hours in the year studied. We report the top ten hours with the most calls received and discuss the two hours with the most calls received.
Table D-10: Frequency Distribution of the Number of Calls
Number of Calls in an
Hour Frequency Percentage 0 5,556 63.42 1 2,434 27.79 2 608 6.94 3 135 1.54 4 21 0.24 5 3 0.03 6 1 0.01 8 1 0.01
14 1 0.01
Observations: • During 27 hours (0.3 percent of all hours), four or more calls occurred; in other words, the
WFD responded to four or more calls in an hour roughly once every 13.5 days.
• Three calls occurred during 135 hours of the year; this means that WFD responded to three calls in an hour roughly once every 2.7 days.
Fire Services Operations and Data Analysis, Watertown, New York page 67
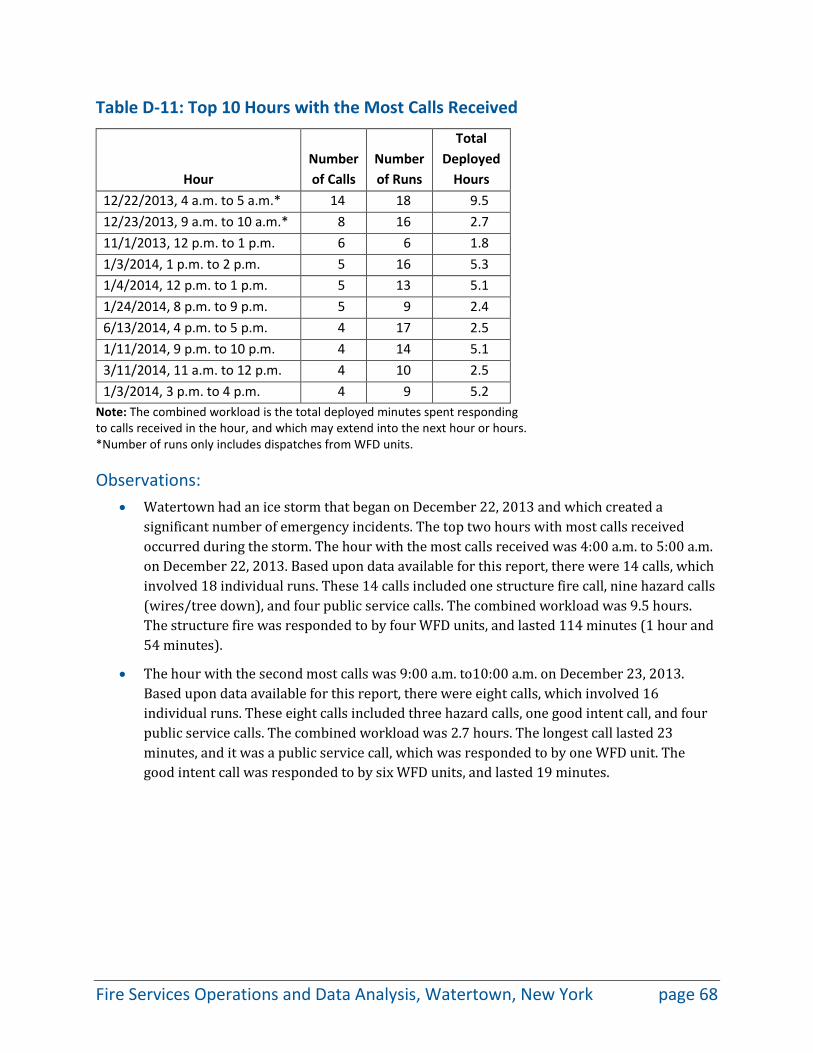
Table D-11: Top 10 Hours with the Most Calls Received
Hour Number of Calls
Number of Runs
Total Deployed
Hours 12/22/2013, 4 a.m. to 5 a.m.* 14 18 9.5 12/23/2013, 9 a.m. to 10 a.m.* 8 16 2.7 11/1/2013, 12 p.m. to 1 p.m. 6 6 1.8 1/3/2014, 1 p.m. to 2 p.m. 5 16 5.3 1/4/2014, 12 p.m. to 1 p.m. 5 13 5.1 1/24/2014, 8 p.m. to 9 p.m. 5 9 2.4 6/13/2014, 4 p.m. to 5 p.m. 4 17 2.5 1/11/2014, 9 p.m. to 10 p.m. 4 14 5.1 3/11/2014, 11 a.m. to 12 p.m. 4 10 2.5 1/3/2014, 3 p.m. to 4 p.m. 4 9 5.2
Note: The combined workload is the total deployed minutes spent responding to calls received in the hour, and which may extend into the next hour or hours. *Number of runs only includes dispatches from WFD units.
Observations: • Watertown had an ice storm that began on December 22, 2013 and which created a
significant number of emergency incidents. The top two hours with most calls received occurred during the storm. The hour with the most calls received was 4:00 a.m. to 5:00 a.m. on December 22, 2013. Based upon data available for this report, there were 14 calls, which involved 18 individual runs. These 14 calls included one structure fire call, nine hazard calls (wires/tree down), and four public service calls. The combined workload was 9.5 hours. The structure fire was responded to by four WFD units, and lasted 114 minutes (1 hour and 54 minutes).
• The hour with the second most calls was 9:00 a.m. to10:00 a.m. on December 23, 2013. Based upon data available for this report, there were eight calls, which involved 16 individual runs. These eight calls included three hazard calls, one good intent call, and four public service calls. The combined workload was 2.7 hours. The longest call lasted 23 minutes, and it was a public service call, which was responded to by one WFD unit. The good intent call was responded to by six WFD units, and lasted 19 minutes.
Fire Services Operations and Data Analysis, Watertown, New York page 68
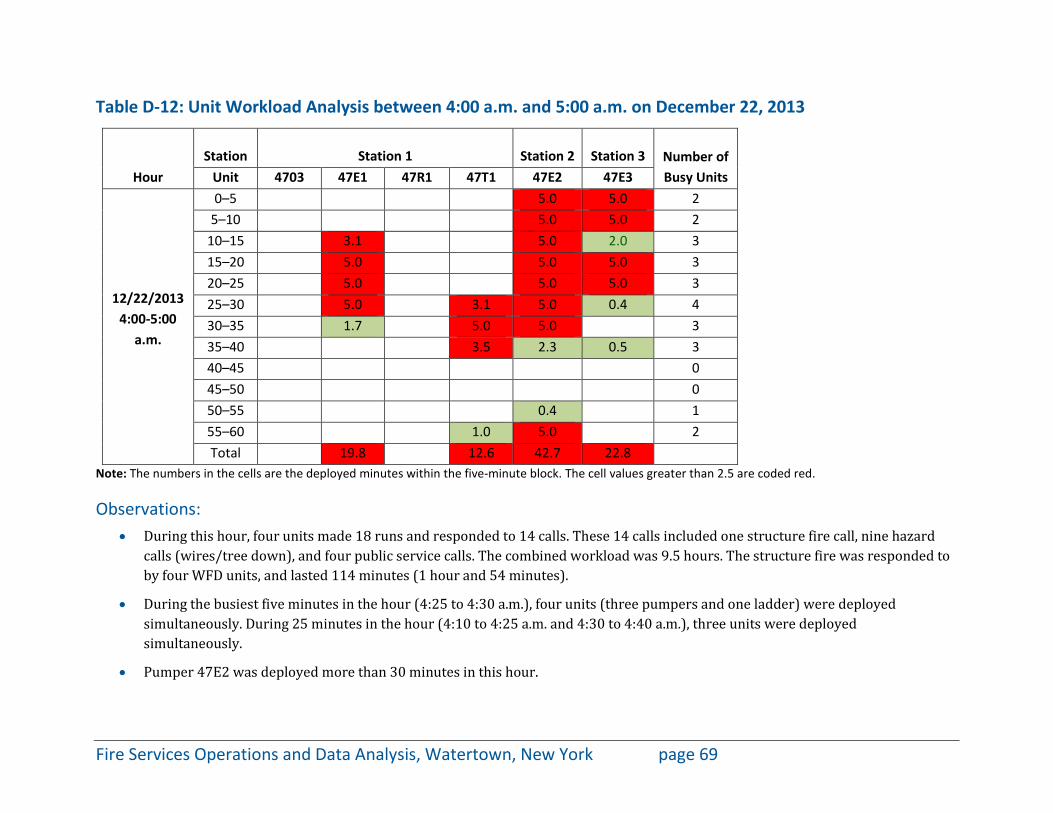
Table D-12: Unit Workload Analysis between 4:00 a.m. and 5:00 a.m. on December 22, 2013
Hour Station Station 1 Station 2 Station 3 Number of
Busy Units Unit 4703 47E1 47R1 47T1 47E2 47E3
12/22/2013 4:00-5:00
a.m.
0–5 5.0 5.0 2 5–10 5.0 5.0 2
10–15 3.1 5.0 2.0 3 15–20 5.0 5.0 5.0 3 20–25 5.0 5.0 5.0 3 25–30 5.0 3.1 5.0 0.4 4 30–35 1.7 5.0 5.0 3 35–40 3.5 2.3 0.5 3 40–45 0 45–50 0 50–55 0.4 1 55–60 1.0 5.0 2 Total 19.8 12.6 42.7 22.8
Note: The numbers in the cells are the deployed minutes within the five-minute block. The cell values greater than 2.5 are coded red.
Observations: • During this hour, four units made 18 runs and responded to 14 calls. These 14 calls included one structure fire call, nine hazard
calls (wires/tree down), and four public service calls. The combined workload was 9.5 hours. The structure fire was responded to by four WFD units, and lasted 114 minutes (1 hour and 54 minutes).
• During the busiest five minutes in the hour (4:25 to 4:30 a.m.), four units (three pumpers and one ladder) were deployed simultaneously. During 25 minutes in the hour (4:10 to 4:25 a.m. and 4:30 to 4:40 a.m.), three units were deployed simultaneously.
• Pumper 47E2 was deployed more than 30 minutes in this hour.
Fire Services Operations and Data Analysis, Watertown, New York page 69
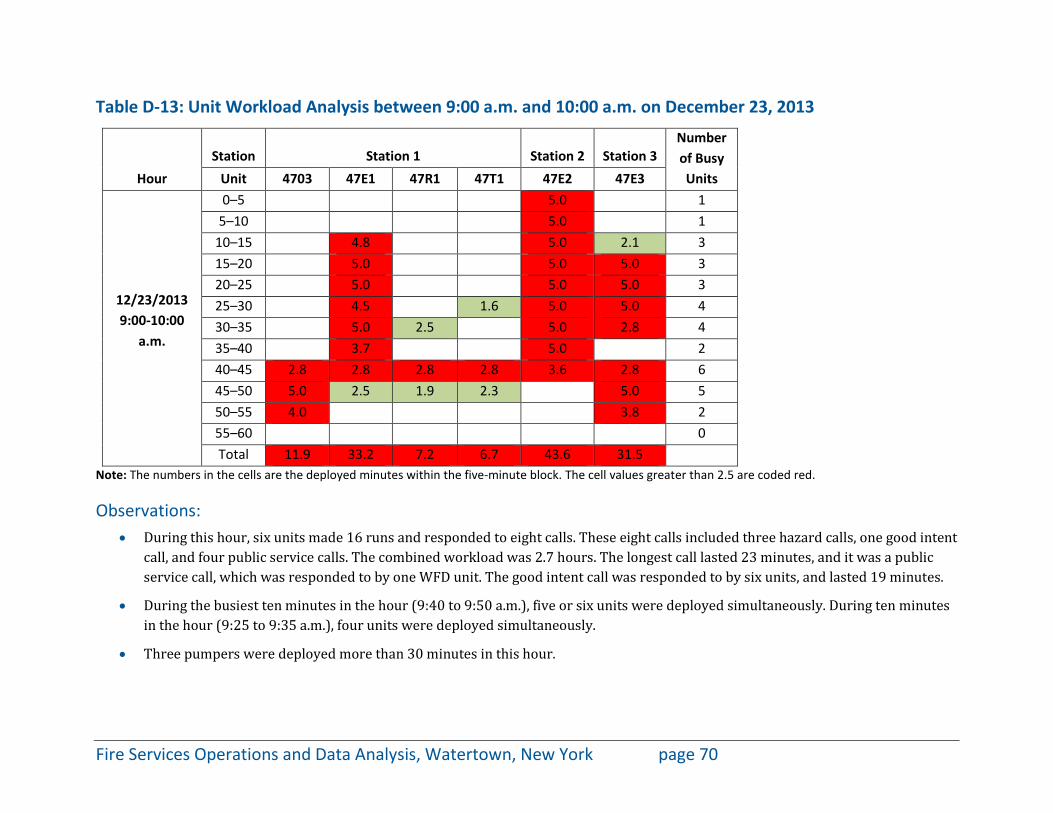
Table D-13: Unit Workload Analysis between 9:00 a.m. and 10:00 a.m. on December 23, 2013
Hour Station Station 1 Station 2 Station 3
Number of Busy Units Unit 4703 47E1 47R1 47T1 47E2 47E3
12/23/2013 9:00-10:00
a.m.
0–5 5.0 1 5–10 5.0 1
10–15 4.8 5.0 2.1 3 15–20 5.0 5.0 5.0 3 20–25 5.0 5.0 5.0 3 25–30 4.5 1.6 5.0 5.0 4 30–35 5.0 2.5 5.0 2.8 4 35–40 3.7 5.0 2 40–45 2.8 2.8 2.8 2.8 3.6 2.8 6 45–50 5.0 2.5 1.9 2.3 5.0 5 50–55 4.0 3.8 2 55–60 0 Total 11.9 33.2 7.2 6.7 43.6 31.5
Note: The numbers in the cells are the deployed minutes within the five-minute block. The cell values greater than 2.5 are coded red.
Observations: • During this hour, six units made 16 runs and responded to eight calls. These eight calls included three hazard calls, one good intent
call, and four public service calls. The combined workload was 2.7 hours. The longest call lasted 23 minutes, and it was a public service call, which was responded to by one WFD unit. The good intent call was responded to by six units, and lasted 19 minutes.
• During the busiest ten minutes in the hour (9:40 to 9:50 a.m.), five or six units were deployed simultaneously. During ten minutes in the hour (9:25 to 9:35 a.m.), four units were deployed simultaneously.
• Three pumpers were deployed more than 30 minutes in this hour.
Fire Services Operations and Data Analysis, Watertown, New York page 70
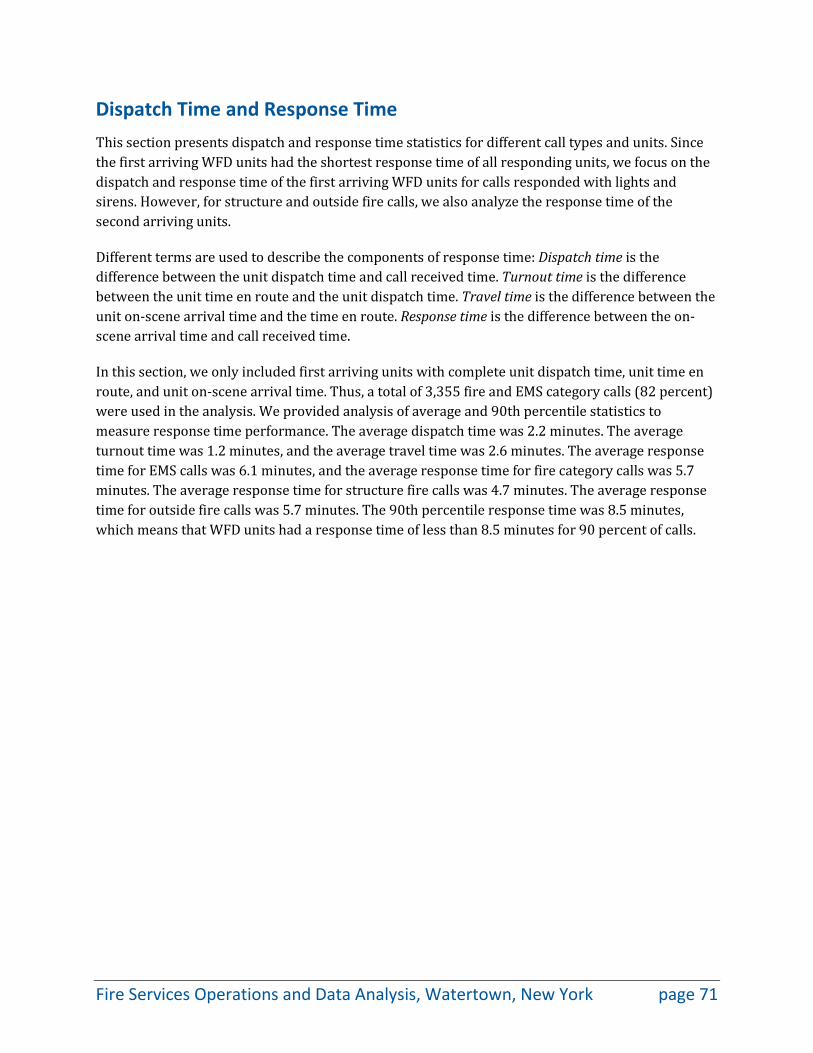
Dispatch Time and Response Time This section presents dispatch and response time statistics for different call types and units. Since the first arriving WFD units had the shortest response time of all responding units, we focus on the dispatch and response time of the first arriving WFD units for calls responded with lights and sirens. However, for structure and outside fire calls, we also analyze the response time of the second arriving units.
Different terms are used to describe the components of response time: Dispatch time is the difference between the unit dispatch time and call received time. Turnout time is the difference between the unit time en route and the unit dispatch time. Travel time is the difference between the unit on-scene arrival time and the time en route. Response time is the difference between the on-scene arrival time and call received time.
In this section, we only included first arriving units with complete unit dispatch time, unit time en route, and unit on-scene arrival time. Thus, a total of 3,355 fire and EMS category calls (82 percent) were used in the analysis. We provided analysis of average and 90th percentile statistics to measure response time performance. The average dispatch time was 2.2 minutes. The average turnout time was 1.2 minutes, and the average travel time was 2.6 minutes. The average response time for EMS calls was 6.1 minutes, and the average response time for fire category calls was 5.7 minutes. The average response time for structure fire calls was 4.7 minutes. The average response time for outside fire calls was 5.7 minutes. The 90th percentile response time was 8.5 minutes, which means that WFD units had a response time of less than 8.5 minutes for 90 percent of calls.
Fire Services Operations and Data Analysis, Watertown, New York page 71
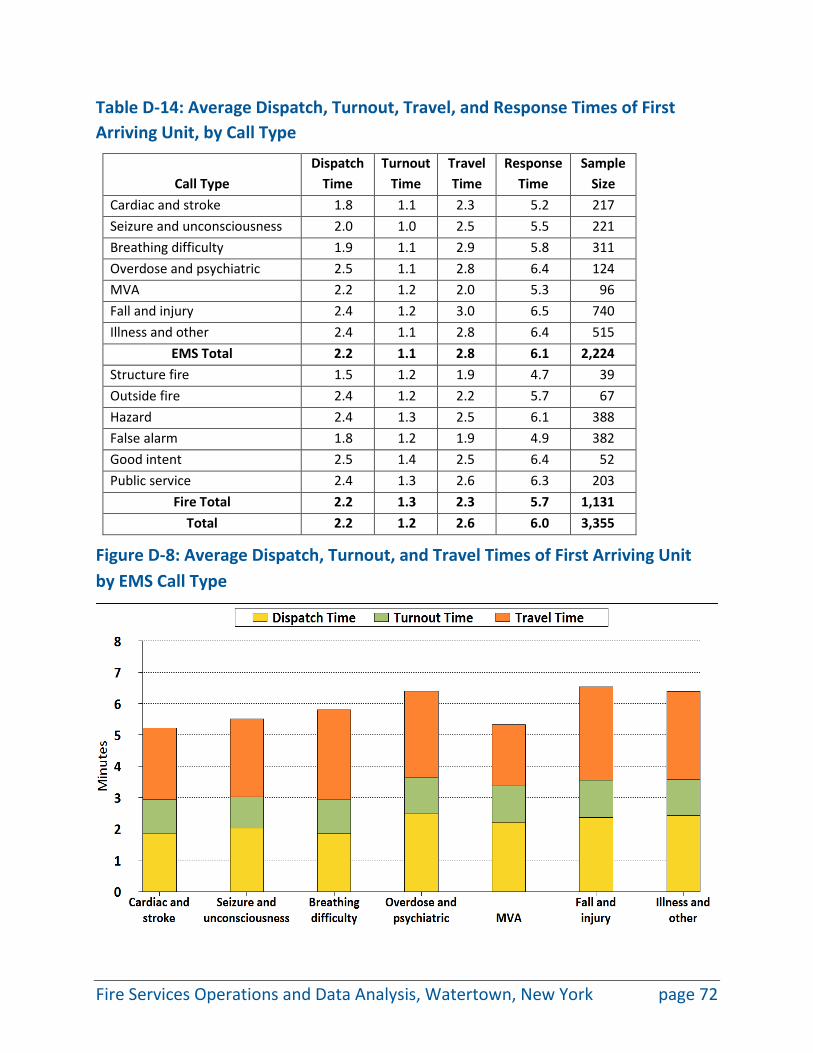
Table D-14: Average Dispatch, Turnout, Travel, and Response Times of First Arriving Unit, by Call Type
Call Type Dispatch
Time Turnout
Time Travel Time
Response Time
Sample Size
Cardiac and stroke 1.8 1.1 2.3 5.2 217 Seizure and unconsciousness 2.0 1.0 2.5 5.5 221 Breathing difficulty 1.9 1.1 2.9 5.8 311 Overdose and psychiatric 2.5 1.1 2.8 6.4 124 MVA 2.2 1.2 2.0 5.3 96 Fall and injury 2.4 1.2 3.0 6.5 740 Illness and other 2.4 1.1 2.8 6.4 515
EMS Total 2.2 1.1 2.8 6.1 2,224 Structure fire 1.5 1.2 1.9 4.7 39 Outside fire 2.4 1.2 2.2 5.7 67 Hazard 2.4 1.3 2.5 6.1 388 False alarm 1.8 1.2 1.9 4.9 382 Good intent 2.5 1.4 2.5 6.4 52 Public service 2.4 1.3 2.6 6.3 203
Fire Total 2.2 1.3 2.3 5.7 1,131 Total 2.2 1.2 2.6 6.0 3,355
Figure D-8: Average Dispatch, Turnout, and Travel Times of First Arriving Unit by EMS Call Type
Fire Services Operations and Data Analysis, Watertown, New York page 72
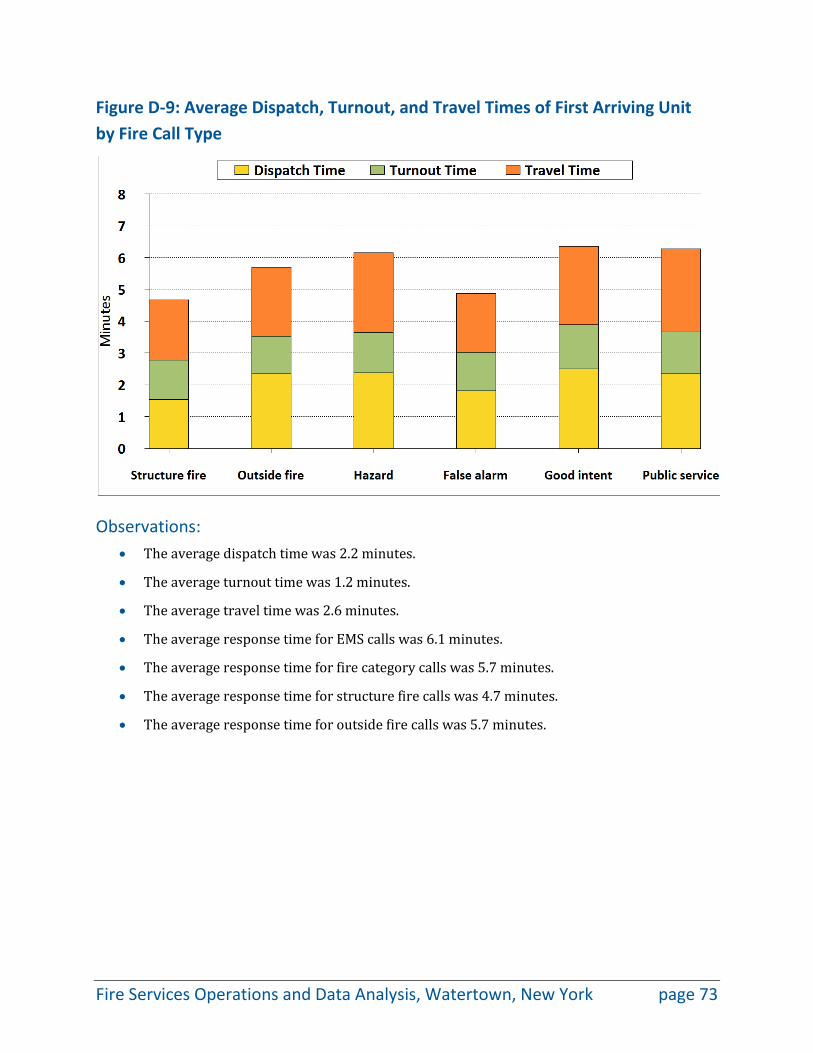
Figure D-9: Average Dispatch, Turnout, and Travel Times of First Arriving Unit by Fire Call Type
Observations: • The average dispatch time was 2.2 minutes.
• The average turnout time was 1.2 minutes.
• The average travel time was 2.6 minutes.
• The average response time for EMS calls was 6.1 minutes.
• The average response time for fire category calls was 5.7 minutes.
• The average response time for structure fire calls was 4.7 minutes.
• The average response time for outside fire calls was 5.7 minutes.
Fire Services Operations and Data Analysis, Watertown, New York page 73
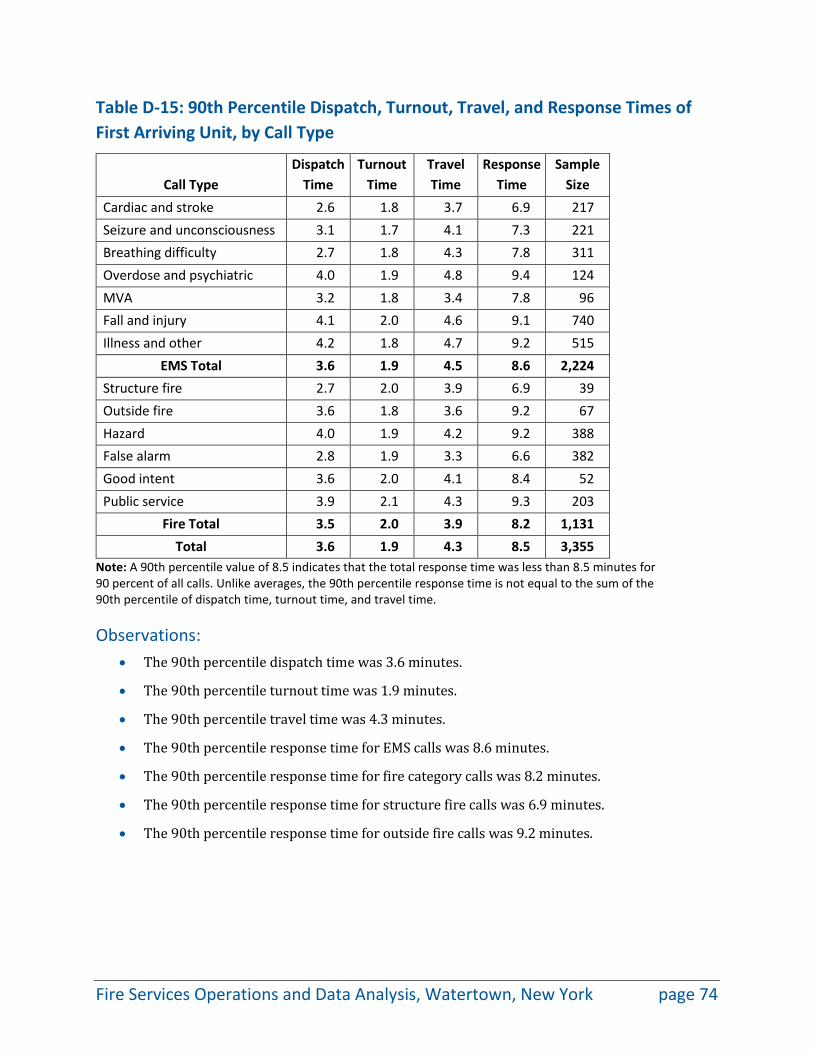
Table D-15: 90th Percentile Dispatch, Turnout, Travel, and Response Times of First Arriving Unit, by Call Type
Call Type Dispatch
Time Turnout
Time Travel Time
Response Time
Sample Size
Cardiac and stroke 2.6 1.8 3.7 6.9 217 Seizure and unconsciousness 3.1 1.7 4.1 7.3 221 Breathing difficulty 2.7 1.8 4.3 7.8 311 Overdose and psychiatric 4.0 1.9 4.8 9.4 124 MVA 3.2 1.8 3.4 7.8 96 Fall and injury 4.1 2.0 4.6 9.1 740 Illness and other 4.2 1.8 4.7 9.2 515
EMS Total 3.6 1.9 4.5 8.6 2,224 Structure fire 2.7 2.0 3.9 6.9 39 Outside fire 3.6 1.8 3.6 9.2 67 Hazard 4.0 1.9 4.2 9.2 388 False alarm 2.8 1.9 3.3 6.6 382 Good intent 3.6 2.0 4.1 8.4 52 Public service 3.9 2.1 4.3 9.3 203
Fire Total 3.5 2.0 3.9 8.2 1,131 Total 3.6 1.9 4.3 8.5 3,355
Note: A 90th percentile value of 8.5 indicates that the total response time was less than 8.5 minutes for 90 percent of all calls. Unlike averages, the 90th percentile response time is not equal to the sum of the 90th percentile of dispatch time, turnout time, and travel time.
Observations: • The 90th percentile dispatch time was 3.6 minutes.
• The 90th percentile turnout time was 1.9 minutes.
• The 90th percentile travel time was 4.3 minutes.
• The 90th percentile response time for EMS calls was 8.6 minutes.
• The 90th percentile response time for fire category calls was 8.2 minutes.
• The 90th percentile response time for structure fire calls was 6.9 minutes.
• The 90th percentile response time for outside fire calls was 9.2 minutes.
Fire Services Operations and Data Analysis, Watertown, New York page 74
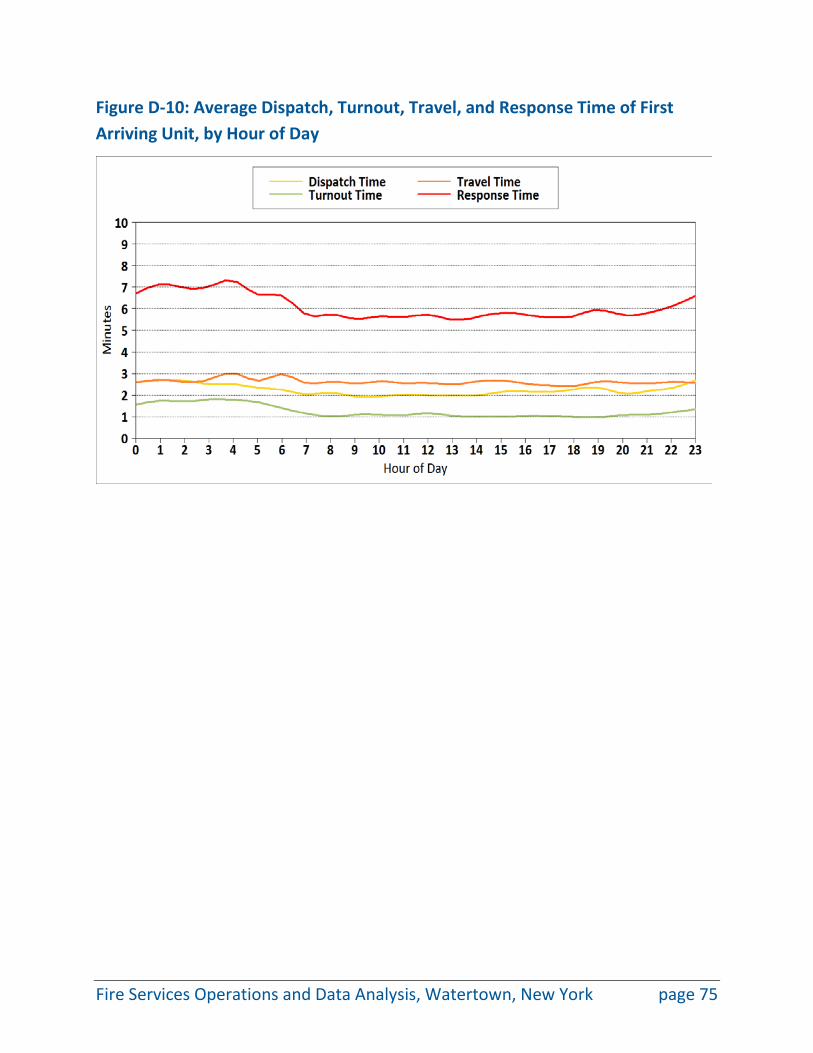
Figure D-10: Average Dispatch, Turnout, Travel, and Response Time of First Arriving Unit, by Hour of Day
Fire Services Operations and Data Analysis, Watertown, New York page 75
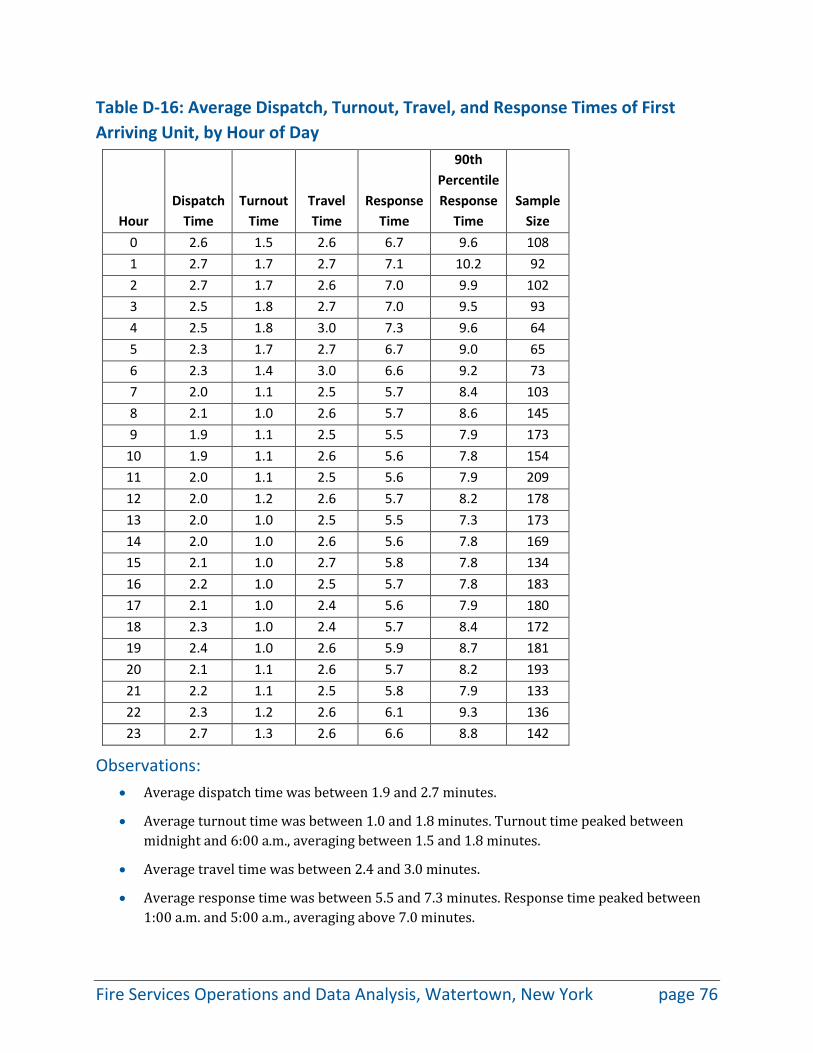
Table D-16: Average Dispatch, Turnout, Travel, and Response Times of First Arriving Unit, by Hour of Day
Hour
Dispatch
Time Turnout
Time Travel Time
Response Time
90th Percentile Response
Time Sample
Size 0 2.6 1.5 2.6 6.7 9.6 108 1 2.7 1.7 2.7 7.1 10.2 92 2 2.7 1.7 2.6 7.0 9.9 102 3 2.5 1.8 2.7 7.0 9.5 93 4 2.5 1.8 3.0 7.3 9.6 64 5 2.3 1.7 2.7 6.7 9.0 65 6 2.3 1.4 3.0 6.6 9.2 73 7 2.0 1.1 2.5 5.7 8.4 103 8 2.1 1.0 2.6 5.7 8.6 145 9 1.9 1.1 2.5 5.5 7.9 173
10 1.9 1.1 2.6 5.6 7.8 154 11 2.0 1.1 2.5 5.6 7.9 209 12 2.0 1.2 2.6 5.7 8.2 178 13 2.0 1.0 2.5 5.5 7.3 173 14 2.0 1.0 2.6 5.6 7.8 169 15 2.1 1.0 2.7 5.8 7.8 134 16 2.2 1.0 2.5 5.7 7.8 183 17 2.1 1.0 2.4 5.6 7.9 180 18 2.3 1.0 2.4 5.7 8.4 172 19 2.4 1.0 2.6 5.9 8.7 181 20 2.1 1.1 2.6 5.7 8.2 193 21 2.2 1.1 2.5 5.8 7.9 133 22 2.3 1.2 2.6 6.1 9.3 136 23 2.7 1.3 2.6 6.6 8.8 142
Observations: • Average dispatch time was between 1.9 and 2.7 minutes.
• Average turnout time was between 1.0 and 1.8 minutes. Turnout time peaked between midnight and 6:00 a.m., averaging between 1.5 and 1.8 minutes.
• Average travel time was between 2.4 and 3.0 minutes.
• Average response time was between 5.5 and 7.3 minutes. Response time peaked between 1:00 a.m. and 5:00 a.m., averaging above 7.0 minutes.
Fire Services Operations and Data Analysis, Watertown, New York page 76
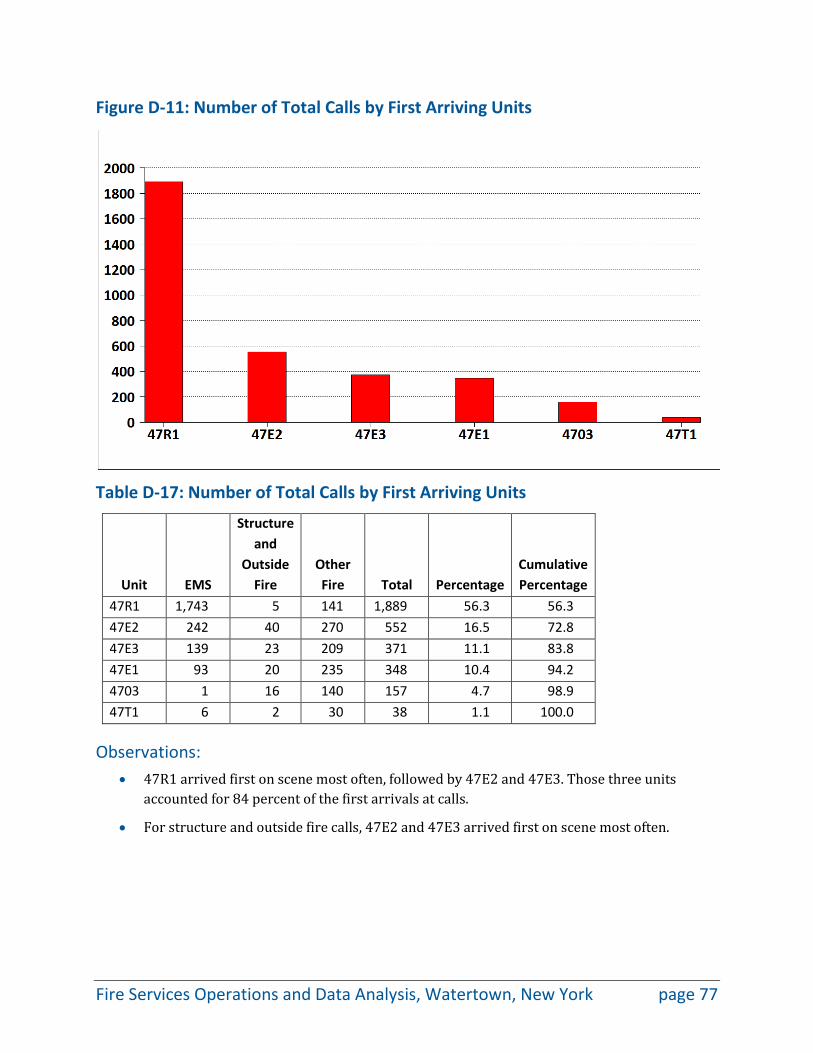
Figure D-11: Number of Total Calls by First Arriving Units
Table D-17: Number of Total Calls by First Arriving Units
Unit EMS
Structure and
Outside Fire
Other Fire Total Percentage
Cumulative Percentage
47R1 1,743 5 141 1,889 56.3 56.3 47E2 242 40 270 552 16.5 72.8 47E3 139 23 209 371 11.1 83.8 47E1 93 20 235 348 10.4 94.2 4703 1 16 140 157 4.7 98.9 47T1 6 2 30 38 1.1 100.0
Observations: • 47R1 arrived first on scene most often, followed by 47E2 and 47E3. Those three units
accounted for 84 percent of the first arrivals at calls.
• For structure and outside fire calls, 47E2 and 47E3 arrived first on scene most often.
Fire Services Operations and Data Analysis, Watertown, New York page 77
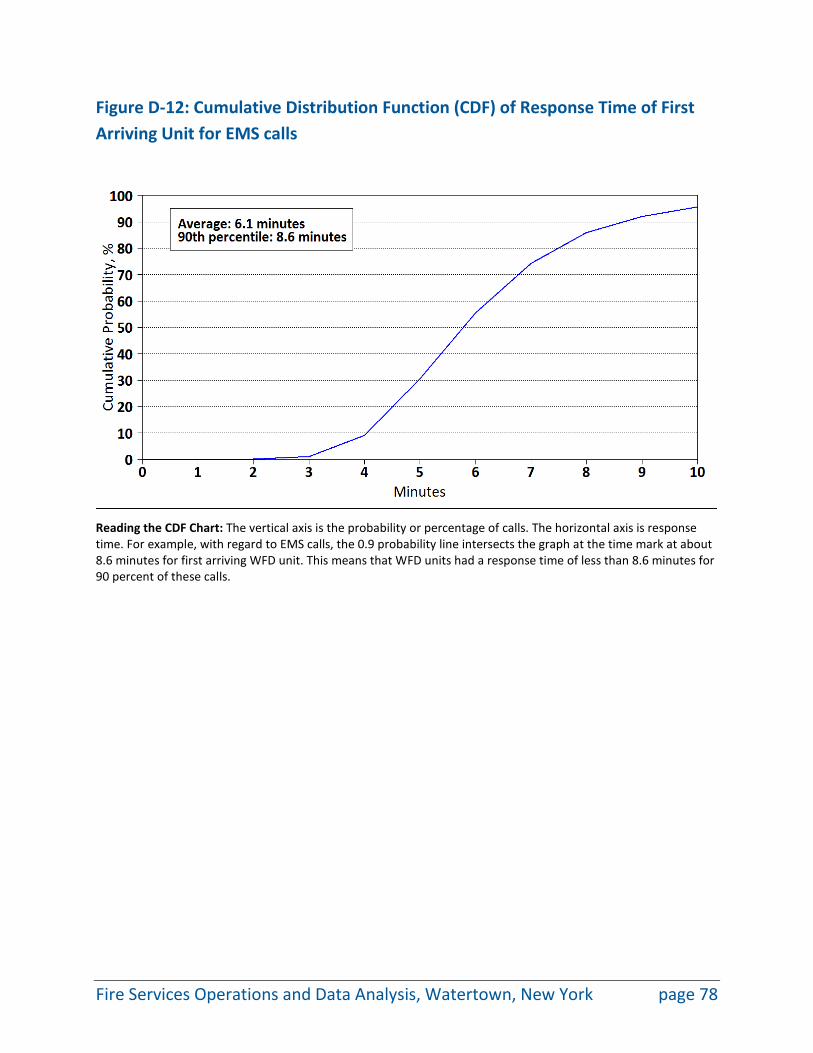
Figure D-12: Cumulative Distribution Function (CDF) of Response Time of First Arriving Unit for EMS calls
Reading the CDF Chart: The vertical axis is the probability or percentage of calls. The horizontal axis is response time. For example, with regard to EMS calls, the 0.9 probability line intersects the graph at the time mark at about 8.6 minutes for first arriving WFD unit. This means that WFD units had a response time of less than 8.6 minutes for 90 percent of these calls.
Fire Services Operations and Data Analysis, Watertown, New York page 78
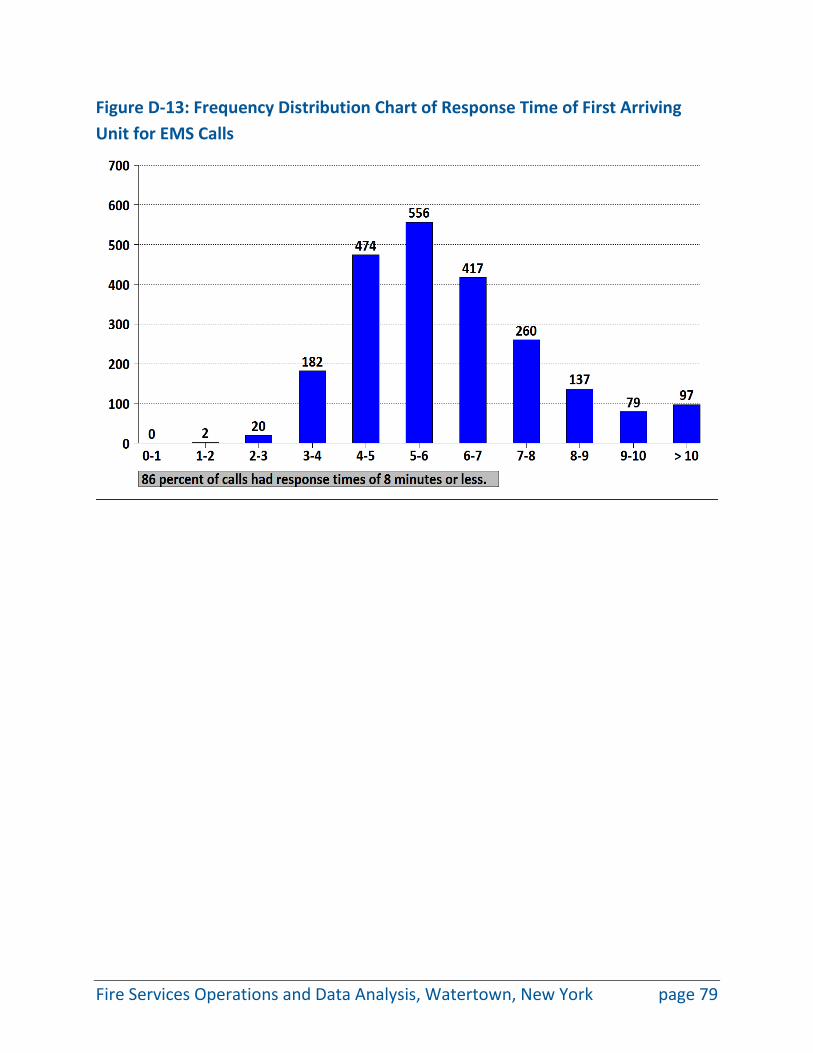
Figure D-13: Frequency Distribution Chart of Response Time of First Arriving Unit for EMS Calls
Fire Services Operations and Data Analysis, Watertown, New York page 79
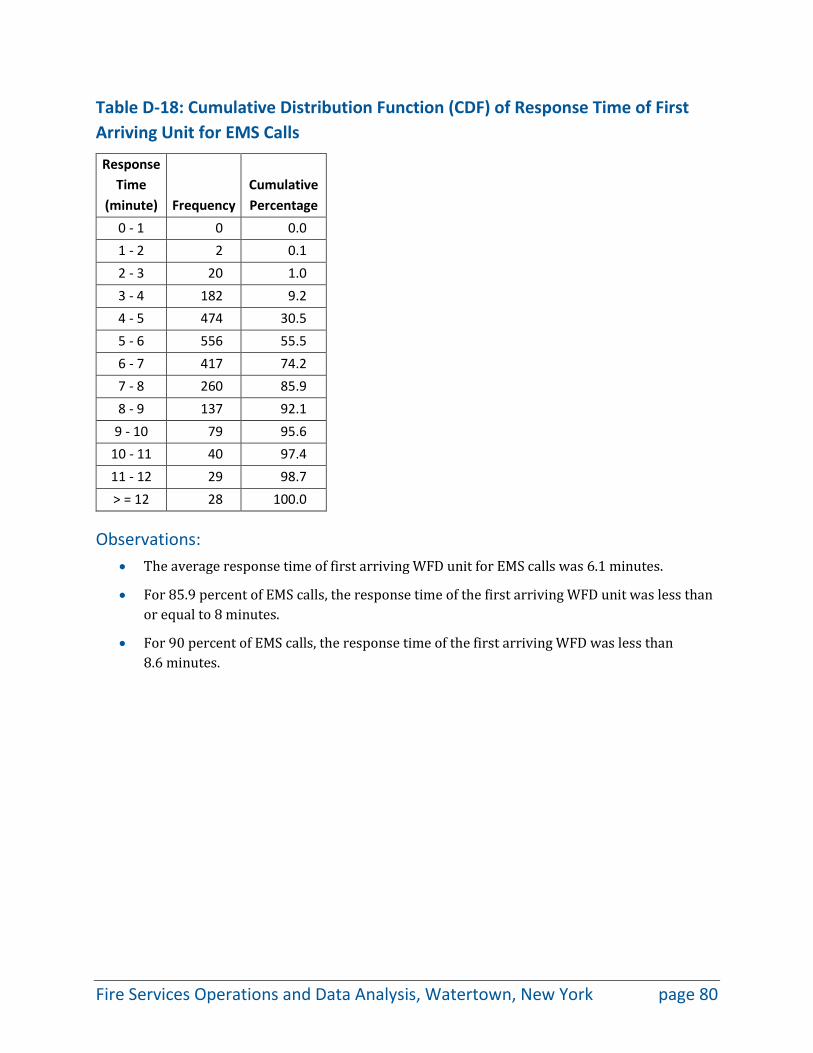
Table D-18: Cumulative Distribution Function (CDF) of Response Time of First Arriving Unit for EMS Calls
Response Time
(minute) Frequency Cumulative Percentage
0 - 1 0 0.0 1 - 2 2 0.1 2 - 3 20 1.0 3 - 4 182 9.2 4 - 5 474 30.5 5 - 6 556 55.5 6 - 7 417 74.2 7 - 8 260 85.9 8 - 9 137 92.1
9 - 10 79 95.6 10 - 11 40 97.4 11 - 12 29 98.7 > = 12 28 100.0
Observations: • The average response time of first arriving WFD unit for EMS calls was 6.1 minutes.
• For 85.9 percent of EMS calls, the response time of the first arriving WFD unit was less than or equal to 8 minutes.
• For 90 percent of EMS calls, the response time of the first arriving WFD was less than 8.6 minutes.
Fire Services Operations and Data Analysis, Watertown, New York page 80
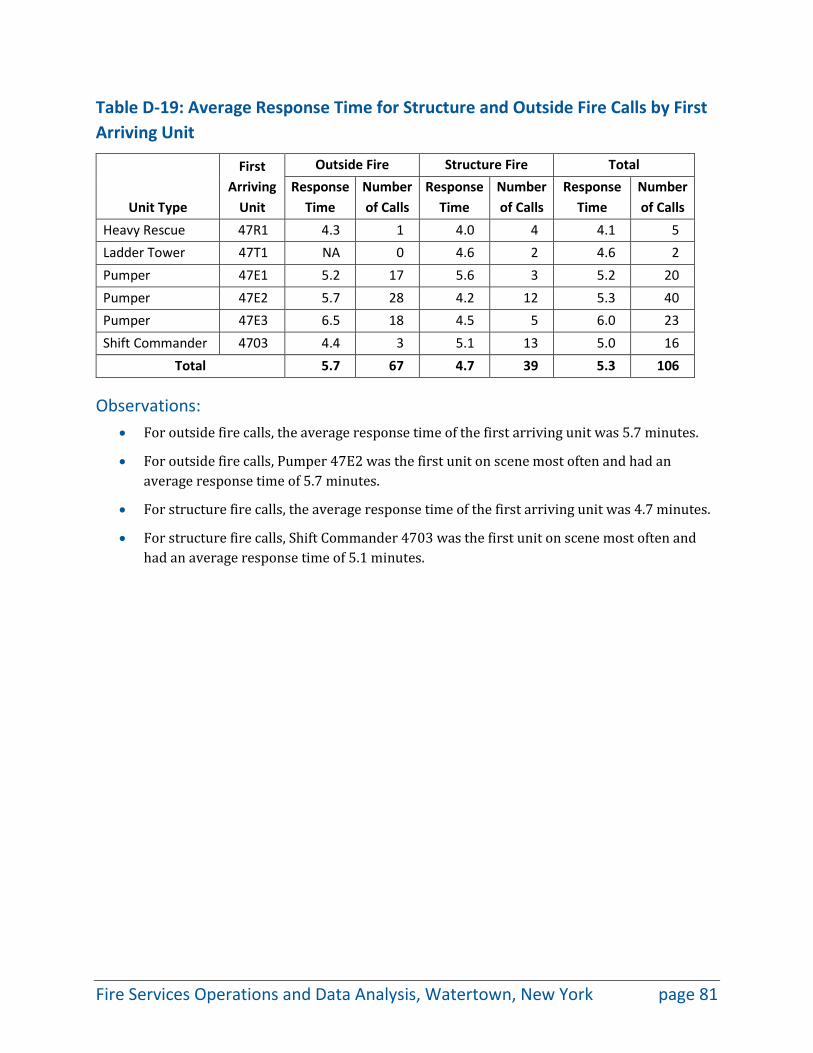
Table D-19: Average Response Time for Structure and Outside Fire Calls by First Arriving Unit
Unit Type
First Arriving
Unit
Outside Fire Structure Fire Total Response
Time Number of Calls
Response Time
Number of Calls
Response Time
Number of Calls
Heavy Rescue 47R1 4.3 1 4.0 4 4.1 5 Ladder Tower 47T1 NA 0 4.6 2 4.6 2 Pumper 47E1 5.2 17 5.6 3 5.2 20 Pumper 47E2 5.7 28 4.2 12 5.3 40 Pumper 47E3 6.5 18 4.5 5 6.0 23 Shift Commander 4703 4.4 3 5.1 13 5.0 16
Total 5.7 67 4.7 39 5.3 106
Observations: • For outside fire calls, the average response time of the first arriving unit was 5.7 minutes.
• For outside fire calls, Pumper 47E2 was the first unit on scene most often and had an average response time of 5.7 minutes.
• For structure fire calls, the average response time of the first arriving unit was 4.7 minutes.
• For structure fire calls, Shift Commander 4703 was the first unit on scene most often and had an average response time of 5.1 minutes.
Fire Services Operations and Data Analysis, Watertown, New York page 81
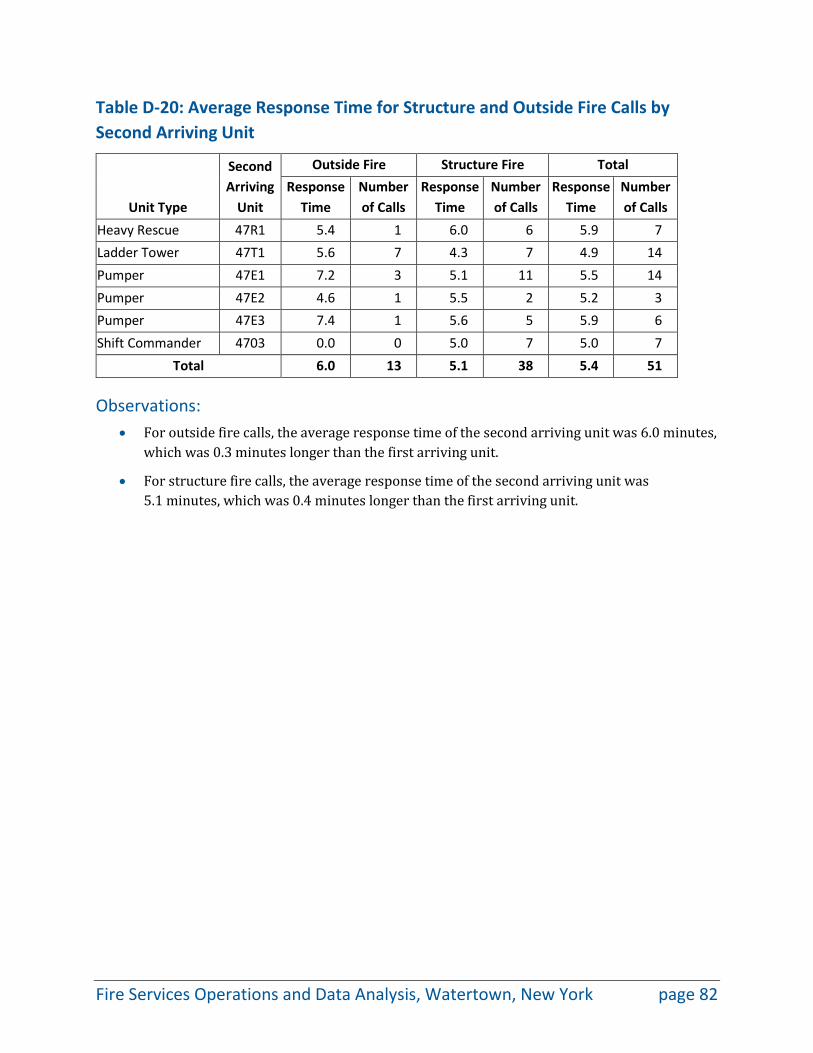
Table D-20: Average Response Time for Structure and Outside Fire Calls by Second Arriving Unit
Unit Type
Second Arriving
Unit
Outside Fire Structure Fire Total Response
Time Number of Calls
Response Time
Number of Calls
Response Time
Number of Calls
Heavy Rescue 47R1 5.4 1 6.0 6 5.9 7 Ladder Tower 47T1 5.6 7 4.3 7 4.9 14 Pumper 47E1 7.2 3 5.1 11 5.5 14 Pumper 47E2 4.6 1 5.5 2 5.2 3 Pumper 47E3 7.4 1 5.6 5 5.9 6 Shift Commander 4703 0.0 0 5.0 7 5.0 7
Total 6.0 13 5.1 38 5.4 51
Observations: • For outside fire calls, the average response time of the second arriving unit was 6.0 minutes,
which was 0.3 minutes longer than the first arriving unit.
• For structure fire calls, the average response time of the second arriving unit was 5.1 minutes, which was 0.4 minutes longer than the first arriving unit.
Fire Services Operations and Data Analysis, Watertown, New York page 82
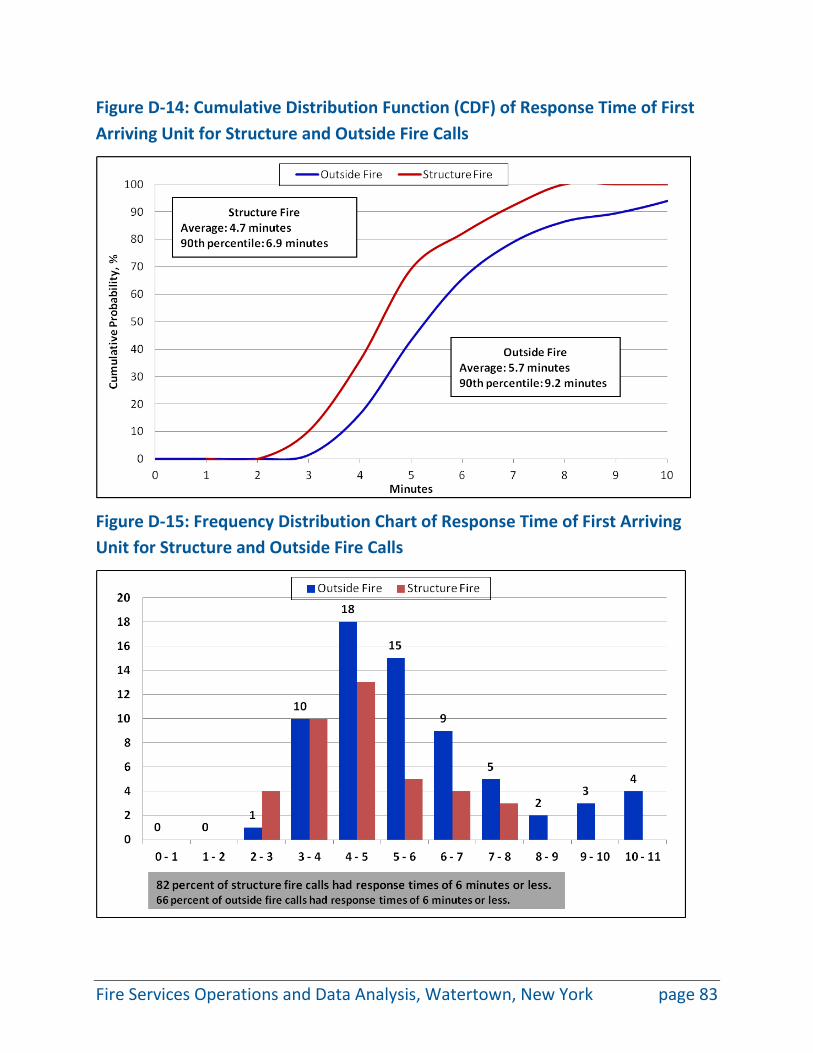
Figure D-14: Cumulative Distribution Function (CDF) of Response Time of First Arriving Unit for Structure and Outside Fire Calls
Figure D-15: Frequency Distribution Chart of Response Time of First Arriving Unit for Structure and Outside Fire Calls
Fire Services Operations and Data Analysis, Watertown, New York page 83
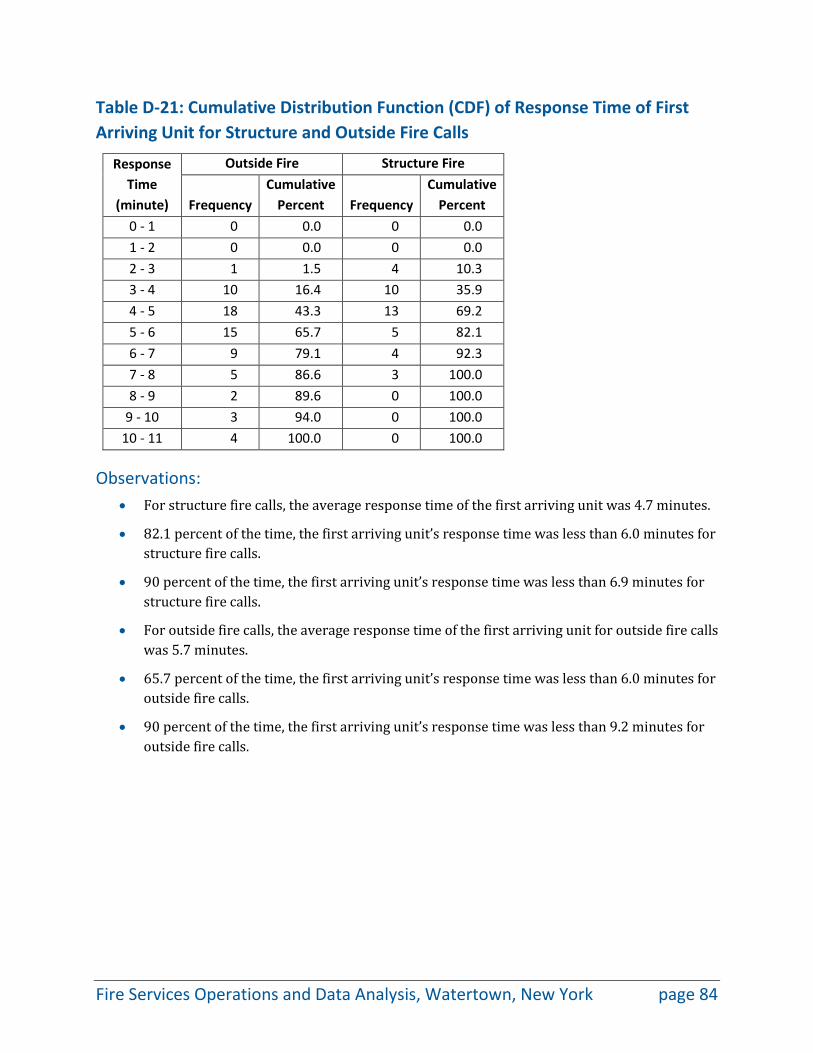
Table D-21: Cumulative Distribution Function (CDF) of Response Time of First Arriving Unit for Structure and Outside Fire Calls
Response Time
(minute)
Outside Fire Structure Fire
Frequency Cumulative
Percent Frequency Cumulative
Percent 0 - 1 0 0.0 0 0.0 1 - 2 0 0.0 0 0.0 2 - 3 1 1.5 4 10.3 3 - 4 10 16.4 10 35.9 4 - 5 18 43.3 13 69.2 5 - 6 15 65.7 5 82.1 6 - 7 9 79.1 4 92.3 7 - 8 5 86.6 3 100.0 8 - 9 2 89.6 0 100.0
9 - 10 3 94.0 0 100.0 10 - 11 4 100.0 0 100.0
Observations: • For structure fire calls, the average response time of the first arriving unit was 4.7 minutes.
• 82.1 percent of the time, the first arriving unit’s response time was less than 6.0 minutes for structure fire calls.
• 90 percent of the time, the first arriving unit’s response time was less than 6.9 minutes for structure fire calls.
• For outside fire calls, the average response time of the first arriving unit for outside fire calls was 5.7 minutes.
• 65.7 percent of the time, the first arriving unit’s response time was less than 6.0 minutes for outside fire calls.
• 90 percent of the time, the first arriving unit’s response time was less than 9.2 minutes for outside fire calls.
Fire Services Operations and Data Analysis, Watertown, New York page 84
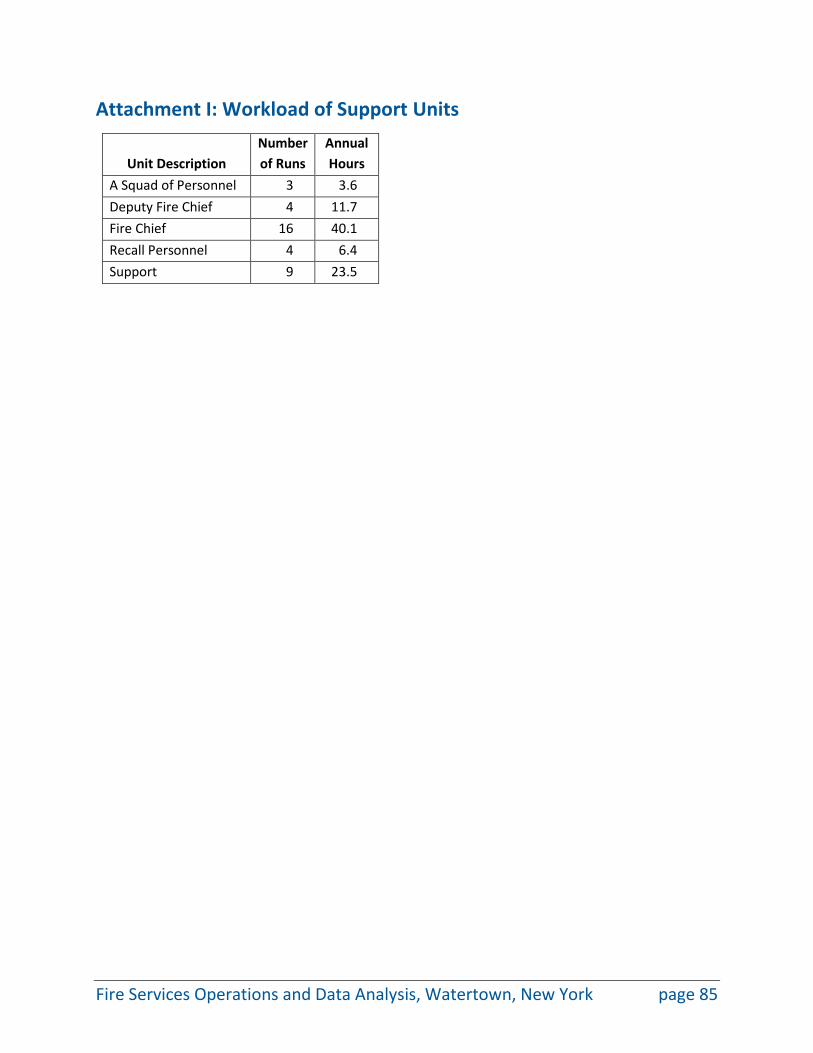
Attachment I: Workload of Support Units
Unit Description Number of Runs
Annual Hours
A Squad of Personnel 3 3.6 Deputy Fire Chief 4 11.7 Fire Chief 16 40.1 Recall Personnel 4 6.4 Support 9 23.5
Fire Services Operations and Data Analysis, Watertown, New York page 85
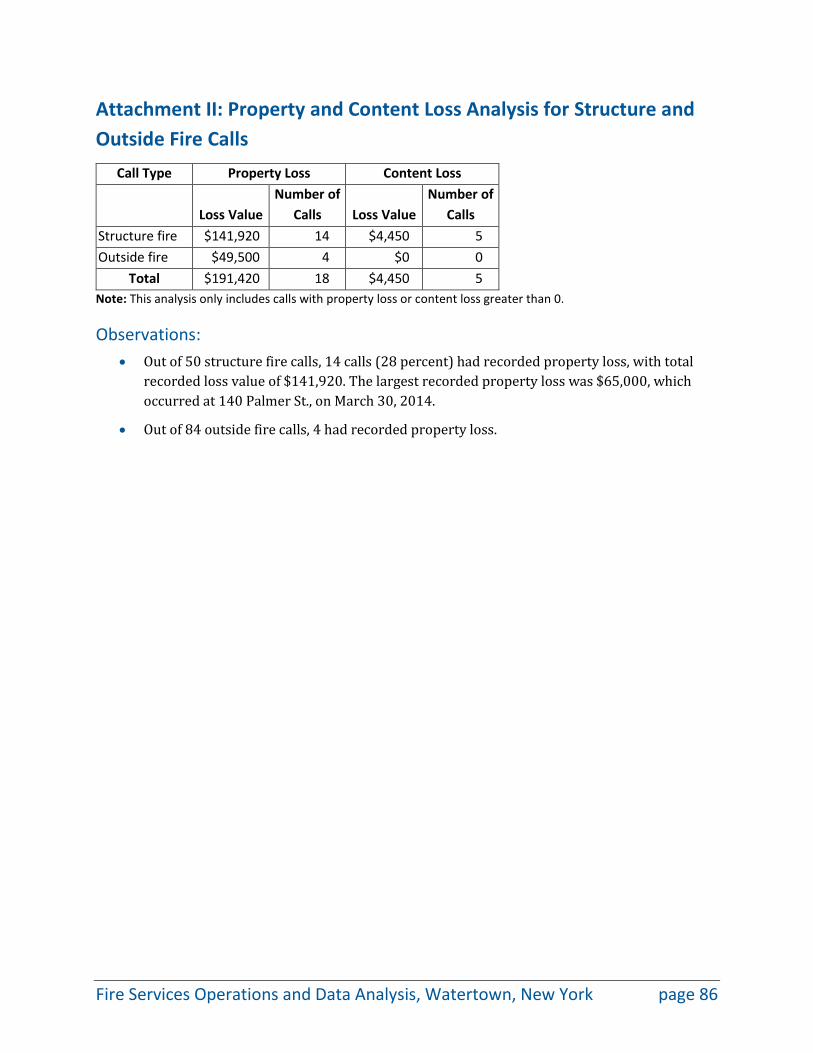
Attachment II: Property and Content Loss Analysis for Structure and Outside Fire Calls
Call Type Property Loss Content Loss
Loss Value Number of
Calls Loss Value Number of
Calls Structure fire $141,920 14 $4,450 5 Outside fire $49,500 4 $0 0
Total $191,420 18 $4,450 5 Note: This analysis only includes calls with property loss or content loss greater than 0.
Observations: • Out of 50 structure fire calls, 14 calls (28 percent) had recorded property loss, with total
recorded loss value of $141,920. The largest recorded property loss was $65,000, which occurred at 140 Palmer St., on March 30, 2014.
• Out of 84 outside fire calls, 4 had recorded property loss.
Fire Services Operations and Data Analysis, Watertown, New York page 86
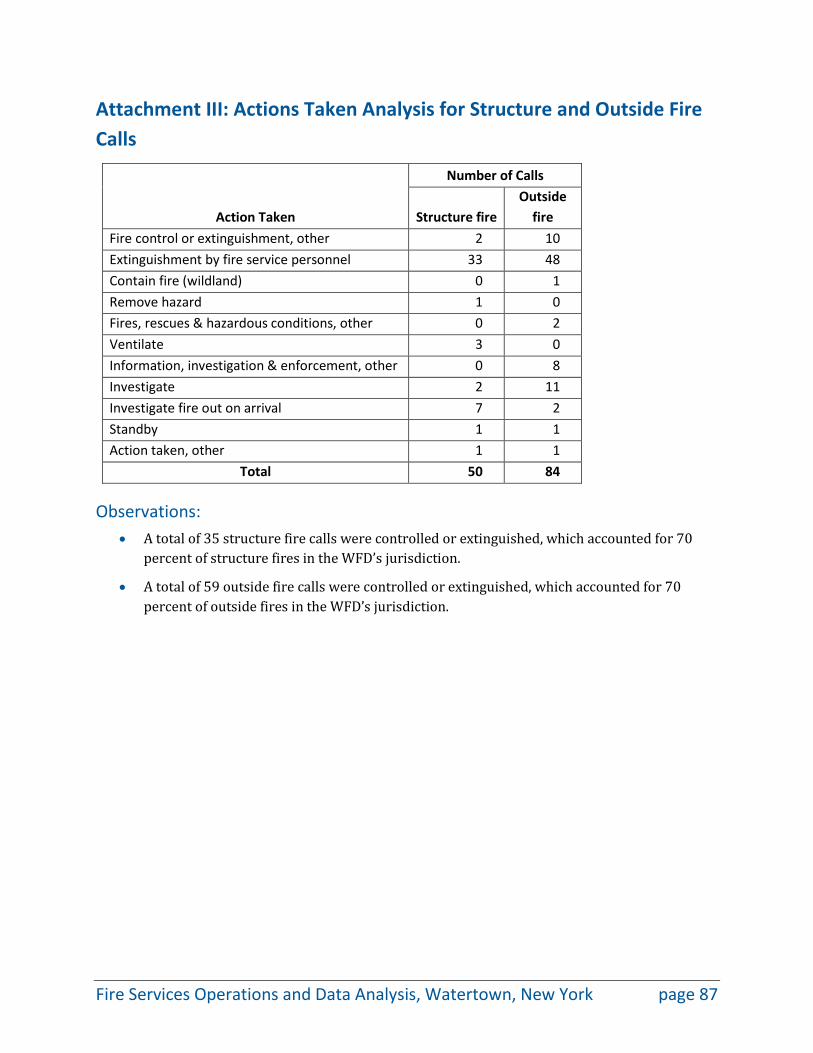
Attachment III: Actions Taken Analysis for Structure and Outside Fire Calls
Action Taken
Number of Calls
Structure fire Outside
fire Fire control or extinguishment, other 2 10 Extinguishment by fire service personnel 33 48 Contain fire (wildland) 0 1 Remove hazard 1 0 Fires, rescues & hazardous conditions, other 0 2 Ventilate 3 0 Information, investigation & enforcement, other 0 8 Investigate 2 11 Investigate fire out on arrival 7 2 Standby 1 1 Action taken, other 1 1
Total 50 84
Observations: • A total of 35 structure fire calls were controlled or extinguished, which accounted for 70
percent of structure fires in the WFD’s jurisdiction.
• A total of 59 outside fire calls were controlled or extinguished, which accounted for 70 percent of outside fires in the WFD’s jurisdiction.
Fire Services Operations and Data Analysis, Watertown, New York page 87
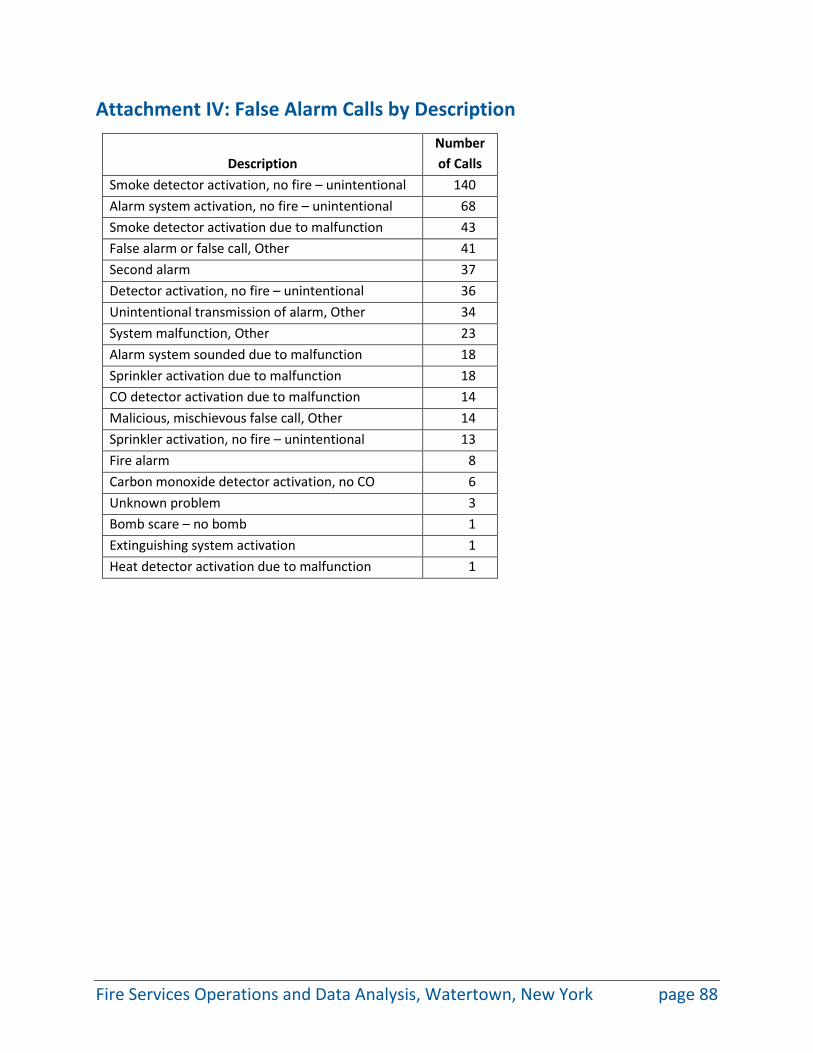
Attachment IV: False Alarm Calls by Description
Description Number of Calls
Smoke detector activation, no fire – unintentional 140 Alarm system activation, no fire – unintentional 68 Smoke detector activation due to malfunction 43 False alarm or false call, Other 41 Second alarm 37 Detector activation, no fire – unintentional 36 Unintentional transmission of alarm, Other 34 System malfunction, Other 23 Alarm system sounded due to malfunction 18 Sprinkler activation due to malfunction 18 CO detector activation due to malfunction 14 Malicious, mischievous false call, Other 14 Sprinkler activation, no fire – unintentional 13 Fire alarm 8 Carbon monoxide detector activation, no CO 6 Unknown problem 3 Bomb scare – no bomb 1 Extinguishing system activation 1 Heat detector activation due to malfunction 1
Fire Services Operations and Data Analysis, Watertown, New York page 88