water supply demand strategy - coliban water - welcome · wimmera system water supply demand...
TRANSCRIPT
Wimmera System
Water Supply Demand Strategy
2011 to 2060
Final Report
March 2012
Page 2 W I M M E R A S Y S T E M W S D S 2 0 1 1 T O 2 0 6 0
TABLE OF CONTENTS
Executive Summary 4
1. Introduction 7
2. Overview 8
2.1. Key Features 8
2.2. How Water is Delivered to each Town 8
2.3. Customer Profile 9
3. Recent Experience 10
3.1. Water Supply 10
3.2. Raw Water Demand 10
3.3. Water Quality 12
3.4. Waterplan 2055 Review 12
4. Levels of Service 13
5. Climate Change / Variability Scenarios 14
6. Demand Forecast 15
6.1. Current System Demand - Baseline Demand 15
6.2. Future System Demand 15
6.2.1. Population and Demand Growth 15
6.2.2. Residential Demand Growth 15
6.2.3. Non-Residential Demand Growth 16
6.2.4. Total Growth in Residential and Non-residential Demand 16
6.2.5. Environmental Demand 16
6.2.6. Climate Change 16
6.2.7. Behaviour Change 17
6.2.8. Improved Water Quality 17
6.2.9. Summary of System Demand Impacts 17
7. Supply Forecast 19
8. System Performance Evaluation 21
9. Demand Reduction Measures 23
9.1. Permanent Water Saving Rules (PWSR) 23
9.2. Reduction of Operational Water 23
9.3. Water Saving Incentives and Community Education 23
9.4. Pricing Incentives 24
9.5. Summary of Demand Reduction Measures 24
Page 3 W I M M E R A S Y S T E M W S D S 2 0 1 1 T O 2 0 6 0
10. Additional Supply Measures 25
10.1. Permanent Water Market 25
10.2. Temporary Water Market 25
10.3. Additional Water – Private Rain Water Tanks 26
10.4. Minimum Allocation 26
10.5. Alternative Water Sources 26
11. Water Quality Measures 27
12. Options Analysis 28
12.1. Demand Reduction 28
12.2. Additional Water 28
12.3. Options Summary 28
13. Management of Risk and Uncertainty 29
13.1. General 29
13.2. Murray Darling Basin Plan 29
14. Proposed Actions 30
14.1. Short-term Actions 30
14.2. Long-term Actions 30
15. Community & Stakeholder Engagement 31
APPENDICES Appendix 1: Alternative Water Atlas
Appendix 2: Long List of Supply Options
Page 4 W I M M E R A S Y S T E M W S D S 2 0 1 1 T O 2 0 6 0
Executive Summary
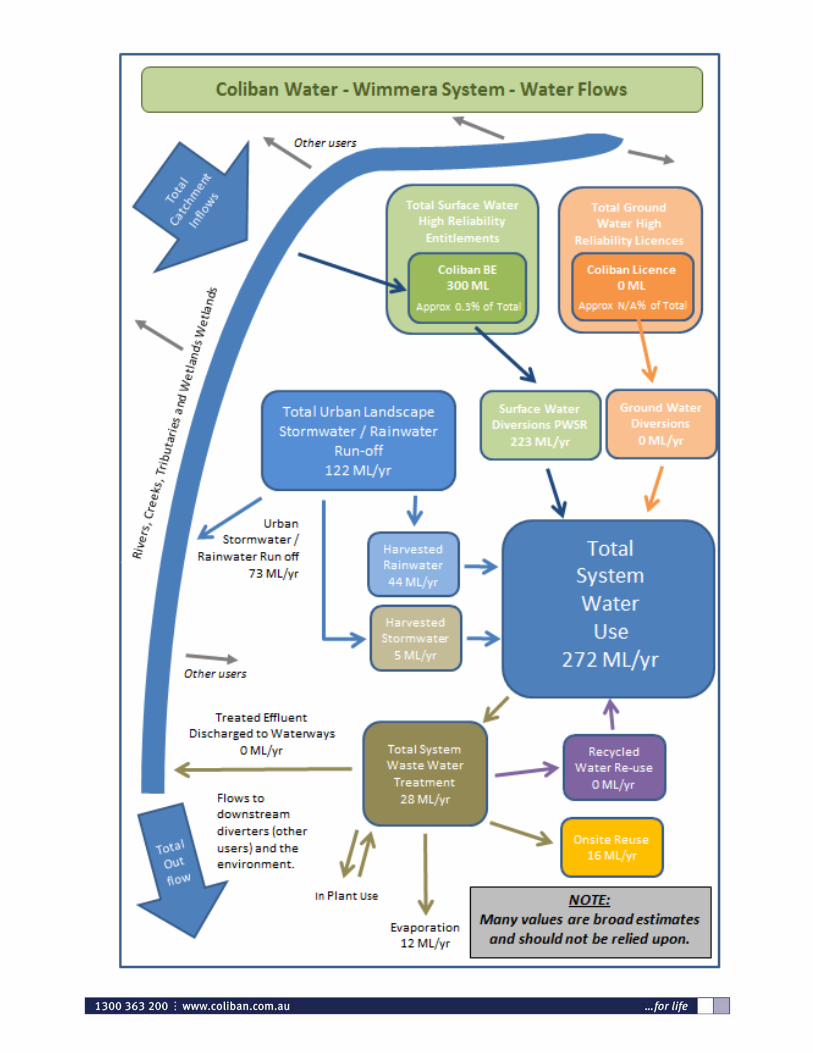
Introduction Coliban Region Water Corporation is a state owned water authority that provides water and wastewater services to a region with a population of 140,000 people, across 16,500 square kilometres of Central and Northern Victoria. The service area covers 49 towns in nine separate supply systems of which the Wimmera system is one.
The Water Supply Demand Strategy (WSDS) identifies the best mix of measures to maintain a balance between the demand for water and the available supply in urban supply systems, now and 50 years into the future. Coliban Water is required to consider the social, environmental and economic costs and benefits and the actions needed to address population growth, non-residential demand for water and potential climate variability.
The Wimmera System The Wimmera system supplies an estimated residential population of 968 in the towns of Wedderburn, Korong Vale, Borung and Wychitella. There are 658 customer connections; 89% are residential and 11% are non-residential.
Raw water is delivered by the Wimmera-Mallee Pipeline system under a 300 ML Bulk Water Entitlement from the Wimmera-Glenelg water supply system. The BE accounts for approximately 0.3% of the water entitlements and water shares supplied from the Wimmera-Mallee system. There are no major on-site storages in the Wimmera system and it relies on water being available at all times from the Wimmera-Mallee Pipeline.
A Water Treatment Plant is located at Korong Vale that supplies treated water to Korong Vale and Wedderburn. The treated water complies with the water quality standards specified in the Safe Drinking Water Act 2003. The water is not treated at Borung and Wychitella and these town systems are not drinking water supplies.
Recent Experience Average inflow to the Grampian system storages for the period from 1998 to 2010 was 68,000 ML per year or only 24% of the historical average of 287,000 ML per year. The Grampian storages fell to the lowest level on record of 5% of capacity in April 2008 and again in April 2009. The low water availability resulted in low allocation between 2005/06 to 2010/11 with a minimum allocation of 63% in 2006/07.
Water restrictions were continually in force for more than 11 years from December 1999 to January 2011. Stage 3 and Stage 4 restrictions were in force for more than seven years.
Annual water demand ranged from a maximum of 505 ML in 2004/05 due to high evaporation and seepage losses at the Korong Vale storages (Stage 3 year) to a minimum of 124 ML in 2010/11 following the replacement of the open storages and also partly due to the extremely high rainfall. Permanent Water Saving Rules (PWSR) have been in place since January 2011. The current estimated PWSR annual raw water demand is 223 ML.
The average annual residential consumption for the four years from 2007 to 2011 was 101 kL per property or two-thirds of the regional average of 153 kL per property. The average annual non-residential consumption for the last four years was 220 kL per property or one-quarter of the regional average of 855 kL per non-residential property.
The Wimmera open earthen channel system supplying water to the Wimmera towns was replaced by the Wimmera-Mallee Pipeline system in mid-2010. Coliban Water’s Korong Vale service basins (capacity 489 ML) and open storages at Borung and Wychitella were replaced with lined and covered basins and tanks to reduce high water losses.
The new Wimmera-Mallee Pipeline system has improved the security of supply to the Wimmera towns with its continuous all-year-round supply.
Page 5 W I M M E R A S Y S T E M W S D S 2 0 1 1 T O 2 0 6 0
The 300 ML BE came into force in 2010/11 and replaced a 450 ML BE as part of amendments to the water sharing arrangements in the Wimmera-Glenelg water supply system. Carryover to a maximum of 100% of the BE was also introduced in 2010/11 together with Spillable Water Accounts. This provides increased capability to manage water security from year-to-year.
Level of Service The Water Supply-Demand Strategy is developed to achieve both:
A PWSR supply reliability of 95% (where PWSR demand would be supplied in 95 out of 100 years and water restrictions would not be expected in more than 5 years in 100; and
A desired restriction level of no worse than Stage 1. More severe restrictions, such as Stage 3, would only be expected if severe or unexpected water shortages occur.
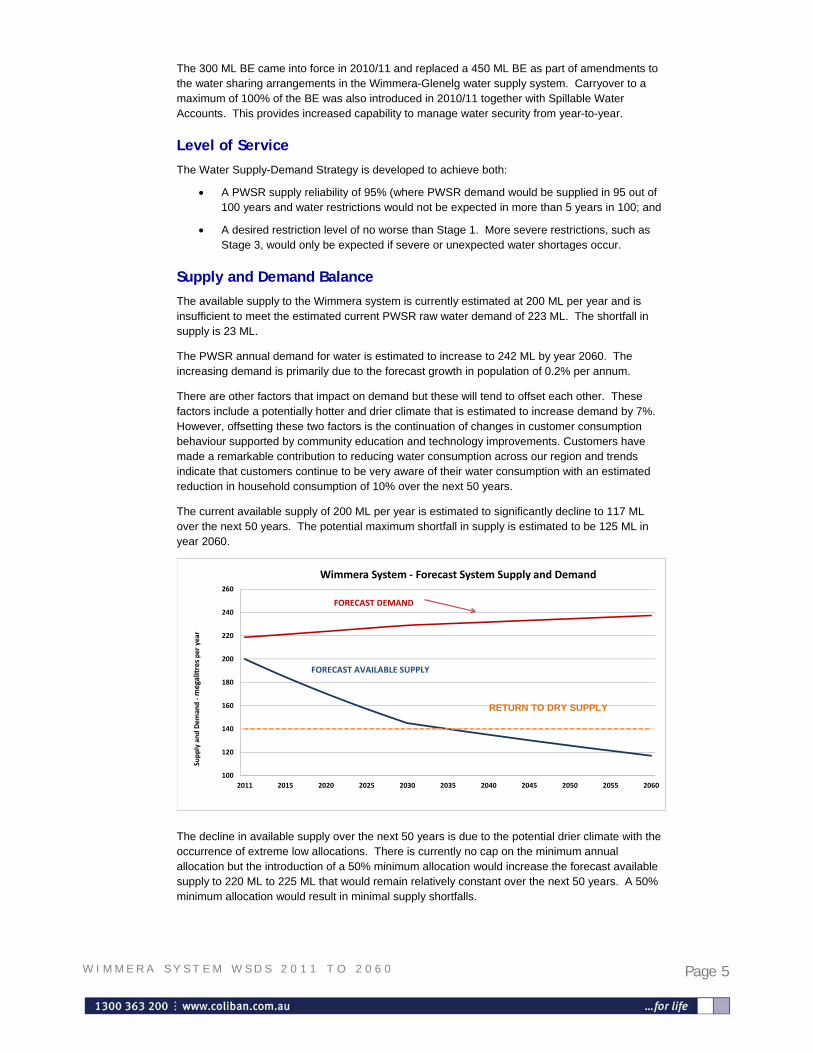
Supply and Demand Balance The available supply to the Wimmera system is currently estimated at 200 ML per year and is insufficient to meet the estimated current PWSR raw water demand of 223 ML. The shortfall in supply is 23 ML.
The PWSR annual demand for water is estimated to increase to 242 ML by year 2060. The increasing demand is primarily due to the forecast growth in population of 0.2% per annum.
There are other factors that impact on demand but these will tend to offset each other. These factors include a potentially hotter and drier climate that is estimated to increase demand by 7%. However, offsetting these two factors is the continuation of changes in customer consumption behaviour supported by community education and technology improvements. Customers have made a remarkable contribution to reducing water consumption across our region and trends indicate that customers continue to be very aware of their water consumption with an estimated reduction in household consumption of 10% over the next 50 years.
The current available supply of 200 ML per year is estimated to significantly decline to 117 ML over the next 50 years. The potential maximum shortfall in supply is estimated to be 125 ML in year 2060.
100
120
140
160
180
200
220
240
260
2011 2015 2020 2025 2030 2035 2040 2045 2050 2055 2060
Supply and Dem
and ‐megalitresper year
Wimmera System ‐ Forecast System Supply and Demand
FORECAST DEMAND
FORECAST AVAILABLE SUPPLY
RETURN TO DRY SUPPLY
The decline in available supply over the next 50 years is due to the potential drier climate with the occurrence of extreme low allocations. There is currently no cap on the minimum annual allocation but the introduction of a 50% minimum allocation would increase the forecast available supply to 220 ML to 225 ML that would remain relatively constant over the next 50 years. A 50% minimum allocation would result in minimal supply shortfalls.
Page 6 W I M M E R A S Y S T E M W S D S 2 0 1 1 T O 2 0 6 0
Meeting Supply-Demand Shortfall The Wimmera system has a potentially reasonable supply reliability of 95% or better, under median climate change conditions, with a 5% to 10% probability of water restrictions in any year. However, it is forecast that restrictions would be severe and generally comprise Stage 4 or emergency supply.
The purchase of temporary water is an appropriate response if water shortages are likely to be infrequent and is only required in those years when water restrictions are likely to be greater than Stage 3. It is estimated that Stage 4 restrictions are likely in about one year in 100 years and require in the order of 10 ML to ensure Stage 3 restrictions.
Consideration would also be given to the purchase of permanent water to meet the shortfall in supply should water restrictions become more frequent than expected. Permanent water shares are subject to annual allocation and are therefore not guaranteed to be fully available every year. The volume of additional permanent water shares to be purchased by year 2060 is estimated to up to 320 ML, an amount more than the existing Bulk Entitlement.
The potential impacts of the Murray–Darling Basin Plan will become clearer over the next two to five years. The Plan will guide the management of water resources and aims to balance the water needs of the environment and other uses across the Basin’s four states and one territory. The draft Plan identifies 23 GL to be recovered for the Wimmera-Avoca River system and possibly more to contribute to the needs of the River Murray. Most aspects of the Plan will take effect in Victoria in 2019. Coliban Water’s Wimmera entitlement is only a small fraction, approximately 0.3%, of the total Wimmera system entitlement and we are therefore likely to continue to have access to the water market in all but the very worst scenarios. Water Supply Demand Strategies are next due for renewal in 2017 which will be the appropriate time to incorporate any required changes.
Further information regarding other possible alternative water supply considerations is available on Coliban Water’s website. Extracts from the Alternative Water Atlas relating to the Wimmera system are contained as Appendix.
Proposed Actions – Wimmera System The proposed strategy to address the shortfall in supply over the next 50 years:
Monitor the supply and demand closely;
Continue with the main replacement and leakage detection programs to minimise non-revenue water; and
Use the temporary and permanent water market to address possible water shortfalls.
Page 7 W I M M E R A S Y S T E M W S D S 2 0 1 1 T O 2 0 6 0
1. Introduction Coliban Region Water Corporation is a state owned water authority that provides water and wastewater services to a region with a population of 140,000 people, across 16,500 square kilometres of Central and Northern Victoria. The service area covers 49 towns in nine separate supply systems of which the Wimmera system is one.
The Water Supply Demand Strategy (WSDS) identifies the best mix of measures to maintain a balance between the demand for water and the available supply in urban supply systems, now and 50 years into the future. Coliban Water is required to consider the social, environmental and economic costs and benefits and the actions needed to address population growth, non-residential demand for water and potential climate variability.
The development of Water Supply Demand Strategies is a requirement of water corporation’s Statement of Obligations and are developed with close reference to the 2011 Guidelines for the Development of a Water Supply Demand Strategy (Version 2) issued by the Department of Sustainability and Environment. The supply-demand balance is tracked and reported on annually against the WSDSs and the WSDSs are thoroughly reviewed every five years.
The development of WSDSs relies on many assumptions and estimates (including water availability, climate change, customer demands and growth) and the resultant recommendations are thus a guide to probable future needs, projects, capital investment and timing. It is therefore important to continually track and review performance on a regular basis and to also implement more serious drought response measures if and when required.
Page 8 W I M M E R A S Y S T E M W S D S 2 0 1 1 T O 2 0 6 0
2. Overview 2.1. Key Features
Towns Supplied
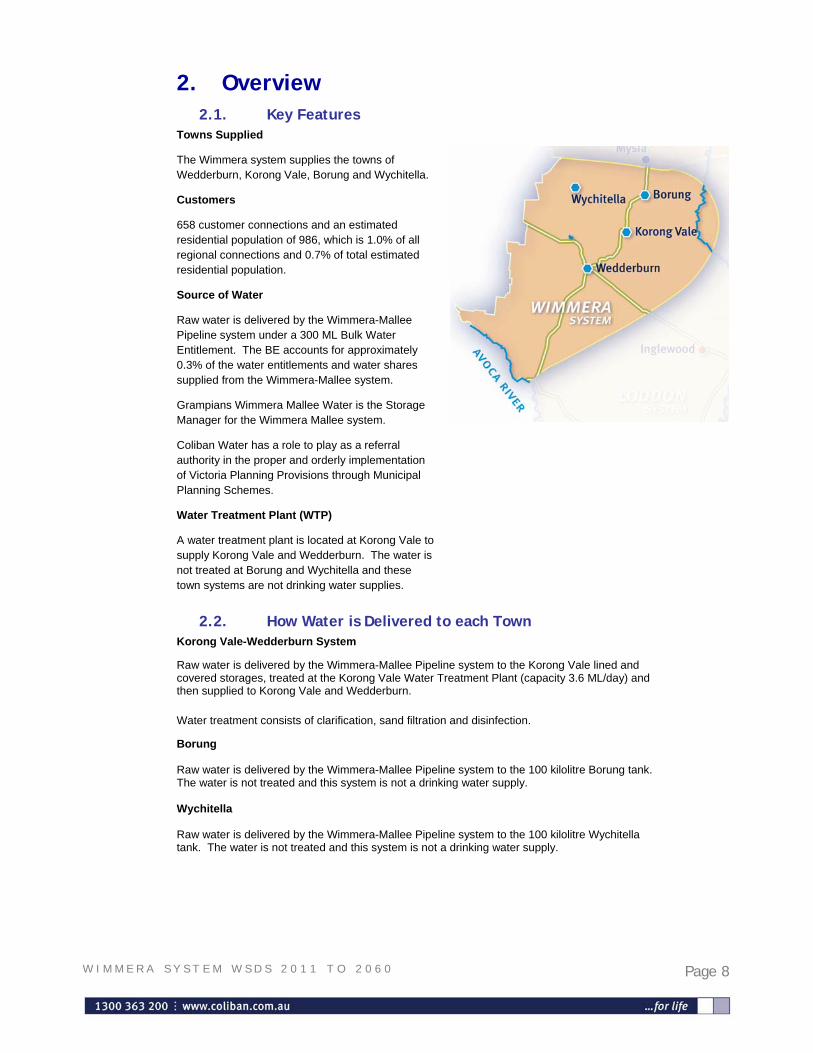
The Wimmera system supplies the towns of Wedderburn, Korong Vale, Borung and Wychitella.
Customers
658 customer connections and an estimated residential population of 986, which is 1.0% of all regional connections and 0.7% of total estimated residential population.
Source of Water
Raw water is delivered by the Wimmera-Mallee Pipeline system under a 300 ML Bulk Water Entitlement. The BE accounts for approximately 0.3% of the water entitlements and water shares supplied from the Wimmera-Mallee system.
Grampians Wimmera Mallee Water is the Storage Manager for the Wimmera Mallee system.
Coliban Water has a role to play as a referral authority in the proper and orderly implementation of Victoria Planning Provisions through Municipal Planning Schemes.
Water Treatment Plant (WTP)
A water treatment plant is located at Korong Vale to supply Korong Vale and Wedderburn. The water is not treated at Borung and Wychitella and these town systems are not drinking water supplies.
2.2. How Water is Delivered to each Town Korong Vale-Wedderburn System
Raw water is delivered by the Wimmera-Mallee Pipeline system to the Korong Vale lined and covered storages, treated at the Korong Vale Water Treatment Plant (capacity 3.6 ML/day) and then supplied to Korong Vale and Wedderburn.
Water treatment consists of clarification, sand filtration and disinfection.
Borung Raw water is delivered by the Wimmera-Mallee Pipeline system to the 100 kilolitre Borung tank. The water is not treated and this system is not a drinking water supply. Wychitella Raw water is delivered by the Wimmera-Mallee Pipeline system to the 100 kilolitre Wychitella tank. The water is not treated and this system is not a drinking water supply.

Page 9 W I M M E R A S Y S T E M W S D S 2 0 1 1 T O 2 0 6 0
2.3. Customer Profile Of the 658 customer connections, 89% are residential and 11% are non-residential.
The average annual residential consumption for the four years from 2007 to 2011 was 101 kL per property. This is lowest consumption rate of the region’s water supply systems and two-thirds of the regional average of 153 kL per property.
The average annual non-residential consumption for the four years from 2007 to 2011 was 220 kL per property. This is one-quarter of the regional average of 855 kL per non-residential property. The largest users are the Wedderburn swimming pool with annual consumption between 4 to 5 ML and the Wedderburn standpipe with annual consumption between 2 to 3 ML
Table 1 shows the residential population and number of water connections for each town in the Wimmera system.
Table 1: Wimmera system Population and Service Connections
Total
Connections
Residential
Connections
Non‐residential
Connections
Borung 46 22 19 3
Korong Vale 180 124 116 8
Wedderburn 739 499 438 61
Wychitella 21 13 12 1
Total Wimmera 986 658 585 73
Wimmera water Supply
System
Residential
Population 2011
Service Connections ‐ 2011
Page 10 W I M M E R A S Y S T E M W S D S 2 0 1 1 T O 2 0 6 0
3. Recent Experience 3.1. Water Supply
The Wimmera system has a Bulk Entitlement (BE) of 300 ML. There is no lower limit on the minimum allocation and it could theoretically be 0% (no supply) in 'very dry' years.
The Wimmera open earthen channel system that had supplied Coliban’s four Wimmera towns was replaced by the Wimmera-Mallee Pipeline system in mid-2010.
The 300 ML BE came into force in 2010/11 and replaced a 450 ML BE that was previously granted in June 2004. The revised bulk entitlement was part of amendments to the water sharing arrangements in the Wimmera-Glenelg water supply system that were formalised in 2010 to share the water savings from the new pipeline that included greater volumes of water to the environment and increased reliability for existing customers. The reduction in the bulk entitlement volume reflects the much reduced losses with the lined and covered storages and all-year-round supply from the Wimmera-Mallee Pipeline compared to the previous seasonal supply to open and unlined earthen storages where evaporation and seepage would occur.
The ability to carryover unused water from one year to the following year, to a maximum of 100% of the BE, was also introduced in 2010/11 together with spillable water accounts. This allowed 176 ML to be carried over to 2011/12 and has increased the capability to manage water security from year-to-year.
During 2009, the 489 ML capacity Korong Vale service basins were replaced with two lined and covered 2.2 ML sized basins (for a total of 4.4 ML) as part of the work to reduce water losses in the Wimmera system. Improvement works also included the replacement of open storage basins in Borung and Wychitella with 100 kilolitre tanks at each location. These works greatly improved system efficiency where previously more than half of the water in the open storages was lost to evaporation and seepage.
The new Wimmera-Mallee Pipeline system has improved the security of supply to the Wimmera towns with its continuous all-year-round supply. Our Bulk Entitlement has been standardised as Wimmera-Mallee Pipeline product. As such Coliban Water holds 300 ML of entitlement out of some 87,700 ML held by other water corporations and private users for supply to urban and irrigation uses as well as for the environment. Our holding is thus approximately 0.3% of the total entitlement.
Our townships are at the extremity of the Wimmera-Mallee Pipeline which presents some risk. Our Korong Vale / Wedderburn demand is sizeable in the relevant area of the pipeline system that otherwise predominantly supplies much smaller stock and domestic demands. The ability of the Wimmera-Mallee Pipeline system to deliver peak system demands is as yet unproven, although it operated satisfactorily over 2011/12, and negotiations are proceeding to obtain firm resolution with GWM Water that the new pipeline system will be able to meet our required peak delivery rates.
Average inflow to the Grampian system storages was 68,000 ML per year for the period from 1998 to 2010 which was only 24% of the historical average of 287,000 ML per year. The Grampian storages fell to the lowest level on record of 5% of capacity in April 2008 and again in April 2009. The low water availability resulted in allocations of less than 100% for five years from 2005/06 to 2010/11 with a minimum allocation of 63% in 2006/07.
In 2007 and 2009 the Wimmera system BEs were amended by Temporary Qualification of Rights (QoR) that confirmed there would be an allocation of water even while there were extreme low levels of water in storage.
3.2. Raw Water Demand
The system demand is the total amount of raw water taken from the Grampian-Wimmera system to meet customer consumption and operational water needs.
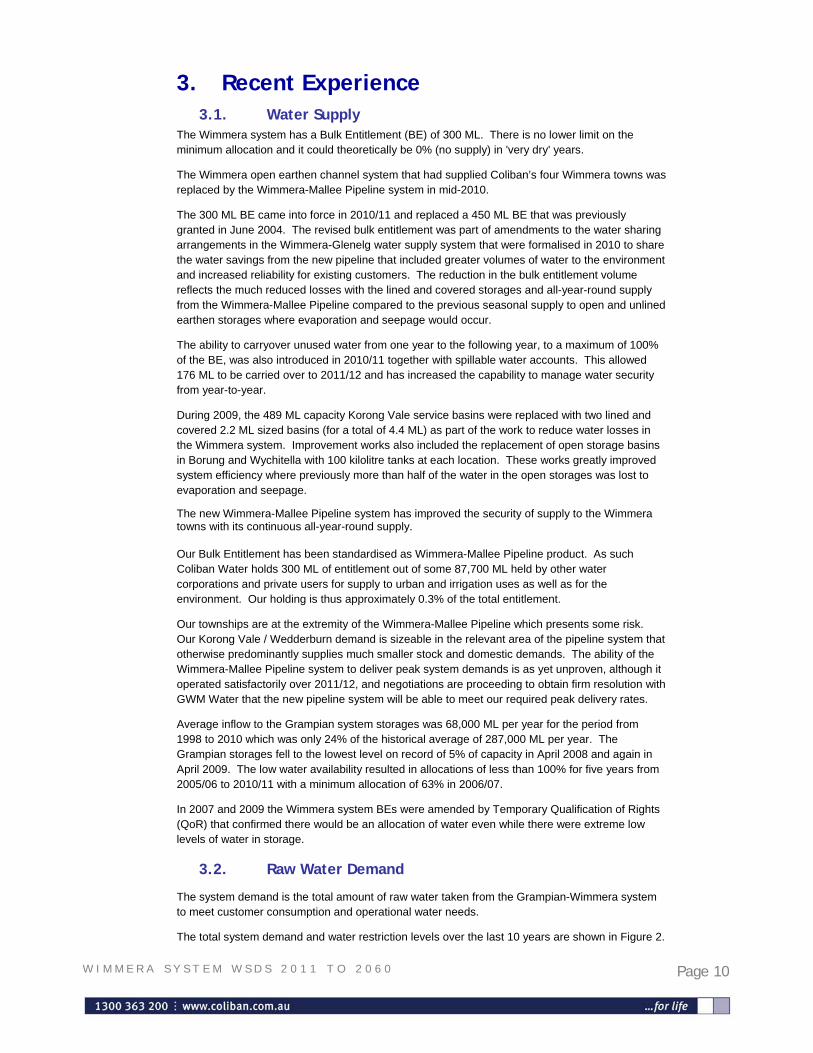
The total system demand and water restriction levels over the last 10 years are shown in Figure 2.
Page 11 W I M M E R A S Y S T E M W S D S 2 0 1 1 T O 2 0 6 0
‐1
0
1
2
3
4
5
60
100
200
300
400
500
600
Restriction Level
Annual Raw
Water Dem
and ‐megaliters
Wimmera System ‐ Annual System Demand
Raw Water Demand Restriction Level
Figure 2: Wimmera System Annual Demand and Water Restriction Levels 2000-2011
Water restrictions commenced in December 1999 and were continually in force for more than 11 years until January 2011 when Permanent Water Saving Rules were put in place. Severe levels of restriction of Stage 3 and Stage 4 were in force for more than 7 years from March 2003 to July 2010.
Annual water demands ranged from a maximum of 505 ML in 2004/05 (Stage 3) to a minimum of 124 ML in in 2010/11 (Stage 1 and PWSR). The low demand of 2010/11 was due to extremely high rainfall and the ongoing changes in customer consumption patterns of the last 10 years. Table 2 shows the components of system demand over the last eight years
Table 2: Components of Wimmera System Demand (with Korong Vale storages) Prior to the Abandonment of the Korong Vale Storages
Component Percentage (%)
Residential consumption 26%
Non-residential consumption 6%
Operational water (downstream of Korong Vale storages)
15%
Operational water (evaporation and seepage at Korong Vale storages)
53%
TOTAL 100%
Water restrictions and changes in customer consumption behaviour resulted in reductions in residential consumptions of up to 44% from a maximum demand of 108 ML in 2002/03 to a minimum of 60 ML in the three years from 2007/08 to 2009/10. Water restrictions had a mixed impact on the non-residential consumption; a high non-residential consumption was recorded in 2005/06 due most likely due to increased demand on the Wedderburn standpipe whereas demands in other years decreased by up to 50% from the peak of 24 ML in 2002/03.
The low demand of 2010/11 was due to extremely high rainfall, the replacement of the highly inefficient open service basins and also due to the contribution made by customers to reduce water consumption.
The water required for operational needs and water lost is known as operational water. Operational water includes evaporation, the water required to backwash and to clean the water treatment plant filters. Water losses can be losses incurred through leakage, evaporation in service basins and pipeline bursts or from the use of fire hydrants and the flushing of mains to maintain general pipeline health.
Operational water has formed a significant proportion of the total raw water requirements of the Wimmera system and generally accounted for two-thirds or 68% of the total system raw water demand. Most of the operational water was lost at the open Korong Vale storages through evaporation and seepage.
Page 12 W I M M E R A S Y S T E M W S D S 2 0 1 1 T O 2 0 6 0
Table 3 shows the estimated system demand following the abandonment of the Korong Vale storages.
Table 3: Components of the Wimmera System Demand (without Korong Vale storages)
Component Percentage (%)
Residential consumption 55%
Non-residential consumption 13%
Non-revenue water 32%
TOTAL 100%
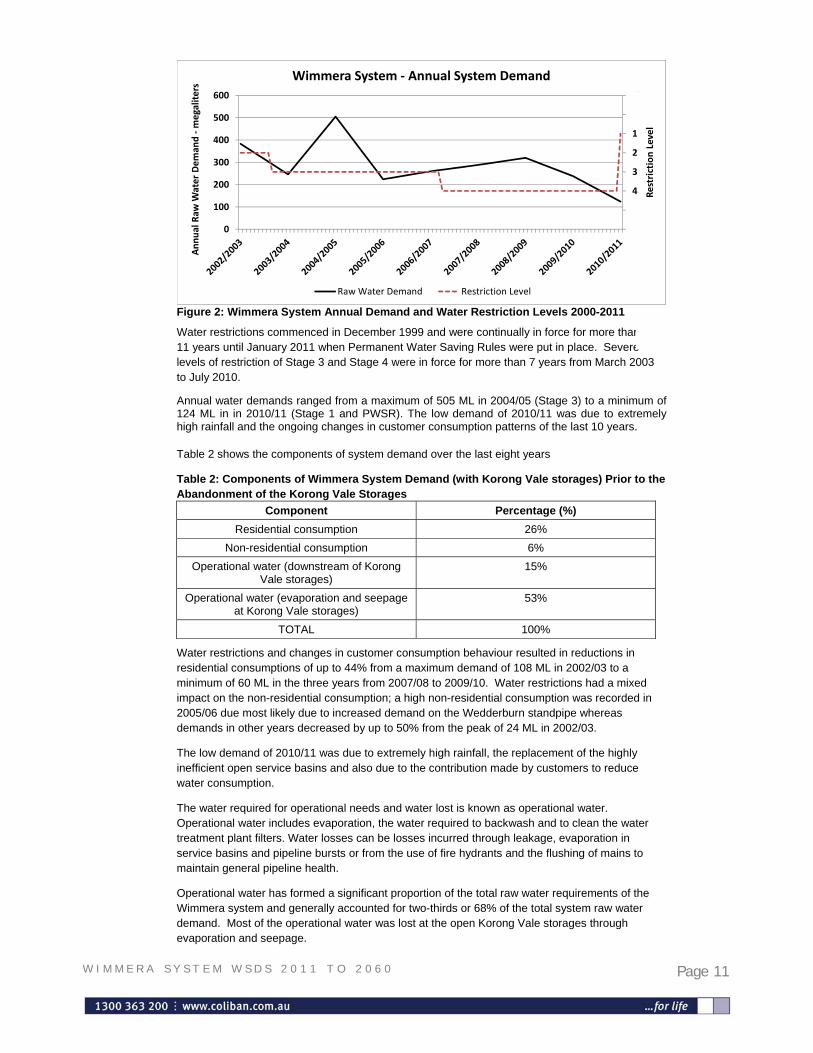
The current town demands are shown in Figure 3.
78%
18%
2% 2%
Wedderburn Korong Vale Borung Wychitella
Wimmera System ‐ towns' proportion of system Demand
Figure 3: Town raw water demand as a proportion of total system demand
3.3. Water Quality A water treatment plant is located at Korong Vale to supply Korong Vale and Wedderburn. The supply to Borung and Wychitella is not treated and the supply is not a drinking water supply.
The treated water complies with the water quality standards specified in the Safe Drinking Water Act 2003.
3.4. Waterplan 2055 Review A review five years on of Coliban Water’s last Water Supply Demand Strategy, Waterplan 2055, is available from Coliban Water’s website. It outlines our progress against the measures which were detailed in the Waterplan 2055 to ensure long-term water security for our region.
In the context of the long-term climate variability challenge, the review summaries our progress with each of the Waterplan 2055 initiatives under the following categories:
Urban Savings
Rural Savings
Recycled Water use
Sourcing Additional supply
Other Projects
Page 13 W I M M E R A S Y S T E M W S D S 2 0 1 1 T O 2 0 6 0
4. Levels of Service Coliban Water is committed to providing the systems and infrastructure to support residential, business and industry needs throughout our region.
With the major investments made in supply infrastructure in central Victoria through the recent Millennium Drought of 2002 to 2010, significant additional works are not anticipated to be required in the Coliban Water region over the next 5-10 years to maintain the objective for water security levels of service.
However growth combined with weather variability and the potential for changes to our future climate may result in water shortages or drought and therefore the need for water restrictions.
The Level of Service we aim to provide to customers has two components:
1. Reliability of Supply
Coliban Water’s objective is to provide sufficient water to meet customer demands of ‘Permanent Water Saving Rules’ (PWSR) at 95% supply reliability. This means that PWSR would be in place 95 years out of every 100 years and water restrictions should not occur more often than the remaining 5 years out of every 100 years.
2. Maximum Restriction level (minimum water provision)
Coliban Water’s objective is that in those years where restrictions are necessary, we would try to keep restrictions to no worse than Stage 1. However in the event of severe or unexpected water shortages, restrictions may need to be more severe, such as Stage 3. Under the Victorian Government’s 2011 Model Water Restriction Review, Stage 1 restrictions is, in the language of the review document, intended to provide an “alert” of an impending possible shortage and Stage 3 Restrictions would mean that “just enough” water is provided for use. Stage 3 restrictions includes no watering of lawn areas however garden areas may be watered within restricted hours on alternate days. Full details are available from the www.water.vic.gov.au website.
For the purposes of this analysis and reporting, the additional water needs (or supply shortfall) generally relates the additional water required to either achieve the target reliability of supply at PWSR and/or to enable restriction levels to be no worse than Stage 3. Even then these restrictions levels would only be expected a few years out of every hundred years.
Under particularly severe or highly unexpected water shortage conditions, the Drought Response Plan would be triggered which could include emergency water supply measures and harsher restrictions.
Occasionally, restrictions may also be required as a short-term management measure to deal with operational emergencies and incidents.
Page 14 W I M M E R A S Y S T E M W S D S 2 0 1 1 T O 2 0 6 0
5. Climate Change / Variability Scenarios Central Victoria has a highly variable climate and there is no 'most likely' or 'most probable' future climate scenario.
CSIRO modelling indicates that the extent and nature of climate change is unknown, so our water resource planning is built around a range of potential climate changes and potential water supply and demand futures.
Based on DSE Guidelines and using CSIRO modelling, the WSDS considers five potential climate futures each with varying changes to temperature, rainfall and inflow to rivers and catchment storages. The five climate scenarios are:
Scenario 1: Baseline climate.
This scenario is based on a continuation of the historical climate, including rainfall and inflows, of the past 120 years from 1891 to 2010.
Scenarios 2, 3 & 4: Change in future climate.
This scenario set is based on a gradual increase in temperature of one degree (+1oC) by approximately 2030 and two degree (+2oC) by approximately 2060.
The three scenarios under this set consider declining rainfall and inflow as a consequence of the increasing temperature being:
Scenario 2: Wet (mild decline in rainfall and inflow); Scenario 3: Median (moderate decline in rainfall and inflow) and, Scenario 4: Dry (larger decline in rainfall and inflow).
Scenario 5: Return to dry weather.
This scenario is based on a return of the dry weather of 1997 to 2009. This scenario results in a greater and immediate reduction to available supply as well as an immediate increase in the demand for water.
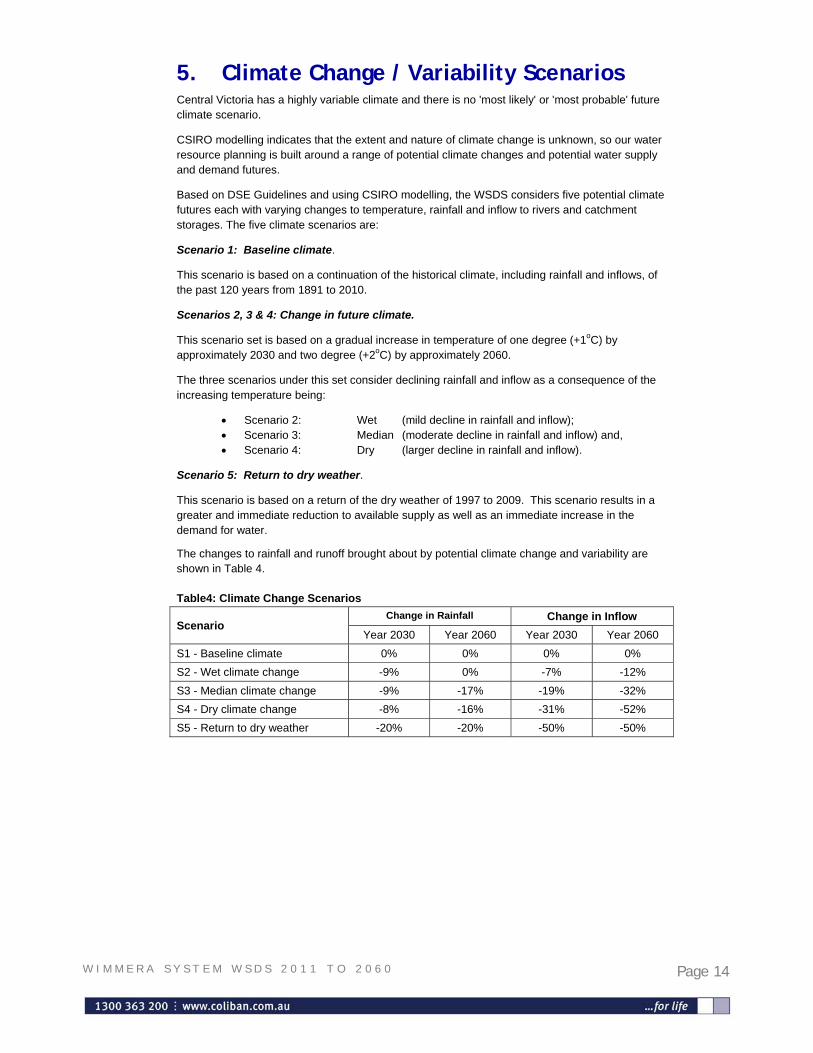
The changes to rainfall and runoff brought about by potential climate change and variability are shown in Table 4. Table4: Climate Change Scenarios
Scenario Change in Rainfall Change in Inflow
Year 2030 Year 2060 Year 2030 Year 2060
S1 - Baseline climate 0% 0% 0% 0%
S2 - Wet climate change -9% 0% -7% -12%
S3 - Median climate change -9% -17% -19% -32%
S4 - Dry climate change -8% -16% -31% -52%
S5 - Return to dry weather -20% -20% -50% -50%
Page 15 W I M M E R A S Y S T E M W S D S 2 0 1 1 T O 2 0 6 0
6. Demand Forecast 6.1. Current System Demand - Baseline Demand
The baseline Wimmera system demand for each level of water restriction is based on a detailed analysis of the last 12 years of raw water use and customer consumption.
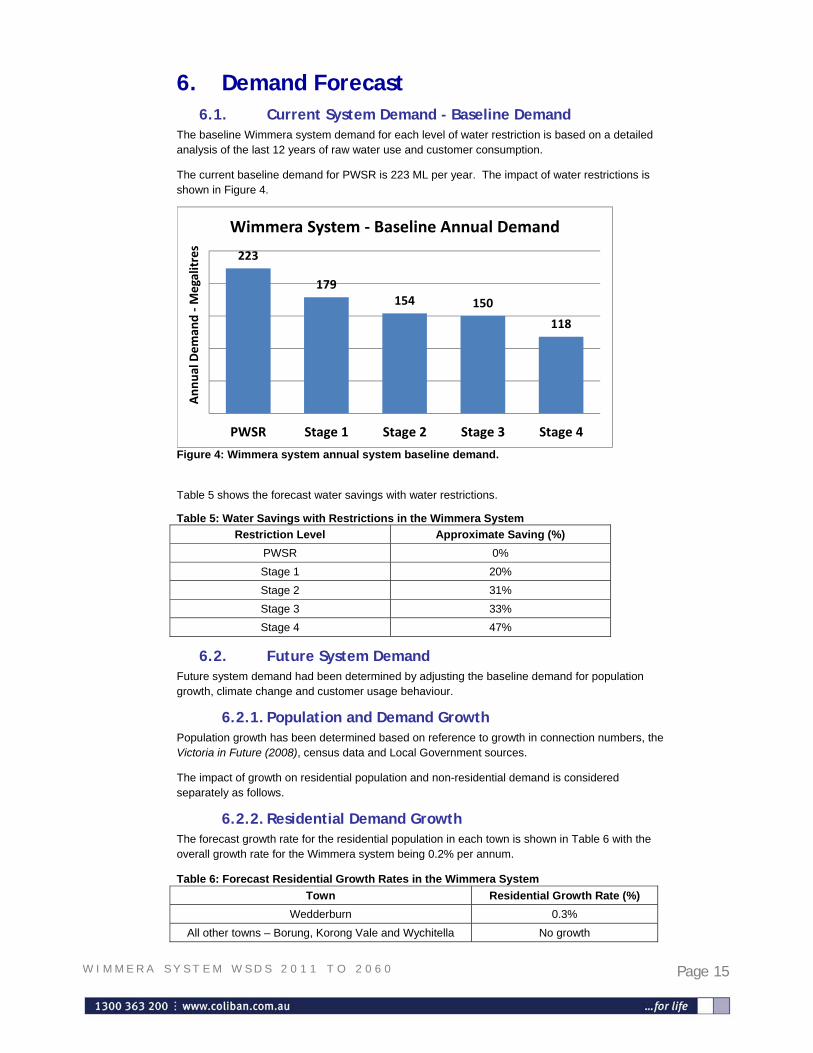
The current baseline demand for PWSR is 223 ML per year. The impact of water restrictions is shown in Figure 4.
223
179154 150
118
PWSR Stage 1 Stage 2 Stage 3 Stage 4
Annual Deman
d ‐Megalitres
Wimmera System ‐ Baseline Annual Demand
Figure 4: Wimmera system annual system baseline demand. Table 5 shows the forecast water savings with water restrictions.
Table 5: Water Savings with Restrictions in the Wimmera System
Restriction Level Approximate Saving (%)
PWSR 0%
Stage 1 20%
Stage 2 31%
Stage 3 33%
Stage 4 47%
6.2. Future System Demand Future system demand had been determined by adjusting the baseline demand for population growth, climate change and customer usage behaviour.
6.2.1. Population and Demand Growth Population growth has been determined based on reference to growth in connection numbers, the Victoria in Future (2008), census data and Local Government sources.
The impact of growth on residential population and non-residential demand is considered separately as follows.
6.2.2. Residential Demand Growth The forecast growth rate for the residential population in each town is shown in Table 6 with the overall growth rate for the Wimmera system being 0.2% per annum.
Table 6: Forecast Residential Growth Rates in the Wimmera System
Town Residential Growth Rate (%)
Wedderburn 0.3%
All other towns – Borung, Korong Vale and Wychitella No growth

Page 16 W I M M E R A S Y S T E M W S D S 2 0 1 1 T O 2 0 6 0
6.2.3. Non-Residential Demand Growth The forecast commercial growth rate is 0.2% per annum. Industrial-manufacturing and other non-residential sectors are forecast not to grow in the future.
Overall, approximately 13% of the Wimmera system demand is non-residential demand. Table 7 shows the classification of non-residential customers.
Table 7: Classification of Non-residential Customers in the Wimmera System
Non-Residential Sector Portion (%)
Manufacturing / industrial, agriculture, forestry and mining
5%
Commercial 95%
TOTAL 100%
6.2.4. Total Growth in Residential and Non-residential Demand The growth in residential population combined with the growth in non-residential demand is forecast to increase the demand for raw water by 0.2% per annum.
This will mean a 4% increase in demand by 2030 and a 12% increase by 2060.
Table 8 shows the projected growth rates for the various customer sectors and the overall growth in demand over the next 50 years.
Table 8: Wimmera System and town growth
Residential
Agriculture, Forestry,
Fishing & M
ining &
Manufacturing
Commercial
Total G
rowth Rate (%
p.a.)
2030 2060
Borung 0.0% 0.0% 0.0% 0.0% 0% 0%
Korong Vale 0.0% 0.0% 0.0% 0.0% 0% 0%
Wedderburn 0.3% 0.0% 0.3% 0.3% 6% 16%
Wychitella 0.0% 0.0% 0.0% 0.0% 0% 0%
Total Wimmera 0.2% 0.0% 0.2% 0.2% 4% 12%
Wimmera Water
Supply System
Adopted Growth Rate (% p.a.) Growth in Demand
6.2.5. Environmental Demand There are no environmental water obligations with Coliban Water's Wimmera Bulk Entitlement.
6.2.6. Climate Change The analysis of the last 12 years of raw water data showed that demand increased with drier weather. Demands at year 2030 are forecast to increase with the reduced rainfall associated with climate change as shown in Table 9.
Table 9: Impact of Climate Change on Rainfall and PWSR Demands
Scenario Rainfall Decrease PWSR Demand Increase
S3 - Median climate change -9% 4%
S4 - Dry climate change -8% 3%
S5 - Return to Dry -20% 9%
Table 10 shows the projected demands over the next 20 to 50 years as impacted by climate change.
Page 17 W I M M E R A S Y S T E M W S D S 2 0 1 1 T O 2 0 6 0
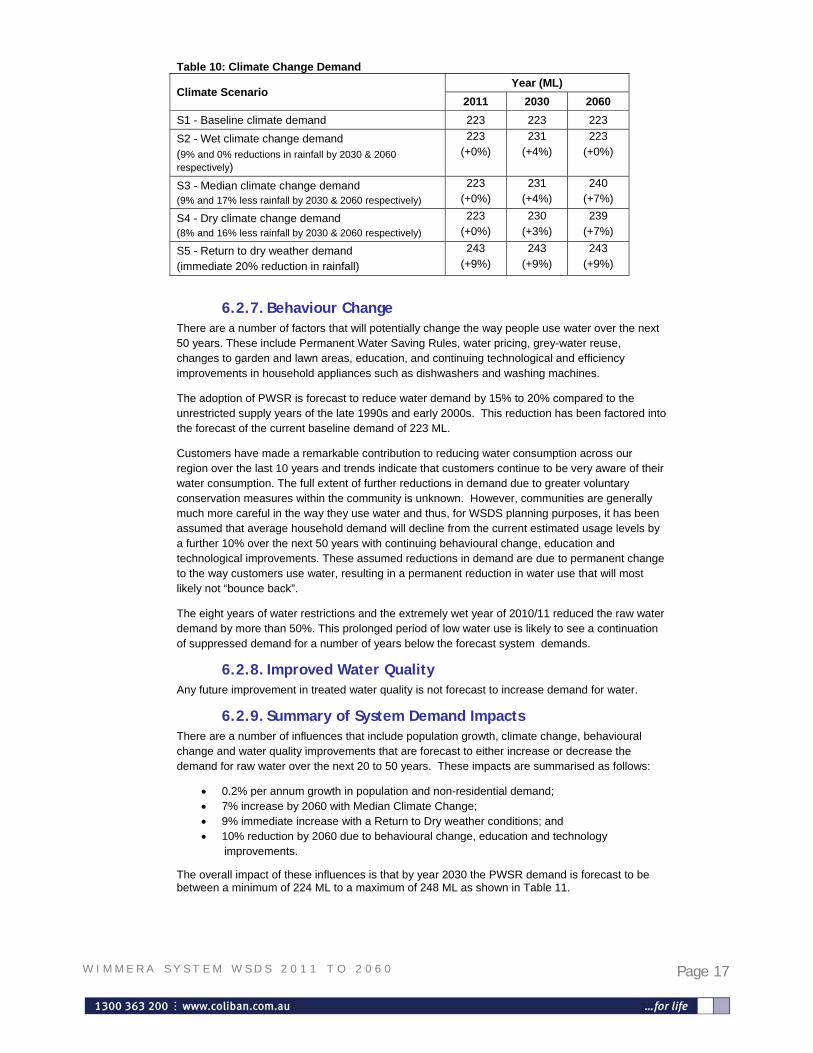
Table 10: Climate Change Demand
Climate Scenario Year (ML)
2011 2030 2060
S1 - Baseline climate demand 223 223 223
S2 - Wet climate change demand (9% and 0% reductions in rainfall by 2030 & 2060 respectively)
223 (+0%)
231 (+4%)
223 (+0%)
S3 - Median climate change demand (9% and 17% less rainfall by 2030 & 2060 respectively)
223 (+0%)
231 (+4%)
240 (+7%)
S4 - Dry climate change demand (8% and 16% less rainfall by 2030 & 2060 respectively)
223 (+0%)
230 (+3%)
239 (+7%)
S5 - Return to dry weather demand (immediate 20% reduction in rainfall)
243 (+9%)
243 (+9%)
243 (+9%)
6.2.7. Behaviour Change There are a number of factors that will potentially change the way people use water over the next 50 years. These include Permanent Water Saving Rules, water pricing, grey-water reuse, changes to garden and lawn areas, education, and continuing technological and efficiency improvements in household appliances such as dishwashers and washing machines.
The adoption of PWSR is forecast to reduce water demand by 15% to 20% compared to the unrestricted supply years of the late 1990s and early 2000s. This reduction has been factored into the forecast of the current baseline demand of 223 ML.
Customers have made a remarkable contribution to reducing water consumption across our region over the last 10 years and trends indicate that customers continue to be very aware of their water consumption. The full extent of further reductions in demand due to greater voluntary conservation measures within the community is unknown. However, communities are generally much more careful in the way they use water and thus, for WSDS planning purposes, it has been assumed that average household demand will decline from the current estimated usage levels by a further 10% over the next 50 years with continuing behavioural change, education and technological improvements. These assumed reductions in demand are due to permanent change to the way customers use water, resulting in a permanent reduction in water use that will most likely not “bounce back”.
The eight years of water restrictions and the extremely wet year of 2010/11 reduced the raw water demand by more than 50%. This prolonged period of low water use is likely to see a continuation of suppressed demand for a number of years below the forecast system demands.
6.2.8. Improved Water Quality Any future improvement in treated water quality is not forecast to increase demand for water.
6.2.9. Summary of System Demand Impacts There are a number of influences that include population growth, climate change, behavioural change and water quality improvements that are forecast to either increase or decrease the demand for raw water over the next 20 to 50 years. These impacts are summarised as follows:
0.2% per annum growth in population and non-residential demand; 7% increase by 2060 with Median Climate Change; 9% immediate increase with a Return to Dry weather conditions; and 10% reduction by 2060 due to behavioural change, education and technology
improvements.
The overall impact of these influences is that by year 2030 the PWSR demand is forecast to be between a minimum of 224 ML to a maximum of 248 ML as shown in Table 11.
Page 18 W I M M E R A S Y S T E M W S D S 2 0 1 1 T O 2 0 6 0
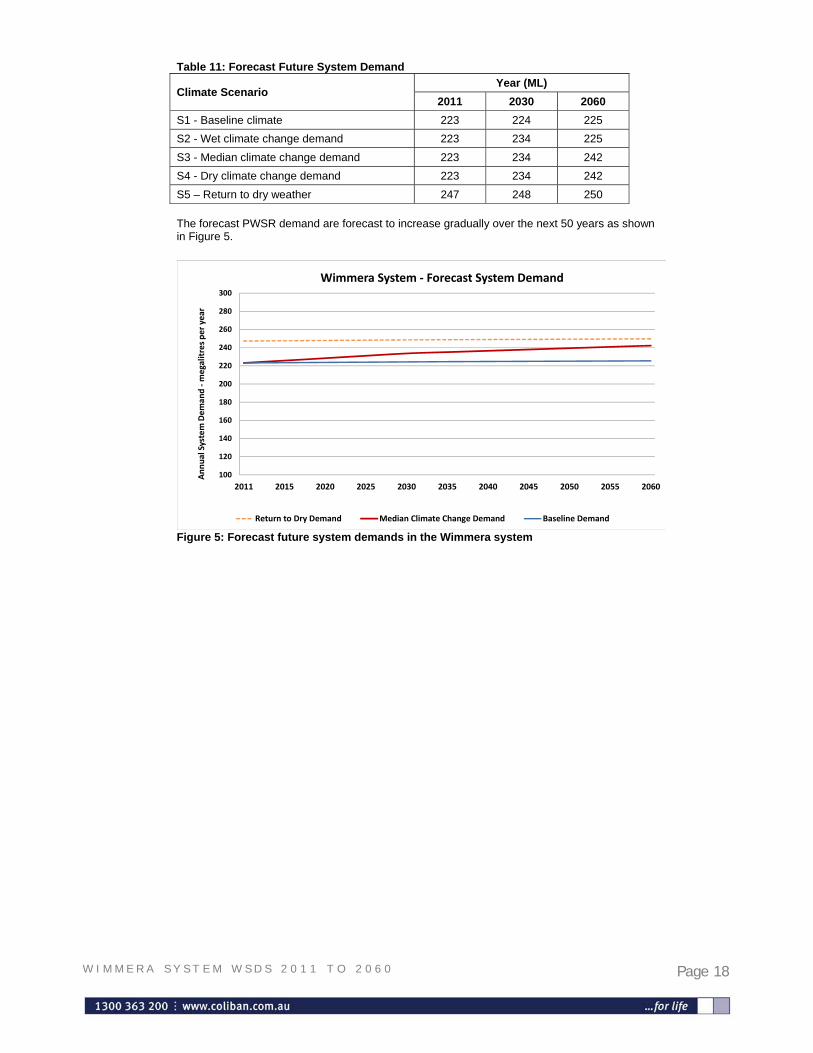
Table 11: Forecast Future System Demand
Climate Scenario Year (ML)
2011 2030 2060
S1 - Baseline climate 223 224 225
S2 - Wet climate change demand 223 234 225
S3 - Median climate change demand 223 234 242
S4 - Dry climate change demand 223 234 242
S5 – Return to dry weather 247 248 250
The forecast PWSR demand are forecast to increase gradually over the next 50 years as shown in Figure 5.
100
120
140
160
180
200
220
240
260
280
300
2011 2015 2020 2025 2030 2035 2040 2045 2050 2055 2060
Annual System Demand ‐megalitres per year
Wimmera System ‐ Forecast System Demand
Return to Dry Demand Median Climate Change Demand Baseline Demand
Figure 5: Forecast future system demands in the Wimmera system
Page 19 W I M M E R A S Y S T E M W S D S 2 0 1 1 T O 2 0 6 0
7. Supply Forecast The forecast supply is the average annual available supply (or amount of water) that is sustainably available each and every year whilst meeting target levels of service.
Computer modelling has been used to forecast the available supply.
Modelling, undertaken by the CSIRO and provided as part of the DSE WSDS Guidelines, forecasts the impact of the various potential climate scenarios on catchment run-off and the inflow to storages. The forecast impacts on inflow are shown in Table 4.
Declining inflows reduce the water available to water entitlement holders. REALM modelling, undertaken by GHD, has forecast how declining inflows impact on water availability, in terms of annual water allocations.
In-house modelling has then been used to analyse the forecast annual allocations and to determine how they specifically meet the current and forecast system water demands. The analysis determines for the climate scenarios (baseline, median climate change and return to dry) the:
Supply Reliability Frequency of water restrictions Severity of water restrictions; and
Additional water needs to meet the target Levels of Service (both additional temporary water and permanent water needs)
Modelling also allows for the analysis of the sensitivity of a number of variables to determine what factors have the greatest impacts the supply-demand balance. Variables and their current values (shown in brackets) include:
Maximum allocation (100% or 300 ML)
Minimum allocation (0% or nil ML) Carryover limits (100% or 300 ML)
Carryover loss (15% of the carryover volume) System Demand (223 ML increasing to 250 at year 2060) Growth (0.2% per annum) Behavioural change in consumption patterns (10% reduction in demand over 50 years)
Level of Service (95% supply reliability with water restrictions no more severe than Stage 3)
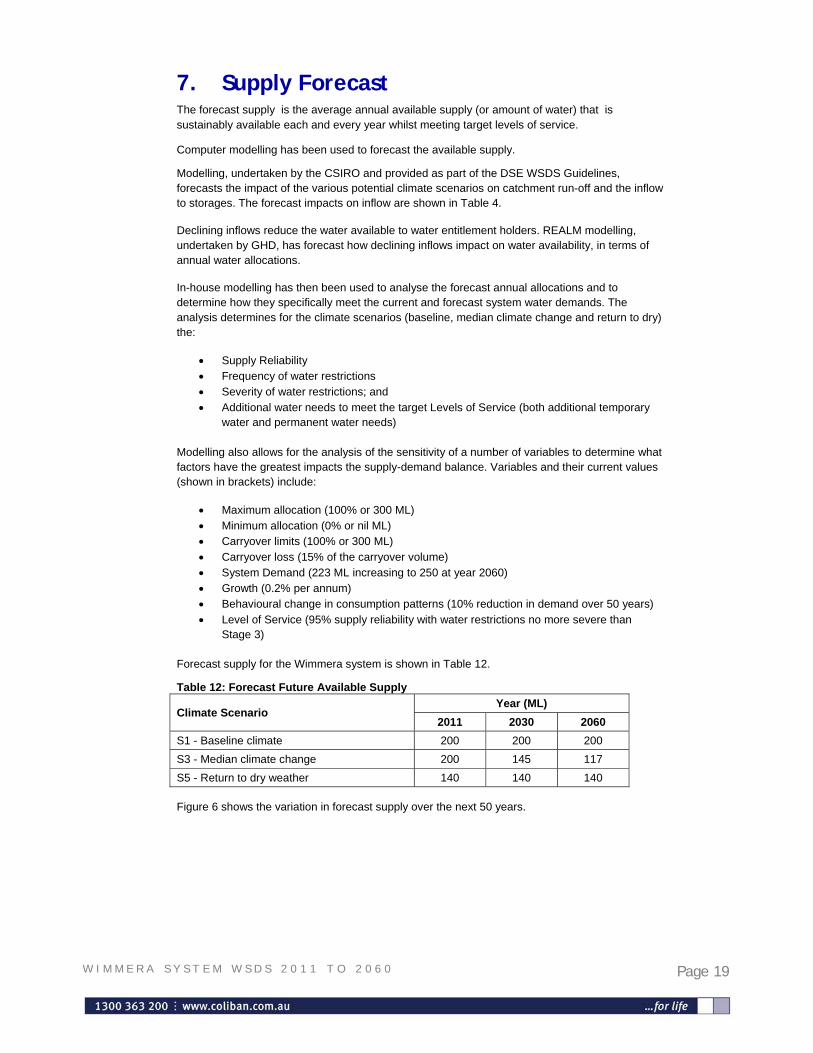
Forecast supply for the Wimmera system is shown in Table 12.
Table 12: Forecast Future Available Supply
Climate Scenario Year (ML)
2011 2030 2060
S1 - Baseline climate 200 200 200 S3 - Median climate change 200 145 117 S5 - Return to dry weather 140 140 140 Figure 6 shows the variation in forecast supply over the next 50 years.

Page 20 W I M M E R A S Y S T E M W S D S 2 0 1 1 T O 2 0 6 0
100
120
140
160
180
200
220
240
2011 2015 202 0 2025 203 0 203 5 204 0 2045 205 0 205 5 2060
Available Supply ‐megalitres per year
Wimmera System ‐ Forecast Supply
Climate Change Supply Return to Dry Supply Baseline Climate Supply
FORECAST AVAILABLE SUPPLY
RETURN TO DRY SUPPLY
BASELINE CLIMATE SUPPLY
Figure 6: Forecast Available Supply in the Wimmera system
The decline in available supply over the next 50 years is due to the potential drier climate with the occurrence of extreme low allocations. There is currently no cap on the minimum annual allocation but the introduction of a 50% minimum allocation would increase the forecast available supply to 220 ML to 225 ML that would remain relatively constant over the next 50 years. A 50% minimum allocation would result in minimal supply shortfalls.
Page 21 W I M M E R A S Y S T E M W S D S 2 0 1 1 T O 2 0 6 0
8. System Performance Evaluation The performance of the Wimmera system is measured on its ability to supply future demand and the target levels of service.
The performance measures that are evaluated are:
supply reliability with a target of at least 95% whereby the likelihood of water restrictions is no more than 5 years in 100 years; and
water restriction levels with a target of no worse than Stage 3
By comparing the forecast supply and demand it is possible to estimate any shortfall in supply and when this may occur.
The Wimmera system is forecast to have a supply shortfall into the foreseeable future. The WSDS is reviewed every 5-years to take into account changes in climate or population growth that may pose a risk to meeting demand.
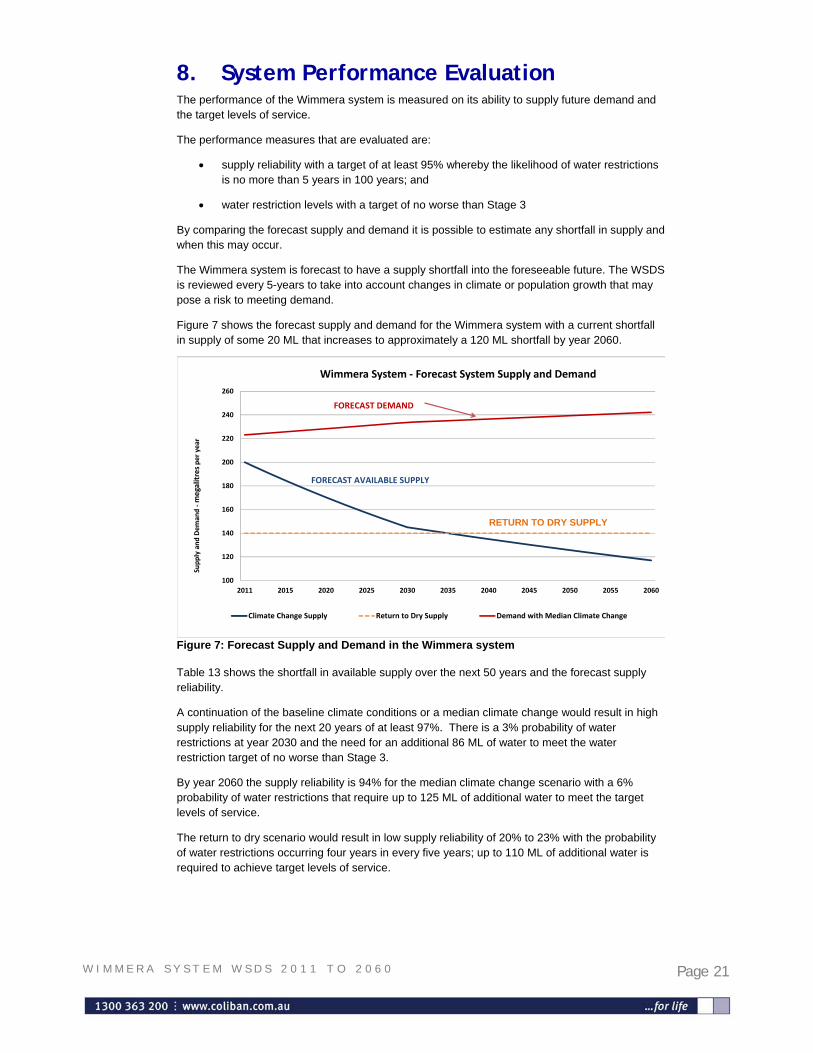
Figure 7 shows the forecast supply and demand for the Wimmera system with a current shortfall in supply of some 20 ML that increases to approximately a 120 ML shortfall by year 2060.
100
120
140
160
180
200
220
240
260
2011 2015 2020 2025 2030 2035 2040 2045 2050 2055 2060
Supply and Dem
and ‐megalitresper year
Wimmera System ‐ Forecast System Supply and Demand
Climate Change Supply Return to Dry Supply Demand with Median Climate Change
FORECAST DEMAND
FORECAST AVAILABLE SUPPLY
RETURN TO DRY SUPPLY
Figure 7: Forecast Supply and Demand in the Wimmera system Table 13 shows the shortfall in available supply over the next 50 years and the forecast supply reliability.
A continuation of the baseline climate conditions or a median climate change would result in high supply reliability for the next 20 years of at least 97%. There is a 3% probability of water restrictions at year 2030 and the need for an additional 86 ML of water to meet the water restriction target of no worse than Stage 3.
By year 2060 the supply reliability is 94% for the median climate change scenario with a 6% probability of water restrictions that require up to 125 ML of additional water to meet the target levels of service.
The return to dry scenario would result in low supply reliability of 20% to 23% with the probability of water restrictions occurring four years in every five years; up to 110 ML of additional water is required to achieve target levels of service.
Page 22 W I M M E R A S Y S T E M W S D S 2 0 1 1 T O 2 0 6 0
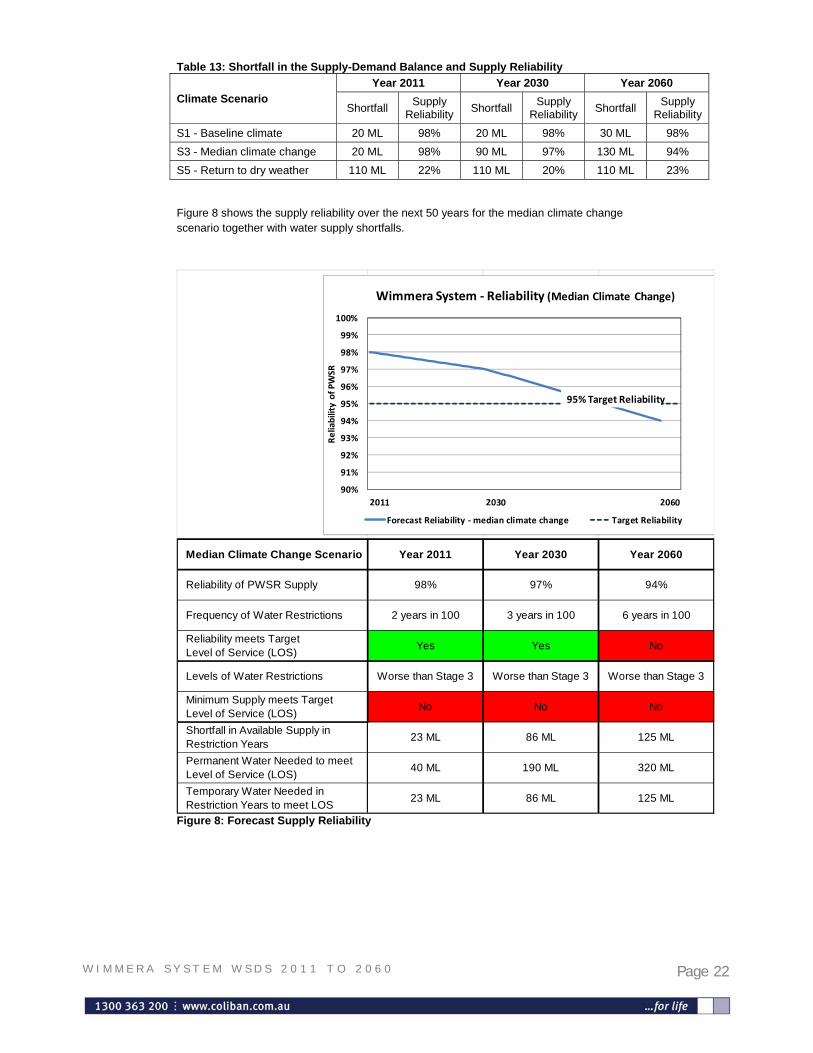
Table 13: Shortfall in the Supply-Demand Balance and Supply Reliability
Climate Scenario
Year 2011 Year 2030 Year 2060
Shortfall Supply
Reliability Shortfall
Supply Reliability
Shortfall Supply
Reliability
S1 - Baseline climate 20 ML 98% 20 ML 98% 30 ML 98%
S3 - Median climate change 20 ML 98% 90 ML 97% 130 ML 94%
S5 - Return to dry weather 110 ML 22% 110 ML 20% 110 ML 23%
Figure 8 shows the supply reliability over the next 50 years for the median climate change scenario together with water supply shortfalls.
Median Climate Change Scenario Year 2011 Year 2030 Year 2060
Reliability of PWSR Supply 98% 97% 94%
Frequency of Water Restrictions 2 years in 100 3 years in 100 6 years in 100
Reliability meets Target Level of Service (LOS)
Yes Yes No
Levels of Water Restrictions Worse than Stage 3 Worse than Stage 3 Worse than Stage 3
Minimum Supply meets Target Level of Service (LOS)
No No No
Shortfall in Available Supply in Restriction Years
23 ML 86 ML 125 ML
Permanent Water Needed to meet Level of Service (LOS)
40 ML 190 ML 320 ML
Temporary Water Needed in Restriction Years to meet LOS
23 ML 86 ML 125 ML
90%
91%
92%
93%
94%
95%
96%
97%
98%
99%
100%
Reliability of PWSR
Wimmera System ‐ Reliability (Median Climate Change)
Forecast Reliability ‐ median climate change Target Reliability
95% Target Reliability
Figure 8: Forecast Supply Reliability
Page 23 W I M M E R A S Y S T E M W S D S 2 0 1 1 T O 2 0 6 0
9. Demand Reduction Measures Coliban Water will continue to work with the community and pursue efficiency measures within the Wimmera system to achieve demand reduction which can be permanent or temporary in nature. Demand reduction measures that and provide on-going and continuous improvement to water reliability are described below.
9.1. Permanent Water Saving Rules (PWSR) PWSR were introduced by the Victorian Government in March 2005 and came into force in the Wimmera system in January 2011 following the lifting of water restrictions. The rules are designed to have customers permanently conserve water by requiring them to adopt some basic common sense water conservation measures.
It is expected that PWSR will reduce 'unrestricted' demand, as experienced in the late 1990s, by 15% to 20%. An allowance of approximately 15% was factored into the assessment of the future Wimmera system demand. The extent of actual water savings attributable to PWSR will be better understood with the evaluation of demand over the next four to five years.
9.2. Reduction of Operational Water Up until 2009, operational water accounted for more than two-thirds of all the raw water taken from the Wimmera-Grampians-Mallee system. Most of this water was lost through evaporation and seepage at the open 489 ML capacity Korong Vale storages and amounted to between 50 to 330 ML per year.
During 2009, the Korong Vale service basins as well as the open storage basins in Borung and Wychitella were replaced with much smaller closed storages. It is estimated that these works reduced operational water by as much as 250 ML in a single year. Operational water is now estimated to amount to approximately 70 ML per year and includes the water required to operate the Korong Vale water treatment plant process and losses within the water distribution systems.
To address water distribution losses, Coliban Water will continue its leakage reduction and water main replacement programs to replace old mains that are susceptible to or experiencing bursts and leaks.
This program will ensure that operational water does not increase with the potential for marginal reductions in water losses of up to 5 ML by year 2030.
9.3. Water Saving Incentives and Community Education A number of water saving incentives and education programs have been in place during the last five years to achieve permanent behavioural change in community water consumption.
Incentives and scheme have included the fitting of efficient water fixtures, such as low-flow shower roses and taps, in new dwellings and the ‘water-efficiency’ labelling of water using appliances such as washing machines.
Other schemes have provided rebates for households and organisations involved in ‘water smart’ programs such as the retro fitting of existing dwellings and the maintenance of efficient garden irrigation systems.
These programs and other options such as grey-water re-use, installation of rain water tanks, continued improvement in the efficiency of appliances and fixtures are expected to continue to change the behaviour and volumes of community water consumption.
A 10% reduction in demand, spread over the next 50 years, has been assumed in the water demand projections for these continued water efficiency savings.
Page 24 W I M M E R A S Y S T E M W S D S 2 0 1 1 T O 2 0 6 0
9.4. Pricing Incentives Increases in the customer's water price can have an influence on reducing consumption. Price increases implemented over the last ten years may haveinfluenced customer behaviour and thereby reduced overall demand. Similarly, any future price increases could be expected to further reduce demand. Any demand reductions that do occur are considered to be included as part of the 10% reduction in demand as outlined in the above Water Saving Incentives and Community Education programs.
9.5. Summary of Demand Reduction Measures Demand reduction measures that have not been considered elsewhere are estimated to save up to an additional 5 ML with the continued system efficiency improvements to reduce operational water.

Page 25 W I M M E R A S Y S T E M W S D S 2 0 1 1 T O 2 0 6 0
10. Additional Supply Measures 10.1. Permanent Water Market
The water market can be used to purchase permanent water entitlement to meet the supply shortfall.
Permanent water entitlement is subject to annual allocation and is therefore not guaranteed to be fully available every year. The volume of permanent water entitlement to be purchased approximates to be about twice the volume of the supply shortfall in order to ensure that there is sufficient available water in most years.
Table 14 shows the amount of permanent water required to ensure the target levels of service of 95% supply reliability and a minimum level of service of Stage 3 water restrictions are achieved.
Table 14: Permanent Water Needs to achieve Target Levels of Service
Climate Scenario Year 2011 Year 2030 Year 2060
S1 - Baseline climate 25 ML 1 ML 0 ML
S3 - Median climate change 25 ML 30 ML 30 ML
S5 - Return to dry weather 0 ML 70 ML 300 ML
The supply reliability of greater than 96% for the baseline climate and median climate change scenarios means that at worst the permanent water is only required in 4 years in 100 years; in all other years the permanent water is unused and in effect it would be spilt and lost. This option would therefore be an inefficient use of water resources and not cost effective.
10.2. Temporary Water Market The purchase of temporary water is an appropriate response if water shortages are likely to be infrequent.
The Wimmera system has a forecast supply reliability of 97%, under median climate change conditions, with water restrictions in three years out of 100 years. However, even though water restrictions are estimated to be infrequent they could be severe requiring Stage 4 or worse. The purchase of temporary water is only required in those years when water restrictions are likely to be greater than Stage 3. It is estimated that Stage 4 restrictions are likely in about two years in 100 years and would require about 90 ML to ensure Stage 3 restrictions.
A major drawback is the potential lack of availability of temporary water in times of severe water shortages; however, there is very little risk of not acquiring the small volume involved from the market.
Table 15 shows the amount of temporary water required to ensure the target levels of service of 95% supply reliability and a minimum level of service of Stage 3 water restrictions are achieved.
Table 15: Temporary Water needs to achieve Target Levels of Service
Climate Scenario Year 2011 Year 2030 Year 2060
S1 - Baseline climate 23 ML 24 ML 25 ML
S3 - Median climate change 23 ML 89 ML 125 ML
S5 - Return to dry weather 107 ML 108 ML 110 ML
The supply reliability of greater than 96% for the baseline climate and median climate change scenarios means that at worst temporary water is only required in 4 years in 100 years; in all other years it would be unnecessary to purchase temporary water. This option is therefore likely to be a cost effective means to meet target levels of service.
Page 26 W I M M E R A S Y S T E M W S D S 2 0 1 1 T O 2 0 6 0
10.3. Additional Water – Private Rain Water Tanks
At present, recommendations from the Department of Health is that water for potable purposes should come from a reticulated potable supply where one is available rather than from rainwater tanks.
Many households in the Wimmera system most likely use rain-water tanks for non-potable purposes which effectively reduce the demand on the potable system. A restriction relating to rain water tanks is that they are reliant on local rainfall and shortages of tank water associated with low rainfall are highly likely to coincide with any shortage that may occur in the Wimmera system. To be effective in significantly reducing potable demand, rainwater tanks have to be of a larger size and appropriately used. Tanks and plumbing associated with such systems are also expensive.
10.4. Minimum Allocation The Wimmera system has a Bulk Entitlement (BE) of 300 ML. There is no lower limit on the minimum allocation and it could theoretically be 0% (no supply) in 'very dry' years.
The low water availability of the last 10 years resulted in a minimum allocation of 63% in 2006/07. Nevertheless, a minimum allocation would provide enhanced water security and ensure water availability even in the most serve water shortage periods.
The introduction of a 50% minimum allocation would increase the forecast available supply to 220 to 225 ML and would remain relatively constant over the next 50 years. This is a significant improvement in the supply availability that under current conditions is forecast to decline to 117 ML by year 2060. A 50% minimum allocation would result in minimal supply shortfalls.
However with recent and ongoing reforms to water entitlements, it would be highly unlikely that this change would be successful as it would create a new and different “product” that would then not be easily tradable.
10.5. Alternative Water Sources An Alternative Water Atlas is being compiled that will identify and communicate potential sources of alternative water that may form part of the future supply-demand balance.
The objectives of the Alternative Water Atlas from the Water Supply Demand Strategy Guidelines (DSE, 2011) are to:
Identify the volumes of stormwater, recycled water and other alternative water sources available within the works of the Corporation (including wetlands and retardation basins) and/or local council;
Help to inform future opportunities for the use of treated stormwater, recycled water and other alternative water sources in the control of either a water corporation or local council;
Some of the alternative sources identified through the development of the Alternative Water Atlas are included in the assessment of options where a supply-demand shortfall exists.
Page 27 W I M M E R A S Y S T E M W S D S 2 0 1 1 T O 2 0 6 0
11. Water Quality Measures The Korong Vale water treatment plants is generally able to meet required customer water quality standards even when the source water is of poorer quality than normal such as through the recent dry period.
The Department of Health is also increasing the standards it expects for treated water quality including meeting a TDS (salinity) level of no more than 500 mg/L by 2015. The Korong Vale WTP may require some minor upgrades to achieve required water quality standards into the future.
Page 28 W I M M E R A S Y S T E M W S D S 2 0 1 1 T O 2 0 6 0
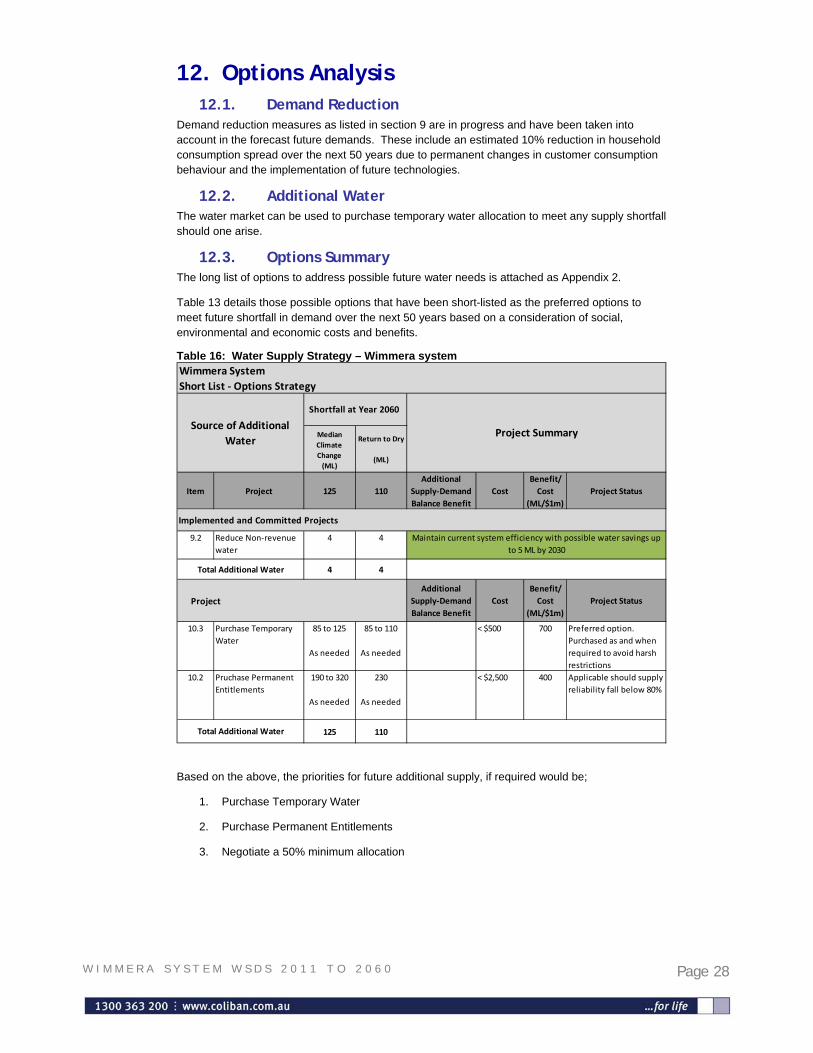
12. Options Analysis 12.1. Demand Reduction
Demand reduction measures as listed in section 9 are in progress and have been taken into account in the forecast future demands. These include an estimated 10% reduction in household consumption spread over the next 50 years due to permanent changes in customer consumption behaviour and the implementation of future technologies.
12.2. Additional Water The water market can be used to purchase temporary water allocation to meet any supply shortfall should one arise.
12.3. Options Summary The long list of options to address possible future water needs is attached as Appendix 2.
Table 13 details those possible options that have been short-listed as the preferred options to meet future shortfall in demand over the next 50 years based on a consideration of social, environmental and economic costs and benefits.
Table 16: Water Supply Strategy – Wimmera system Wimmera System
Short List ‐ Options Strategy
Item Project 125 110
Additional
Supply‐Demand
Balance Benefit
Cost
Benefit/
Cost
(ML/$1m)
Project Status
9.2 Reduce Non‐revenue
water
4 4
4 4
Project
Additional
Supply‐Demand
Balance Benefit
Cost
Benefit/
Cost
(ML/$1m)
Project Status
10.3 Purchase Temporary
Water
85 to 125
As needed
85 to 110
As needed
< $500 700 Preferred option.
Purchased as and when
required to avoid harsh
restrictions
10.2 Pruchase Permanent
Entitlements
190 to 320
As needed
230
As needed
< $2,500 400 Applicable should supply
reliability fall below 80%
125 110
Total Additional Water
Total Additional Water
Source of Additional
Water
Shortfall at Year 2060
Median
Climate
Change
(ML)
Return to Dry
(ML)
Implemented and Committed Projects
Project Summary
Maintain current system efficiency with possible water savings up
to 5 ML by 2030
Based on the above, the priorities for future additional supply, if required would be;
1. Purchase Temporary Water
2. Purchase Permanent Entitlements
3. Negotiate a 50% minimum allocation
Page 29 W I M M E R A S Y S T E M W S D S 2 0 1 1 T O 2 0 6 0
13. Management of Risk and Uncertainty 13.1. General
The use of the water market to supplement supply is considered the lowest risk and cost option.
Coliban Water’s Wimmera entitlement is approximately 0.3% of the total Wimmera system entitlement. The very small volumes of water that may be required should be easily secured from this large market.
13.2. Murray Darling Basin Plan The Murray–Darling Basin Authority has responsibility for developing the Murray–Darling Basin Plan, which will guide the management of water resources across the Basin’s four states and one territory. The Plan builds on and complements previous water reforms and contributes to the Authority’s vision for a healthy working Basin. The Basin Plan aims to balance the water needs of the environment and other uses, through the establishment of new limits (known as sustainable diversion limits, or SDLs) on the volumes of water use in systems and regions.
The draft Basin Plan identifies the following additional water needs to be recovered for southern catchments relevant to Coliban Water’s systems:
Wimmera-Avoca 23 GL
Campaspe 12 GL
Loddon 10 GL
Murray 63 GL (This volume is expected to be met through NVIRP 2)
Goulburn-Broken 99 GL (This volume is expected to be met through NVIRP 2)
However, to meet the needs of the River Murray, a further 971 GL needs to be recovered. This volume would need to be recovered from somewhere within the southern Basin catchments that regularly flow into the Murray and there is flexibility as to where this water comes from.
Coliban Water would likely only be affected by Basin Plan implications in the irregular times that it wishes to access the market to supplement low allocations or reservoir inflows. Due to the very small fraction of total system water that Coliban Water would be seeking, it is reasonable to assume that in all but the worst scenarios that there would be at least some water available.
There is some risk relating to how much of the 971 GL may be sought from the smaller catchments upon which Coliban Water relies and what may happen if the proposed Murray-Darling Basin Authority voluntary buy-back process does not achieve the targeted volumes. From Coliban Water’s perspective, the Campaspe and Loddon systems may be the catchments of greater concern to be more closely monitored into the future.
Most of the aspects of the Basin Plan are presently not intended to take effect in Victoria until 2019 and as such there is time to monitor, contribute to and further assess the likely future impacts of the Basin Plan over the next couple of years. Water Supply Demand Strategies are next due for renewal in 2017 which will be the appropriate time to incorporate any changes.
Page 30 W I M M E R A S Y S T E M W S D S 2 0 1 1 T O 2 0 6 0
14. Proposed Actions The WSDS proposes the following actions for the Wimmera system.
14.1. Short-term Actions The actions proposed for the period covered by WaterPlan 3 (2013 to 2018) and WaterPlan 4 (2018 to 2023):
Monitor the supply and demand closely
Continue with the main replacement and leakage detection programs to minimise non-revenue water
Use the temporary water market to address possible water shortfalls
14.2. Long-term Actions The actions proposed for the period to 2060:
Monitor the supply and demand closely
Continue with the main replacement and leakage detection programs to minimise non-revenue water; and
Use the temporary and permanent water market to address possible water shortfalls.
Page 31 W I M M E R A S Y S T E M W S D S 2 0 1 1 T O 2 0 6 0
15. Community & Stakeholder Engagement The Water Supply Demand Strategies are key strategies for a water business that guide the level of service to our customers and drive augmentation works to enable us to have available required supplies to meet demands. We recognise the importance of implementing a community engagement program that:
Inspires confidence in the process and our ability to manage water resources now and into the future;
Promotes acceptance and understanding of our plans; and
Provides information that supports communities understanding and ability to have informed input.
Some of the methods that have been utilised in engagement around the development and finalisation of this WSDS, or have fed into the WSDS, were:
2009 region wide Understanding our residential customer research project. This included focus groups and mail survey with ‘willingness to pay’ a key focus;
2011 surveys sent to all 66,000 residential customers and 5,000 non-residential customers;
Attended and presented to community groups upon request;
Held public meetings in the Loddon system which had been particularly heavily impacted through the drought;
Meetings with individuals and groups who came forward offering suggestions and comments relating to particular systems and towns;
Website posting of a five year progress review of WaterPlan 2055 (Coliban Water’s 2005 WSDS);
Website posting of draft strategies requesting comments and feedback;
Direct mail to almost 100 key stakeholders directing them to the website and requesting comments and feedback;
Sending out hardcopies of the WSDS draft reports upon request;
Presentations to Coliban Water staff of draft strategies requesting comments and feedback; and
Presentations and strategy sessions with the Coliban Water Board leading up to WSDS endorsement.
The feedback received and conversations had have been useful in informing development and in finalisation of our WSDS.
There have been no major issues or suggestions raised significantly affecting the outcomes and recommendations of the WSDS with feedback received suggesting a high level of support for the direction proposed by Coliban Water and articulated through the strategies.
Page 32 W I M M E R A S Y S T E M W S D S 2 0 1 1 T O 2 0 6 0
APPENDIX 1 Alternative Water Atlas
Wimmera System Summary
Page 34 W I M M E R A S Y S T E M W S D S 2 0 1 1 T O 2 0 6 0
APPENDIX 2 Long List of Supply Options
Wimmera System
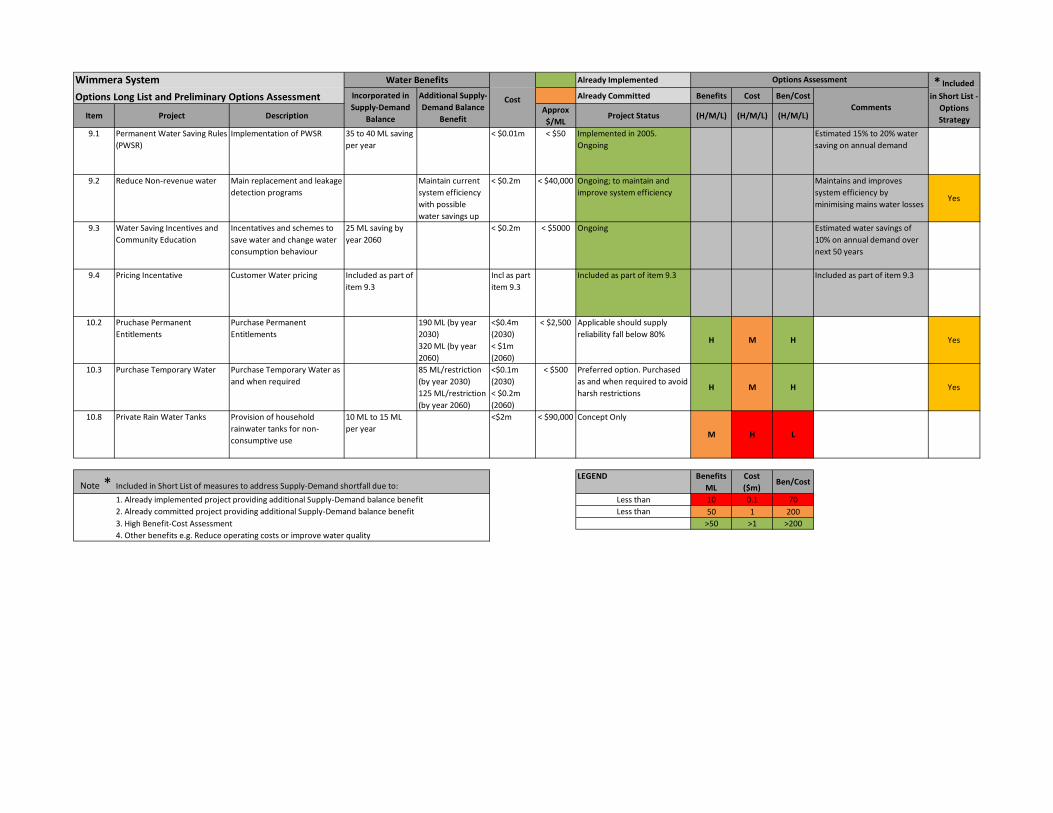
Wimmera System Already Implemented
Options Long List and Preliminary Options Assessment Already Committed Benefits Cost Ben/Cost
Item Project DescriptionApprox
$/MLProject Status (H/M/L) (H/M/L) (H/M/L)
9.1 Permanent Water Saving Rules
(PWSR)
Implementation of PWSR 35 to 40 ML saving
per year
< $0.01m < $50 Implemented in 2005.
Ongoing
Estimated 15% to 20% water
saving on annual demand
9.2 Reduce Non‐revenue water Main replacement and leakage
detection programs
Maintain current
system efficiency
with possible
water savings up
< $0.2m < $40,000 Ongoing; to maintain and
improve system efficiency
Maintains and improves
system efficiency by
minimising mains water lossesYes
9.3 Water Saving Incentives and
Community Education
Incentatives and schemes to
save water and change water
consumption behaviour
25 ML saving by
year 2060
< $0.2m < $5000 Ongoing Estimated water savings of
10% on annual demand over
next 50 years
9.4 Pricing Incentative Customer Water pricing Included as part of
item 9.3
Incl as part
item 9.3
Included as part of item 9.3 Included as part of item 9.3
10.2 Pruchase Permanent
Entitlements
Purchase Permanent
Entitlements
190 ML (by year
2030)
320 ML (by year
2060)
<$0.4m
(2030)
< $1m
(2060)
< $2,500 Applicable should supply
reliability fall below 80%H M H Yes
10.3 Purchase Temporary Water Purchase Temporary Water as
and when required
85 ML/restriction
(by year 2030)
125 ML/restriction
(by year 2060)
<$0.1m
(2030)
< $0.2m
(2060)
< $500 Preferred option. Purchased
as and when required to avoid
harsh restrictionsH M H Yes
10.8 Private Rain Water Tanks Provision of household
rainwater tanks for non‐
consumptive use
10 ML to 15 ML
per year
<$2m < $90,000 Concept Only
M H L
Note * Included in Short List of measures to address Supply‐Demand shortfall due to:LEGEND Benefits
ML
Cost
($m)Ben/Cost
1. Already implemented project providing additional Supply‐Demand balance benefit Less than 10 0.1 70
2. Already committed project providing additional Supply‐Demand balance benefit Less than 50 1 200
3. High Benefit‐Cost Assessment >50 >1 >200
4. Other benefits e.g. Reduce operating costs or improve water quality
Options Assessment
Comments
Water Benefits
Incorporated in
Supply‐Demand
Balance
Additional Supply‐
Demand Balance
Benefit
Cost
* Included in Short List ‐
Options
Strategy