water supply and demand in the lower río bravo/río grande ... · water supply and demand in the...
TRANSCRIPT
Water supply and demand in the lower Río Bravo/Río Grandebasin: The irrigated agriculture scenario
José Návar1 Facultad de Ciencias Forestales, UANL, Linares, N.L., México
Received: August 28, 2002; accepted: January 13, 2004
RESUMENEl manejo convencional de los recursos hidrológicos no puede sustentar el desarrollo en la cuenca baja del Río Bravo/Río
Grande. Proyecciones a largo plazo del suministro y demanda del agua proveen información para planear el manejo sustentable delos recursos hidrológicos. Cuatro escenarios se estudiaron para proyectar la disponibilidad y el suministro del agua en la partemexicana de la cuenca baja del Río Bravo/Río Grande: (i) desarrollo de la infraestructura para el aprovechamiento de las aguas delrío Conchos, (ii) sequía histórica, (iii) hidrología normal y (iv) la presencia simultánea de (i) y (ii). El área agrícola de riego podríaser más variable, con pérdida de superficie agrícola irrigada en el distrito 025 de México de la cuenca baja del Río Bravo/RíoGrande, por la creciente demanda del agua en los sectores doméstico, industria, municipal y comercial de los municipios fronterizosdel Río Bravo/Río Grande, magnificado por la sequía y el desarrollo en infraestructura para el aprovechamiento de las aguas delrío Conchos.
PALABRAS CLAVE: Agricultura irrigada, manejo sustentable de recursos hidrológicos, distrito de riego 025, sequía históricaregistrada y desarrollo de infraestructura hidráulica en el río Conchos.
ABSTRACTConventional management of water resources cannot sustain development in the lower Río Bravo/Río Grande watershed.
Long-term projections of water supply and demand provide information to plan for the sustainable management of water re-sources. Four scenarios were studied to project water availability and supply on the Mexican side of the Lower Río Bravo/RíoGrande watershed: (i) water development of the Conchos River, (ii) drought spells on record, (iii) normal hydrological conditions,and (iv) the simultaneous presence of (i) and (ii). The size of agricultural lands could become more variable, with loss of irrigatedagriculture in district 025 of the Mexican lower Río Bravo/Río Grande, due to increasing water demand from domestic, industrial,commercial, and municipal sectors in the municipalities bordering the Río Bravo/Río Grande, magnified by drought and thedevelopment of water demand of the Conchos river.
KEY WORDS: Irrigated agriculture, sustainable management of water resources, Irrigation District 025, drought on record andnormal hydrological conditions.
INTRODUCTION
The lower watershed of the Río Bravo/Grande basinon the Mexican side, from Reynosa to the Gulf of Mexico atMatamoros, is facing a complex set of water supply and de-mand issues. Irrigation and domestic, industrial, municipal,and commercial water uses dominate in this area. Environ-mental concerns regarding streamflow shortages along themain course of the Río Bravo/Río Grande and severe con-tamination (Vogel and Armstrong, 1997) are important is-sues for the management of riparian ecosystems (Contrerasand Lozano, 1994; Edwards and Contreras, 1997;CEFPRODHAC, 1997; Chapman, 2000).
The basin has been experiencing rapid economic, pub-lic, services and trade growth due to the North AmericanFree Trade Agreement (NAFTA)(Aguilar and Chapa, 1998).
Population and industry almost doubled from 1970 to 1995(INEGI, 1995). Population growth in the bordering munici-palities of the basin place considerable demand on water sup-ply from yearly average of 74 Mm3 in the 1970’s to 193 Mm3
in the 1990’s (CNA, 1997). The basin has been experiencingrecurrent drought spells contributing to surface water short-ages and reduced agricultural areas in irrigation district 025of Mexico.
The lower Río Bravo/Río Grande watershed contrib-utes an average of 4.6% of the water supply in the region.(IBWC, 1994; SARH CNA, 1994). The remainder comesfrom the middle and upper watersheds of the Río Bravo/RíoGrande basin through La Amistad and Falcón reservoirs(Chapman, 2000; Schmandt et al., 2000). The Conchos isthe main Mexican tributary of the Bravo/Río Grande andcontributes to these reservoirs, at a larger rate than provided
495
Geofísica Internacional (2004), Vol. 43, Num. 3, pp. 495-506
496
J. Návar
in the US/Mexico treaty of 1944 (IBWC data 1980-1994;Ward, 1998). The San Juan is the main tributary of the lowerRío Bravo/Río Grande. It also discharged at an average ratehigher than stipulated in the treaty (ERL, 1991; Návar, 2001).However, the current drought and the construction of ElCuchillo reservoir lowered the rate of discharge into the RíoBravo/Río Grande (Navar, 2001). Because of the drought,Mexico was unable to meet its obligations of the 1944 treatyin recent times.
Future increase in public water demands coupled withthe presence of drought spells, and the likely full utilizationof the Río Conchos headwaters could result in serious so-cial, political, economical, and environmental concerns inthe region. Under such scenarios, the Río Bravo/Río Grandemay not meet water demand of the Mexican side of the lowerRío Bravo/Río Grande. The objectives of this study are (1)to forecast future supplyes and demand under (a) normalhydrological conditions, (b) full development of the Mexi-can waters, (c) worst drought on record, and (d) full Mexi-can development of the Mexican waters coupled with a worstdrought of record. We assess the impact of these scenarioson the size of irrigated land of irrigation district 025 for 1990-2005; 2010-2025; and 2030-2045. The worst drought ofrecord was estimated as the critical draw-down or depletionperiod of La Amistad and Falcón reservoir in the 1945-1960.This interval extends from a local maximum (100% of stor-age conservation capacity) to the lowest subsequent mini-mum value before a large maximum. “Normal” hydrologi-cal conditions were assumed as the 15 year period wherereservoir storage oscillates with the smallest variation. Fulldevelopment of Mexican waters assumes that Mexico useall water left after complying with the 1944 treaty with theUS.
METHODOLOGY
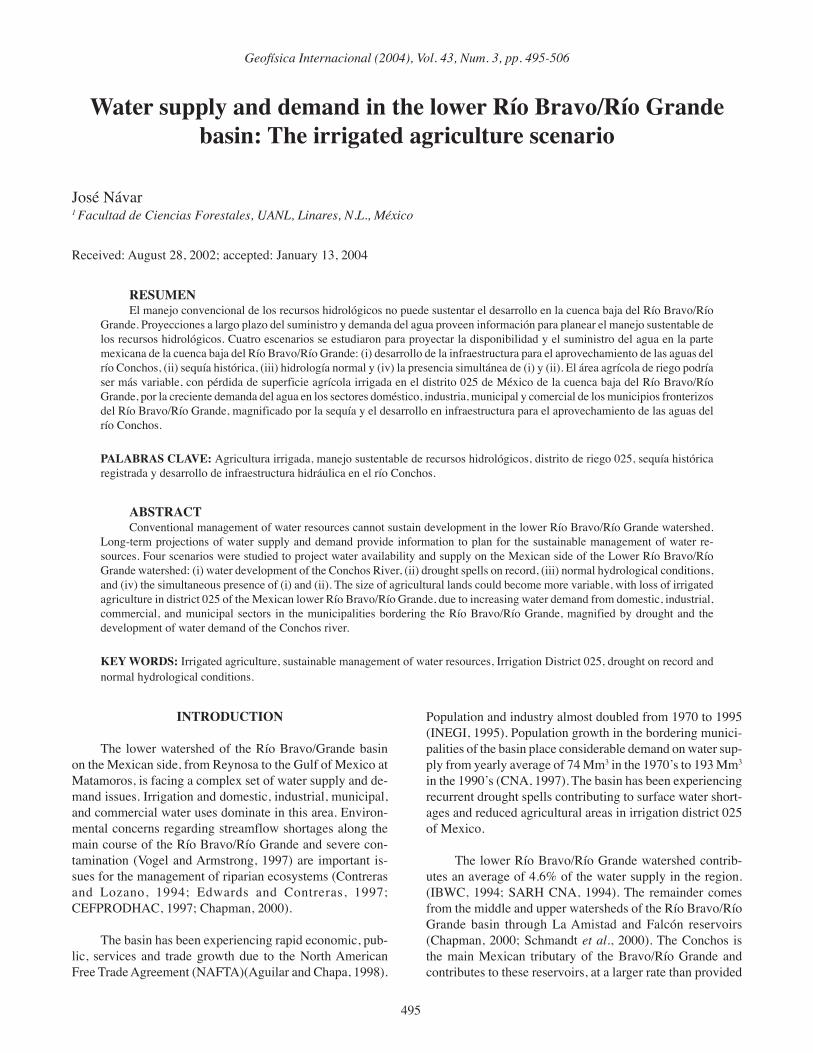
The Hydrologic Region of the Lower Río Bravo/Río Grande/Río Conchos. The Lower Río Grande/RíoBravo watershed, LRGW, belongs to the Río Bravo/RíoConchos basin, which comprises a total area of 870 000 km2,of which, approximately 400 000 km2 drain into closed wa-tersheds. According to IBWC (1993), the lower Río Bravo/Río Grande watershed covers an area of 44 193 km2, fromFalcón reservoir to its outlet into the Gulf of Mexico, ofwhich 92.9 % (41 065 km2) belongs to Mexico and the re-mainder within the United States. The study area covers inMexico the municipalities of Reynosa, Río Bravo/RíoGrande, Valle Hermoso, and Matamoros of the State ofTamaulipas, Mexico.
Irrigation water demands. Agriculture has dominatedwater use in the lower Río Bravo/Río Grande because ofthe size of irrigated lands. The irrigation districts of the Mexi-
can portion of the watershed are: the 026 or Bajo San Juanand the 025 or Bajo Río Bravo/Río Grande districts (Figure1). Within the American portion of the watershed, there arecurrently 29 irrigation districts of 33 originally established(Schmandt et al., 1998). Total irrigated areas accounts for620 483 ha, of which 53.8% (333 615 ha) lies within Mexicoand the remaining 46.2% (286 468 ha) lies within the USA(IBWC, 1993). Total irrigated area in Mexico (226 000 ha)utilizes discharge from the main stem of the Río Bravo/RíoGrande because the lower 026 or Bajo San Juan district irri-gates agriculture from the complex Marte R. Gómez-ElCuchillo reservoirs, which were built along the headwatersof the Río San Juan.
METHODS
To forecast future supply and demands on the MexicanBajo Río Bravo/Río Grande watershed, a water balance wasconducted on the main stem of the Río Bravo/Río Grande.The balance employed the following inflows and outflows.Inflows: i) releases from the Falcón reservoir, gauged imme-diately below the reservoir, ii) discharges from the Río Alamoand Río San Juan and iii) irrigation excess from district 026.Outflows: i) water diversions from the Río Bravo/Río Grandefor the American and Mexican sides of the watershed foragriculture, and ii) water diverted by several cities for mu-nicipal use. The outlet was considered to be the river reachat Brownsville, TX. The water balance is closed and fourscenarios were imposed on releases from Falcón reservoir:(a) normal hydrological conditions, (b) full development ofthe Mexican waters, (c) worst drought of record, and (d) fullMexican development of the Mexican waters coupled with aworst drought of record. The volume of discharge allottedfor Mexico at Anzaldúas was estimated using regression equa-tions derived from IBWC data for the period of 1980-1994.It was assumed that discharge delivered for Mexico suppliedfirst municipalities and industry and the volume left was al-lotted for irrigation of the 025 district. Volume divided byirrigation depth results in irrigated land. The irrigation depthwas estimated by using the consumptive use for two of themost common crops (maize and sorghum) after averagemonthly precipitation was subtracted. Population and indus-try water demands increase in time while irrigation depthremains nearly fixed in time of simulation. Given businessas usual scenarios, the size of irrigated agriculture is depen-dent on the volume of discharge and on public and industrialdemands. The volume of discharge in the future is depen-dent also on the hydroclimatic conditions and further devel-opments of water use along the main tributaries of the RíoBravo/Río Grande.
The size of irrigated lands in the lower Río Bravoand water demands. Historic irrigated lands in the US andMexican sides of the lower watershed are variable in size
497
Water supply and demand scenarios in the Mexican lower Río Bravo/Río Grande watershead
because of uncertainties in water supplies for irrigation re-gardless of the storage management of reservoirs 'La Amistad','Falcón' and 'Marte R. Gómez'. In the 025 district, averageirrigated lands (1978-1997) sized 188 000 ha year-1. How-ever irrigated lands are contracting with time. The volume ofwater used for irrigation within the 025 district is also vari-able and it is dependent on the volume of water storage inthe reservoirs mentioned above and the operation of reser-voirs. Annual average and standard deviations of volume ofwater used for irrigation are 737 and 356 Mm3 year-1 (CNA,1998).
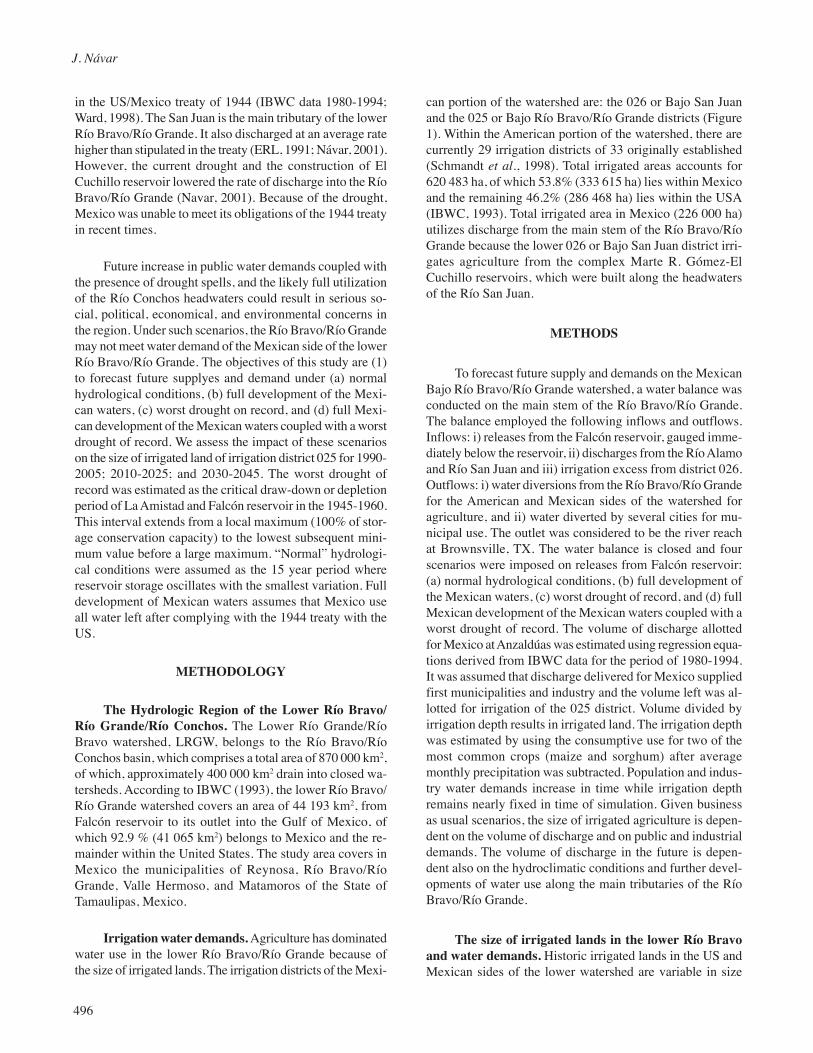
Population of the lower Río Bravo/Río Grande wa-tershed. Population in the lower watershed is steadily in-creasing (Aguilar and Chapar, 1998; Schmandt et al., 1998;Schmandt et al., 2000). In the Mexican side, the incrementrate for the 1990’s was approximately 3.9% and it is expectedto decline to 2.5% for the year 2010 (CONAPO, 1996). Thisrate represents approximately 32 000 new inhabitant year-1
for the 4 municipalities bordering the lower Río Bravo/RíoGrande watershed.
Total population for the municipalities of the lower RíoBravo/Río Grande was obtained from INEGI sources for theperiod of 1960 to 1995 and predicted from CONAPO sourcesfor the years 2000 to 2010. A linear trend was fitted to pre-dict future population up to the year 2045. Three scenariosof population growth had been proposed and described byCONAPO (INEGI 1995) (Figure 2).
Observed population increased 2.3 times from 1960(0.32 M) to 1990 (0.73 M). Conapo (1996) reports increasesof 1.5 times for the year 2010 (1.29 M) in comparison to the1995 population. Predicted population for the years 2030 and2045 would be 1.99 and 2.44 M, respectively, representingincrements of 235 and 288% of the population reported forthe year 1995.
Public water demands in the lower Río Bravo/RíoGrande watershed. The main stem of the Río Bravo/RíoGrande supplies water for public (domestic, municipal, andcommercial use) use, through releases from La Amistad-Falcón reservoirs, for 8 out of the 10 Mexican municipali-
Fig. 1. Several features of the lower Río Bravo/Río Grande watershed in the Mexican portion of the Basin.
498
J. Návar
ties of the lower Río Bravo/Río Grande watershed. Marte R.Gómez reservoir supplies water to the remaining other twomunicipalities. Total public water demand for the 8 munici-palities was estimated with information provided by severalsources for several time periods. For six municipalities in1995, total public water supply was approximately 115 Mm3
year-1. A similar figure has been reported on water diversionsfrom the Río Bravo/Río Grande at Anzaldúas for municipalwater use for the period of 1960 to 1997 (114 Mm3 year-1
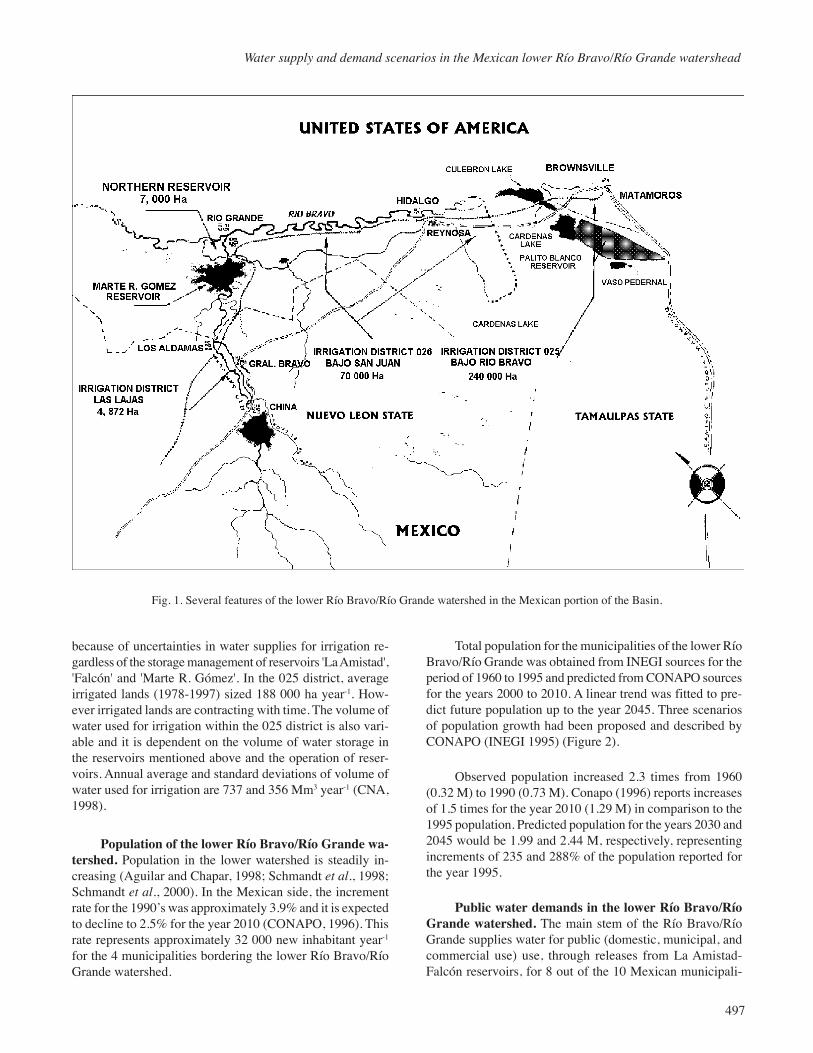
with a standard deviation of 64 Mm3 year-1). For the periodof 1990 1998, average water diversions from the Río Bravo/Río Grande for public water supply was 199 Mm3 year-1 witha standard deviation of 66 Mm3 year-1. Therefore, diversionsfrom Anzaldúas for public water supply and population esti-mates provided by INEGI (1998) were plotted to estimatethe average per capita water supply.
The per capita public water supply steadily increasedwhen projected in time. Therefore, a maximum per capitawater use had to be proposed. The maximum constant percapita water supply was 405 liters per person per day after1995. This figure appears to be quite large. However, it ac-counts for domestic, residential, commercial, and public sup-ply (Figure 3). On the other hand, this constant per capitawater use was recorded for 1995 during the middle of thedrought episode of the last decade.
Observed per capita public water use for 1960 and 1995was 246 and 326 liters day-1 inhabitant-1. These figures wouldincrease for the years 2010, 2030, and 2045 to 352, 384, and405 liters day-1 inhabitant-1, respectively. This estimate isslightly larger than the figure estimated by Soley et al., (1998)for domestic water use alone for the entire United States. Asstated above, our estimation comprises also municipal, com-mercial and public water use and is consistent with figures
reported for other modern societies. Several semi-arid cit-ies such as Amman and Lalitpur (40 liters day-1 inhabitant-
1) (Schmitt, 1997) are the exception to the high per capitawater supply.
Public water demand for the years 1960 and 1995 hadan average of 26 and 101 Mm3 year-1, respectively. Thesefigures would increase for the years 2010, 2030, and 2045to 206, 309, and 386 Mm3 year-1, respectively.
Industrial water use. Temporal trends in industrialwater use for the municipalities included in this study fitteda linear regression equation. Observed industrial water usefor the years 1975, 1980, 1990 and 1995 were: 5.2, 1.2,15.8, and 11.3 Mm3 year-1, respectively. For the years 2010,2030, and 2045 these figures are expected to increase to:40, 63, and 77 Mm3 year-1, respectively. These figures arein the range of 20% of the volume of water predicted forpublic water supply and it is consistent for several indus-trial centers such as the Monterrey Metropolitan Area(Návar, 2001).
Hydrometric information reviewed and analyzedHydrological data for the lower Río Bravo/Río Grande was
Fig. 2. Population trends in the Mexican portion of the lower RíoBravo/Río Grande watershed, from Reynosa to Matamoros,Tamaulipas, Mexico (Source: INEGI 1950-1990 and CONAPO
1996).
Fig. 3. Observed and predicted per capita domestic and municipalwater use in the Mexican portion of the lower Río Bravo/Río Grandewatershed (Source CNA 1998). The per capita water use had to beassumed to be a constant of 405 l per day per person, the maximum
recorded for the Mexican Bajo Río Bravo/Río Grande.
499
Water supply and demand scenarios in the Mexican lower Río Bravo/Río Grande watershead
obtained from the hydrologic bulletins annually publishedby IBWC. For this project, monthly data from 1980-1994were employed. The gauging stations studied were:
• Streamflow gauged at 5 hydrometric stations along the RíoBravo/Río Grande, below Falcón reservoir.
• Inflows gauged in 4 hydrometric stations along Río Bravo/Río Grande: from the Mexican tributaries Río Alamo andRío San Juan and irrigation-excess flows from District 025.
• Diversions gauged at 7 hydrometric stations along the RíoBravo/Río Grande; 6 in the USA and 1 in Mexico.
• Diversions for municipal use gauged in 5 hydrometric sta-tions along the Río Bravo/Río Grande.
• Irrigated land areas of District 025.
Outflows. Outflows from the Río Bravo/Río Grande aregauged in 7 hydrometric stations:
Diversions for Municipal Use. Outflows from the RíoBravo/Río Grande for municipal use are being gauged byIBWC at 5 hydrometric stations:
Regression equations were used to estimate monthlydischarges at each hydrometric station because of the highvariability associated with discharge, diversions and inflows.The gauging stations immediately above the gauging stationin study were considered the independent variables. The sub-traction of discharges between hydrometric stations resultedin estimate of the diversions between gauging stations. Thisapproach accurately fitted water budgets along the Río Bravo/Río Grande and comprises several sources of variation suchas losses in the main stem and resacas (ponds remaining af-ter releases drains along the Río Bravo/Río Grande chan-nel), withdrawals from the main stem during releases, errorsin gauging, unaccounted diversions, etc. The equations em-ployed are described below:
QRBRío Grande
=337.02+0.9207 QRBFalcón
; r2=0.91, Sx=0.665 Mm3
QRBAnzaldúas
=200.64+0.459 QRBRío Grande
; r2=0.56, Sx=0.934 Mm3
QRBSan Benito
=-315.6+0.615 QRBAnzaldúas
; r2=0.66, Sx=0.623 Mm3
QRBBrownsville
=-25.01+0.96 QRBSan Benito
; r2=0.82, Sx=0.462 Mm3
Where: Q = Monthly discharge (x1000 m3);
Falcón, Río Grande, Anzaldúas, San Benito, and Brownsvilleare the IBWC gauging stations along the Río Bravo/RíoGrande.
Hydrological Scenarios on the main stem of the LRB.The water balance of La Amistad-Falcón reservoirs, calcu-
lated for the period of 1945 to 1990 by Ward (1998) underthe four scenarios employed in this study, was used as inputdata into the Lower Río Bravo/Río Grande. Monthly dis-charge below Falcón reservoir varied according the projectedscenarios; a) normal hydrological conditions, NH, b) fulldevelopment of Mexican waters, MD, c) drought of recordor super-drought, SD, and d) full development of Mexicanwaters and super-drought, MDSD. Normal hydrological con-ditions and drought of record was estimated as the monthlydischarge for 15 years. The drought of record or super-droughtwas defined as the highest draw-down 15-year period of LaAmistad-Falcón reservoirs from 1945 1960. This dry epi-sode is coincident with the worst drought of record estimatedfor the Río San Juan watershed, which lasted from 1949 to1964 (Navar, 2001). Data consisting on releases from thecomplex La Amistad-Falcón were estimated by Ward (1998)for these four scenarios and provided for this report.
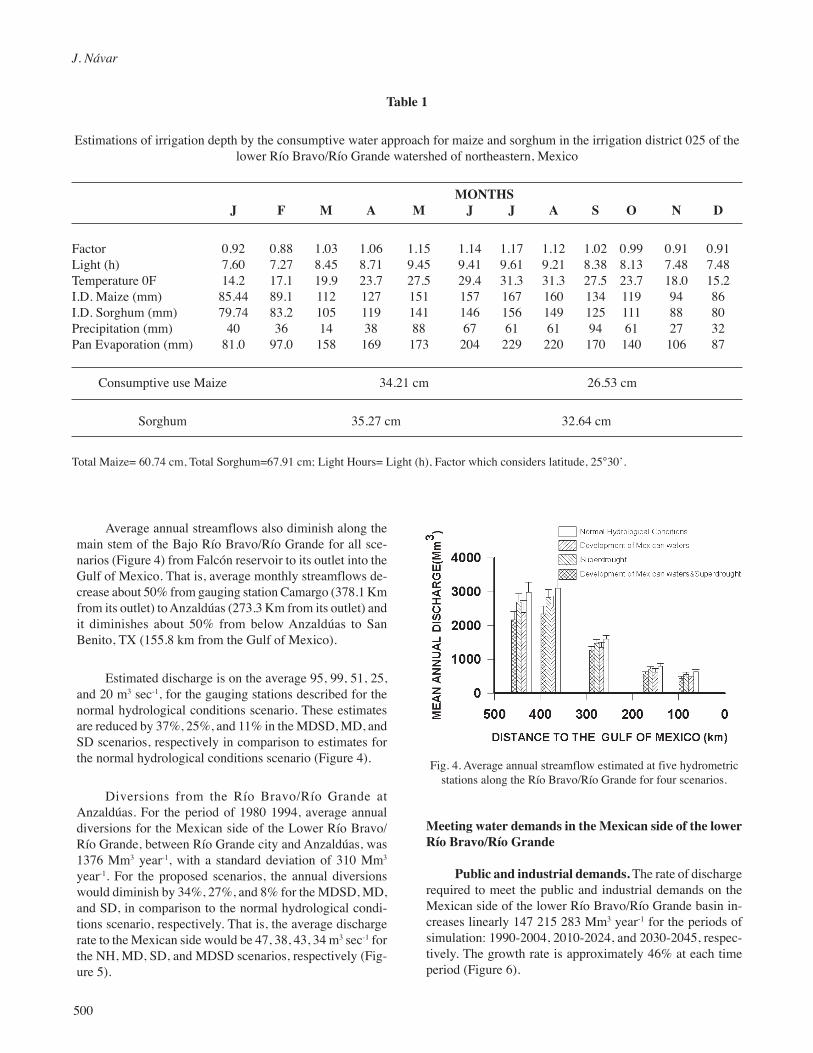
The irrigation depth was approximated using the cropconsumption approach of Blaney and Criddle (Withers andVipond, 1986). This approach was employed for irrigatingthe most popular crops: maize and sorghum for two con-secutive growing seasons. Estimated consumptive water usefor these crops was subtracted from monthly precipitation todetermine the irrigation depth required for these two cropsand the results are presented in Table 1.
The full water balance can define in a monthly tempo-ral scale (i) discharge along the main stem of the Río Bravo/Río Grande, (ii) water diversions between hydrometric sta-tions, (iii) public and industrial water demand, (iv) volumeof water left for irrigation, (iv) consumptive water demandsfor irrigation, and (v) the area to be irrigated for the volumeof water remaining after the municipal and industrial useshave been satisfied.
RESULTS
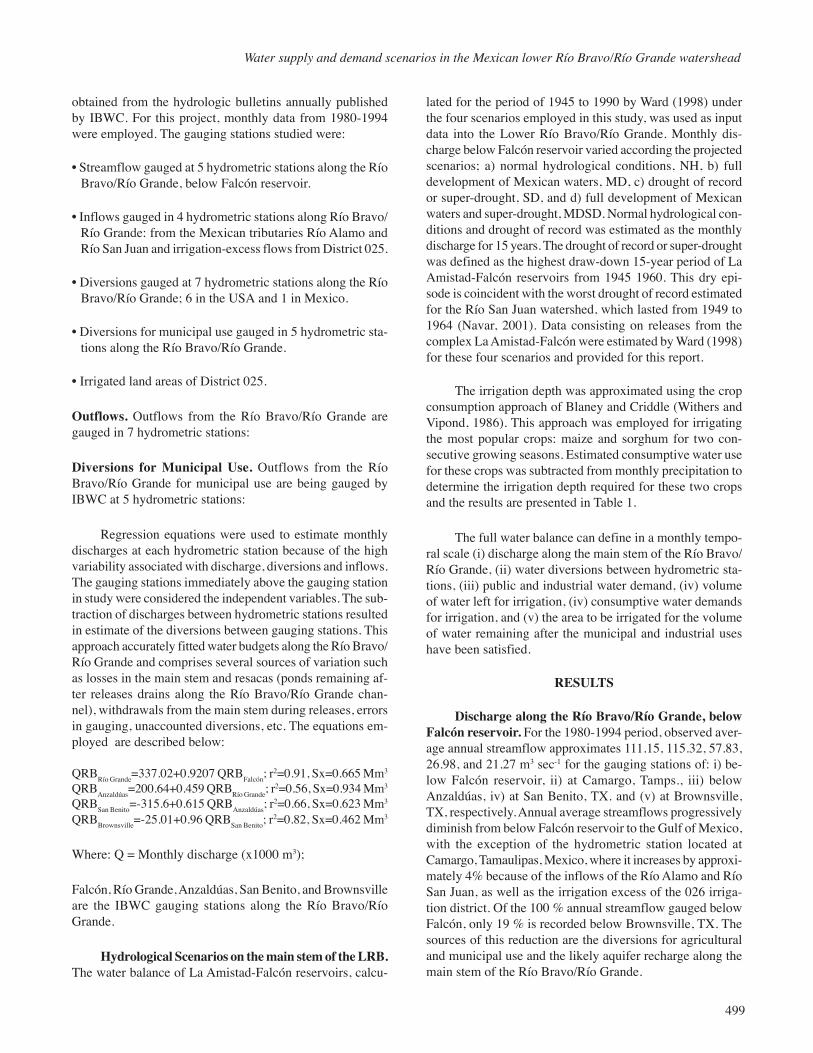
Discharge along the Río Bravo/Río Grande, belowFalcón reservoir. For the 1980-1994 period, observed aver-age annual streamflow approximates 111.15, 115.32, 57.83,26.98, and 21.27 m3 sec-1 for the gauging stations of: i) be-low Falcón reservoir, ii) at Camargo, Tamps., iii) belowAnzaldúas, iv) at San Benito, TX. and (v) at Brownsville,TX, respectively. Annual average streamflows progressivelydiminish from below Falcón reservoir to the Gulf of Mexico,with the exception of the hydrometric station located atCamargo, Tamaulipas, Mexico, where it increases by approxi-mately 4% because of the inflows of the Río Alamo and RíoSan Juan, as well as the irrigation excess of the 026 irriga-tion district. Of the 100 % annual streamflow gauged belowFalcón, only 19 % is recorded below Brownsville, TX. Thesources of this reduction are the diversions for agriculturaland municipal use and the likely aquifer recharge along themain stem of the Río Bravo/Río Grande.
500
J. Návar
Average annual streamflows also diminish along themain stem of the Bajo Río Bravo/Río Grande for all sce-narios (Figure 4) from Falcón reservoir to its outlet into theGulf of Mexico. That is, average monthly streamflows de-crease about 50% from gauging station Camargo (378.1 Kmfrom its outlet) to Anzaldúas (273.3 Km from its outlet) andit diminishes about 50% from below Anzaldúas to SanBenito, TX (155.8 km from the Gulf of Mexico).
Estimated discharge is on the average 95, 99, 51, 25,and 20 m3 sec-1, for the gauging stations described for thenormal hydrological conditions scenario. These estimatesare reduced by 37%, 25%, and 11% in the MDSD, MD, andSD scenarios, respectively in comparison to estimates forthe normal hydrological conditions scenario (Figure 4).
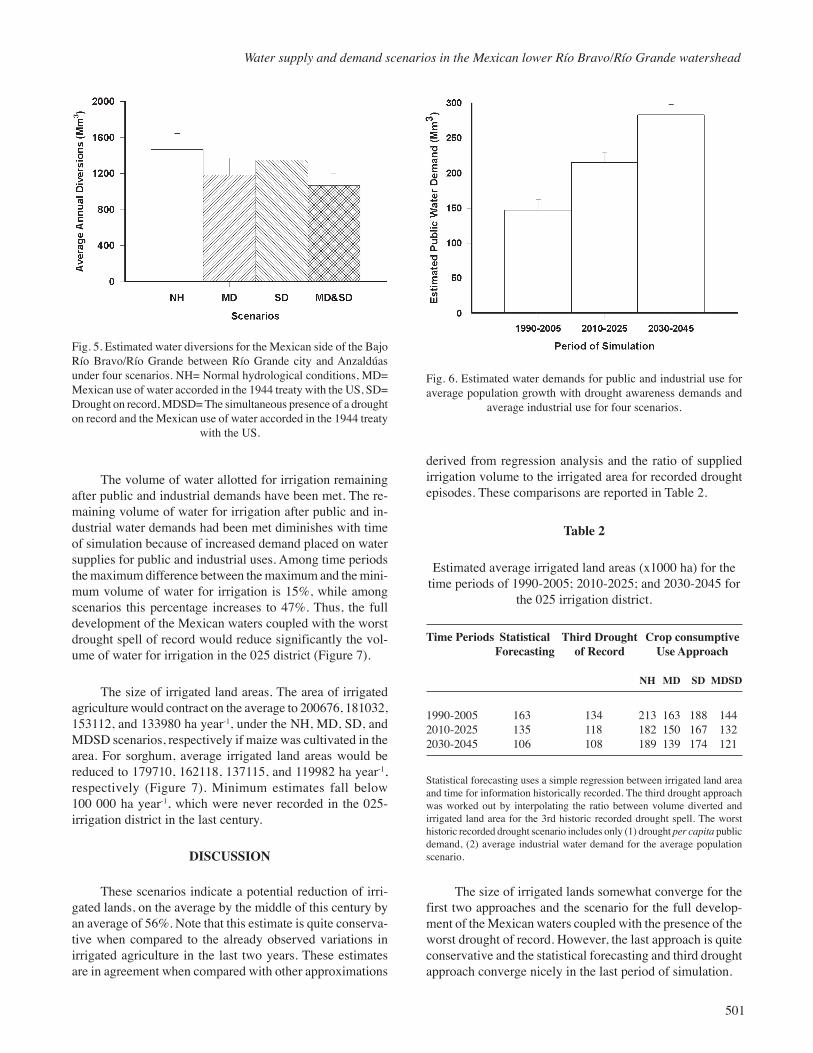
Diversions from the Río Bravo/Río Grande atAnzaldúas. For the period of 1980 1994, average annualdiversions for the Mexican side of the Lower Río Bravo/Río Grande, between Río Grande city and Anzaldúas, was1376 Mm3 year-1, with a standard deviation of 310 Mm3
year-1. For the proposed scenarios, the annual diversionswould diminish by 34%, 27%, and 8% for the MDSD, MD,and SD, in comparison to the normal hydrological condi-tions scenario, respectively. That is, the average dischargerate to the Mexican side would be 47, 38, 43, 34 m3 sec-1 forthe NH, MD, SD, and MDSD scenarios, respectively (Fig-ure 5).
Meeting water demands in the Mexican side of the lowerRío Bravo/Río Grande
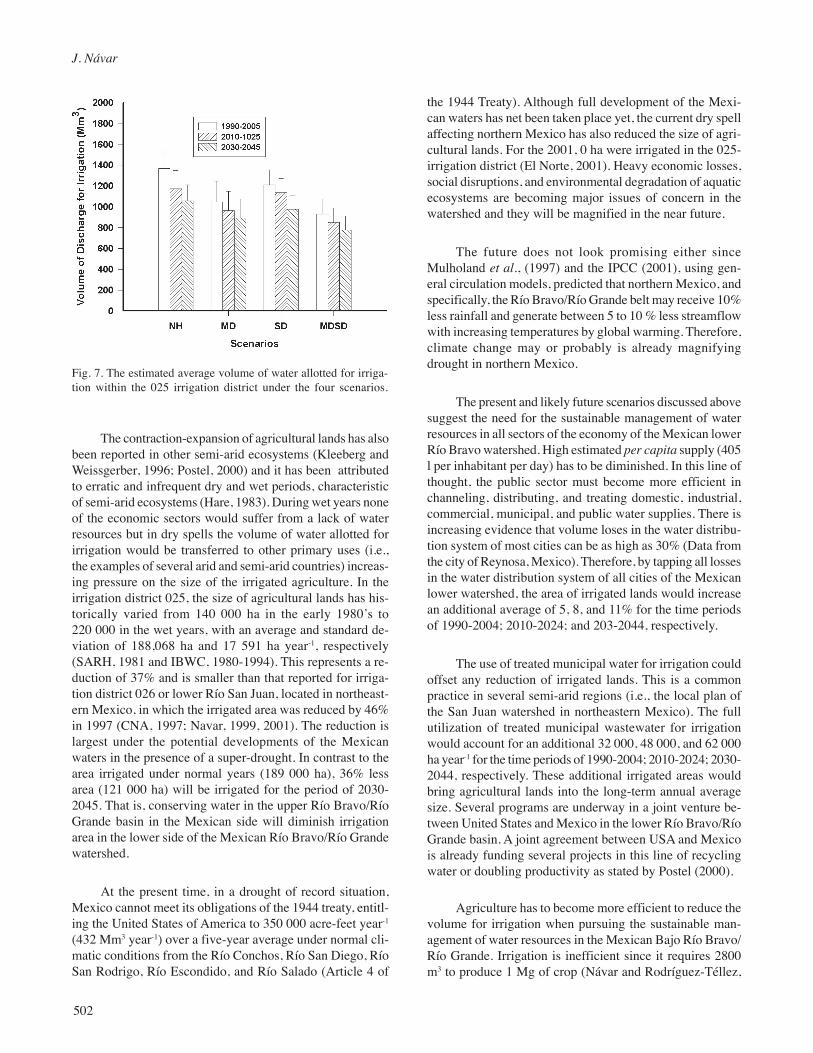
Public and industrial demands. The rate of dischargerequired to meet the public and industrial demands on theMexican side of the lower Río Bravo/Río Grande basin in-creases linearly 147 215 283 Mm3 year-1 for the periods ofsimulation: 1990-2004, 2010-2024, and 2030-2045, respec-tively. The growth rate is approximately 46% at each timeperiod (Figure 6).
Table 1
Estimations of irrigation depth by the consumptive water approach for maize and sorghum in the irrigation district 025 of thelower Río Bravo/Río Grande watershed of northeastern, Mexico
MONTHSJ F M A M J J A S O N D
Factor 0.92 0.88 1.03 1.06 1.15 1.14 1.17 1.12 1.02 0.99 0.91 0.91Light (h) 7.60 7.27 8.45 8.71 9.45 9.41 9.61 9.21 8.38 8.13 7.48 7.48Temperature 0F 14.2 17.1 19.9 23.7 27.5 29.4 31.3 31.3 27.5 23.7 18.0 15.2I.D. Maize (mm) 85.44 89.1 112 127 151 157 167 160 134 119 94 86I.D. Sorghum (mm) 79.74 83.2 105 119 141 146 156 149 125 111 88 80Precipitation (mm) 40 36 14 38 88 67 61 61 94 61 27 32Pan Evaporation (mm) 81.0 97.0 158 169 173 204 229 220 170 140 106 87
Consumptive use Maize 34.21 cm 26.53 cm
Sorghum 35.27 cm 32.64 cm
Total Maize= 60.74 cm, Total Sorghum=67.91 cm; Light Hours= Light (h), Factor which considers latitude, 25°30’.
Fig. 4. Average annual streamflow estimated at five hydrometricstations along the Río Bravo/Río Grande for four scenarios.
501
Water supply and demand scenarios in the Mexican lower Río Bravo/Río Grande watershead
The volume of water allotted for irrigation remainingafter public and industrial demands have been met. The re-maining volume of water for irrigation after public and in-dustrial water demands had been met diminishes with timeof simulation because of increased demand placed on watersupplies for public and industrial uses. Among time periodsthe maximum difference between the maximum and the mini-mum volume of water for irrigation is 15%, while amongscenarios this percentage increases to 47%. Thus, the fulldevelopment of the Mexican waters coupled with the worstdrought spell of record would reduce significantly the vol-ume of water for irrigation in the 025 district (Figure 7).
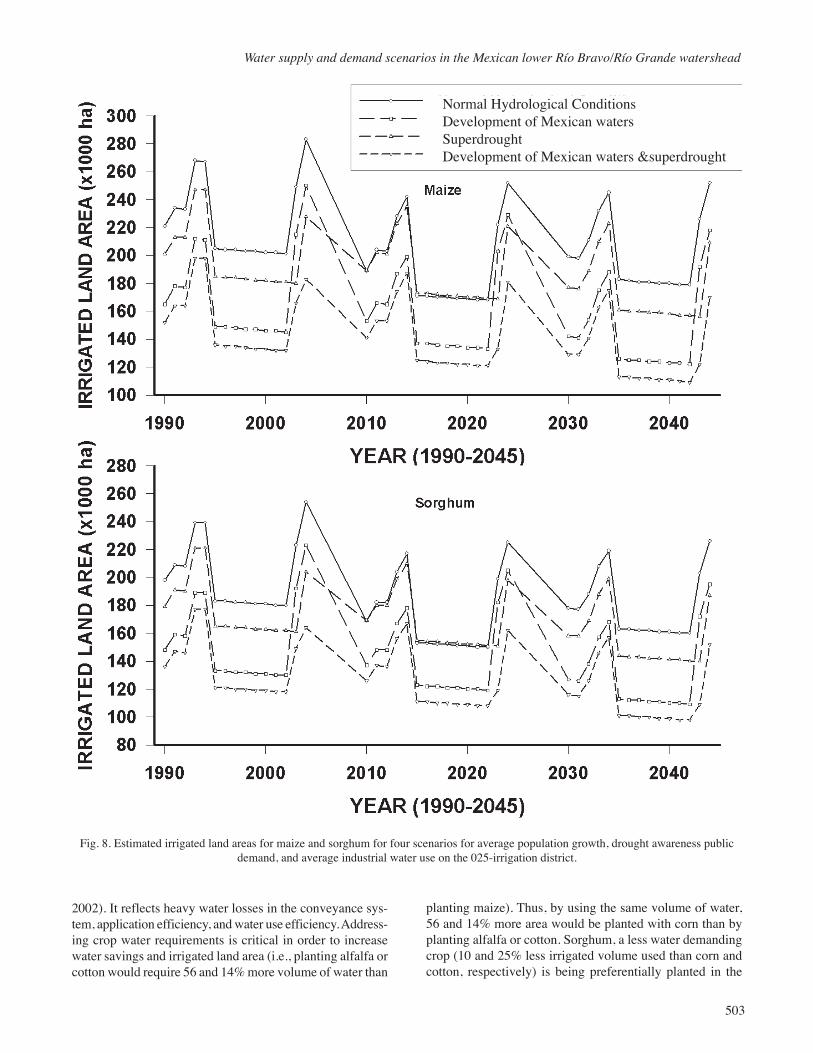
The size of irrigated land areas. The area of irrigatedagriculture would contract on the average to 200676, 181032,153112, and 133980 ha year-1, under the NH, MD, SD, andMDSD scenarios, respectively if maize was cultivated in thearea. For sorghum, average irrigated land areas would bereduced to 179710, 162118, 137115, and 119982 ha year-1,respectively (Figure 7). Minimum estimates fall below100 000 ha year-1, which were never recorded in the 025-irrigation district in the last century.
DISCUSSION
These scenarios indicate a potential reduction of irri-gated lands, on the average by the middle of this century byan average of 56%. Note that this estimate is quite conserva-tive when compared to the already observed variations inirrigated agriculture in the last two years. These estimatesare in agreement when compared with other approximations
derived from regression analysis and the ratio of suppliedirrigation volume to the irrigated area for recorded droughtepisodes. These comparisons are reported in Table 2.
Table 2
Estimated average irrigated land areas (x1000 ha) for thetime periods of 1990-2005; 2010-2025; and 2030-2045 for
the 025 irrigation district.
Time Periods Statistical Third Drought Crop consumptiveForecasting of Record Use Approach
NH MD SD MDSD
1990-2005 163 134 213 163 188 1442010-2025 135 118 182 150 167 1322030-2045 106 108 189 139 174 121
Statistical forecasting uses a simple regression between irrigated land areaand time for information historically recorded. The third drought approachwas worked out by interpolating the ratio between volume diverted andirrigated land area for the 3rd historic recorded drought spell. The worsthistoric recorded drought scenario includes only (1) drought per capita publicdemand, (2) average industrial water demand for the average populationscenario.
The size of irrigated lands somewhat converge for thefirst two approaches and the scenario for the full develop-ment of the Mexican waters coupled with the presence of theworst drought of record. However, the last approach is quiteconservative and the statistical forecasting and third droughtapproach converge nicely in the last period of simulation.
Fig. 5. Estimated water diversions for the Mexican side of the BajoRío Bravo/Río Grande between Río Grande city and Anzaldúasunder four scenarios. NH= Normal hydrological conditions, MD=Mexican use of water accorded in the 1944 treaty with the US, SD=Drought on record, MDSD= The simultaneous presence of a droughton record and the Mexican use of water accorded in the 1944 treaty
with the US.
Fig. 6. Estimated water demands for public and industrial use foraverage population growth with drought awareness demands and
average industrial use for four scenarios.
502
J. Návar
The contraction-expansion of agricultural lands has alsobeen reported in other semi-arid ecosystems (Kleeberg andWeissgerber, 1996; Postel, 2000) and it has been attributedto erratic and infrequent dry and wet periods, characteristicof semi-arid ecosystems (Hare, 1983). During wet years noneof the economic sectors would suffer from a lack of waterresources but in dry spells the volume of water allotted forirrigation would be transferred to other primary uses (i.e.,the examples of several arid and semi-arid countries) increas-ing pressure on the size of the irrigated agriculture. In theirrigation district 025, the size of agricultural lands has his-torically varied from 140 000 ha in the early 1980’s to220 000 in the wet years, with an average and standard de-viation of 188,068 ha and 17 591 ha year-1, respectively(SARH, 1981 and IBWC, 1980-1994). This represents a re-duction of 37% and is smaller than that reported for irriga-tion district 026 or lower Río San Juan, located in northeast-ern Mexico, in which the irrigated area was reduced by 46%in 1997 (CNA, 1997; Navar, 1999, 2001). The reduction islargest under the potential developments of the Mexicanwaters in the presence of a super-drought. In contrast to thearea irrigated under normal years (189 000 ha), 36% lessarea (121 000 ha) will be irrigated for the period of 2030-2045. That is, conserving water in the upper Río Bravo/RíoGrande basin in the Mexican side will diminish irrigationarea in the lower side of the Mexican Río Bravo/Río Grandewatershed.
At the present time, in a drought of record situation,Mexico cannot meet its obligations of the 1944 treaty, entitl-ing the United States of America to 350 000 acre-feet year-1
(432 Mm3 year-1) over a five-year average under normal cli-matic conditions from the Río Conchos, Río San Diego, RíoSan Rodrigo, Río Escondido, and Río Salado (Article 4 of
the 1944 Treaty). Although full development of the Mexi-can waters has net been taken place yet, the current dry spellaffecting northern Mexico has also reduced the size of agri-cultural lands. For the 2001, 0 ha were irrigated in the 025-irrigation district (El Norte, 2001). Heavy economic losses,social disruptions, and environmental degradation of aquaticecosystems are becoming major issues of concern in thewatershed and they will be magnified in the near future.
The future does not look promising either sinceMulholand et al., (1997) and the IPCC (2001), using gen-eral circulation models, predicted that northern Mexico, andspecifically, the Río Bravo/Río Grande belt may receive 10%less rainfall and generate between 5 to 10 % less streamflowwith increasing temperatures by global warming. Therefore,climate change may or probably is already magnifyingdrought in northern Mexico.
The present and likely future scenarios discussed abovesuggest the need for the sustainable management of waterresources in all sectors of the economy of the Mexican lowerRío Bravo watershed. High estimated per capita supply (405l per inhabitant per day) has to be diminished. In this line ofthought, the public sector must become more efficient inchanneling, distributing, and treating domestic, industrial,commercial, municipal, and public water supplies. There isincreasing evidence that volume loses in the water distribu-tion system of most cities can be as high as 30% (Data fromthe city of Reynosa, Mexico). Therefore, by tapping all lossesin the water distribution system of all cities of the Mexicanlower watershed, the area of irrigated lands would increasean additional average of 5, 8, and 11% for the time periodsof 1990-2004; 2010-2024; and 203-2044, respectively.
The use of treated municipal water for irrigation couldoffset any reduction of irrigated lands. This is a commonpractice in several semi-arid regions (i.e., the local plan ofthe San Juan watershed in northeastern Mexico). The fullutilization of treated municipal wastewater for irrigationwould account for an additional 32 000, 48 000, and 62 000ha year-1 for the time periods of 1990-2004; 2010-2024; 2030-2044, respectively. These additional irrigated areas wouldbring agricultural lands into the long-term annual averagesize. Several programs are underway in a joint venture be-tween United States and Mexico in the lower Río Bravo/RíoGrande basin. A joint agreement between USA and Mexicois already funding several projects in this line of recyclingwater or doubling productivity as stated by Postel (2000).
Agriculture has to become more efficient to reduce thevolume for irrigation when pursuing the sustainable man-agement of water resources in the Mexican Bajo Río Bravo/Río Grande. Irrigation is inefficient since it requires 2800m3 to produce 1 Mg of crop (Návar and Rodríguez-Téllez,
Fig. 7. The estimated average volume of water allotted for irriga-tion within the 025 irrigation district under the four scenarios.
503
Water supply and demand scenarios in the Mexican lower Río Bravo/Río Grande watershead
2002). It reflects heavy water losses in the conveyance sys-tem, application efficiency, and water use efficiency. Address-ing crop water requirements is critical in order to increasewater savings and irrigated land area (i.e., planting alfalfa orcotton would require 56 and 14% more volume of water than
planting maize). Thus, by using the same volume of water,56 and 14% more area would be planted with corn than byplanting alfalfa or cotton. Sorghum, a less water demandingcrop (10 and 25% less irrigated volume used than corn andcotton, respectively) is being preferentially planted in the
Fig. 8. Estimated irrigated land areas for maize and sorghum for four scenarios for average population growth, drought awareness publicdemand, and average industrial water use on the 025-irrigation district.
Normal Hydrological ConditionsDevelopment of Mexican watersSuperdroughtDevelopment of Mexican waters &superdrought
504
J. Návar
lower Río Bravo/Río Grande irrigation district because ofthe water shortages allotted for irrigation, resulting fromthe present drought spell. Other economic considerationsmust be considered when shifting crops in the 025-irriga-tion district.
The irrigation efficiency is classified in: (1) water con-veyance, (2) water application efficiency, and (3) water useefficiency. The main conveyance system has an efficiencyof 71%, the secondary drain system between 75-80%, andat the individual farms level the efficiency is 65% (SARH,1981). The overall estimated efficiency lies in the range of32 to 36% and by increasing it to a feasible range of 60%,the total irrigated land area would increase from 24 to 28%.The water application system in the irrigation district 025is conducted mainly by surface irrigation which has an av-erage efficiency of 70% (Schwab et al., 1981). The wateruse efficiency is also in the range of 60% because of thehigh water table (Reyes, 1986), with irrigation-excessdrained into the Río Bravo/Río Grande, as well as into theGulf of Mexico (CNA, 1998). Therefore, other irrigationtechnologies may also improve the water application effi-ciency and increase the area of irrigated lands.
The environmental services provided by streamflowof sufficient quality must be also addressed when allocat-ing water to other uses. The aquatic communities of plants,fish, insects and other organisms are already under stress inthe Río Bravo/Río Grande (Contreras and Lozano, 1994;Contreras and Edwards, 1998). Extinction of fish specieshas occurred in several tributaries of the Río Bravo/RíoGrande. Villareal (1983) pointed out that four fish species(Notropis stramineus, Notropis amabilis, Dionda episcopa,and Campostoma anomalum) had become extinct due todramatic increases in the salinity and alkalinity of the river.Villareal et al., (1986) and Obregón (1987) also reportedthe bio-accumulation of Zn and Fe in two fish species(Poecilia formosa and Cichalosoma cyanoguttatum) in theRío Santa Catarina, and bio-accumulation of Pb, Fe and Cuin four fish species (Astyanax mexicanus, Notropis braytoni,Notropis jemezanus, and Cichlasoma cianoguttatum).Guerra (2000) found evidence that the diversity–abundanceof the fish community is sensitive to pollution of the RíoSan Juan of Nuevo León, Mexico.
The benefits of conducting sustainable managementof water resources in the Mexican Bajo Río Bravo/RíoGrande watershed comply with the expectations of society.However, several aspects of sustainability must be consid-ered. The UNCED (1992) and Schmandt et al., (1998; 2000)discussed the need of the promotion of an interactive, itera-tive and multisectorial approach, the planning for the ratio-nal utilization, protection, conservation, and managementof water resources, the design, implementation and evalua-tion of projects and programs that are economically effi-
cient and socially appropriate, and (4) the identification andstrengthening or development the appropriate institutional,legal and financial mechanisms. These are some issues thatmust be explored in coming research papers on water andsustainable development in the Bajo Río Bravo/Río Grande.
BIBLIOGRAPHY
AGUILAR, B. I. and A. L. CHAPA, 1998. Socio-economyof the lower Río Grande/Bravo. HARC-ITESM JointResearch Project on Water and Sustainable Developmentin the Binational Lower Río Grande/Río Bravo Basin.ITESM, Monterrey, N. L. Mexico.
CENTRO DE ESTUDIOS FRONTERIZOS Y LAPROMOCIÓN DE DERECHOS HUMANOS,CEFPRODHAC, 1998. Reportaje: Una presa financiadapor el BID suscita una disputa sobre derechos acuíferos.p6.
CHAPMAN, K., 2000. Growth at any cost? Texas Centerfor policy Studies. University of Texas, Austin, TX.
CNA, 1994. Consejo de Cuenca del Río Bravo. ComisiónNacional del Agua. CNA, Región Noreste. México, D.F.
CNA, 1997. Datos climáticos de los municipios fronterizos.Gerencia Estatal Tamaulipas, Cd. Victoria, Tamps.,Mexico.
CONAPO, 1996. Estimaciones y proyecciones de lapoblación. Consejo Nacional de Población, México, D.F.
CONTRERAS, B. S. and V. M. L. LOZANO, 1994. Water,endangered fishes, and development perspectives in aridlands of Mexico. Conservation Biology 8, 379 387.
DOORENBOS, J. and A. H. KASSAM, 1979. Yield re-sponses to water. Food and Agriculture Organization ofthe United Nations, Rome, Italy.
EDWARDS, R. J. and B. S. CONTRERAS, 1998. Ecologi-cal conditions in the Lower Río Grande/Río Bravo val-ley study area and projections for the future. HARC-ITESM Joint Reserach Project on Water and Sustain-able Development in the Binational Lower Río Grande/Río Bravo Basin. ITESM, Monterrey, N.L. México.
EL NORTE 22/01/2001. Señalan inequidad en reparto deagua. Reporte escrito por Miguel Domínguez. Monterrey,N.L., México.
505
Water supply and demand scenarios in the Mexican lower Río Bravo/Río Grande watershead
ENVIRONMENTAL RESOURCES LIMITED ERL, 1991.Plan de manejo de los embalses de la cuenca del RíoSan Juan. Comisión de Comunidades Europeas. Madrid,España. 72 p.
HARE, K., 1983. Climate and desertification. World ClimateProgram. WCP-44. UNEP. 149 pp.
IBWC, 1980-1993. Boletines Hidrométricos. Escurrimientosdel Río Bravo y Datos Conexos. Secretaría de RelacionesExteriores. México, D.F.
INEGI, 1995. Anuario estadístico de Tamaulipas. InstitutoNacional de Estadística, Geografía e Informática yGobierno del Estado de Tamaulipas. Cd. Victoria,Tamps., México.
INEGI, 1996. Anuario estadístico de Tamaulipas. InstitutoNacional de Estadística Geografía e Informática yGobierno del Estado de Tamaulipas. Cd. Victoria,Tamps., México.
INEGI, 1997. Anuario estadístico de Tamaulipas. InstitutoNacional de Estadística Geografía e Informática yGobierno del Estado de Tamaulipas. Cd. Victoria, Tamps,México.
INTERNATIONAL BOUNDARY WATER COMMISSION,1980-1994. Hydrologic bulletins of the Río Bravo/RíoGrande.
IPCC, Intergovernmental Panel on Climate Change. 2001.Impacts, adaptation, and vulnerability. Summary forPolicy Makers. Cambridge University Press. Cambridge,UK. 17 pp.
KLEEBERG, H.-B. and G. K. WEISSGERBER, 1996. Man-agement of irrigation in semi-arid regions. Natural Re-sources and Development 40, 113-125.
NÁVAR, J., 1998. Water demand and supply in the Mexicanportion of the lower Río Grande/Río Bravo watershed.HARC-ITESM Joint Reserach Project on Water and Sus-tainable Development in the Binational Lower RíoGrande/Río Bravo Basin. ITESM, Monterrey, N. L.Mexico.
NÁVAR, J., 2001. Water supply and demand scenarios inthe San Juan Watershed. Geofís. Int., 40, 121-134.
NÁVAR, J. and E. RODRÍGUEZ-TELLEZ, 2002.Caracterización de las superficies agrícolas y sus
volúmenes de irrigación en la cuenca del río San Juan,Mexico. Investigaciones Geográficas 47, 77-91.
NOLASCO, M., 1989. Los Municipios de las Fronteras deMéxico. Centro de Ecodesarrollo. Centro Nacional deDesarrollo Municipal. México, D.F.
OBREGÓN , M. A., 1987. Bioacumulación de Pb, Cu, y Feen Astyanax mexicanus, Notropis braytoni, Notropisjemezanus y Cichlasoma cyanoguttatus, en el Río SanJuan, provincia del Río Bravo, Noreste de México. Tesisinédita. Facultad de Ciencias Biológicas, UniversidadAutónoma de Nuevo León. San Nicolás de los GarzaN. L.
POSTEL, L.S., 2000. Entering an era of water scarcity: thechallenges ahead. Ecological Applications 10 (4), 941-948.
REYES, M. R., 1986. Estudios freatimétricos antes y despuésde la rehabilitación del distrito de riego No 25, unidadcontrol. Tesis Profesional. Universidad AutónomaChapingo, México.
SARH, 1978. Estudio sobre el aprovechamiento deexcedentes del Río Bravo, Coahuila, Nuevo León yTamaulipas. Infraestructura, Recursos y Servicios.México, D.F.
SARH, 1981. Rehabilitación de los distritos de riego delBajo Río Bravo (25) y del Río San Juan (26), Tamps.Resúmen. Infraestructura, Recursos y Servicios.México, D.F.
SARH-CNA, 1991. Distrito de riego No 026 B.R.S.J.organización e infraestructura. Unidad de Informacióny Participación Ciudadana. Cd. Gustavo Díaz Ordaz,Tamps. México.
SARH-SEP, 1989. El agua y la sociedad en el mundo, enMéxico y en Nuevo León. Instituto de Tecnología delAgua, IMTA, Cuernavaca, Morelos, México.
SCHMANDT, J., C. STOLP and G. WARD, 1998. Scarcewater: doing more with less in the lower Río Grande.US-Mexican Policy Studies Program. Policy Report No.8. The University of Texas, Austin, TX.
SCHMANDT, J., I. AGUILAR, N. ARMSTRONG, L.CHAPA, S. CONTRERAS, R. EDWARDS, J.HAZELTON, M. MATHIS, J. NÁVAR, E. VOGEL andG. WARD, 2000. Water and sustainable development.
506
J. Návar
Executive Summary. EPA research Agreement R824799-01-0. March 31, 2000.
SCHMITT, T. G., 1997. Water protection human beings atriangular relationships in changing times. Appl. Geogr.Develop., 59-78.
SOLEY, W. B., R. R. PIERCE and H. A. PERLMAN, 1998.Estimated use of water in the United States in 1995. U.S.Geological Survey Circular No 1200.
SCHWAB, G. O., R. K. FREVERT, T. W. EDMINSTER andK. K. BARNES, 1981. Soil Conservation and Engineer-ing. Third Edition. John Wiley and Sons. New York.
UNCED, 1992. United Nations Conference on Environmentand Development, Agenda 21, Chapter 18, sections 8and 9. Rio de Janeiro, Brazil.
VOGEL, E. and N. E. ARMSTRONG, 1997. Water qualityin the lower Río Grande/Río Bravo. HARC-ITESM JointReserach Project on Water and Sustainable Development
in the Binational Lower Río Grande/Río Bravo Basin.ITESM, Monterrey, N.L. Mexico.
WARD, G., 1988. Water supply in the US side of the LowerRío Bravo/Río Grande watershed. HARC-ITESM JointReserach Project on Water and Sustainable Developmentin the Binational Lower Río Grande/Río Bravo Basin.ITESM, Monterrey, N.L. Mexico.
WARD, G., 2000. Water and sustainable development. Ex-ecutive Summary. EPA research Agreement R 824799-01-0. March 31, 2000.
WITHERS, B. and S. VIPOND, 1986. El Riego: Diseño yPráctica. 5a Impresión. Editorial Diana. México, D.F.
_____________
José Návar1 Professor of Forestry and Watershed ManagementFacultad de Ciencias Forestales, 67700 UANL,Linares, N.L., México.Tels (821-24895), (821-21817) Fax (821-24251)Email: [email protected]