water quality improvement using rain gardens: university of maryland … · 2015-01-26 · rain...
TRANSCRIPT
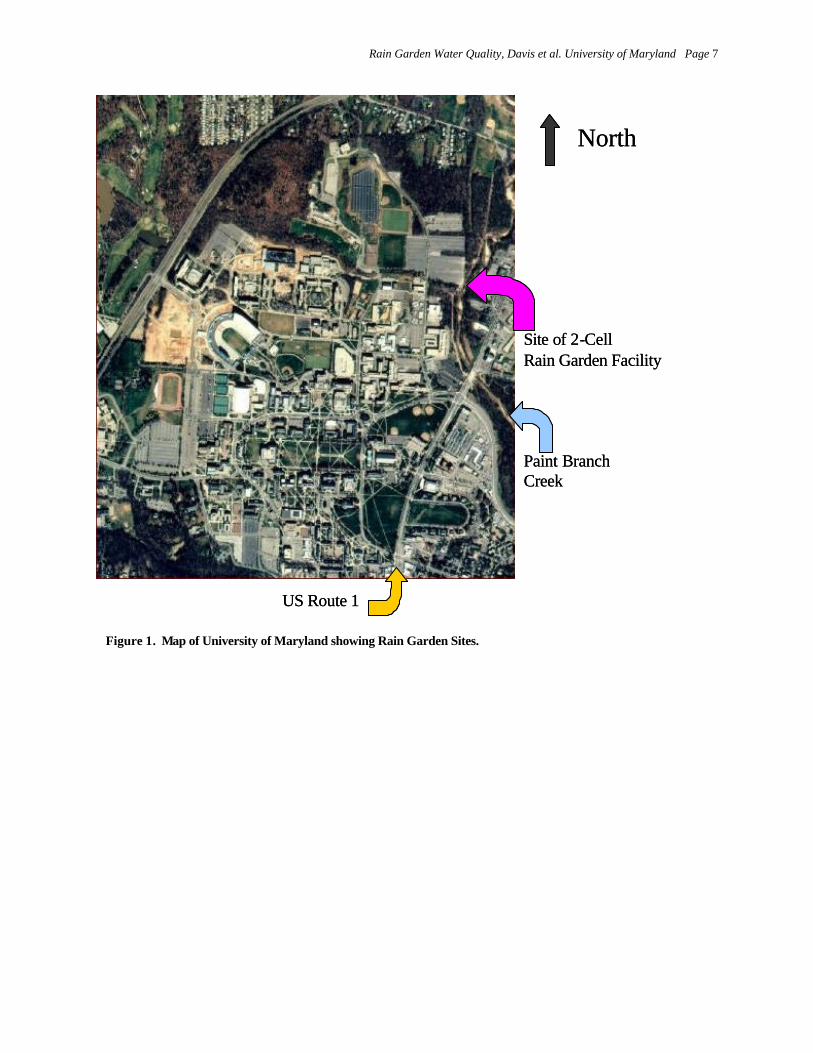
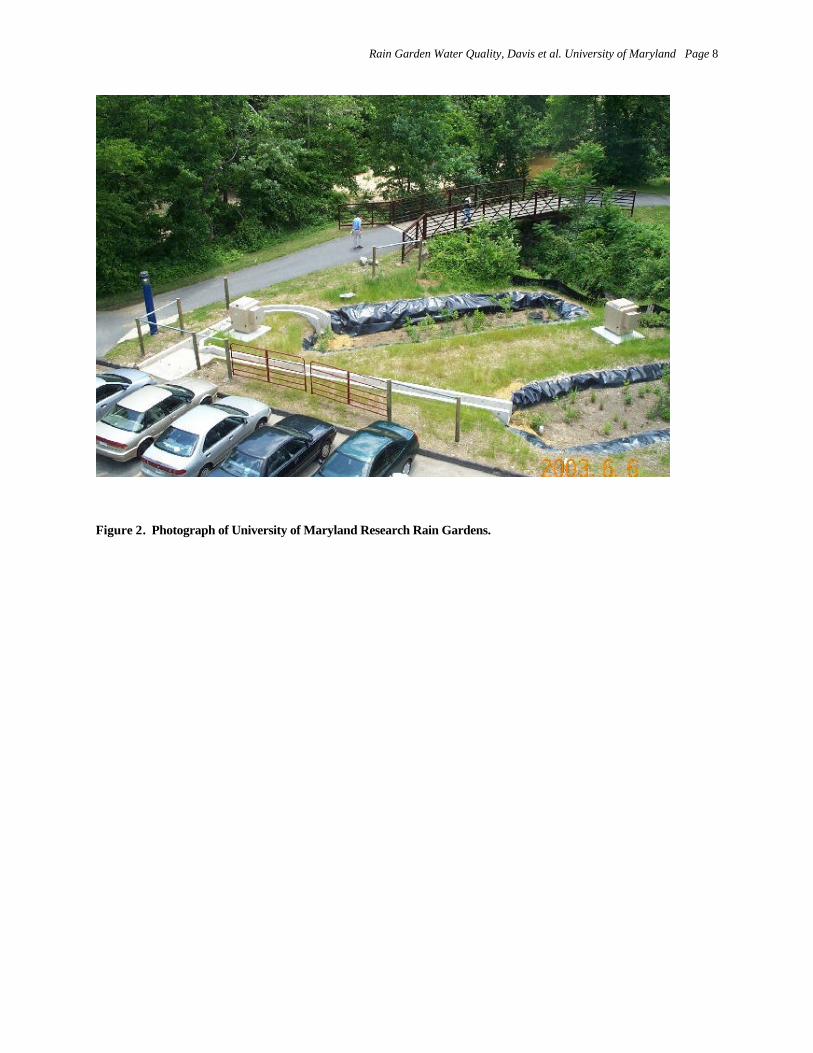
WATER QUALITY IMPROVEMENT USING RAIN GARDENS: UNIVERSITY OF MARYLAND STUDIES Allen P. Davis, Rebecca Stack, Patrick Kangas, J. Scott Angle Maryland Water Resources Research Center University of Maryland College Park, Maryland 20742 Introduction In Fall 2001, a project was initiated to construct two rain gardens (also known as bioretention cells) on the University of Maryland campus. Rain gardens are part of the low impact development (LID) paradigm for storm water management that is rapidly becoming recognized as the state-of-the-art by environmental managers and regulators responsible for watershed protection. LID concepts have evolved over time and are now beginning to receive wide acceptance. Rain garden/bioretention facilities consist of a porous soil or similar media mixture covered with a thin (3-8 cm) layer of standard hardwood mulch. Various grasses, shrubs, and small trees are established to promote evapotranspiration, maintain soil porosity, encourage biological activity, and promote uptake of some pollutants. Storm water runoff is directed into the facility, allowed to pool, and infiltrates through the plant/mulch/soil environment, providing the treatment. Basically, the intention is to create an engineered terrestrial ecosystem which has significant aesthetic value through the use of plants and landscaping that are both attractive and functional, along with a constructed soil/media profile. Numerous completed and ongoing studies at the University of Maryland have suggested that bioretention is very effective in reducing pollutant levels from runoff (Davis et al. 2001, 2003, submitted, Hsieh and Davis submitted). Methodology Bioretention Cells. Two parallel bioretention cells were constructed in 2003 on the University of Maryland campus to capture and treat storm water runoff from a half-acre asphalt parking area. This area is near the confluence of Campus Creek with Paint Branch (Figure 1). This parking area is very active and runoff from this lot previously traveled as sheet flow through a small grass/forest area into the creeks. An asphalt curb was constructed along the perimeter of the parking lot to funnel the sheet flow to the corner of the lot. The cells have a rectangular surface area, each approximately 30 square meters (Figures 2 and 3). One cell (the shallow cell) is constructed according to the standard design outlined in the Bioretention Design Manual (Prince George’s County 2001). The second cell incorporates an experimental anoxic zone at the bottom to promote denitrification of runoff that passes through the cell (the deep cell). Laboratory studies have demonstrated that such anoxic cells, seeded with shredded newspapers, can be very effective in promoting denitrification of infiltrating water (Kim et al. 2003). The primary media in each cell consists of an engineered soil mix of organic sandy loam with a clay content of less
Rain Garden Water Quality, Davis et al. University of Maryland Page 2
than 10%, based on current design manual recommendation (Prince George’s County 2001). Small gravel is packed around the underdrain system that is also wrapped in a non-woven geo-textile to prevent clogging in the perforated pipe. The surface of each cell received approximately 8 cm of rough shredded hardwood mulch, also based on current design manual recommendation. In the deep cell, the anaerobic sump was filled with a sand and newspaper mix. Plantings in both cells were selected from the Prince George’s County Bioretention Design Manual list based on local nursery availability. Preference was given to those shrubs and herbaceous plants that were observed to be successful in existing bioretention facilities throughout Prince George’s County. The planting scheme aimed for high species diversity; trees were not included. Plantings were identical between cells both in planting location and species composition with one notable exception. A zinc hyperaccumulator, Thlaspi sp., was included at the front of the deep cell in an array of ten by five. The total depth in each cell is 0.9 meters (without anoxic sump) and 1.2 meters (with sump) respectively. Both cells have been lined with a polypropylene linear to minimize migration of water into or out of the system. A 15-cm perforated plastic pipe runs the length of each cell, below the media, to collect and convey infiltrated water to Campus Creek. The parking lot flow enters a concrete splitter box where the flow is equally divided. One stream passes through a flume for flow measurement, using a 6-inch (15-cm) Tracom parshall flume, and water quality sampling. The flows then enter the two cells. The cells outfalls are outfitted with two 12-inch (30-cm) Thelmar plug-in weirs for flow measurement. Bubble flow meters (ISCO 4230/3230) are positioned at each flow measurement device to record inflow and outflow rates throughout the duration of a storm event. Sample Collection and Analysis. Automatic storm water samplers (ISCO FR3700) are triggered by the flow meters based on preset flow rates and samples are subsequently collected at prescribed time intervals. Storm water samplers are outfitted with 1-L polypropylene bottles to collect 12 samples over a programmed set of unequal times. The sampling time sequence is 0, 15, 30, 45 60, 90, 120, 150, 180, 240, 300, and 360 minutes. The inflow-sampling event is triggered by flows exceeding 0.01 cfs (0.28 L/s). The outflow-sampling events are triggered by flows exceeding 0.008 cfs (0.23 L/s). These set points are chosen as the minimum limitations of the equipment to capture the widest range of storm frequencies that may occur. Samples are collected within 24 hours and transported to the Biological Resources Engineering Laboratory, University of Maryland where they are split, preserved, and refrigerated according to Standard Methods (APHA et al. 1995) required for each constituent to be tested. Latex gloves are worn at all times during sample handling and analysis. Bottles and glassware are acid washed. Deionized water is used in all washing and testing procedures. A field blank is carried through all analyses on each sampling event. A standards check is preformed for every ten samples analyzed. Pollutants investigated include Total Suspended Solids (TSS), Total Phosphorus (TP), nitrate (NO3), and total lead, copper and zinc.
Rain Garden Water Quality, Davis et al. University of Maryland Page 3
Samples for nitrate analysis are filtered and analyzed via ion chromatography (Dionex DX-100) within 24 hours of sampling. Testing for TSS follows standard glass-fiber filtering, weighing and drying procedures recommended in Section 2540D (APHA et al. 1995). The detection limit is 0.01mg/L. Samples for total phosphorus analysis are digested by the persulfate method to release all phosphorous as orthophosphate. Following Standard Methods (APHA et al. 1995), digested samples analyzed via spectrophotometry (HACH DR4000) with a detection limit of 0.01 mg/L. Metals samples (Pb, Zn, Cu) are acidified with trace metal grade HNO3 and digested. Subsequently, they are filtered and analyzed using known standards (Fisher Chemical) via atomic absorption spectrophotometry (Perkin Elmer Model 5100ZC). The Standard Method 3111 flame mode is followed for zinc (detection limit of 30 µg/L) and the Standard Method 3110 furnace mode is followed for copper and lead (detection limit of 1µg/L) (APHA et al. 1995). The Event Mean Concentration (EMC) characterizes pollutant concentrations as a flow-weighted average, and is calculated as:
∑
∑
=
=
∆
∆==
d
d
t
i
t
i
tQ
tQCEMC
1
1
Volume Runoff TotalMassPollutant Total
(1)
Here, Q is the flow rate, C is the pollutant concentration, and ∆t is the sample time increment. Each summation is over the event duration. Pollutant removal efficiency is calculated as:
EMC efficiency (%) = [(Concin – Concout)/Concin]*100 (2)
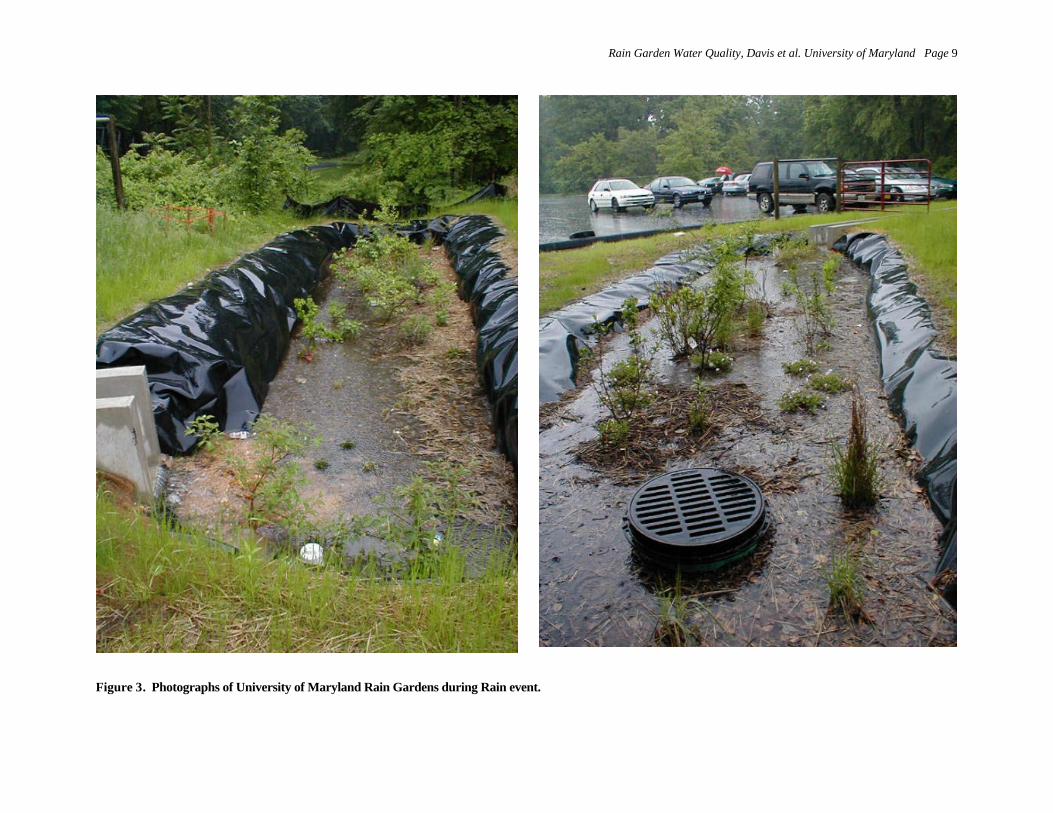
Where Concin is the EMC at inflow and Concout is the EMC at outflow Results Hydrology Data. The inflow and outflow behavior of the University of Maryland rain gardens has been characterized to date with twelve discrete rain events. These events range in storm duration from eight to sixty hours. The rain events recorded range in total inflow volume from 1000 to 8000 ft3 (28 to 226 m3) delivered to each cell. When dry antecedent conditions exist prior to a rain event, outflows typically release around 10% of the inflow by the end of the storm event. The cells can take up to two weeks to release all the stored runoff. When prior conditions were wet, the cells released anywhere from 10% to 70% of the inflow by the end of the event. Times to peak flow and value of peak flow were measured, along with ratios of input-to-output parameter values. In general, the rain gardens were effective in moderating the flow. On average, the delay of the peak flow leaving the deep cell was 4.0 times that of the input and the output value of the peak was 46% of the input. Similar analysis for the shallow cell demonstrates a delay factor of 3.4 and a peak flow of 83%. As expected, the rain gardens reduced and delayed the flow peak coming from the parking lot. Nevertheless, some variability

Rain Garden Water Quality, Davis et al. University of Maryland Page 4
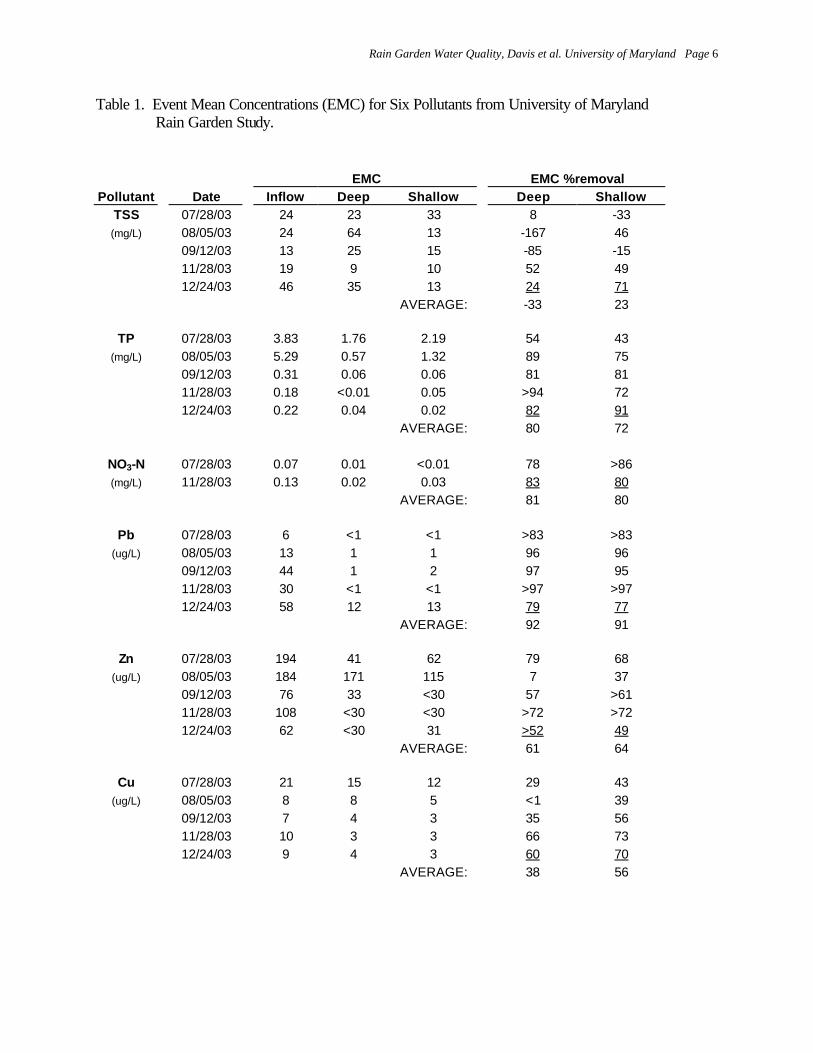
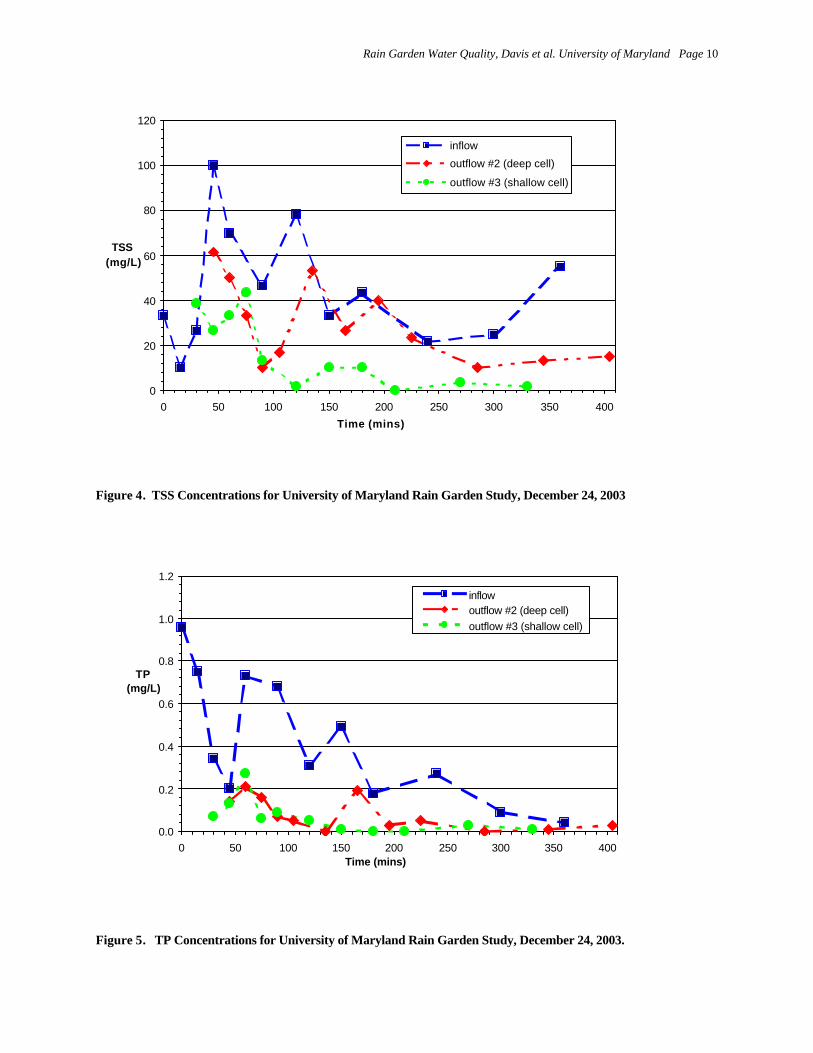
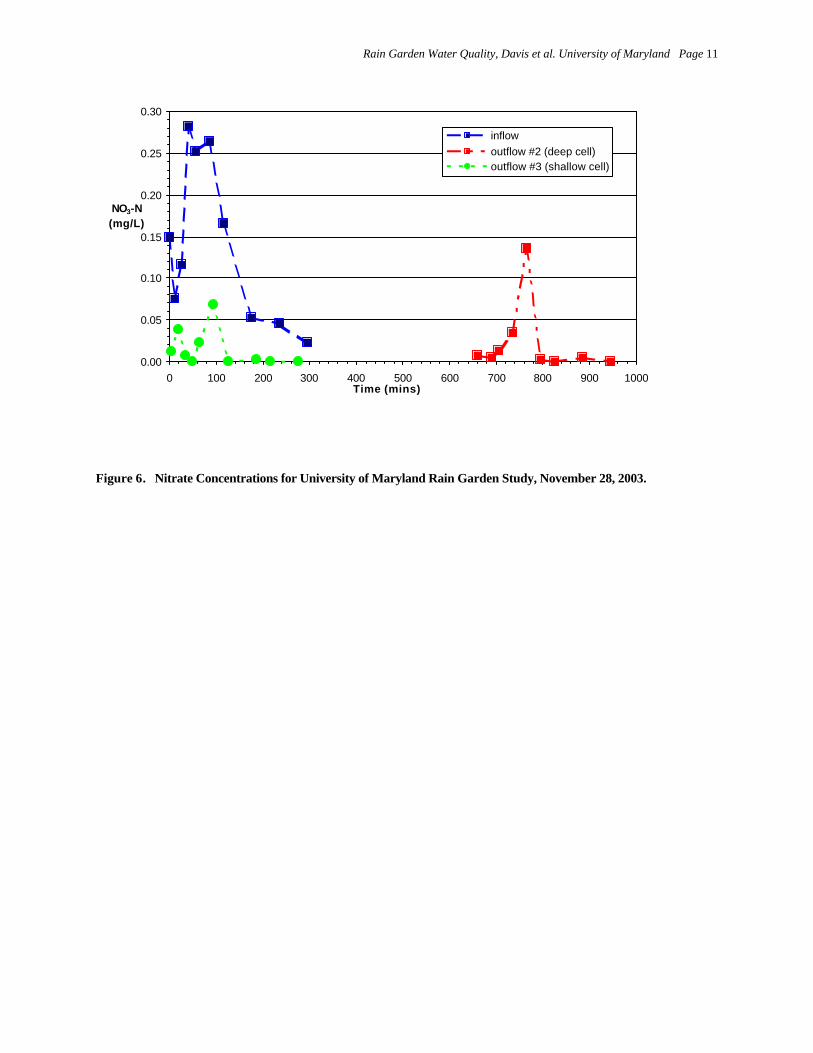
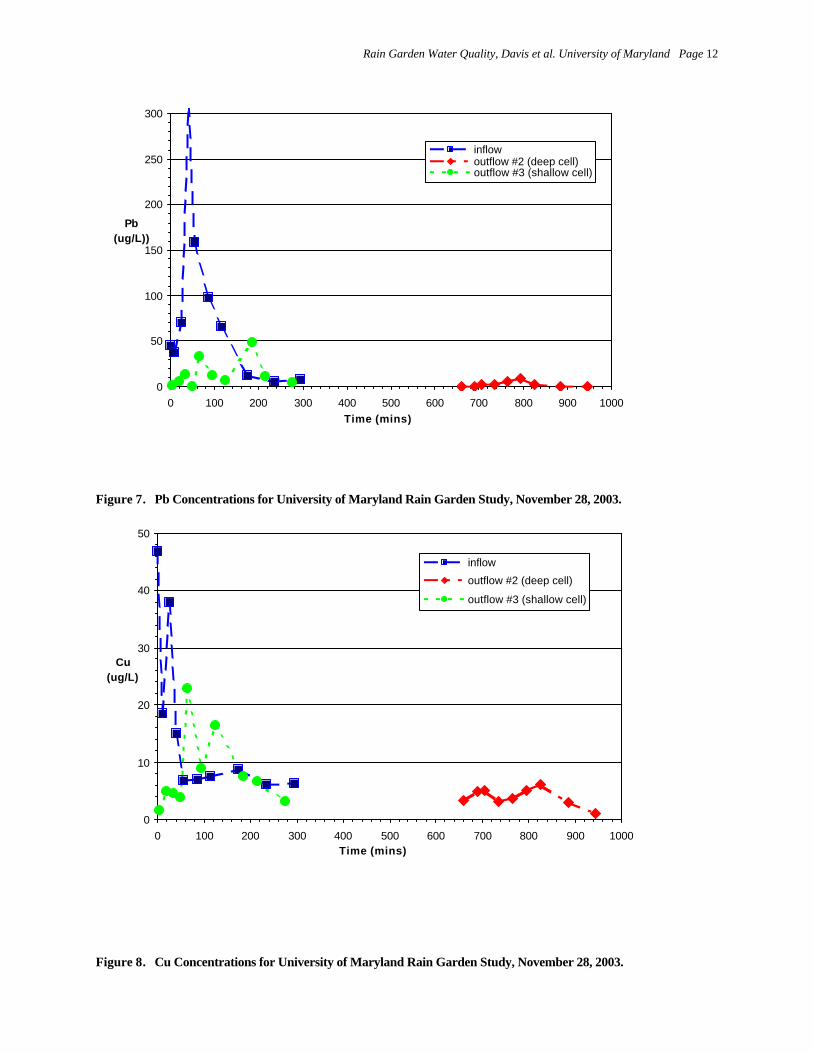
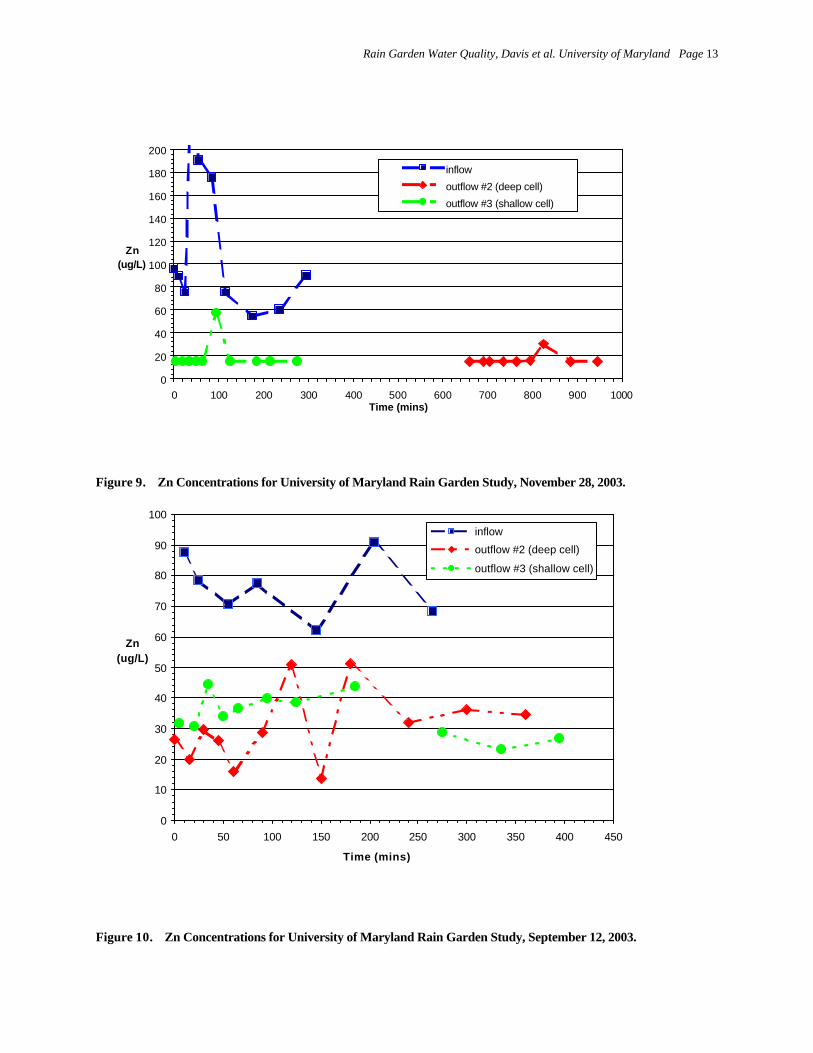
was demonstrated in all of these parameters. In fact, on one occasion for each cell, the peak in the output flow occurred before that of the input. Also, on three events for the shallow cell, the output peak flow was greater than the input. These unexpected results apparently arise due to flows combining from antecedent conditions. Frequent and extreme rains occurred in Fall 2003 and output flows from the rain gardens continued for several days after a precipitation event. When another event came within a few days, the peak would be added to the residual flows. More monitoring is necessary to separate these factors. Water Quality Data. Water quality data are available for five storm events. Figures 4-11 show pollutant concentrations measured during storm events from September 12, 2003 (Zn), November 28, 2003 (NO3-N, Cu, Pb), and December 24, 2003 (TSS, TP). Input concentrations are presented, as well as output concentrations for both cells. In all cases, reductions in pollutant concentrations are noted. Data for EMCs for the 5 events are presented in Table 1. Removal efficiencies based on EMC calculations for TP average 80% for the deep cell and 72% for the shallow cell. For both cells the removal efficiency results suggest some improvement with time. Zinc removal rates varied greatly but been as high as 79%. Nitrate removal rates are over 78% (note small sample size though). Further sampling and analysis is required to evaluate the design differences between cells with respect to the anoxic denitrification chamber. Lead removal rates average above 90%. Copper removal rates appear to improve over time for both cells. Overall, heavy metal removals are excellent and phosphorus and nitrate removals are good. These results are similar to those found in laboratory and controlled-field study bioretention experiments (Davis et al. 2001, 2003, submitted, Hsieh and Davis submitted). TSS removal rates have varied significantly between the cells and the events over the first year of operation. Both cells have exported TSS during more than one event but removal efficiencies in both cells suggest an improving trend over time. This apparently results from the soil media in the cells becoming stabilized, as initially some washout will occur. Acknowledgment and Disclaimer The construction and rain garden monitoring is supported by the Prince George’s County (MD) Department of Environmental Resources. The results presented in this document are preliminary and part of several ongoing research projects at the University of Maryland. These data are not intended for public release at this time.
Rain Garden Water Quality, Davis et al. University of Maryland Page 5
References APHA, AWWA, and WPCF. 1995. Standard Methods for the Examination of Water and Wastewater, 19th Ed. Washington, D.C. Davis, A.P., Shokouhian, M., Sharma, H. and Minami, C. (2001) “Laboratory Study of Biological Retention (Bioretention) for Urban Storm Water Management,” Water Env. Res., 73(1), 5-14. Davis, A.P., Shokouhian, M., Sharma, H., Minami, C., and Winogradoff, D. “Water Quality Improvement through Bioretention: Lead, Copper, and Zinc,” Water Environ. Res., 75(1), 73-82 (2003). Davis, A.P., Shokouhian, M., Sharma, H., and Minami, C. “Water Quality Improvement through Bioretention: Nitrogen and Phosphorus Removal,” Water Environ. Res., submitted, 2003. Hsieh, C.-h and Davis, A.P. “Evaluation and Optimization of Bioretention Media for Treatment of Urban Storm Water Runoff,” J. Environ. Engg., ASCE, submitted, 2003. Kim, H., Seagren, E.A., and Davis, A.P. “Engineered Bioretention for Removal of Nitrate from Stormwater Runoff,” Water Environ. Res., 75(4), 355-367 (2003). Prince George’s County “The Bioretention Manual,” Programs & Planning Division, Department of Environmental Resources, Prince George’s County, Maryland, November 2001.
Rain Garden Water Quality, Davis et al. University of Maryland Page 6
Table 1. Event Mean Concentrations (EMC) for Six Pollutants from University of Maryland Rain Garden Study.
EMC EMC %removal
Pollutant Date Inflow Deep Shallow Deep Shallow TSS 07/28/03 24 23 33 8 -33 (mg/L) 08/05/03 24 64 13 -167 46
09/12/03 13 25 15 -85 -15 11/28/03 19 9 10 52 49 12/24/03 46 35 13 24 71 AVERAGE: -33 23
TP 07/28/03 3.83 1.76 2.19 54 43 (mg/L) 08/05/03 5.29 0.57 1.32 89 75
09/12/03 0.31 0.06 0.06 81 81 11/28/03 0.18 <0.01 0.05 >94 72 12/24/03 0.22 0.04 0.02 82 91 AVERAGE: 80 72
NO3-N 07/28/03 0.07 0.01 <0.01 78 >86 (mg/L) 11/28/03 0.13 0.02 0.03 83 80
AVERAGE: 81 80
Pb 07/28/03 6 <1 <1 >83 >83 (ug/L) 08/05/03 13 1 1 96 96
09/12/03 44 1 2 97 95 11/28/03 30 <1 <1 >97 >97 12/24/03 58 12 13 79 77 AVERAGE: 92 91
Zn 07/28/03 194 41 62 79 68 (ug/L) 08/05/03 184 171 115 7 37
09/12/03 76 33 <30 57 >61 11/28/03 108 <30 <30 >72 >72 12/24/03 62 <30 31 >52 49 AVERAGE: 61 64
Cu 07/28/03 21 15 12 29 43 (ug/L) 08/05/03 8 8 5 <1 39
09/12/03 7 4 3 35 56 11/28/03 10 3 3 66 73 12/24/03 9 4 3 60 70 AVERAGE: 38 56
Rain Garden Water Quality, Davis et al. University of Maryland Page 7
Site of 2-Cell Rain Garden Facility
North
US Route 1
Paint Branch Creek
Site of 2-Cell Rain Garden Facility
North
US Route 1
Paint Branch Creek
Figure 1. Map of University of Maryland showing Rain Garden Sites.
Rain Garden Water Quality, Davis et al. University of Maryland Page 8
Figure 2. Photograph of University of Maryland Research Rain Gardens.
Rain Garden Water Quality, Davis et al. University of Maryland Page 9
Figure 3. Photographs of University of Maryland Rain Gardens during Rain event.
Rain Garden Water Quality, Davis et al. University of Maryland Page 10
0
20
40
60
80
100
120
0 50 100 150 200 250 300 350 400
Time (mins)
TSS (mg/L)
inflow
outflow #2 (deep cell)
outflow #3 (shallow cell)
Figure 4. TSS Concentrations for University of Maryland Rain Garden Study, December 24, 2003
0.0
0.2
0.4
0.6
0.8
1.0
1.2
0 50 100 150 200 250 300 350 400Time (mins)
TP (mg/L)
inflowoutflow #2 (deep cell)outflow #3 (shallow cell)
Figure 5. TP Concentrations for University of Maryland Rain Garden Study, December 24, 2003.
Rain Garden Water Quality, Davis et al. University of Maryland Page 11
0.00
0.05
0.10
0.15
0.20
0.25
0.30
0 100 200 300 400 500 600 700 800 900 1000Time (mins)
NO3-N(mg/L)
inflowoutflow #2 (deep cell)outflow #3 (shallow cell)
Figure 6. Nitrate Concentrations for University of Maryland Rain Garden Study, November 28, 2003.
Rain Garden Water Quality, Davis et al. University of Maryland Page 12
0
50
100
150
200
250
300
0 100 200 300 400 500 600 700 800 900 1000Time (mins)
Pb(ug/L))
inflowoutflow #2 (deep cell)outflow #3 (shallow cell)
Figure 7. Pb Concentrations for University of Maryland Rain Garden Study, November 28, 2003.
0
10
20
30
40
50
0 100 200 300 400 500 600 700 800 900 1000Time (mins)
Cu(ug/L)
inflow
outflow #2 (deep cell)
outflow #3 (shallow cell)
Figure 8. Cu Concentrations for University of Maryland Rain Garden Study, November 28, 2003.
Rain Garden Water Quality, Davis et al. University of Maryland Page 13
0
20
40
60
80
100
120
140
160
180
200
0 100 200 300 400 500 600 700 800 900 1000Time (mins)
Zn(ug/L)
inflow
outflow #2 (deep cell)
outflow #3 (shallow cell)
Figure 9. Zn Concentrations for University of Maryland Rain Garden Study, November 28, 2003.
0
10
20
30
40
50
60
70
80
90
100
0 50 100 150 200 250 300 350 400 450
Time (mins)
Zn(ug/L)
inflow
outflow #2 (deep cell)
outflow #3 (shallow cell)
Figure 10. Zn Concentrations for University of Maryland Rain Garden Study, September 12, 2003.