water quality and restoration in a coastal subdivision stormwater pond
TRANSCRIPT
ARTICLE IN PRESS
0301-4797/$ - se
doi:10.1016/j.je
�CorrespondE-mail addr
marie.delorenzo
Journal of Environmental Management 88 (2008) 43–52
www.elsevier.com/locate/jenvman
Water quality and restoration in a coastal subdivision stormwater pond
Lorimar Serranoa,b, Marie E. DeLorenzoa,�
aNOAA, National Ocean Service, 219 Fort Johnson Road, Charleston, SC 29412, USAbCollege of Charleston, 205 Fort Johnson Road, Charleston, SC 29412, USA
Received 26 June 2006; received in revised form 19 January 2007; accepted 26 January 2007
Available online 21 March 2007
Abstract
Stormwater ponds are commonly used in residential and commercial areas to control flooding. The accumulation of urban
contaminants in stormwater ponds can lead to a number of water quality problems including high nutrient, chemical contaminant, and
bacterial levels. This study examined the interaction between land use and coastal pond water quality in a South Carolina residential
subdivision pond. Eutrophic levels of chlorophyll and phosphorus were present in all seasons. Harmful cyanobacterial blooms were
prevalent during the summer months. Microcystin toxin and fecal coliform bacteria levels were measured that exceeded health and safety
standards. Low concentrations of herbicides (atrazine and 2,4-D) were also detected during summer months. Drainage from the
stormwater pond may transport contaminants into the adjacent tidal creek and estuary. A survey of residents within the pond’s
watershed indicated poor pet waste management and frequent use of fertilizers and pesticides as possible contamination sources.
Educational and outreach activities were provided to community members to create an awareness of the water quality conditions in the
pond. Pond management strategies were then recommended, and selected mitigation actions were implemented. Water quality problems
identified in this study have been observed in other coastal stormwater ponds of varying size and salinity, leading this project to serve as a
potential model for coastal stormwater pond management.
r 2007 Elsevier Ltd. All rights reserved.
Keywords: Stormwater pond; Coastal water quality; Public outreach; Management strategies
1. Introduction
Stormwater pond density has been increasing withcoastal development. A 1999 survey identified 7309 pondswithin the SC coastal zone (inland approximately to thelevel of river tidal influence), which represented anapproximately 65% increase in the number of pondsduring 5 years (USES, 2004). Stormwater ponds are usedto receive runoff from residential and commercial areas,thereby collecting non-point source contaminants andcontrolling flooding. Pollutants discharged into the pondsystem are removed from the water column via sedimentdeposition or by biological uptake (Novotny, 1995).Regulations for the design of SC stormwater ponds includea minimum of 80% sediment removal during construction,specific runoff rates for storm events, and a minimum ‘‘first
e front matter r 2007 Elsevier Ltd. All rights reserved.
nvman.2007.01.025
ing author. Tel.: +1843 762 8515; fax: +1 843 762 8700.
esses: [email protected] (L. Serrano),
@noaa.gov (M.E. DeLorenzo).
flush’’ retention (SCDHEC, 2003). The majority of theretention ponds in the SC coastal zone have tidal exchangewith the estuarine environment (Lewitus et al., 2003).Low water circulation and high pollutant loading from
urban areas have contributed to a number of water qualityproblems in stormwater ponds (Novotny, 1995). Watereutrophication can be induced by runoff after fertilizerapplications, fecal material input, and additional urbanrunoff from domestic wastewater and driveways (Brickeret al., 1999; WHO, 1999). High nutrient levels can lead toexcessive algal growth (e.g. Glibert et al., 2001) and thepotential development of toxic algal blooms. In freshwaterand brackish systems, toxins are most commonly producedby cyanobacterial species (Onodera et al., 1997; Vieiraet al., 2005; Watanabe et al., 1995). The hepatotoxin,microcystin, is produced by several cyanobacterial speciesof the genera Microcystis, Anabaena, Nostoc, and Oscilla-
toria and represents a concern to human, wildlife, and pethealth (Freitas de Magalhaes et al., 2001; WHO, 1999).Exposure to microcystin can be through oral and dermal
ARTICLE IN PRESSL. Serrano, M.E. DeLorenzo / Journal of Environmental Management 88 (2008) 43–5244
exposure to contaminated water (Balmer-Hanchey et al.,2003; Van Dolah et al., 2001; WHO, 1999).
High bacterial levels can lead to a second health concernin coastal pond systems. Sources of fecal coliform bacteria(FCB) in a watershed include wastewater discharges, septictank leaks, agricultural or stormwater runoff, wildlife anddomestic animal waste (An et al., 2002; Novotny, 1995;Ritter et al., 2002). FCB have been used as an indicator ofpathogens associated with fecal waste such as Escherichia
coli, Salmonella sp., Streptococcus sp., cholera, hepatitis,and typhoid, which can negatively impact human health(Feldman et al., 2002; Mawdsley et al., 1995; Yoder et al.,2004). Similar to their effect on algal growth, nutrients caninduce bacterial outbreaks which can pose a risk to thehealth of the pond system and its recreational uses(Feldman et al., 2002; Yoder et al., 2004).
Chemical contaminants entering stormwater ponds (e.g.pesticides, PAHs, and metals) may cause direct toxicity toaquatic organisms or indirect effects such as bioaccumula-tion and trophic transfer (e.g. Baier-Anderson andAnderson, 2000; DeLorenzo and Serrano, 2003; Mooreet al., 1998; Phyu et al., 2006). Besides fertilizers, pesticidesare the dominant class of chemicals used in home and lawnmaintenance. These can reach stormwater ponds via runofffrom urban areas (e.g. golf courses and residential lawns)after pesticide application. Mobilization of water from thepond can result in pulses of contamination to estuarinetidal creeks (USES, 2004).
Coastal stormwater pond water quality is important forwildlife, pet, and human health, as well as the health ofadjacent estuarine habitats. This study provides a char-acterization of the water quality of one residential storm-water pond, the possible risks to human and animal health,and seasonal fluctuations in water quality parameters. Asmany of the water quality problems present in stormwaterponds are associated with surrounding land use activities,this project also included public outreach and educationcomponents. Human influences on pond water quality wereexamined, and the public was engaged in an education andmitigation program aimed at improving the water qualityof the pond. The approach used and the informationgenerated in this study may be applicable to the manage-ment of other coastal stormwater pond systems.
2. Materials and methods
2.1. Study site
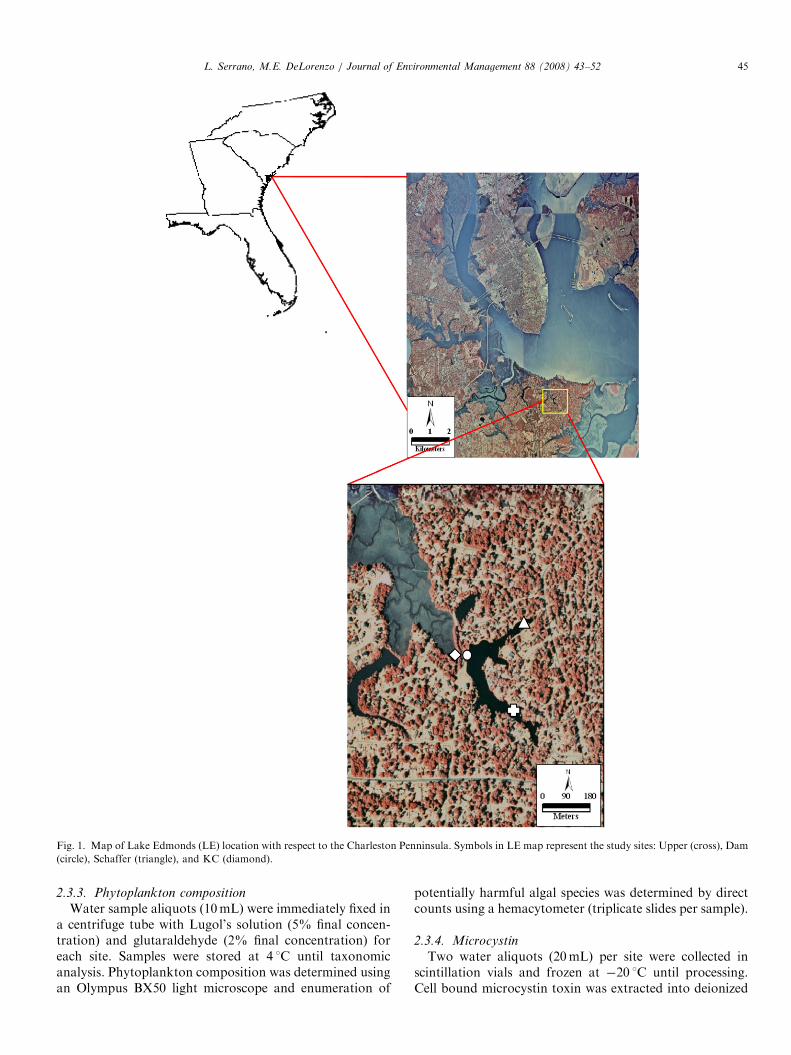
Lake Edmonds (LE) is an 11 acre freshwater pond in aresidential area of Charleston, SC (Horner, 1996). A 1996assessment described the LE drainage area as 107 acres,including road right-of-way areas (16%), houses anddriveways (18%), the lake basin (10%), and natural zones(56%) (Horner, 1996). LE drains into a nearby estuary,Kushiwah Creek (KC), and then into Charleston Harbor(Fig. 1). In addition to stormwater retention, the pond
serves as wildlife habitat and as a recreational resource tohomeowners.
2.2. Sample collection
Water samples were collected between 8:00 and 11:00a.m., every 10 days from May to October 2004 and fromMay to July 2005. Water samples were also collected onceper month from November 2004 to April 2005. Two pondlocations were selected: the upper end and the estuarineinterface site (i.e. the dam where water overflows into thetidal creek) (Fig. 1). Water samples were simultaneouslycollected from KC, approximately 50m downstream fromthe dam to examine the influence of the pond on thissystem (Fig. 1). A rain gauge (HOBO Event C, 1996ONSET Computer Corp) was installed at the upper end ofthe pond in August 2004 to quantify monthly rainfall in thepond basin. Dissolved oxygen, temperature, pH, conduc-tivity, salinity, and turbidity were measured with eachsample collection using a hand-held YSI-556 meter and apH meter. Water samples were analyzed for nutrient,chlorophyll, pesticide, algal toxin, and fecal coliformbacteria concentrations. Algal community compositionidentification and quantification was also performed.Surface water samples (250mL) for nutrient, chlorophyll,algal toxin, and algal community composition werecollected in acid-washed Nalgene bottles. Nalgene bottlesfor sampling fecal coliform bacteria were also autoclaved.Water samples for pesticide analysis were collected in40mL amber glass vials. Samples were kept cool andtransported immediately to the laboratory for analysis.
2.3. Sample analysis
2.3.1. Nutrients
Duplicate aliquots (20mL) of the collected watersamples were immediately filtered through glass fiber filters(Whatman Type GF/F, 25mm diameter), and the filtratewas collected in glass scintillation vials. Nutrient analysis(ammonium (NH4
+), nitrate/nitrite (NO3�/NO2
�), andorthophosphate (PO4
3�)) was performed using a LachatQuickchem 8000TM auto-analyzer according to the wetchemical methods of Johnson and Petty (1983) andZimmerman and Keefe (1991).
2.3.2. Chlorophyll
Chlorophyll a concentration (mg/L) was used to estimatephototrophic biomass using a fluorometric methodadapted from Glover and Morris (1979). Duplicates ofsample aliquots (10–40mL depending on turbidity) werefiltered onto glass fiber filters (Whatman Type GF/F,25mm diameter). Filters were placed in vials with 1mL of asaturated MgCO3 solution, and the vials were frozen at�20 1C until extraction (48 h period in 90% acetone).Fluorescence was then measured using a Sequoia-TurnerModel 450 fluorometer.
ARTICLE IN PRESS
Fig. 1. Map of Lake Edmonds (LE) location with respect to the Charleston Penninsula. Symbols in LE map represent the study sites: Upper (cross), Dam
(circle), Schaffer (triangle), and KC (diamond).
L. Serrano, M.E. DeLorenzo / Journal of Environmental Management 88 (2008) 43–52 45
2.3.3. Phytoplankton composition
Water sample aliquots (10mL) were immediately fixed ina centrifuge tube with Lugol’s solution (5% final concen-tration) and glutaraldehyde (2% final concentration) foreach site. Samples were stored at 4 1C until taxonomicanalysis. Phytoplankton composition was determined usingan Olympus BX50 light microscope and enumeration of
potentially harmful algal species was determined by directcounts using a hemacytometer (triplicate slides per sample).
2.3.4. Microcystin
Two water aliquots (20mL) per site were collected inscintillation vials and frozen at �20 1C until processing.Cell bound microcystin toxin was extracted into deionized
ARTICLE IN PRESSL. Serrano, M.E. DeLorenzo / Journal of Environmental Management 88 (2008) 43–5246
water using the SPER Scientific Sonicator (10005) during a3-min period. Microcystin-LR content in the samples wasquantified using the EnviroGards Microcystin Plate Kit(75400) according to the protocol provided with thekit. The 96 well-plate was read in an absorbance platereader (mQuant, Bio-Teks Instruments, Inc.) at 450 nmusing Microplate Data Analysis Software KC JuniorTM
(Bio-Teks 1998).
2.3.5. Pesticides
Four pesticides commonly used by homeowners wereselected for quantification: two herbicides (atrazine and2,4-D), one fungicide (chlorothalonil), and one insecticide(chlorpyrifos). Duplicate samples were refrigerated at 4 1Cand analyzed within 24 h of collection using RaPIDAssays test kits (Strategic Diagnostic, Inc.). Minimumdetection limits (MDL) for each compound were 0.1 mg/Latrazine, 1.0 mg/L 2,4-D, 0.1 mg/L chlorothalonil, and0.22 mg/L chlorpyrifos.
2.3.6. Fecal coliform bacteria (FCB) analysis
Duplicate water volumes of 1, 10, and 25mL werefiltered by the membrane filter technique using 0.45 mmAnalytical Test Filter Funnel (APHA, 1998). Filters werewater incubated in 1% rosolic acid—DifcoTM mFC agarfor 24 h at 44.5 1C (APHA, 1998). FCB colonies on eachplate were counted and final colony forming units (CFU)per 100mL value were determined for each site ((no. ofcolonies� 100)/volume filtered in mL) (APHA, 1998).
2.3.7. Statistical analysis
Kendall’s multiple correlation analysis was performed todetermine the relationship between study variables (e.g.physical parameters, FCB levels, nutrient, pesticide,chlorophyll and algal toxin concentrations, algal celldensity, and rainfall). Data used in the correlation analysiswas the average of each site (i.e. Upper and Dam) at LE foreach sampling time. Significance level was a ¼ 0.05.Seasonal comparisons were designated as: summer (21June–22 September), fall (23 September–21 December),winter (22 December–19 March) and spring (20 March–20June).
2.4. Mitigation strategies
Residents in the LE watershed (n ¼ 277) were surveyedregarding factors contributing to pond water quality issues(e.g. pets per household, lawn care products use, vegetativebuffer presence, pond use, and public interest in waterquality problems). Percentages based on the number ofrespondents for each question were calculated, and thesurvey information was used to determine relationshipsbetween homeowner’s practices and water quality condi-tions in the pond.
After water quality condition was assessed, a feedbackletter was sent to the residents. The letter included theresults of the survey, a summary of the data collected, and
general recommendations to improve the water quality inthe pond. A postcard was sent to homeowners with directaccess to the pond, inviting them to participate in avegetative buffer installation activity.A PowerPoint presentation, a website (www.cofc.edu/�delorenzom), and a brochure were developed as educa-tional tools. These materials included general informationabout stormwater ponds, their common water qualityissues, and recommendations to improve their conditions.A high school training session was designed to provide ahands-on lesson in water quality of aquatic ecosystems.
3. Results and discussion
3.1. Water quality
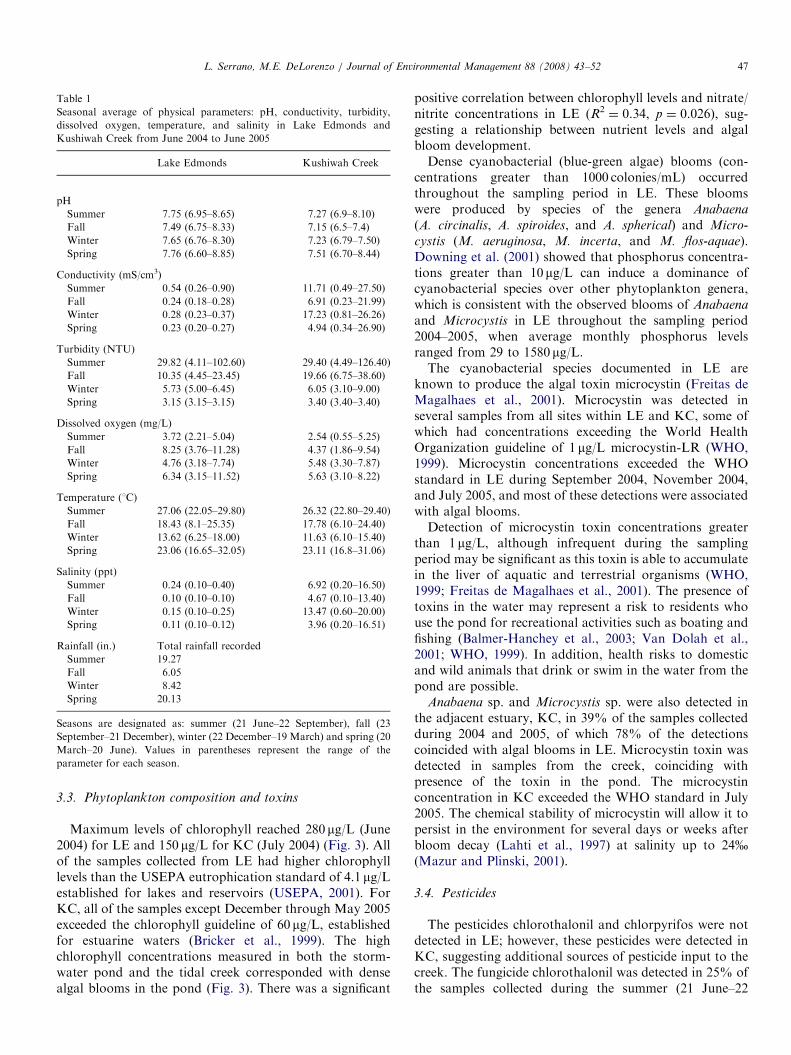
Water quality parameters measured during the2004–2005 sampling period for LE and KC are summar-ized in Table 1. Typical seasonal fluctuations in tempera-ture were observed, ranging from 6.10 to 32.05 1C. Higherdissolved oxygen (DO) concentrations in LE were asso-ciated with algal bloom development (June 2004 and June2005). The average summer DO concentrations for LE andKC were below the guideline of 4mg/L established forestuarine waters (Table 1), below which water quality isconsidered poor and potentially stressful for organisms(SCDHEC, 2001). Higher turbidity values were observed inKC when compared to LE (Table 1), except in the summerwhen algal blooms in the lake were prevalent.
3.2. Nutrients
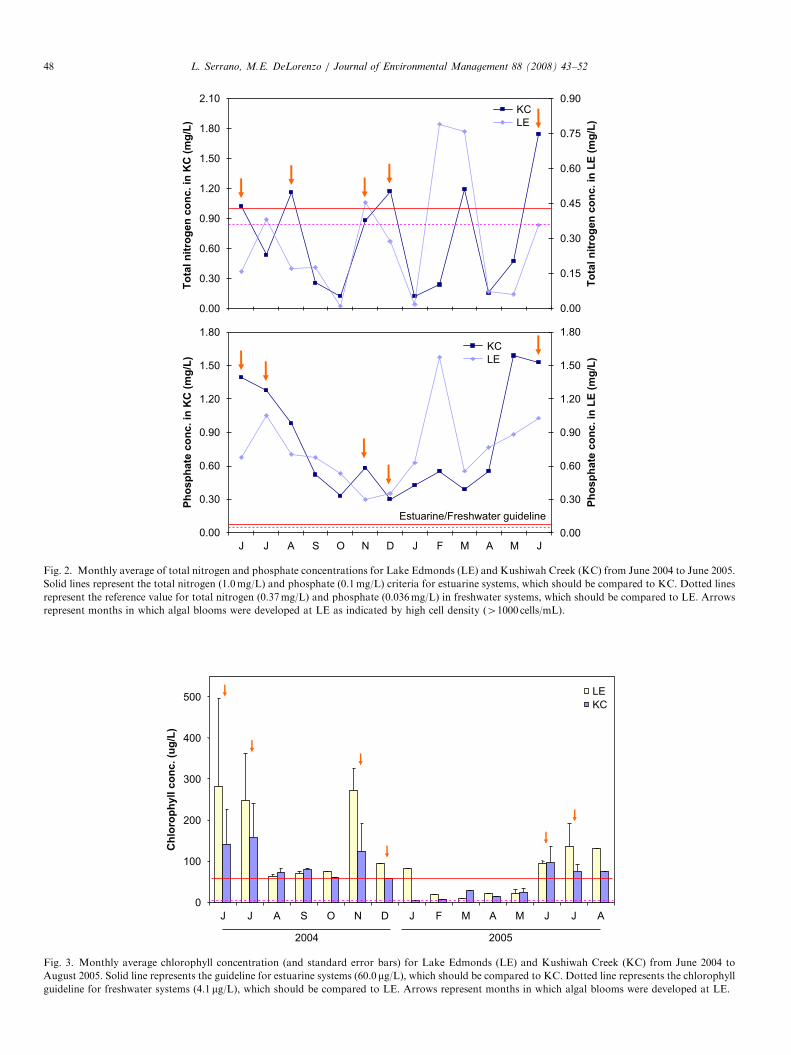
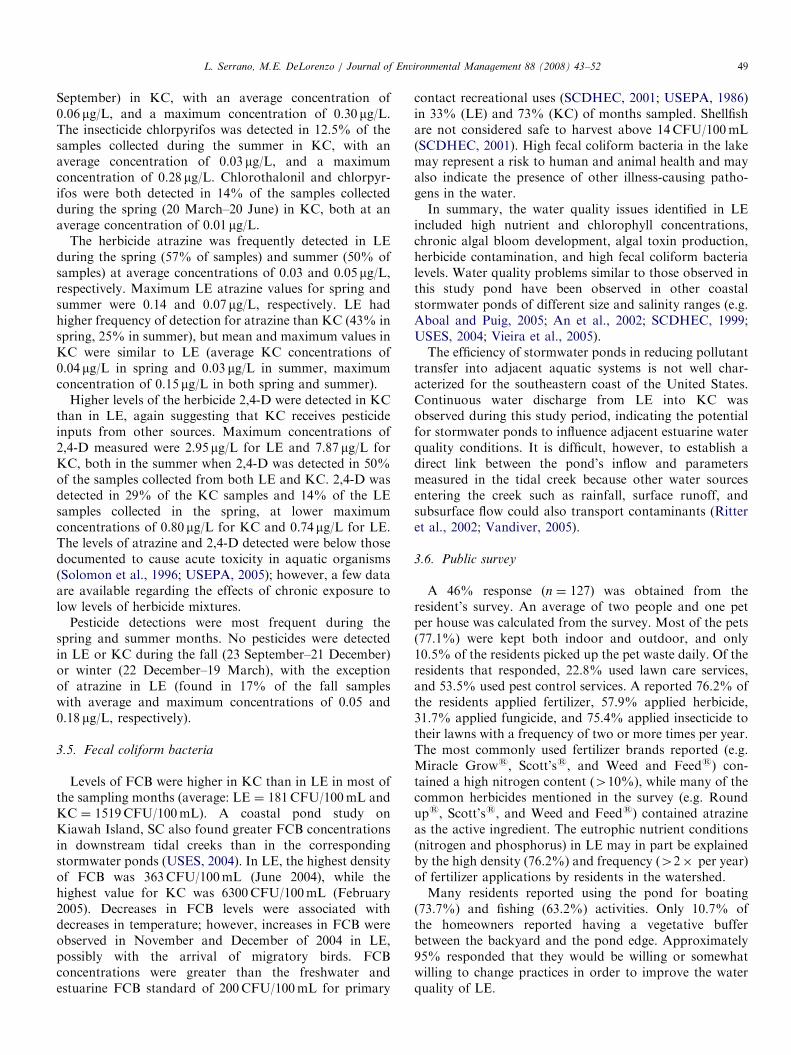
The concentrations of ammonia and nitrate/nitritewere summed and compared to the nutrient referencecriteria established for total nitrogen of 0.37mg/L(0.32–0.41mg/L) for lake and reservoir waters (USEPA,2001). This may be a conservatively low estimate becausedissolved organic nitrogen was not included. Averagemonthly total nitrogen concentrations in LE for July andNovember of 2004, and February and March of 2005exceeded the EPA criteria and would be consideredeutrophic (Fig. 2). Similarly, average monthly nitrogenlevels in KC exceeded the estuarine eutrophication guide-line of 1mg/L (Bricker et al., 1999) in June, August, andDecember of 2004, and in March and June of 2005 (Fig. 2).All LE and KC samples had higher orthophosphate
concentrations than the total phosphorus guideline forlakes and reservoirs (0.036mg/L (0.024–0.048mg/L))(USEPA, 2001) and estuarine waters (0.1mg/L) (Brickeret al., 1999) (Fig. 2). Comparing orthophosphate concen-trations to total phosphorus may yield a conservatively lowestimate. Similar to total nitrogen, phosphorus concentra-tions were highest in the lake in February, and were highestin the creek in May. The lake and creek would beconsidered highly eutrophic in terms of phosphorusthroughout the year.
ARTICLE IN PRESS
Table 1
Seasonal average of physical parameters: pH, conductivity, turbidity,
dissolved oxygen, temperature, and salinity in Lake Edmonds and
Kushiwah Creek from June 2004 to June 2005
Lake Edmonds Kushiwah Creek
pH
Summer 7.75 (6.95–8.65) 7.27 (6.9–8.10)
Fall 7.49 (6.75–8.33) 7.15 (6.5–7.4)
Winter 7.65 (6.76–8.30) 7.23 (6.79–7.50)
Spring 7.76 (6.60–8.85) 7.51 (6.70–8.44)
Conductivity (mS/cm3)
Summer 0.54 (0.26–0.90) 11.71 (0.49–27.50)
Fall 0.24 (0.18–0.28) 6.91 (0.23–21.99)
Winter 0.28 (0.23–0.37) 17.23 (0.81–26.26)
Spring 0.23 (0.20–0.27) 4.94 (0.34–26.90)
Turbidity (NTU)
Summer 29.82 (4.11–102.60) 29.40 (4.49–126.40)
Fall 10.35 (4.45–23.45) 19.66 (6.75–38.60)
Winter 5.73 (5.00–6.45) 6.05 (3.10–9.00)
Spring 3.15 (3.15–3.15) 3.40 (3.40–3.40)
Dissolved oxygen (mg/L)
Summer 3.72 (2.21–5.04) 2.54 (0.55–5.25)
Fall 8.25 (3.76–11.28) 4.37 (1.86–9.54)
Winter 4.76 (3.18–7.74) 5.48 (3.30–7.87)
Spring 6.34 (3.15–11.52) 5.63 (3.10–8.22)
Temperature (1C)
Summer 27.06 (22.05–29.80) 26.32 (22.80–29.40)
Fall 18.43 (8.1–25.35) 17.78 (6.10–24.40)
Winter 13.62 (6.25–18.00) 11.63 (6.10–15.40)
Spring 23.06 (16.65–32.05) 23.11 (16.8–31.06)
Salinity (ppt)
Summer 0.24 (0.10–0.40) 6.92 (0.20–16.50)
Fall 0.10 (0.10–0.10) 4.67 (0.10–13.40)
Winter 0.15 (0.10–0.25) 13.47 (0.60–20.00)
Spring 0.11 (0.10–0.12) 3.96 (0.20–16.51)
Rainfall (in.) Total rainfall recorded
Summer 19.27
Fall 6.05
Winter 8.42
Spring 20.13
Seasons are designated as: summer (21 June–22 September), fall (23
September–21 December), winter (22 December–19 March) and spring (20
March–20 June). Values in parentheses represent the range of the
parameter for each season.
L. Serrano, M.E. DeLorenzo / Journal of Environmental Management 88 (2008) 43–52 47
3.3. Phytoplankton composition and toxins
Maximum levels of chlorophyll reached 280 mg/L (June2004) for LE and 150 mg/L for KC (July 2004) (Fig. 3). Allof the samples collected from LE had higher chlorophylllevels than the USEPA eutrophication standard of 4.1 mg/Lestablished for lakes and reservoirs (USEPA, 2001). ForKC, all of the samples except December through May 2005exceeded the chlorophyll guideline of 60 mg/L, establishedfor estuarine waters (Bricker et al., 1999). The highchlorophyll concentrations measured in both the storm-water pond and the tidal creek corresponded with densealgal blooms in the pond (Fig. 3). There was a significant
positive correlation between chlorophyll levels and nitrate/nitrite concentrations in LE (R2
¼ 0.34, p ¼ 0.026), sug-gesting a relationship between nutrient levels and algalbloom development.Dense cyanobacterial (blue-green algae) blooms (con-
centrations greater than 1000 colonies/mL) occurredthroughout the sampling period in LE. These bloomswere produced by species of the genera Anabaena
(A. circinalis, A. spiroides, and A. spherical) and Micro-
cystis (M. aeruginosa, M. incerta, and M. flos-aquae).Downing et al. (2001) showed that phosphorus concentra-tions greater than 10 mg/L can induce a dominance ofcyanobacterial species over other phytoplankton genera,which is consistent with the observed blooms of Anabaena
and Microcystis in LE throughout the sampling period2004–2005, when average monthly phosphorus levelsranged from 29 to 1580 mg/L.The cyanobacterial species documented in LE are
known to produce the algal toxin microcystin (Freitas deMagalhaes et al., 2001). Microcystin was detected inseveral samples from all sites within LE and KC, some ofwhich had concentrations exceeding the World HealthOrganization guideline of 1 mg/L microcystin-LR (WHO,1999). Microcystin concentrations exceeded the WHOstandard in LE during September 2004, November 2004,and July 2005, and most of these detections were associatedwith algal blooms.Detection of microcystin toxin concentrations greater
than 1 mg/L, although infrequent during the samplingperiod may be significant as this toxin is able to accumulatein the liver of aquatic and terrestrial organisms (WHO,1999; Freitas de Magalhaes et al., 2001). The presence oftoxins in the water may represent a risk to residents whouse the pond for recreational activities such as boating andfishing (Balmer-Hanchey et al., 2003; Van Dolah et al.,2001; WHO, 1999). In addition, health risks to domesticand wild animals that drink or swim in the water from thepond are possible.
Anabaena sp. and Microcystis sp. were also detected inthe adjacent estuary, KC, in 39% of the samples collectedduring 2004 and 2005, of which 78% of the detectionscoincided with algal blooms in LE. Microcystin toxin wasdetected in samples from the creek, coinciding withpresence of the toxin in the pond. The microcystinconcentration in KC exceeded the WHO standard in July2005. The chemical stability of microcystin will allow it topersist in the environment for several days or weeks afterbloom decay (Lahti et al., 1997) at salinity up to 24%(Mazur and Plinski, 2001).
3.4. Pesticides
The pesticides chlorothalonil and chlorpyrifos were notdetected in LE; however, these pesticides were detected inKC, suggesting additional sources of pesticide input to thecreek. The fungicide chlorothalonil was detected in 25% ofthe samples collected during the summer (21 June–22
ARTICLE IN PRESS
0.00
0.30
0.60
0.90
1.20
1.50
1.80
2.10
To
tal n
itro
gen
co
nc. in
KC
(m
g/L
)
0.00
0.15
0.30
0.45
0.60
0.75
0.90
To
tal n
itro
gen
co
nc. in
LE
(m
g/L
)
KC
LE
0.00
0.30
0.60
0.90
1.20
1.50
1.80
J J A S O N D J F M A M J
Ph
osp
hate
co
nc. in
KC
(m
g/L
)
0.00
0.30
0.60
0.90
1.20
1.50
1.80
Ph
osp
hate
co
nc. in
LE
(m
g/L
)
KC
LE
Estuarine/Freshwater guideline
Fig. 2. Monthly average of total nitrogen and phosphate concentrations for Lake Edmonds (LE) and Kushiwah Creek (KC) from June 2004 to June 2005.
Solid lines represent the total nitrogen (1.0mg/L) and phosphate (0.1mg/L) criteria for estuarine systems, which should be compared to KC. Dotted lines
represent the reference value for total nitrogen (0.37mg/L) and phosphate (0.036mg/L) in freshwater systems, which should be compared to LE. Arrows
represent months in which algal blooms were developed at LE as indicated by high cell density (41000 cells/mL).
0
100
200
300
400
500
J J A S O N D FJ A MM J J A
Ch
loro
ph
yll c
on
c. (u
g/L
)
LE
KC
2004 2005
Fig. 3. Monthly average chlorophyll concentration (and standard error bars) for Lake Edmonds (LE) and Kushiwah Creek (KC) from June 2004 to
August 2005. Solid line represents the guideline for estuarine systems (60.0mg/L), which should be compared to KC. Dotted line represents the chlorophyll
guideline for freshwater systems (4.1 mg/L), which should be compared to LE. Arrows represent months in which algal blooms were developed at LE.
L. Serrano, M.E. DeLorenzo / Journal of Environmental Management 88 (2008) 43–5248
ARTICLE IN PRESSL. Serrano, M.E. DeLorenzo / Journal of Environmental Management 88 (2008) 43–52 49
September) in KC, with an average concentration of0.06 mg/L, and a maximum concentration of 0.30 mg/L.The insecticide chlorpyrifos was detected in 12.5% of thesamples collected during the summer in KC, with anaverage concentration of 0.03 mg/L, and a maximumconcentration of 0.28 mg/L. Chlorothalonil and chlorpyr-ifos were both detected in 14% of the samples collectedduring the spring (20 March–20 June) in KC, both at anaverage concentration of 0.01 mg/L.
The herbicide atrazine was frequently detected in LEduring the spring (57% of samples) and summer (50% ofsamples) at average concentrations of 0.03 and 0.05 mg/L,respectively. Maximum LE atrazine values for spring andsummer were 0.14 and 0.07 mg/L, respectively. LE hadhigher frequency of detection for atrazine than KC (43% inspring, 25% in summer), but mean and maximum values inKC were similar to LE (average KC concentrations of0.04 mg/L in spring and 0.03 mg/L in summer, maximumconcentration of 0.15 mg/L in both spring and summer).
Higher levels of the herbicide 2,4-D were detected in KCthan in LE, again suggesting that KC receives pesticideinputs from other sources. Maximum concentrations of2,4-D measured were 2.95 mg/L for LE and 7.87 mg/L forKC, both in the summer when 2,4-D was detected in 50%of the samples collected from both LE and KC. 2,4-D wasdetected in 29% of the KC samples and 14% of the LEsamples collected in the spring, at lower maximumconcentrations of 0.80 mg/L for KC and 0.74 mg/L for LE.The levels of atrazine and 2,4-D detected were below thosedocumented to cause acute toxicity in aquatic organisms(Solomon et al., 1996; USEPA, 2005); however, a few dataare available regarding the effects of chronic exposure tolow levels of herbicide mixtures.
Pesticide detections were most frequent during thespring and summer months. No pesticides were detectedin LE or KC during the fall (23 September–21 December)or winter (22 December–19 March), with the exceptionof atrazine in LE (found in 17% of the fall sampleswith average and maximum concentrations of 0.05 and0.18 mg/L, respectively).
3.5. Fecal coliform bacteria
Levels of FCB were higher in KC than in LE in most ofthe sampling months (average: LE ¼ 181CFU/100mL andKC ¼ 1519CFU/100mL). A coastal pond study onKiawah Island, SC also found greater FCB concentrationsin downstream tidal creeks than in the correspondingstormwater ponds (USES, 2004). In LE, the highest densityof FCB was 363CFU/100mL (June 2004), while thehighest value for KC was 6300CFU/100mL (February2005). Decreases in FCB levels were associated withdecreases in temperature; however, increases in FCB wereobserved in November and December of 2004 in LE,possibly with the arrival of migratory birds. FCBconcentrations were greater than the freshwater andestuarine FCB standard of 200CFU/100mL for primary
contact recreational uses (SCDHEC, 2001; USEPA, 1986)in 33% (LE) and 73% (KC) of months sampled. Shellfishare not considered safe to harvest above 14CFU/100mL(SCDHEC, 2001). High fecal coliform bacteria in the lakemay represent a risk to human and animal health and mayalso indicate the presence of other illness-causing patho-gens in the water.In summary, the water quality issues identified in LE
included high nutrient and chlorophyll concentrations,chronic algal bloom development, algal toxin production,herbicide contamination, and high fecal coliform bacterialevels. Water quality problems similar to those observed inthis study pond have been observed in other coastalstormwater ponds of different size and salinity ranges (e.g.Aboal and Puig, 2005; An et al., 2002; SCDHEC, 1999;USES, 2004; Vieira et al., 2005).The efficiency of stormwater ponds in reducing pollutant
transfer into adjacent aquatic systems is not well char-acterized for the southeastern coast of the United States.Continuous water discharge from LE into KC wasobserved during this study period, indicating the potentialfor stormwater ponds to influence adjacent estuarine waterquality conditions. It is difficult, however, to establish adirect link between the pond’s inflow and parametersmeasured in the tidal creek because other water sourcesentering the creek such as rainfall, surface runoff, andsubsurface flow could also transport contaminants (Ritteret al., 2002; Vandiver, 2005).
3.6. Public survey
A 46% response (n ¼ 127) was obtained from theresident’s survey. An average of two people and one petper house was calculated from the survey. Most of the pets(77.1%) were kept both indoor and outdoor, and only10.5% of the residents picked up the pet waste daily. Of theresidents that responded, 22.8% used lawn care services,and 53.5% used pest control services. A reported 76.2% ofthe residents applied fertilizer, 57.9% applied herbicide,31.7% applied fungicide, and 75.4% applied insecticide totheir lawns with a frequency of two or more times per year.The most commonly used fertilizer brands reported (e.g.Miracle Grows, Scott’ss, and Weed and Feeds) con-tained a high nitrogen content (410%), while many of thecommon herbicides mentioned in the survey (e.g. Roundups, Scott’ss, and Weed and Feeds) contained atrazineas the active ingredient. The eutrophic nutrient conditions(nitrogen and phosphorus) in LE may in part be explainedby the high density (76.2%) and frequency (42� per year)of fertilizer applications by residents in the watershed.Many residents reported using the pond for boating
(73.7%) and fishing (63.2%) activities. Only 10.7% ofthe homeowners reported having a vegetative bufferbetween the backyard and the pond edge. Approximately95% responded that they would be willing or somewhatwilling to change practices in order to improve the waterquality of LE.
ARTICLE IN PRESSL. Serrano, M.E. DeLorenzo / Journal of Environmental Management 88 (2008) 43–5250
3.7. Public outreach and education
Human practices such as the disposal of lawn clippingsin the water and mowing lawns to the water’s edge (i.e. lackof vegetative buffer) may contribute to water qualityproblems observed in stormwater ponds. The disposal oflawn clippings in the ponds may cause nutrient loading,debris accumulation, and oxygen depletion from organicmatter degradation. The lack of a vegetative buffer maylead to higher rates of water runoff into the pond.Additionally, soil erosion and debris deposition over timereduce the storage capacity of stormwater ponds anddecrease the residence time of pollutants (USEPA, 2000).Decreases in water depth not only can result in floodingproblems but may also lead to denser algal blooms andmacrophyte overgrowth caused by higher light intensitiesreaching deeper into the water column. Vegetative buffersare known to reduce nutrient (USES, 2004), chemical(Syversen and Bechmann, 2004), and bacterial (Vandiver,2005) loads to adjacent water bodies by material uptake orby acting as a physical barrier.
Public outreach and education activities were conductedto inform participants about common water qualityproblems in stormwater ponds and potential mitigationtechniques. These activities included: (1) PowerPointpresentations given to the Lake Edmonds HomeownersAssociation and two high school groups. Participants werealso referred to the Water Quality Restoration for CoastalStormwater Ponds website (http://cofc.edu/�delorenzom),and a Water Quality Restoration in Stormwater Pondsbrochure was distributed. (2) A water quality measurementdemonstration for high school students. The studentslearned laboratory techniques to test water quality suchas pesticide analysis (ELISA kits), nutrient analysis(HACH kits), FCB culture and quantification, andphytoplankton community preservation and quantifica-tion. (3) The installation of vegetative buffers at LE.Community groups participated in the planting of nativespecies such as White Pickerel, Iris sp., and a common rush(i.e. Juncus effusus) (total number of plants ¼ 57).
Previous studies have shown that public education andparticipation in restoration projects increases public inter-est toward environmental problems (Sarkar and Bhatta-charya, 2003; USES, 2004). In this study, the communityoutreach and education activities resulted in severalpositive outcomes: (1) Watershed residents acquired moreknowledge related to how human actions affect waterquality. (2) The Lake Edmonds Homeowners Associationbegan to apply management practices for controlling algaegrowth in the pond including installing vegetative buffersand stocking planktivorous fish such as Blue Tilapia(N ¼ 1000) and Grass carp (N ¼ 42) (performed in April2005). Long-term monitoring will be required to determinewhether these mitigations were effective in improving LE’swater quality. (3) A positive attitude of the high schoolstudents was observed toward the water quality restorationefforts. The teacher and students gained knowledge and
techniques that they plan to utilize in a research study ofwater quality management at the stormwater pond on theirschool’s property.
4. Conclusions
Water quality problems in stormwater ponds are anincreasing concern with coastal development. A combinedapproach of management and preventive practices can helpto reduce contamination of stormwater ponds. As a resultof this study, five restoration and management techniqueswere recommended for residential communities to improvestormwater pond water quality: (1) the installation of avegetative buffer, (2) the use of products with low chemicaland nutrient content, especially biodegradable ones,(3) the reduction of chemical applications and strictadherence to label instructions, (4) proper disposal of petwaste and lawn clippings, and (5) the addition ofplanktivorous fish or application of additional techniquesknown to control algae and macrophyte overgrowth. It isstrongly encouraged that community outreach and restora-tion efforts use a watershed approach in order toencompass all pollutant sources present in the stormwaterpond’s drainage area.The connection between land use, coastal stormwater
ponds, and coastal habitat represents a significant chal-lenge in the preservation and productivity of the coastalzone. Community involvement is essential in order toeducate citizens about their influences on water conditionsand the risks that poor water quality may representto human and wildlife health (USES, 2004). With predictedincreases in coastal development, the results of this studymay be beneficial to environmental managers chargedwith improving the design and function of stormwaterponds.
Acknowledgments
Funding for this research was provided by the Urbaniza-tion and Southeastern Estuarine Systems (USES) grantfrom the National Ocean Service (#NA16OA2562) and theSouth Carolina Sea Grant Consortium (#6257). Humanresearch was approved by the College of CharlestonInstitutional Review Board for the Protection of HumanResearch Participants (IRB-05-009). We thank the LakeEdmonds’ Homeowners Association, residents in the lake’swatershed and West Ashley High School teacher, Ms.Margaret Spigner and students, Cub Scouts and parentsfor their cooperation with the project. We wish toacknowledge Charleston Aquatic Nursery and theSCDHEC-OCRM (particularly Denise Sanger) as projectsponsors. We are grateful for the assistance of many peopleat the NOAA laboratory: Pete Key, Tom Siewicki, KatyChung, Tom Pullaro, Brian Thompson, Jennifer Hoguet,Karl Phillips, Marion Sanders, Erica Boyce, StaceyMcDaniel, Jill Stewart, Laura Webster, Paul Pennington,Wei Pan, Jan Gooch, and Lou Ann Reed; and the
ARTICLE IN PRESSL. Serrano, M.E. DeLorenzo / Journal of Environmental Management 88 (2008) 43–52 51
SC DNR-Algal Ecology Laboratory: Ken Hayes,Sophia Johnson, Wesley Jackson, and Patrick Brown.The National Ocean Service (NOS) does not approve,recommend, or endorse any proprietary product ormaterial mentioned in this publication.
References
Aboal, M., Puig, M., 2005. Intracellular and dissolved microcystin in
reservoirs of the River Segura basin, Murcia, SE Spain. Toxicon 45,
509–518.
American Public Health Association (APHA), 1998. Standard Methods
for the Examination of Water and Wastewater, 20th ed. APHA,
Washington, DC.
An, Y.-J., Kampbell, D.H., Breidenbach, G.P., 2002. E. coli and total
coliforms in water and sediments at lake marinas. Environ. Pollut. 120,
771–778.
Baier-Anderson, C., Anderson, R.S., 2000. The effects of chlorothalonil
on oyster hemocyte activation: phagocytosis, reduced pyridine
nucleotides, and reactive oxygen species production. Environ. Res.
A. 83, 72–78.
Balmer-Hanchey, E.L., Jaykus, L.A., Green, D.P., McClellan-Green, P.,
2003. Marine biotoxins and algal origin and seafood safety. J. Aquat.
Food Prod. Technol. 12 (1), 29–53.
Bricker, S.B., Clement, C.G., Pirhalla, D.E., Orlando, S.P., Farrow,
D.R.G., 1999. National Estuarine Eutrophication Assessment: Effects
of Nutrient Enrichment in the Nation’s Estuaries. NOAA, National
Ocean Service, Special Projects Office and the National Centers for
Coastal Ocean Science, Silver Spring, MD, 71pp.
DeLorenzo, M.E., Serrano, L., 2003. Individual and mixture toxicity of
three pesticides; atrazine, chlorpyrifos, and chlorothalonil to the
marine phytoplankton species Dunaliella tertiolecta. J. Environ. Sci.
Health, B 38 (5), 529–538.
Downing, J.A., Watson, S.B., McCauley, E., 2001. Predicting cyanobac-
teria dominance in lakes. Can. J. Fish Aquat. Sci. 58, 1905–1908.
Feldman, K.A., Mohle-Boetani, J.C., Ward, J., Furst, K., Abrott, S.I.,
Ferrero, D.V., Olsen, A., Werner, S.B., 2002. A cluster of Escherichi
coli 0157: nonmotile infections associated with recreational exposure to
lake water. Publ. Health Rep. 117, 380–385.
Freitas de Magalhaes, V., Soares, R.M., Azevedo, S.M.F.O., 2001.
Microcystin contamination in fish from Jacarepagua Lagoon (Rio de
Janeiro, Brazil): ecological implication and human risk. Toxicon 39
(7), 1077–1085.
Glibert, P.M., Magnien, R., Lomas, M.W., Alexander, J., Fan, C.,
Haramoto, E., Trice, M., Kana, T.M., 2001. Harmful algal blooms in
the Chesapeake and coastal bays of Maryland USA: comparison of
1997, 1998 and 1999 events. Estuaries 24 (6A), 875–883.
Glover, H.E., Morris, I., 1979. Photosynthetic carboxylating enzymes in
marine phytoplankton. Limnol. Oceanogr. 23, 510–519.
Horner, R.L., 1996. Stormwater runoff analysis for the Lake Edmonds
drainage basin. Prepared for the Lake Edmonds Home and
Property Owners Association (LEHPOA). 10pp. Reprints available
Johnson, K.S., Petty, R.L., 1983. Determination of nitrate and nitrate in
seawater by flow injection analysis. Limnol. Oceanogr. 28, 1260–1266.
Lahti, K., Rapala, J., Fardig, M., Niemela, M., Sivonen, K., 1997.
Persistence of cyanobacterial hepatotoxin microcystin-LR in
particulate material and dissolved in lake water. Water Reserve 31,
1005–1012.
Lewitus, A.J., Schmidt, L.B., Mason, L.J., Kempton, J.W., Wilde, S.B.,
Wolny, J.L., Williams, B.J., Hayes, K.C., Hymel, S.N., Keppler, C.J.,
Ringwood, A.H., 2003. Harmful algal blooms in South Carolina
residential and golf course ponds. Popul. Environ. 24 (5), 387–413.
Mawdsley, J.L., Bardgett, R.D., Merry, R.J., Pain, B.F., Theodorou,
M.K., 1995. Pathogens in livestock waste, their potential for movement
through soil and environmental pollution. Appl. Soil Ecol. 2, 1–15.
Mazur, H., Plinski, M., 2001. Stability of cyanotoxins, microcystin-LR,
microcystin-RR and nodularins in seawater and BG-11 medium of
different salinity. Oceanologia 43 (3), 329–339.
Moore, M.T., Huggett, D.B., Gillespie, W.B.J., Rodgers, J.H., Cooper,
C.M., 1998. Comparative toxicity of chlordane, chlorpyrifos, and
aldicarb to four aquatic organisms. Arch. Environ. Contam. Toxicol.
34, 152–157.
Novotny, V., 1995. Nonpoint Pollution and Urban Stormwater Manage-
ment, first ed. Technomic Publishing Company, Inc., PA.
Onodera, H., Oshima, Y., Hemriksen, P., Yasumoto, T., 1997.
Confirmation of anatoxin-a(s), in the cyanobacterium Anabaena
lemmermannii, as the cause of bird kills in Danish lakes. Toxicon 35,
1645–1648.
Phyu, Y.L., Warne, M.St.J., Lim, R.P., 2006. Toxicity and bioavailability
of atrazine and molinate to the freshwater fish (Melanotenia fluviatilis)
under laboratory and simulated field conditions. Sci. Total Environ.
356, 86–99.
Ritter, L., Solomon, K., Sibley, P., 2002. Sources, pathways, and relative
risks of contaminants in surface water and groundwater: a perspective
prepared for the Walkerton Inquiry. J. Toxicol. Environ. Health, A 65,
1–142.
Sarkar, S.K., Bhattacharya, A.K., 2003. Conservation of biodiversity of
the coastal resources of Sundarbans, Northeast India: an integrated
approach through environmental education. Mar. Pollut. Bull. 47,
260–264.
SCDHEC, 1999. Total maximum daily load development for Camp Creek
CW-235: Fecal Coliform. South Carolina Department of Health and
Environmental Control. Bureau of Water, Office of Ocean and Coastal
Resource Management, Columbia, SC.
SCDHEC, 2001. Water Classifications and Standards (Regulation
61–68) and Classified Waters (Regulation 61–69) for the State
of South Carolina. Office of Environmental Quality Control,
Columbia, SC.
SCDHEC, 2003. South Carolina Stormwater Management and Sediment
Control Handbook for Land Disturbance Activities, 2003. South
Carolina Department of Health and Environmental Control. Envir-
onmental Water Quality. Bureau of Water, Office of Ocean and
Coastal Resource Management, Columbia, SC.
Solomon, K.R., Baker, D.B., Richards, P., Dixon, K.R., Klaine, S.J.,
LaPoint, T.W., Kendall, R.J., Weisskopf, C.P., Giddings, J.M., Geisy,
J.P., Hall, L.W., Williams, W.M., 1996. Ecological risk assessment of
atrazine in North American surface waters. Environ. Toxicol. Chem.
15 (1), 31–76.
Syversen, N., Bechmann, M., 2004. Vegetative buffer zones as pesticide
filters for simulated surface runoff. Ecol. Eng. 22, 175–184.
USEPA, 1986. Ambient Water Quality Criteria for Bacteria. Office of
Water, Regulations and Standards. Criteria and Standards Division.
Environmental Protection Agency, Washington, DC.
USEPA, 2000. Nutrient Criteria. Technical Guidance Manual. Lakes and
Reservoirs, first ed. Office of Water. Office of Science and Technology.
US Environmental Protection Agency, Washington, DC.
USEPA, 2001. Ambient Water Quality Criteria Recommendations.
Information Supporting the Development of State and Tribal
Nutrient Criteria. Lakes and Reservoirs in Nutrient Ecoregion XIV.
Office of Water 4304. US Environmental Protection Agency,
Washington, DC.
USEPA, 2005. Reregistration Eligibility Decision for 2,4-D. Office of
Prevention, Pesticides and Toxic Substances (7508C). EPA 738-R-05-
002. US Environmental Protection Agency, Washington, DC.
USES (Urbanization and Southeastern Estuarine Systems) Final Project
Report 2004. Submitted by the University of South Carolina,
Columbia, SC and NOAA, National Ocean Service, Center for
Coastal Environmental Health and Biomolecular Research, Charles-
ton, SC. NOAA grant #NA16OA2562, and South Carolina Sea Grant
Consortium grant #6257.
Vandiver, L., 2005. Characterizing pollutant transport through a coastal,
residential lawn of vegetated buffer. Master Thesis of Environmental
Studies Program at the College of Charleston, SC.

ARTICLE IN PRESSL. Serrano, M.E. DeLorenzo / Journal of Environmental Management 88 (2008) 43–5252
Van Dolah, F.M., Roelke, D., Greene, R.M., 2001. Health and ecological
impacts of harmful algae blooms: risk assessment notes. Hum. Ecol.
Risk Assess. 7 (5), 1329–1345.
Vieira, J., Azevedo, M., Oliveira-Azevedo, S., Honda, R., Correa, B.,
2005. Toxic cyanobacteria and microcystin concentrations in a public
water supply reservoir in the Brazilian Amazonia region. Toxicon 45
(7), 901–909.
Watanabe, M.F., Harada, K., Carmichael, W.W., Fujiki, H., 1995. Toxic
Microcystis, first ed. CRC Press, Inc., New York.
WHO, 1999. Toxic cyanobacteria in water: a guide to their public health
consequences, monitoring and management. World Health Organiza-
tion. /www.who.int/docstore/water_sanitation_health/toxicyanobact/
ch15.htmlS, 7/19/2005.
Yoder, J.S., Blackburn, B.G., Craun, G.F., Hill, V., Levy, D.A., Chen, N.,
Lee, S.H., Calderon, R.L., Beach, M.J., 2004. Surveillance for
waterborne-disease outbreak associated with recreational water—
United States, 2001–2002. In: Surveillance Summaries, October 22,
2004. MMWR 2004; 53(SS08): 22pp.
Zimmerman, C.F., Keefe, C.W., 1991. EPAMethod 353.4, Determination of
nitrate+nitrite in estuarine and coastal waters by automated colorimetric
analysis. In an internal manual of methods for the determination of
nutrients in estuarine and coastal waters. Revision 1.1, June 1991.