water operation and maintenance - usbr.gov · pdf filethis water operation and maintenance...
TRANSCRIPT

W A T E R O P E R A T I O N
A N D M A I N T E N A N C E
B U L L E T I N
No. 185 September 1998
I N T H I S I S S U E . . .
• Inspection of Brake Motors and Speed Reducers for Gate Hoists• Abrasion/Erosion in Stilling Basins• Hydraulic Model Studies of Aeration Enhancements at the
Folsom Dam Outlet Works: Reducing Cavitation Damage Potential
• Nondestructive Testing of Large Concrete Dams
UNITED STATES DEPARTMENT OF THE INTERIORBureau of Reclamation

For further information about the Water Operation andMaintenance Bulletin or to receive a copy of the index, contact:
Jerry Fischer, Managing Editor
Bureau of Reclamation
Inspections and Emergency Management Group,
Code D-8470
PO Box 25007, Denver CO 80225
Telephone: (303) 445-2748
FAX: (303) 445-6381
Email: [email protected]
This Water Operation and Maintenance Bulletin is published quarterly for the benefitof water supply system operators. Its principal purpose is to serve as a medium toexchange information for use by Reclamation personnel and water user groups inoperating and maintaining project facilities.
Although every attempt is made to ensure high quality and accurate information,Reclamation cannot warrant nor be responsible for the use or misuse of information that is furnished in this bulletin.
Cover photograph: Roller bearing removed from secondary speed reducer afterapproximately 40 years in service (left). Climbers of Reclamation's ClimbTeam (right).
Any information contained in this bulletin regarding commercial products may not beused for advertisement or promotional purposes and is not to be construed as an
endorsement of any product or firm by the Bureau of Reclamation.
UNITED STATES DEPARTMENT OF THE INTERIOR Bureau of Reclamation

WATER OPERATION AND MAINTENANCE BULLETINNo. 185—September 1998
CONTENTS
Page
Inspection of Brake Motors and Speed Reducers for Gate Hoists . . . . . . . . . . . . . . . . . . . 1Abrasion/Erosion in Stilling Basins . . . . . . . . . . . . . . . . . . . . . . . . . . . . . . . . . . . . . . . . . . . 5Hydraulic Model Studies of Aeration Enhancements at the Folsom Dam Outlet Works: Reducing Cavitation Damage Potential . . . . . . . . . . . . . . . . . . . . . . . . . . . . . . . 11Nondestructive Testing of Large Concrete Dams . . . . . . . . . . . . . . . . . . . . . . . . . . . . . . . . 25

1 Division of Resources Management, Mid-Pacific Region, Sacramento, California.
INSPECTION OF BRAKE MOTORS AND SPEED REDUCERSFOR GATE HOISTS
by Bill Nixon, Jr.1
Introduction
Brake motors and speed reducers require little service and normally receive no service. Theyare usually quiet and run very slowly. These are not characteristics that attract attention. Running time is extremely low—1 hour or less in a year is not unusual. Brake motors andspeed reducers would last forever if kept in a hermetically sealed environment. However, ifthe machinery has been outside in the hot sun, blowing sand, snow, and rain for approxi-mately 40 years, moisture and dirt may have worked into the various parts.
Description
A brake locks the hoist machinery, engaged by spring pressure and disengaged by an electro-magnet. It may also have a manual release. The brake mechanism is normally bolted to oneend of the motor.
The motor is normally two direction, three phase, 440 volt, 60 Hertz, totally enclosed fancooled, and weatherproof. In most applications, the motor is bolted to the primary speedreducer.
A primary speed reducer is bolted to the structure. Many designs include a secondary speedreducer, and some have a tertiary or final reducer.
Inspection of the Brake
Many of the brakes have been specified to include a manual release. The manual release isusually a small lever extending through an opening in the inspection cover. Very little force isrequired to operate the lever. Experience has proven that the gate will go down when thebrake is manually released.
Because of the manual release lever, unauthorized or accidental lowering of a gate may bepossible. The Mid-Pacific Region has installed covers over several manual release levers. Covering the levers may be more important when the equipment is open to the public.

2 Water Operation and Maintenance Bulletin
Remove the inspection cover to examine the brake mechanism, and you will often find sandand rust inside. If the brake mechanism has a manual release, sand may get in through therelease lever opening. The machinery is delicate. Use compressed air to blow out the dirt. Use a soft cloth to carefully clean the brake parts. Examine the brake lining and rotors. Studythe mechanism to identify the fulcrums and bearings. Wipe the parts with a clean soft cloththat is dampened with light oil (20 weight oil, for example). Do not use spray can lubricant. It is imperative that no oil gets on the lining or rotors. If the gate is open, you may carefullyrelease the brake just enough to watch the rotor turn one or two revolutions—this will lower the gate less than ten thousands of an inch. Inspect the electrical releasesolenoid. Inspect wires for cracked insulation. Do not move any wires unless there is a needto do so. Do not make any adjustments unless there is a need to do so. If it is working, donot adjust it. Clean the inspection cover. Apply a thin coat of heavy grease or gasket formerto the cover seal. Remember, the cover must be removable—do not cement it on. New partsfor the brake are very likely unavailable.
Inspection of the Motor
Check the air cooling system for mud and wasp nests. The motor will be equipped with sealedball bearings which were greased at the factory. After 30 or 40 years, the grease becomeshard and dry and no longer lubricates. There is no acceptable way to add grease. Look forevidence of motor shaft side play. There should be no measurable play. Sound is a very goodtest, provided the motor can be run for a few minutes. The motor should be very smooth andquiet. You can use a wood rod or a stethoscope to listen and determine if there are unusualsounds and where they are coming from. New bearings are available for almost any motor, nomatter how old it is. And, any motor can be rewound, although the expense may make itimpractical.
Inspection of the Primary Speed Reducer
The primary reducer is normally a factory design. The gear ratio is always high. For example,the gear ratio could be 180 to 1, the motor R.P.M. could be 1,800, and the output R.P.M.would be 10. The torque would be multiplied by 180. The primary gear box is always a wetbox, meaning it will use liquid oil for lubrication. Determine if the oil is ever changed. Ifpossible, remove a sample of oil from the bottom of the gear box. Any visible water is a hintof more serious problems and reason enough to suggest that the oil be changed. Check theinput and output shafts for oil leaks. Some seepage is acceptable; a leak that forms a puddle isnot acceptable. When you are listening to the motor, also listen to the speed reducer. Newbearings are probably available, but the gears and other parts are almost certain to be orphans.

Water Operation and Maintenance Bulletin 3
Inspection of the Secondary Speed Reducer
The secondary speed reducer will be a much larger machine. It will run very slowly. It mayhave been designed by the Bureau of Reclamation, and any parts, other than bearings andseals, will have to be designed and made to order. There should be inspection covers. Examine the inside parts for rust or discoloration. Some boxes are designed with semi-external bearings that are greased manually from the outside. Examine the oil for water. Check the records regarding oil changes. The oil change schedule is affected by climate andweatherproof quality of the gear box. These large speed reducers should last a very long time,perhaps over 100 years. Leaking seals and bad bearings are parts that must be scheduled forreplacement.
Inspection of the Tertiary or Final Drive
The final drive will be similar to the secondary drive, and all comments apply to both of them. Sometimes, the final drive is a dry type. The gears may be exposed or may be inside a drybox. The lubricant is often a tar-like grease. Inspect this grease for sand or other contami-nation; otherwise, there may be no reason to change it. Some exposed gears run without anylubricant—this is to prevent sand or dust from sticking to the surface.
Conclusion
The following photograph shows a roller bearing removed from a secondary speed reducer. The unit had been in service for approximately 40 years. The oil had never been changed. There was water in the bottom of the gear box, and the bearings had been destroyed bycorrosion.

4 Water Operation and Maintenance Bulletin
Roller bearing removed from secondary speed reducer after approximately 40 years in service.

Water Operation and Maintenance Bulletin 5
Figure 1.—Counter-rotating flow eddy over basin end sill and lower apron.
ABRASION/EROSION IN STILLING BASINS
by Leslie Hanna and Elisabeth Cohen, Bureau of Reclamation, Denver, Colorado, USA
Introduction
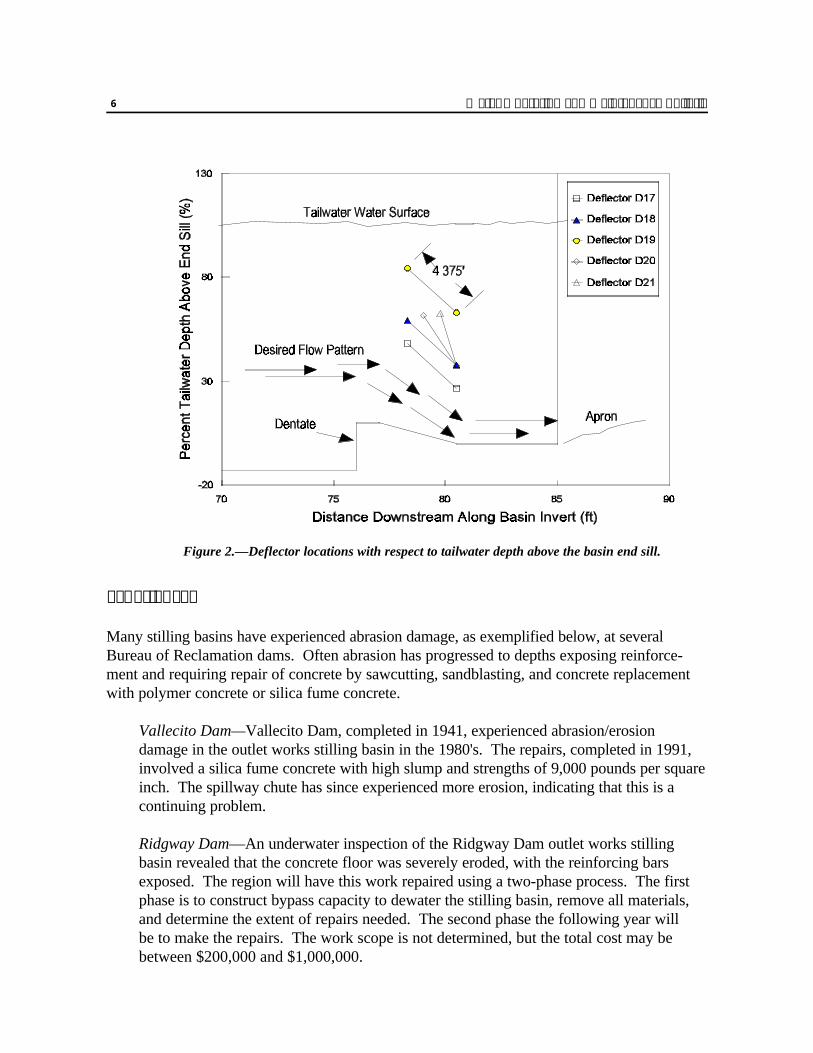
Many stilling basins have experienced damage caused by rock, gravel, and sand brought intothe basin by back flow over the stilling basin end sill. Normal operation of a hydraulic jumpenergy dissipation basin can cause a reverse flow eddy over the basin end sill and lower apron,as shown in figure 1. This counter-rotating eddy is driven by a high-velocity jet rising off thebasin floor near the end of the basin. Riprap placed on the apron downstream of the basin endsill is typically designed to be stable under this condition. However, small material can betransported into the basin and trapped where turbulent flow continually moves the materialabout the surface, eroding the concrete. The cost for these repairs, in terms of time, effort,and money, can be significant. If a means to reduce the reverse flow can be found, largesavings can be obtained. One possible solution that is currently being studied at the Bureau ofReclamation’s Water Resources Research Laboratory (WRRL) is to install flow deflectors inthe basin to improve inter-basin flow conditions and minimize upstream velocities over thebasin end sill (figure 2).
6 Water Operation and Maintenance Bulletin
Figure 2.—Deflector locations with respect to tailwater depth above the basin end sill.
Experiences
Many stilling basins have experienced abrasion damage, as exemplified below, at severalBureau of Reclamation dams. Often abrasion has progressed to depths exposing reinforce-ment and requiring repair of concrete by sawcutting, sandblasting, and concrete replacementwith polymer concrete or silica fume concrete.
Vallecito Dam—Vallecito Dam, completed in 1941, experienced abrasion/erosiondamage in the outlet works stilling basin in the 1980's. The repairs, completed in 1991,involved a silica fume concrete with high slump and strengths of 9,000 pounds per squareinch. The spillway chute has since experienced more erosion, indicating that this is acontinuing problem.
Ridgway Dam—An underwater inspection of the Ridgway Dam outlet works stillingbasin revealed that the concrete floor was severely eroded, with the reinforcing barsexposed. The region will have this work repaired using a two-phase process. The firstphase is to construct bypass capacity to dewater the stilling basin, remove all materials, and determine the extent of repairs needed. The second phase the following year will be to make the repairs. The work scope is not determined, but the total cost may bebetween $200,000 and $1,000,000.

Water Operation and Maintenance Bulletin 7
Taylor Draw Dam—In 1991, about $200,000 was spent to repair abrasion damage to theTaylor Draw Dam outlet works stilling basin. After just one operating season, aninspection revealed that abrasion damage had again occurred. After repairs werecompleted the second time, a study conducted by WRRL demonstrated that theinstallation of flow deflectors improved the basin’s flow distribution significantly, greatlyreducing the potential for movement of material into the basin. The deflectors have beenin place for 4 years, with no further repairs to the basin concrete required.
The Model
A physical model is being used to investigate hydraulic conditions in Type II stilling basins andto study the affect of deflector positioning and inclination on flow patterns over the basin endsill. The study will be used to optimize and generalize flow deflector designs based on basingeometry and operating conditions. The Ridgway Dam outlet works and its Type II twin baystilling basin are being used for the model investigations. The model includes the42-inch high-pressure slide gates discharging into 2:1 sloping chutes and 12-foot-wide bays. The basin is 85 feet long. Froude scaling was used to model the outlet works at a 1:10.5scale. The downstream riprap apron topography was modeled on a 6:1 slope with moveablebed material to simulate the abrasion source. Unit discharges (q) (corresponding to 40-, 60-,80-, and 100-percent gate openings for the Ridgway Dam outlet works) and percent oftailwater depth were used to describe flow conditions. Velocity measurements weredetermined using a sontek acoustic flow meter and were measured at the downstream end of the basin end sill in the center of the bay. Bottom velocities were measured 5.25 inchesabove the basin end sill. All velocities are described in terms of average velocities. Tailwaterwas set according to the tailwater curve generated for the Ridgway Dam outlet worksoperations.
Investigations
Flow conditions over the basin end sill were characterized with profiles representing averagevelocities (negative values represent velocities in the upstream direction) mapped along thevertical axis in the center of the bay for unit discharges of 29 cubic feet per second per foot(ft3/s/ft) (40-percent gate), 41 ft3/s/ft (60-percent gate), 52 ft3/s/ft (80-percent gate), and 60 ft3/s/ft (100-percent gate), as shown in figure 3. The vertical axis shows the relative depthin percent of total tailwater depth over the basin end sill. Initial investigations determined thatthe most effective position along the length of the basin was to locate the deflector directlyabove the downstream slope of the basin dentates. Once this was established, the mosteffective position along the vertical axis was investigated. Figure 3 shows that as values ofunit q increase, the thickness of the high-velocity (downstream) jet increases, thereby

8 Water Operation and Maintenance Bulletin
-2
-1
0
1
2
3
Position of Deflector
Bot
tom
Vel
ocity
nea
r E
nd S
ill (
ft/s)
D0 D 1 7 D 1 8 D 1 9 D 2 0 D 2 1
q = 29 f t³ /s/ f t
q = 41 f t³ /s/ f t
q = 52 f t³ /s/ f t
q = 60 f t³ /s/ f t
Figure 3.—Bottom velocities (average) measured for each deflector position.(D0 indicates no deflector was installed.)
lowering the transition point between upstream and downstream velocities above the basin endsill. The effectiveness of the flow deflector is dependent on the vertical location of thedeflector with respect to this transition point and its ability to trap and redirect a large enoughportion of the high-velocity jet (immediately above the transition point) to improve flowconditions. With this in mind, three vertical locations and several deflector angles wereinvestigated.
All the deflectors tested were 4.375 feet deep and were located as shown in figure 2. Deflectors D17 through D19 were positioned at an angle of 60 degrees, and deflectors D20 and D21 were positioned at 70 and 80 degrees, respectively.
Figure 4 shows bottom velocities measured near the basin end sill for deflector positions D17through D21 for each flow tested. The results of these investigations show that the per-formance of each deflector varies over the range of flows. When the deflector was positionedlow in the basin and just above the transition points of the higher flows (i.e., D17), thedeflector performed well at the high flows. However, it became ineffective as the flow wasdecreased because the transition point moved above the location of the deflector. As a result,at the lower flows, the deflector missed a major portion of the high-velocity jet because it waspositioned below it. A similar problem occurred when the deflector was positioned too high(i.e., D19). Although the deflector was in good position (just above the transition point)
Water Operation and Maintenance Bulletin 9
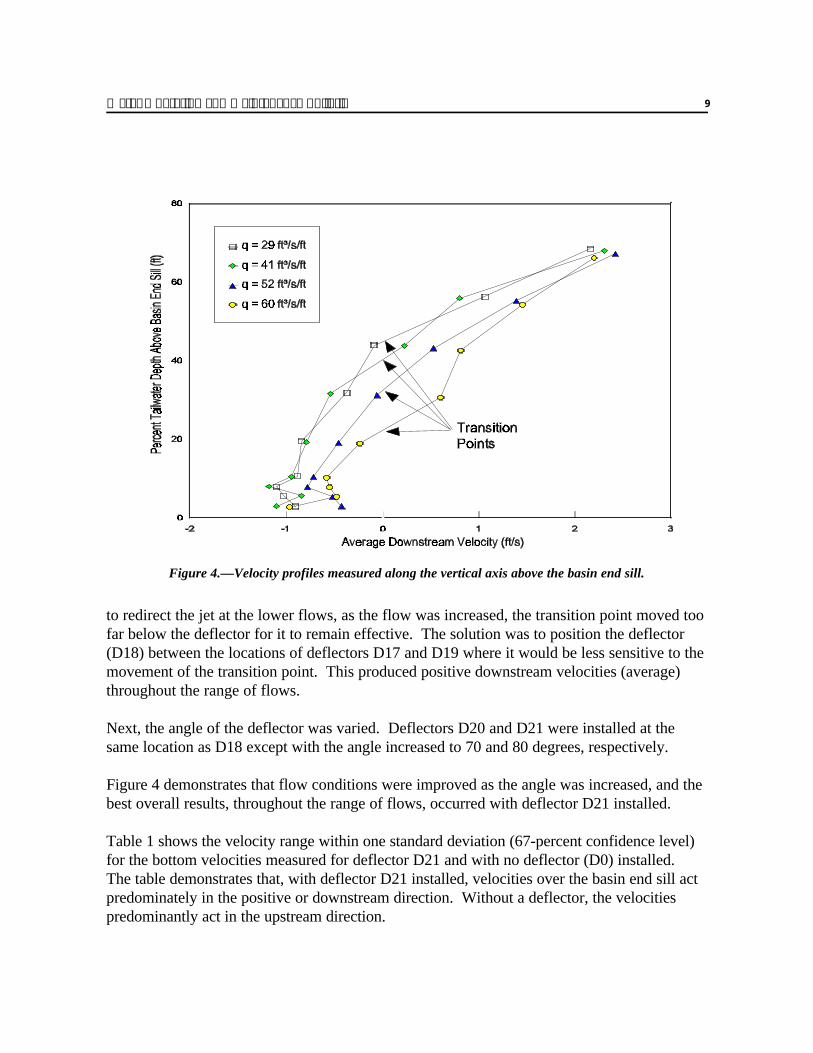
Figure 4.—Velocity profiles measured along the vertical axis above the basin end sill.
to redirect the jet at the lower flows, as the flow was increased, the transition point moved toofar below the deflector for it to remain effective. The solution was to position the deflector(D18) between the locations of deflectors D17 and D19 where it would be less sensitive to themovement of the transition point. This produced positive downstream velocities (average)throughout the range of flows.
Next, the angle of the deflector was varied. Deflectors D20 and D21 were installed at thesame location as D18 except with the angle increased to 70 and 80 degrees, respectively.
Figure 4 demonstrates that flow conditions were improved as the angle was increased, and thebest overall results, throughout the range of flows, occurred with deflector D21 installed.
Table 1 shows the velocity range within one standard deviation (67-percent confidence level)for the bottom velocities measured for deflector D21 and with no deflector (D0) installed. The table demonstrates that, with deflector D21 installed, velocities over the basin end sill actpredominately in the positive or downstream direction. Without a deflector, the velocitiespredominantly act in the upstream direction.

10 Water Operation and Maintenance Bulletin
Table 1.—Bottom velocities within one standard deviation
Deflectorposition
Velocity range within one standard deviation(feet per second)
q = 29 ft3/s/ft q = 41 ft3/s/ft q = 52 ft3/s/ft q = 60 ft3/s/ft
D21 -.14 to 2.67 -.08 to 2.56 .05 to 3.13 .14 to 3.62
D0 -2.1 to .239 -2.22 to .02 -1.62 to .43 -1.7 to .51
Each of these investigations was conducted with the tailwater depth set at a specific levelaccording to the tailwater curve for Ridgway Dam outlets works operations. Futureinvestigations will determine the best deflector positioning relative to fluctuations in tailwaterdepth.
Conclusions
Deflectors have been designed and installed at Taylor Draw Dam with marked improvementsin stilling basin flow patterns, and, based on the model study, performance of the deflectorsshow the potential for significant savings by reducing damage caused by abrasion.
The results of the Ridgway Dam hydraulic model study indicate that the effectiveness of thedeflector depends on the basin discharge and on the deflector’s relative position and sensi-tivity to the movement of the transition point throughout the range of operations. The studyshowed the deflector was most effective when it was located between 38 percent and 69 per-cent of the average tailwater depth over the full operating range and positioned at an angle of80 degrees.
Further investigations will determine if the deflector location can be generalized over largeranges of tailwater depth. If the variation of the tailwater (i.e., the operating range) is greaterthan 200 percent, a single deflector may not be effective. The structural design of thedeflectors will depend on the material used, the overall width of the stilling basin, and theangle of the deflector. Future work may also involve determining the maximum basin width atwhich the deflector design will be effective.
Further work at WRRL will include generalizing flow deflector designs for Type III stillingbasins.
References
[1] Dodge, Russ, “Hydraulic Study of Taylor Draw Dam Outlet Works,” U.S. Department ofthe Interior, Bureau of Reclamation Report R-92-10, March 1992.

Water Operation and Maintenance Bulletin 11
1 Research Hydraulic Engineer, Water Resources Research Laboratory.
Figure 1.—Section through the dam showingoutlet works.
HYDRAULIC MODEL STUDIES OF AERATION ENHANCEMENTSAT THE FOLSOM DAM OUTLET WORKS: REDUCING CAVITATION
DAMAGE POTENTIAL
by K. Warren Frizell1
Introduction
Folsom Dam is on the American River about 20 miles northeast of Sacramento, California. The dam was built by the Corps of Engineers (Corps) and transferred to the Bureau ofReclamation (Reclamation) for operation and maintenance in 1956. The dam is a concretegravity structure 340 feet high and impounds a reservoir of a little over 1 million acre-feet.
The dam features two tiers of four outletseach (figure 1), controlled by 5- by 9-footslide gates. The outlets consist ofrectangular conduits of formed concretepassing through the dam and exiting onthe face of the service spillway. Historically, the outlets have not beenoperated much. Flood releases in 1955,1963, and 1964 resulted in cavitationdamage initiating at the constriction onthe crown of the outlets just upstreamfrom the junction with the spillway face. The 1955 flood conditions were studiedby the Corps using the model for RedRock Dam which had a similar outletconfiguration (Corps, 1965). These testsrevealed scaled vapor pressure readings atseveral piezometer locations near wherethe damage had occurred. Reclamationstudied the problem using a 1:16.7 scalesectional model of one of the upper tieroutlets (Isbester, 1971). An eyebrow-type flow deflector was tested and laterinstalled at Folsom over each outlet exit(figure 2). Besides the eyebrow, a gateoperating restriction of 60-percent maximum was set when combining outlet works flows withspillway flows. These modifi-cations to the structure and operating criteria have performedwell over the years, and no additional damage has occurred at the outlet/spillway junction.
12 Water Operation and Maintenance Bulletin
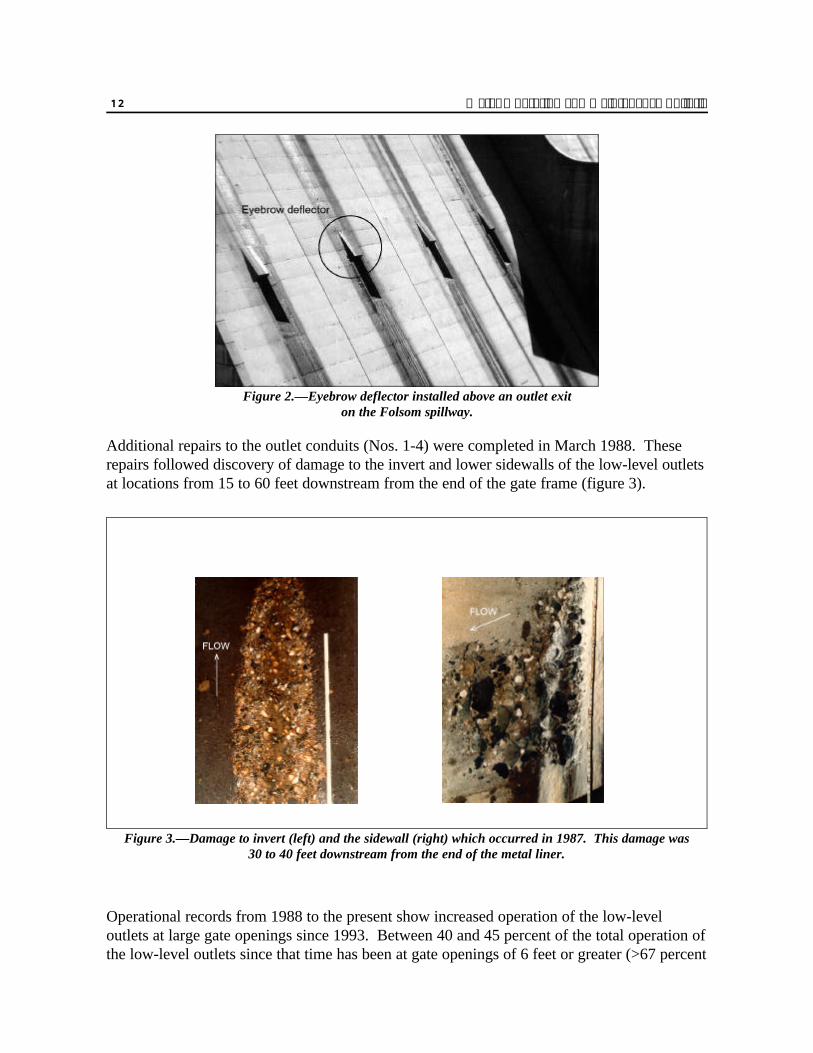
Figure 2.—Eyebrow deflector installed above an outlet exiton the Folsom spillway.
Figure 3.—Damage to invert (left) and the sidewall (right) which occurred in 1987. This damage was30 to 40 feet downstream from the end of the metal liner.
Additional repairs to the outlet conduits (Nos. 1-4) were completed in March 1988. Theserepairs followed discovery of damage to the invert and lower sidewalls of the low-level outletsat locations from 15 to 60 feet downstream from the end of the gate frame (figure 3).
Operational records from 1988 to the present show increased operation of the low-leveloutlets at large gate openings since 1993. Between 40 and 45 percent of the total operation ofthe low-level outlets since that time has been at gate openings of 6 feet or greater (>67 percent

Water Operation and Maintenance Bulletin 13
Figure 4.—Damage to conduits 3 and 4, low-level outlets, May 1997.
Figure 5.—Damage to invert of conduit 2. Left photo is at the end of the steel liner.Note the pattern of damage on the right photo.
open). This change in operations was due to revisions of the operation plan calling for morefrequent use of the outlets in order to reduce the chance of exceeding levee capacity down-stream and also to supplement flows during repair of the spillway gates.
During major releases in the winter of 1996-97, observers noted that the trajectories of thedischarge from outlet Nos. 3 and 4 were falling short of those from outlet Nos. 1 and 2. Inspections in May 1997 revealed major damage due to cavitation in outlet Nos. 3 and 4(figure 4), minor damage in outlet No. 2 (figure 5), and little or no damage in numbers 1, 5, 6,7, and 8.

14 Water Operation and Maintenance Bulletin
12" Gate Valve
12" Pipe
12" Pipe
Slide Gate
5' X 9' Conduit
Tailbox addition
Existing BoxControl Gate
About 11 ft
Figure 6.—Elevation of the 1:12 scale hydraulic sectional model.
Vm
gLm
'Vp
gLp (1)
This damage was initiated by cavitation and accelerated by a combination of both cavitationand abrasion. Abrasion damage is probably primarily responsible for the deep lateral extent ofthe damage in outlet Nos. 3 and 4, especially along the construction joints. There was awidely varying degree of damage between outlets 1, 2, 3, and 4. Cavitation intensity is largelya function of pressure and velocity, so the variation in damage is attributable to very low,localized pressures downstream from the gates due to air starvation. Previous studies haveshown the manifold system to be undersized for the expected air demand. Outlets 3 and 4 areat the end of the air manifold that brings air to the conduits.
Model Studies
A 1:12 scale Froude-based hydraulic model of a single low-level outlet gate and conduit wasconstructed in Reclamation’s Water Resources Research Lab. This model was used to verifypresent operating conditions as well as test modifications aimed at preventing future cavita-tion damage. The sectional model included the 5- by 9-foot slide gate and the rectangularconduit downstream from the gate. The junction between the outlet and the spillway was alsomodeled to allow observations of combined spillway and outlet works operations with anyproposed modification to the structure (figure 6).
The model similitude was based on equating the Froude numbers of the model and theprototype:
where:
V = velocityL = lengthg = gravitational accelerationm = modelp = prototype

Water Operation and Maintenance Bulletin 15
This lead to the following scale relationships when a common fluid (water) is used in bothmodel and prototype: Lp=12Lm, Vp=3.464Vm, and Qp=498.83Qm. The scale was chosen dueto the desire to measure air demand characteristics. Model Reynolds Numbers ranged from1.5 x 105 to 2 x 10⁵. Prior research has shown that to model free surface flows with airentrainment, the flows in the model need to be fully turbulent, Rem$105 (Wood, 1991). Muchof the prior defining work was done on spillway aerators—a similar concept to themodifications which were tested in this gate model.
Data were collected for a range of reservoir elevations and gate openings. At each point,water discharge was measured using venturi meters. The venturi meters were calibratedagainst a weigh tank and provide discharge accuracy to within 0.1 percent. Pressures alongthe conduit invert downstream from the regulating gate were measured using piezometers withwater manometers. Piezometer taps were located along the centerline of the invert of the 5-by 9-foot conduit at 9.25, 11.5, 12.5, 16.5, and 22.5 feet downstream from the regulatinggate. The amount of air flowing into the conduit downstream from the regulating gate wasmeasured using an orifice plate with three different sized orifices. Multiple orifice plates wereused in order to simulate various loss coefficients in the vent/manifold system, includingK=1.55, K=6.91, and K=28.85.
Calculations based on Isbester’s study showed the air vent system to be well undersized. The5-foot-diameter air intake header would not be able to carry the full capacity with all gatesoperating. In addition to increasing the air vent capacity, a more effective method to distri-bute the air to the sidewalls and invert downstream from the gates was needed. Previousstudies on aeration slots and ramps (Beichley, 1975; Beichley and King, 1975; Pinto et al.,1984; Volkart and Rutschmann, 1986) have shown them to be effective in reducing thepotential for cavitation damage in outlet works and on spillways. The addition of even smallquantities of air into the flow along boundaries has proven effective in eliminating cavitationdamage (Peterka, 1953).
The model was first used to verify data for the as-built condition. Once this was completed,an insert resembling the constriction in a jet-flow gate was installed and tested. The 6-inch-high ramp angled at 45 degrees yielded a large reduction in discharge capacity (20 to 25 per-cent) and was abandoned in favor of reduced slope, smaller offset ramps. Three differentaeration ramp configurations were tested. These ramps were placed just downstream from theregulating gate. All ramps had a 15-inch horizontal length, yielding offsets of 3 inches and 1.5inches for the 1:5 and 1:10 ramps, respectively. The modifications which were tested areshown on figure 7. These ramps were designed to allow air from the present vent system to bedistributed down the sidewalls and along the conduit floor.
Results
Model experiments began with measurements of the original as-built conditions. Dischargecharacteristics, along with air demand and pressures downstream from the gate, were

16 Water Operation and Maintenance Bulletin
Figure 7.—Ramp configurations tested in the hydraulic scale model.
measured. Figure 8 shows the as-built discharge for one lower-level outlet conduit. Resultsfrom three reservoir elevations ranging from 400 feet to 450 feet are reported. The airdemand is shown on figure 9, and results are reported for a vent/manifold loss factor, K=6.91. Piezometric pressures downstream from the gate are reported on figure 10.

Water Operation and Maintenance Bulletin 17
Figure 8.—Discharge for one, low-level outlet conduit, as-built conditions.
Figure 9.—Air demand for a low-level outlet conduit, as-built conditions.
Figure 10.—Pressures on the conduit invert, downstream from the regulating gate.Reservoir elevation 450 feet.
18 Water Operation and Maintenance Bulletin
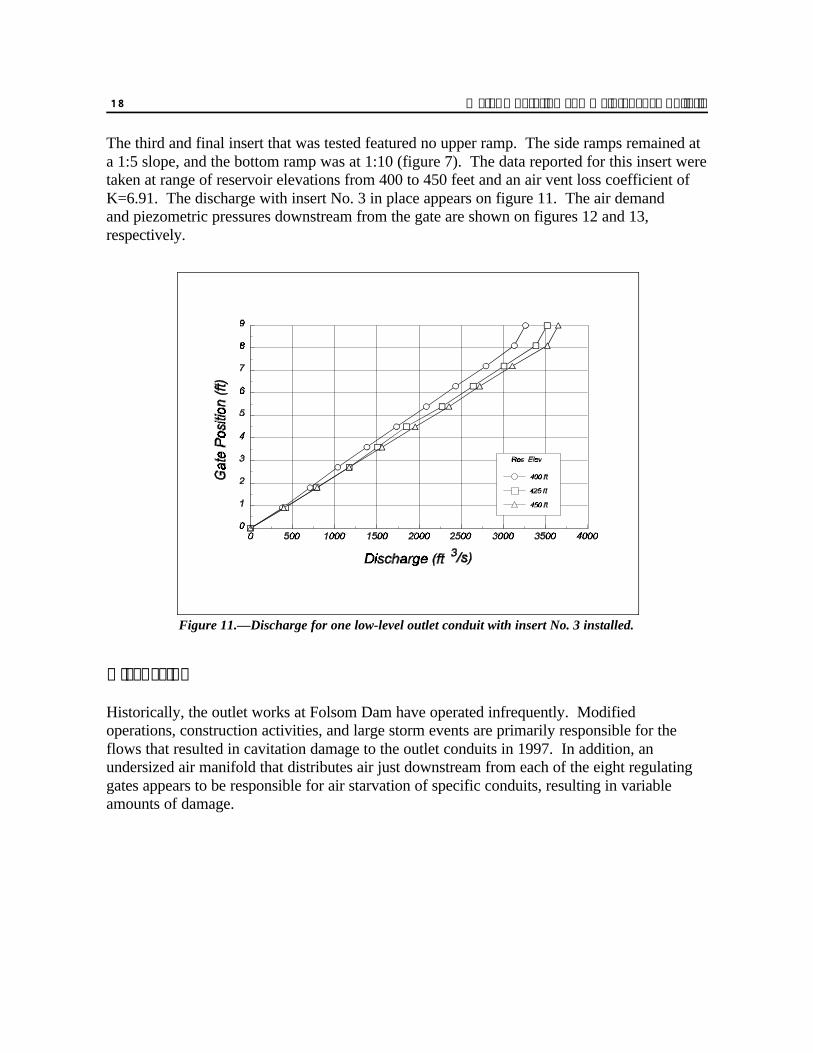
Figure 11.—Discharge for one low-level outlet conduit with insert No. 3 installed.
The third and final insert that was tested featured no upper ramp. The side ramps remained ata 1:5 slope, and the bottom ramp was at 1:10 (figure 7). The data reported for this insert weretaken at range of reservoir elevations from 400 to 450 feet and an air vent loss coefficient ofK=6.91. The discharge with insert No. 3 in place appears on figure 11. The air demand and piezometric pressures downstream from the gate are shown on figures 12 and 13,respectively.
Discussion
Historically, the outlet works at Folsom Dam have operated infrequently. Modifiedoperations, construction activities, and large storm events are primarily responsible for theflows that resulted in cavitation damage to the outlet conduits in 1997. In addition, anundersized air manifold that distributes air just downstream from each of the eight regulatinggates appears to be responsible for air starvation of specific conduits, resulting in variableamounts of damage.

Water Operation and Maintenance Bulletin 19
Figure 12.—Air demand for one low-level outlet conduit with insert No. 3 installed.
Figure 13.—Piezometric pressures downstream of the regulating gatewith insert No. 3 in place.

20 Water Operation and Maintenance Bulletin
F'Po&Pv
DVo2/2
(2)
Analysis of the cavitation potential for the mean flow shows a cavitation index greater than0.2, where the cavitation index is given by:
where:Po = reference pressure and Pv = vapor pressureVo = reference velocityD = density of water
Usually, no damage occurs at F $ 0.2 (Falvey, 1990). However, localized flow features, suchas vortices, can still carry a vapor core and cause damage during collapse and implosion of thevortex core. The damage patterns which have occurred in the Folsom outlets showcharacteristics of damage resulting from shear layers or vortices emanating from the gates or gate slots.
Air demands measured for the as-built condition (no ramps) showed a substantial air flow into the conduit behind the gate. At a reservoir elevation of 450 feet, a maximum demand of2,400 cubic feet per second (ft3/s) was measured for a single low-level outlet. The cor-responding demand for an upper-level outlet would be about 1,600 ft3/s. Using these data, atotal air flow requirement, if all eight gates were operating at a reservoir elevation of 450 feet,would be about 16,000 ft3/s of air. With the present 5-foot-diameter air header, velocitieswould easily exceed the design limitations of maintaining subsonic flow.
Solving the damage problem appears to be two-fold; an increase in the capacity of the airmanifold that supplies air to the regulating gates is needed, as well as a method to betterdistribute the air to the locations which need it (i.e., the invert and sidewalls just downstreamfrom the gates).
Previous and present model studies reinforced the fact that the current air header (5-foot-diameter) is well undersized, restricting the quantities of air which are distributed to each ofthe eight outlet gates. A new air intake was designed and constructed at Folsom Dam. Thisintake was sized based on trying to limit air velocities in the vent to 100 feet per second. Inaddition, the size was increased slightly to facilitate construction. The new vent was drilledand blasted from the left abutment and joined with the existing 5-foot-diameter air header. The system was then split by installation of a bulkhead, allowing four outlet gates to besupplied by the existing system and four gates to be supplied by the new air intake.
The introduction of air into an area where cavitation damage potential exists can be aneffective way to lessen or eliminate possible damage which might result. A standard methoddeveloped over the years is to separate the flow from the boundary and allow air to be pulledto the area naturally by the low pressures created by the separation. This method has beenused on many spillway applications, and, while it has not seen wide application on outletworks, it has also been effective.

Water Operation and Maintenance Bulletin 21
The effectiveness of an aeration ramp is not strictly evaluated on the amount of air which ispulled into the vent. Of more concern is how well the air is distributed along the sidewalls andinvert areas of the structure in question. Even though the as-built condition has a large airdemand, most of the air just passes down the conduit along the top of the water flow withoutmixing effectively. This is due to the very rough water surface and large amounts of spraygenerated by the gate operation. A properly designed aeration ramp or slot can effectivelydistribute air to regions of the conduit which need protection. Figures 14 and 15 show modelphotos comparing the as-built with insert No. 3.
Insert No. 3 performed well throughout the testing and was chosen as the final design to beinstalled in the prototype. This insert can be welded to the existing steel liner, allowing foreasy installation. The insert reduces the flow area by 11.25 percent at the point of the largestconstriction; however, a discharge reduction of only 2 to 3 percent was measured.
With the combination of the new aeration ramp and construction of an additional air intakemanifold (over doubling the capacity), operation of the outlet works should be possiblewithout any additional cavitation damage.
References
Beichley, G.L. and D.L. King. 1975. "Cavitation Control by Aeration of High-Velocity Jets,"Journal of the Hydraulics Division, ASCE, vol. 101, No. HY7, pp. 829-846.
Falvey, Henry T. 1990. Cavitation in Chutes and Spillways, Engineering Monograph No. 42, Bureau of Reclamation, Denver, CO.
Isbester, T.J. 1971. Hydraulic Model Studies of the Folsom Spillway-Outlet Junction, REC-ERC-71-12, Bureau of Reclamation, Denver, CO.
Peterka, A.J. 1953. "The Effect of Entrained Air on Cavitation Pitting," Proceedings of theJoint Meeting of the International Association for Hydraulic Research and the AmericanSociety of Civil Engineers, Minneapolis, MN.
Pinto, N.L. de S., S.H. Neidert, and J.J. Ota. 1982. "Prototype and Laboratory Experimentson Aeration at High Velocity Flows," Report No. 36, Centro de Hydraulica e HidrologiaProf. Parigot de Souza, Universidade Federal do Parana, Curitiba, Brazil.
U.S. Army Corps of Engineers. 1965. "Spillway and Sluices, Red Rock Dam, Des MoinesRiver, Iowa," Technical Report No. 2-673, Waterways Experiment Station, Vicksburg,MS.

22 Water Operation and Maintenance Bulletin
Volkart, P. and P. Rutschmann. 1986. "Aerators on Spillway Chutes: Fundamentals andApplication," Proceedings of the ASCE Specialty Conference on Advancements inAerodynamics, Fluid Mechanics, and Hydraulics, Minneapolis, MN.
Wood, I.R. (editor). 1991. Air Entrainment in Free-Surface Flows, International Associationfor Hydraulic Research, Hydraulic Structures Design Manual 4, A.A. Balkema, Rotterdam,Netherlands.

Water Operation and Maintenance Bulletin 23
a) Gate position is 90 percent, head is450 feet, as-built. Air vent ispressurized (note stream of waterpouring out of air vent).
b) Gate position is 90 percent, head is450 feet, final design aeration rampinstalled just downstream from thegate slot. Note air vent is notpressurized, and air is beingcarried all the way to the floor.
Figure 14.—Comparison of as-built and final design for a gate opening of 90 percent at a head of 450 feet.

24 Water Operation and Maintenance Bulletin
a) Gate position 50 percent, head 450 feet, as-built configuration. Note that aeration appears to belocalized at the free surface.
b) Gate position 50 percent, head is 450 feet. Insert No. 3 aeration rampinstalled. Note that air is carrieddown to the conduit floor, allowingfor aeration over the entire fluidstream.
Figure 15.—Comparison of as-built configuration with the final design aeration ramp.Gate position 50 percent (5.5 feet open) at a head of 450 feet.

Water Operation and Maintenance Bulletin 25
1 Materials Engineering and Research Laboratory, D-8180, Bureau of Reclamation, Denver,Colorado 80225; phone: (303) 445-2386; e-mail: [email protected]
NONDESTRUCTIVE TESTING OF LARGE CONCRETE DAMS
by William F. Kepler, P.E.1
It is not very likely that the Bureau of Reclamation (Reclamation) will build a new concretedam in the foreseeable future. Since a majority of Reclamation’s large concrete dams havereached their 50-year design life, we have been focusing our efforts on evaluating andrepairing our existing infrastructure. The primary focus of a large concrete dam evaluation is to determine the structure's ability to withstand a major earthquake or flooding conditions. The dam's reaction depends on the mechanical strength developed throughout the complexdiscontinuous mass of the structure. One of our biggest concerns during the evaluation is thatwe have no idea of what is going on inside a large dam.
The traditional method for determining the physical properties of a concrete dam is to extractlarge core samples drilled from the top of the dam down to the foundation and then des-tructively tested to determine strength and elastic modulus. This information is then used in a finite element model to simulate responses of the structure to various loading conditions. Depending on the size of the structure, two to four drill holes are cored down to the founda-tion, often a distance of more than 300 feet. Large-diameter cores (10 to 12 inches indiameter) are required to provide representative samples. Extracting this amount of largediameter concrete cores is very expensive. In addition, although a coring program of thismagnitude is considered sufficient, it only samples a very small percentage of the dam volume,typically less than 0.1 percent. This procedure cannot, therefore, be expected to find mostlocal anomalies, such as regions of disbonded lift lines, cracks, or weak areas. A new testingprocedure is required that will provide a more thorough evaluation of the physical propertiesof the dam and that is less expensive than a full coring program.
In 1994, while working with researchers at the University of Colorado, the MaterialsEngineering Laboratory developed a radical new concept for looking inside large concretedams. We combined aspects of ultrasonic nondestructive testing of small concrete structures,nondestructive evaluation of interfaces, and shallow seismic surveying into "Acoustic TravelTime Tomography," (ATTT).
Acoustic testing can provide reliable estimates of the modulus of elasticity and compressivestrength of hardened concrete. This method uses a sparse array of receivers and an impulsesource. The proposed procedures can not only determine both local and global bulk modulusand strength values of a structure but can also locate cracks, voids, and anomalies within thestructure. ATTT increase the percentage of the dam volume inspected and is cheaper than afull-blown coring program.

26 Water Operation and Maintenance Bulletin
The basic premise of our new testing procedure is that the velocity of sound remains fairlyconstant in concrete. The velocity is a function of the density of concrete, the modulus ofelasticity, and Poisson’s ratio. In good concrete, these three properties do not vary. However, in cracked concrete, the velocity drops significantly. In addition, sound wavescannot travel through a crack larger than 0.003 inch thick.
By placing sensors on the top and sides of the dam, and possibly in the adits (as shown infigure 1), we can measure the velocity within the structure. We generate the sound wave byhitting the dam with a hammer connected to the data acquisition system. By using a simple,off-the-shelf, tomographic program, we can map the velocities as they change within the dam. This allows us to find weak areas, cracks, and other anomalies inside the structure. It is justlike performing a CAT Scan on a dam—only simpler.
Now we have had our fair share of detractors ("experts" who said it could not be done). But,with a lot of hard work, and more than a little late night ingenuity, we developed a workingsystem. It has been so successful that we have applied for a patent on the technique.
This has been a fun and exciting research project because we were doing something that hadnever been done before, and it had a direct effect on how we looked at large concrete dams. The research program was divided up into four phases: in the first phase, we developed thebasic concept and tested it in the laboratory; in the second phase, we tested the concept on asection of a concrete dam; in the third phase, we went back to that concrete dam andimproved our testing techniques and equipment and compared our test results to core takenfrom the structure; in the fourth phase, we determined the accuracy and reliability of thetesting technique. I wanted to make sure that I was not just “blowing smoke” about the testresults.
In the beginning, we tested a piece of concrete core sample in the laboratory. This sample wasbroken in half and then grouted back together, leaving a crack that went half way through thecore, as shown in figure 2. We placed transducers on each end and made simple velocitymeasurements through the uncracked concrete and through the cracked section. The resultswere "bang on" to the expected values. At the same time, we were testing concrete core fromHoover Dam. That concrete was in great shape. It was so good that we could not find a liftline in the core. This is a group of engineers and technicians that look at concrete for a living,and we could not find a lift line to save our lives. We knew where it was supposed to be, butthat did not help either. We even x-rayed the core and had no luck. So, on a lark, we con-nected up our sensors to the core and tested it. The results are shown in figure 3. The lift linedetermined by the nondestructive testing was within 1.0 inch of where it was supposed to be.
The next step in the testing process was to go to a concrete dam and test a section just to see if our method would work on the large scale. We selected Barker Dam (owned by PublicService) because it is close to our lay, it is easy to get to the top of the dam, and it’s designand construction are similar to Reclamation dams. In this phase, we only tested the top 20 feet of the dam. This part of the dam has a rectangular shape, which made it easier toreduce the data.

Water Operation and Maintenance Bulletin 27
1.0'
3.0'
3.0'
5.0'
5.0'
7.0'
9.0'
11.0'
13.0'
15.0'
17.0'
4.0' 6.0' 8.0'
Receiver
Source
Known Crack
Figure 1.—Source and receiver locations.

28 Water Operation and Maintenance Bulletin
CrackTransmitter Receiver
Grout300 mm600 mm
32
1
432
1
4
Figure 2.—Laboratory tests on a partially cracked piece of concrete core.
Nor
mal
ized
Rel
ativ
e D
elay
1 2 3 4 5Distance along test specimen (ft.)
Lift
Lin
e Po
sitio
n
60.0
0.5
1.0
Figure 3.—Travel time measurements on a piece of Hoover Dam core.
Water Operation and Maintenance Bulletin 29
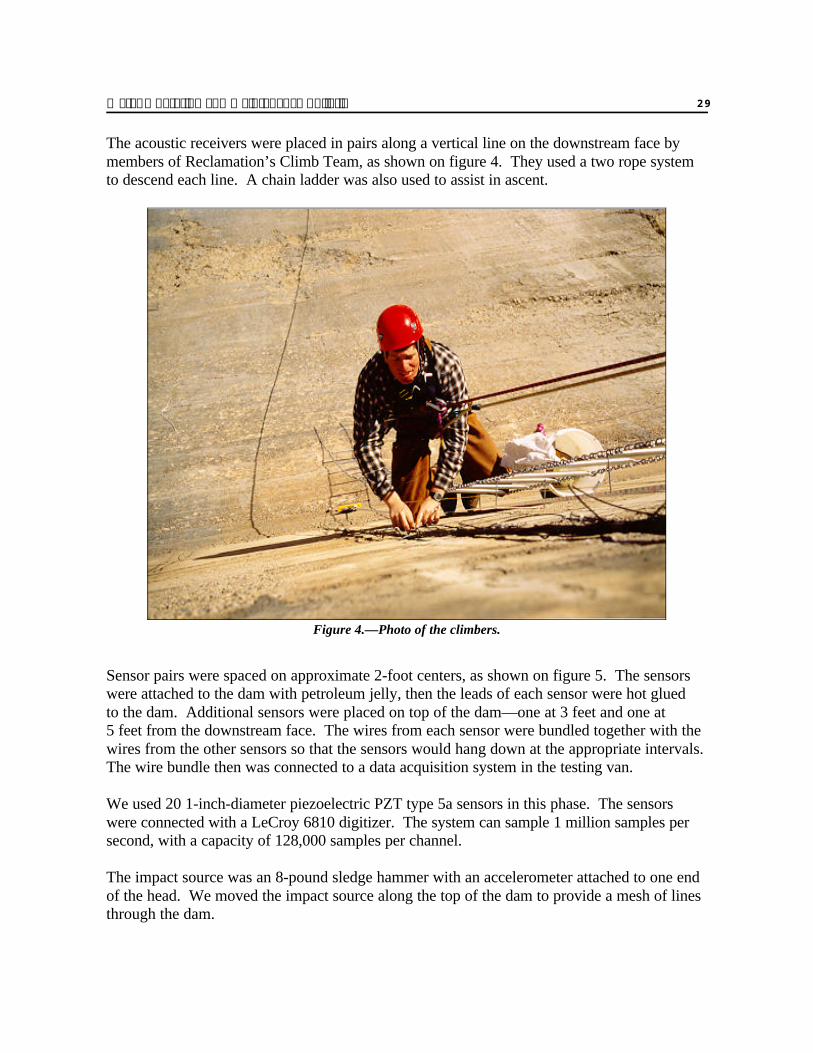
Figure 4.—Photo of the climbers.
The acoustic receivers were placed in pairs along a vertical line on the downstream face bymembers of Reclamation’s Climb Team, as shown on figure 4. They used a two rope systemto descend each line. A chain ladder was also used to assist in ascent.
Sensor pairs were spaced on approximate 2-foot centers, as shown on figure 5. The sensorswere attached to the dam with petroleum jelly, then the leads of each sensor were hot glued to the dam. Additional sensors were placed on top of the dam—one at 3 feet and one at 5 feet from the downstream face. The wires from each sensor were bundled together with thewires from the other sensors so that the sensors would hang down at the appropriate intervals. The wire bundle then was connected to a data acquisition system in the testing van.
We used 20 1-inch-diameter piezoelectric PZT type 5a sensors in this phase. The sensorswere connected with a LeCroy 6810 digitizer. The system can sample 1 million samples persecond, with a capacity of 128,000 samples per channel.
The impact source was an 8-pound sledge hammer with an accelerometer attached to one endof the head. We moved the impact source along the top of the dam to provide a mesh of linesthrough the dam.

30 Water Operation and Maintenance Bulletin
Figure 5.—Photo of the receivers.
It worked! As you can see in figure 6 and the following table, the basic concept worked.
Comparison between known horizontal crack locations and the tomographicestimate of the crack locations in the top 17 feet of Barker Dam.Shown is the vertical distance from the top of the dam in feet.
Block 4-14 North Block 4-24 North
Known cracklocation
Tomographicestimate of crack
locationKnown crack
location
Tomographicestimate of crack
location
2.0 3.0 1.5 1.8
4.5 Not apparent 4.5 4.6
8.4 8.3 8.4 8.6
10.8 10.8 10.8 10.5
14.5 14.5 14.4 14.4
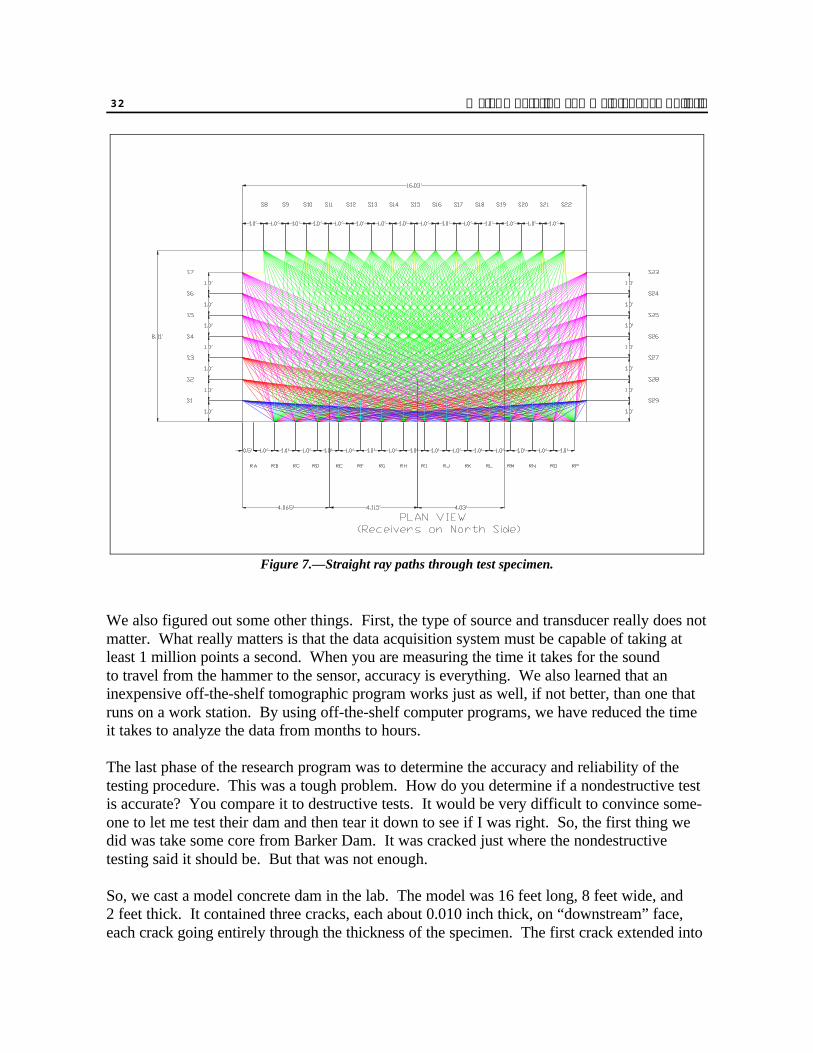
We went back to Barker Dam the next year to improve our testing techniques. We placedtransducers on the top and downstream face of the dam and then hit it with a sledge hammeron the upstream face. This gave us a much better test mesh, as shown on figure 7.

Water Operation and Maintenance Bulletin 31
Figure 6.—Initial tomograph of Barker Dam.
32 Water Operation and Maintenance Bulletin
Figure 7.—Straight ray paths through test specimen.
We also figured out some other things. First, the type of source and transducer really does notmatter. What really matters is that the data acquisition system must be capable of taking atleast 1 million points a second. When you are measuring the time it takes for the sound to travel from the hammer to the sensor, accuracy is everything. We also learned that aninexpensive off-the-shelf tomographic program works just as well, if not better, than one thatruns on a work station. By using off-the-shelf computer programs, we have reduced the timeit takes to analyze the data from months to hours.
The last phase of the research program was to determine the accuracy and reliability of thetesting procedure. This was a tough problem. How do you determine if a nondestructive testis accurate? You compare it to destructive tests. It would be very difficult to convince some-one to let me test their dam and then tear it down to see if I was right. So, the first thing wedid was take some core from Barker Dam. It was cracked just where the nondestructivetesting said it should be. But that was not enough.
So, we cast a model concrete dam in the lab. The model was 16 feet long, 8 feet wide, and 2 feet thick. It contained three cracks, each about 0.010 inch thick, on “downstream” face,each crack going entirely through the thickness of the specimen. The first crack extended into

Water Operation and Maintenance Bulletin 33
T h e o r e t i c a l v s . A c t u a l T r a v e l T i m e s
0
2 0 0
4 0 0
6 0 0
8 0 0
1 0 0 0
1 2 0 0
1 4 0 0
1 6 0 0
1 8 0 0
0 2 0 0 4 0 0 6 0 0 8 0 0 1 0 0 0 1 2 0 0 1 4 0 0 1 6 0 0 1 8 0 0
T h e o r e t i c a l T r a v e l T i m e ( µ s e c )
Mea
sure
d T
rave
l Tim
e (µ
sec)
Figure 8.—Theoretical travel time versus actual test measurements (±10 percent lines are also shown).
the model 1.0 foot, the second crack extended in 2.0 feet, and the third crack extended in 4.0 feet. We then tested the model just as we would a real dam. Then, we compared theactual test results with the theoretical travel time from the source, around each crack, to thesensor.
As any lab hand knows, concrete is not easy to test. Test results never match up well—anytime the correlation between two tests is greater than 60 percent, we are happy. Thecorrelation for this nondestructive testing technique is 99.5 percent. Figure 8 shows themeasured travel time compared to the theoretical travel time. This figure also shows the ±10 percent lines. Ninety-five percent of the actual data are within ±5.6 percent of thetheoretical travel times.
Conclusions
The Materials Engineering and Research Laboratory has developed a new way to look inside aconcrete dam by measuring the velocity of sound as it passes through the structure. Thetechnique is inexpensive and very accurate. The techniques we have developed can also beused on other structures.

Mission
The mission of the Bureau of Reclamation is to manage, develop, andprotect water and related resources in an environmentally andeconomically sound manner in the interest of the American public.
The purpose of this bulletin is to serve as a medium of exchanging operation andmaintenance information. Its success depends upon your help in obtaining andsubmitting new and useful operation and maintenance ideas.
Advertise your district’s or project’s resourcefulness by having an article published inthe bulletin—let us hear from you soon!
Prospective articles should be submitted to one of the Bureau of Reclamation contactslisted below:
Jerry Fischer, Technical Service Center, ATTN: D-8470, PO Box 25007, Denver,Colorado 80225-0007; (303) 445-2748, FAX (303) 445-6381; email: [email protected]
Vicki Hoffman, Pacific Northwest Region, ATTN: PN-3234, 1150 North Curtis Road,Boise, Idaho 83706-1234; (208) 378-5335, FAX (208) 378-5305
Dena Uding, Mid-Pacific Region, ATTN: MP-430, 2800 Cottage Way, Sacramento,California 95825-1898; (916) 978-5229, FAX (916) 978-5290
Bob Sabouri, Lower Colorado Region, ATTN: BCOO-4844, PO Box 61470, BoulderCity, Nevada 89006-1470; (702) 293-8116, FAX (702) 293-8042
Don Wintch, Upper Colorado Region, ATTN: UC-258, PO Box 11568, Salt LakeCity, Utah 84147-0568; (801) 524-3307, FAX (801) 524-5499
Tim Flanagan, Great Plains Region, ATTN: GP-2400, PO Box 36900, Billings,Montana 59107-6900; (406) 247-7780, FAX (406) 247-7793