water desalination: when and where will it make sense?
TRANSCRIPT
© Fraunhofer ISE
Washington, Feb. 21 2011
Water Desalination:When and Where Will it Make Sense?
Joachim Koschikowski
Fraunhofer Institute forSolar Energy Systems ISEFreiburg, [email protected]
www.ise.fraunhofer.de
© Fraunhofer ISE
Agenda
Water demand and scarcityDesalination: basic considerations Desalination: introduction of technologies Desalination: Implementation and statisticsDesalination and renewables Conclusions
© Fraunhofer ISE
Water demand and scarcity
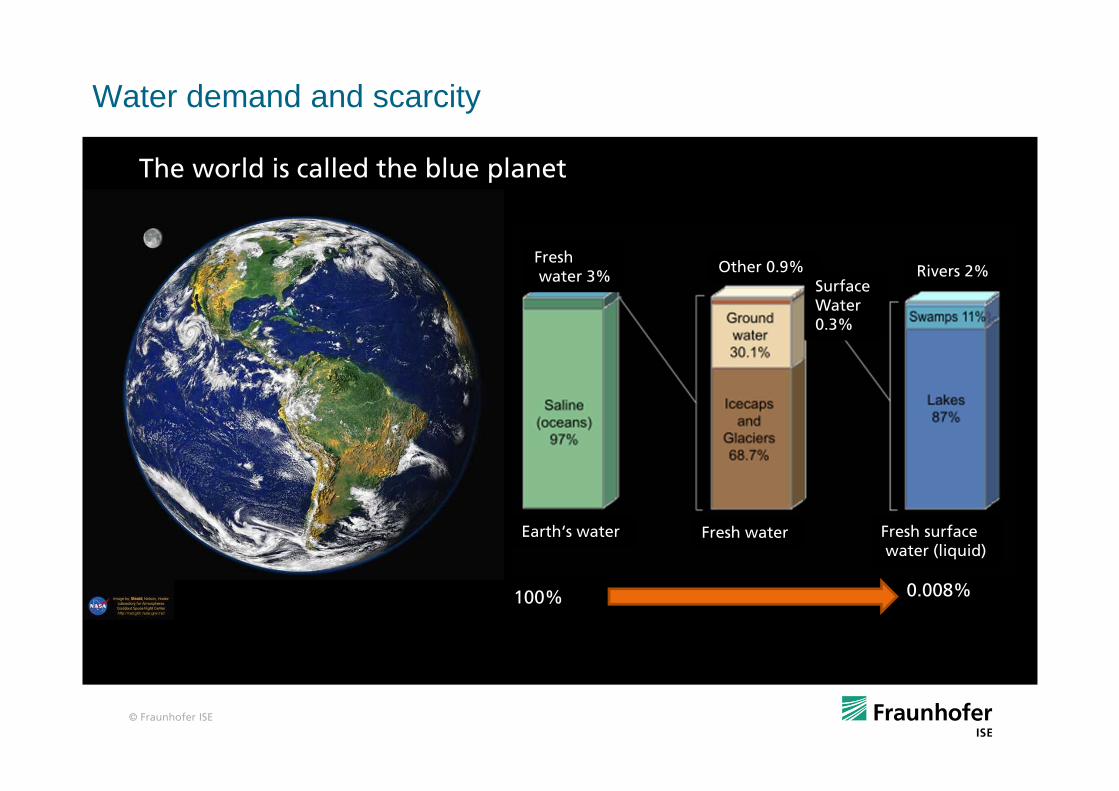
The world is called the blue planet
Earth‘s water Fresh water Fresh surfacewater (liquid)
Freshwater 3%
Earth‘s water
Other 0.9% SurfaceWater0.3%
Rivers 2%
0.008%100%

© Fraunhofer ISE
Historical development of world population
World population in billionAverage annual growth in 10 years
Water demand and scarcity
© Fraunhofer ISE
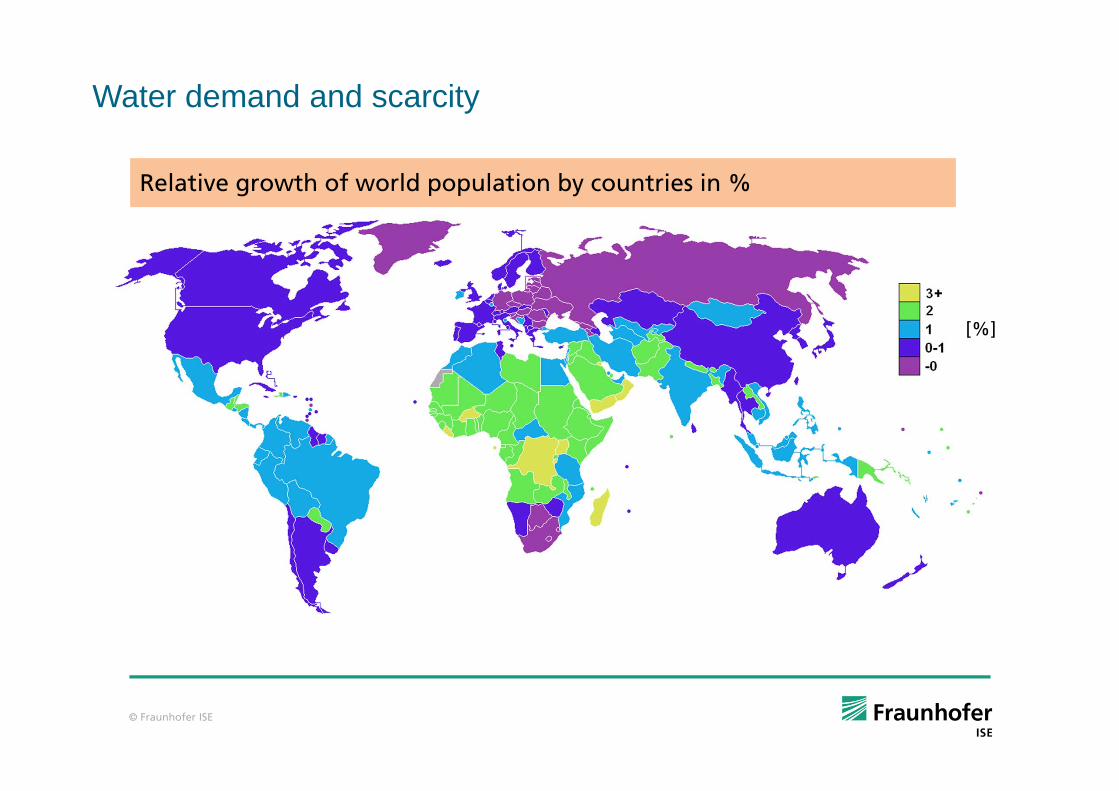
Relative growth of world population by countries in %
[%]
Water demand and scarcity
© Fraunhofer ISE
Wo
rld
wat
er d
eman
d [
bill
ion
m³
/ yea
r]
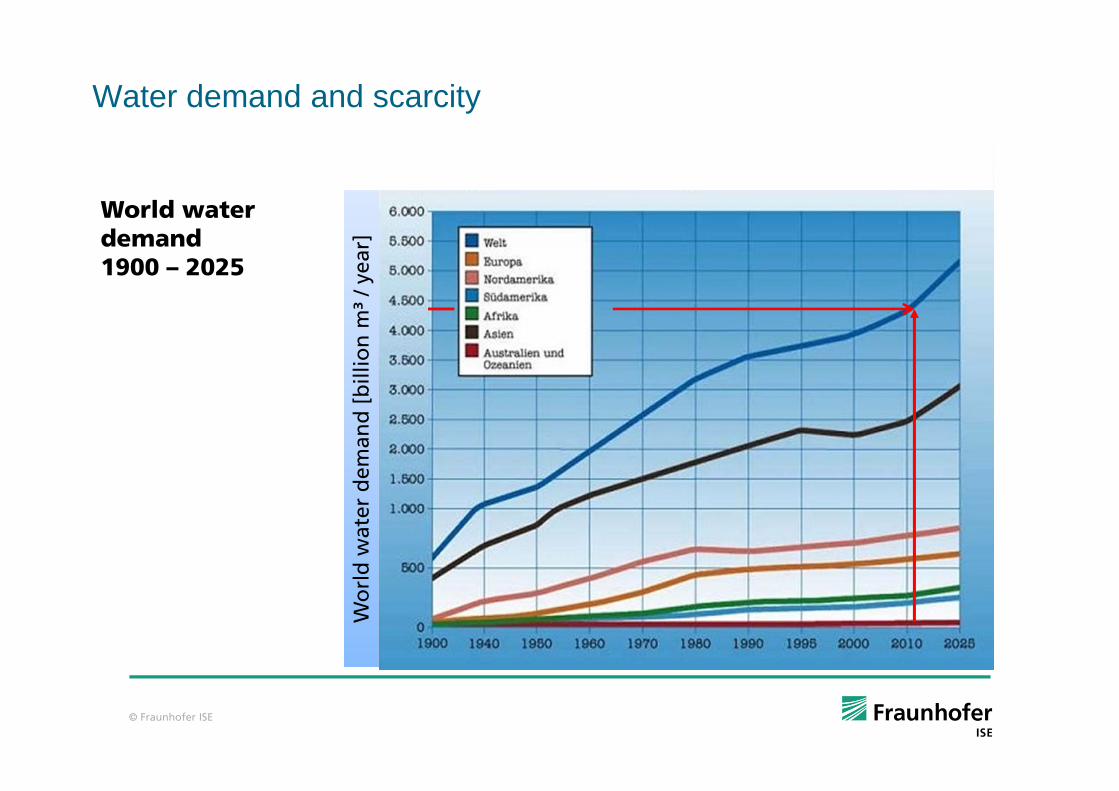
World waterdemand1900 – 2025
Water demand and scarcity
© Fraunhofer ISE
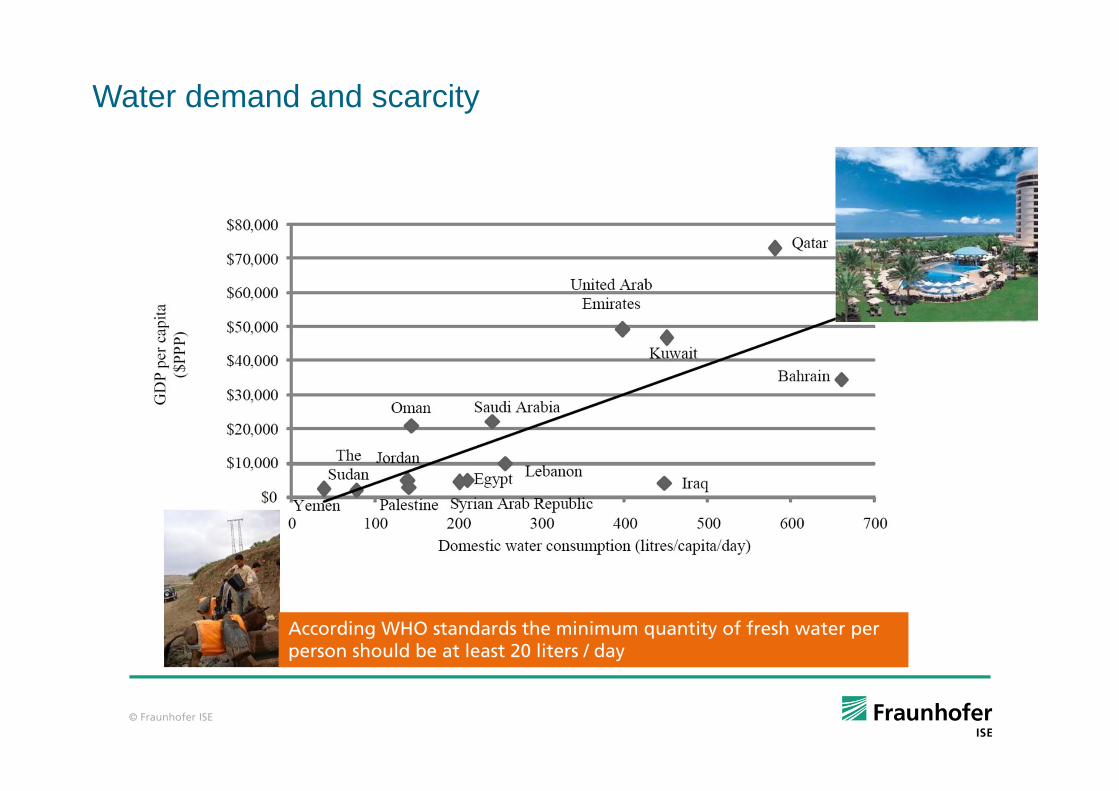
According WHO standards the minimum quantity of fresh water per person should be at least 20 liters / day
Water demand and scarcity
© Fraunhofer ISE
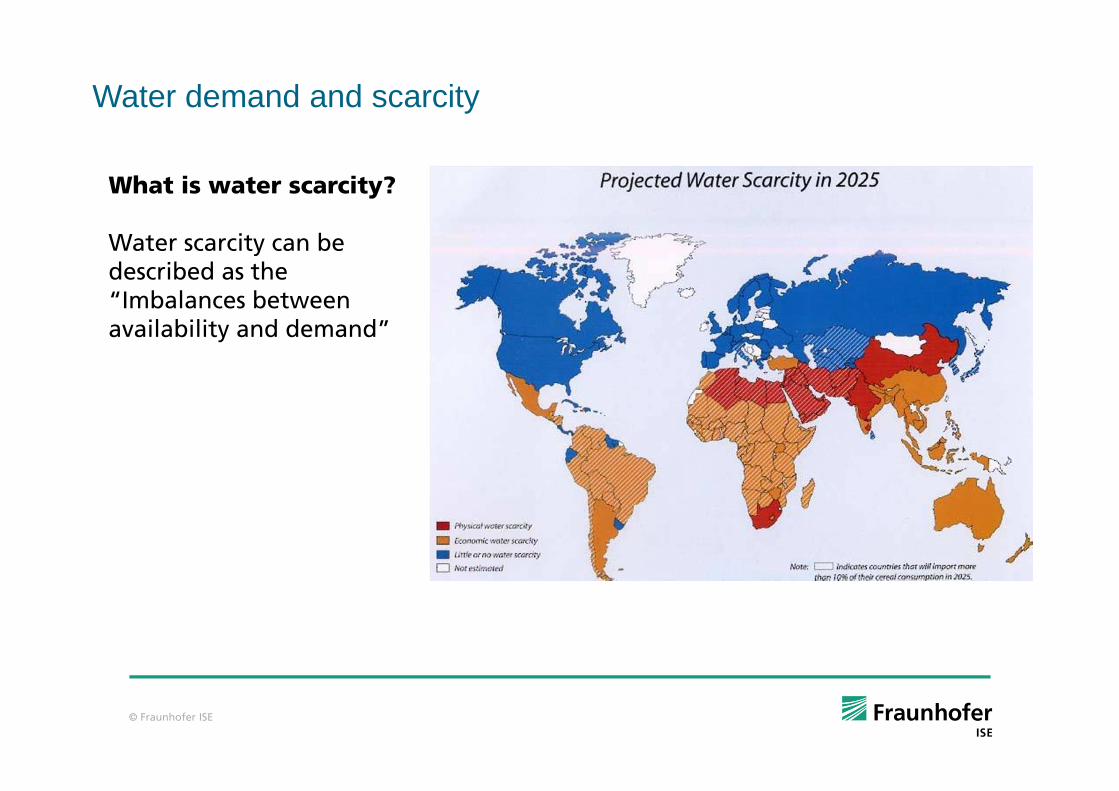
What is water scarcity?
Water scarcity can be described as the“Imbalances between availability and demand”
Water demand and scarcity
© Fraunhofer ISE
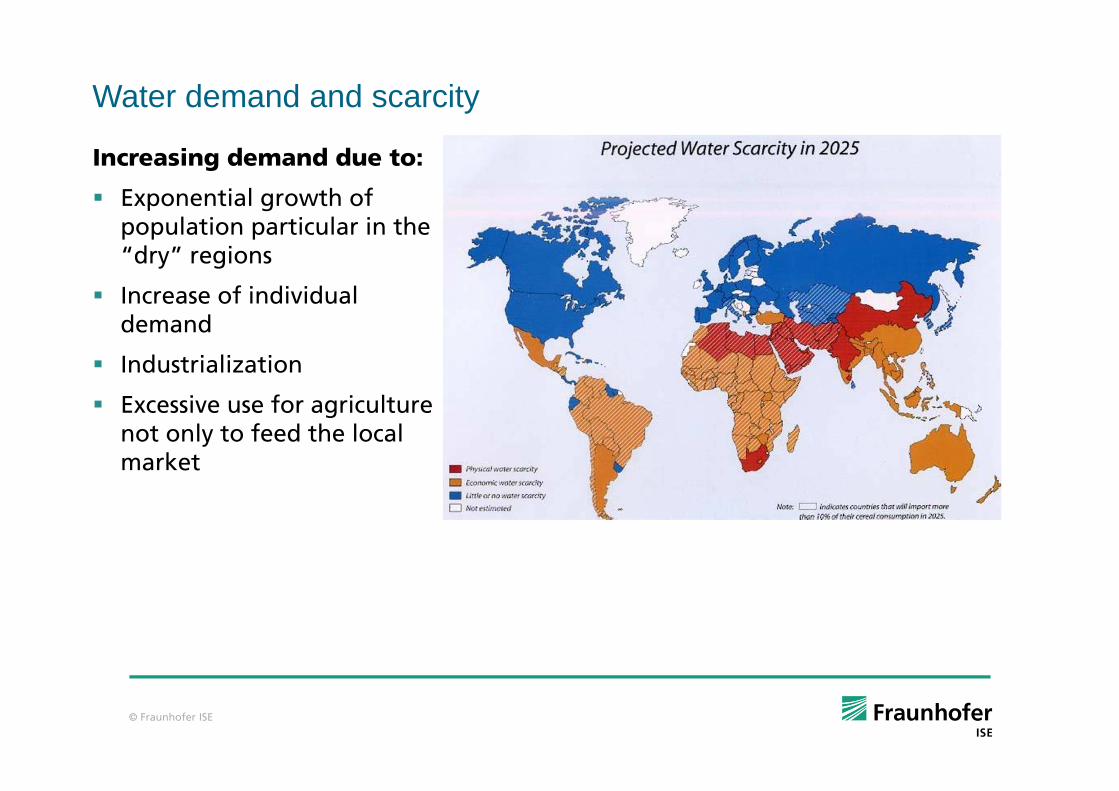
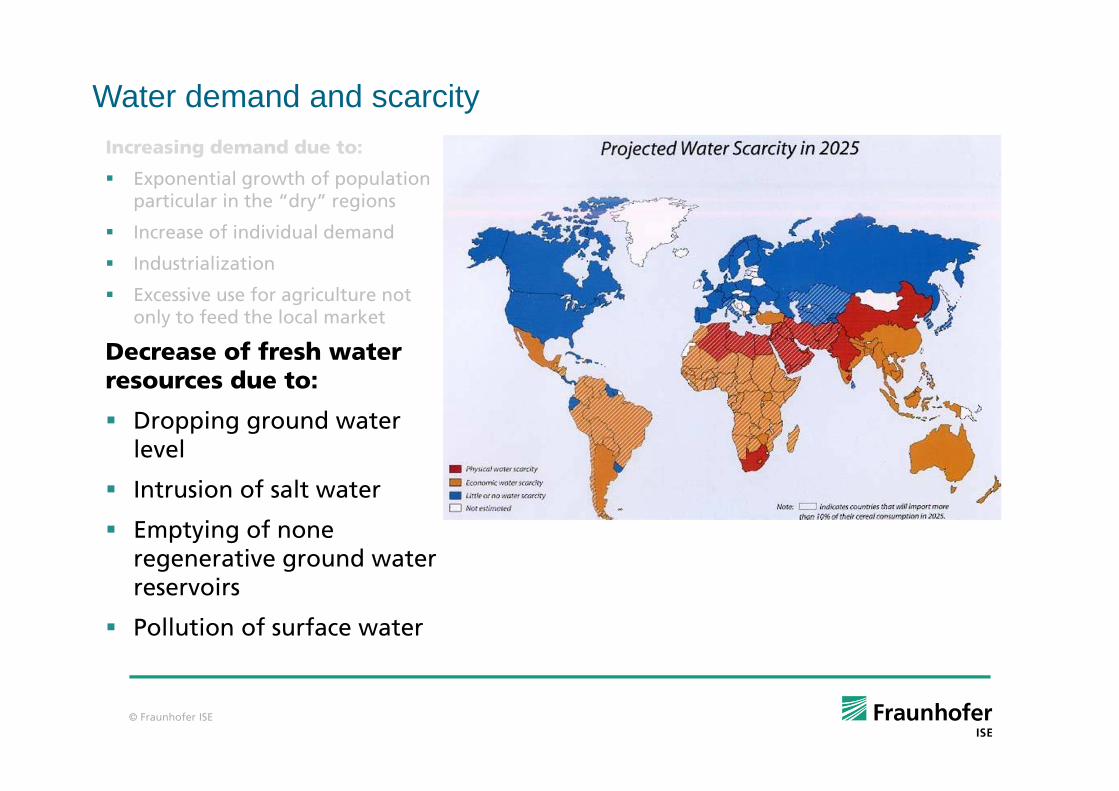
Increasing demand due to:
Exponential growth of population particular in the “dry” regions
Increase of individual demand
Industrialization
Excessive use for agriculture not only to feed the local market
Water demand and scarcity
© Fraunhofer ISE
Increasing demand due to:
Exponential growth of population particular in the “dry” regions
Increase of individual demand
Industrialization
Excessive use for agriculture not only to feed the local market
Decrease of fresh water resources due to:
Dropping ground water level
Intrusion of salt water
Emptying of none regenerative ground water reservoirs
Pollution of surface water
Water demand and scarcity
© Fraunhofer ISE
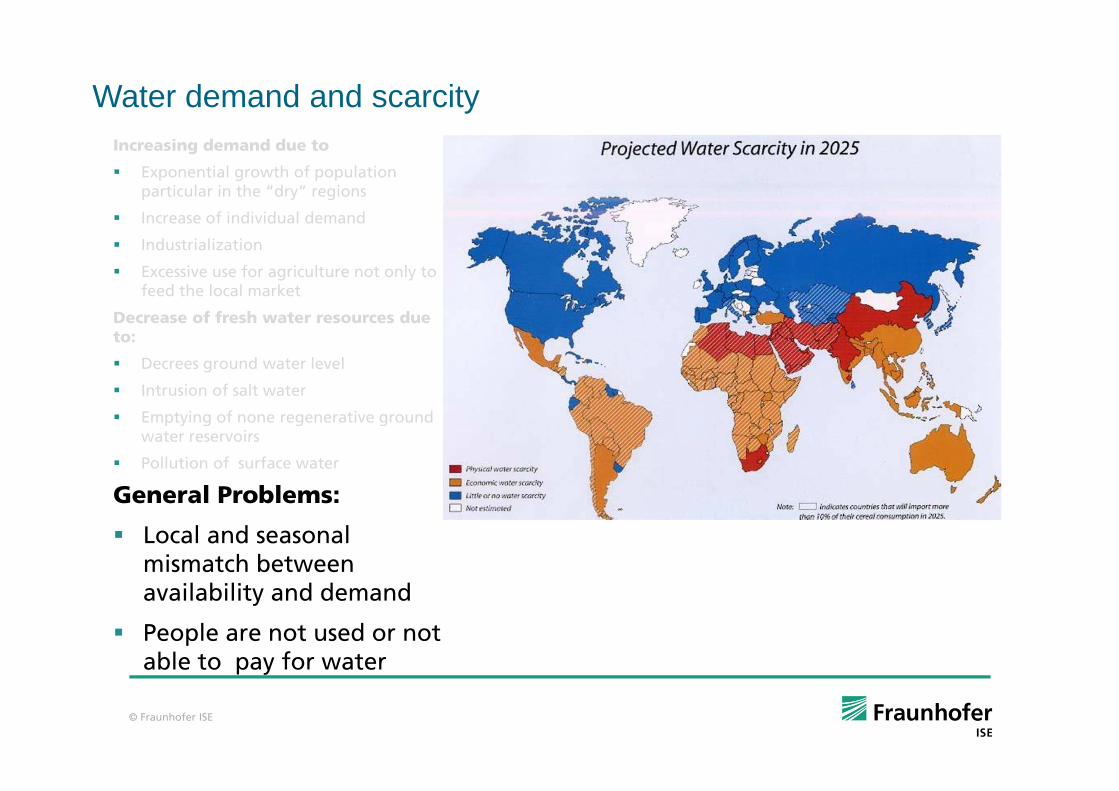
Increasing demand due to
Exponential growth of population particular in the “dry” regions
Increase of individual demand
Industrialization
Excessive use for agriculture not only to feed the local market
Decrease of fresh water resources due to:
Decrees ground water level
Intrusion of salt water
Emptying of none regenerative ground water reservoirs
Pollution of surface water
General Problems:
Local and seasonal mismatch between availability and demand
People are not used or not able to pay for water
Water demand and scarcity
© Fraunhofer ISE
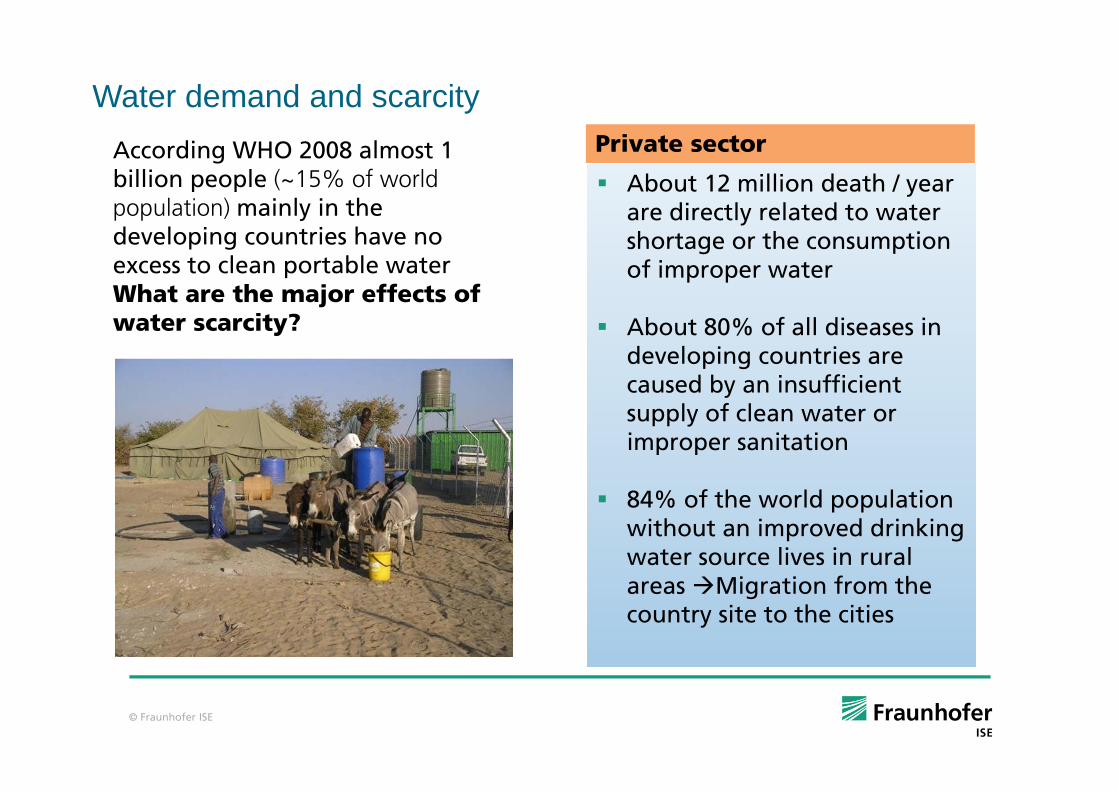
According WHO 2008 almost 1 billion people (~15% of world population) mainly in the developing countries have no excess to clean portable water What are the major effects of water scarcity?
Private sector
About 12 million death / year are directly related to water shortage or the consumption of improper water
About 80% of all diseases in developing countries are caused by an insufficient supply of clean water or improper sanitation
84% of the world population without an improved drinking water source lives in rural areas Migration from the country site to the cities
Water demand and scarcity
© Fraunhofer ISE
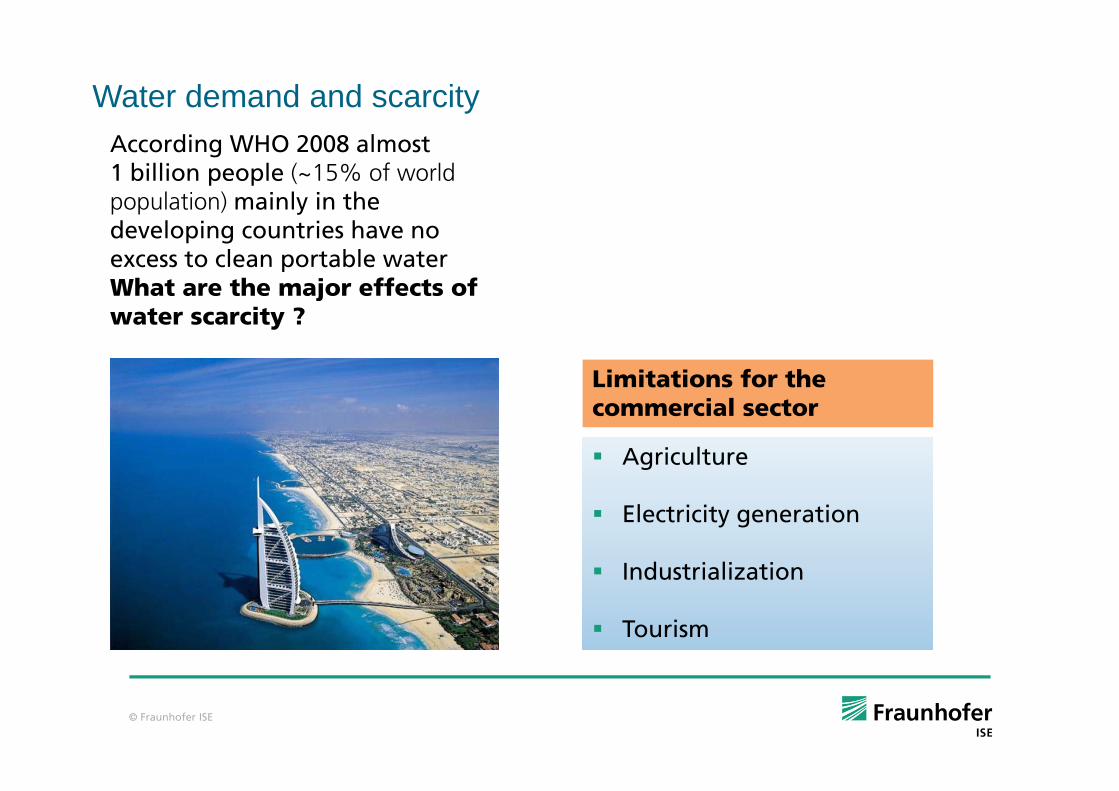
According WHO 2008 almost 1 billion people (~15% of world population) mainly in the developing countries have no excess to clean portable water What are the major effects of water scarcity ?
Limitations for the commercial sector
Agriculture
Electricity generation
Industrialization
Tourism
Agriculture
Electricity generation
Industrialization
Tourism
Water demand and scarcity
© Fraunhofer ISE
Desalination can be applied with following boundary conditions:
Demand for fresh water (domestic use, industry, agriculture…..)Lack of conventional water sources Availability of salt water Availability of Infrastructure (energy, water distribution network)Interest for financing (invest, maintenance, energy,…)
Basic consideration
Desalination: basic considerations
© Fraunhofer ISE
Standard seawater has a salinity of 35.000ppm TDS (Totally Dissolved Solids)Brackish water has a salinity of 1000 –10.000ppm TDS Fresh water for human consumption should not exceed 500 ppm TDS. A maximum of 1000ppm TDS is recommended by WHO
Basic consideration
Desalination: basic considerations
© Fraunhofer ISE
Advantages Sea water is an “unlimited” sourceMany large cities are located next to the seaFor some countries it is the only excess to fresh waterMigration from country site due to fresh water scarcity can be reduced
General advantages and disadvantages of desalination
Disadvantages Desalination is an energy intensive processInvestment and operation costs are very highBrine discharge can effect the environmentBrine discharge of brackish water desalination inside the country is difficult
Desalination: basic considerations
© Fraunhofer ISE
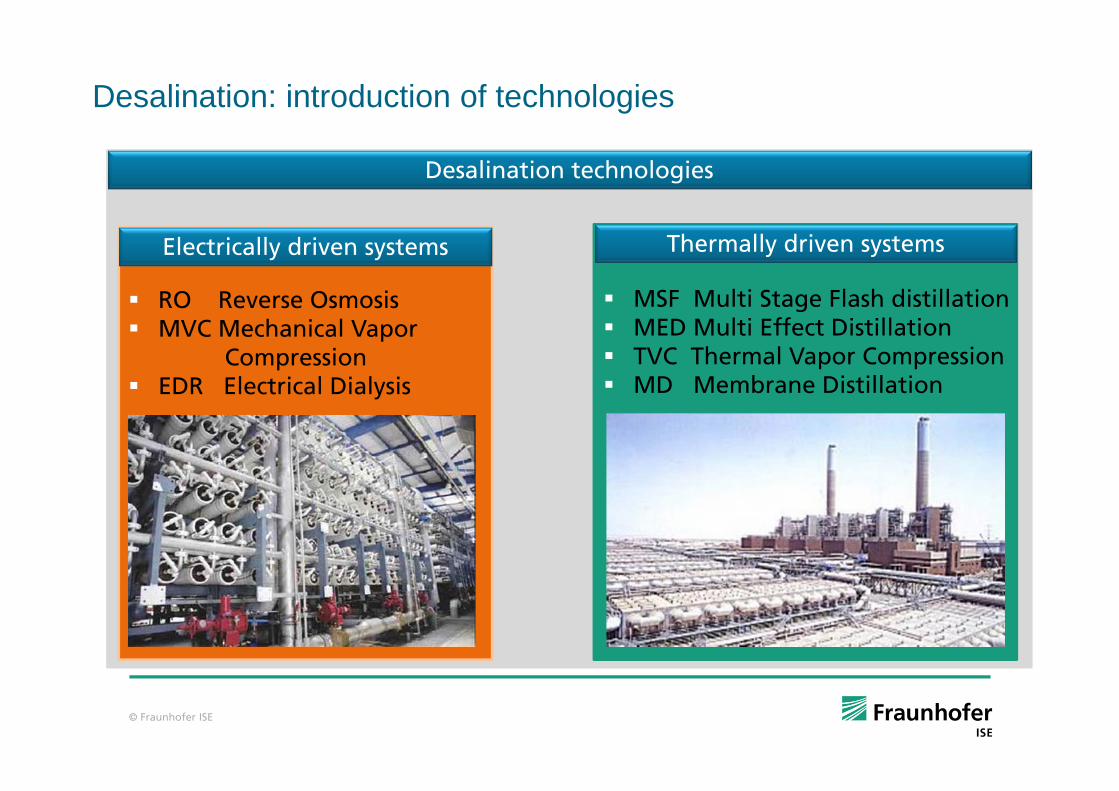
RO Reverse OsmosisMVC Mechanical Vapor
CompressionEDR Electrical Dialysis
Electrically driven systems Thermally driven systems
Desalination technologies
MSF Multi Stage Flash distillationMED Multi Effect DistillationTVC Thermal Vapor CompressionMD Membrane Distillation
Desalination: introduction of technologies
© Fraunhofer ISE
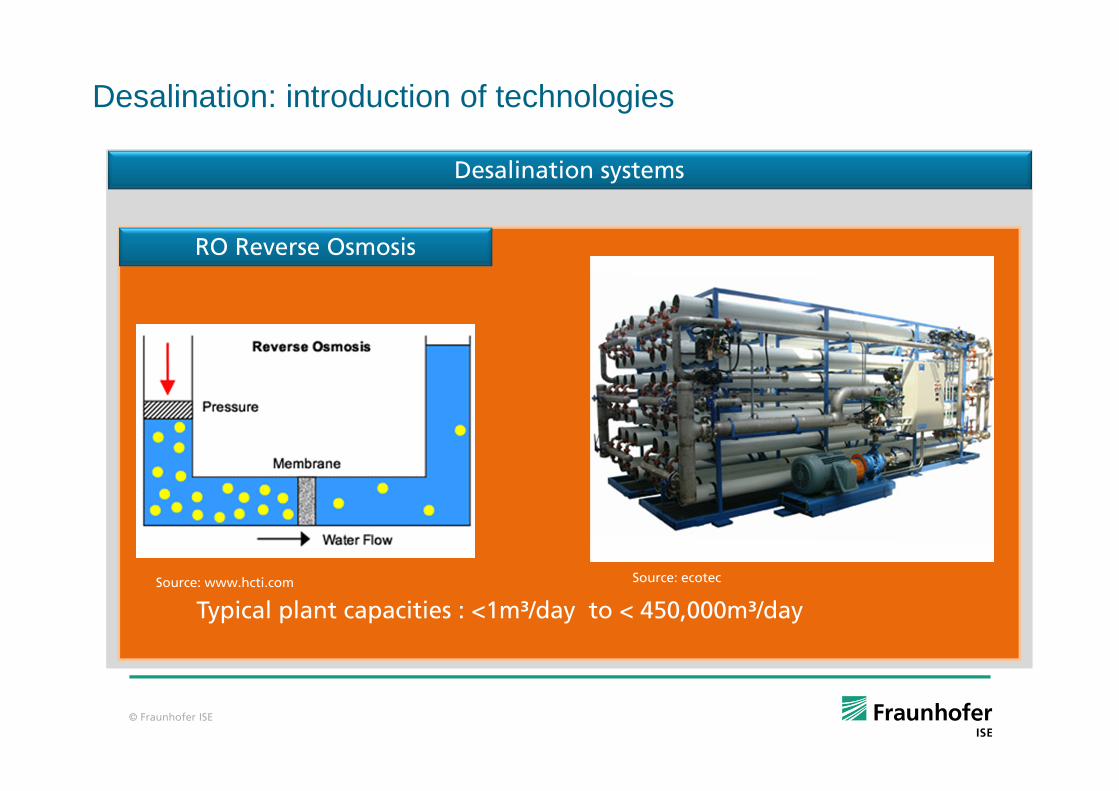
RO Reverse Osmosis
Desalination systems
Typical plant capacities : <1m³/day to < 450,000m³/day Source: www.hcti.com Source: ecotec
Desalination: introduction of technologies
© Fraunhofer ISE
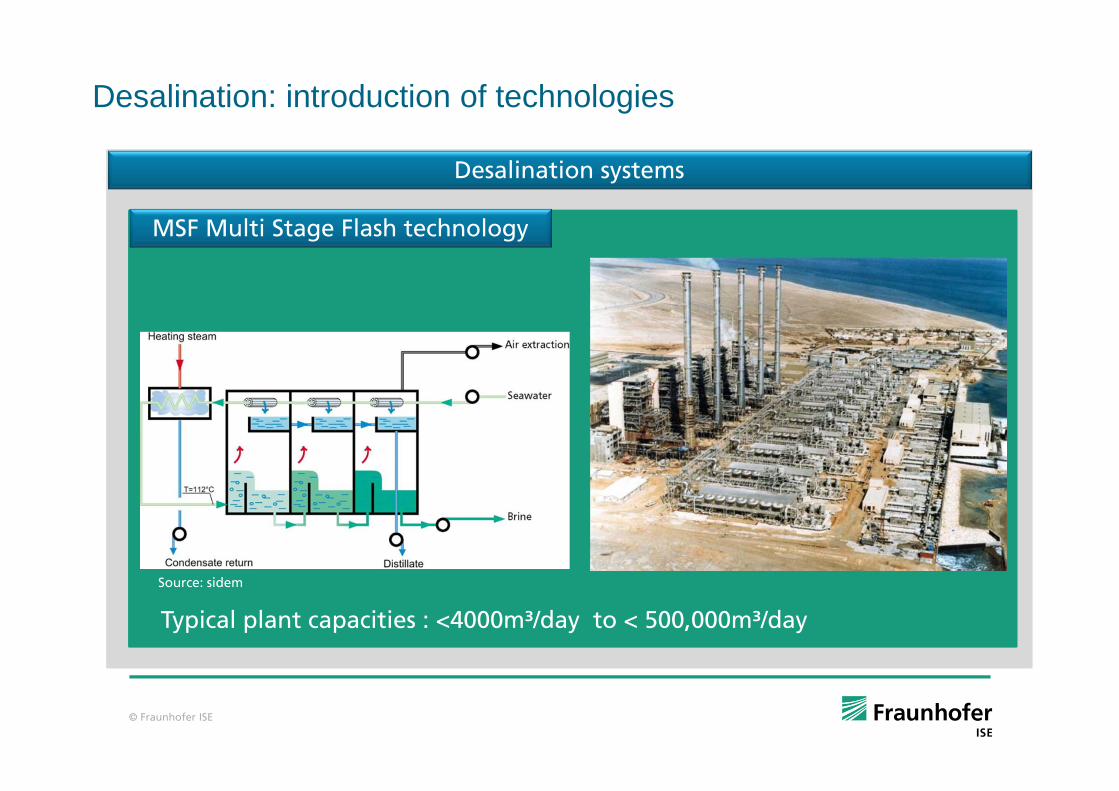
MSF Multi Stage Flash technology
Desalination systems
Source: sidem
Typical plant capacities : <4000m³/day to < 500,000m³/day
Desalination: introduction of technologies
© Fraunhofer ISE
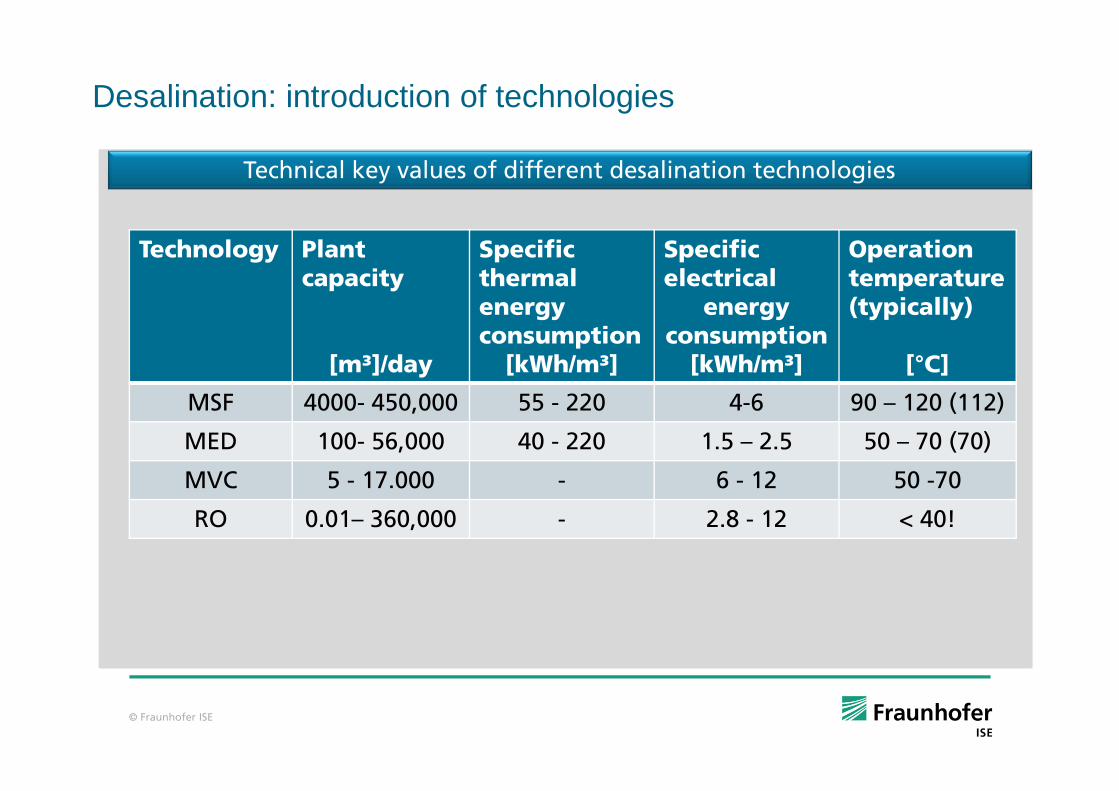
Technical key values of different desalination technologies
Technology Plant capacity
[m³]/day
Specific thermal energy consumption
[kWh/m³]
Specific electrical
energy consumption
[kWh/m³]
Operation temperature(typically)
[°C]
MSF 4000- 450,000 55 - 220 4-6 90 – 120 (112)
MED 100- 56,000 40 - 220 1.5 – 2.5 50 – 70 (70)
MVC 5 - 17.000 - 6 - 12 50 -70
RO 0.01– 360,000 - 2.8 - 12 < 40!
Desalination: introduction of technologies
© Fraunhofer ISE
21
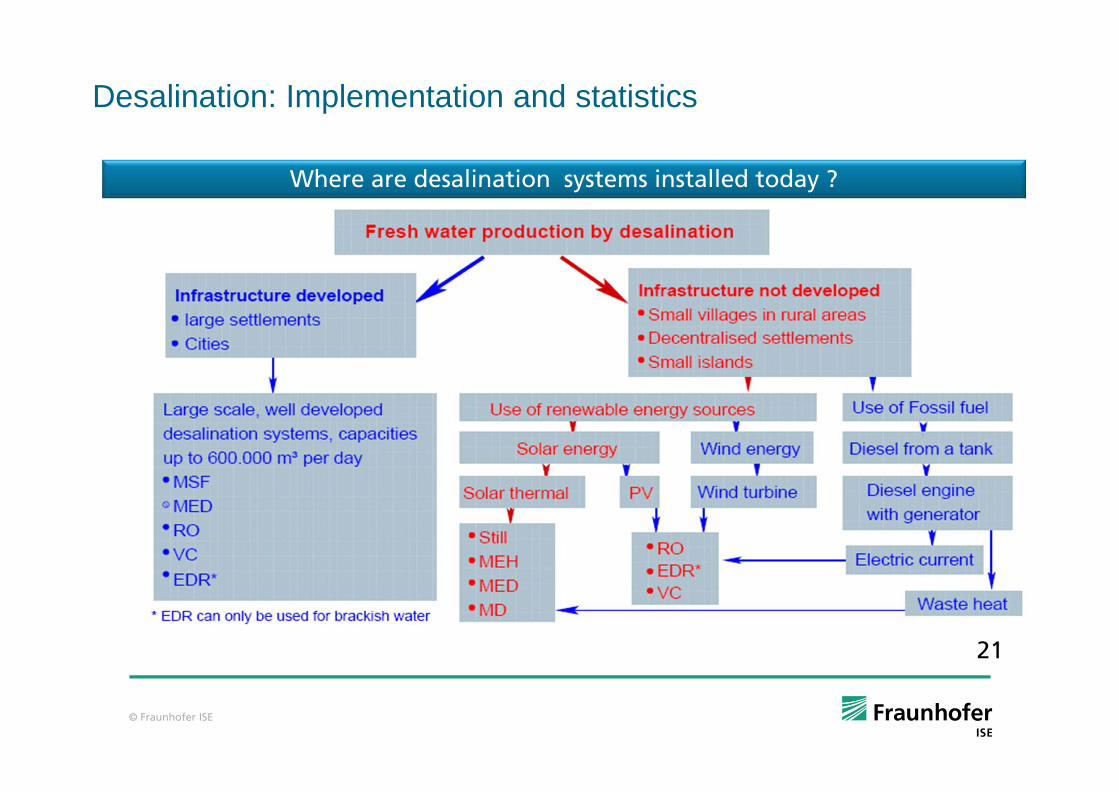
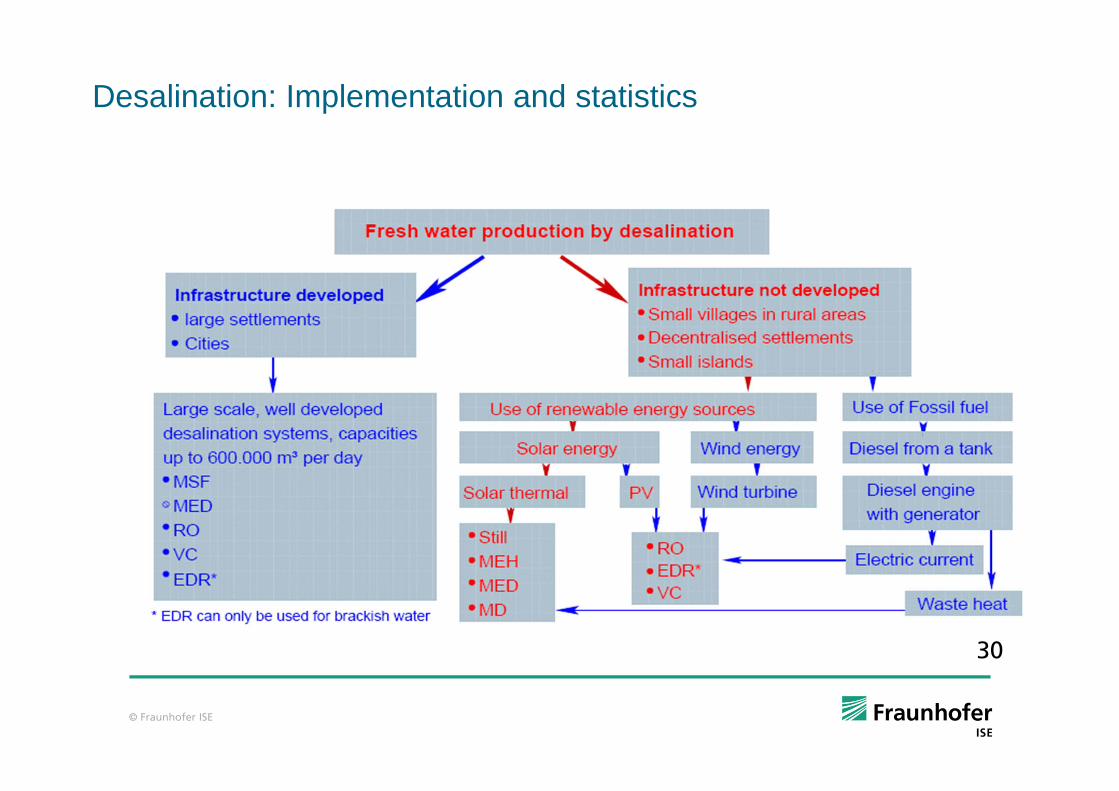
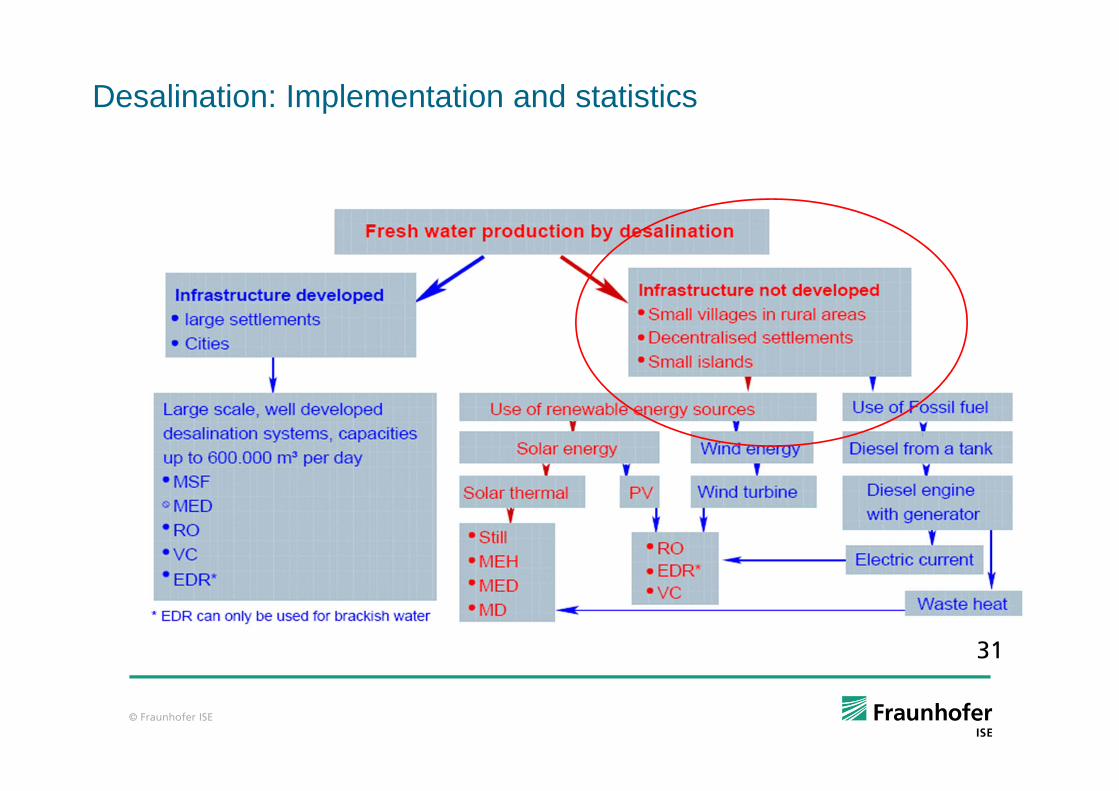
Where are desalination systems installed today ?
Desalination: Implementation and statistics
© Fraunhofer ISE
22
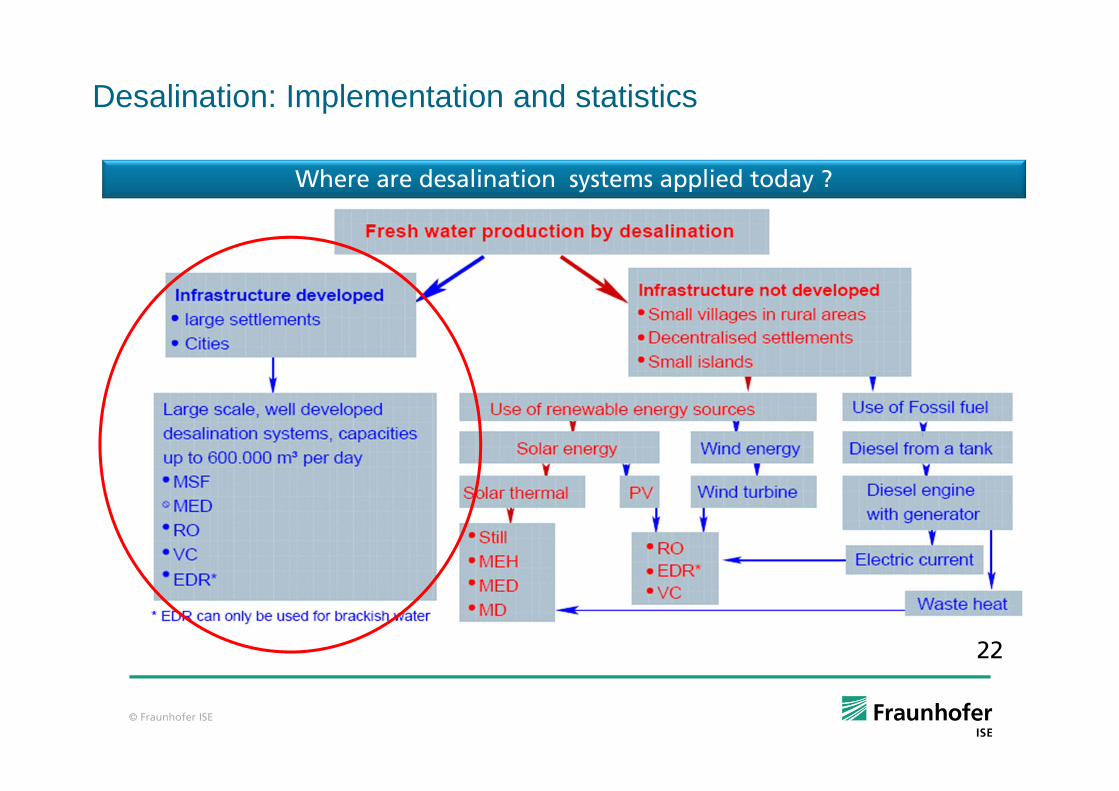
Where are desalination systems applied today ?
Desalination: Implementation and statistics
© Fraunhofer ISE
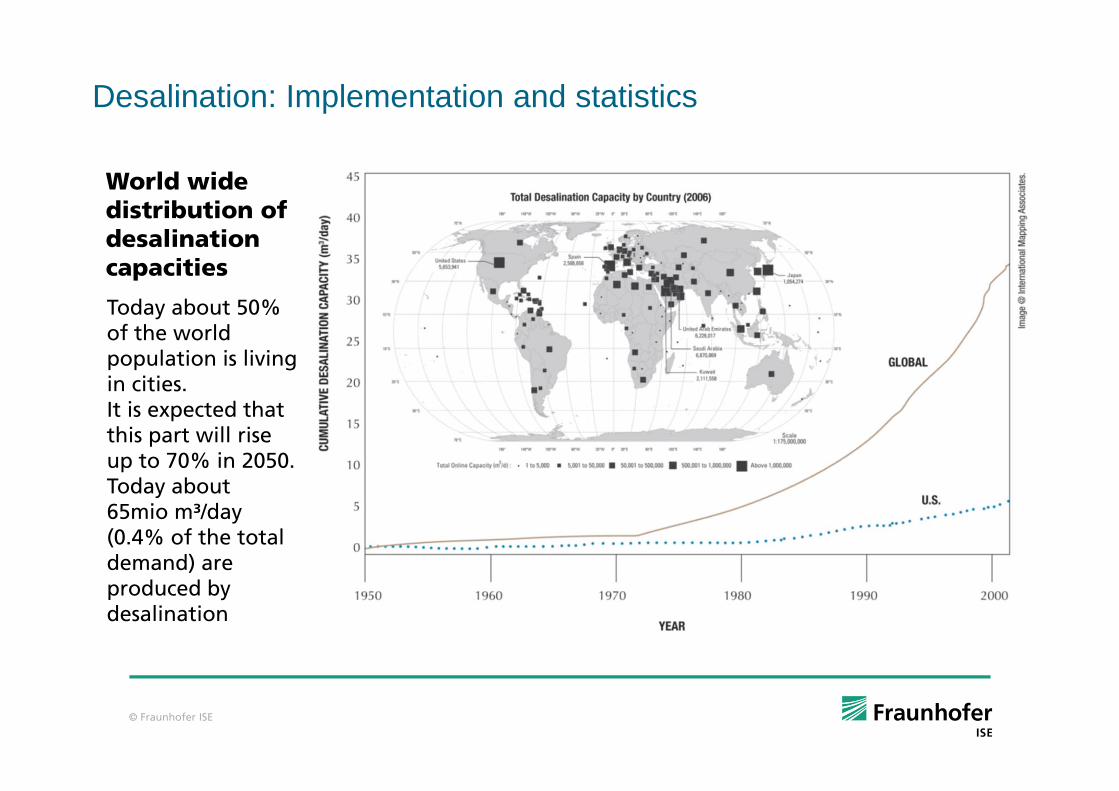
Today about 50% of the world population is living in cities.It is expected that this part will rise up to 70% in 2050.Today about 65mio m³/day (0.4% of the total demand) are produced by desalination
World wide distribution of desalination capacities
Desalination: Implementation and statistics
© Fraunhofer ISE
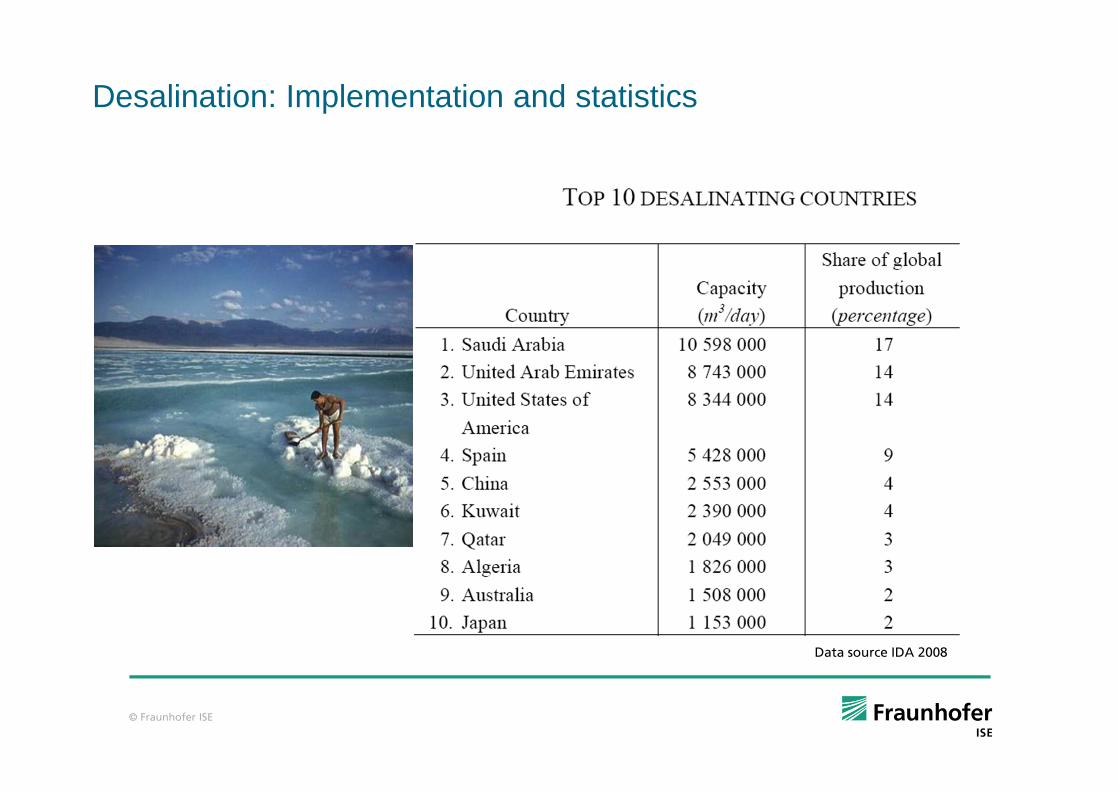
Data source IDA 2008
Desalination: Implementation and statistics
© Fraunhofer ISE
0
1
2
3
4
5
6
7
8
0
10
20
30
40
50
60
70
1980 1984 1988 1992 1996 2000 2004 2008
Glo
bal a
nnua
l new
onl
ine
capa
city
/ m
illio
n m
³/d
Glo
bal c
umul
ativ
e on
line
capa
city
/ m
illio
n m
³/d
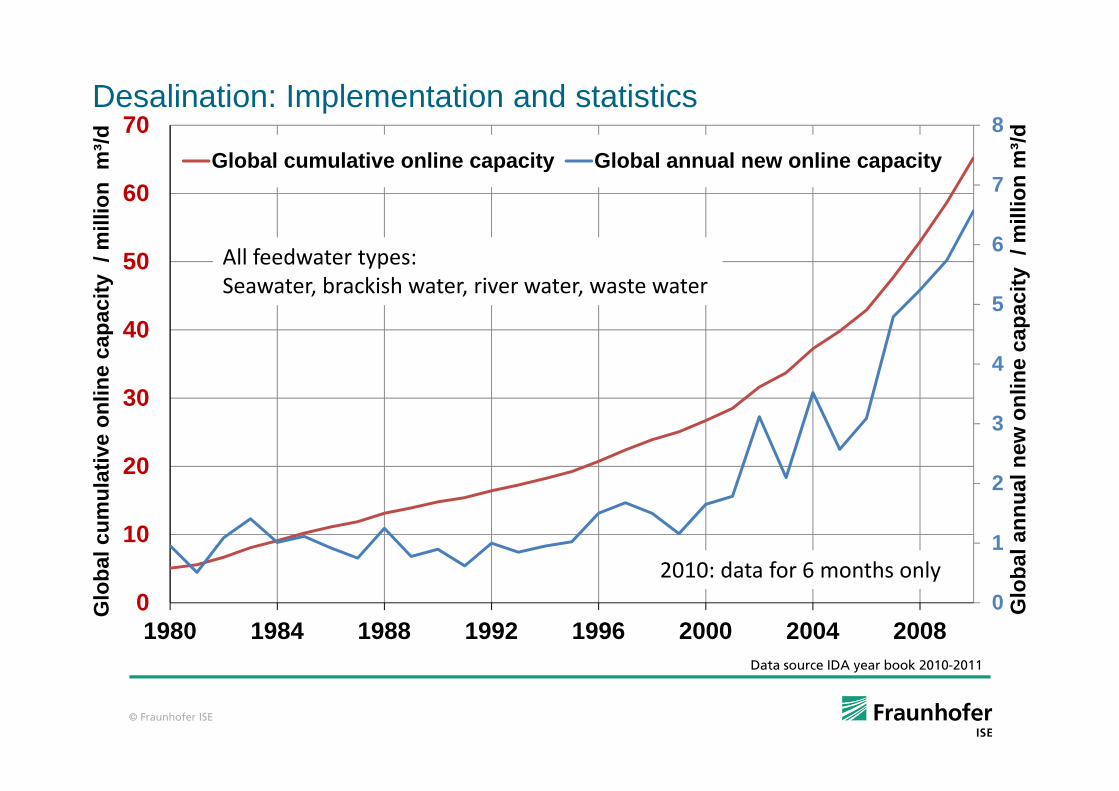
Global cumulative online capacity Global annual new online capacity
2010: data for 6 months only
All feedwater types:Seawater, brackish water, river water, waste water
Data source IDA year book 2010-2011
Desalination: Implementation and statistics
© Fraunhofer ISE
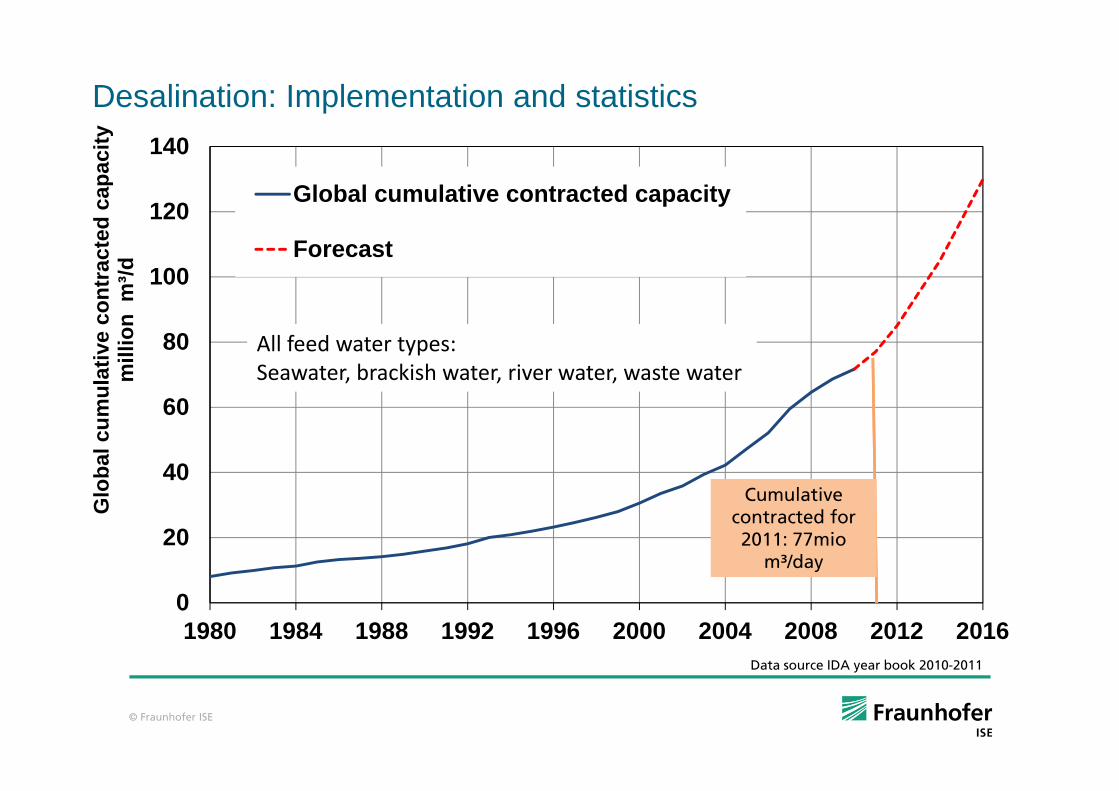
0
20
40
60
80
100
120
140
1980 1984 1988 1992 1996 2000 2004 2008 2012 2016
Glo
bal c
umul
ativ
eco
ntra
cted
capa
city
mill
ion
m³/d
Global cumulative contracted capacity
Forecast
All feed water types:Seawater, brackish water, river water, waste water
Cumulative contracted for 2011: 77mio
m³/day
Data source IDA year book 2010-2011
Desalination: Implementation and statistics
© Fraunhofer ISE
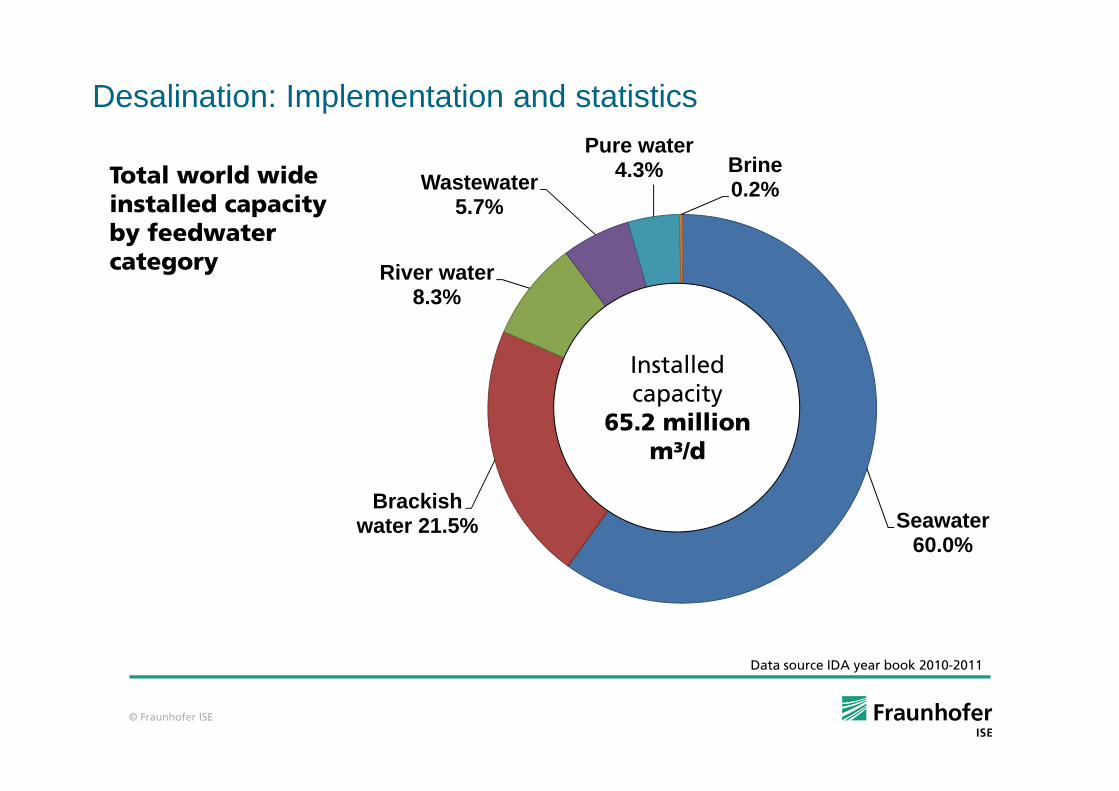
Seawater 60.0%
Brackish water 21.5%
River water 8.3%
Wastewater5.7%
Pure water 4.3% Brine
0.2%Total world wideinstalled capacityby feedwatercategory
Installed capacity
65.2 million m³/d
Data source IDA year book 2010-2011
Desalination: Implementation and statistics
© Fraunhofer ISE
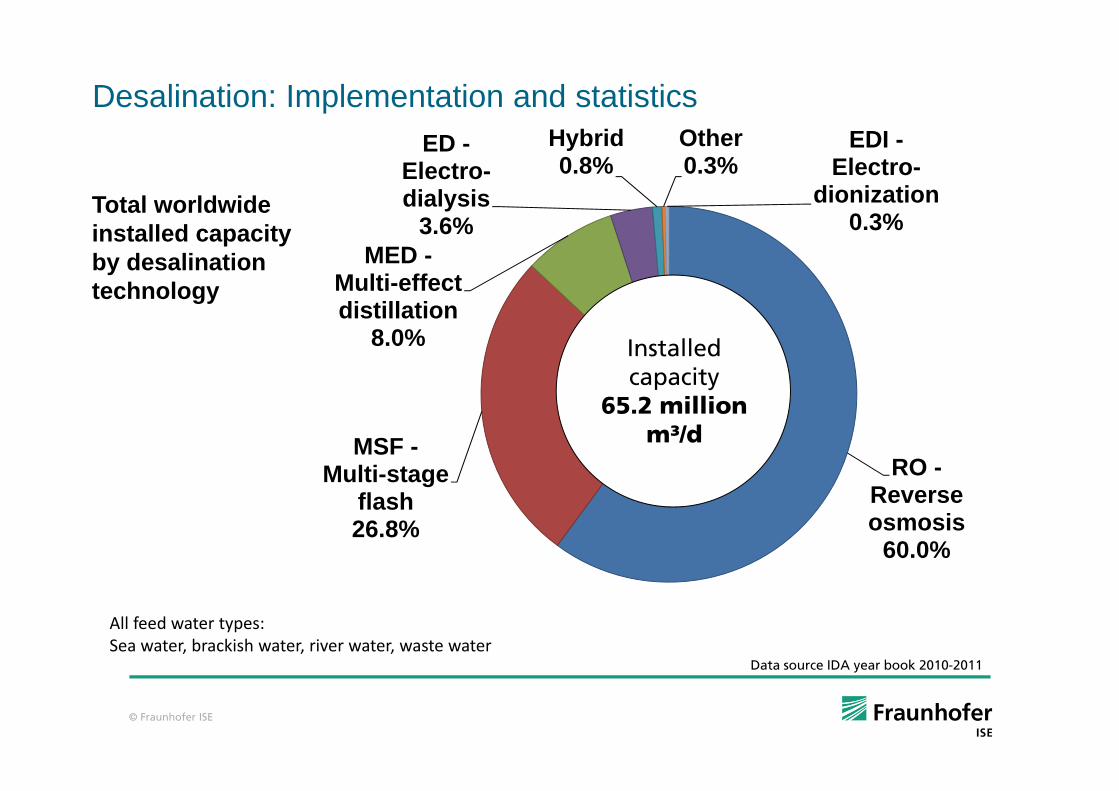
RO -Reverse osmosis
60.0%
MSF -Multi-stage
flash26.8%
MED -Multi-effect distillation
8.0%
ED -Electro-dialysis
3.6%
Hybrid0.8%
Other0.3%
EDI -Electro-
dionization0.3%
Installed capacity
65.2 million m³/d
All feed water types:Sea water, brackish water, river water, waste water
Data source IDA year book 2010-2011
Total worldwide installed capacity by desalination technology
Desalination: Implementation and statistics
© Fraunhofer ISE
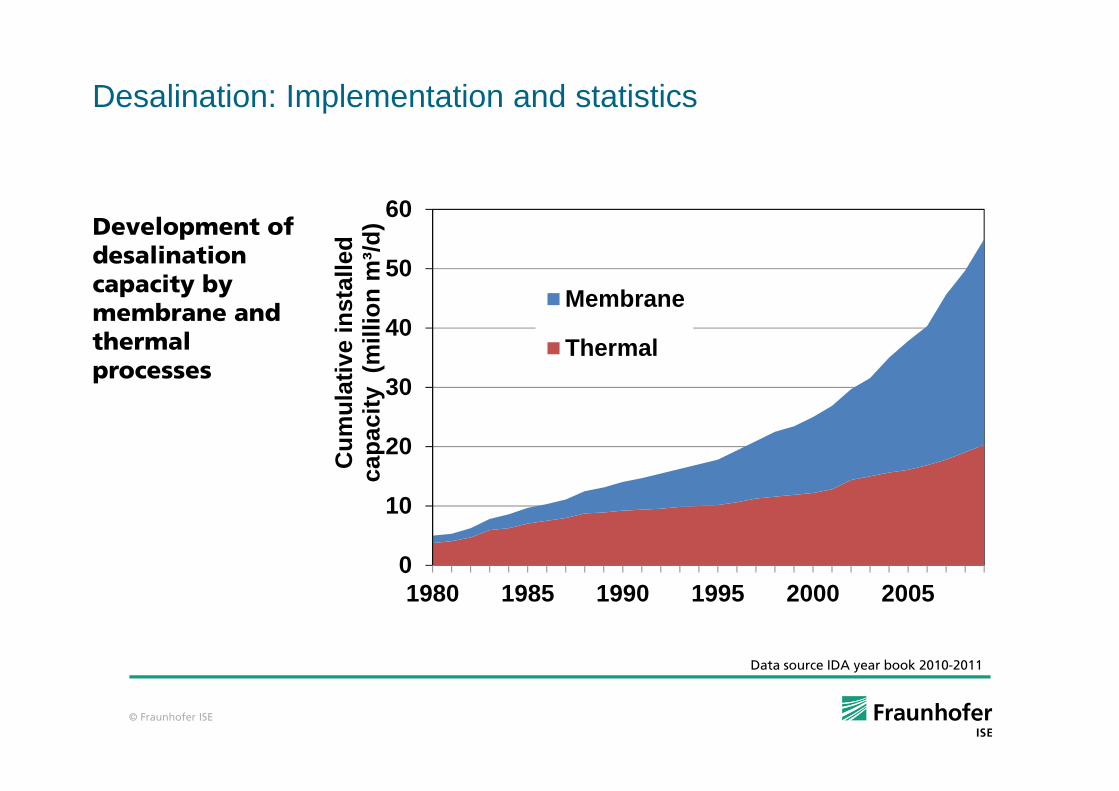
0
10
20
30
40
50
60
1980 1985 1990 1995 2000 2005
Cum
ulat
ive
inst
alle
dca
paci
ty(m
illio
nm
³/d)
Membrane
Thermal
Data source IDA year book 2010-2011
Development of desalination capacity by membrane and thermal processes
Desalination: Implementation and statistics
© Fraunhofer ISE
30
Desalination: Implementation and statistics
© Fraunhofer ISE
31
Desalination: Implementation and statistics
© Fraunhofer ISE
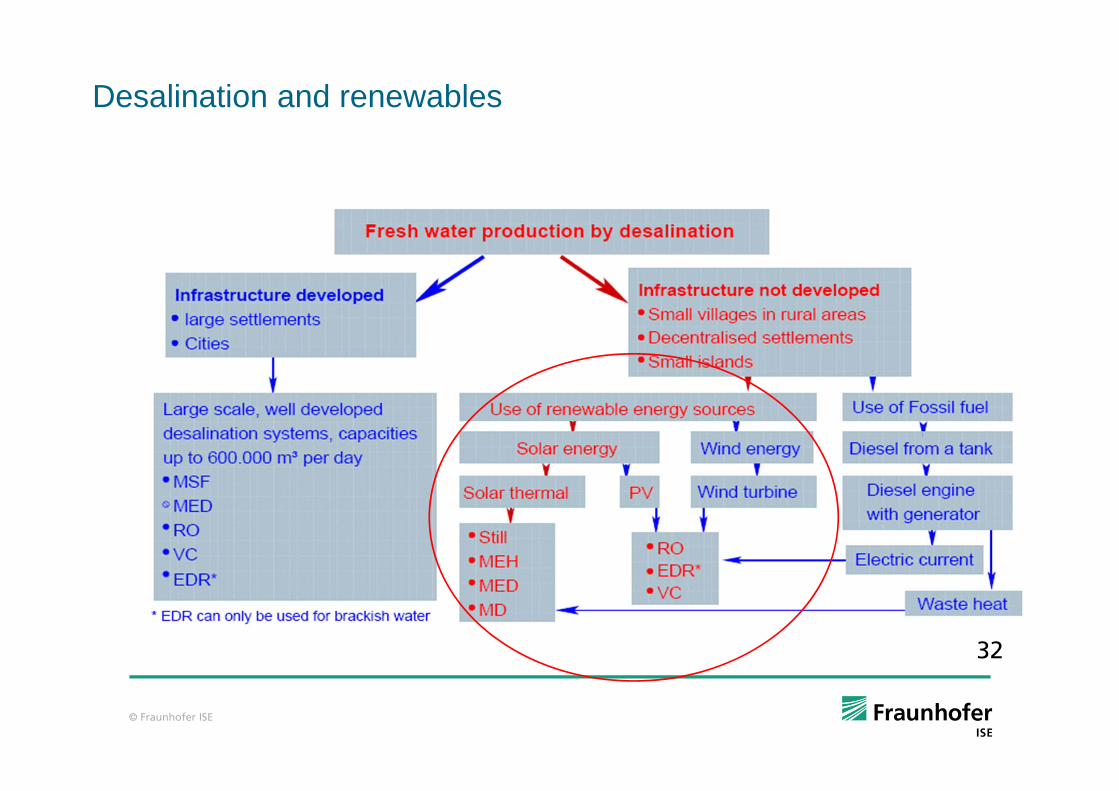
32
Desalination and renewables
© Fraunhofer ISE
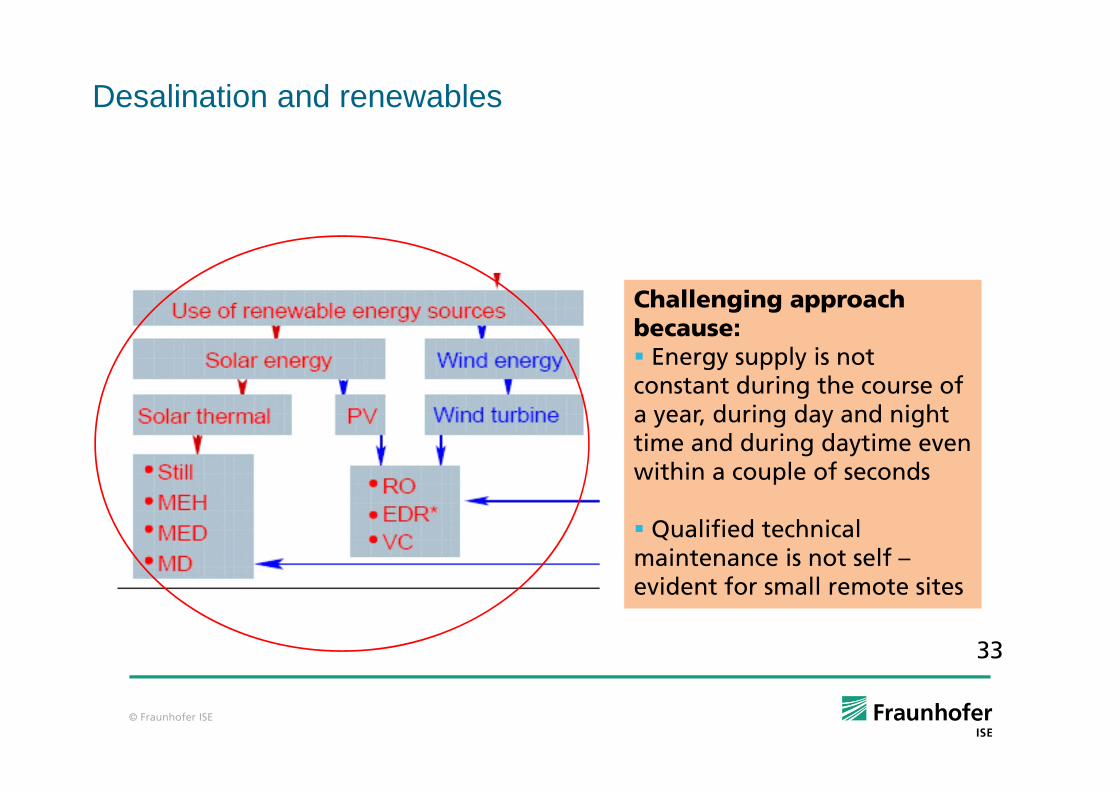
33
Challenging approach because:
Energy supply is not constant during the course of a year, during day and night time and during daytime even within a couple of seconds
Qualified technical maintenance is not self –evident for small remote sites
Desalination and renewables
© Fraunhofer ISE
34
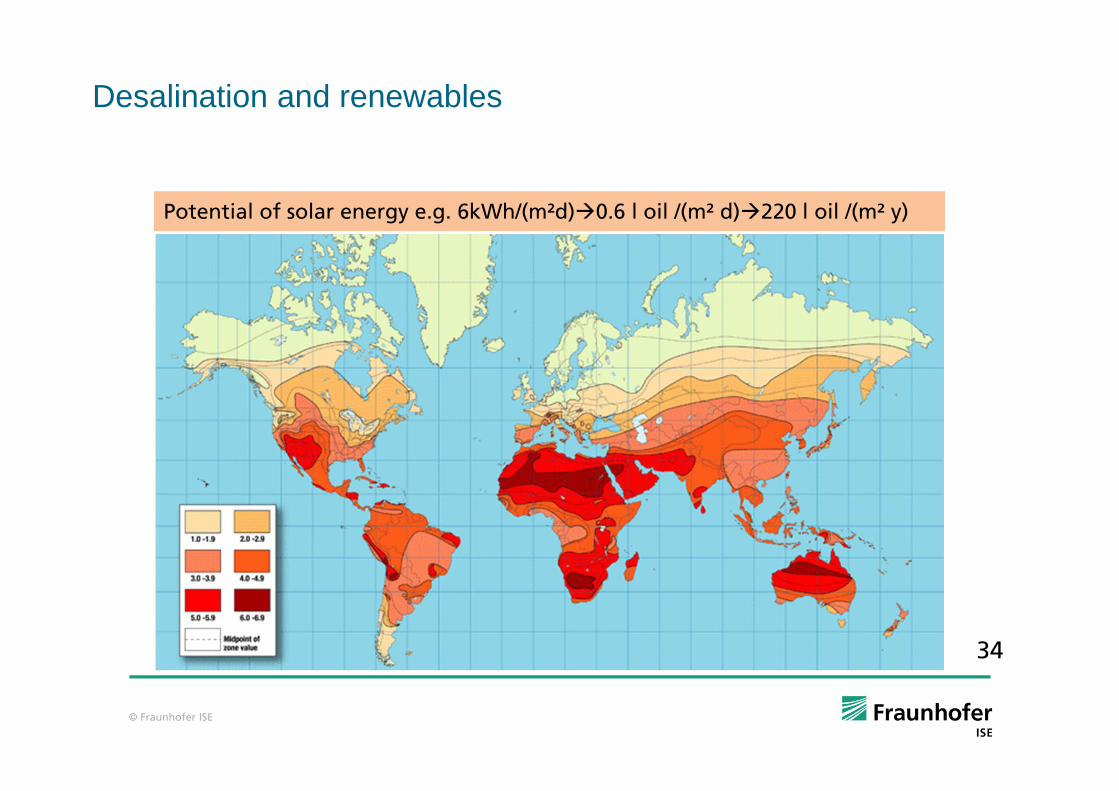
Potential of solar energy e.g. 6kWh/(m²d) 0.6 l oil /(m² d) 220 l oil /(m² y)
Desalination and renewables
© Fraunhofer ISE
35
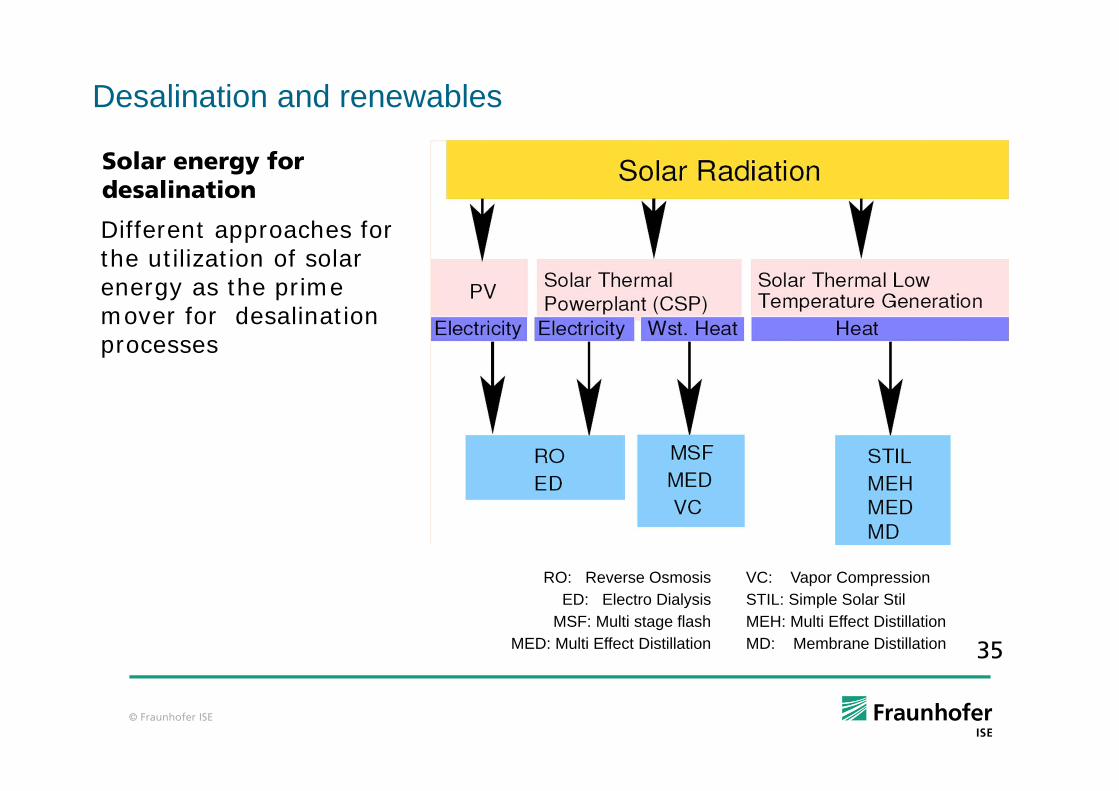
Different approaches for the utilization of solar energy as the prime mover for desalination processes
RO: Reverse OsmosisED: Electro Dialysis
MSF: Multi stage flashMED: Multi Effect Distillation
c
VC: Vapor CompressionSTIL: Simple Solar StilMEH: Multi Effect DistillationMD: Membrane Distillation
Solar energy for desalination
Desalination and renewables
© Fraunhofer ISE
36
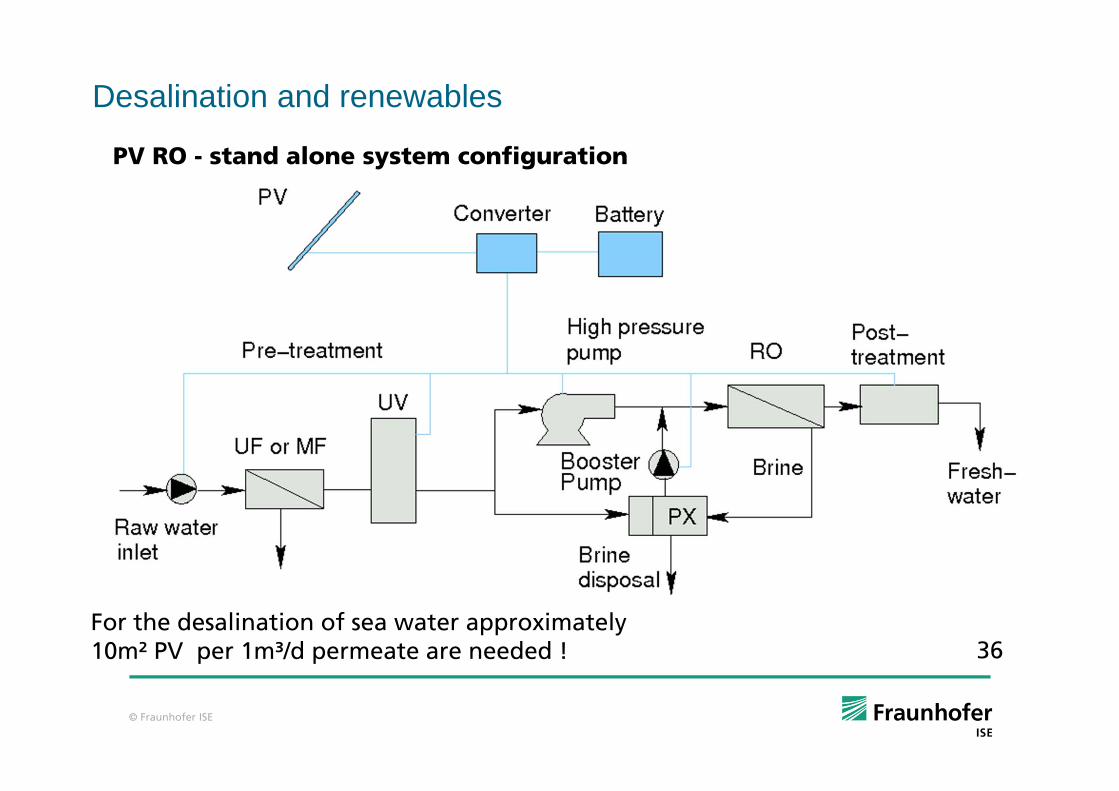
PV RO - stand alone system configuration
Systeme solar
For the desalination of sea water approximately 10m² PV per 1m³/d permeate are needed !
Desalination and renewables
© Fraunhofer ISE
37
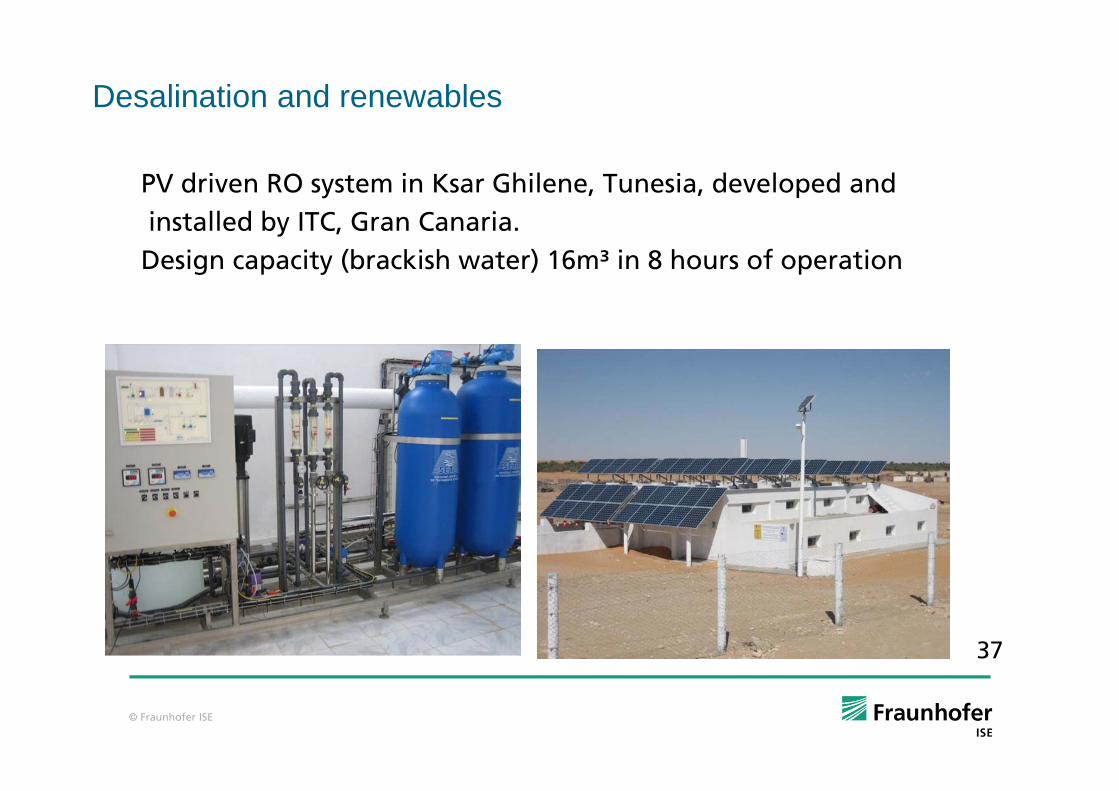
PV driven RO system in Ksar Ghilene, Tunesia, developed andinstalled by ITC, Gran Canaria.Design capacity (brackish water) 16m³ in 8 hours of operation
Desalination and renewables
© Fraunhofer ISE
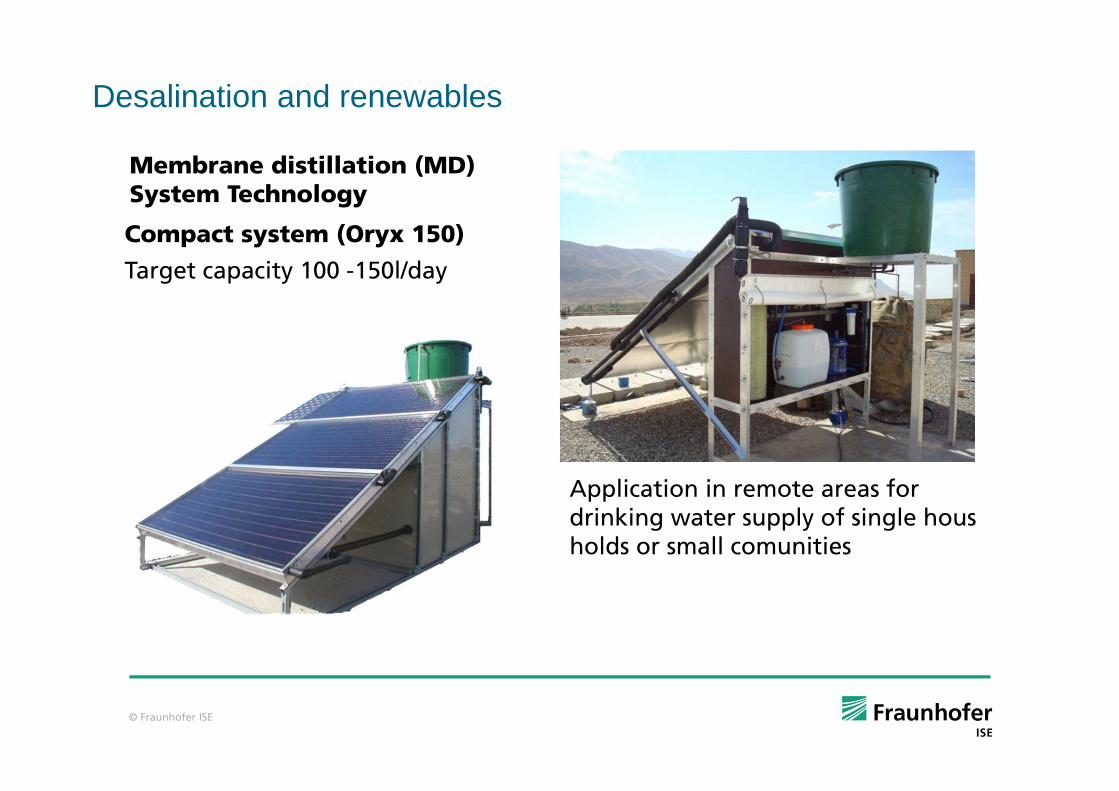
Compact system (Oryx 150)
Target capacity 100 -150l/day
Application in remote areas fordrinking water supply of single housholds or small comunities
Membrane distillation (MD)System Technology
Desalination and renewables
© Fraunhofer ISE
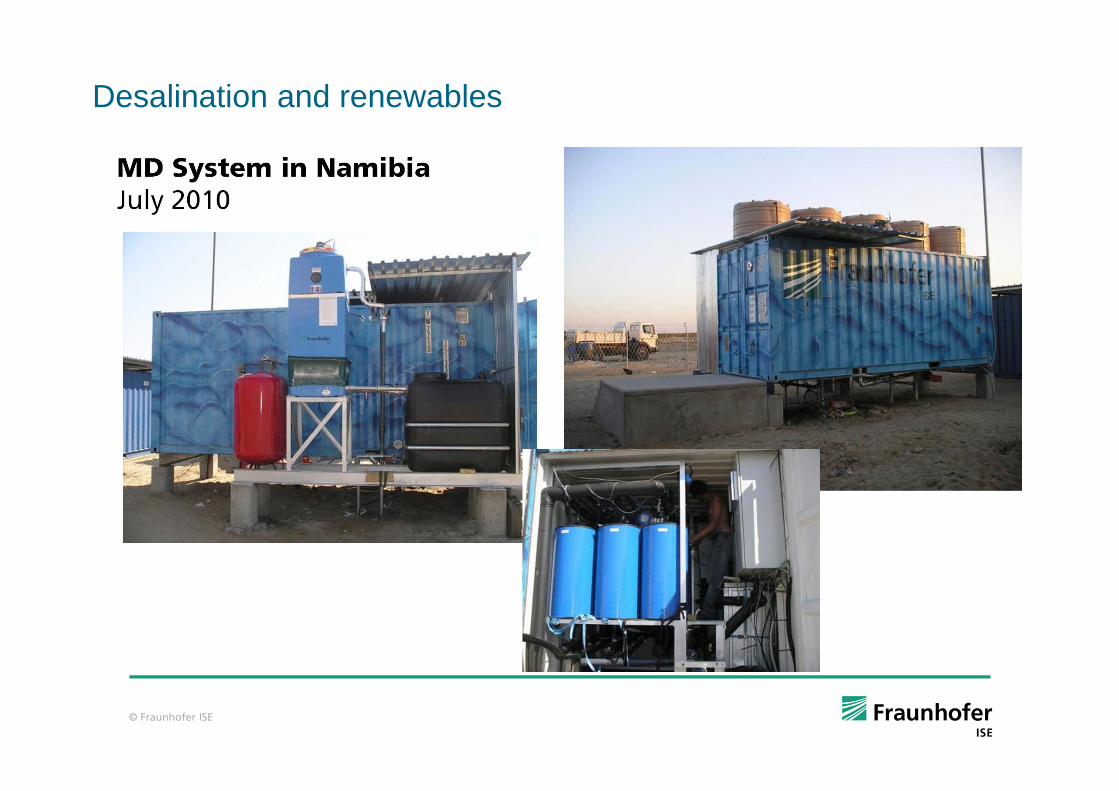
MD System in Namibia July 2010
Desalination and renewables
© Fraunhofer ISE
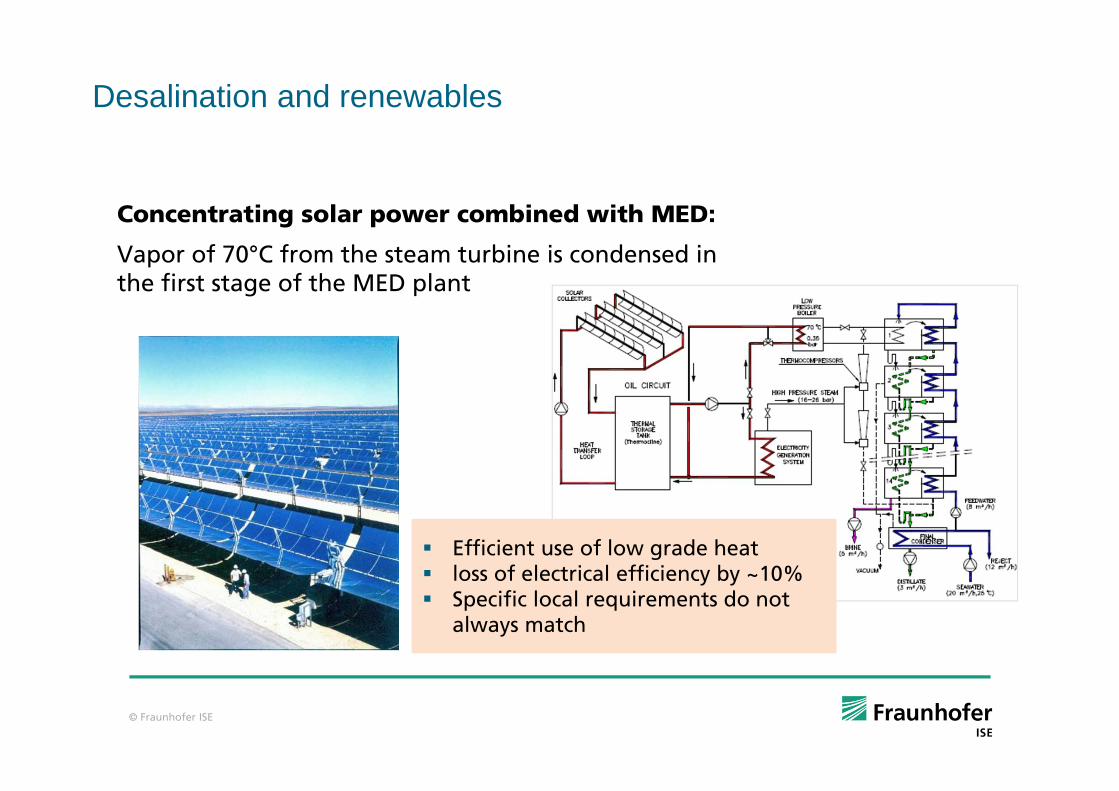
Concentrating solar power combined with MED:
Vapor of 70°C from the steam turbine is condensed in the first stage of the MED plant
Efficient use of low grade heatloss of electrical efficiency by ~10%Specific local requirements do not always match
Desalination and renewables
© Fraunhofer ISE
41
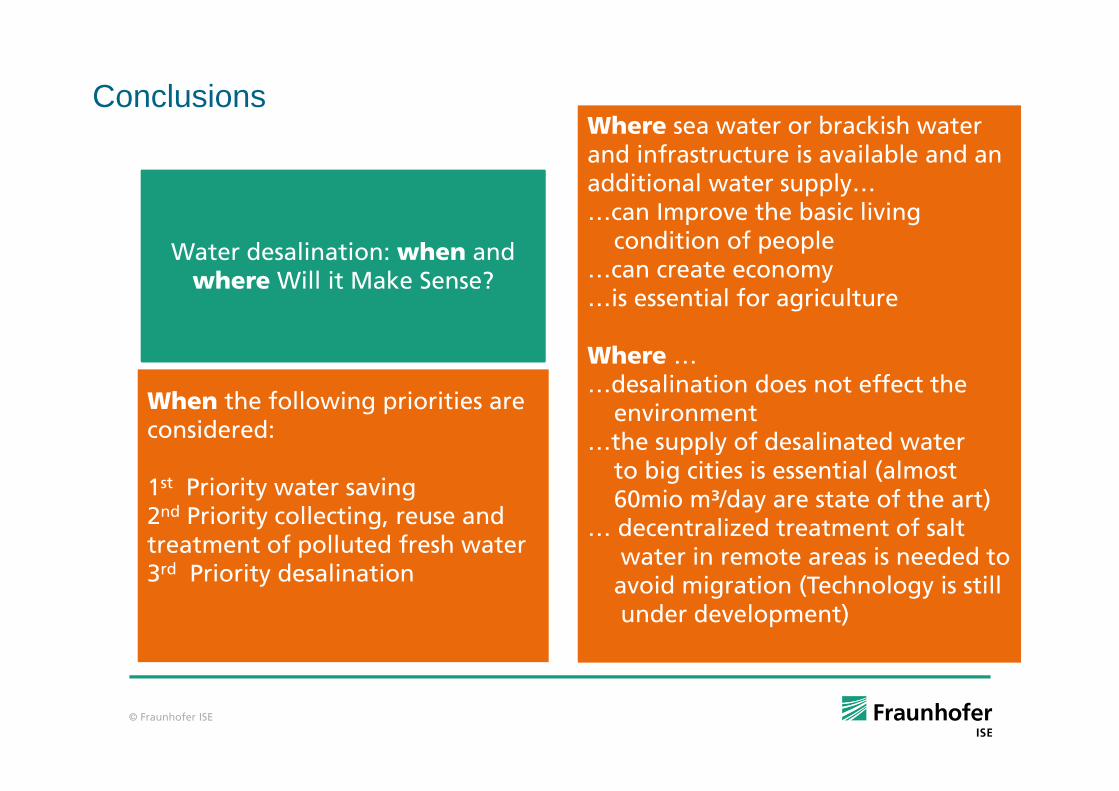
When the following priorities are considered:
1st Priority water saving2nd Priority collecting, reuse and treatment of polluted fresh water3rd Priority desalination
Where sea water or brackish water and infrastructure is available and an additional water supply… …can Improve the basic living
condition of people…can create economy…is essential for agriculture
Where ……desalination does not effect the
environment…the supply of desalinated water
to big cities is essential (almost60mio m³/day are state of the art)
… decentralized treatment of saltwater in remote areas is needed to
avoid migration (Technology is stillunder development)
Water desalination: when and where Will it Make Sense?
Conclusions
© Fraunhofer ISE
42
Thank you for your attention ...