water: back to growth - danone-danonecom...
TRANSCRIPT
Water: Back to GrowthThomas Kunz
Summary
Significant topline growth is back
Our crisis strategy clearly worked and has helped to give
the category new relevance and meaning
Input costs are a challenge. Our productivity mindset goes
a long way to compensate, but pricing action has been
inevitable
Aquadrinks become an increasingly important growth driver
– 2 –
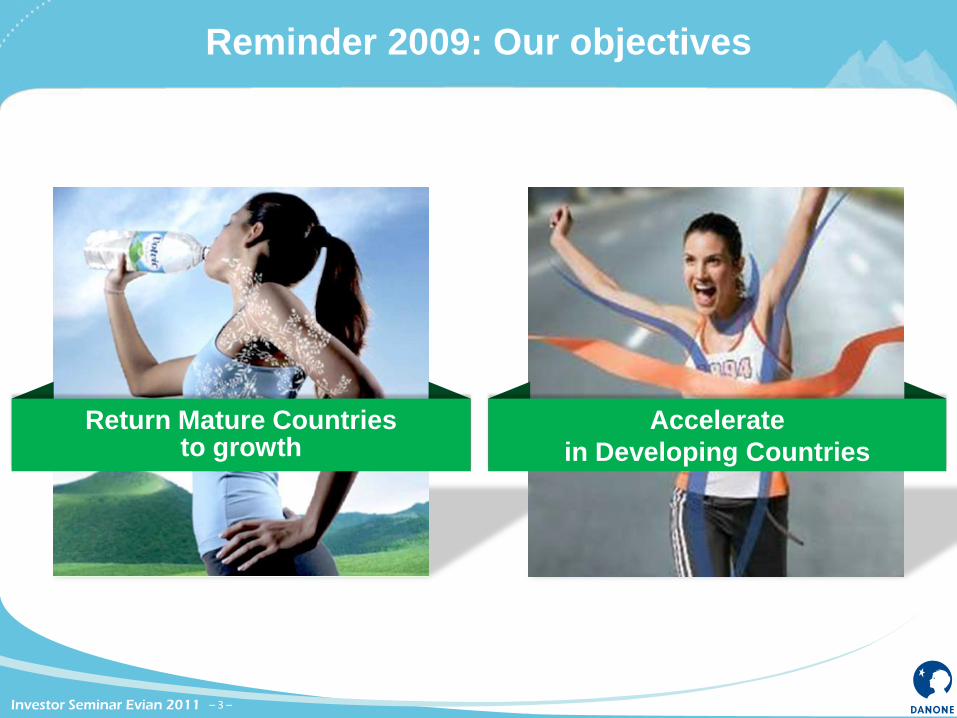
Reminder 2009: Our objectives
– 3 –
Accelerate
in Developing Countries
Return Mature Countries to growth
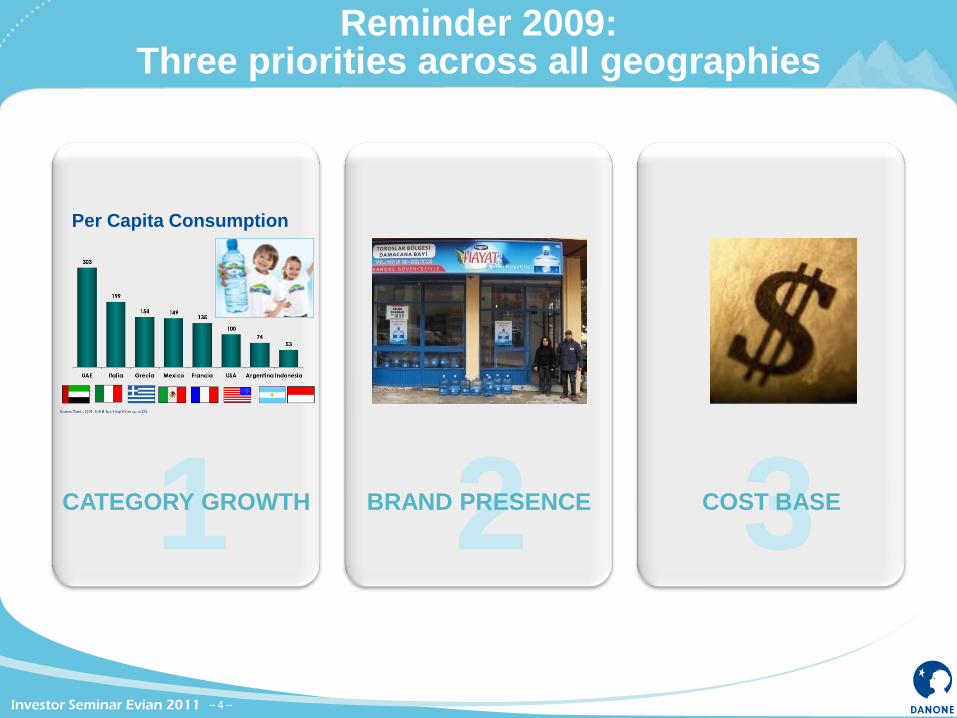
Reminder 2009:Three priorities across all geographies
– 4 –
1 2 3
Per Capita Consumption
CATEGORY GROWTH BRAND PRESENCE COST BASE
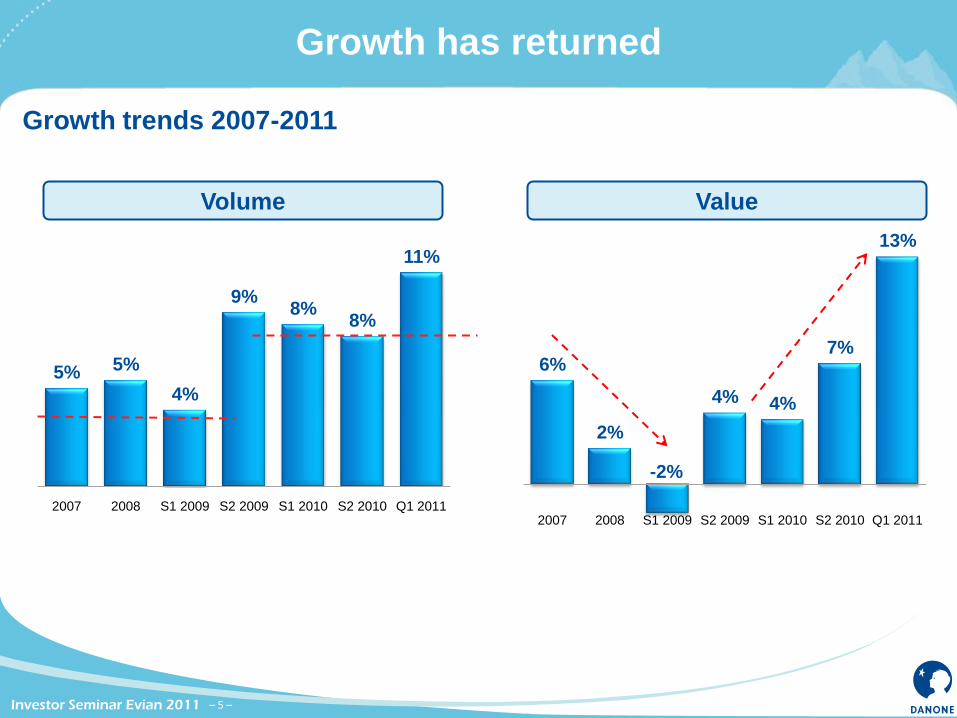
Growth has returned
– 5 –
5% 5%
4%
9%8%
8%
11%
2007 2008 S1 2009 S2 2009 S1 2010 S2 2010 Q1 2011
6%
2%
-2%
4% 4%
7%
13%
2007 2008 S1 2009 S2 2009 S1 2010 S2 2010 Q1 2011
Volume Value
Growth trends 2007-2011
The pricing/mix impact is going back to normal
– 6 –
1%
-3%
-6%
-5% -4%
0%
3%
2007 2008 S1 2009 S2 2009 S1 2010 S2 2010 Q1 2011
Difference Value-Volume 2007-2011
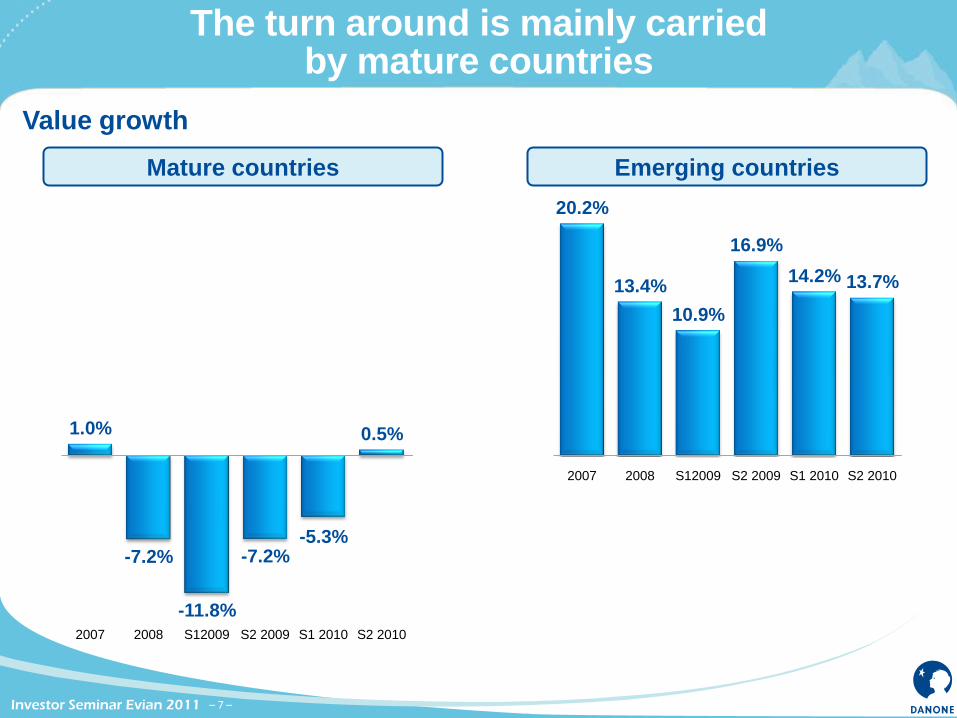
The turn around is mainly carried by mature countries
– 7 –
20.2%
13.4%
10.9%
16.9%
14.2% 13.7%
19.2%
2007 2008 S12009 S2 2009 S1 2010 S2 2010 Q1 2011
Mature countries Emerging countries
Value growth
1.0%
-7.2%
-11.8%
-7.2%-5.3%
0.5%
5.7%
2007 2008 S12009 S2 2009 S1 2010 S2 2010 Q1 2011
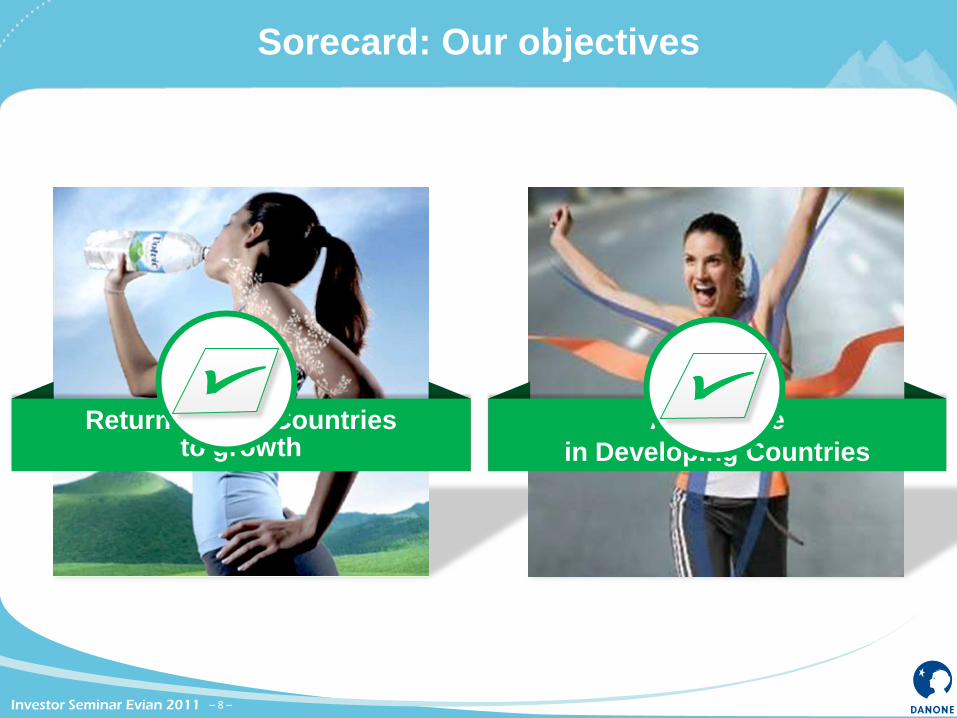
Sorecard: Our objectives
– 8 –
Accelerate
in Developing Countries
Return Mature Countries to growth
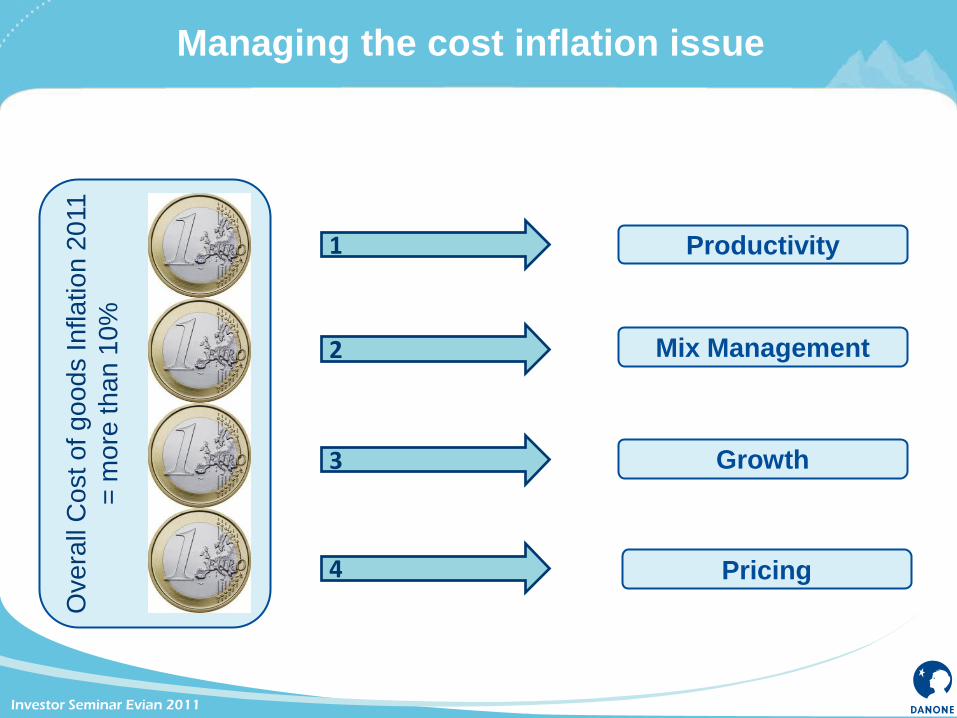
Managing the cost inflation issue O
vera
ll C
ost of goods Inflation 2
011
= m
ore
th
an
10
%
1
2
3
4
Productivity
Growth
Mix Management
Pricing
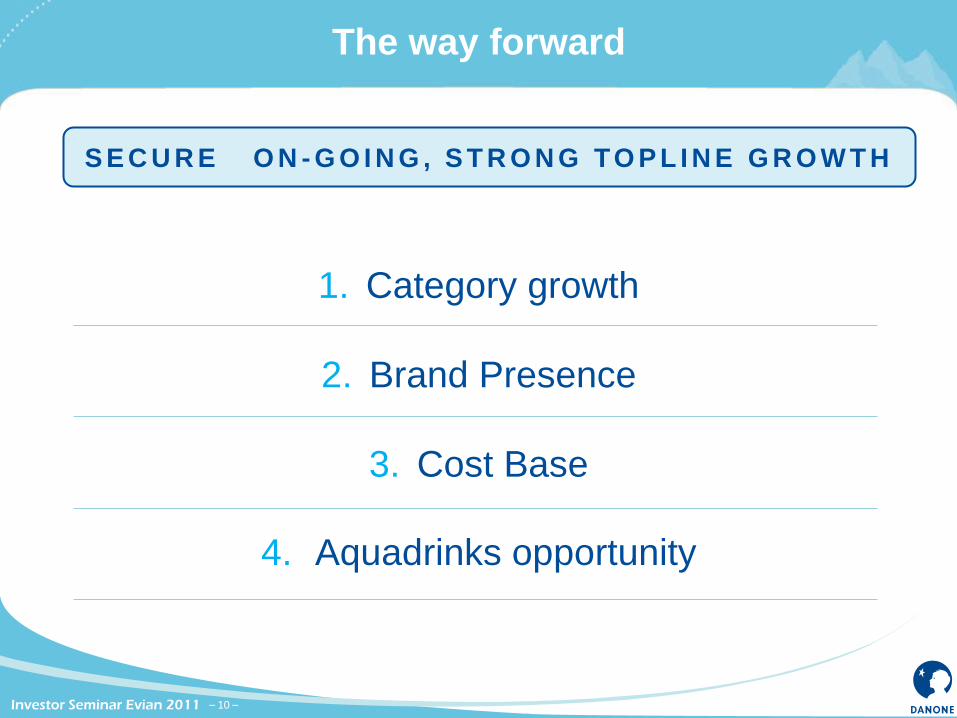
The way forward
– 10 –
1. Category growth
2. Brand Presence
3. Cost Base
4. Aquadrinks opportunity
S E C U R E O N - G O I N G , S T R O N G TO P L I N E G R O W T H
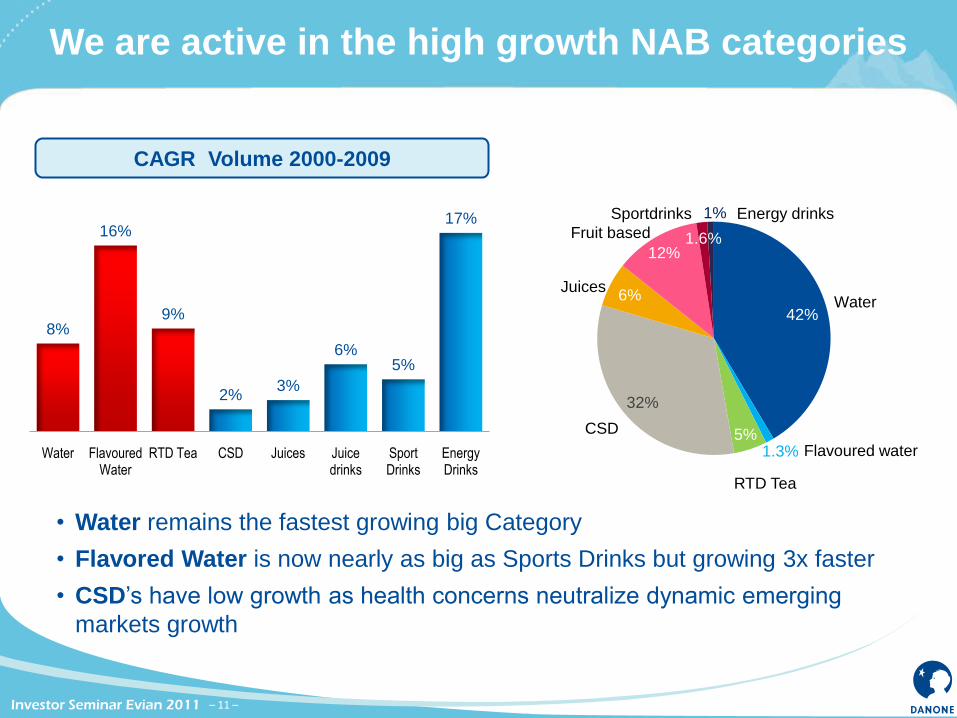
We are active in the high growth NAB categories
– 11 –
• Water remains the fastest growing big Category
• Flavored Water is now nearly as big as Sports Drinks but growing 3x faster
• CSD’s have low growth as health concerns neutralize dynamic emerging
markets growth
8%
16%
9%
2%3%
6%5%
17%
Water Flavoured Water
RTD Tea CSD Juices Juice drinks
Sport Drinks
Energy Drinks
42%
1.3%5%
32%
6%
12%1.6%
1% Energy drinksSportdrinks
Juices
CSD
RTD Tea
Flavoured water
Water
Fruit based
CAGR Volume 2000-2009
– 12 –
Growing the Water Category
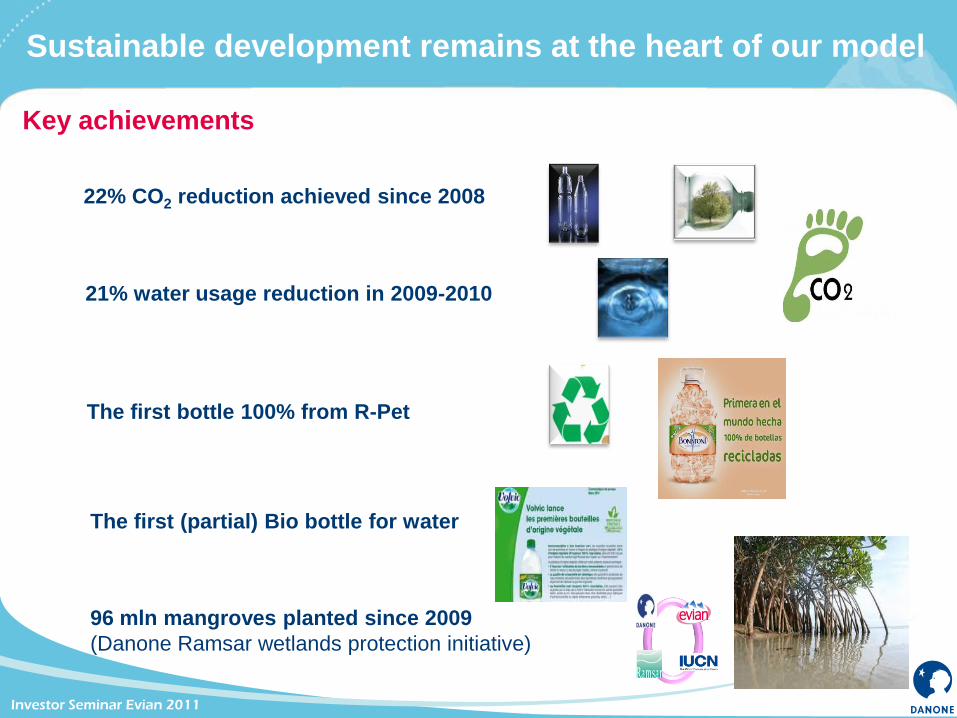
96 mln mangroves planted since 2009
(Danone Ramsar wetlands protection initiative)
22% CO2 reduction achieved since 2008
The first bottle 100% from R-Pet
21% water usage reduction in 2009-2010
Sustainable development remains at the heart of our model
The first (partial) Bio bottle for water
Key achievements
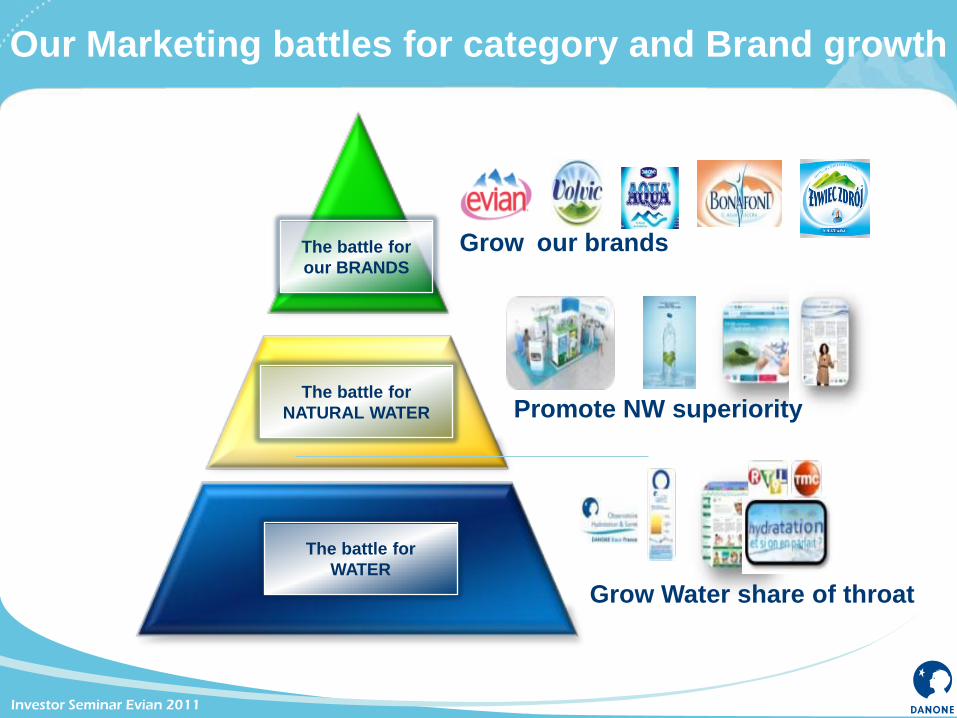
Our Marketing battles for category and Brand growth
The battle for WATER
The battle for
NATURAL WATER
The battle for
our BRANDS
The battle for
WATER
Grow Water share of throat
Grow our brands
Promote NW superiority
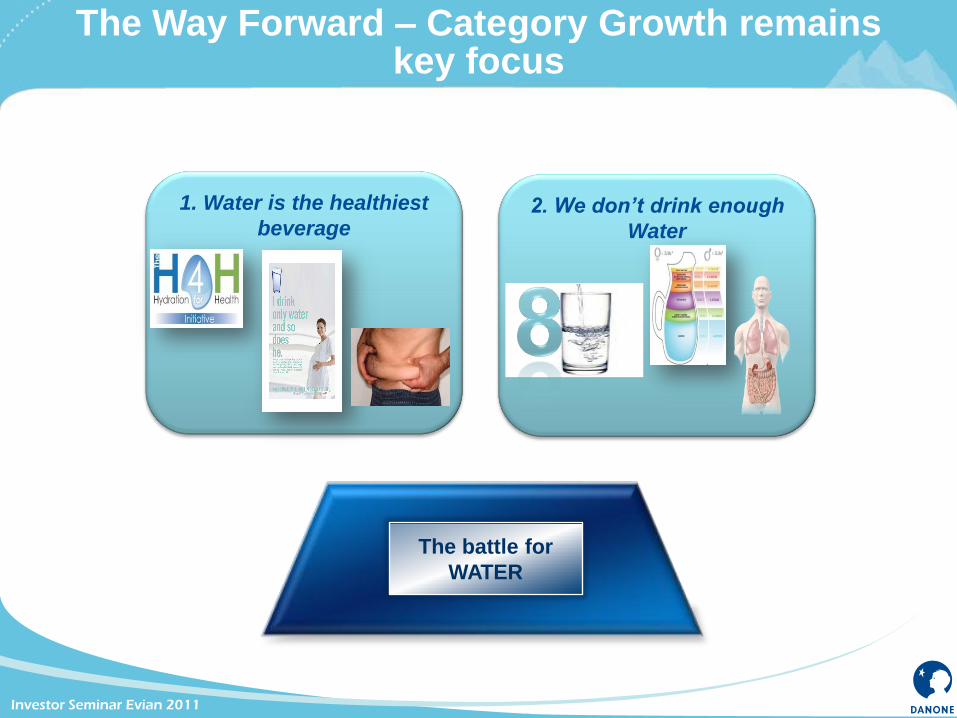
1. Water is the healthiest
beverage2. We don’t drink enough
Water
The battle for WATERThe battle for
WATER
The Way Forward – Category Growth remainskey focus
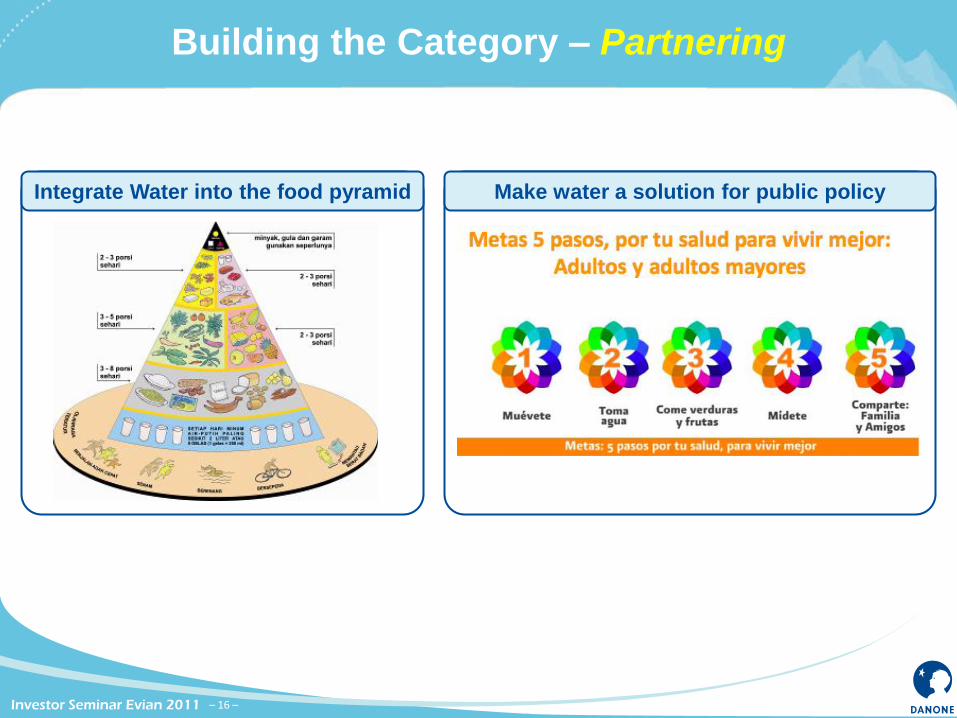
Building the Category – Partnering
– 16 –
Make water a solution for public policy Integrate Water into the food pyramid
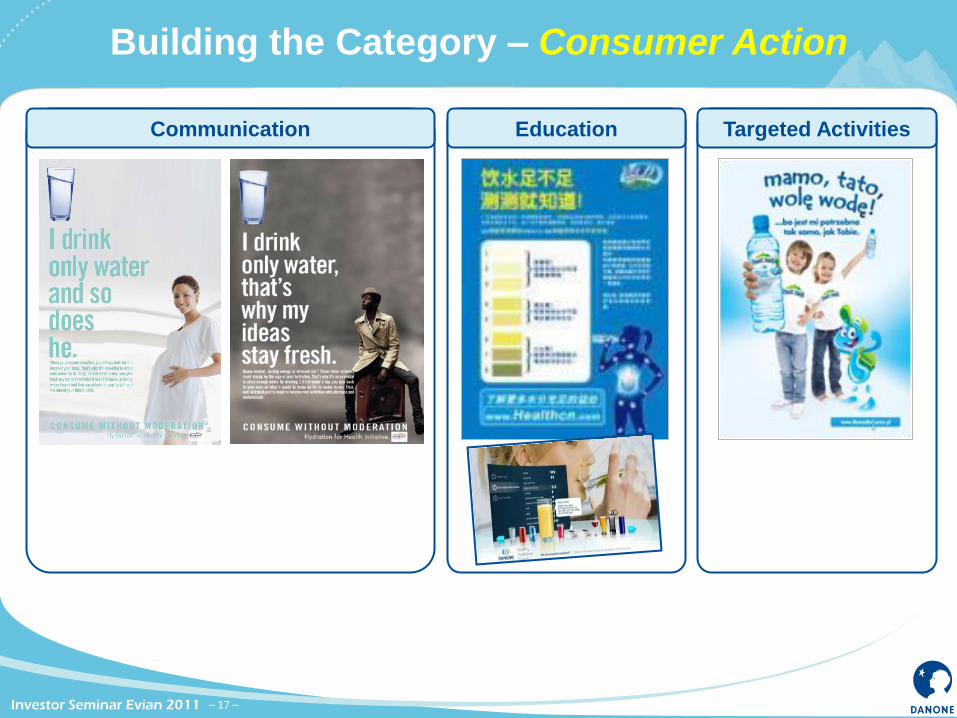
Targeted Activities
Building the Category – Consumer Action
– 17 –
EducationCommunication
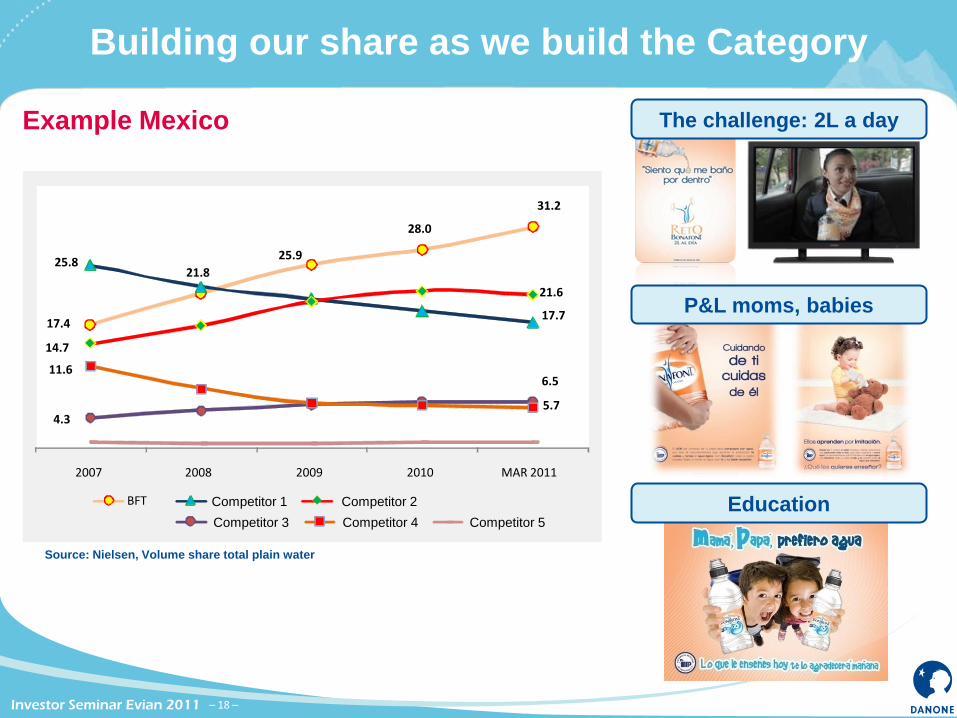
Building our share as we build the Category
– 18 –
Example Mexico The challenge: 2L a day
P&L moms, babies
Education
17.4
21.8
25.9
28.0
31.2
25.8
17.7
14.7
21.6
4.3
6.511.6
5.7
2007 2008 2009 2010 MAR 2011
BFT Competitor 1
Source: Nielsen, Volume share total plain water
Competitor 5Competitor 4Competitor 3
Competitor 2
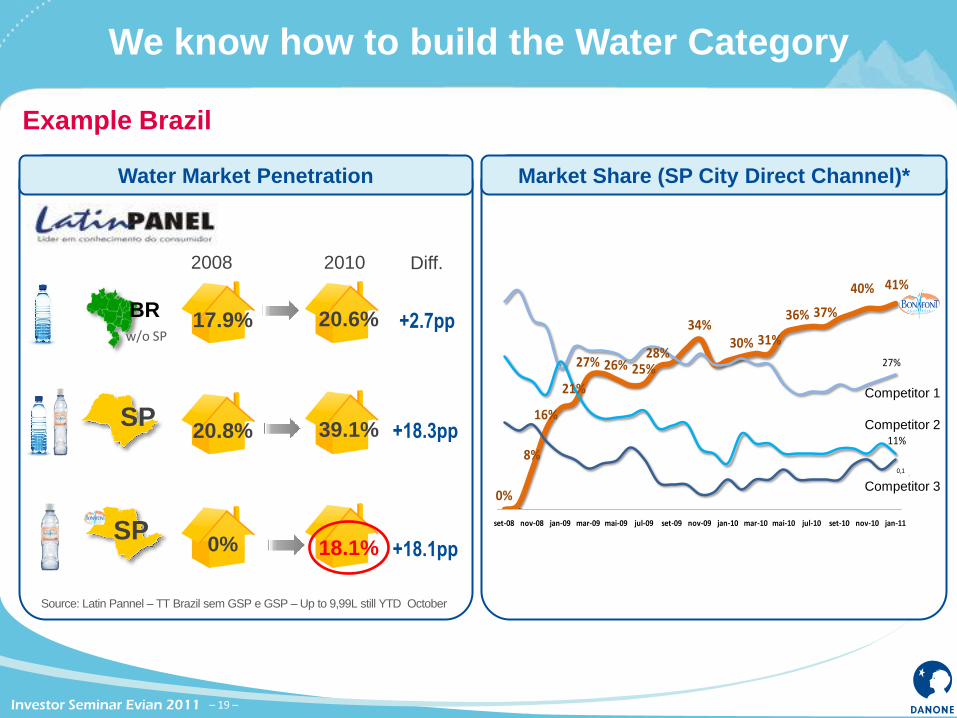
BRw/o SP
17.9%
2008 2010 Diff.
Source: Latin Pannel – TT Brazil sem GSP e GSP – Up to 9,99L still YTD October
SP20.8%
Water Market Penetration
We know how to build the Water Category
– 19 –
Example Brazil
20.6% +2.7pp
SP18.1% +18.1pp0%
39.1% +18.3pp
0%
8%
16%
21%
27% 26% 25%28%
34%30% 31%
36% 37%
40% 41%
27%
11%
0,1
set-08 nov-08 jan-09 mar-09 mai-09 jul-09 set-09 nov-09 jan-10 mar-10 mai-10 jul-10 set-10 nov-10 jan-11
Market Share (SP City Direct Channel)*
Competitor 1
Competitor 2
Competitor 3
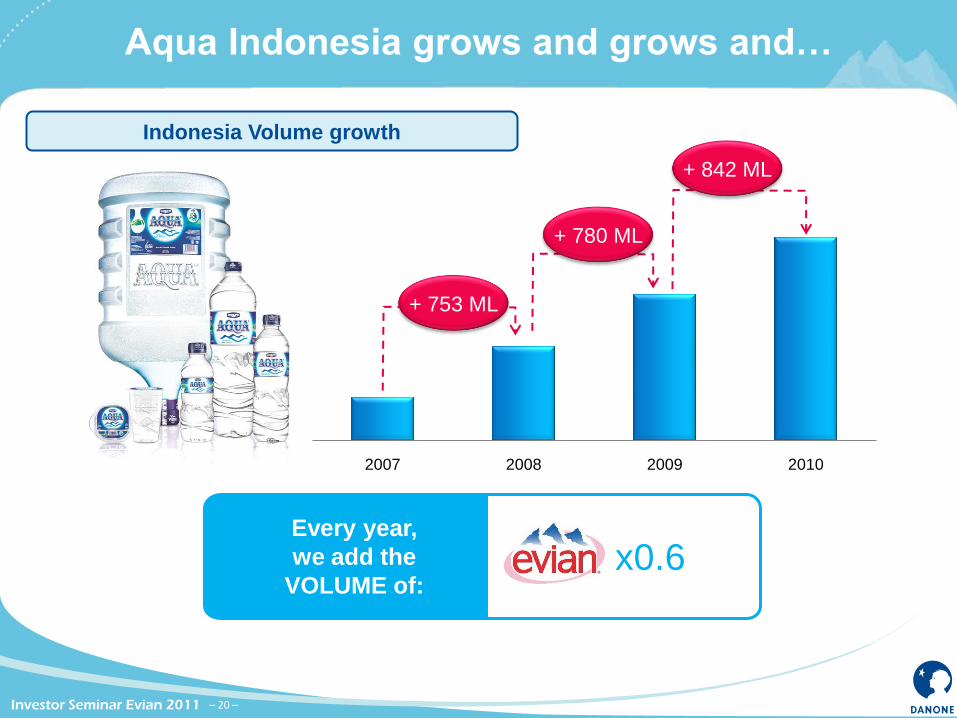
Aqua Indonesia grows and grows and…
– 20 –
2007 2008 2009 2010
Every year,
we add the
VOLUME of:x0.6
Indonesia Volume growth
+ 753 ML
+ 780 ML
+ 842 ML
– 21 –
Exploiting the Aquadrinks Opportunity
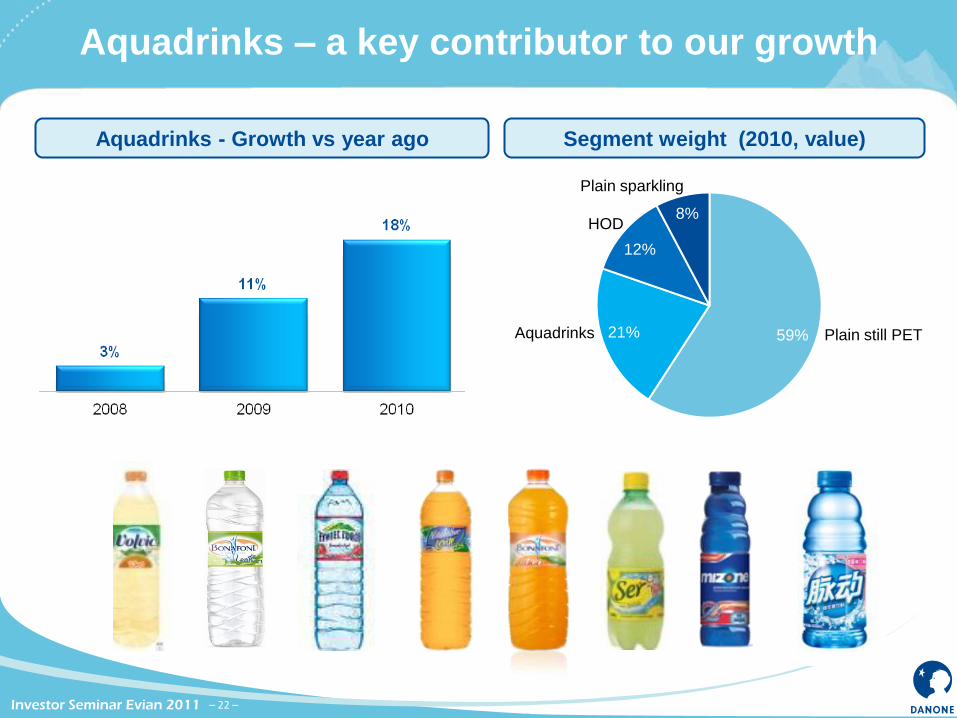
Aquadrinks – a key contributor to our growth
– 22 –
Aquadrinks - Growth vs year ago
59%21%
12%
8%
Segment weight (2010, value)
Plain still PET
Plain sparkling
HOD
Aquadrinks
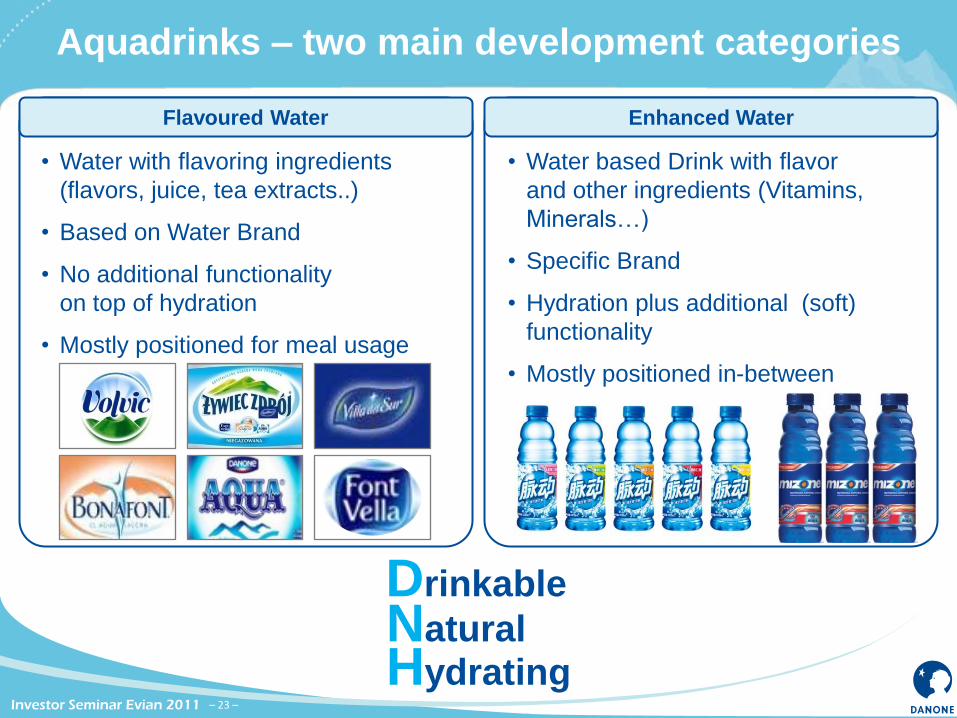
Aquadrinks – two main development categories
– 23 –
Enhanced Water
• Water based Drink with flavor
and other ingredients (Vitamins,
Minerals…)
• Specific Brand
• Hydration plus additional (soft)
functionality
• Mostly positioned in-between
Flavoured Water
• Water with flavoring ingredients
(flavors, juice, tea extracts..)
• Based on Water Brand
• No additional functionality
on top of hydration
• Mostly positioned for meal usage
Drinkable
NaturalHydrating
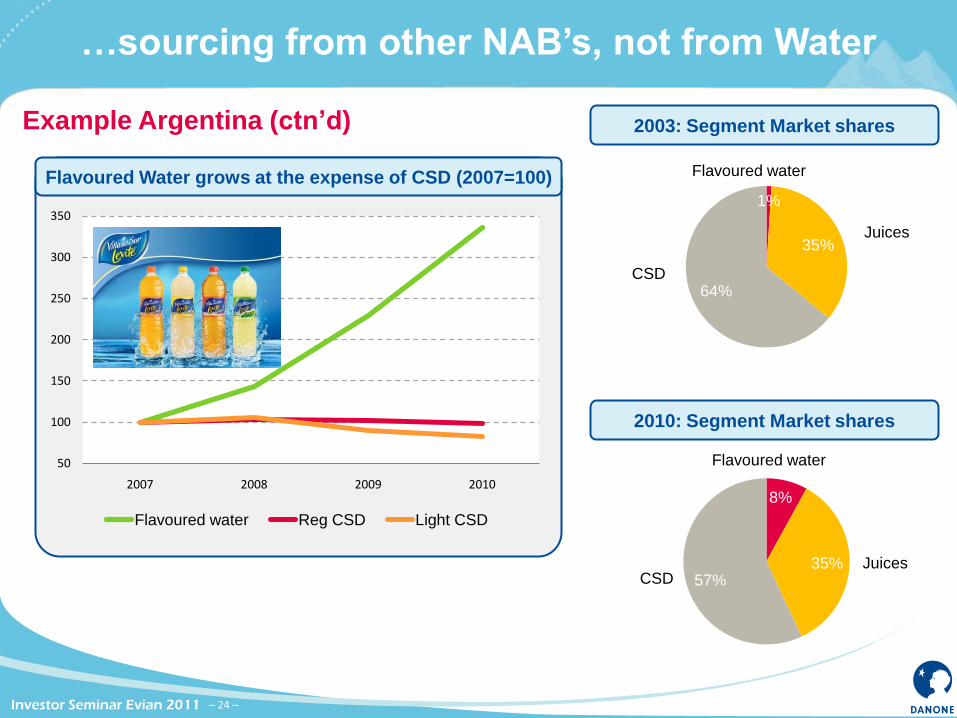
…sourcing from other NAB’s, not from Water
– 24 –
Example Argentina (ctn’d)
Flavoured Water grows at the expense of CSD (2007=100)
50
100
150
200
250
300
350
2007 2008 2009 2010
Flavoured water Reg CSD Light CSD
1%
35%
64%
2003: Segment Market shares
Juices
Flavoured water
CSD
2010: Segment Market shares
Juices
Flavoured water
CSD
8%
35%57%
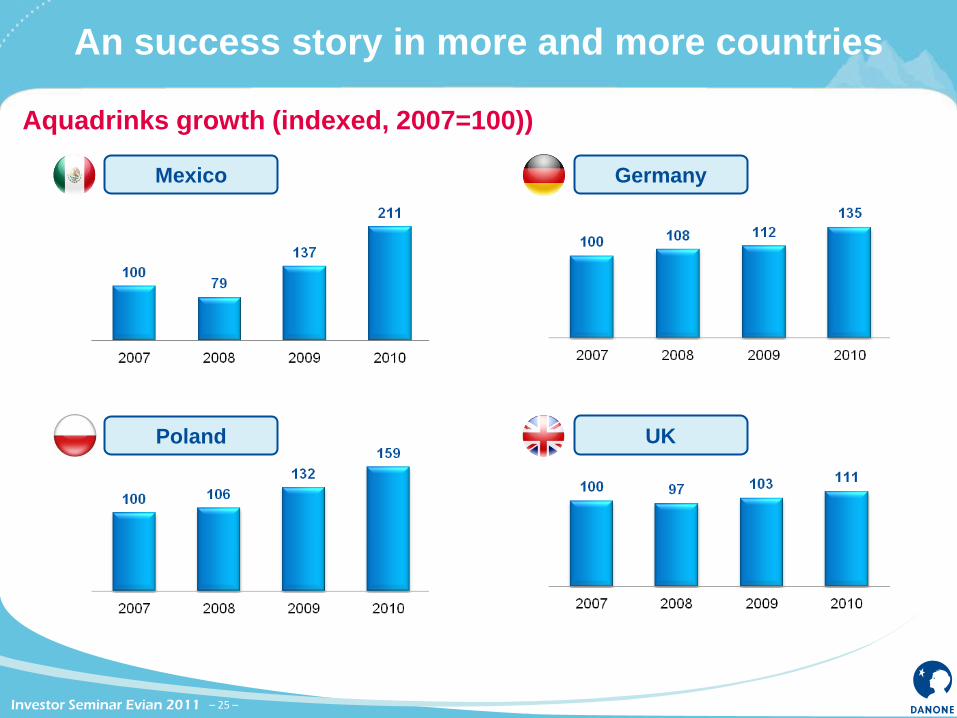
An success story in more and more countries
– 25 –
Aquadrinks growth (indexed, 2007=100))
Mexico Germany
Poland UK
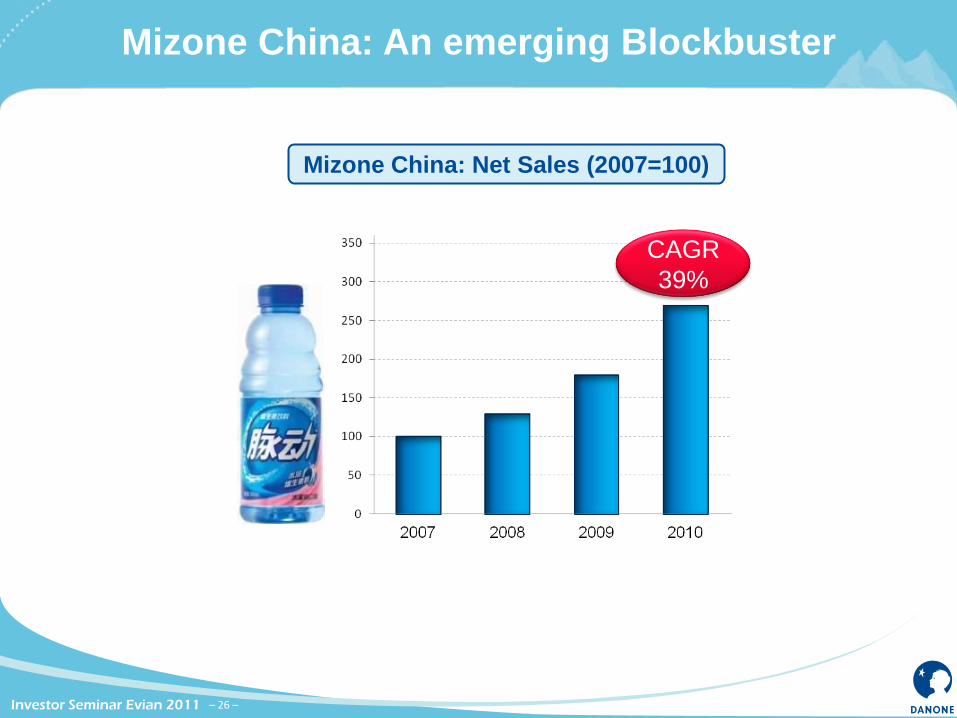
Mizone China: An emerging Blockbuster
– 26 –
Mizone China: Net Sales (2007=100)
CAGR
39%
– 27 –
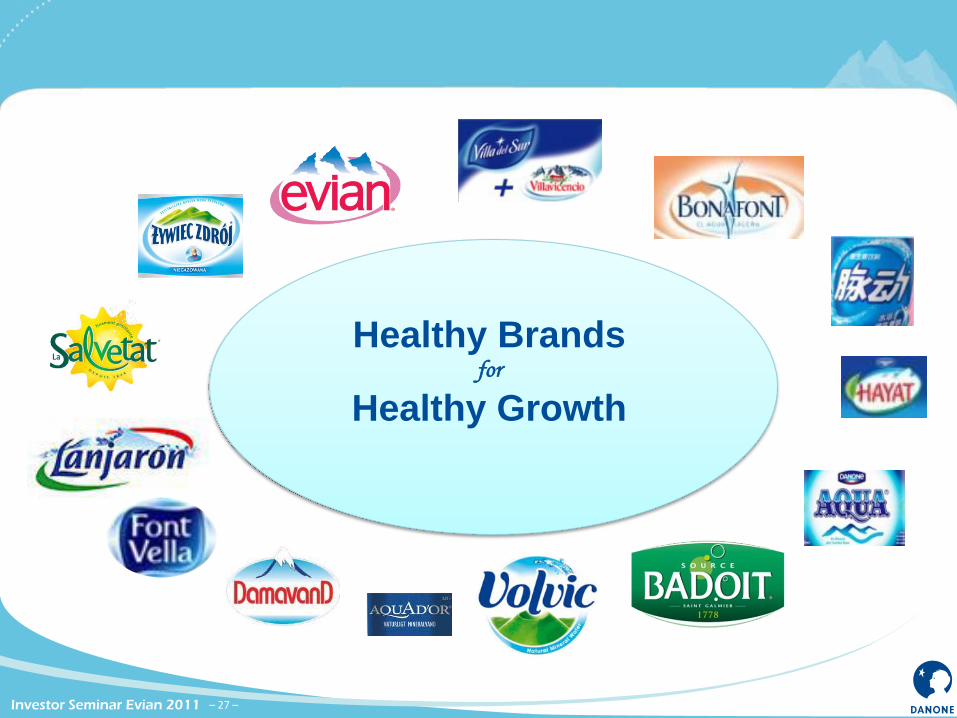
Healthy Brandsfor
Healthy Growth