water and waste water treatment opportunity in …treatment of waste water, sewage treatment and...
TRANSCRIPT
Water and Waste Water Treatment Opportunity in India An Overview
An ISO 9001:2008 Certified Organization
2011
AVALON GLOBAL RESEARCH
2
Contents India Country ID ............................................................................................................................................................. 3
Geography & Climatic Conditions......................................................................................................................... 3
Land Use/Irrigation/Renewable Water ................................................................................................................ 5
Government .......................................................................................................................................................... 5
People & Population ............................................................................................................................................. 5
The Economy ................................................................................................................................................................. 6
Water ..................................................................................................................................................................... 7
Renewable Energy ................................................................................................................................................ 7
Food Sector ........................................................................................................................................................... 7
Others .................................................................................................................................................................... 7
Water in India ................................................................................................................................................................ 8
Introduction .......................................................................................................................................................... 8
Waste Water Treatment ..................................................................................................................................... 10
Pollution .............................................................................................................................................................. 11
Rainwater Harvesting ......................................................................................................................................... 11
Desalination ........................................................................................................................................................ 12
Reverse Osmosis Desalination Projects ............................................................................................................. 12
Irrigation .............................................................................................................................................................. 13
Ground Water ..................................................................................................................................................... 14
Water Quality ...................................................................................................................................................... 15
Government Initiatives and Policies ............................................................................................................................ 16
11th
Five Year Plan Focus ..................................................................................................................................... 16
Key issues ............................................................................................................................................................. 17
Developments in Public Private Partnerships ...................................................................................................... 19
Market Opportunity .................................................................................................................................................... 20
Market Size and Overall Demand ....................................................................................................................... 20
Business Opportunity.......................................................................................................................................... 26
Annexure ..................................................................................................................................................................... 27
AVALON GLOBAL RESEARCH
3
INDIA COUNTRY ID1
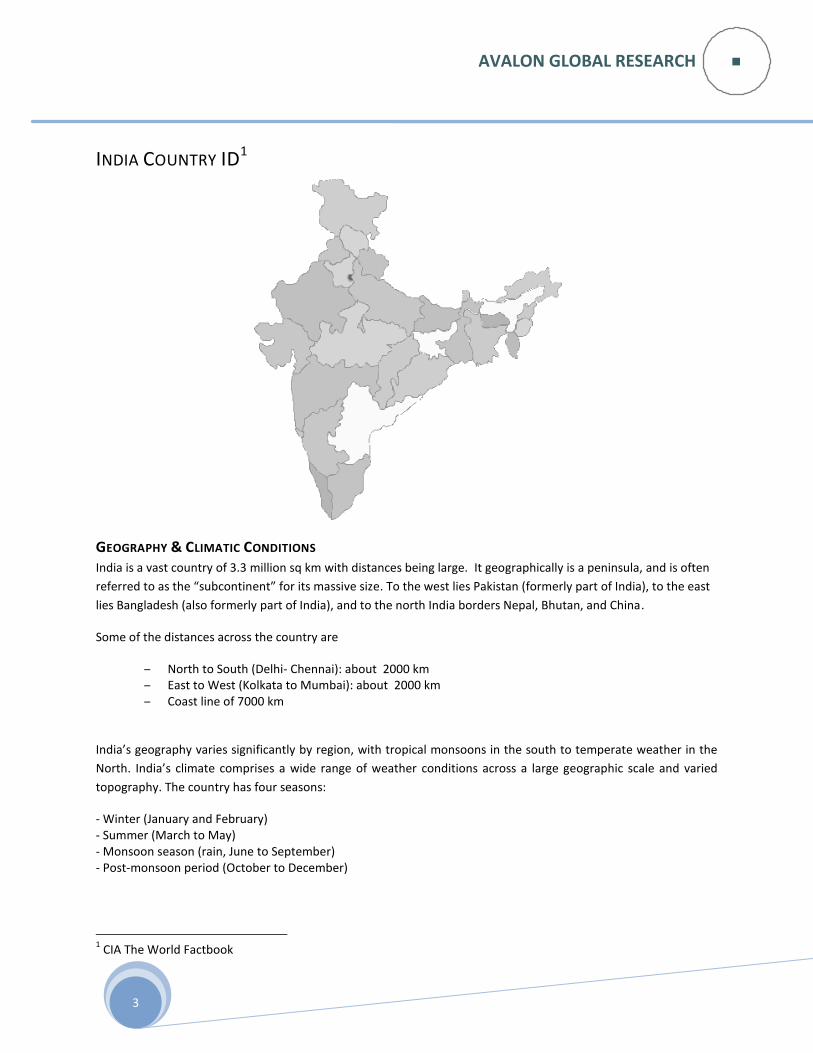
GEOGRAPHY & CLIMATIC CONDITIONS India is a vast country of 3.3 million sq km with distances being large. It geographically is a peninsula, and is often
referred to as the “subcontinent” for its massive size. To the west lies Pakistan (formerly part of India), to the east
lies Bangladesh (also formerly part of India), and to the north India borders Nepal, Bhutan, and China.
Some of the distances across the country are
‒ North to South (Delhi- Chennai): about 2000 km ‒ East to West (Kolkata to Mumbai): about 2000 km ‒ Coast line of 7000 km
India’s geography varies significantly by region, with tropical monsoons in the south to temperate weather in the
North. India’s climate comprises a wide range of weather conditions across a large geographic scale and varied
topography. The country has four seasons:
- Winter (January and February) - Summer (March to May) - Monsoon season (rain, June to September) - Post-monsoon period (October to December)
1 CIA The World Factbook
AVALON GLOBAL RESEARCH
4
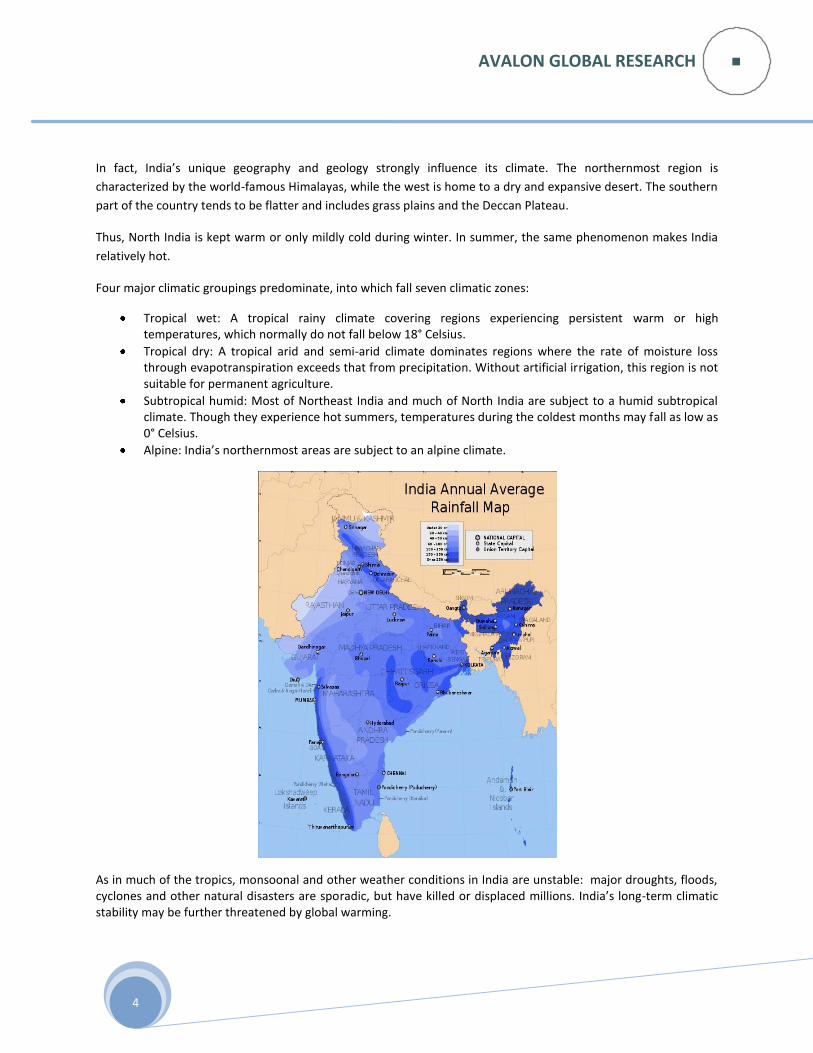
In fact, India’s unique geography and geology strongly influence its climate. The northernmost region is
characterized by the world-famous Himalayas, while the west is home to a dry and expansive desert. The southern
part of the country tends to be flatter and includes grass plains and the Deccan Plateau.
Thus, North India is kept warm or only mildly cold during winter. In summer, the same phenomenon makes India
relatively hot.
Four major climatic groupings predominate, into which fall seven climatic zones:
Tropical wet: A tropical rainy climate covering regions experiencing persistent warm or high temperatures, which normally do not fall below 18° Celsius.
Tropical dry: A tropical arid and semi-arid climate dominates regions where the rate of moisture loss through evapotranspiration exceeds that from precipitation. Without artificial irrigation, this region is not suitable for permanent agriculture.
Subtropical humid: Most of Northeast India and much of North India are subject to a humid subtropical climate. Though they experience hot summers, temperatures during the coldest months may fall as low as 0° Celsius.
Alpine: India’s northernmost areas are subject to an alpine climate.
As in much of the tropics, monsoonal and other weather conditions in India are unstable: major droughts, floods, cyclones and other natural disasters are sporadic, but have killed or displaced millions. India’s long-term climatic stability may be further threatened by global warming.
AVALON GLOBAL RESEARCH
5
LAND USE/IRRIGATION/RENEWABLE WATER ‒ Arable land – 48.83% ‒ Permanent crops: 2.8% ‒ Other: 48.37% (2005) ‒ Irrigated Land: 622,860 sq km (2008) ‒ Total renewable water resources: 1,907.08 cu km (1999)
GOVERNMENT The Indian government is a secular federal republic with 28 states and seven union territories. India’s legal system
is based on English common law and has both a chief of state and a head of government. These figures are elected
by a legislative parliament whose members are elected, in five-year terms, by more local representative
assemblies
PEOPLE & POPULATION India is the second largest country in the world, with a population of over 1.2 billion. The population density of India is reported to be 202 persons per square mile. The population is roughly composed of 72% Indo-Aryan, 25% Dravidian (an aboriginal population that occupies much of southern India and parts of Sri Lanka), and 3% Mongoloid. In India, 23 major languages are spoken, across 6 regions with the dialect change every 100 km
AVALON GLOBAL RESEARCH
6
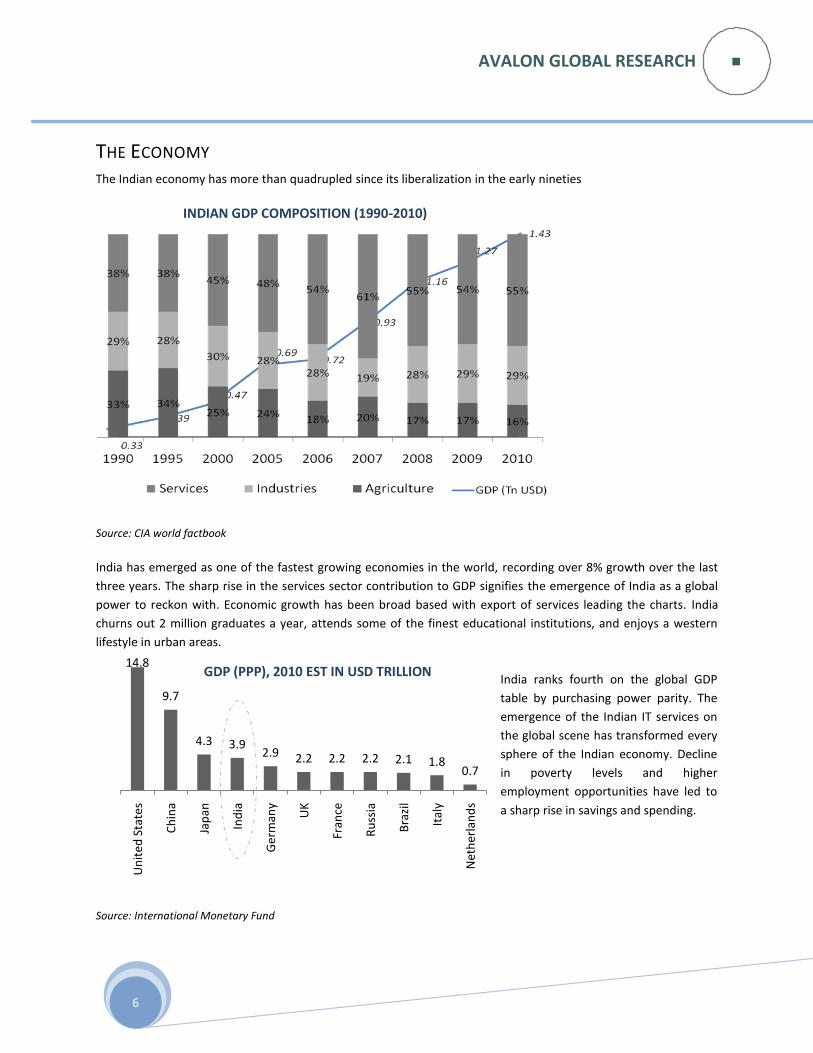
THE ECONOMY The Indian economy has more than quadrupled since its liberalization in the early nineties
Source: CIA world factbook
India has emerged as one of the fastest growing economies in the world, recording over 8% growth over the last
three years. The sharp rise in the services sector contribution to GDP signifies the emergence of India as a global
power to reckon with. Economic growth has been broad based with export of services leading the charts. India
churns out 2 million graduates a year, attends some of the finest educational institutions, and enjoys a western
lifestyle in urban areas.
Source: International Monetary Fund
14.8
9.7
4.3 3.92.9 2.2 2.2 2.2 2.1 1.8
0.7
Un
ited
Sta
tes
Ch
ina
Jap
an
Ind
ia
Ger
man
y
UK
Fran
ce
Ru
ssia
Bra
zil
Ital
y
Net
her
lan
ds
India ranks fourth on the global GDP
table by purchasing power parity. The
emergence of the Indian IT services on
the global scene has transformed every
sphere of the Indian economy. Decline
in poverty levels and higher
employment opportunities have led to
a sharp rise in savings and spending.
INDIAN GDP COMPOSITION (1990-2010)
GDP (PPP), 2010 EST IN USD TRILLION
AVALON GLOBAL RESEARCH
7
There are many sectors where demand is growing rapidly and India will need FDI along with technology support to
bridge the gap2
WATER A large populace still does not have access to safe water. The planning commission has budgeted USD 26.5 billion
in the 2012-2017 plan for providing safe water to all urban and rural Indians. Treatment of waste water, sewage
treatment and solid, liquid and chemical waste, water technology, environmental services, desalination
companies, consulting and engineering are some services that India will require to tackle the water problem. India
spends less than USD 5 per person as compared to USD 28 in US
RENEWABLE ENERGY Despite having an installed capacity of over 167 GW, India is facing an energy deficit of 8% and peak deficit of 12%.
So far, only 4.5% of renewable energy potential has been explored in India. Wind has achieved only 4% of its
potential of 45000 MW while solar has achieved about 10% of its potential (on a sq km basis). Current power
deficit, difficulty in providing power lines in remote areas, rising crude costs provide a huge opportunity for
renewable energy companies viz. wind and solar power
FOOD SECTOR India’s share in exports of processed food is abysmally low, at 1.5%. The global processed food market is estimated
at USD 3.2 trillion. The Indian government has formulated a Vision 2015, to triple the size of the processing
industry, from the current USD 70 b to around USD 210 b, enhancing its global share to 3%, increasing value
addition to 35%, from the current 20%.
OTHERS Ports, Floriculture, Healthcare (equipment), Oil and Gas, Electronics are some other sectors where foreign
collaboration will be in great demand
2 Industry Sources
AVALON GLOBAL RESEARCH
8
WATER IN INDIA
INTRODUCTION While on one hand the pressures of development are changing the distribution of water in the country, on the
other hand access to adequate water has been cited as the primary factor responsible for limiting development.
The average availability of water is reducing steadily with the growing population and it is estimated that by 2020
India will become a water stressed nation. Groundwater is the major source of water in our country with 85% of
the population dependent on it.
As per the 2001 Census 68.2 per cent of households in India has access to safe drinking water. More recent
estimates state that, 94 per cent of the rural population and 91 per cent of the people living in urban areas have
access to safe drinking water.
Per capita availability of fresh water in India has dropped from 5,177 cubic meters in 1951 to 1,820 cubic meters in
2001. The urban situation faces the same plight, with cities like Bangalore where water is rationed twice a week
and for 30 minutes a day in Bhopal. Given the projected growth of population by the year 2025, the per capita
availability is likely to drop drastically leading to scarcity.
Only about half of the cities in India are supplied with piped water. For cities which have a population of between
one and five million their municipal authorities distribute water for a few hours per day. The few hours that water
is available, the inadequate pipe pressure makes the whole process a struggle.
Traditionally, the water sector in India has been owned and operated by the government. The Indian government
supports the private sector to contribute and initiate various regulatory reforms. Not being able to solve all
problems single-handedly, the government is encouraging the private sector to participate and introduce
regulatory reforms.
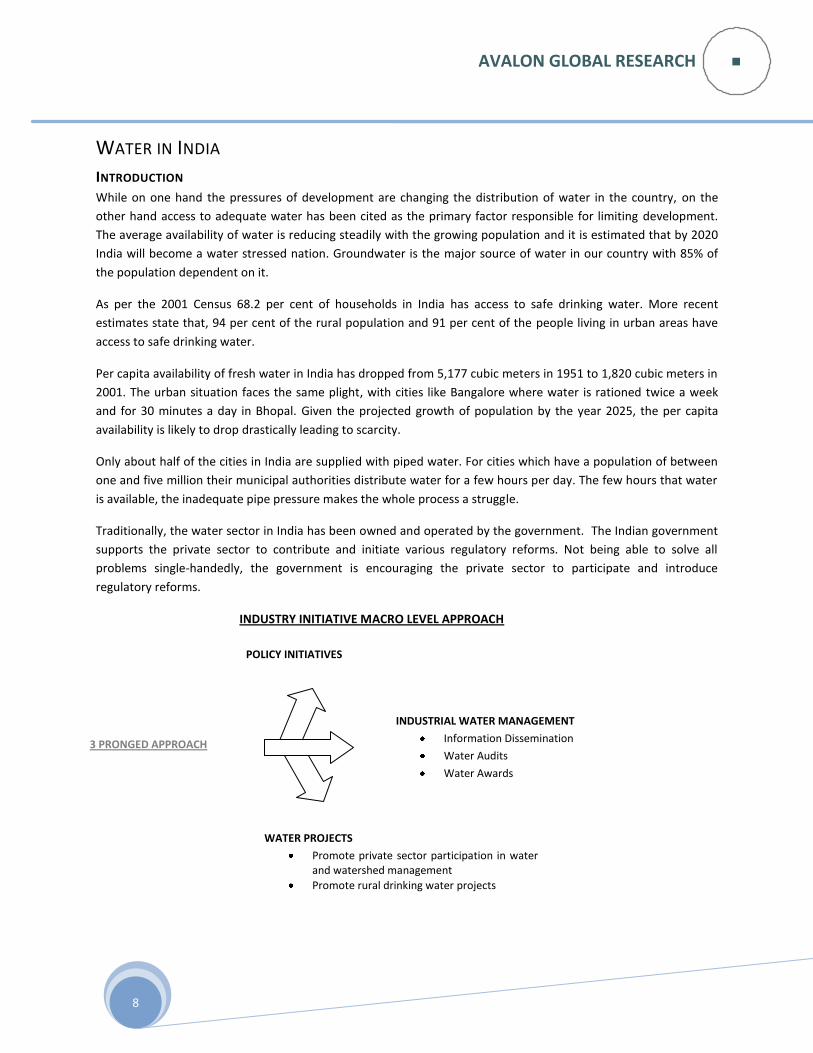
INDUSTRY INITIATIVE MACRO LEVEL APPROACH
3 PRONGED APPROACH
INDUSTRIAL WATER MANAGEMENT
Information Dissemination
Water Audits
Water Awards
POLICY INITIATIVES
WATER PROJECTS
Promote private sector participation in water and watershed management
Promote rural drinking water projects
AVALON GLOBAL RESEARCH
9
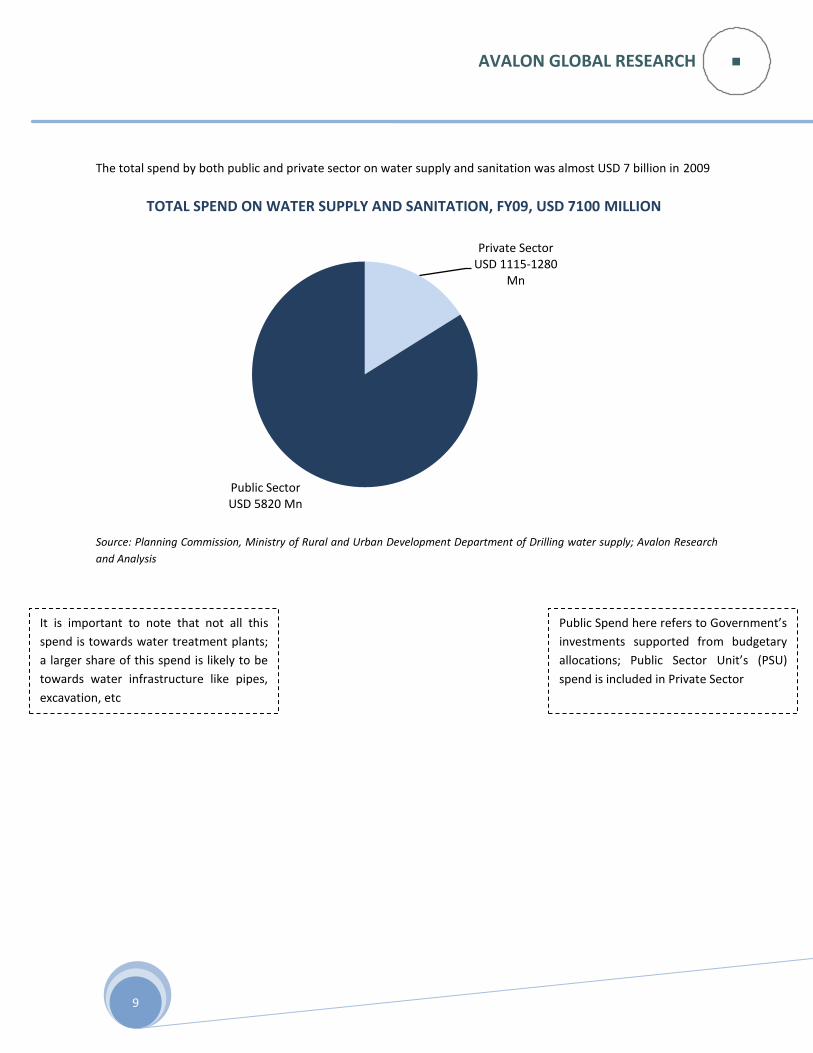
The total spend by both public and private sector on water supply and sanitation was almost USD 7 billion in 2009
Source: Planning Commission, Ministry of Rural and Urban Development Department of Drilling water supply; Avalon Research
and Analysis
Private Sector USD 1115-1280
Mn
Public Sector USD 5820 Mn
TOTAL SPEND ON WATER SUPPLY AND SANITATION, FY09, USD 7100 MILLION
It is important to note that not all this
spend is towards water treatment plants;
a larger share of this spend is likely to be
towards water infrastructure like pipes,
excavation, etc
Public Spend here refers to Government’s
investments supported from budgetary
allocations; Public Sector Unit’s (PSU)
spend is included in Private Sector
AVALON GLOBAL RESEARCH
10
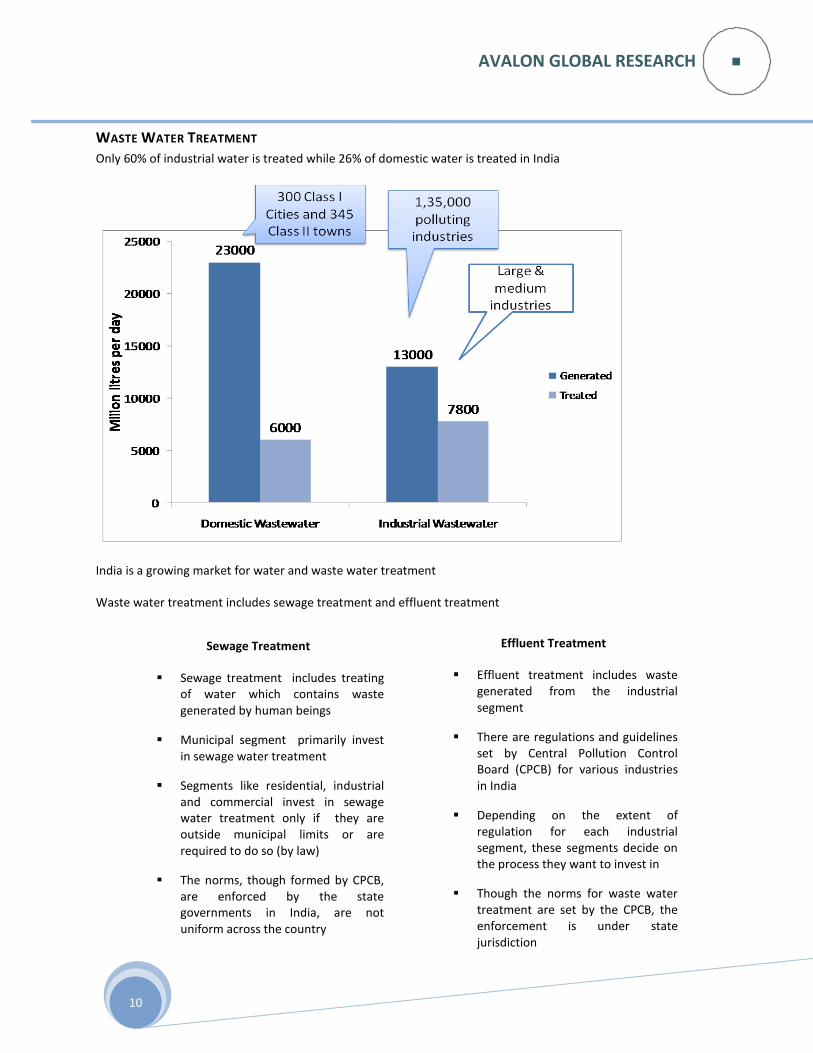
WASTE WATER TREATMENT
Only 60% of industrial water is treated while 26% of domestic water is treated in India
India is a growing market for water and waste water treatment
Waste water treatment includes sewage treatment and effluent treatment
Sewage Treatment
Sewage treatment includes treating of water which contains waste generated by human beings
Municipal segment primarily invest in sewage water treatment
Segments like residential, industrial and commercial invest in sewage water treatment only if they are outside municipal limits or are required to do so (by law)
The norms, though formed by CPCB, are enforced by the state governments in India, are not uniform across the country
Effluent Treatment
Effluent treatment includes waste generated from the industrial segment
There are regulations and guidelines set by Central Pollution Control Board (CPCB) for various industries in India
Depending on the extent of regulation for each industrial segment, these segments decide on the process they want to invest in
Though the norms for waste water treatment are set by the CPCB, the enforcement is under state jurisdiction
AVALON GLOBAL RESEARCH
11
POLLUTION The release of untreated wastewater has resulted in increased pollution and depletion of clean water resources. The most polluting of them are the city sewage and industrial waste discharged into the rivers. The facilities to treat waste water are not adequate in any city in India. Presently, only about 10% of the waste water generated is treated; the rest is discharged as it is into our water bodies. The main quality problem encountered with ground water in India is due to excess fluoride, arsenic, iron, nitrate, and salinity. Nitrate contamination is mainly due to the use of fertilizers and discharge of fecal material. Salinity may have different origin, but the most common is the infiltration of brackish water in a fresh aquifer due to the over exploitation of this aquifer.
RAINWATER HARVESTING In India, rainwater harvesting is an ancient tradition. From as far back as the 4500 BC, the simplest of earthworks in
Thar Dessert and Rajasthan, would harvest water from the falling rain. However, in recent years more
sophisticated methods and technologies are being made use of. Organised collection and recharging of ground
water, is a new development and is gaining significance as a viable and easy to implement remedy to restore the
hydrological imbalance and prevent a crisis. Today, rooftop rainwater harvesting systems are now mandatory for
new buildings in 18 of India’s 28 states and 4 of its 7 federally-administered union territories.
Falling groundwater tables and the cost of developing surface supplies, new government mandates and funding
emphasize rainwater harvesting. Extraction of groundwater is being done unplanned and uncontrolled, resulting in
1. Hydrological imbalance
2. Deterioration in water quality
3. Rise in energy requirements for pumping
About 50 percent of the funds for India’s Rural Employment Act are being used for water harvesting systems, as
per the Minister for Rural Development.
The agencies involved in rainwater harvesting are
Central Ground Water Board (CGWB)
Centre for Science and Environment A few rainwater harvesting projects are as below:
Saint Gobain, Sriperumbudur, (rooftop water harvesting 1,50,000 m3/year)
Wipro, Bangalore, (rainwater harvesting, 2254 KL harvested water/year)
Hero Honda, Haryana (rooftop for capturing rain 11,080 sq m)
AVALON GLOBAL RESEARCH
12
DESALINATION India has a long coastline of 7,600 kilometres and is most likely to witness high growth ratios in desalinating water in the future. Unequal water distribution exists within our country and fresh water desalination technology is getting concentrated more on water scarce areas such as Gujarat, Tamil Nadu and Rajasthan. Besides producing desalted water for human consumption and Industrial requirement these technologies are also found to be advantageous in the recovery of water from waste streams. As per the Indian Desalination Association there are more than 1000 membrane based desalination plants of various capacities ranging from 20 m3/day to 10,000 m3/day. The few desalination plants are as below:
Plant City State Developed by
Chennai Petroleum Corporation Limited (CPCL),
Chennai Tamil Nadu Ion Exchange, India
Gujarat State Electricity Board (GSEB) Sikka Gujarat Ion Exchange, India
Nirma Industries Bhavnagar Gujarat Thermax, India
Reliance Industries Limited (RIL) Jamnagar Gujarat IDE, Israel
Tata Chemicals Limited Mithapur Mithapur GE Water
Source: Industry Sources Besides the above, government initiatives in the form of small community-based desalination plants have been put up by the government at coastal areas in the states of Andhra Pradesh and Tamil Nadu
REVERSE OSMOSIS DESALINATION PROJECTS The demand for membrane based desalination plants is increasing. Ever since the early nineties numerous Since
membrane based brackish water desalination plants were set up with the aim of providing safe drinking water to
villages in states like Andhra Pradesh, Gujarat, Rajasthan and Tamil Nadu.
Reverse osmosis desalination plants were installed also in the industry sector:
Plant City State Developed by
Gujarat State Electricity Board (GSEB) Sikka Gujarat Ion Exchange, India
Nirma Industries Bhavnagar Gujarat Thermax, India
Rashtriya Chemical Factory Mumbai Maharashtra Aquatec, India
IFFCO Phulpur Uttar Pradesh Ion Exchange, India
Source: Industry Sources
AVALON GLOBAL RESEARCH
13
IRRIGATION Agriculture contributes about 18 per cent to India’s gross domestic product (GDP). Nevertheless, about 65-70 per
cent of the Indian population depends on agriculture for its livelihood. It is a rather risky dependency because
nearly 60 per cent of India’s agricultural area depends on seasonal monsoon rains. Since 1950 India’s national as
well as federal state governments have invested around USD 18 billion to provide irrigation infrastructure across
the country. Today, India’s irrigation infrastructure is growing with investments at USD 1.5 billion each year. But it
should grow three times faster if the actual need is to be met.
Irrigation demand in India’s major river basins by 2050
River Basins Major agricultural states in the river basins
Population density Water used for irrigation (of total consumption)
Ganges Uttar Pradesh 449 91%
Krishna Maharashtra, Karnataka 253 90%
Kaveri Tamil Nadu, Karnataka 389 95%
Godavari Andhra Pradesh, Karnataka
189 89%
Source: Grail Research, 2009
Irrigation potential
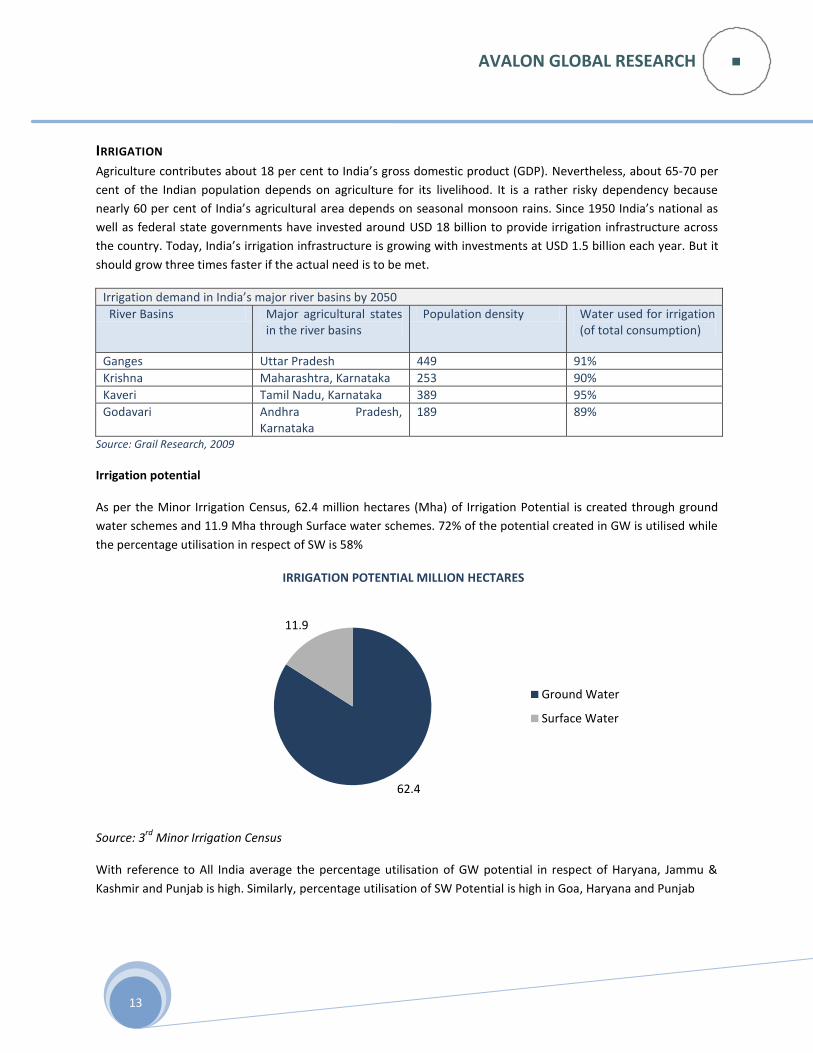
As per the Minor Irrigation Census, 62.4 million hectares (Mha) of Irrigation Potential is created through ground
water schemes and 11.9 Mha through Surface water schemes. 72% of the potential created in GW is utilised while
the percentage utilisation in respect of SW is 58%
Source: 3rd
Minor Irrigation Census
With reference to All India average the percentage utilisation of GW potential in respect of Haryana, Jammu &
Kashmir and Punjab is high. Similarly, percentage utilisation of SW Potential is high in Goa, Haryana and Punjab
62.4
11.9
Ground Water
Surface Water
IRRIGATION POTENTIAL MILLION HECTARES
AVALON GLOBAL RESEARCH
14
GROUND WATER
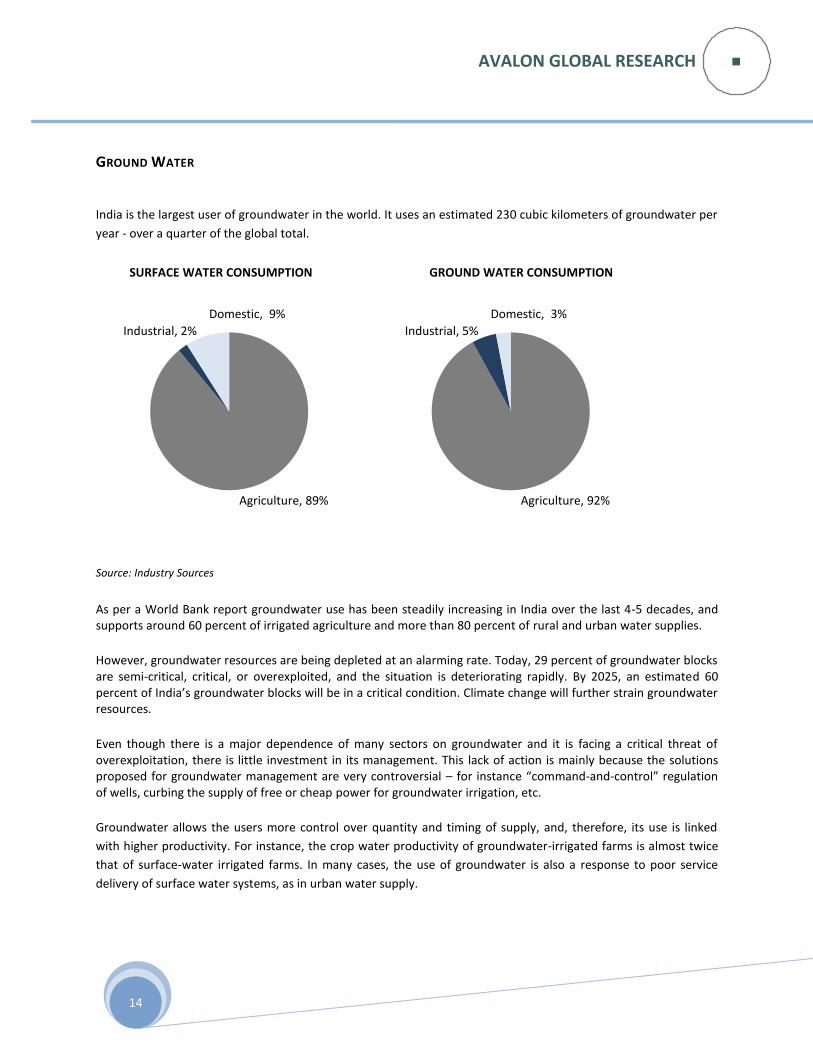
India is the largest user of groundwater in the world. It uses an estimated 230 cubic kilometers of groundwater per
year - over a quarter of the global total.
Source: Industry Sources
As per a World Bank report groundwater use has been steadily increasing in India over the last 4-5 decades, and supports around 60 percent of irrigated agriculture and more than 80 percent of rural and urban water supplies.
However, groundwater resources are being depleted at an alarming rate. Today, 29 percent of groundwater blocks are semi-critical, critical, or overexploited, and the situation is deteriorating rapidly. By 2025, an estimated 60 percent of India’s groundwater blocks will be in a critical condition. Climate change will further strain groundwater resources.
Even though there is a major dependence of many sectors on groundwater and it is facing a critical threat of overexploitation, there is little investment in its management. This lack of action is mainly because the solutions proposed for groundwater management are very controversial – for instance “command-and-control” regulation of wells, curbing the supply of free or cheap power for groundwater irrigation, etc.
Groundwater allows the users more control over quantity and timing of supply, and, therefore, its use is linked
with higher productivity. For instance, the crop water productivity of groundwater-irrigated farms is almost twice
that of surface-water irrigated farms. In many cases, the use of groundwater is also a response to poor service
delivery of surface water systems, as in urban water supply.
Domestic, 9%
Industrial, 2%
Agriculture, 89%
Domestic, 3%
Industrial, 5%
Agriculture, 92%
SURFACE WATER CONSUMPTION GROUND WATER CONSUMPTION
AVALON GLOBAL RESEARCH
15
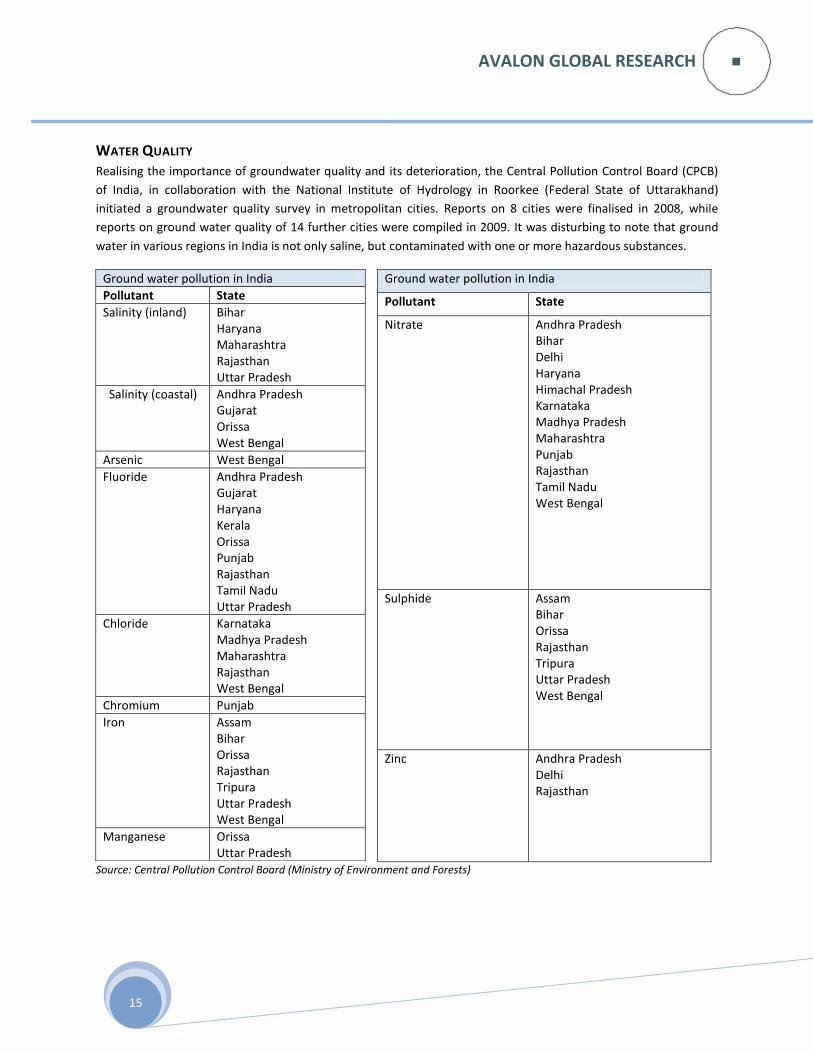
WATER QUALITY Realising the importance of groundwater quality and its deterioration, the Central Pollution Control Board (CPCB)
of India, in collaboration with the National Institute of Hydrology in Roorkee (Federal State of Uttarakhand)
initiated a groundwater quality survey in metropolitan cities. Reports on 8 cities were finalised in 2008, while
reports on ground water quality of 14 further cities were compiled in 2009. It was disturbing to note that ground
water in various regions in India is not only saline, but contaminated with one or more hazardous substances.
Ground water pollution in India
Pollutant State
Nitrate Andhra Pradesh Bihar Delhi Haryana Himachal Pradesh Karnataka Madhya Pradesh Maharashtra Punjab Rajasthan Tamil Nadu West Bengal
Sulphide Assam Bihar Orissa Rajasthan Tripura Uttar Pradesh West Bengal
Zinc Andhra Pradesh Delhi Rajasthan
Source: Central Pollution Control Board (Ministry of Environment and Forests)
Ground water pollution in India
Pollutant State
Salinity (inland) Bihar Haryana Maharashtra Rajasthan Uttar Pradesh
Salinity (coastal) Andhra Pradesh Gujarat Orissa West Bengal
Arsenic West Bengal
Fluoride Andhra Pradesh Gujarat Haryana Kerala Orissa Punjab Rajasthan Tamil Nadu Uttar Pradesh
Chloride Karnataka Madhya Pradesh Maharashtra Rajasthan West Bengal
Chromium Punjab
Iron Assam Bihar Orissa Rajasthan Tripura Uttar Pradesh West Bengal
Manganese Orissa Uttar Pradesh

AVALON GLOBAL RESEARCH
16
GOVERNMENT INITIATIVES AND POLICIES
11TH FIVE YEAR PLAN FOCUS
The 11th
Five Year Plan (2007-12) lays down provisions for efficient management of water resources in the country,
which are as follows:
The Jal Abhiyan Programme was launched in December 2005 for mass awareness among the stakeholders about scarcity of water, method for recharging of ground water, management of surface and ground water for efficient utilization, which covered about 20,000 villages, developed 1 lakh water harvesting structures and revamped canal system
Focus on water harvesting structures and improving water use efficiency through better maintenance of irrigation system and promoting efficiency through drip/ sprinklers
State Water Policy is under consideration with main objective of utilizing all available water resources, (surface and groundwater), in a judicious, equitable and economic manner
Water Users Associations are being formed for maintenance, distribution and revenue collection
Rural infrastructure: The Bharat Nirman Programme launched in 2005 identifies seven major areas where infrastructure gaps need to be addressed. The programme extended into initial two years of the 11th Plan. Bharat Nirman was a time-bound business plan for action in rural infrastructure over the four year period (2005-2009). Under Bharat Nirman, action was proposed in the areas of irrigation (to create 10 million hectares of additional irrigation capacity), rural roads, rural housing, rural water supply, rural electrification and rural telecommunication connectivity
Hence, the main objectives of the XI plan are
Creation of additional potential around 16mha
Reducing the gap between potential created and its utilization
Mitigation of flood damages
Promotion of mass awareness on water related issues
The plan emphasizes the creation of irrigation potentials and thereby highlights the need to close the gap between
irrigation potential created and irrigation potential utilized so as to ensure effective ‘development’ and
‘management’.
Some of the other important suggestions of the Working Group (GOI, 2006) are:
Creation of more storage is absolutely essential for future requirements. The State Governments could be provided with incentives for creation of additional storage, if necessary. Extension, restoration and modernisation projects should be given due priority where the eroded potential can be restored with moderate expenditure
A separate plan fund may be provided as irrigation maintenance fund7
There is need to reorient the approach from groundwater development to management and a comprehensive act for regulation of groundwater development on sustainable basis. Artificial recharge to ground water and rain water harvesting should be implemented in identified areas through participatory approach.
AVALON GLOBAL RESEARCH
17
State Governments may institute Water Regulatory Authorities for fixing water rates.
While undertaking construction of dams, adequate flood cushion may be provided in reservoirs. If required, the Central Government may provide necessary support for the same.
Projects on interlinking of rivers should be expedited.
Training and capacity building scheme for State/Central Government officials may be made comprehensively.
KEY ISSUES Organisational challenges
The gravest challenges are those of managing the existing infrastructure and of the water resource itself. More
than a few high-level commissions have been appointed over the last few years in order to address water
management issues as well as new national/state policies have been circulated.
Although minimal effective implementation has taken place, the increasing divide between the problem and
practice has resulted in extensive credibility loss for the states abilities in water development and management
which is why well functioning water systems often the service providers from the overall water resources
management authority.
As per a report by Asian Development Bank on water resources development in India Some important changes at
the state levels include the creation of autonomous corporations by Karnataka and Maharashtra for mobilizing
public funds as well as the initiatives of Andhra Pradesh Gujarat, Madhya Pradesh, and Maharashtra for soliciting
corporate investments in the water sector. In 1994, Karnataka formed the Krishna Bhagya Jal Nigam Limited
(KBJNL) under the Companies Act with the specific purpose of mobilizing public funds for developing the Upper
Krishna Project. Almost similar is the case with the Maharashtra Krishna Valley Development Corporation (MKVDC)
floated by Maharashtra in 1996. But all these ‘autonomous’ organizations owing to their poor financial status
depend on state budgetary support even for interest payments.
A few years ago, the government of Maharashtra invited tenders for the Neera-Devagadh irrigation project in the
year 2007, on Build-Own-Operate-Transfer basis, at a cost of Rs.1000 crores. Several private firms expressed their
interest to participate in this venture. These private companies are forming alliances with drip and sprinkler system
providers on one side, and forward and backward linkages providers on the other side. They hope to reap rich
dividends in the long term, by enhancing water use efficiency and higher crop productivity (including commercial
crops), and thereby, boosting farmers willingness to pay for water to a higher side. A series of discussions, across
various irrigation projects of Andhra Pradesh during 2005-06, had also indicated similar willingness from farmers,
irrigation engineers and private firms.
AVALON GLOBAL RESEARCH
18
Service Provision
In India, the service providers of formal irrigation and water supply are monopolized by government agencies,
which do not provide or provide substandard services to the poor/those who do not have access. Absence of clear,
enforceable water rights at all levels is also at the root of service shortcomings such as, water use inefficiency,
corruption, financial problems and conflicts which plague the water sector in India currently.
Notably, Public Private Partnerships (PPP) have set an example n raising project financing and bringing in technical
expertise for infrastructure projects including water and sanitation. They can accelerate solutions and enhance
operations and service. On February 7th in Chennai the Tamil Nadu Chief Minister inaugurated a public-private
partnership that is now providing water and sewerage services to thousands of Tirupur area residents. With an aim
to focus on the poor from the beginning, the Public-Private Partnership in Tirupur covered the water and
sanitation needs of the entire city population, including close to 80,000 slum residents. The Tirupur project is a
great example of how the private sector’s participation in public service delivery can radically improve access to
water and sanitation. It also demonstrates that PPP can provide the necessary match to government investments
and that the private sector can provide important services to the poor - and at lower costs lower than those paid
by so-called beneficiaries of government subsidies.
Recruiting the private sector in the water industry not only brings in capital and finance, but also reduces waste
and lowers costs when supported by effective governance and transparency.
AVALON GLOBAL RESEARCH
19
DEVELOPMENTS IN PUBLIC PRIVATE PARTNERSHIPS
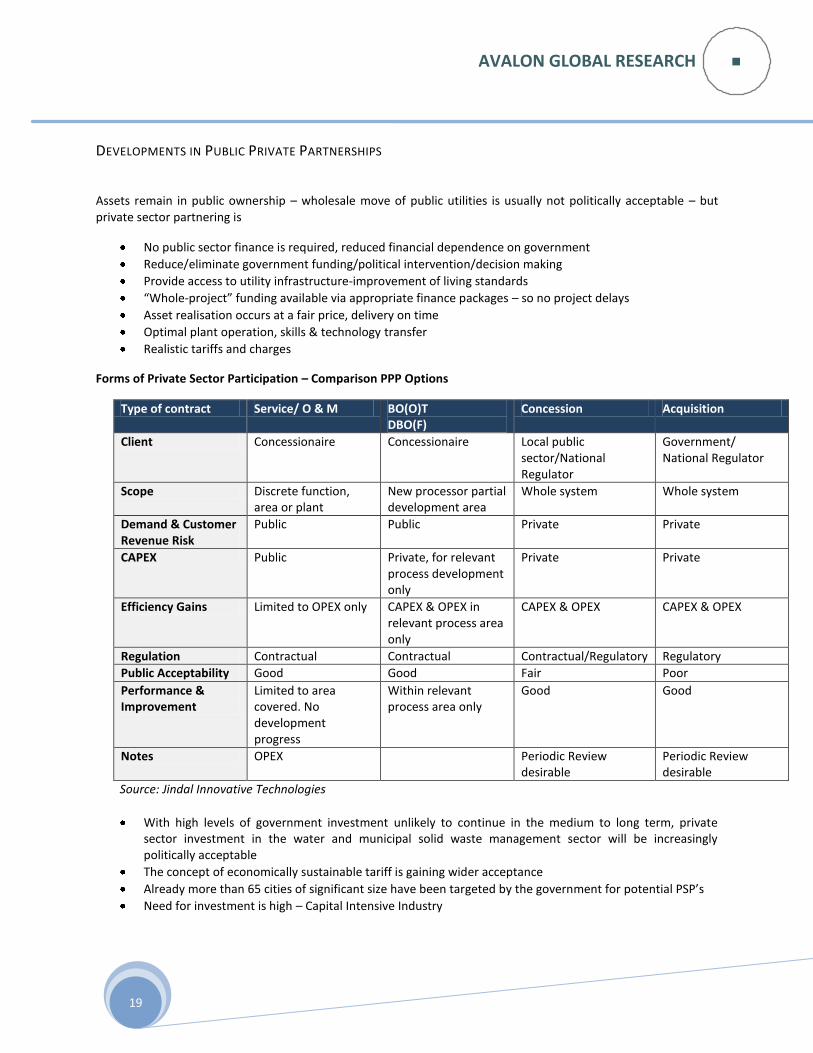
Assets remain in public ownership – wholesale move of public utilities is usually not politically acceptable – but private sector partnering is
No public sector finance is required, reduced financial dependence on government
Reduce/eliminate government funding/political intervention/decision making
Provide access to utility infrastructure-improvement of living standards
“Whole-project” funding available via appropriate finance packages – so no project delays
Asset realisation occurs at a fair price, delivery on time
Optimal plant operation, skills & technology transfer
Realistic tariffs and charges
Forms of Private Sector Participation – Comparison PPP Options
Type of contract Service/ O & M BO(O)T DBO(F)
Concession Acquisition
Client Concessionaire Concessionaire Local public sector/National Regulator
Government/ National Regulator
Scope Discrete function, area or plant
New processor partial development area
Whole system Whole system
Demand & Customer Revenue Risk
Public Public Private Private
CAPEX Public Private, for relevant process development only
Private Private
Efficiency Gains Limited to OPEX only CAPEX & OPEX in relevant process area only
CAPEX & OPEX CAPEX & OPEX
Regulation Contractual Contractual Contractual/Regulatory Regulatory
Public Acceptability Good Good Fair Poor
Performance & Improvement
Limited to area covered. No development progress
Within relevant process area only
Good Good
Notes OPEX Periodic Review desirable
Periodic Review desirable
Source: Jindal Innovative Technologies
With high levels of government investment unlikely to continue in the medium to long term, private sector investment in the water and municipal solid waste management sector will be increasingly politically acceptable
The concept of economically sustainable tariff is gaining wider acceptance
Already more than 65 cities of significant size have been targeted by the government for potential PSP’s
Need for investment is high – Capital Intensive Industry
AVALON GLOBAL RESEARCH
20
MARKET OPPORTUNITY
MARKET SIZE AND OVERALL DEMAND
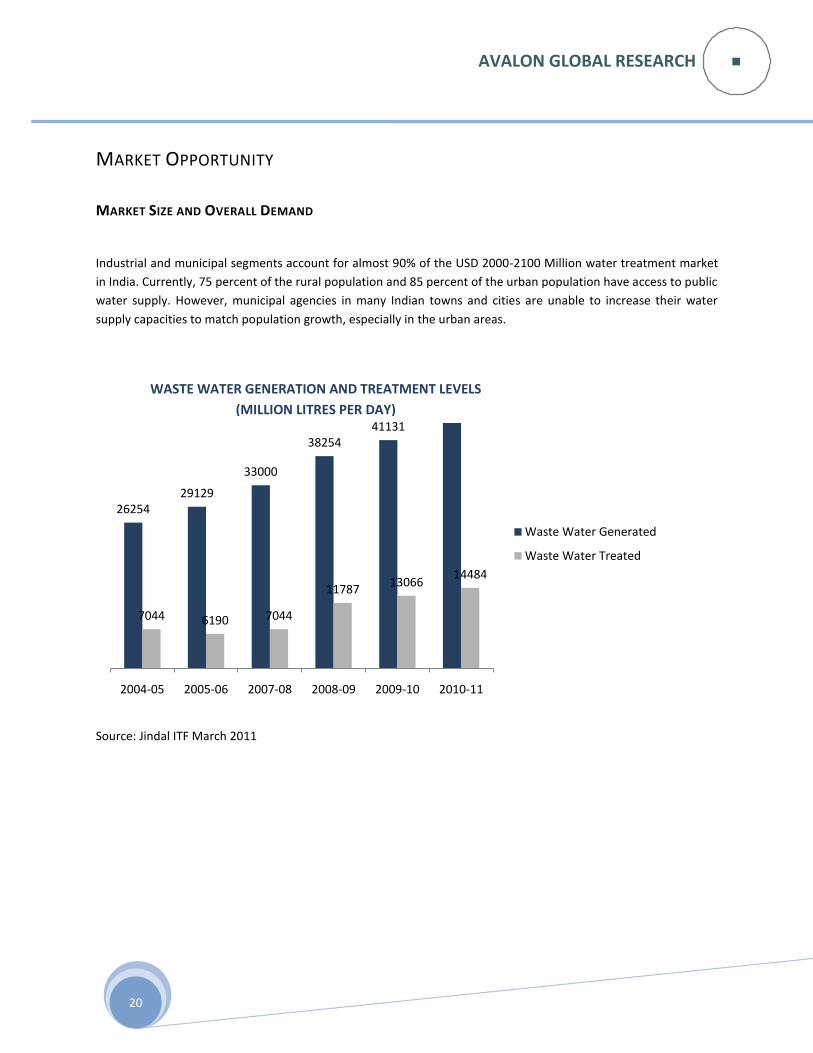
Industrial and municipal segments account for almost 90% of the USD 2000-2100 Million water treatment market
in India. Currently, 75 percent of the rural population and 85 percent of the urban population have access to public
water supply. However, municipal agencies in many Indian towns and cities are unable to increase their water
supply capacities to match population growth, especially in the urban areas.
Source: Jindal ITF March 2011
2625429129
33000
3825441131
44224
7044 6190 7044
1178713066
14484
2004-05 2005-06 2007-08 2008-09 2009-10 2010-11
Waste Water Generated
Waste Water Treated
WASTE WATER GENERATION AND TREATMENT LEVELS
(MILLION LITRES PER DAY)
AVALON GLOBAL RESEARCH
21
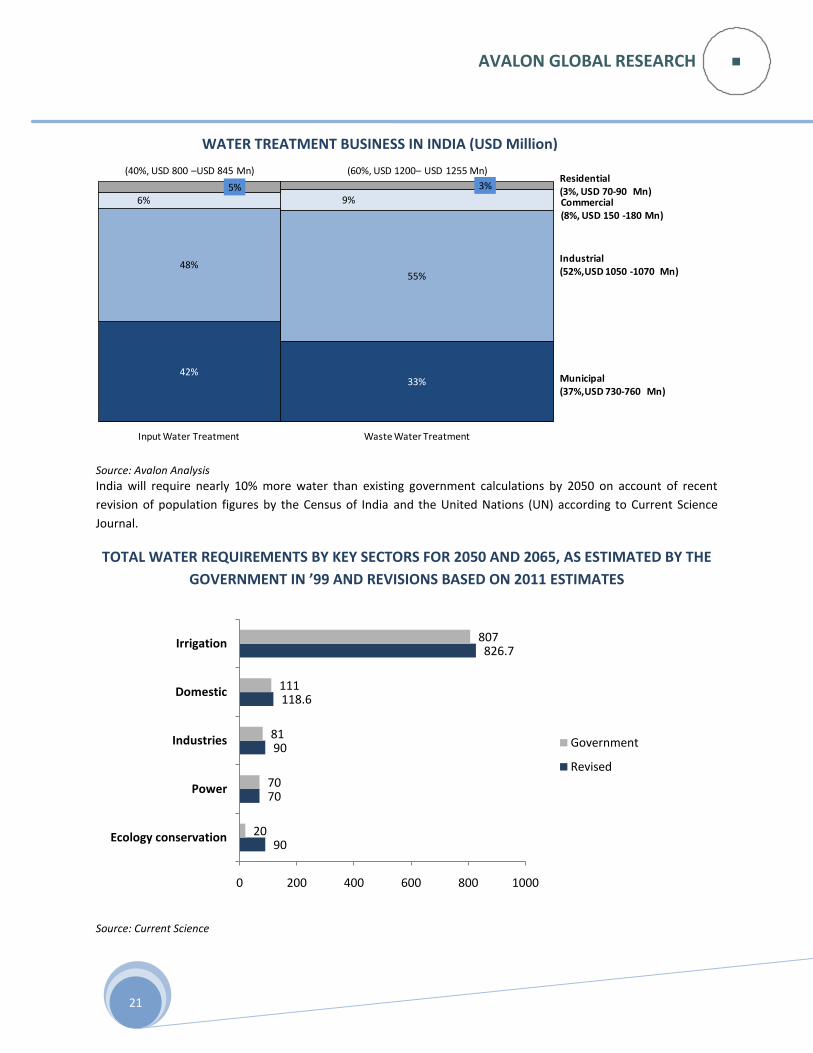
Source: Avalon Analysis
India will require nearly 10% more water than existing government calculations by 2050 on account of recent
revision of population figures by the Census of India and the United Nations (UN) according to Current Science
Journal.
TOTAL WATER REQUIREMENTS BY KEY SECTORS FOR 2050 AND 2065, AS ESTIMATED BY THE
GOVERNMENT IN ’99 AND REVISIONS BASED ON 2011 ESTIMATES
Source: Current Science
(40%, USD 800 –USD 845 Mn) (60%, USD 1200– USD 1255 Mn)
Municipal(37%,USD 730-760 Mn)
33%
55%
9%
3%
Input Water Treatment
48%
Residential (3%, USD 70-90 Mn)Commercial (8%, USD 150 -180 Mn)
Industrial (52%,USD 1050 -1070 Mn)
6%5%
42%
Waste Water Treatment
90
70
90
118.6
826.7
20
70
81
111
807
0 200 400 600 800 1000
Ecology conservation
Power
Industries
Domestic
Irrigation
Government
Revised
WATER TREATMENT BUSINESS IN INDIA (USD Million)
AVALON GLOBAL RESEARCH
22
The factors that will increase water requirement include ecological conservation needs and demands by irrigaton
and industry. Ecological conservation, that refers to minimum water levels that must be maintained in rivers and
lakes to preserve ecosystems will need about 90 bcm in 2050, compared with the water commission’s 20 bcm
estimate.
A 10% increase is significant, however governement and people have long known that increased water
conservation, rainwater harvesting etc are needed to ensure water security according to the Indian Agricultural
Research Institute.
India’s water woes appear to be mounting. A 2007 report by the government had pointed out that water resource
management is going to be the most serious problem of the 21st
century.
Climate change, the report said accounts for 20% increase in water scarcity with the remaining 80% due to
population increase and economic development resulting in water pollution and contamination of rivers and lakes.
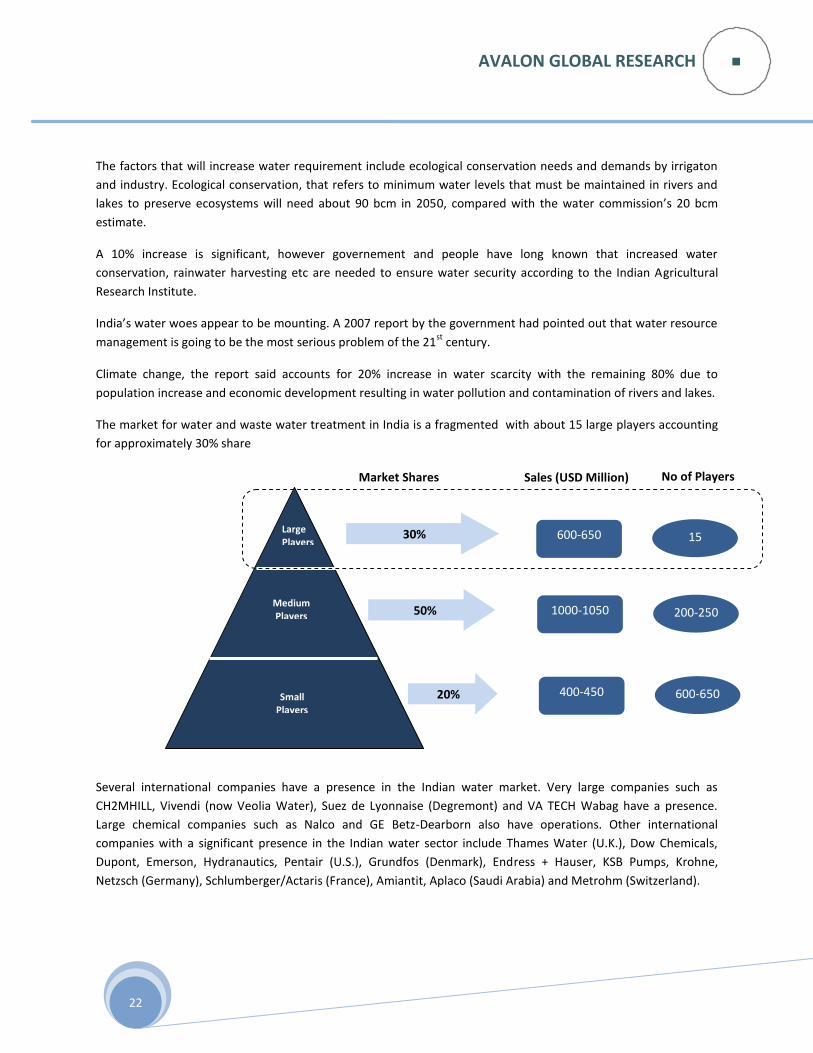
The market for water and waste water treatment in India is a fragmented with about 15 large players accounting
for approximately 30% share
Several international companies have a presence in the Indian water market. Very large companies such as
CH2MHILL, Vivendi (now Veolia Water), Suez de Lyonnaise (Degremont) and VA TECH Wabag have a presence.
Large chemical companies such as Nalco and GE Betz-Dearborn also have operations. Other international
companies with a significant presence in the Indian water sector include Thames Water (U.K.), Dow Chemicals,
Dupont, Emerson, Hydranautics, Pentair (U.S.), Grundfos (Denmark), Endress + Hauser, KSB Pumps, Krohne,
Netzsch (Germany), Schlumberger/Actaris (France), Amiantit, Aplaco (Saudi Arabia) and Metrohm (Switzerland).
Large Players
Medium Players
Small Players
30% 600-650
1000-1050
400-450
50%
20%
15
200-250
600-650
Market Shares Sales (USD Million) No of Players
AVALON GLOBAL RESEARCH
23
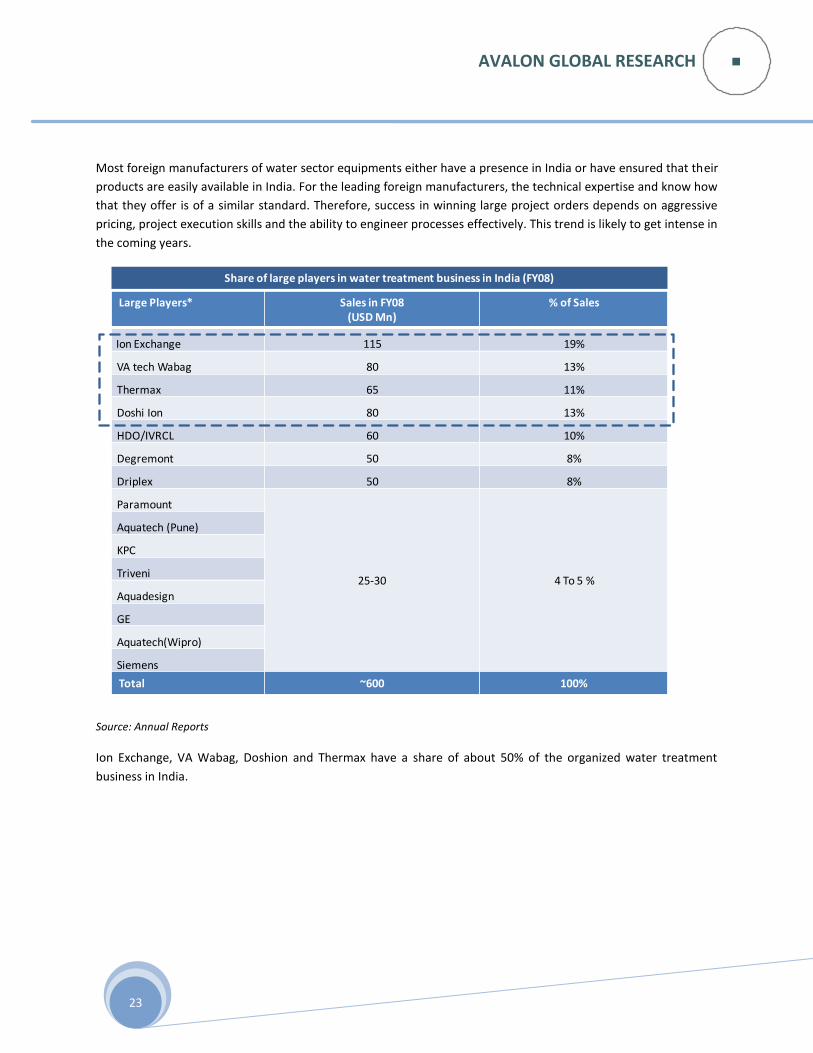
Most foreign manufacturers of water sector equipments either have a presence in India or have ensured that their
products are easily available in India. For the leading foreign manufacturers, the technical expertise and know how
that they offer is of a similar standard. Therefore, success in winning large project orders depends on aggressive
pricing, project execution skills and the ability to engineer processes effectively. This trend is likely to get intense in
the coming years.
Source: Annual Reports
Ion Exchange, VA Wabag, Doshion and Thermax have a share of about 50% of the organized water treatment
business in India.
Large Players* Sales in FY08(USD Mn)
% of Sales
Ion Exchange 115 19%
VA tech Wabag 80 13%
Thermax 65 11%
Doshi Ion 80 13%
HDO/IVRCL 60 10%
Degremont 50 8%
Driplex 50 8%
Paramount
25-30 4 To 5 %
Aquatech (Pune)
KPC
Triveni
Aquadesign
GE
Aquatech(Wipro)
Siemens
Total ~600 100%
Share of large players in water treatment business in India (FY08)

AVALON GLOBAL RESEARCH
24
The large players typically serve the demand for water treatment from large projects, but all players offer the
entire product/service offering
SIZE OF PROJECTS IN WATER TREATMENT SPACE IN INDIA
Large projects: Large projects include projects which require capital investments of greater than USD 1.0 Million
Medium projects: Medium size projects include projects which require capital investments of USD 0.22 -1.0 Million
Small Projects: Small projects include projects which require capital investments of less than USD 0.22 Million
Most of the Tier 1 players in India have global alliances
Sr.No Tier 1 company Global Alliances
1 V A Tech WABAG
Wabag Germany
2 Degremont India
Joint Venture with Degremont , France
3 Doshi Ion
Joint Venture with Veolia Solutions, France Tie up with Kinetico Inc USA for filtration, softening and Denin systems
4 Ion Exchange India
Joint Venture with Waterleau, Belgium
5 Driplex Partnership with Best Water group Austria and Lanxess, Germany
6 Paramount
Pilkenwood water ,UK for oil water separation; Koch Glitch,UK for Bio-tower Plastic media
7 Thermax Wehrie Unwelt Gmbh-Technology for treatment of hard to treat effluents GE Water- Ultrafiltration and MBR technologies for India - Reverse Osmonis membranes
Source: Company reports, Industry News
Category of player
Size of projects Service /Product offering
Focus SectorsSmall Medium
LargeDesigning
&
ConsultingMechanical Civil
Large Players Power, Municipal, Oil & Gas
Medium Players All segments
Small Players Residential, Commercial, Engineering, Chemicals, Food
AVALON GLOBAL RESEARCH
25
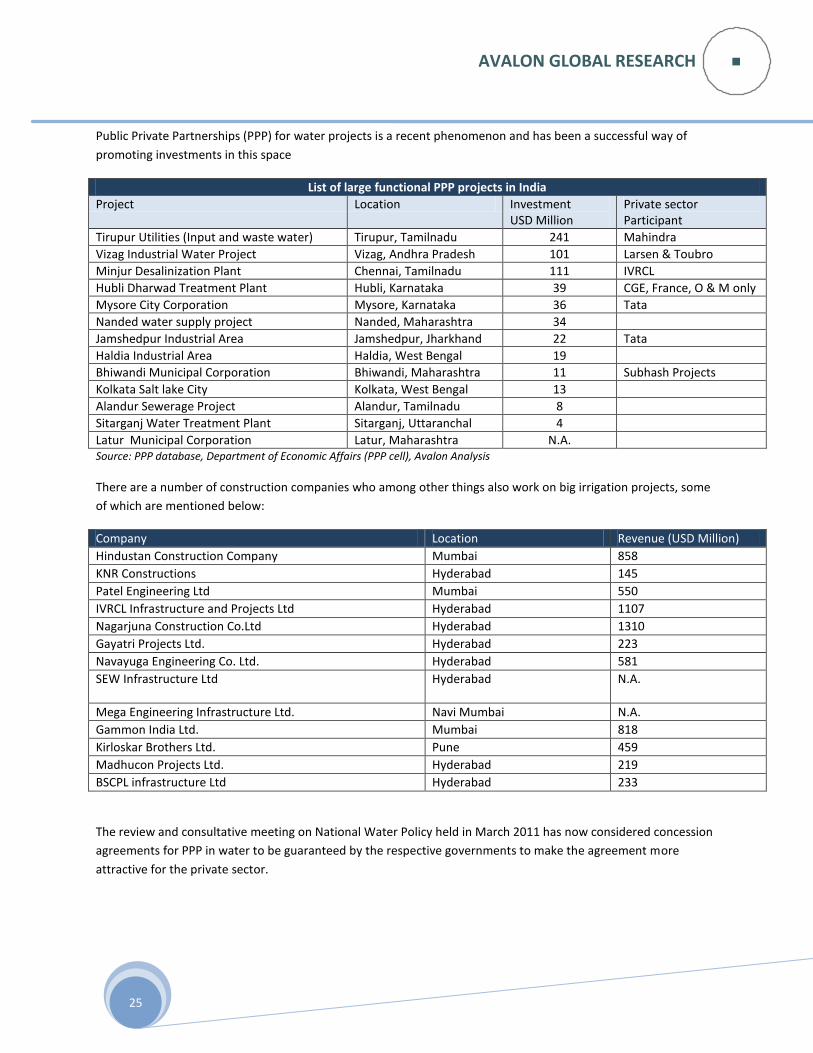
Public Private Partnerships (PPP) for water projects is a recent phenomenon and has been a successful way of
promoting investments in this space
List of large functional PPP projects in India
Project Location Investment USD Million
Private sector Participant
Tirupur Utilities (Input and waste water) Tirupur, Tamilnadu 241 Mahindra
Vizag Industrial Water Project Vizag, Andhra Pradesh 101 Larsen & Toubro
Minjur Desalinization Plant Chennai, Tamilnadu 111 IVRCL
Hubli Dharwad Treatment Plant Hubli, Karnataka 39 CGE, France, O & M only
Mysore City Corporation Mysore, Karnataka 36 Tata
Nanded water supply project Nanded, Maharashtra 34
Jamshedpur Industrial Area Jamshedpur, Jharkhand 22 Tata
Haldia Industrial Area Haldia, West Bengal 19
Bhiwandi Municipal Corporation Bhiwandi, Maharashtra 11 Subhash Projects
Kolkata Salt lake City Kolkata, West Bengal 13
Alandur Sewerage Project Alandur, Tamilnadu 8
Sitarganj Water Treatment Plant Sitarganj, Uttaranchal 4
Latur Municipal Corporation Latur, Maharashtra N.A. Source: PPP database, Department of Economic Affairs (PPP cell), Avalon Analysis
There are a number of construction companies who among other things also work on big irrigation projects, some
of which are mentioned below:
Company Location Revenue (USD Million)
Hindustan Construction Company Mumbai 858
KNR Constructions Hyderabad 145
Patel Engineering Ltd Mumbai 550
IVRCL Infrastructure and Projects Ltd Hyderabad 1107
Nagarjuna Construction Co.Ltd Hyderabad 1310
Gayatri Projects Ltd. Hyderabad 223
Navayuga Engineering Co. Ltd. Hyderabad 581
SEW Infrastructure Ltd
Hyderabad N.A.
Mega Engineering Infrastructure Ltd. Navi Mumbai N.A.
Gammon India Ltd. Mumbai 818
Kirloskar Brothers Ltd. Pune 459
Madhucon Projects Ltd. Hyderabad 219
BSCPL infrastructure Ltd Hyderabad 233
The review and consultative meeting on National Water Policy held in March 2011 has now considered concession
agreements for PPP in water to be guaranteed by the respective governments to make the agreement more
attractive for the private sector.
AVALON GLOBAL RESEARCH
26
BUSINESS OPPORTUNITY
Water and waste water treatment will remain high potential business opportunity in India for many years due to
the following trends.
The rise in population levels and rapid increase in urbanization have put pressure on urban cities to cater to the
increasing water needs of the people. Secondly, agriculture sector is also feeling the pinch of rising population and
shrinking acreage as they have to find adequate water sources for irrigation purpose to improve crop yield. Finally
the emergence of a new industry and manufacturing set up has not only put pressure on water requirements but
also on water treatment. As all state governments struggle with ecology and development challenges, the private
sector can step in to provide the perfect solution to all the stakeholders.
Municipal water and wastewater treatment and industrial in-process and wastewater treatment operators
constitute the two major buyer groups for the wastewater treatment segment.
At the state level, development corporations are the key promoters of common effluent treatment plants and are
responsible for developing infrastructure for industrial estates. Limited resources and the small sized operations in
India have resulted in a consistent demand for packaged treatment units for isolated businesses and common
effluent treatment plants for clusters continue to be promising business opportunities.
The possible opportunities also include:
Water treatment
The main end users in the water market are the municipal authorities and the Public Health Departments. The
major industries connected with the water sector include cement, chemicals, fertilizers, food & beverage, paper,
pharmaceuticals, power, refineries, sugar, tanneries and textiles. End user commercial establishments include
hospitals, hotels and housing developments
Desalination Plants
Joint ventures with Indian firms to offer integrated technology and solutions in desalination plants
Wastewater treatment
The current gap between treated and untreated urban wastewater is huge and is growing every year.
There is a lot of scope for the Israeli Water Industry to offer technology or equipment for this sector, and
to enter the Indian market in collaboration with Indian firms.
AVALON GLOBAL RESEARCH
27
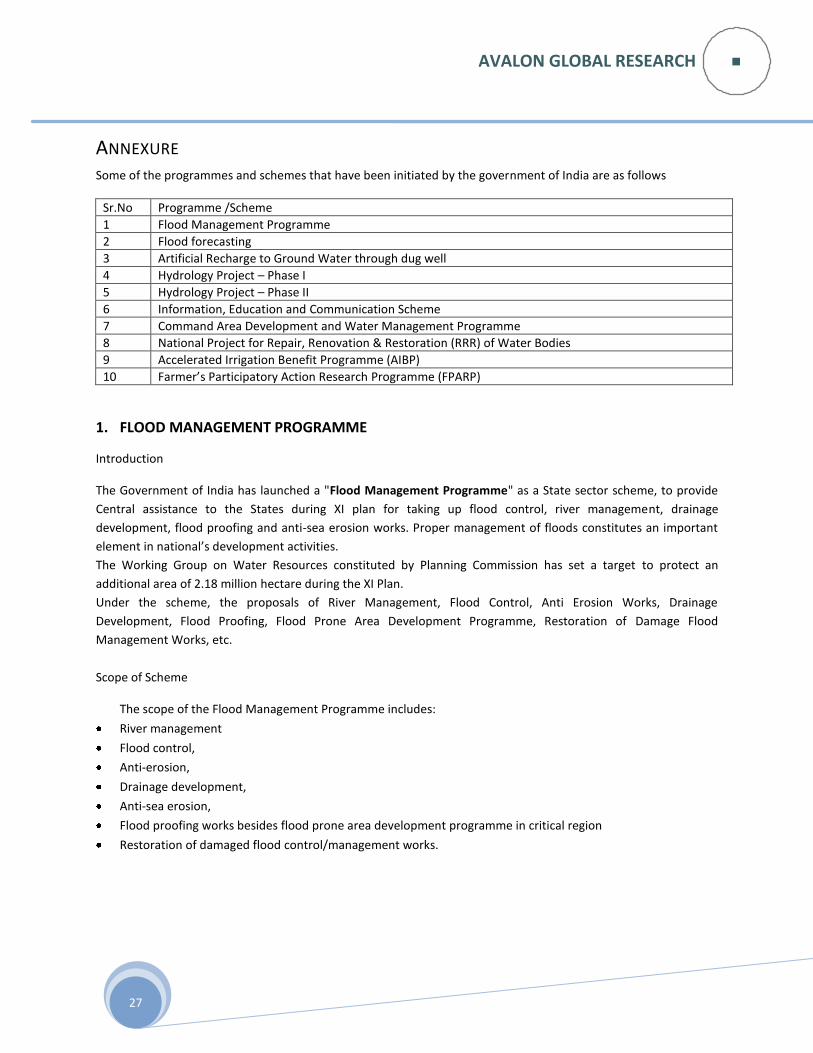
ANNEXURE Some of the programmes and schemes that have been initiated by the government of India are as follows
Sr.No Programme /Scheme
1 Flood Management Programme
2 Flood forecasting
3 Artificial Recharge to Ground Water through dug well
4 Hydrology Project – Phase I
5 Hydrology Project – Phase II
6 Information, Education and Communication Scheme
7 Command Area Development and Water Management Programme
8 National Project for Repair, Renovation & Restoration (RRR) of Water Bodies
9 Accelerated Irrigation Benefit Programme (AIBP)
10 Farmer’s Participatory Action Research Programme (FPARP)
1. FLOOD MANAGEMENT PROGRAMME
Introduction
The Government of India has launched a "Flood Management Programme" as a State sector scheme, to provide
Central assistance to the States during XI plan for taking up flood control, river management, drainage
development, flood proofing and anti-sea erosion works. Proper management of floods constitutes an important
element in national’s development activities.
The Working Group on Water Resources constituted by Planning Commission has set a target to protect an
additional area of 2.18 million hectare during the XI Plan.
Under the scheme, the proposals of River Management, Flood Control, Anti Erosion Works, Drainage
Development, Flood Proofing, Flood Prone Area Development Programme, Restoration of Damage Flood
Management Works, etc.
Scope of Scheme
The scope of the Flood Management Programme includes:
River management
Flood control,
Anti-erosion,
Drainage development,
Anti-sea erosion,
Flood proofing works besides flood prone area development programme in critical region
Restoration of damaged flood control/management works.

AVALON GLOBAL RESEARCH
28
Central assistance is being provided to all the flood affected states in the country to undertake critical flood control
and river management works, on the following funding pattern:
For special category States: 90% central share: 10% state share, (The Special Category States covers the
North Eastern States, Sikkim, Himachal Pradesh, Jammu & Kashmir and Uttarakhand.)
For non-special category States: - 75% central share: 25% state share
For restoration of damaged works: 90% central share: 10% state share to all the States
Achievements
Flood Management Programme progressed well as a total of 117 schemes have been completed by the State
Governments as on 31.03.2010.
In addition, 25 more schemes are reported to be completed up to 31st July’2010.
By completing these 142 works, an additional flood prone area of 0.10 million has been protected against the
floods as new area, besides an area of 1.23 million has been restored. It has provided safety to an estimated 12.98
million people during high flood situation.
2. FLOOD FORECASTING
Introduction Central Water Commission started flood-forecasting services in 1958 with setting up its first forecasting station on Yamuna at Delhi Railway Bridge.
Flood forecasting is one of the important, reliable and cost-effective measures for flood management. Realising its importance, Central Water Commission, Ministry of Water Resources has set up a network of forecasting stations covering all important flood prone interstate rivers. The forecasts issued by these stations are used to alert the Public and to enable the administrative and engineering agencies of the States/UT's to take appropriate measures. Scope of Scheme Scope of Flood Forecasting Programme includes:
To collect Hydrological/ Hydro-meteorological data from 878 sites
Transmission of the data using wireless/ fax/ email/ telephones /satellites /mobiles
Processing of data
Formulation of forecast and dissemination of the same.
Achievements
Presently, a network of 175 Flood Forecasting Stations including 28 inflow forecast, in 9 major river basins
and 71 sub basins of the country exists. It covers 15 States besides NCT Delhi and UT of Dadra & Nagar Haveli. Central Water Commission on an average issues 6000 flood forecasts with an accuracy of more than 95% every year.
To make the flood forecasts more accurate, effective and timely, CWC is continuously updating and
modernizing its flood forecasting system.
AVALON GLOBAL RESEARCH
29
3. ARTIFICIAL RECHARGE TO GROUND WATER THROUGH DUG WELL
Introduction
The scheme on 'Artificial Recharge of Groundwater through Dug wells' was launched in the year 2008 to control
the problem of over-exploitation of Ground Water Resources in the State as well as to ensure sustainable Water
Resource Management and assured irrigation facilities in the affected areas. The Dug well Recharge scheme is a
State sector Scheme. The scheme had a total outlay of Rs. 1798.71 crore, including subsidy component of Rs.
1499.27 crore. The Scheme will be implemented by the respective State Government in association with
Panchayati Raj Institutions (PRIs), CGWB, NABARD, NGOs etc.
The scheme aims to facilitate improvement in the ground water situation in the affected areas, increase the
sustainability of wells during lean period, to improve quality of ground water and community involvement in water
resource management in the affected areas.
Scope/objectives
The objectives of the scheme include, recharge of existing dug wells, improvement of ground water situation,
increase in sustainability of ground water during lean period and improvement in the overall agricultural
productivity. Total number of irrigation dug wells proposed for recharge is 4.45 million, Out of which 2.72 million is
owned by small and marginal farmers and 1.73 million is owned by other farmers. Average cost of recharge
structure per well is Rs. 4000.
The beneficiaries would be farmers having own well in their agricultural land.
Provision has been made for 100% subsidy to small and marginal farmers and 50% subsidy to other
farmers
The funding of the scheme will be done by Ministry of Finance through NABARD.
Anticipated benefits of the scheme will include:
Ground water recharge through existing dug wells in favorable catchments like agricultural fields will
facilitate improvement in ground water situation in the affected areas.
The recharge programme will increase the sustainability of wells during lean periods and will improve the
overall irrigated agricultural productivity, drinking water availability, socio-economic conditions and
quality of life of the people in the affected areas.
The recharge Programme will also help improve the quality of ground water especially in the fluoride-
affected areas.
The scheme would facilitate strengthening of the institutional framework, creation of awareness and
capacity building of beneficiaries and personnel involved in project implementation and overall
community involvement in water resources management in the affected areas.
Experience sharing for replication of similar recharge programmes in other ground water stressed areas in
the country.
AVALON GLOBAL RESEARCH
30
4. HYDROLOGY PROJECT – PHASE I
Introduction
Hydrology Project Phase-I was implemented with the assistance of World Bank and was sanctioned in 1997 under
the Ministry of Water Resources. The project implemented with the coordination of participating 9 Southern
States.
Scope/Objectives
The main objective of the scheme was to develop an Integrated Hydrological Information System
providing reliable, accurate, comprehensive and timely hydrological, meteorological and water quality
data.
To obtain hydrological information to plan and manage water resources and other legitimate uses and
also to promote its utilisation.
To deliver a functional demand driven Hydrological Information System (HIS) with improved institutional
capacity to build, operate and utilise HIS to the benefit of different user groups and to encourage
cooperation among the different participating agencies through data exchange
Achievements
Improved institutional and organisational arrangements, technical capabilities, and physical facilities
available for collection, processing and dissemination of hydrological and hydro meteorological
information
The improved hydrological and hydro-meteorological information would help in making reliable and
economic:-
o Investment decisions in which water resources availability is a foremost determinate (i.e. irrigated agriculture, water supply and sanitation, industrial water use, etc
o Operational decisions in existing enterprises in which water is an essential input to achieve predicted impact.
o Data storage software, namely, Water Information System for Online Data Management (WISDOM) has also been developed by Central Water Commission (CWC) through M/S Rolta India Limited for storing the data and preparation of the catalogue of the available data.
AVALON GLOBAL RESEARCH
31
5. HYDROLOGY PROJECT – PHASE II
Introduction
The government has launched the second phase of the hydrology project with USD104.98 million loan assistance
from the World Bank. The total cost of this project is estimated at Rs 631.83 crore. The project is being
implemented in 13 States and eight central agencies viz. Central Water Commission (CWC), Central Ground Water
Board (CGWB), India Meteorological Department (IMD), National Institute of Hydrology (NIH), Central Water and
Power Research Station (CWPRS), Ministry of Water Resources (MoWR), Central Pollution Control Board (CPCB)
and Bhakhra Beas Management Board (BBMB).
Scope/Objectives
To extend and promote the sustained and effective use of HIS by all implementing agencies concerned
with water resources planning and management both in public and private thereby contributing to
improve productivity and cost effectiveness of water related investments in 13 participating States and 8
Central agencies
To extend HIS to the four new state agencies of Goa, Himachal Pradesh (H.P.), Pondicherry and Punjab
and two central agencies Bhakra Beas Management Board (BBMB) and Central Pollution Control Board
(CPCB)
Strengthening the capabilities of implementing agencies at state/central level in using HIS for efficient
water resource planning and management
Awareness building and outreach services about HIS use
Achievements
Improved data accessibility for exchange among the Implementing Agencies.
Improved tools for water resources planning and management.
Improved data systems & tools for management of tools and droughts.

AVALON GLOBAL RESEARCH
32
6. INFORMATION, EDUCATION AND COMMUNICATION SCHEME
Introduction
Information, Education and Communication Scheme (IEC) is a Scheme of Ministry of Water Resources (MOWR).
Information, Education and Communication Scheme has been launched during XI plan with the aims to create
awareness among various target groups about the importance of development and management of water
resources in a holistic manner with due emphasis on a coordinated effort for addressing various water related
issues. The overall scenario of water resources, dependency on water for various requirements of the society, the
urgent need for conservation of water and preservation of its quality, the advantages of adoption of integrated
approach and participatory management etc. issues are covered under the IEC Scheme.
Scope/ Objectives
To create awareness for optimal sustainable development, maintenance of quality and efficient use of
country’s water resource to match the growing demands on this precious natural resources with active
involvement of all stakeholders in order to achieve accelerated, equitable, economic development of the
country.
To create awareness for the urgent need for mutual cooperation and adopting integrated planning and
participatory approach in management.
To create awareness among the people about necessity of water conservation,
To promote advocacy on the tenets of National Water Policy with focus on setting learning, documenting
and dissemination of knowledge of water science and technology and issues concerning sustained
development of water resources,
To create awareness about necessity of adopting measures for rainwater harvesting and artificial recharge
of ground water to meet present and future needs of water,
To strengthen awareness infrastructure specially, campaign mechanism and support structure.
Major activities carried out under Information, Education and Communication (IEC)
Publicity through Electronic Media
Painting Competition on Water Conservation issues
Publicity through newspapers/magazines and participation in Exhibitions/Fairs
Celebration of Special Days
Organisation of Workshops/Seminars
Production of Documentary Film
Publicity through Mass Media Transport Vehicle
Publicity through Post Offices located in various parts of the country
Grant in Aid to Chambers of Commerce
AVALON GLOBAL RESEARCH
33
7. COMMAND AREA DEVELOPMENT AND WATER MANAGEMENT PROGRAMME
Introduction
The Centrally sponsored Command Area Development (CAD) Programme was launched in 1974-75. The
programme was restructured and renamed as Command Area Development & Water Management (CADWM)
Programme w.e.f. 1-4-2004. The scheme is now being implemented as a State sector scheme during the XI Five
Year Plan (2008-09 to 2011-12).
Scope/Objectives
To bridge the gap between the irrigation potential created and utilised
Construction of field channels and field drains
One time functional grant to Water Users' Associations
Land leveling and shaping
Realignment of field boundaries/consolidation of holdings
Introduction of suitable cropping patterns
Strengthening of extension services
Farmers’ participation and reclamation of waterlogged areas
Software activities namely trainings, adaptive trials, demonstrations and monitoring & evaluation
To ensure Participatory Irrigation Management
Achievements
Achieved tremendous increase in the irrigated area
Productivity and production, irrigation efficiency
Programme taken up in 310 projects 162 closed, 23 clubbed into 8 and now 133 continuing
CCA of 28.5 Mha Included – 17.05 completed
Central Assistance of Rs. 2879 crores was released till June 2005
National Project for Repair, Renovation & Restoration (RRR) of Water Bodies
AVALON GLOBAL RESEARCH
34
8. NATIONAL PROJECT FOR REPAIR, RENOVATION & RESTORATION (RRR) OF WATER BODIES
Introduction
The Government of India sanctioned a Pilot Scheme for “National Project for Repair, Renovation & Restoration
(RRR) of Water Bodies directly linked to Agriculture” in January, 2005 with an estimated cost of Rs.300 crore.
Government of India approved two schemes on repair, renovation and restoration of water bodies (i) one with
external assistance with an outlay of Rs. 1500 crore and (ii) the other with domestic support with an outlay of Rs.
1250 crore for implementation during XI Plan Period.
Scope/Objectives
To restore and augment storage capacities of water bodies
To recover and extend their lost irrigation potential
Improvement of Water Bodies
catchment area treatment
command area development
Capacity building of stakeholders, increased availability of drinking water.
Achievements
(RRR) of Water Bodies scheme covers 1098 water bodies with total original culturable command area of
1.72 lakh hectares
Additional irrigation potential of 0.78 lakh hectares is likely to be generated.
The physical work for restoration has been completed in 1054 water bodies in 15 states so far.
The spillover activities are being continued during the current financial year i.e. 2009-10 in the state of
Maharashtra.
The irrigation potential created subsequent to pilot scheme is 1.73lakh ha approximately.
AVALON GLOBAL RESEARCH
35
9. ACCELERATED IRRIGATION BENEFIT PROGRAMME (AIBP)
Introduction
The Accelerated Irrigation Benefit Programme (AIBP) was launched during 1996- 1997 to give loan assistance to
the States to help them complete some of the incomplete major/medium irrigation projects. Grant component
has been introduced in the programme from April 2004 like other Central Sector Schemes. After commencement
of this programme, 109 major/medium projects and 6,584 Surface MI Schemes have been reported to be
completed so far. An additional irrigation potential of 5.44 million hectare has been created through
major/medium irrigation projects and an irrigation potential of 0.45 million hectares has been created through
Surface MI Schemes up to March 2009. For the year 2009-10, budget allocation is Rs.8, 000 crores.
Scope/Objectives
To accelerate implementation of large irrigation projects which are beyond their source capability of the
State Governments
Expeditious completion of the projects which were in advanced stage of completion
To realize bulk benefits from irrigation projects
Program Outlay
An outlay of Rs.1200.00 crore has been provided under AIBP during 2010-11 to create additional irrigation
potential of 43.324 th. ha. Sector-wise details are given in the table below. Besides 72 new MI projects with an
estimated cost of Rs.125.85to provide irrigation to 11.93 thousand hectare shave been submitted to MOWR for
approval. The latest technique such as Remote Sensing is also being used by the Government of India to confirm
irrigation potential reported to have been created by the State Governments under AIBP.
Achievements
Active central assistance at the rate of 90% of the eligible balance cost of irrigation and drinking water
component of these projects is being provided
AIBP of the 65 major/medium projects initially included in the Prime Minister’s relief package for agrarian
distressed districts of Andhra Pradesh, Karnataka, Kerala and Maharashtra, so far 40 projects have been
funded under AIBP. The grant released so far for these projects is Rs.5155.1307 crore.
AVALON GLOBAL RESEARCH
36
10. FARMER’S PARTICIPATORY ACTION RESEARCH PROGRAMME (FPARP)
Introduction
Farmers Participatory Action Research Programme (FPARP) has been initiated by the Ministry of Water Resources
during 2007-08 kharif seasons onwards in the irrigated land of arid, semi-arid, hilly and coastal areas of the
country with a view to facilitate demonstration of technologies for achieving the goal of “More crop and income
per drop of water”. FPARP is being implemented by 60 institutes in 25 states covering about 2300 villages in the
country.
Technologies
Following are the main technologies relating to improved crop practices, water savings, design of storage
structures & farm implements etc, being demonstrated under FPARP:-
SRI (System of Rice Intensification) cultivation for paddy crops
Multiple cropping
Improvement of water use efficiency through suitably improved crop rotations
Bio-farming Technology
Propagation of Aqua Culture Activities e.g. Pisciculture
Crop diversification & multiple use of water
Improved irrigation methods – Micro irrigation methods (Sprinkler/Drip)
Water harvesting technologies (Low Cost Micro Rain Water Harvesting Structure; i.e. Jalkund, Storage tanks, Percolation tanks, Check dams, Recharging Wells etc)
Reclamation of soils through–Drainage/Bio-reclamation
Soil & Water conservation measures
Impact
Water saving technological interventions was demonstrated on various crops such as paddy, wheat, vegetable cowpea, apple and maize in various States.
The performance of these technologies implemented under FPARP were compared with the conventional method of irrigation in terms of percentage increase in water saving and income.
Water saving has been indicated in wheat from 20% to 91%, paddy from 22% to 50%, Gram from 22% to 33%, vegetable from 31% to 40%, Groundnut from 15% to 26%, Soyabean 33%, Maize from 8% to 40%, Banana from 40% to 50% and in case of Coconut 65%.
Increase in yield for wheat ranged from 7-289 %, paddy from 8-100%, Gram from 10-66 %, vegetable from 10-230%, Groundnut from 16-18 %, Soyabean from 20-34%, Maize from 26-78% and in case of Banana & Coconut 9% and 24% respectively.
Conclusion
FPARP demonstrations have indicated that there is sufficient scope for improving the efficiency of use of irrigation
water in a manner that both the productivity and profitability of farmers are enhanced. Modern irrigation
technologies, particularly the sprinkler and drip irrigation, increase water use efficiencies for crop production.
They have opened up new opportunities for the farmers to shift from low value crops with high water
requirements (e.g. cereal) to high value crops with low water requirements such as fruits, vegetables and oil seeds
etc