water accounting in australia - cepal · pdf fileconservation groups, etc) ... abs given...
TRANSCRIPT
Linking people, the economy and the environment
Karen Connaughton, Director, Environmental Accounts, ABS
Water Accounting in Australia
Water brings us all together
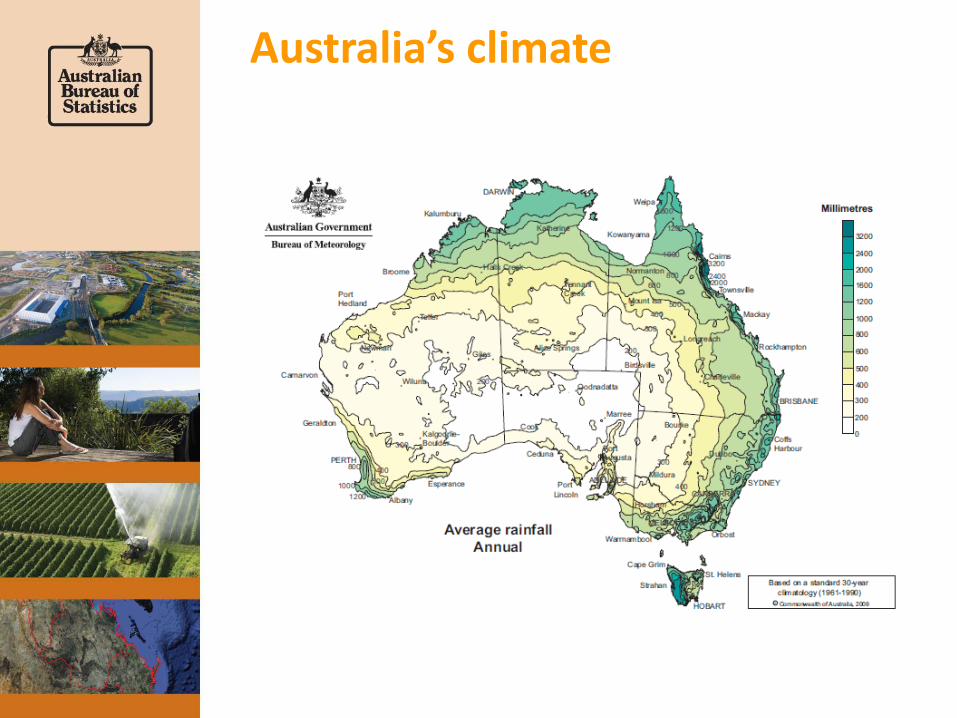
Australia’s climate
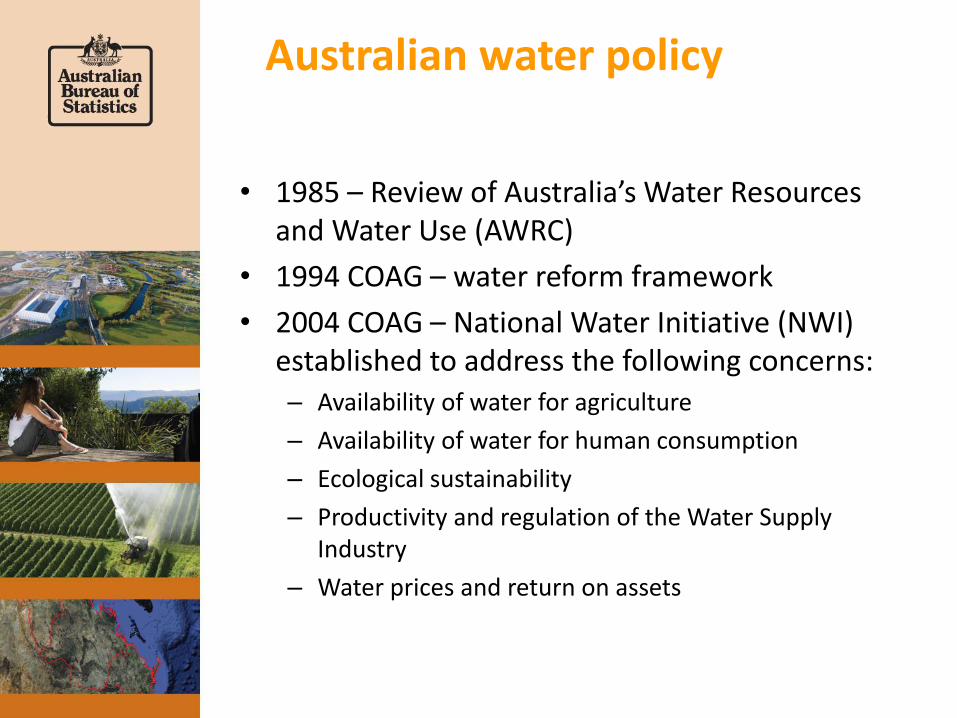
Australian water policy
• 1985 – Review of Australia’s Water Resources and Water Use (AWRC)
• 1994 COAG – water reform framework
• 2004 COAG – National Water Initiative (NWI) established to address the following concerns: – Availability of water for agriculture
– Availability of water for human consumption
– Ecological sustainability
– Productivity and regulation of the Water Supply Industry
– Water prices and return on assets
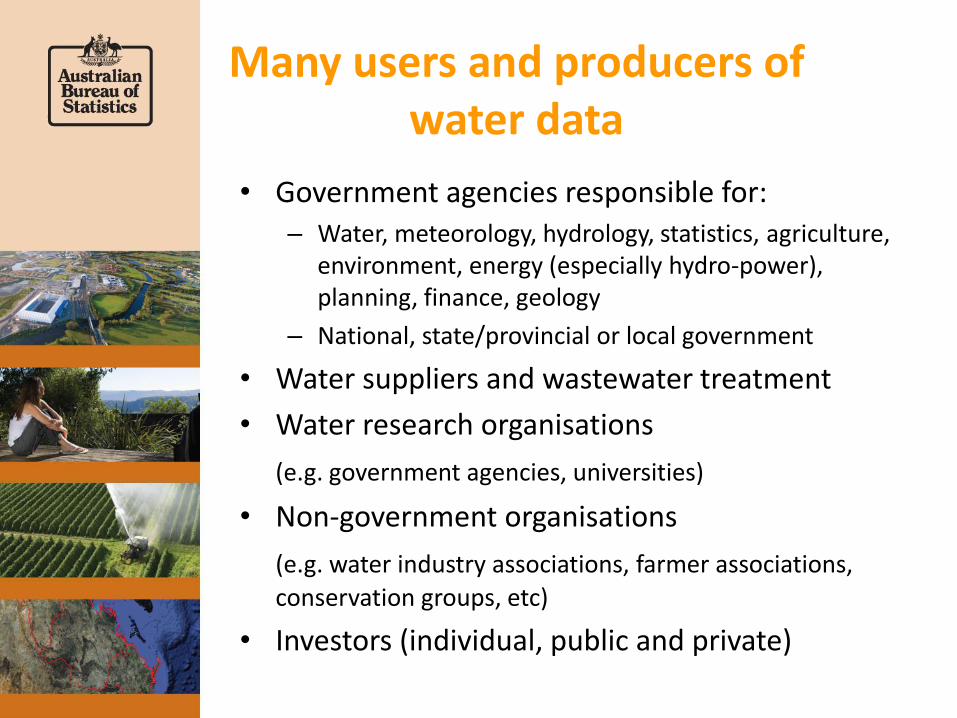
Many users and producers of water data
• Government agencies responsible for: – Water, meteorology, hydrology, statistics, agriculture,
environment, energy (especially hydro-power), planning, finance, geology
– National, state/provincial or local government
• Water suppliers and wastewater treatment
• Water research organisations
(e.g. government agencies, universities)
• Non-government organisations
(e.g. water industry associations, farmer associations,
conservation groups, etc)
• Investors (individual, public and private)
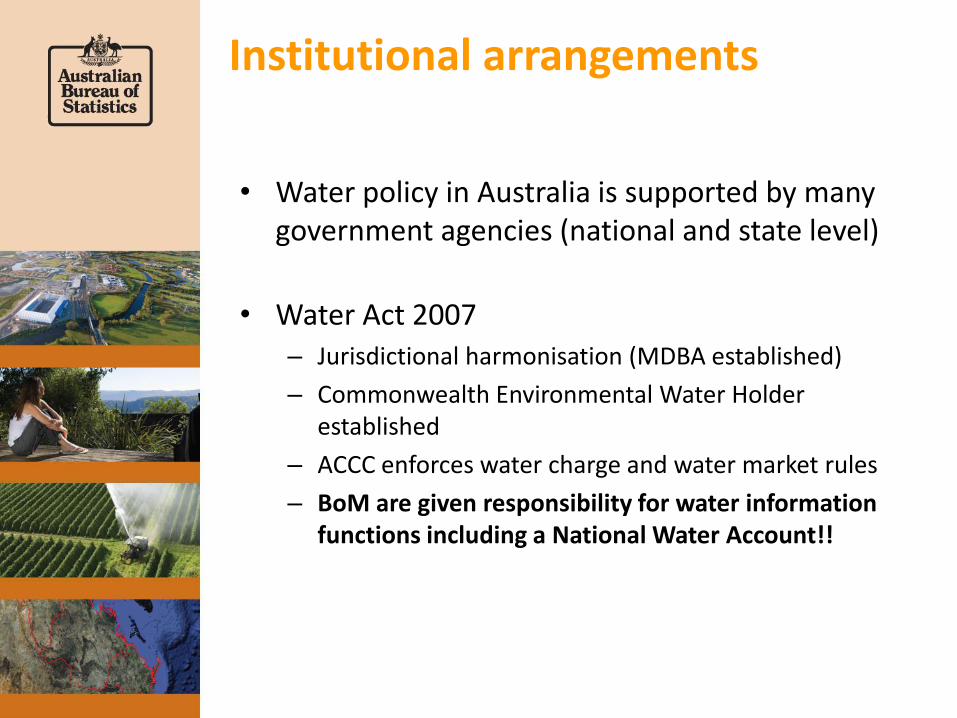
Institutional arrangements
• Water policy in Australia is supported by many government agencies (national and state level)
• Water Act 2007 – Jurisdictional harmonisation (MDBA established)
– Commonwealth Environmental Water Holder established
– ACCC enforces water charge and water market rules
– BoM are given responsibility for water information functions including a National Water Account!!

History
1985 – Review of Australia’s Water Resources and Water Use (AWRC)
1994 – COAG Water Reform Framework
2000 – 1st Water Account Australia (ref period 1993-94 to 1996-97)
2004 – 2nd Water Account Australia (ref period 2000-01)
2004 – National Water Initiative
2006 – 3rd Water Account Australia (ref period 2004-05)
2007 – The Water Act 2007
2010 – 4th Water Account Australia (ref period 2008-09) –
1st in a series of annual accounts
2012 – SEEA adopted as international statistical standard
2013 – ABS given official leadership role for SEEA-implementation in
Australia
Water Account Australia
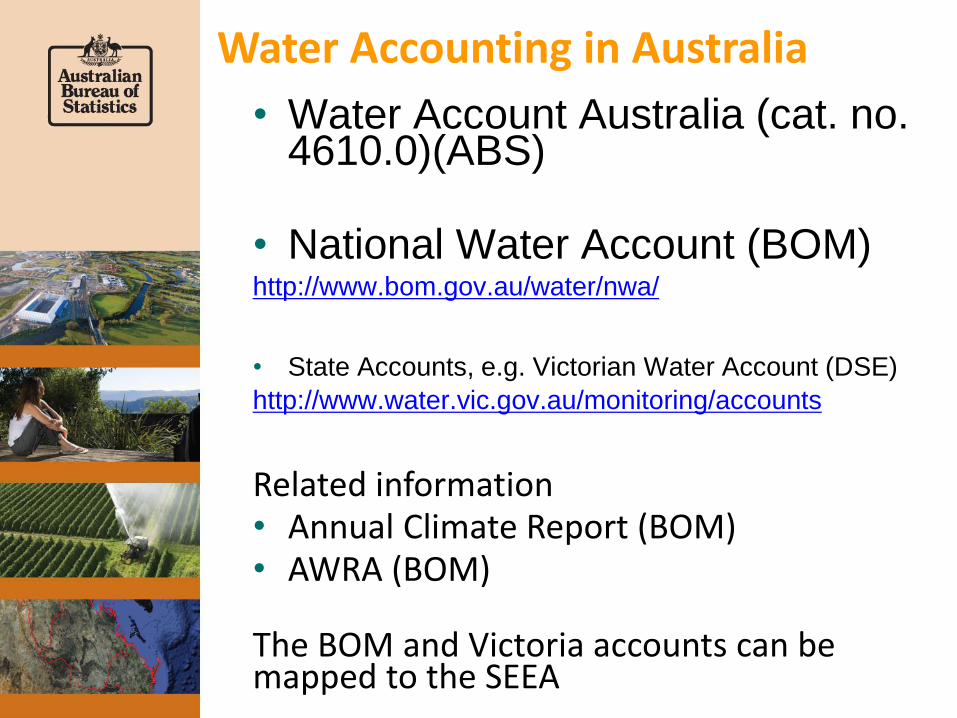
Water Accounting in Australia
• Water Account Australia (cat. no. 4610.0)(ABS)
• National Water Account (BOM) http://www.bom.gov.au/water/nwa/
• State Accounts, e.g. Victorian Water Account (DSE)
http://www.water.vic.gov.au/monitoring/accounts
Related information • Annual Climate Report (BOM) • AWRA (BOM)
The BOM and Victoria accounts can be mapped to the SEEA

ABS vs BOM water account
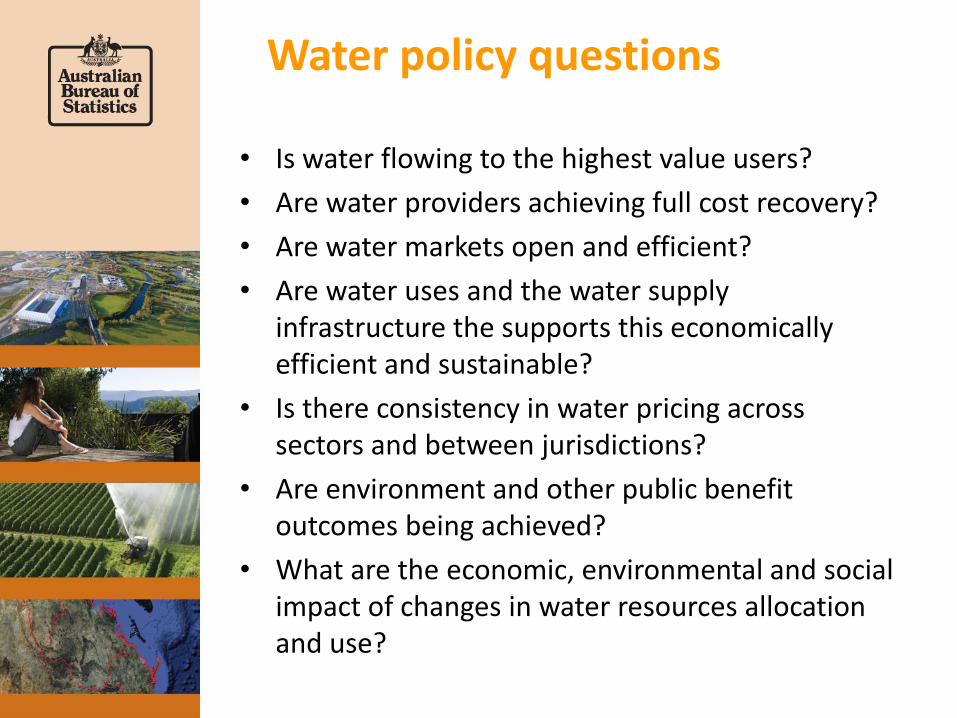
Water policy questions
• Is water flowing to the highest value users?
• Are water providers achieving full cost recovery?
• Are water markets open and efficient?
• Are water uses and the water supply infrastructure the supports this economically efficient and sustainable?
• Is there consistency in water pricing across sectors and between jurisdictions?
• Are environment and other public benefit outcomes being achieved?
• What are the economic, environmental and social impact of changes in water resources allocation and use?

Water Account Australia
What is in the publication?
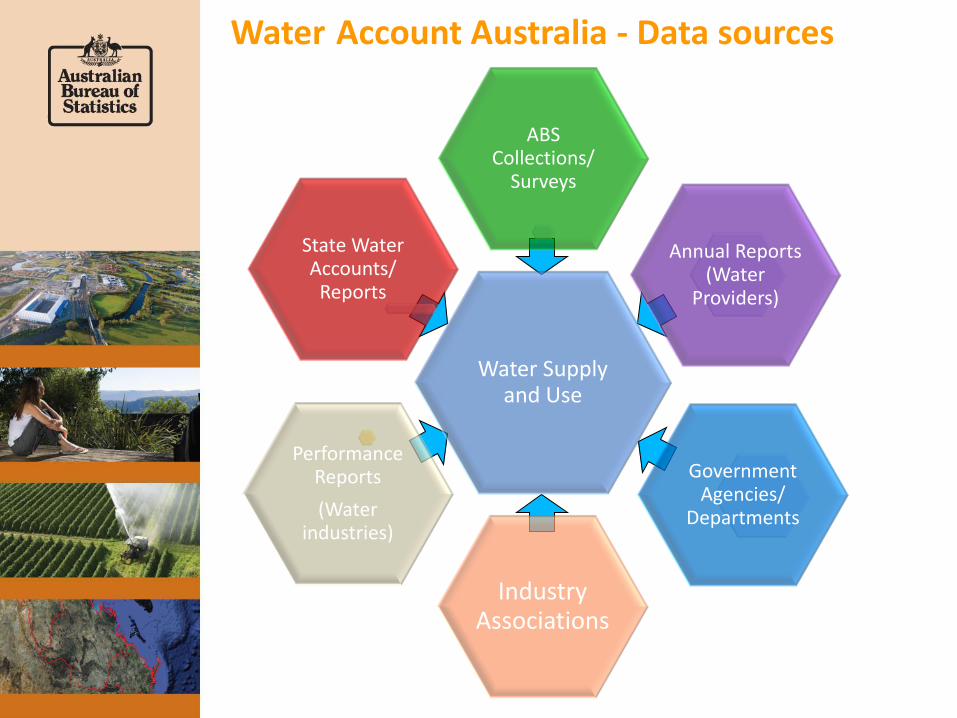
Water Supply and Use
ABS Collections/
Surveys
Annual Reports (Water
Providers)
Government Agencies/
Departments
Industry Associations
Performance Reports
(Water industries)
State Water Accounts/
Reports
Water Account Australia - Data sources
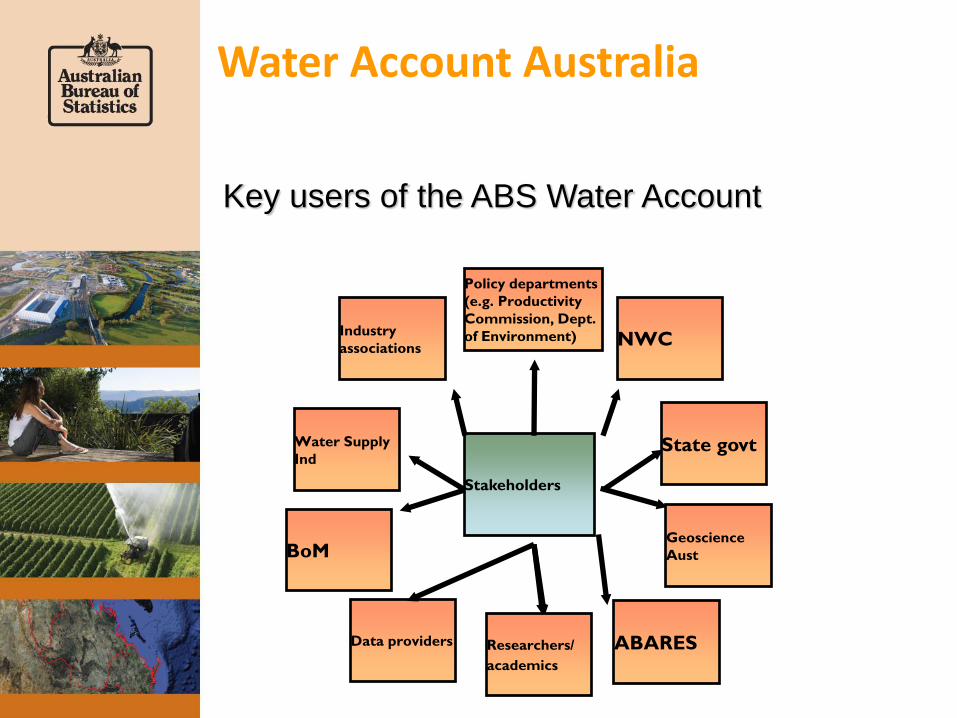
Key users of the ABS Water Account
Stakeholders
ABARES
Policy departments
(e.g. Productivity
Commission, Dept.
of Environment)
Water Supply
Ind
Geoscience
Aust BoM
Industry
associations NWC
State govt
Data providers Researchers/
academics
Water Account Australia
Australian water accounts - policy applications
• ABS Water Accounts relatively new tool for policy makers and researchers
• Potential in decision-making and analysis yet to be fully realised
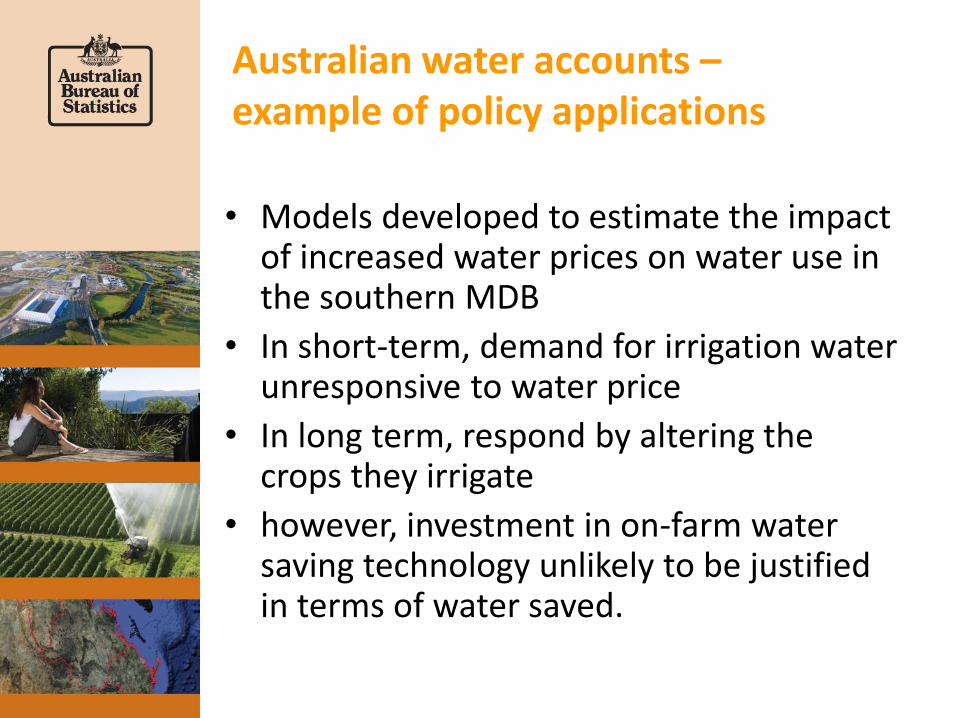
Australian water accounts – example of policy applications
• Models developed to estimate the impact of increased water prices on water use in the southern MDB
• In short-term, demand for irrigation water unresponsive to water price
• In long term, respond by altering the crops they irrigate
• however, investment in on-farm water saving technology unlikely to be justified in terms of water saved.
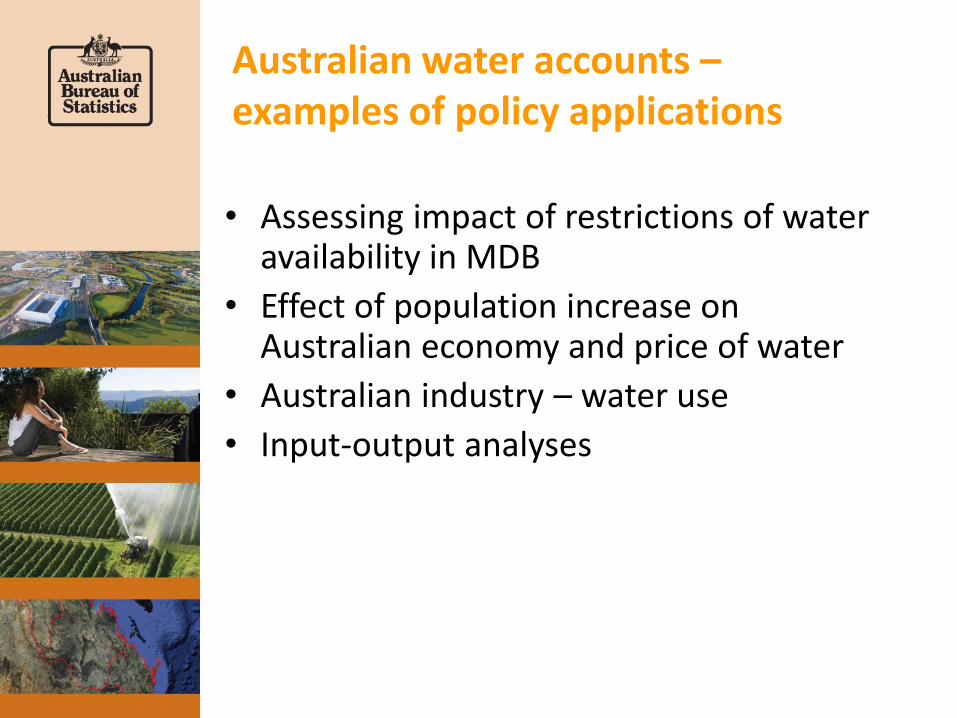
Australian water accounts – examples of policy applications
• Assessing impact of restrictions of water availability in MDB
• Effect of population increase on Australian economy and price of water
• Australian industry – water use
• Input-output analyses
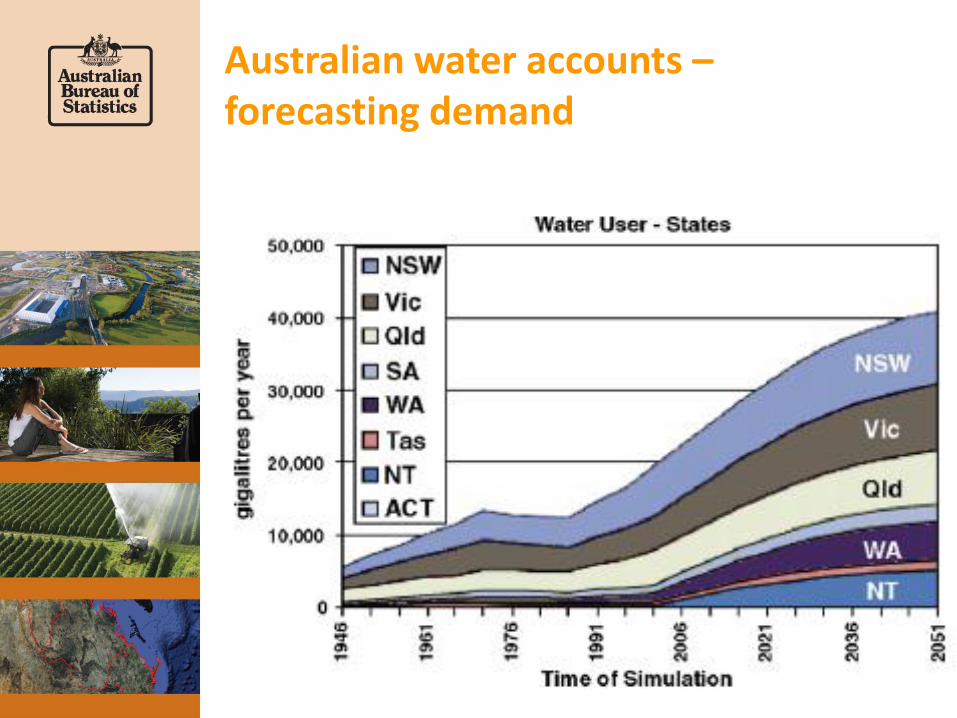
Australian water accounts – forecasting demand
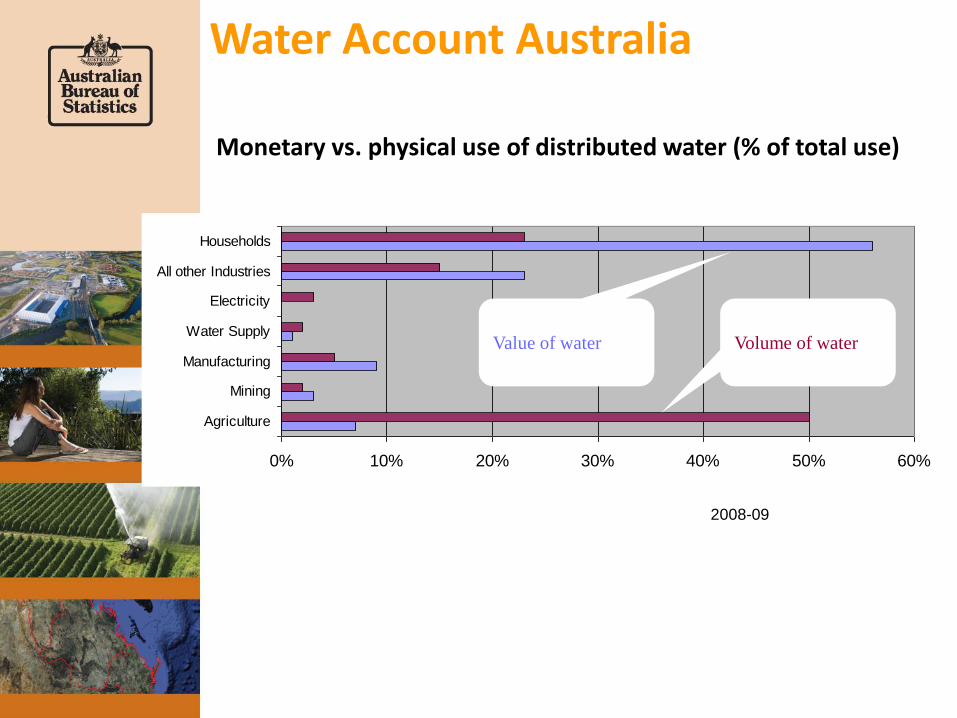
Monetary vs. physical use of distributed water (% of total use)
0% 10% 20% 30% 40% 50% 60%
Agriculture
Mining
Manufacturing
Water Supply
Electricity
All other Industries
Households
Volume of water Value of water
2008-09
Water Account Australia
Water Account Australia
• Timeliness – data available 15 months after reference period
• Data-provider load
• Consistency/quality of data from different sources
• Combining and linking monetary water accounts with physical water accounts
• Appropriate valuation of water and water infrastructure assets
Water Account Australia
• Greater disaggregation of industry data
• Spatial referencing – economic data is related to enterprises and there can be poor spatial referencing
• Separate identification of water supply and sewerage services
• Data Gaps
– Rain-fed agriculture
– Household rainwater tanks (now in)
– Discharges back to the environment (especially from irrigation run-off)
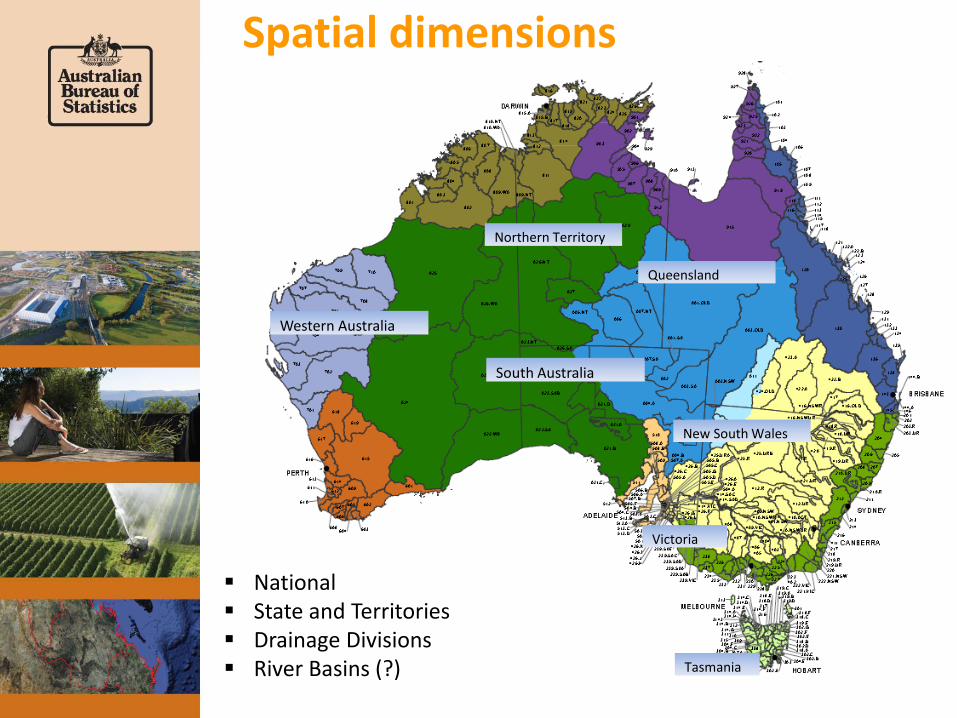
Western Australia
South Australia
Northern Territory
Queensland
New South Wales
Victoria
Tasmania
Spatial dimensions
National State and Territories Drainage Divisions River Basins (?)
Water Account Australia
• Presentation – SEEA format
• Broader adoption of the SEEA beyond ABS – BOM, National Water Commission, states/territories
• Licence volumes Vs actual abstraction
• Treatment of losses
• Treatment of environmental flows, Environmental Water Holders
• Rural “distributed” water
• Indicators
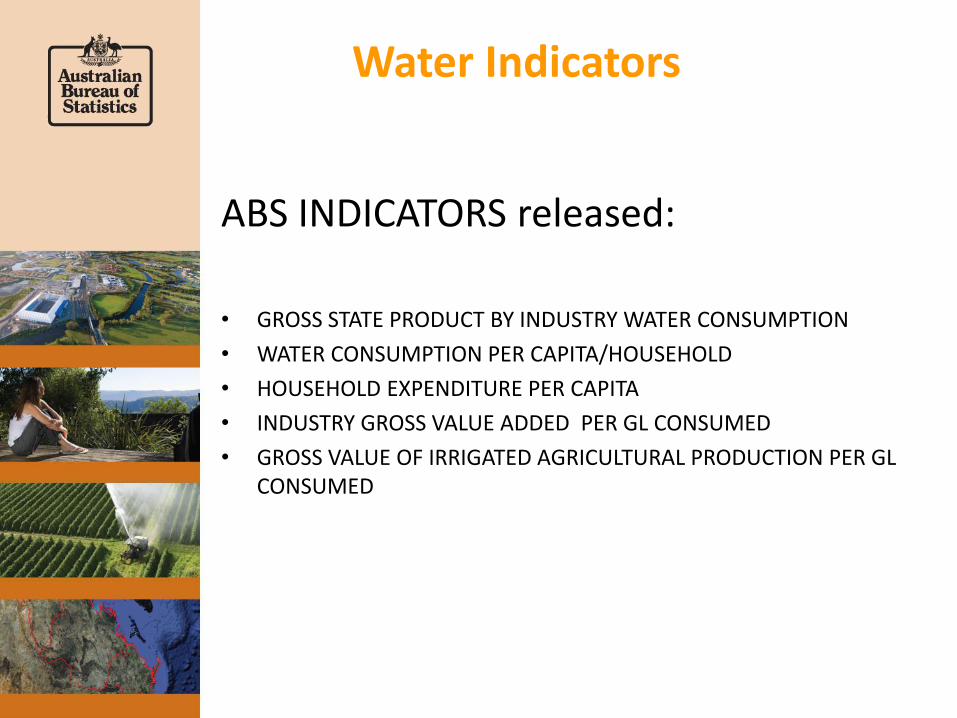
Water Indicators
ABS INDICATORS released:
• GROSS STATE PRODUCT BY INDUSTRY WATER CONSUMPTION
• WATER CONSUMPTION PER CAPITA/HOUSEHOLD
• HOUSEHOLD EXPENDITURE PER CAPITA
• INDUSTRY GROSS VALUE ADDED PER GL CONSUMED
• GROSS VALUE OF IRRIGATED AGRICULTURAL PRODUCTION PER GL CONSUMED
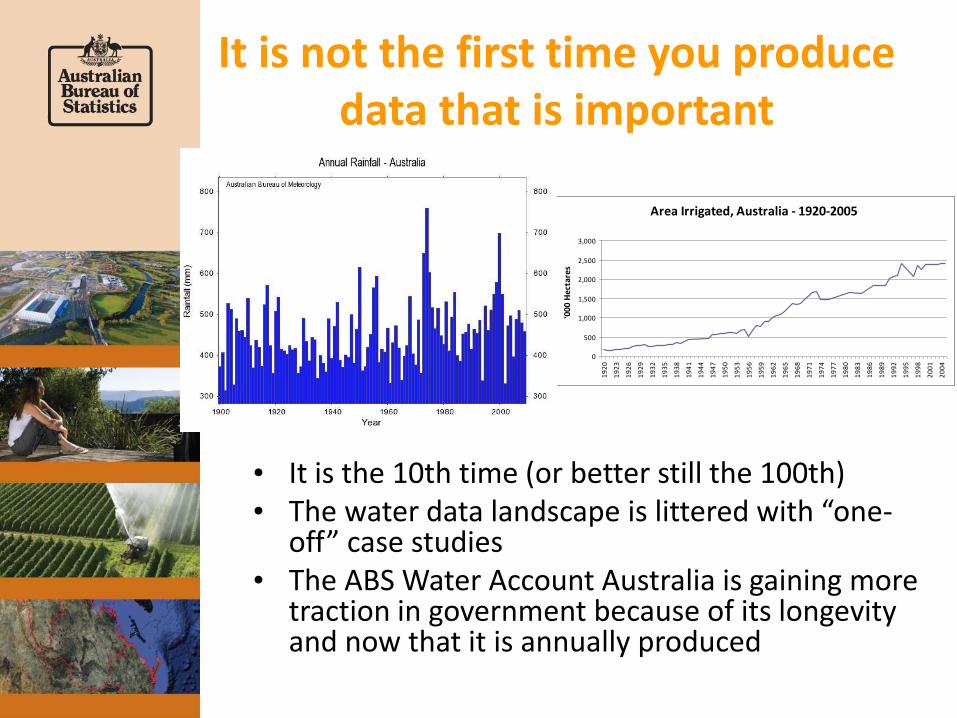
It is not the first time you produce data that is important
• It is the 10th time (or better still the 100th) • The water data landscape is littered with “one-
off” case studies • The ABS Water Account Australia is gaining more
traction in government because of its longevity and now that it is annually produced
Area Irrigated, Australia - 1920-2005
0
500
1,000
1,500
2,000
2,500
3,000
19
20
19
23
19
26
19
29
19
32
19
35
19
38
19
41
19
44
19
47
19
50
19
53
19
56
19
59
19
62
19
65
19
68
19
71
19
74
19
77
19
80
19
83
19
86
19
89
19
92
19
95
19
98
20
01
20
04
'000
Hec
tare
s
Discussion and Questions
Karen Connaughton
Director, Environmental Accounts Section
Australian Bureau of Statistics