warm up i have one can of coke that is up for grabs – how are we going to decide who gets it? –...
TRANSCRIPT
Warm Up
• I have one can of Coke that is up for grabs– How are we going to decide who gets it?– What will happen if I decide to auction it off?– Will the soda go for the price you can buy it at the
store?• How do economists decide “who” when there
are limited resources?
Going to a Concert?
• Popular concert• Sold out? Shortage of tickets?• How many would buy for $25• More?• Law of demand: consumers will demand more
of a product at lower prices
Introduction
• There are many reasons why people decide to purchase or decide to sell
• One element is always present– Price!
• If price is too low – sellers will not sell• If price is too high – buyers will not buy• Supply and demand work together to establish
“Market Price”
Demand
• Desire, willingness, and ability to purchase at the specified price and time
• The quantity demanded varies with the price of an item
• The lower the price, the greater number people are willing to buy
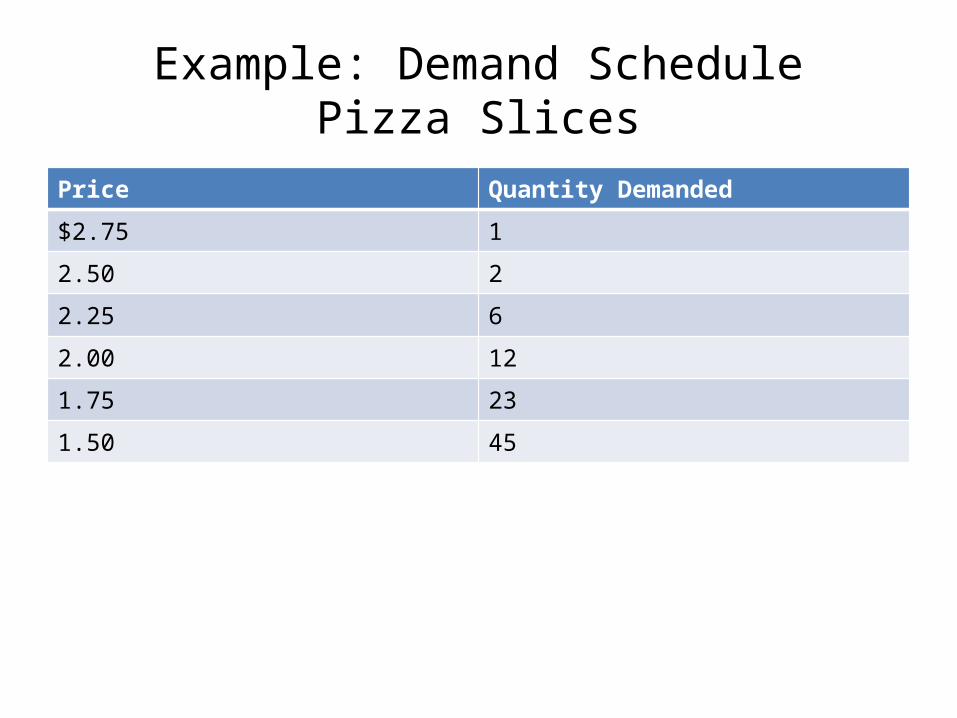
Example: Demand SchedulePizza Slices
Price Quantity Demanded
$2.75 1
2.50 2
2.25 6
2.00 12
1.75 23
1.50 45
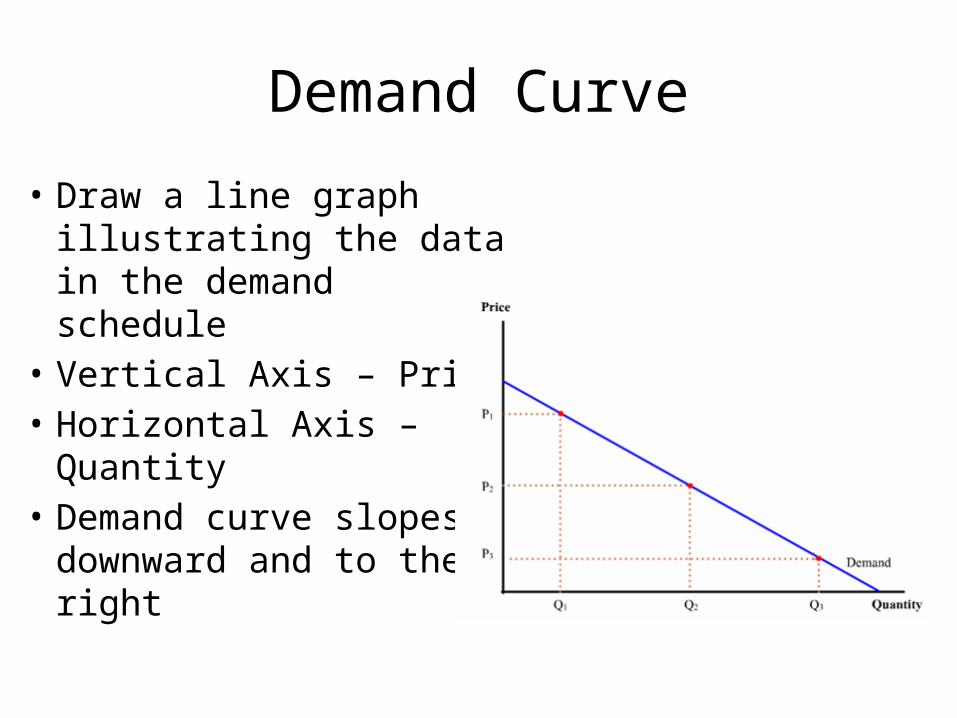
Demand Curve
• Draw a line graph illustrating the data in the demand schedule
• Vertical Axis – Price• Horizontal Axis –
Quantity• Demand curve slopes
downward and to the right
Law of Demand
• Buyers will purchase more of an item at a lower price and less at a higher price
• Reasons– More can afford it– People buy more at lower prices
• Quantity demanded varies inversely with (in the opposite direction to) changes in price
Example
• As the price of pizza was reduced, more students demanded them
• Storekeepers lower their price when they want to clear out merchandise
Movement ALONG the Demand Curve
• Change in Quantity Demanded is due to a change in PRICE

Reasons for movement along the Demand Curve
• INCOME EFFECT– The income effect happens when a person changes his or
her consumption of goods and services as a result of a change in real income
• SUBSTITUTION EFFECT– The substitution effect occurs when consumers react to an
increase in a good’s price by consuming less of that good and more of other goods.
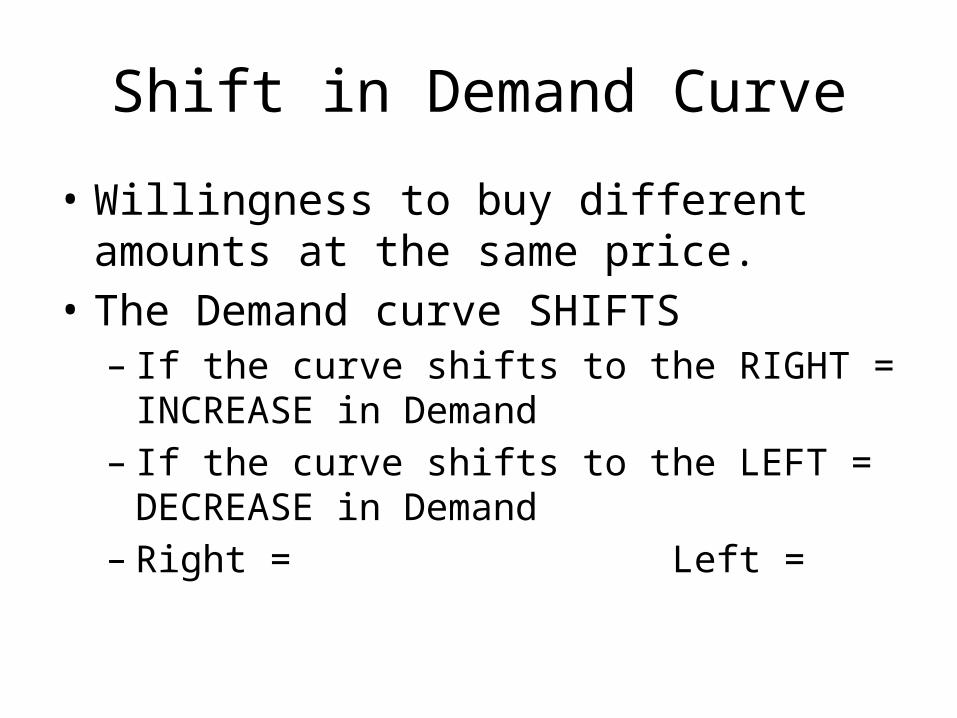
Shift in Demand Curve
• Willingness to buy different amounts at the same price.
• The Demand curve SHIFTS– If the curve shifts to the RIGHT = INCREASE in
Demand– If the curve shifts to the LEFT = DECREASE in
Demand– Right = Left =
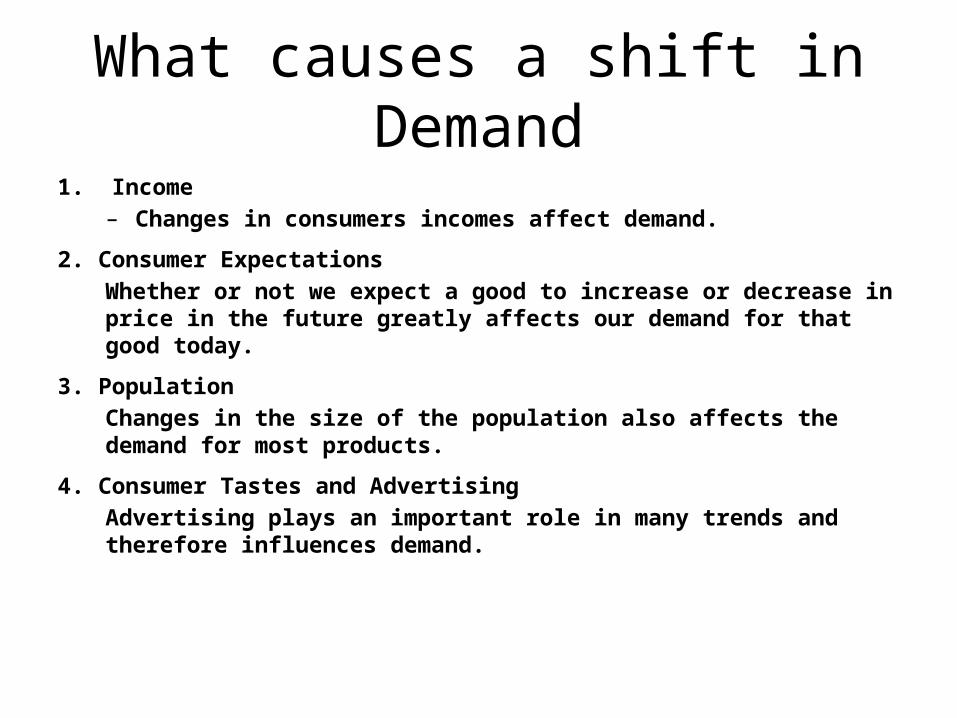
What causes a shift in Demand1. Income
– Changes in consumers incomes affect demand.
2. Consumer Expectations
Whether or not we expect a good to increase or decrease in price in the future greatly affects our demand for that good today.
3. Population
Changes in the size of the population also affects the demand for most products.
4. Consumer Tastes and Advertising
Advertising plays an important role in many trends and therefore influences demand.
Prices of Related Goods
• The demand curve for one good can be affected by a change in the demand for another
• Compliments: 2 goods bought together– Skis and ski boots
• Substitutes: 1 good bought in place of the other– Skis and snowboards

Let’s take a look!
• Demand Graphs
Marginal Utility
• Utility = usefulness or satisfaction• Defined as EXTRA usefulness or satisfaction a
person gets from acquiring one more unit of a product
Principle of Diminishing Marginal Utility
• More units of a certain economic product a person acquires, the less eager that person is to buy more
• I’m looking for a volunteer!
Warm Up
1. What is the definition of demand?2. Explain the law of demand3. Describe marginal utility and diminishing marginal utility4. What causes a change along the demand curve line?5. What causes a shift in the demand curve?
• Let’s practice: Demand Schedule/Graph
Elasticity of Demand
• The law of demand does NOT tell us by how much the quantity demanded will increase or decrease at different prices
• One way to measure the degree of demand is through the concept of elasticity of demand
• The percentage change in demand that follows a price change
• The more demand expands or contracts after a price change, the great the elasticity of demand
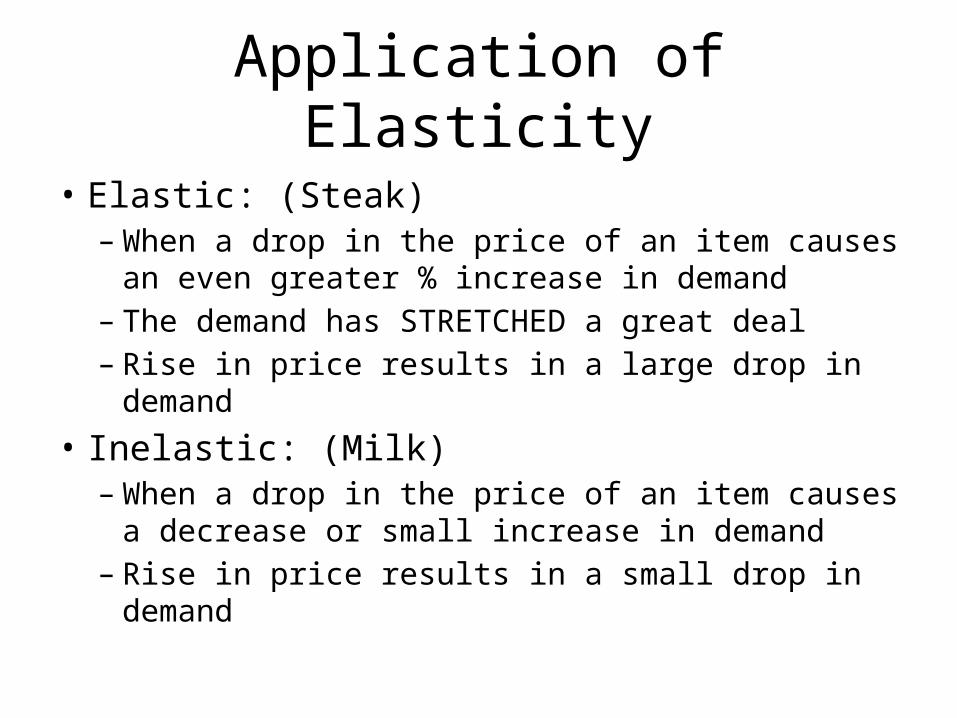
Application of Elasticity
• Elastic: (Steak)– When a drop in the price of an item causes an
even greater % increase in demand– The demand has STRETCHED a great deal– Rise in price results in a large drop in demand
• Inelastic: (Milk)– When a drop in the price of an item causes a
decrease or small increase in demand– Rise in price results in a small drop in demand
What Makes Demand Elastic/Inelastic
• Demand for a good that consumers will continue to buy despite a price increase is ??
• Inelastic!• Demand for a good that is very sensitive to
changes in price is elastic!
Significance of Demand Elasticity
• The elasticity of demand determines how a change in prices will affect a firm’s total revenue or income
• If a good has an elastic demand, raising prices may actually decrease the firm’s total revenue

Quick Quiz: Elastic/Inelastic
• When a small change in price causes a large change in quantity demanded

• Elastic
• There are very few substitutes for a good

• inelastic
• A change in price will cause a small change in quantity demanded

• inelastic
• A big ticket item’s price increases

• Elastic
Activity
• With a partner• Make a list• Elastic/Inelastic goods/services• Why elastic?• Why inelastic?
Supply
• The amount of a product that is offered for sale at all prices that could prevail in the market
• Law states suppliers will offer more for sale at high prices and less at low prices
• Quantity supplied = how much of a good/service is offered for sale at a given price
• Increased revenues when prices are high encourage firms to produce more!
• Also draws in more competition!!
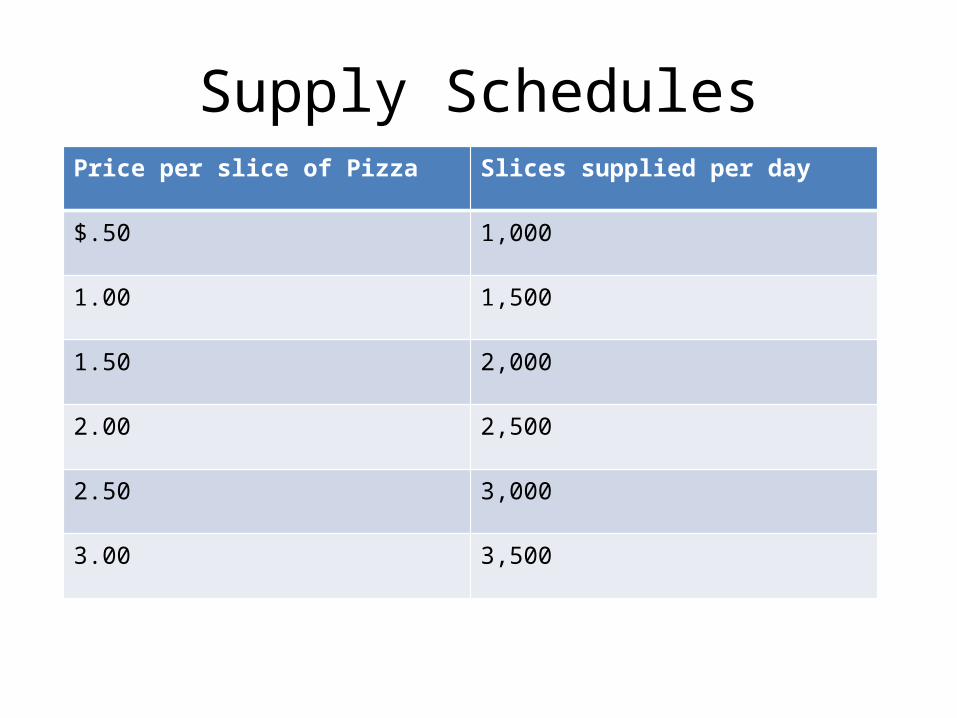
Supply SchedulesPrice per slice of Pizza Slices supplied per day
$.50 1,000
1.00 1,500
1.50 2,000
2.00 2,500
2.50 3,000
3.00 3,500
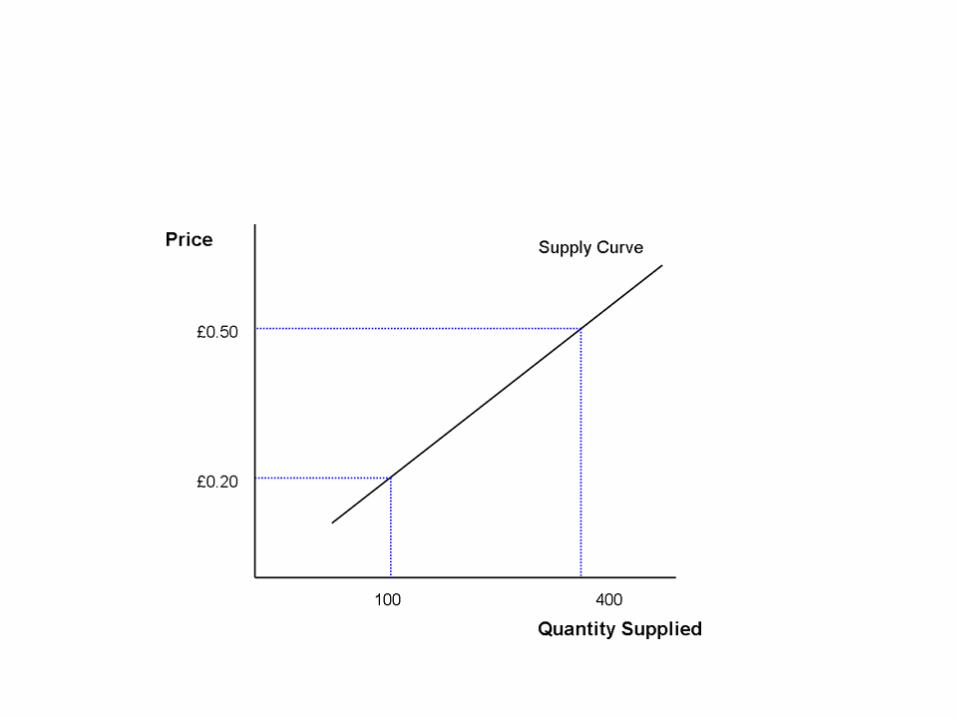
A change in QUANTITY SUPPLIED
• Is shown by movement ALONG the supply curve
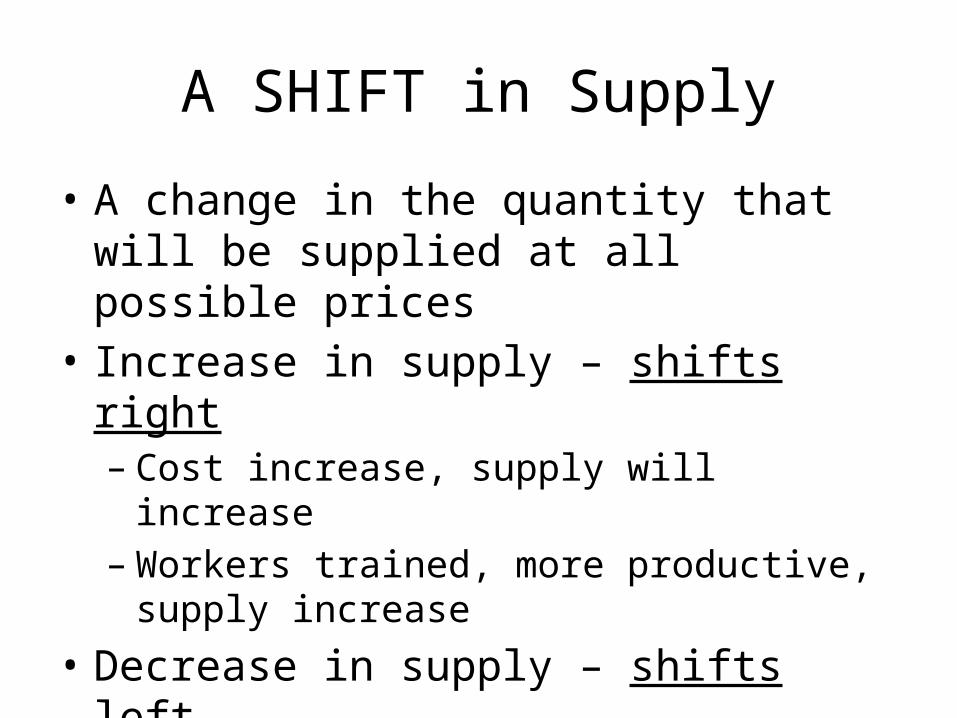
A SHIFT in Supply
• A change in the quantity that will be supplied at all possible prices
• Increase in supply – shifts right– Cost increase, supply will increase– Workers trained, more productive, supply increase
• Decrease in supply – shifts left– Cost increase, supply will decrease– Temps, less productive, supply decreases
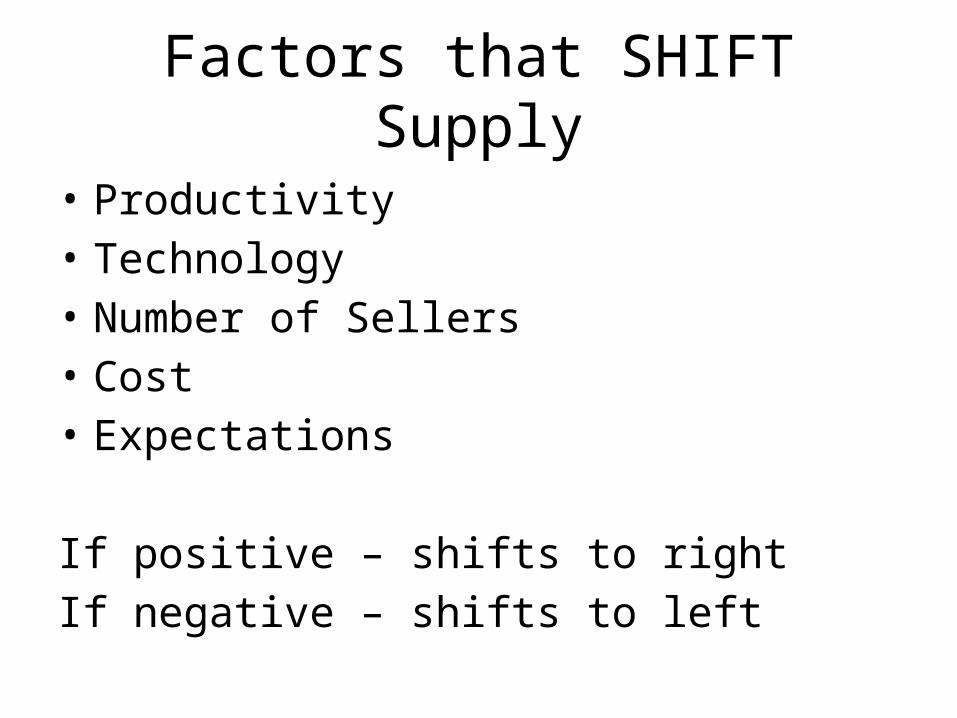
Factors that SHIFT Supply
• Productivity• Technology• Number of Sellers• Cost• Expectations
If positive – shifts to rightIf negative – shifts to left
Government Influence
• By raising or lowering the cost of producing goods, the government can encourage or discourage an entrepreneur or industry– Subsidies– Taxes– regulation
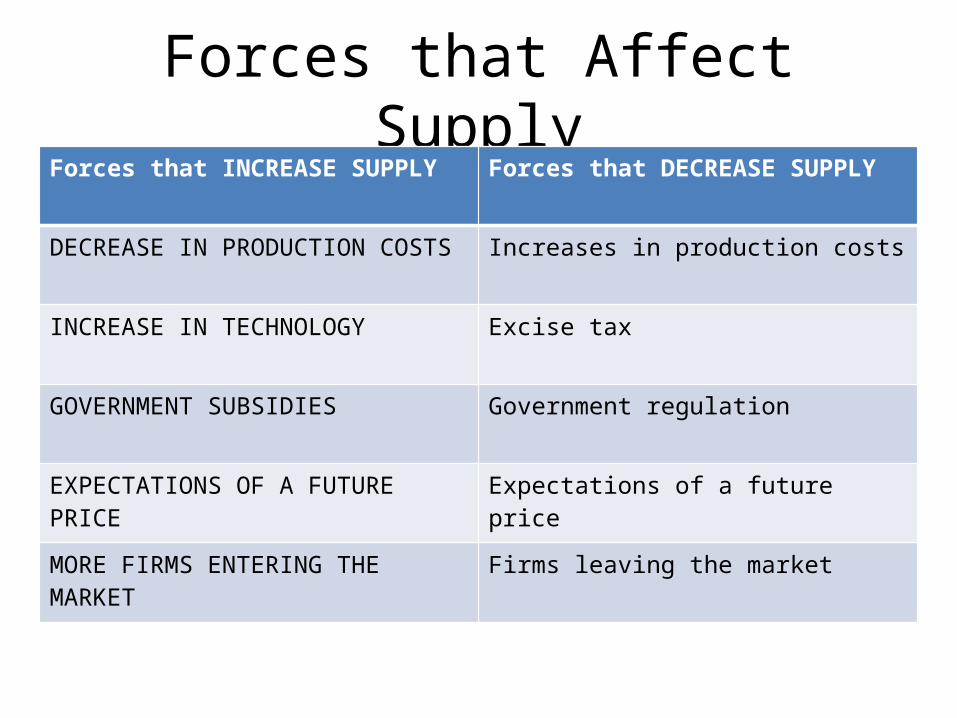
Forces that Affect SupplyForces that INCREASE SUPPLY Forces that DECREASE SUPPLY
DECREASE IN PRODUCTION COSTS Increases in production costs
INCREASE IN TECHNOLOGY Excise tax
GOVERNMENT SUBSIDIES Government regulation
EXPECTATIONS OF A FUTURE PRICE Expectations of a future price
MORE FIRMS ENTERING THE MARKET Firms leaving the market
Supply Elasticity
• Elasticity of supply is a measure of the way quantity supplied reacts to a change in price
• If supply is not very responsive – inelastic• An elastic supply is very sensitive to changes in
price
Determinates of Supply Elasticity
• When companies find it difficult to increase output because of huge capital and technology – supply will be inelastic
• When companies can increase production easily, without the need for more capital or labor – supply will be elastic
• Typically in the short run, a firm cannot easily change its output level, so supply is inelastic
Demand v. Supply Elasticity
• If quantities are being purchased – concept is demand elasticity
• If quantities are being supplied – concept is supply elasticity
• BOTH is a measure of responsiveness to CHANGE IN PRICE
Equilibrium
• By combining the supply and demand curves on the same graph, you can see how supply and demand together determine how much of a product will be produced and the equilibrium price
• Equilibrium – price at which the quantity supplied exactly equals the quantity demanded
• In other words, consumers are willing and able to buy the same amount of the product as producers are willing and able to supply
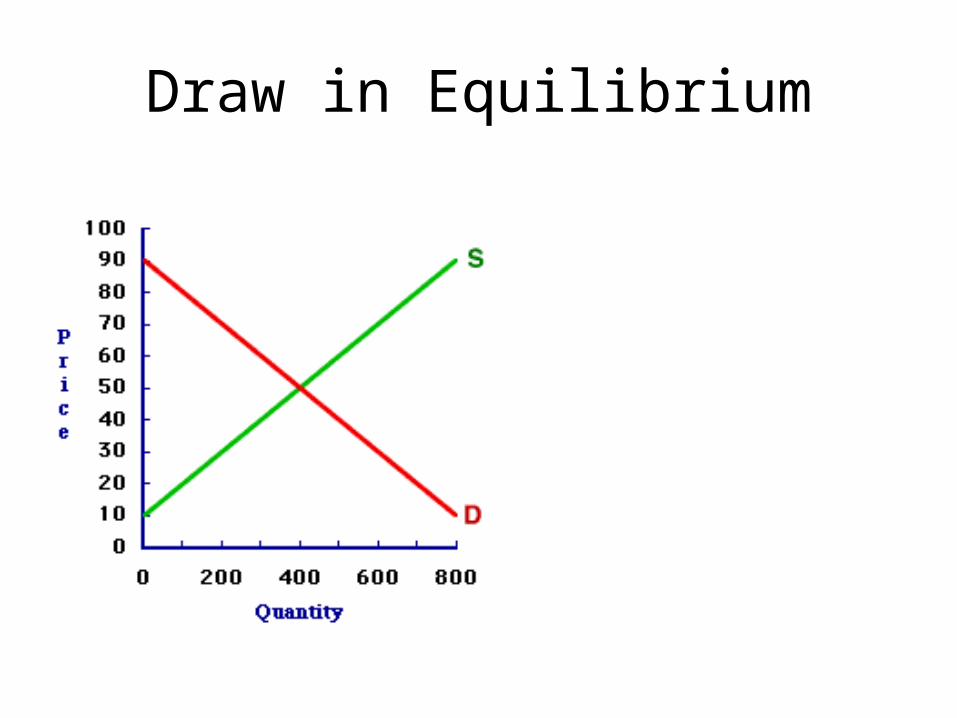
Draw in Equilibrium
Time to come to Equilibrium
• Will bread come to equilibrium before red cars?
• Yes! Because it is perishable and no other reason!
Market Disequilibrium
• If the market price or quantity supplied is anywhere but equilibrium
• 2 causes– Excess demand– Excess supply
• Interactions between buyers and sellers will always push the market back towards equilibrium
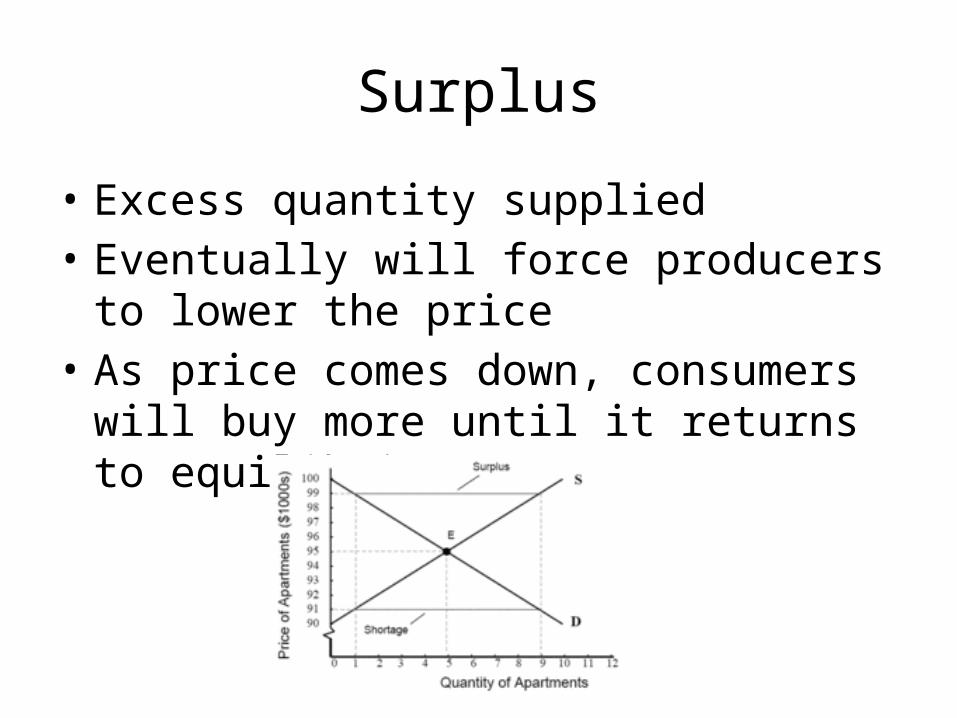
Surplus
• Excess quantity supplied• Eventually will force producers to lower the
price• As price comes down, consumers will buy
more until it returns to equilibrium
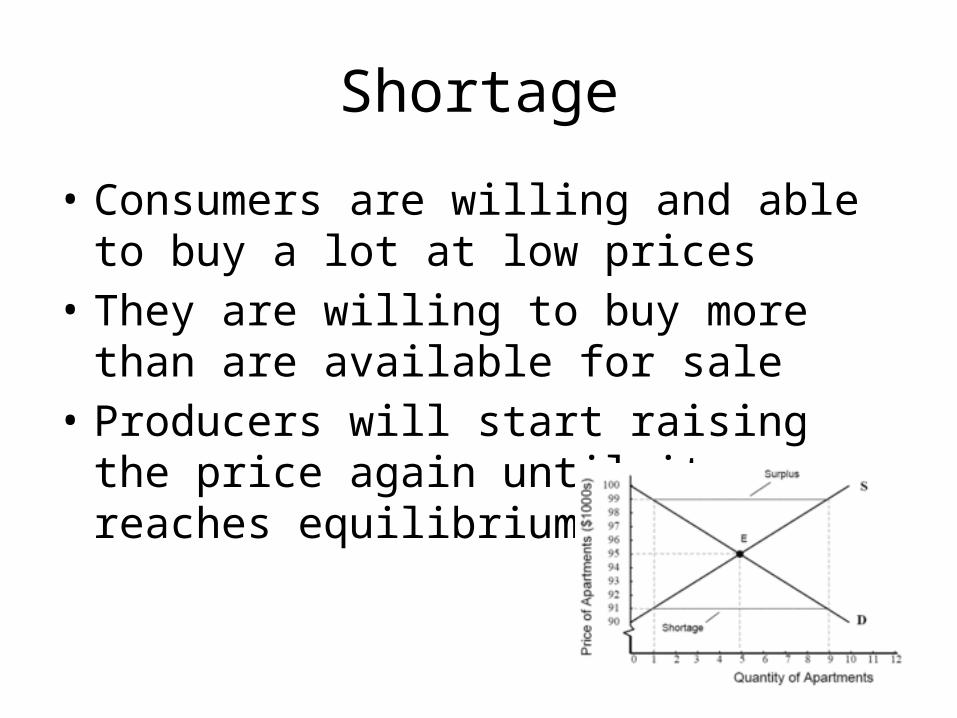
Shortage
• Consumers are willing and able to buy a lot at low prices
• They are willing to buy more than are available for sale
• Producers will start raising the price again until it reaches equilibrium
Role of Government in D&S
• Price ceilings– Max price that can be legally charged for a good– Rent control
• Price floors– Minimum price set by the government that must
be paid for a good/service– Minimum wage
• We need government when price is too high or low?
Make a list of things that are too expensive
Should the government get involved?
• Where are prices too low? Should we help boost these prices with government involvement?
Activity
• Prices are signals and provide incentives to buyers and sellers. When supply or demand changes, market prices adjust, affecting incentives– Identify products used in households that have
become more/less expensive compared to other products as a result of changes in supply and demand
– Explain how the price changes affected production and consumption decisions in the household
Advantages of Prices
• As an incentive to buy or produce• Signals – high price is giving sellers the green
light to produce more• Flexibility – price more flexible than
production levels
Efficient Resource Allocation
• A market system, with its fully changing prices, ensures that resources go to the uses that consumers value most highly
• Market problems!– Spillover costs (pollution) to consumers– Misinformed consumers
Activity
• Describe what is likely to happen if the government imposes a price ceiling on gas and a price floor on milk
Using the Internet
• Employment data– www.whitehouse.gov/fsbr/esbr/html
• Family income distribution– www.census.gov/hhes/income/histinc/f02.htlm

Project
• PowerPoint OR Essay• How does Demand and Supply impact me?• BE convincing!