wages in uganda - wageindicator in uganda october 2012 wageindicator data report ... dr. godius...
TRANSCRIPT
Wages in Uganda
October 2012
WageIndicator Data Report
WageIndicator survey 2012
MSc Janna Besamusca
University of Amsterdam, AIAS, Netherlands
Dr Kea Tijdens
University of Amsterdam, AIAS, Netherlands
Dr Godius Kahyarara
University of Dar es Salaam, Tanzania
MSc Ernest Ngeh Tingum
University of Dar es Salaam, Tanzania
About WageIndicator Foundation - www.wageindicator.org The WageIndicator concept is owned by the independent, non-profit WageIndicator Foundation, established in 2003. Its Supervisory Board is chaired by the University of Amsterdam/Amsterdam Institute of Advanced labour Studies, the Dutch Confederation of Trade Unions (FNV) and Monster career site. The Foundation aims for transparency of the labour market by sharing and comparing wage data and labour conditions information. The Foundation operates national websites in some 70 countries. The websites have a so called 3 pillar structure: for wages, for labour law and minimum wages, and for vacancies and education related information. In more than 20 countries the national WageIndicator websites are supported with offline actions like face-to-face surveys, fact finding debates and media campaigns.
WageIndicator Foundation operates globally through a network of associated, yet independent regional and national partner organizations like universities, media houses, trade unions and employers organizations, and self-employed specialists for legal, internet, media issues, with whom the Foundation engages in long lasting relationships. WageIndicator Foundation has offices in Amsterdam (HQ), Ahmedabad, Bratislava, Buenos Aires, Cape Town, Maputo and Minsk.
Address: WageIndicator Foundation, Plantage Muidergracht 12, 1018TV Amsterdam, The Netherlands, [email protected]
About University of Dar es Salaam/Economics Department - www.udsm.ac.tz
The University of Dar es Salaam is the oldest and biggest public university in Tanzania. It is situated on the western side of the city of Dar es Salaam. It was established on 1st July 1970, through parliament act and all the enabling legal instruments of the constituent colleges. Prior to 1970, the university college, Dar es Salaam had started on 1st July 1961 as an affiliate college of the University of London. It had only one faculty- the faculty of Law, with 14 students. In 1963 it became a constituent college of the university of East Africa together with Makerere University College in Uganda and Nairobi University College in Kenya. Since 1961, the University of Dar es Salaam has grown in terms of student intake, academic units and academic programmes. Dr. Godius Kahyarara (economist) is a senior lecturer of economics in the Department of Economics. In 2008, he cooperated with the ILO in Geneva for a survey about working conditions in Tanzania. He is also involved in the World Bank evaluation projects for the Ministry of Natural Resources and Tourism in Tanzania. Currently he is involved in the WageIndicator face-to-face surveys in Tanzania and Uganda, part of the so called Enabling Social Dialogue project in Ghana, Kenya, Tanzania, Uganda in which employers- and trade union organisations cooperate. Ernest Ngeh Tingum (economist) is a PhD candidate and is responsible for the WageIndicator face-to-face surveys in Francophone Africa. Check sites like Mywage.org/Tanzania, or Africapay.org/Tanzania.
About University of Amsterdam/Amsterdam Institute for Advanced Labour Studies - www.uva-aias.net
The University of Amsterdam is a 350-years old research university. Its Amsterdam Institute for Advanced Labour Studies (AIAS) is an interdisciplinary research institute focusing on labour issues, particularly industrial relations, organization of work, working conditions, wage setting, labour- market inequalities, employment and labour market governance. AIAS maintains a large portfolio of internationally funded research projects and international data bases and data collections. Since 2003, AIAS chairs the Supervisory Board of the Wage Indicator Foundation. Kea Tijdens (sociologist) is a Research Coordinator at AIAS and a professor of sociology at Erasmus University Rotterdam. She is the scientific coordinator of the WageIndicator web-survey on work and wages. She has analyzed the data concerning the wage ranking of health care occupations in 20 countries, the impact of short-time arrangements in Germany and the Netherlands, and the relationship of collective bargaining coverage and wage brackets. Janna Besamusca is a PhD candidate at the University of Amsterdam. She has conducted research into working conditions and unionism in low wage sectors and is now studying the effect of country contexts on the position of women in the labour market worldwide.
Special thanks to
Funding partners: FNV Mondiaal, Dutch Employers Cooperation Programme (DECP). Project partners: National Organisation of Trade Unions (NOTU), Federation of Uganda Employers - FUE, University of Dar es Salaam, Team members: Godius Kahyarara, Tomáš Mamrilla, Janna Besamusca, Douglas Opio, Paulien Osse, Kea Tijdens, Sanne van Zijl.
More information: Mywage.org/Uganda, Africapay.org/Uganda, WageIndicator.org.
Executive summary This WageIndicator Data Report presents the results of the face-to-face WageIndicator survey in Uganda, conducted between the 15th of May and 12th of June 2012. In total 1306 persons from all administrative regions were interviewed; 51% were men and 46% were under 30 years old. The workers in the survey live in households with on average 4 members, half of the people live with children and partners. On a scale from 1 (low) to 10 (high), less than half of the respondents (43%) rate their satisfaction with life a six or higher and only 13% score an 8 or higher. On average, the interviewees score a 5.
Nearly half of the workers had certificates from secondary education (48%). Five per cent of workers followed no formal education, 14% stopped at primary education, 16% have a college education and 17% a university degree. On average, respondents worked for 10 years. Half the people in the sample work in an organization with 10 or fewer employees (51%). The average working week of respondents is almost 60 hours and they work six days per week. Two in ten workers regularly work shifts, 51% work evenings, seven in ten workers report working Saturdays, while four in ten work Sundays.
The biggest group of interviewees worked in trade, transport and hospitality (32%). Just over a quarter (26%) worked in the public sector, health care and education and just a little fewer (24%) in agriculture, manufacturing and construction. The remaining 18% worked in commercial services. Nearly half of the workers in the sample are employed as managers. Sizeable groups of respondents work in services and sales (14%) and as plant and machine operators (14%).
One in four workers are self-employed (27%), two in ten workers are employees with a permanent contract (22%), 33% have a fixed term contract and 18% have no contract at all. Four in ten workers (39%) state that they are entitled, to social security. Some 10% of workers state that they have no agreed working hours, the remaining group has agreed working hours, either in writing or verbally (no 10%, in writing 53%, verbally agreed 37%). One third get their wages transferred to a bank account, two thirds get them cash in hand. Up to 35% of workers are in what can be qualified as very informal jobs, without social security, agreed hours or contracts, whereas 15% are in the very formal jobs.
The median net hourly wage of the total sample is 1121 Ugandan Shilling (UGX). Workers in firms with less than ten employees, earn a lot less than employees of bigger firms. The analysis also shows that the more informal a jobs is, the lower the net hourly wages. Those on the lowest end of the informality scale earn only 894 UGX per hour, whereas those in the highest end earn wages far above that (median is 1617 UGX). Employees with permanent contracts have by far the highest earnings (1529 UGX), whereas workers without a labour contract (751 UGX) have the lowest earnings. Median wages increase with every level of education. Payoffs are small for the first levels of education and increase as the level gets higher. Workers without formal education earn on average 546 Shilling, whereas those with university education earn 2383 UGX.
Managers have the highest median wages (1600 UGX), followed by clerical support workers (1042 UGX) and plant and machine operators (925 UGX). The lowest paid workers are agricultural workers (443 UGX), followed by technicians and associate professionals (577 Shilling) and service and sales workers (589 Shilling). Men earn significantly more than women.
The result of the analysis shows that 77% of the sample is paid on or above the poverty line of 403 Shilling per hour (or 1.25 US Dollars per day), whereas 23% is paid below the poverty line. Only 62% of informal workers are paid above the poverty line compared to 97% of the most formal workers. Women are less often paid above the poverty line than men (75% versus 78%). Workers under 30 years are most vulnerable: 71% is paid on or above the poverty line, compared to 87% of workers above 50 years old. Workers in very small firms are least often paid above the poverty line (67%), compared to 91% of workers in firms employing between 11 and 50 people. Workers without a contract are the single most vulnerable group, only just over half (55%) are paid more than the poverty line. Two third of workers with primary or lower secondary education are paid on or above the poverty line, compared to 97% and 95% of workers who finished tertiary education respectively. Nine in ten managers are paid above the poverty line and almost as many clerical support workers (89%). In contract, less than half (49%) of the technicians and associate professionals earn more than the poverty line for one person, and just a little more (58%) service and sales workers do. Workers in trade, transport and hospitality are most at risk of poverty (30% paid below the poverty line). Public sector workers are best of, 92% of them earning a wage above the poverty line.
Table of contents
Executive summary
1 Introducing the survey 1 Aim of the survey .............................................................................................................. 1 The questionnaire .............................................................................................................. 1 Sampling and fieldwork ...................................................................................................... 1 Weighting ......................................................................................................................... 2
2 Socio-demographic characteristics 3 Regions ............................................................................................................................ 3 Age and gender ................................................................................................................. 3 Household composition ....................................................................................................... 4 Living with partner and children .......................................................................................... 4
3 Employment characteristics 5 Labour force ..................................................................................................................... 5 Status in employment and labour contract ............................................................................ 5 Employment by educational category ................................................................................... 6 Years of work experience .................................................................................................... 7 Firm size .......................................................................................................................... 8 Employment by occupational category ................................................................................. 8 Employment by industry ..................................................................................................... 9
4 Remuneration 10 Wage levels .................................................................................................................... 10 Wages below the poverty line ........................................................................................... 11 Bargaining coverage ........................................................................................................ 13 Participation in schemes and receiving allowances ............................................................... 13 Wages on time and cash in hand ....................................................................................... 14
5 Working hours 15 Working hours agreed ...................................................................................................... 15 Usual working hours ........................................................................................................ 15 Shifts or irregular hours ................................................................................................... 16 Average working days per week ........................................................................................ 17
6 Satisfaction with life-as-a-whole 18
Appendix 1 List of occupational titles 19
Appendix 2 Regressions 20
Table of Graphs
Graph 1 Distribution of respondents and total population (2012) across regions .......................... 3 Graph 2 Percentages interviewees according to age and gender ................................................ 3 Graph 3 Distribution over household size, break down by age group, gender and total ................. 4 Graph 4 Distribution over household composition, break down by age group, gender and total ..... 4 Graph 5 Distribution over status in employment, break down by entitlement to social security,
agreed working hours, wage by bank or in cash and total ............................................ 5 Graph 6 Distribution over the informality-index, breakdown by gender, age and total .................. 6 Graph 7 Percentage of workers according to education, by gender and total ............................... 7 Graph 8 Distribution over years of work experience, breakdown by employment status,
gender and total ..................................................................................................... 7 Graph 9 Distribution over firm size, break down by employment status, education and total ......... 8 Graph 10 Percentage interviewees according to occupational category, by gender and total ........... 8 Graph 11 Percentage interviewees according to industry, by gender and total .............................. 9 Graph 12 Median net hourly wage in Ugandan Shilling (UGX), break down by firm size, informal
work, gender, employment status, education, occupation and total ............................. 10 Graph 13 Distribution over hourly wages in UGX, break down by education, employment,
gender and total ................................................................................................... 11 Graph 14 Percentages of workers paid above the poverty line, by informality index, gender,
age, firm size, employment status, education and total.............................................. 12 Graph 15 Percentage of workers paid above the poverty line, by occupation, sector and total. ...... 12 Graph 16 Percentage of workers covered by a collective agreement and percentage agreeing
with the statement that it is important to be covered, breakdown by firm size and total .................................................................................................................... 13
Graph 17 Percentage of workers participating in a scheme in the past 12 months ....................... 14 Graph 18 Percentages of employees reporting that they received their wage on time and that
they received their wage in cash, by occupational group. ........................................... 14 Graph 19 Percentages of employees with agreed working hours, by employment status and
occupational group. ............................................................................................... 15 Graph 20 Average length of the working week, by employment group and occupational group ..... 16 Graph 21 Percentages of workers reporting to be working in the evenings, shift work or
irregular hours, Saturdays or Sundays, by employment group, gender and total. .......... 16 Graph 22 Average number of working days per week, by employment status, gender, firm size,
occupation, education and total. ............................................................................. 17 Graph 23 Percentage of workers indicating how satisfied they are with their life-as-a-whole. ........ 18 Graph 24 Average satisfaction with life-as-a-whole, breakdown by employment status, gender,
wage, occupational status, educational level and total (mean scores on a scale 1-10).... 18
WageIndicator Data Report October 2012 Uganda – Mywage.org/Uganda 1 | P a g e
1 Introducing the survey
Aim of the survey This WageIndicator Data Report presents the results of the face-to-face WageIndicator survey in Uganda, conducted between the 15th of May and 12th of June 2012. The survey aimed to measure in detail the wages earned by Ugandan workers, including the self-employed. In total 1,306 persons were interviewed. This survey is part of the global WageIndicator survey on work and wages. These surveys are also posted on WageIndicator websites. The continuous, volunteer WageIndicator web-survey is an international comparable survey in the national language(s). The survey contains questions about wages, education, occupation, industry, socio-demographics, and alike.1 Once a WageIndicator survey is created for use on a national WageIndicator website, a paper-based questionnaire for face-to-face interviews can be drafted from the web-survey. These paper-based surveys supplement the web-based surveys in countries with low internet access rates.
The questionnaire The WageIndicator survey was adapted from the global standard questionnaire to the Ugandan setting. Most of the questions were retained without changing the intended purpose. The questionnaire is available in one language, namely English, see Table 1.
Table 1 Number of respondents and language of the survey Number of respondents Per cent English 1,306 100%
Source: WageIndicator face-to-face survey Uganda, 2012, unweighted data
Sampling and fieldwork The sampling and interviewing of the respondents was done by CEDR, a professional interview agency based in Dar-Es-Salam (Tanzania). The interviews were done in rural areas across the country. As a first step, locations in Uganda were selected in order to ensure an even spread across geographical areas. On the basis of a geographical spread, 1300 enterprises were selected at random to do interviews. During the field work the cooperation of interviewees was good and no major problems were encountered. People were interviewed in their work places, their neighbourhoods, in employment agencies, schools and bars. CEDR also took responsibility for the data-entry. The data-entry took place in the WageIndicator web-based data-entry module using a range of validity checks. The interviewers and data-entry typists received a two-week training for the work.
1 See for more information about the survey Tijdens, K.G., S. van Zijl, M. Hughie-Williams, M. van Klaveren,
S. Steinmetz (2010) Codebook and explanatory note on the WageIndicator dataset, a worldwide, continuous, multilingual web-survey on work and wages with paper supplements. Amsterdam: AIAS Working Paper 10-102. www.wageindicator.org/documents/publicationslist/publications-2010/codebook-and-explanatory-note-on-the-wageindicator-dataset.pdf
WageIndicator Data Report October 2012 Uganda – Mywage.org/Uganda 2 | P a g e
Weighting Sampling is critical in reaching a national representative survey. In order to perfect the representativeness, weighting had to be applied. ILO’s Estimates And Projections of the Economically Active Population (EAPEP 6th edition) was used for weighting according to gender and age. Table 2 shows the weights, indicating to what extent the gender/age group in the face-to-face survey was over- or underrepresented in comparison to the labour force estimates. If a weight is smaller than 1, the group is overrepresented. If the weight is larger than 1, the group is underrepresented. In this paper, all graphs and tables are derived from weighted data.
Table 2 Weights for the Uganda survey according to age and gender distribution
Weight N Male 14-29 years 1,11 272
Male 30-39 years 0,58 286
Male 40-80 years 1,32 147
Female 14-29 years 1,05 282
Female 30-39 years 0,70 221
Female 40-80 years 1,95 98
Total 1,0 1306 Source: The weights are based on the labour force estimates for 2012, derived from the Estimates
And Projections Of The Economically Active Population (EAPEP 6th edition) database of the International Labour Organization (ILO).
WageIndicator Data Report October 2012 Uganda – Mywage.org/Uganda 3 | P a g e
2 Socio-demographic characteristics
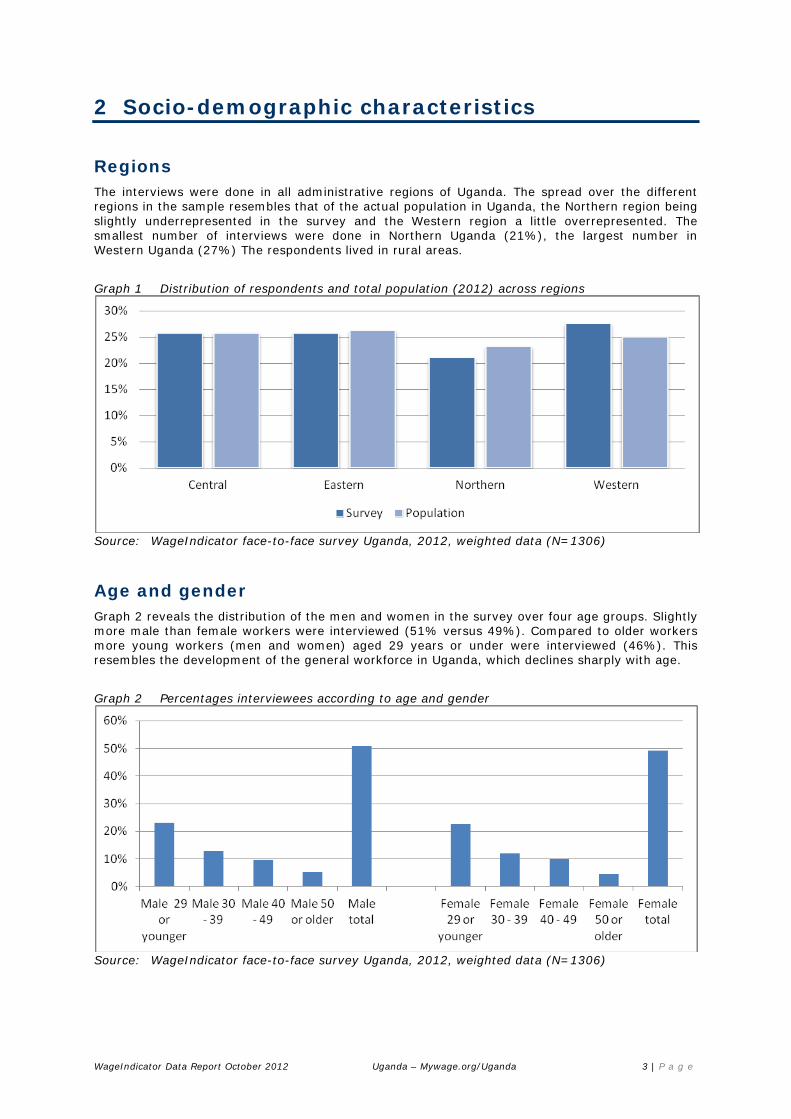
Regions The interviews were done in all administrative regions of Uganda. The spread over the different regions in the sample resembles that of the actual population in Uganda, the Northern region being slightly underrepresented in the survey and the Western region a little overrepresented. The smallest number of interviews were done in Northern Uganda (21%), the largest number in Western Uganda (27%) The respondents lived in rural areas.
Graph 1 Distribution of respondents and total population (2012) across regions
Source: WageIndicator face-to-face survey Uganda, 2012, weighted data (N=1306)
Age and gender Graph 2 reveals the distribution of the men and women in the survey over four age groups. Slightly more male than female workers were interviewed (51% versus 49%). Compared to older workers more young workers (men and women) aged 29 years or under were interviewed (46%). This resembles the development of the general workforce in Uganda, which declines sharply with age.
Graph 2 Percentages interviewees according to age and gender
Source: WageIndicator face-to-face survey Uganda, 2012, weighted data (N=1306)
WageIndicator Data Report October 2012 Uganda – Mywage.org/Uganda 4 | P a g e
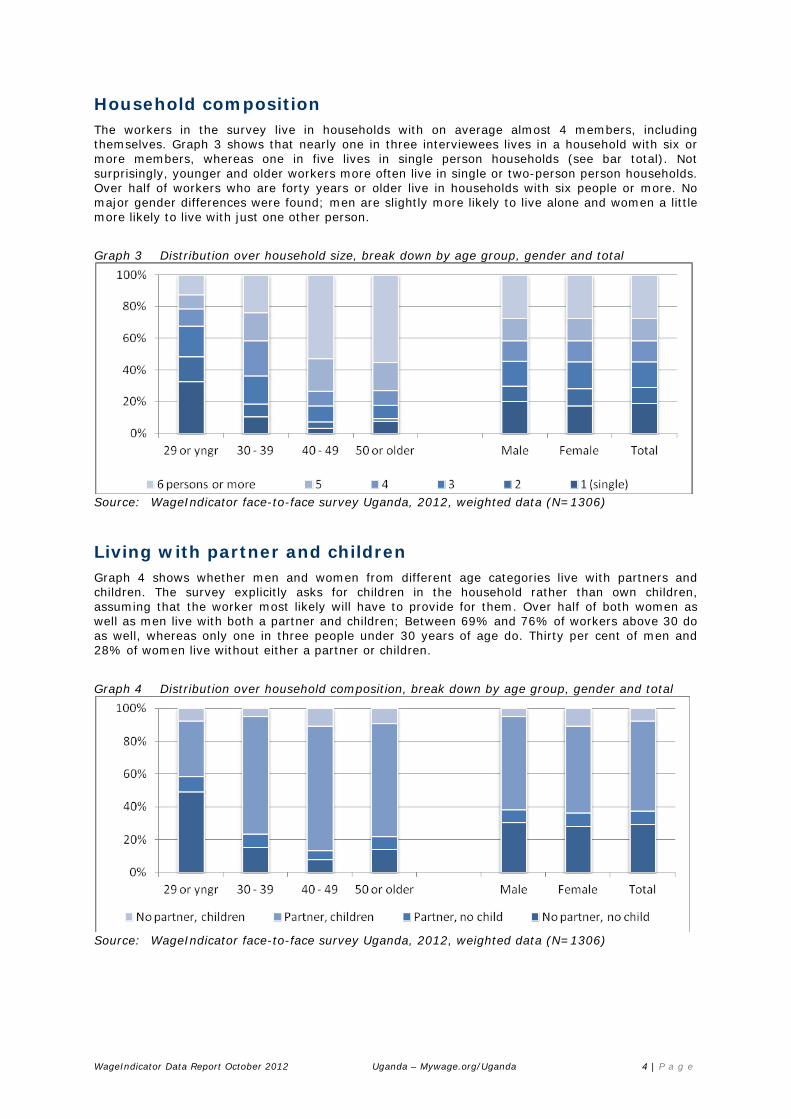
Household composition The workers in the survey live in households with on average almost 4 members, including themselves. Graph 3 shows that nearly one in three interviewees lives in a household with six or more members, whereas one in five lives in single person households (see bar total). Not surprisingly, younger and older workers more often live in single or two-person person households. Over half of workers who are forty years or older live in households with six people or more. No major gender differences were found; men are slightly more likely to live alone and women a little more likely to live with just one other person.
Graph 3 Distribution over household size, break down by age group, gender and total
Source: WageIndicator face-to-face survey Uganda, 2012, weighted data (N=1306)
Living with partner and children Graph 4 shows whether men and women from different age categories live with partners and children. The survey explicitly asks for children in the household rather than own children, assuming that the worker most likely will have to provide for them. Over half of both women as well as men live with both a partner and children; Between 69% and 76% of workers above 30 do as well, whereas only one in three people under 30 years of age do. Thirty per cent of men and 28% of women live without either a partner or children.
Graph 4 Distribution over household composition, break down by age group, gender and total
Source: WageIndicator face-to-face survey Uganda, 2012, weighted data (N=1306)
WageIndicator Data Report October 2012 Uganda – Mywage.org/Uganda 5 | P a g e
3 Employment characteristics
Labour force According to the ILO economically active population estimates and projects, Uganda has an economically active population of just over 14 million people. The labour force participation rate is 79% for men and 76% for women. According to the ministry of finance2, Uganda has 458,106 registered businesses, employing just over two people on average. Over 41% of the labour force works in trade, 14% in hospitality, 8% in manufacturing, 8% in education and 7% in personal services.
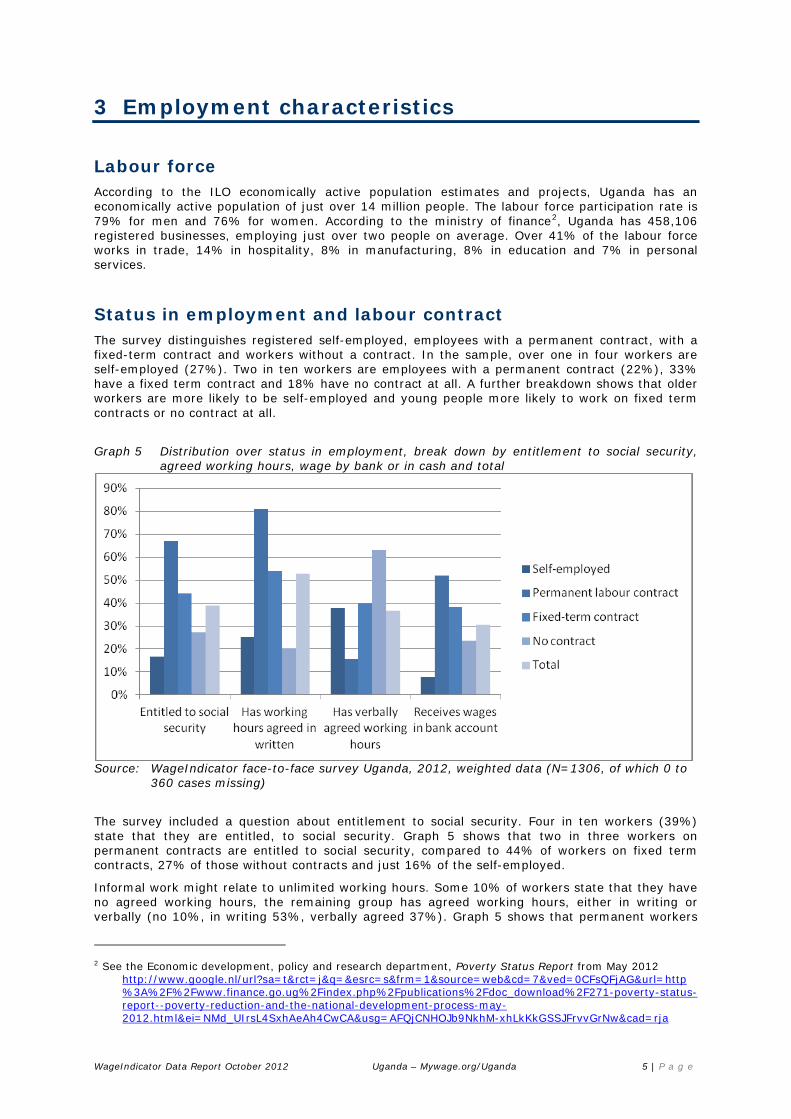
Status in employment and labour contract The survey distinguishes registered self-employed, employees with a permanent contract, with a fixed-term contract and workers without a contract. In the sample, over one in four workers are self-employed (27%). Two in ten workers are employees with a permanent contract (22%), 33% have a fixed term contract and 18% have no contract at all. A further breakdown shows that older workers are more likely to be self-employed and young people more likely to work on fixed term contracts or no contract at all.
Graph 5 Distribution over status in employment, break down by entitlement to social security, agreed working hours, wage by bank or in cash and total
Source: WageIndicator face-to-face survey Uganda, 2012, weighted data (N=1306, of which 0 to
360 cases missing)
The survey included a question about entitlement to social security. Four in ten workers (39%) state that they are entitled, to social security. Graph 5 shows that two in three workers on permanent contracts are entitled to social security, compared to 44% of workers on fixed term contracts, 27% of those without contracts and just 16% of the self-employed.
Informal work might relate to unlimited working hours. Some 10% of workers state that they have no agreed working hours, the remaining group has agreed working hours, either in writing or verbally (no 10%, in writing 53%, verbally agreed 37%). Graph 5 shows that permanent workers
2 See the Economic development, policy and research department, Poverty Status Report from May 2012
http://www.google.nl/url?sa=t&rct=j&q=&esrc=s&frm=1&source=web&cd=7&ved=0CFsQFjAG&url=http%3A%2F%2Fwww.finance.go.ug%2Findex.php%2Fpublications%2Fdoc_download%2F271-poverty-status-report--poverty-reduction-and-the-national-development-process-may-2012.html&ei=NMd_UIrsL4SxhAeAh4CwCA&usg=AFQjCNHOJb9NkhM-xhLkKkGSSJFrvvGrNw&cad=rja
WageIndicator Data Report October 2012 Uganda – Mywage.org/Uganda 6 | P a g e
almost always have working hours agreed in written (81%). Employees on fixed term contracts are still most likely to have working hours agreed in written (54%) rather than verbally (40%), whereas workers without contracts and the self-employed are more likely to have just a verbal agreement about working hours.
One survey question asked if wages were received in a bank account or cash in hand (by bank 31%, in cash 68%). Again, workers on permanent contracts are most likely to receive their wages in a bank account (52%), compared to 38% of fixed term workers, 23% of those without contracts and 8% of self-employed.
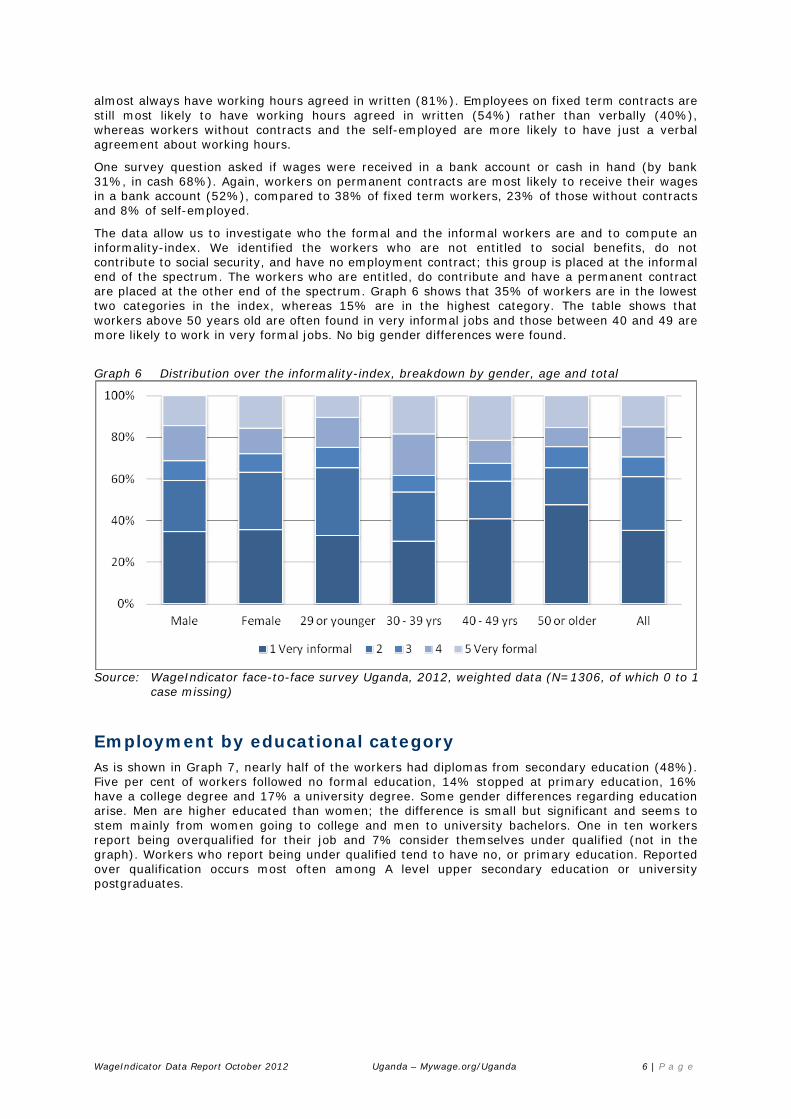
The data allow us to investigate who the formal and the informal workers are and to compute an informality-index. We identified the workers who are not entitled to social benefits, do not contribute to social security, and have no employment contract; this group is placed at the informal end of the spectrum. The workers who are entitled, do contribute and have a permanent contract are placed at the other end of the spectrum. Graph 6 shows that 35% of workers are in the lowest two categories in the index, whereas 15% are in the highest category. The table shows that workers above 50 years old are often found in very informal jobs and those between 40 and 49 are more likely to work in very formal jobs. No big gender differences were found.
Graph 6 Distribution over the informality-index, breakdown by gender, age and total
Source: WageIndicator face-to-face survey Uganda, 2012, weighted data (N=1306, of which 0 to 1
case missing)
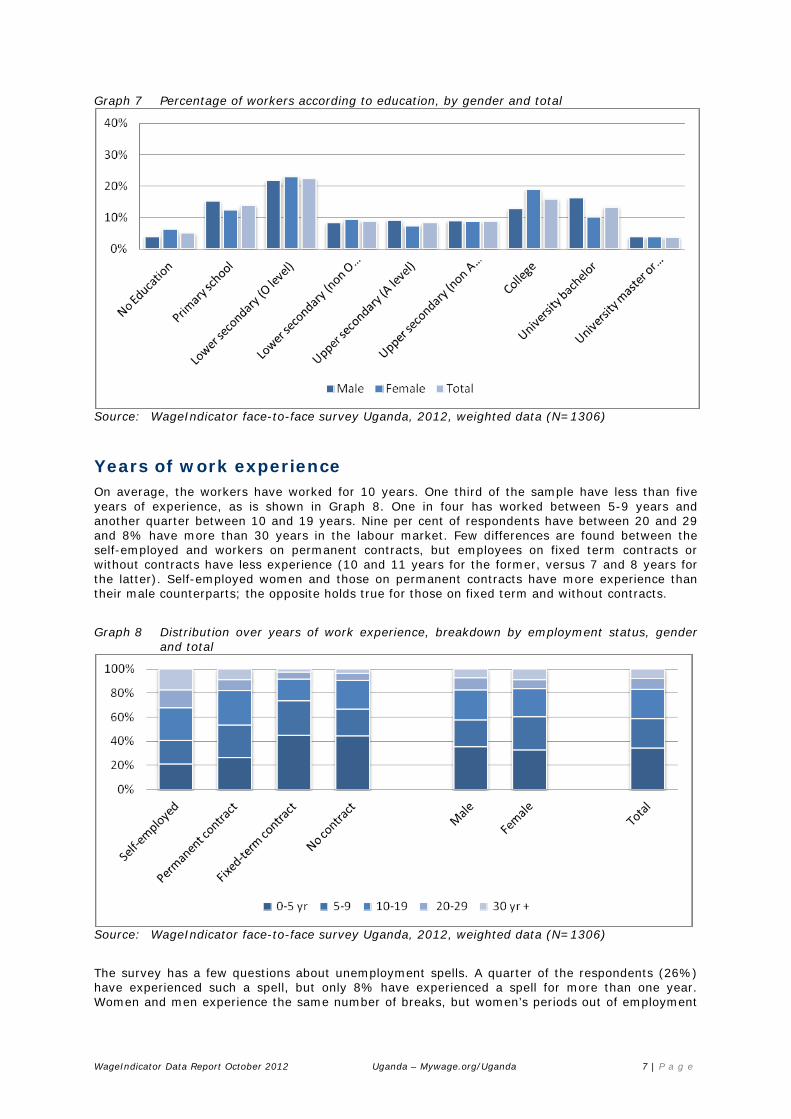
Employment by educational category As is shown in Graph 7, nearly half of the workers had diplomas from secondary education (48%). Five per cent of workers followed no formal education, 14% stopped at primary education, 16% have a college degree and 17% a university degree. Some gender differences regarding education arise. Men are higher educated than women; the difference is small but significant and seems to stem mainly from women going to college and men to university bachelors. One in ten workers report being overqualified for their job and 7% consider themselves under qualified (not in the graph). Workers who report being under qualified tend to have no, or primary education. Reported over qualification occurs most often among A level upper secondary education or university postgraduates.
WageIndicator Data Report October 2012 Uganda – Mywage.org/Uganda 7 | P a g e
Graph 7 Percentage of workers according to education, by gender and total
Source: WageIndicator face-to-face survey Uganda, 2012, weighted data (N=1306)
Years of work experience On average, the workers have worked for 10 years. One third of the sample have less than five years of experience, as is shown in Graph 8. One in four has worked between 5-9 years and another quarter between 10 and 19 years. Nine per cent of respondents have between 20 and 29 and 8% have more than 30 years in the labour market. Few differences are found between the self-employed and workers on permanent contracts, but employees on fixed term contracts or without contracts have less experience (10 and 11 years for the former, versus 7 and 8 years for the latter). Self-employed women and those on permanent contracts have more experience than their male counterparts; the opposite holds true for those on fixed term and without contracts.
Graph 8 Distribution over years of work experience, breakdown by employment status, gender and total
Source: WageIndicator face-to-face survey Uganda, 2012, weighted data (N=1306)
The survey has a few questions about unemployment spells. A quarter of the respondents (26%) have experienced such a spell, but only 8% have experienced a spell for more than one year. Women and men experience the same number of breaks, but women’s periods out of employment
WageIndicator Data Report October 2012 Uganda – Mywage.org/Uganda 8 | P a g e
are of longer duration. No questions were asked about the reasons for the spell, but most likely these are due to unemployment.
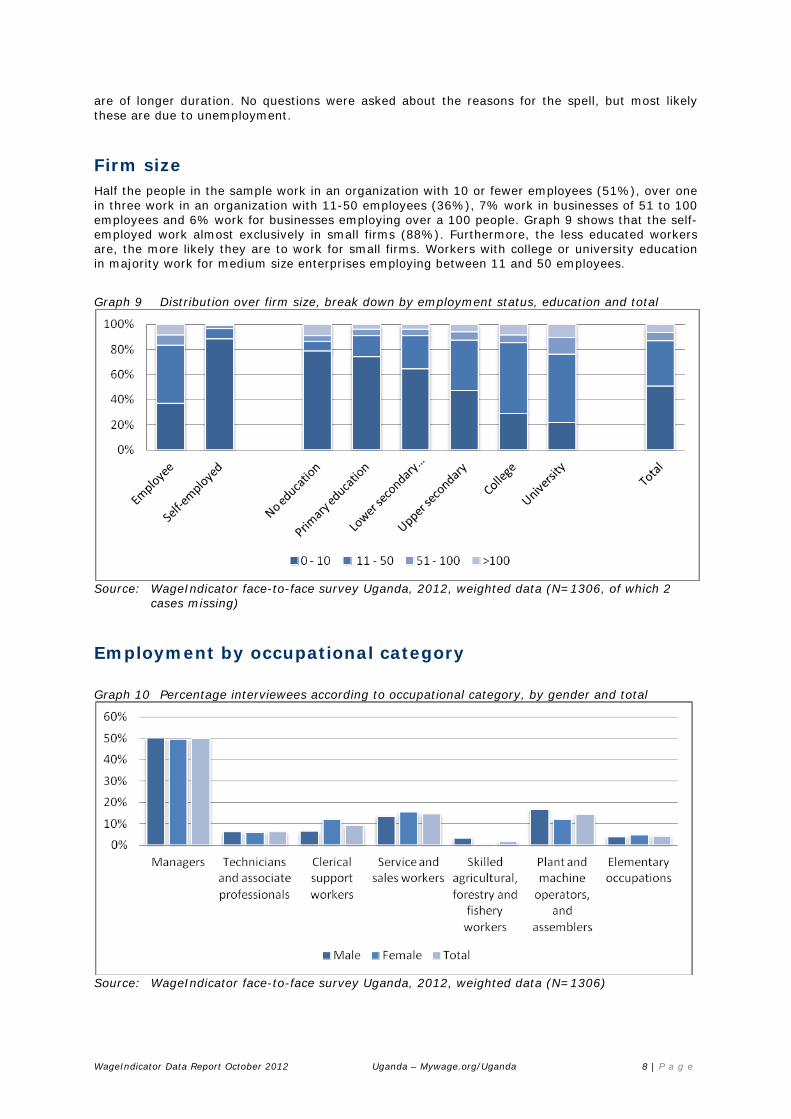
Firm size Half the people in the sample work in an organization with 10 or fewer employees (51%), over one in three work in an organization with 11-50 employees (36%), 7% work in businesses of 51 to 100 employees and 6% work for businesses employing over a 100 people. Graph 9 shows that the self-employed work almost exclusively in small firms (88%). Furthermore, the less educated workers are, the more likely they are to work for small firms. Workers with college or university education in majority work for medium size enterprises employing between 11 and 50 employees.
Graph 9 Distribution over firm size, break down by employment status, education and total
Source: WageIndicator face-to-face survey Uganda, 2012, weighted data (N=1306, of which 2
cases missing)
Employment by occupational category
Graph 10 Percentage interviewees according to occupational category, by gender and total
Source: WageIndicator face-to-face survey Uganda, 2012, weighted data (N=1306)
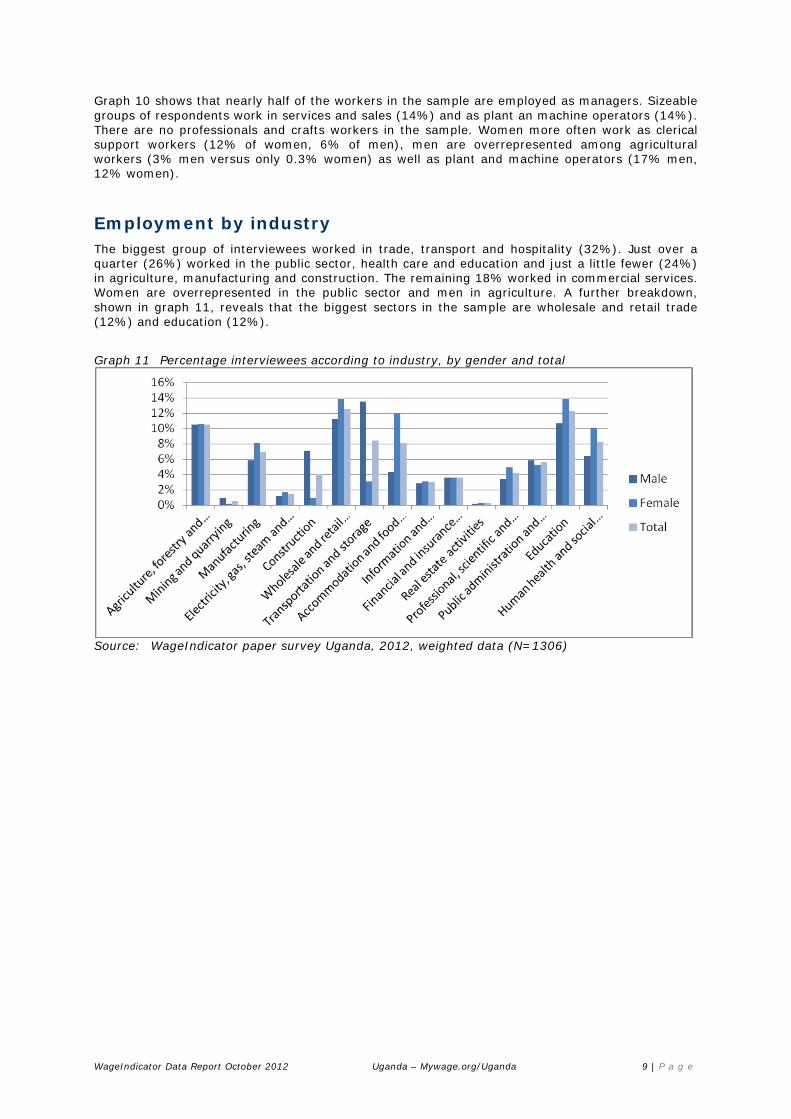
WageIndicator Data Report October 2012 Uganda – Mywage.org/Uganda 9 | P a g e
Graph 10 shows that nearly half of the workers in the sample are employed as managers. Sizeable groups of respondents work in services and sales (14%) and as plant an machine operators (14%). There are no professionals and crafts workers in the sample. Women more often work as clerical support workers (12% of women, 6% of men), men are overrepresented among agricultural workers (3% men versus only 0.3% women) as well as plant and machine operators (17% men, 12% women).
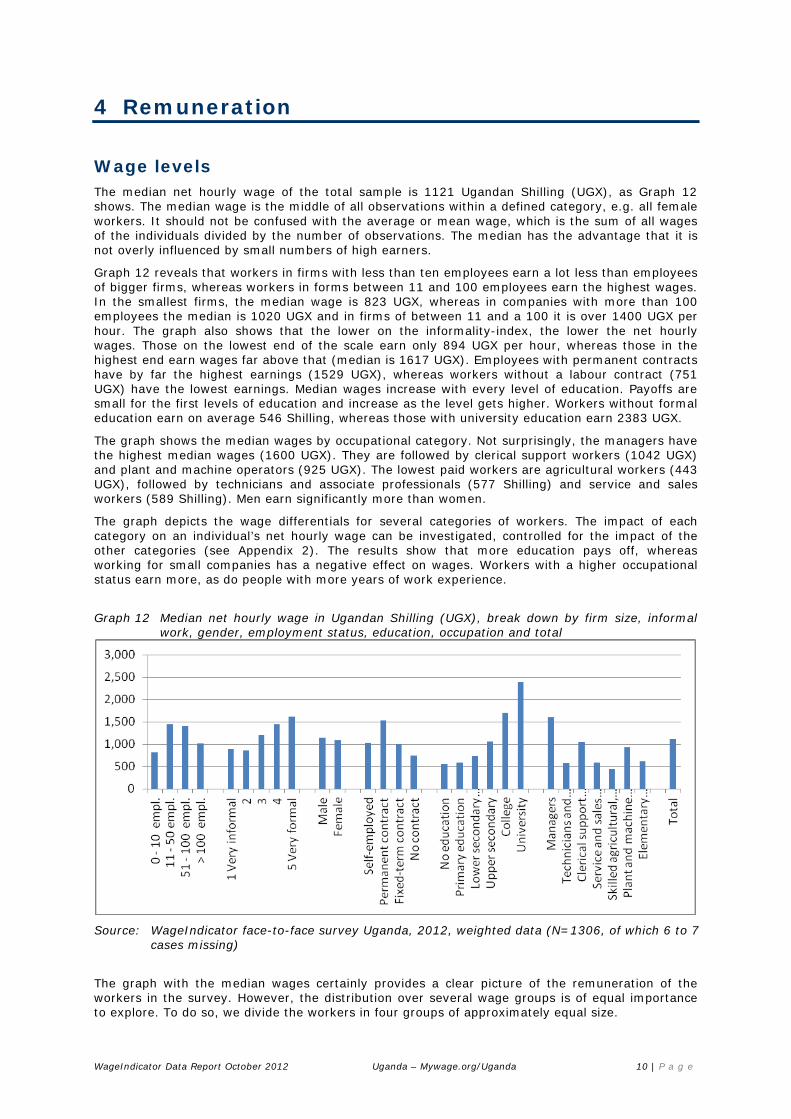
Employment by industry The biggest group of interviewees worked in trade, transport and hospitality (32%). Just over a quarter (26%) worked in the public sector, health care and education and just a little fewer (24%) in agriculture, manufacturing and construction. The remaining 18% worked in commercial services. Women are overrepresented in the public sector and men in agriculture. A further breakdown, shown in graph 11, reveals that the biggest sectors in the sample are wholesale and retail trade (12%) and education (12%).
Graph 11 Percentage interviewees according to industry, by gender and total
Source: WageIndicator paper survey Uganda, 2012, weighted data (N=1306)
WageIndicator Data Report October 2012 Uganda – Mywage.org/Uganda 10 | P a g e
4 Remuneration
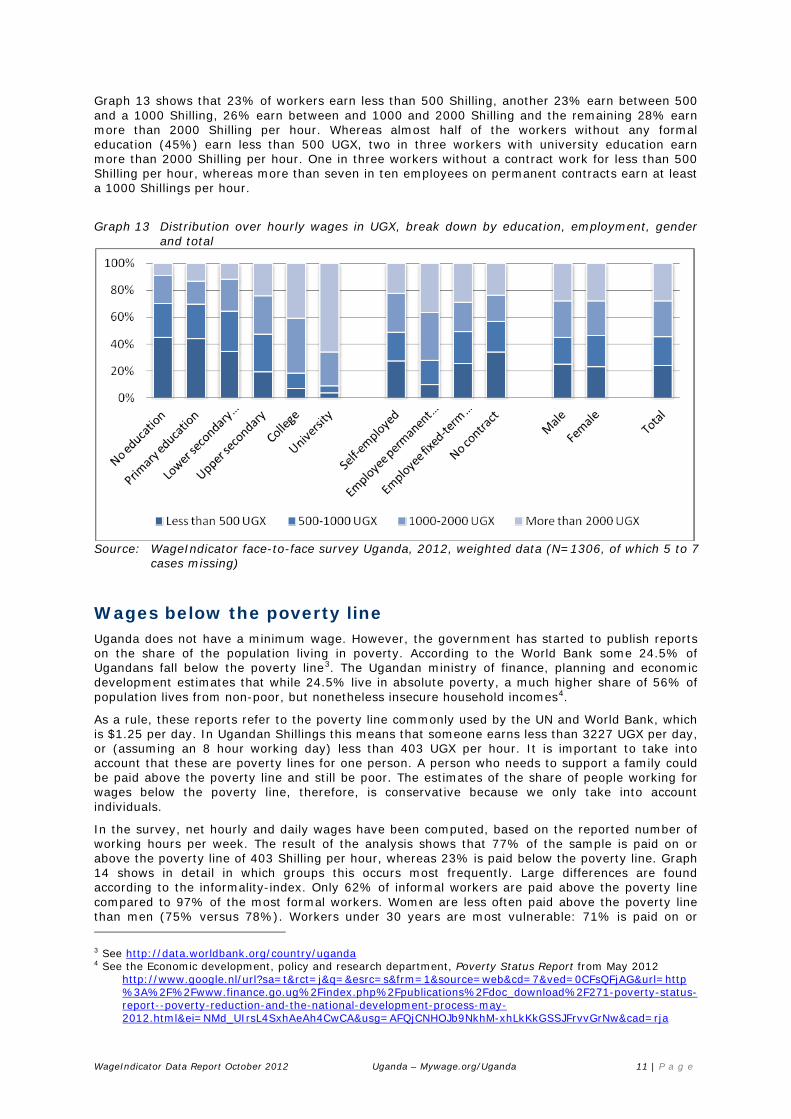
Wage levels The median net hourly wage of the total sample is 1121 Ugandan Shilling (UGX), as Graph 12 shows. The median wage is the middle of all observations within a defined category, e.g. all female workers. It should not be confused with the average or mean wage, which is the sum of all wages of the individuals divided by the number of observations. The median has the advantage that it is not overly influenced by small numbers of high earners.
Graph 12 reveals that workers in firms with less than ten employees earn a lot less than employees of bigger firms, whereas workers in forms between 11 and 100 employees earn the highest wages. In the smallest firms, the median wage is 823 UGX, whereas in companies with more than 100 employees the median is 1020 UGX and in firms of between 11 and a 100 it is over 1400 UGX per hour. The graph also shows that the lower on the informality-index, the lower the net hourly wages. Those on the lowest end of the scale earn only 894 UGX per hour, whereas those in the highest end earn wages far above that (median is 1617 UGX). Employees with permanent contracts have by far the highest earnings (1529 UGX), whereas workers without a labour contract (751 UGX) have the lowest earnings. Median wages increase with every level of education. Payoffs are small for the first levels of education and increase as the level gets higher. Workers without formal education earn on average 546 Shilling, whereas those with university education earn 2383 UGX.
The graph shows the median wages by occupational category. Not surprisingly, the managers have the highest median wages (1600 UGX). They are followed by clerical support workers (1042 UGX) and plant and machine operators (925 UGX). The lowest paid workers are agricultural workers (443 UGX), followed by technicians and associate professionals (577 Shilling) and service and sales workers (589 Shilling). Men earn significantly more than women.
The graph depicts the wage differentials for several categories of workers. The impact of each category on an individual’s net hourly wage can be investigated, controlled for the impact of the other categories (see Appendix 2). The results show that more education pays off, whereas working for small companies has a negative effect on wages. Workers with a higher occupational status earn more, as do people with more years of work experience.
Graph 12 Median net hourly wage in Ugandan Shilling (UGX), break down by firm size, informal work, gender, employment status, education, occupation and total
Source: WageIndicator face-to-face survey Uganda, 2012, weighted data (N=1306, of which 6 to 7 cases missing)
The graph with the median wages certainly provides a clear picture of the remuneration of the workers in the survey. However, the distribution over several wage groups is of equal importance to explore. To do so, we divide the workers in four groups of approximately equal size.
WageIndicator Data Report October 2012 Uganda – Mywage.org/Uganda 11 | P a g e
Graph 13 shows that 23% of workers earn less than 500 Shilling, another 23% earn between 500 and a 1000 Shilling, 26% earn between and 1000 and 2000 Shilling and the remaining 28% earn more than 2000 Shilling per hour. Whereas almost half of the workers without any formal education (45%) earn less than 500 UGX, two in three workers with university education earn more than 2000 Shilling per hour. One in three workers without a contract work for less than 500 Shilling per hour, whereas more than seven in ten employees on permanent contracts earn at least a 1000 Shillings per hour.
Graph 13 Distribution over hourly wages in UGX, break down by education, employment, gender and total
Source: WageIndicator face-to-face survey Uganda, 2012, weighted data (N=1306, of which 5 to 7
cases missing)
Wages below the poverty line Uganda does not have a minimum wage. However, the government has started to publish reports on the share of the population living in poverty. According to the World Bank some 24.5% of Ugandans fall below the poverty line3. The Ugandan ministry of finance, planning and economic development estimates that while 24.5% live in absolute poverty, a much higher share of 56% of population lives from non-poor, but nonetheless insecure household incomes4.
As a rule, these reports refer to the poverty line commonly used by the UN and World Bank, which is $1.25 per day. In Ugandan Shillings this means that someone earns less than 3227 UGX per day, or (assuming an 8 hour working day) less than 403 UGX per hour. It is important to take into account that these are poverty lines for one person. A person who needs to support a family could be paid above the poverty line and still be poor. The estimates of the share of people working for wages below the poverty line, therefore, is conservative because we only take into account individuals.
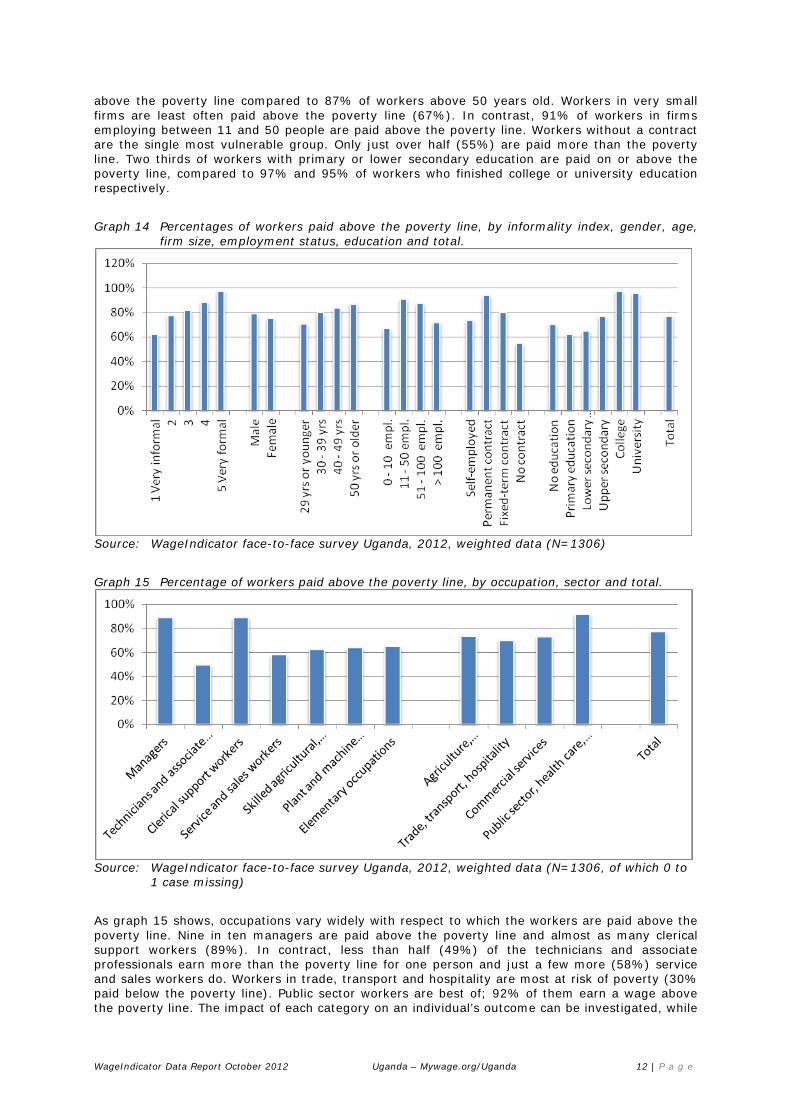
In the survey, net hourly and daily wages have been computed, based on the reported number of working hours per week. The result of the analysis shows that 77% of the sample is paid on or above the poverty line of 403 Shilling per hour, whereas 23% is paid below the poverty line. Graph 14 shows in detail in which groups this occurs most frequently. Large differences are found according to the informality-index. Only 62% of informal workers are paid above the poverty line compared to 97% of the most formal workers. Women are less often paid above the poverty line than men (75% versus 78%). Workers under 30 years are most vulnerable: 71% is paid on or 3 See http://data.worldbank.org/country/uganda 4 See the Economic development, policy and research department, Poverty Status Report from May 2012
http://www.google.nl/url?sa=t&rct=j&q=&esrc=s&frm=1&source=web&cd=7&ved=0CFsQFjAG&url=http%3A%2F%2Fwww.finance.go.ug%2Findex.php%2Fpublications%2Fdoc_download%2F271-poverty-status-report--poverty-reduction-and-the-national-development-process-may-2012.html&ei=NMd_UIrsL4SxhAeAh4CwCA&usg=AFQjCNHOJb9NkhM-xhLkKkGSSJFrvvGrNw&cad=rja
WageIndicator Data Report October 2012 Uganda – Mywage.org/Uganda 12 | P a g e
above the poverty line compared to 87% of workers above 50 years old. Workers in very small firms are least often paid above the poverty line (67%). In contrast, 91% of workers in firms employing between 11 and 50 people are paid above the poverty line. Workers without a contract are the single most vulnerable group. Only just over half (55%) are paid more than the poverty line. Two thirds of workers with primary or lower secondary education are paid on or above the poverty line, compared to 97% and 95% of workers who finished college or university education respectively.
Graph 14 Percentages of workers paid above the poverty line, by informality index, gender, age, firm size, employment status, education and total.
Source: WageIndicator face-to-face survey Uganda, 2012, weighted data (N=1306)
Graph 15 Percentage of workers paid above the poverty line, by occupation, sector and total.
Source: WageIndicator face-to-face survey Uganda, 2012, weighted data (N=1306, of which 0 to
1 case missing)
As graph 15 shows, occupations vary widely with respect to which the workers are paid above the poverty line. Nine in ten managers are paid above the poverty line and almost as many clerical support workers (89%). In contract, less than half (49%) of the technicians and associate professionals earn more than the poverty line for one person and just a few more (58%) service and sales workers do. Workers in trade, transport and hospitality are most at risk of poverty (30% paid below the poverty line). Public sector workers are best of; 92% of them earn a wage above the poverty line. The impact of each category on an individual’s outcome can be investigated, while

WageIndicator Data Report October 2012 Uganda – Mywage.org/Uganda 13 | P a g e
controlled for the impact of the other categories (see Appendix 2). This shows that particularly the educational level, age and occupational status affect the likelihood of being paid on or above poverty line.
Bargaining coverage Collective agreements are a main instrument for wage setting. This raises the question to what extent the workers in the survey are covered by an agreement. Just less than half (47%) of respondents are covered (see graph 16). This ranges from 34% of works in companies of less than 10 people and 35% of workers without a contract, to six in ten workers in companies employing between 11 and 50 workers or 68% of employees with permanent contracts. The Appendix holds an analysis which workers are covered by an agreement if controlled for other characteristics. It shows that more highly educated workers, employees on permanent contracts and women are more likely to be covered, whereas those working for small firms are less likely.
The survey has a question asking whether workers think that it is important to be covered by a collective agreement. Whereas 47% of workers are covered, 81% wish to be covered. This percentage is highest for employees on permanent contracts (92%) in big firms (88%) and lowest for those without contract (79%) and in small firms (73%).
Graph 16 Percentage of workers covered by a collective agreement and percentage agreeing with the statement that it is important to be covered, breakdown by firm size and total
Source: WageIndicator face-to-face survey Uganda, 2012, weighted data (N=1316, of which 132 to
215 cases missing)
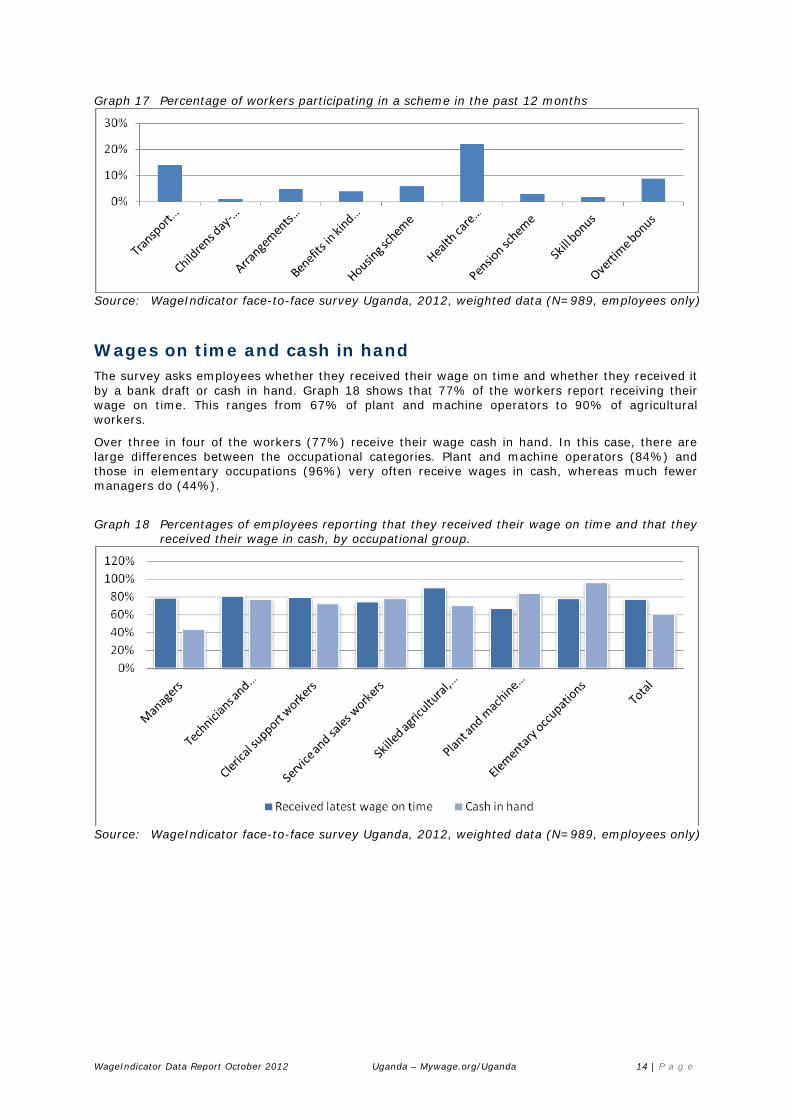
Participation in schemes and receiving allowances The survey has several questions about participation in schemes and bonuses. These questions are asked to both the employees and the self-employed. Graph 17 shows that participation is generally low and that reimbursements of transport costs (14%), overtime bonuses (9%) and health care schemes (22%) are most common.
WageIndicator Data Report October 2012 Uganda – Mywage.org/Uganda 14 | P a g e
Graph 17 Percentage of workers participating in a scheme in the past 12 months
Source: WageIndicator face-to-face survey Uganda, 2012, weighted data (N=989, employees only)
Wages on time and cash in hand The survey asks employees whether they received their wage on time and whether they received it by a bank draft or cash in hand. Graph 18 shows that 77% of the workers report receiving their wage on time. This ranges from 67% of plant and machine operators to 90% of agricultural workers.
Over three in four of the workers (77%) receive their wage cash in hand. In this case, there are large differences between the occupational categories. Plant and machine operators (84%) and those in elementary occupations (96%) very often receive wages in cash, whereas much fewer managers do (44%).
Graph 18 Percentages of employees reporting that they received their wage on time and that they received their wage in cash, by occupational group.
Source: WageIndicator face-to-face survey Uganda, 2012, weighted data (N=989, employees only)
WageIndicator Data Report October 2012 Uganda – Mywage.org/Uganda 15 | P a g e
5 Working hours
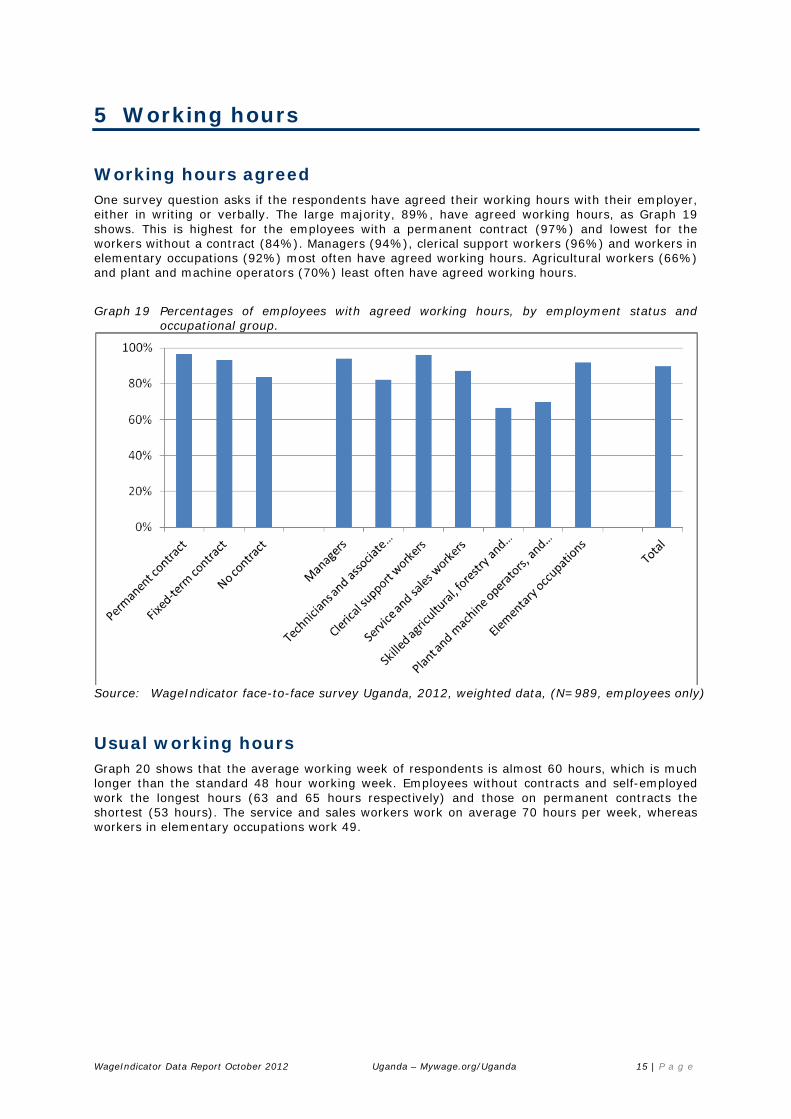
Working hours agreed One survey question asks if the respondents have agreed their working hours with their employer, either in writing or verbally. The large majority, 89%, have agreed working hours, as Graph 19 shows. This is highest for the employees with a permanent contract (97%) and lowest for the workers without a contract (84%). Managers (94%), clerical support workers (96%) and workers in elementary occupations (92%) most often have agreed working hours. Agricultural workers (66%) and plant and machine operators (70%) least often have agreed working hours.
Graph 19 Percentages of employees with agreed working hours, by employment status and occupational group.
Source: WageIndicator face-to-face survey Uganda, 2012, weighted data, (N=989, employees only)
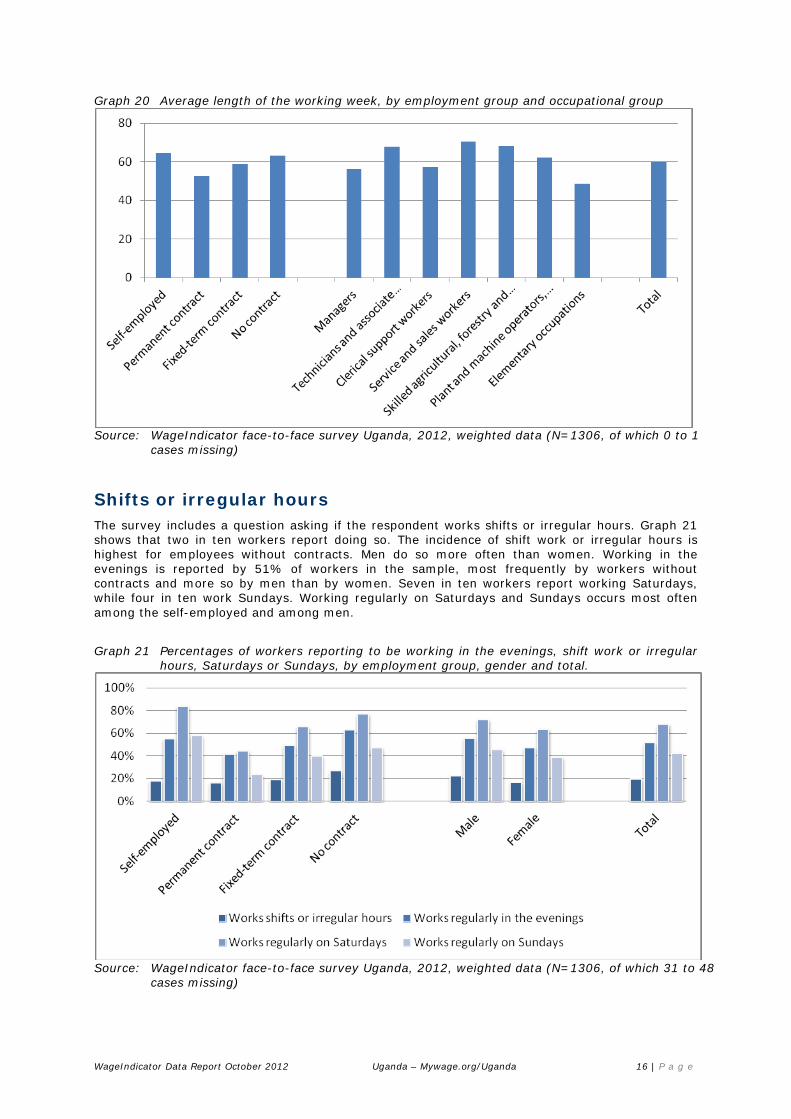
Usual working hours Graph 20 shows that the average working week of respondents is almost 60 hours, which is much longer than the standard 48 hour working week. Employees without contracts and self-employed work the longest hours (63 and 65 hours respectively) and those on permanent contracts the shortest (53 hours). The service and sales workers work on average 70 hours per week, whereas workers in elementary occupations work 49.
WageIndicator Data Report October 2012 Uganda – Mywage.org/Uganda 16 | P a g e
Graph 20 Average length of the working week, by employment group and occupational group
Source: WageIndicator face-to-face survey Uganda, 2012, weighted data (N=1306, of which 0 to 1
cases missing)
Shifts or irregular hours The survey includes a question asking if the respondent works shifts or irregular hours. Graph 21 shows that two in ten workers report doing so. The incidence of shift work or irregular hours is highest for employees without contracts. Men do so more often than women. Working in the evenings is reported by 51% of workers in the sample, most frequently by workers without contracts and more so by men than by women. Seven in ten workers report working Saturdays, while four in ten work Sundays. Working regularly on Saturdays and Sundays occurs most often among the self-employed and among men.
Graph 21 Percentages of workers reporting to be working in the evenings, shift work or irregular hours, Saturdays or Sundays, by employment group, gender and total.
Source: WageIndicator face-to-face survey Uganda, 2012, weighted data (N=1306, of which 31 to 48
cases missing)
WageIndicator Data Report October 2012 Uganda – Mywage.org/Uganda 17 | P a g e
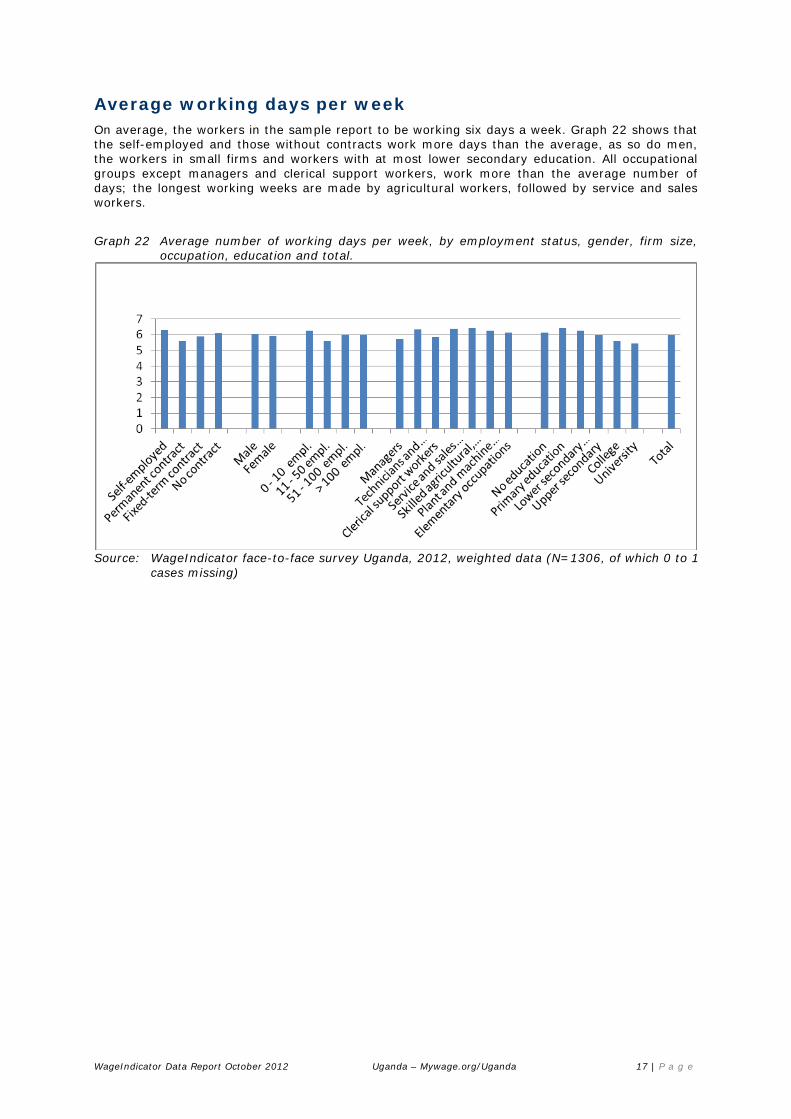
Average working days per week On average, the workers in the sample report to be working six days a week. Graph 22 shows that the self-employed and those without contracts work more days than the average, as so do men, the workers in small firms and workers with at most lower secondary education. All occupational groups except managers and clerical support workers, work more than the average number of days; the longest working weeks are made by agricultural workers, followed by service and sales workers.
Graph 22 Average number of working days per week, by employment status, gender, firm size, occupation, education and total.
Source: WageIndicator face-to-face survey Uganda, 2012, weighted data (N=1306, of which 0 to 1
cases missing)
WageIndicator Data Report October 2012 Uganda – Mywage.org/Uganda 18 | P a g e
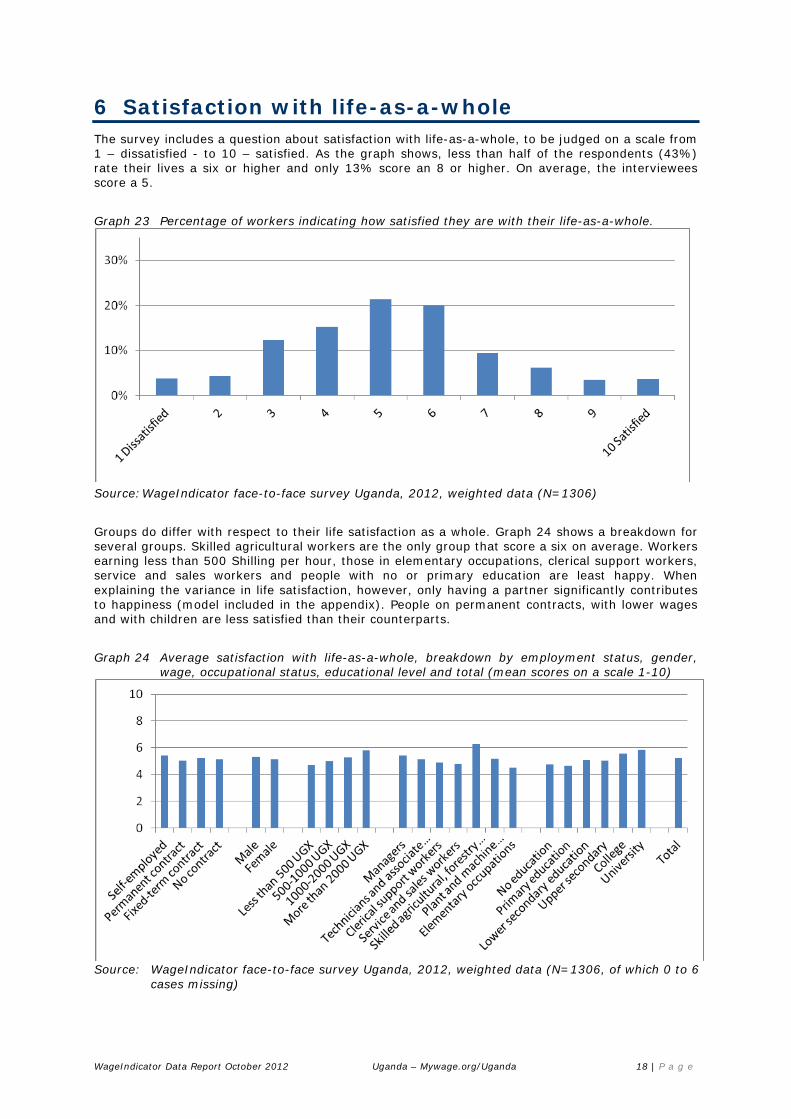
6 Satisfaction with life-as-a-whole The survey includes a question about satisfaction with life-as-a-whole, to be judged on a scale from 1 – dissatisfied - to 10 – satisfied. As the graph shows, less than half of the respondents (43%) rate their lives a six or higher and only 13% score an 8 or higher. On average, the interviewees score a 5.
Graph 23 Percentage of workers indicating how satisfied they are with their life-as-a-whole.
Source: WageIndicator face-to-face survey Uganda, 2012, weighted data (N=1306)
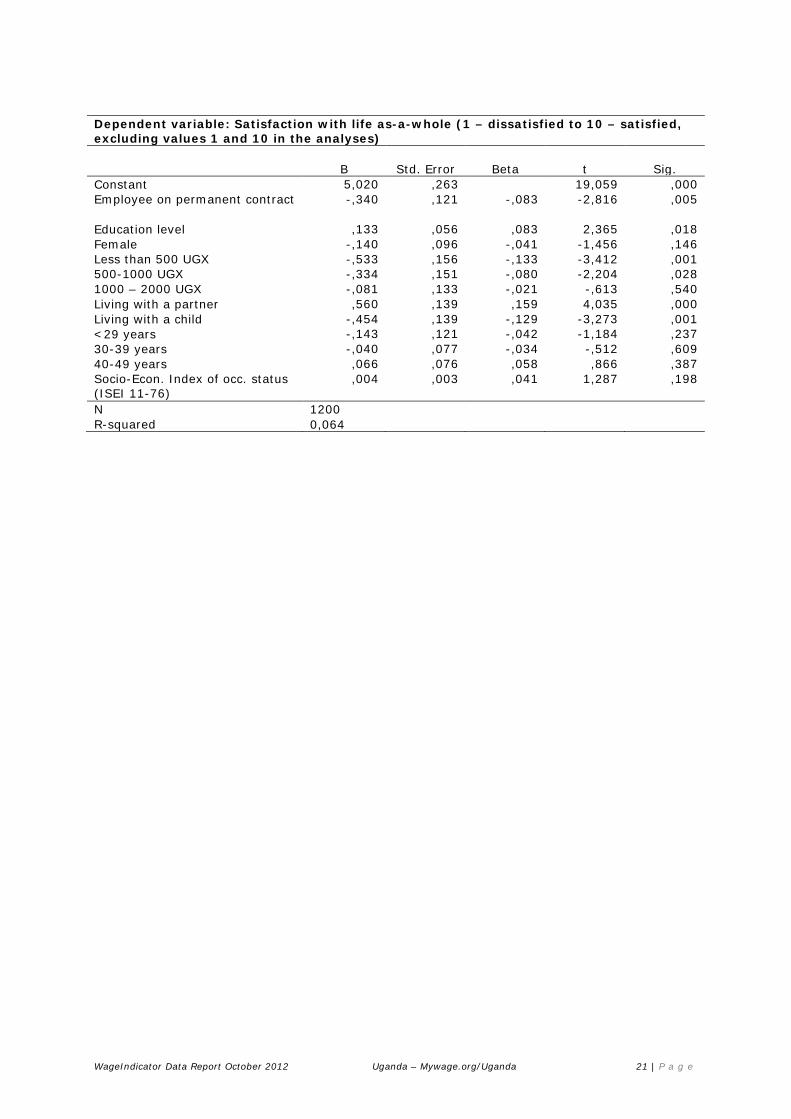
Groups do differ with respect to their life satisfaction as a whole. Graph 24 shows a breakdown for several groups. Skilled agricultural workers are the only group that score a six on average. Workers earning less than 500 Shilling per hour, those in elementary occupations, clerical support workers, service and sales workers and people with no or primary education are least happy. When explaining the variance in life satisfaction, however, only having a partner significantly contributes to happiness (model included in the appendix). People on permanent contracts, with lower wages and with children are less satisfied than their counterparts.
Graph 24 Average satisfaction with life-as-a-whole, breakdown by employment status, gender, wage, occupational status, educational level and total (mean scores on a scale 1-10)
Source: WageIndicator face-to-face survey Uganda, 2012, weighted data (N=1306, of which 0 to 6
cases missing)
WageIndicator Data Report October 2012 Uganda – Mywage.org/Uganda 19 | P a g e
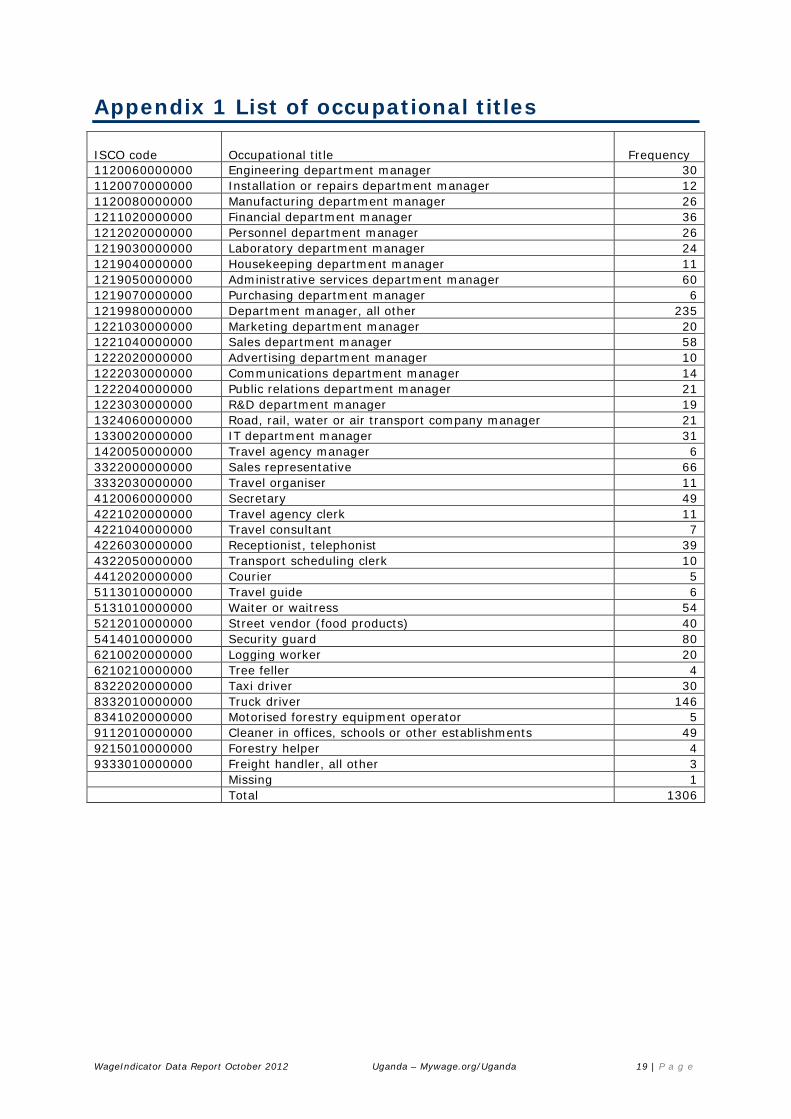
Appendix 1 List of occupational titles
ISCO code Occupational title Frequency 1120060000000 Engineering department manager 30 1120070000000 Installation or repairs department manager 12 1120080000000 Manufacturing department manager 26 1211020000000 Financial department manager 36 1212020000000 Personnel department manager 26 1219030000000 Laboratory department manager 24 1219040000000 Housekeeping department manager 11 1219050000000 Administrative services department manager 60 1219070000000 Purchasing department manager 6 1219980000000 Department manager, all other 235 1221030000000 Marketing department manager 20 1221040000000 Sales department manager 58 1222020000000 Advertising department manager 10 1222030000000 Communications department manager 14 1222040000000 Public relations department manager 21 1223030000000 R&D department manager 19 1324060000000 Road, rail, water or air transport company manager 21 1330020000000 IT department manager 31 1420050000000 Travel agency manager 6 3322000000000 Sales representative 66 3332030000000 Travel organiser 11 4120060000000 Secretary 49 4221020000000 Travel agency clerk 11 4221040000000 Travel consultant 7 4226030000000 Receptionist, telephonist 39 4322050000000 Transport scheduling clerk 10 4412020000000 Courier 5 5113010000000 Travel guide 6 5131010000000 Waiter or waitress 54 5212010000000 Street vendor (food products) 40 5414010000000 Security guard 80 6210020000000 Logging worker 20 6210210000000 Tree feller 4 8322020000000 Taxi driver 30 8332010000000 Truck driver 146 8341020000000 Motorised forestry equipment operator 5 9112010000000 Cleaner in offices, schools or other establishments 49 9215010000000 Forestry helper 4 9333010000000 Freight handler, all other 3 Missing 1 Total 1306
WageIndicator Data Report October 2012 Uganda – Mywage.org/Uganda 20 | P a g e
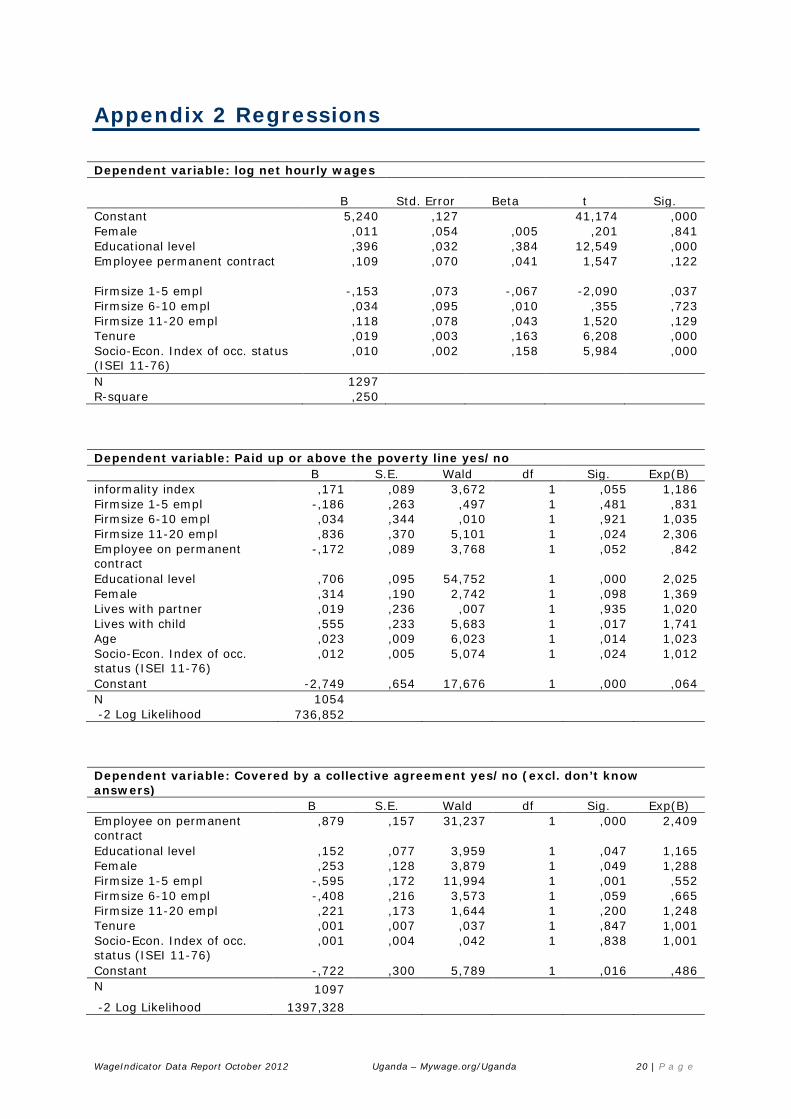
Appendix 2 Regressions
Dependent variable: log net hourly wages
B Std. Error Beta t Sig.
Constant 5,240 ,127 41,174 ,000 Female ,011 ,054 ,005 ,201 ,841 Educational level ,396 ,032 ,384 12,549 ,000 Employee permanent contract ,109 ,070 ,041 1,547 ,122
Firmsize 1-5 empl -,153 ,073 -,067 -2,090 ,037 Firmsize 6-10 empl ,034 ,095 ,010 ,355 ,723 Firmsize 11-20 empl ,118 ,078 ,043 1,520 ,129 Tenure ,019 ,003 ,163 6,208 ,000 Socio-Econ. Index of occ. status (ISEI 11-76)
,010 ,002 ,158 5,984 ,000
N 1297 R-square ,250
Dependent variable: Paid up or above the poverty line yes/no B S.E. Wald df Sig. Exp(B) informality index ,171 ,089 3,672 1 ,055 1,186 Firmsize 1-5 empl -,186 ,263 ,497 1 ,481 ,831 Firmsize 6-10 empl ,034 ,344 ,010 1 ,921 1,035 Firmsize 11-20 empl ,836 ,370 5,101 1 ,024 2,306 Employee on permanent contract
-,172 ,089 3,768 1 ,052 ,842
Educational level ,706 ,095 54,752 1 ,000 2,025 Female ,314 ,190 2,742 1 ,098 1,369 Lives with partner ,019 ,236 ,007 1 ,935 1,020 Lives with child ,555 ,233 5,683 1 ,017 1,741 Age ,023 ,009 6,023 1 ,014 1,023 Socio-Econ. Index of occ. status (ISEI 11-76)
,012 ,005 5,074 1 ,024 1,012
Constant -2,749 ,654 17,676 1 ,000 ,064 N 1054 -2 Log Likelihood 736,852
Dependent variable: Covered by a collective agreement yes/no (excl. don’t know answers) B S.E. Wald df Sig. Exp(B) Employee on permanent contract
,879 ,157 31,237 1 ,000 2,409
Educational level ,152 ,077 3,959 1 ,047 1,165 Female ,253 ,128 3,879 1 ,049 1,288 Firmsize 1-5 empl -,595 ,172 11,994 1 ,001 ,552 Firmsize 6-10 empl -,408 ,216 3,573 1 ,059 ,665 Firmsize 11-20 empl ,221 ,173 1,644 1 ,200 1,248 Tenure ,001 ,007 ,037 1 ,847 1,001 Socio-Econ. Index of occ. status (ISEI 11-76)
,001 ,004 ,042 1 ,838 1,001
Constant -,722 ,300 5,789 1 ,016 ,486 N 1097
-2 Log Likelihood 1397,328
WageIndicator Data Report October 2012 Uganda – Mywage.org/Uganda 21 | P a g e
Dependent variable: Satisfaction with life as-a-whole (1 – dissatisfied to 10 – satisfied, excluding values 1 and 10 in the analyses)
B Std. Error Beta t Sig. Constant 5,020 ,263 19,059 ,000 Employee on permanent contract -,340 ,121 -,083 -2,816 ,005
Education level ,133 ,056 ,083 2,365 ,018 Female -,140 ,096 -,041 -1,456 ,146 Less than 500 UGX -,533 ,156 -,133 -3,412 ,001 500-1000 UGX -,334 ,151 -,080 -2,204 ,028 1000 – 2000 UGX -,081 ,133 -,021 -,613 ,540 Living with a partner ,560 ,139 ,159 4,035 ,000 Living with a child -,454 ,139 -,129 -3,273 ,001 <29 years -,143 ,121 -,042 -1,184 ,237 30-39 years -,040 ,077 -,034 -,512 ,609 40-49 years ,066 ,076 ,058 ,866 ,387 Socio-Econ. Index of occ. status (ISEI 11-76)
,004 ,003 ,041 1,287 ,198
N 1200 R-squared 0,064
WageIndicator Data Report October 2012 Uganda – Mywage.org/Uganda 1 | P a g e