w.a. no. - british columbia
TRANSCRIPT

W.A. NO.
NAME &&&L J2fiZ:
SUBJECT
o
O m
~n m
en o

GEOPHYSICAL REPORT ON A
HYDROSONDE SURVEY KOOTENAY LAKE , B. C.
May 1970
1
for Cominco Limited
by Renting Earth Sciences
To Act\\T£>

CONTENTS
I.
II.
INTRODIH CTION 2
1. Purpose 2
2. Survey Area 2
3 . Survey Vessel 2
SURVEY 3
1. Dates of Survey 3
2. Traverse Lines 3
3 . Survey Procedure 3
HI. DATA REDUCTION • 4
IV. INTERPRETATION 6
V. CONCLUSIONS 9
BIBLIOGRAPHY
MAP POCKET ELEVATION OF BOTTOM MAP
ELEVATION OF BEDROCK MAP

- 2 -
1. INTRODUCTION
1. Purpose
A HYDROSONDE survey was performed by Renting
Earth Sciences for Cominco Limited over a portion of Kootcnay
Lake, British Columbia. The purpose was to delineate bedrock
with the hope of outlining a southward extension of the host rock
of the Bluebell mine at Riondel, B .C.
This survey is a southern extension of a survey per-
formed by Huntec Limited in 1966. For theoretical and geological
aspects, reference is made to the report regarding that survey.
2 . Survey Area
The survey area extended, from line +48 00 to - 3200
covering an area of approximately 4.4 square miles.
3 . Survey Vessel
The survey vessel, supplied by Cominco Limited, was
a 41 foot wooden tug, "The Kokanee ".

II. SURVEY
1. Dates of Survey
The field work commenced 26 May, 1970 and was
completed 30 May, 1970.
2 . Traverse Lines
The traverse lines were oriented approximately east-*̂
west. These lines extended from +4800 to -3200, referenced to mine
co-ordinates. Lines +4800 to +2000, -400 and -2800 were run from
shore to shore, the remaining lines from the east shore, to an approxi
mate distance of 3,000 feet offshore. Line +7600 was run to correlate
with the previous survey and line +5995 to correlate with D.D.H. 1363.
Tie lines were also run to cut all east-west lines,
3. Survey Procedure
The survey procedure was the same as outlined in section
II - 2 of the 1966 report, although different theodolite stations were
used. Again, the theodolite parties were under the direction of Mr. H.
Dixon of Cominco Limited.

- 4 -
III. DATA REDUCTION
The bedrock elevation map is produced from three maps;
an unmigrated isopach map, a migrated isopach map,- and a bottom
elevation map. The procedure used is as follows.
1. Depth from lake bottom to bedrock was calculated using
the time taken from the seismic records . This value was plotted at
each fix and contoured to produce an unmigrated isopach map. Near
shore sediment thicknesses are zero as the water depths are the depth
to bedrock.
2 . Sediment thickness at each fix was migrated to yield values >
which were used to contour a migrated isopach map.N
3 . Where bedrock formed lake bottom, i . e . near shore,
w&ter depth was calculated at each fix, plotted and contoured to produce
unmigrated depth to bedrock. Profiles were drawn perpendicular to the
contours, i . e . along dip. Circular wavefronts were drawn, having radii
determined from unmigrated water depth values along the profiles. A
line was drawn to envelope the wavefronts forming the migrated water
depth profile. Elevation of the bedrock was read from the profile,
plotted and contoured to form a portion of the bedrock elevation map.
4 . Bottom elevations were calculated at fixes used in step 1),
plotted and contoured to yield a bottom elevation map.
5. Step five yields the elevation of bedrock over the area
detailed in step 1). When the elevation of the bottom and the thickness
- 5 -
of material between bottom and bedrock is known, subtraction of
sediment thickness from bottom elevation yields bedrock elevations.
To accomplish this, the bottom elevation map (step 4) was overlain
on the migrated isopach (sediment thickness) map (step 2). Sediment
thickness was subtracted from bottom elevation along each bottom
elevation contour, plotted on the bedrock elevation map (step 3) and
contoured to yield a complete bottom elevation map.
- 6 -
IV. INTERPRETATION
Throughout most of the survey area the bedrock
horizon was quite well defined although in certain portions the
bedrock was masked out for various reasons.
Above the intersection of the two dipping slopes, the
actual bedrock horizon is masked by signals originating from r e
flections off the two slopes. Thus the centre portion of the bedrock
elevation map has fewer contours because in this portion the first
arr ivals were reflections from the slopes and not from bedrock
vertically below.
Another instance of masking occurs at>diffraction points
where the diffracted wave train hides the actual bedrock arr ival . This
phenonmenon in itself is not a great problem when one diffraction pattern
occurs, but when two diffraction patterns occur, the bedrock arrivals
are convolved with many reflections so that the definition between bed
rock and the diffracting surfaces is extremenly difficult. This situation
occurred on the east side of the survey area on lines -1200 to -3200.
One diffracting surface follows tie line MB ff and the second diffracting
surface parallels it roughly eight hundred (800) feet to the east. Thus,
between these two points on each record any definite outline of the
bedrock is lost in the diffractions. There are several geological s truc
tures which could account for these diffracting patterns, but we shall .
concentrate only on the most likely structures.
- 7 -
Any structural feature must be evaluated bearing in
mind that it occurs in a glacial valley. Thus the feature has been
ice eroded. Since erosion acts differentially, the central portion
of the feature must be softer than the two diffracting surfaces.
This can occur when a "cap11 rock or a sheared zone is present.
A mechanism likely to produce these results would be ice eroding
down a shear zone located midway between the diffracting surfaces.
As the ice erodes vertically downward in the shear zone, it also
erodes laterally to produce a lfU,f shaped valley. An analogy would
• pe a river eroding downward and laterally to form a frVn shaped
valley. There is another possibility which is more>probable and is
believed to be the best explanation.
According to Rice (1941), there are many dikes and sills
within the Lardeau Series. Due to its homogeniety, a granitic sill
or dike is much more resistant to erosion than a schist or gneiss.
Thus it is concluded that the diffracting surfaces are due to the p re
sence of either a dike or a sill or a combination of both. The thick
ness of the sill would be appreciable to produce a feature of this size.
A sill or dike accounts for a deepening between diffracting surfaces
due to the fact that the material between is less resistant to ice
erosion.
The feature described above is delineated only in a de
tailed two-dimensional migration. In three dimensional migration
of down-dip diffractions, the feature farther down-dip shows up as a

flattened surface and not as a protrusion from a smooth bedrock'
profile. Thus below tie-line ff B " between the lines mentioned
above, bedrock could be at a considerably higher elevation and
this could be outlined in a more detailed interpretation. It is
unknown whether the western most feature is of any economic
value, but this could be ascertained by drilling.
Another feature revealed by the records appears
below tie-line "B " between +2000 and -400, its highest elevation
being 1050 feet at fix 14.8 on line +800. It is broadest on line
+ 800 measuring roughly twelve hundred (1200) feet and tapers in
an approximately elliptical pattern to its extremities. This fea->
ture is believed to be a glacial remnant, composed of either clay
or boulders or both, and may pose problems in drilling.
The ridge extending along tie-line "B M from +4800,
south, to approximately +3600, is considered to be an extension
of the host rock immediately to the north. Thus, due to the proxi
mity to a known ore body, there is a strong possibility that the
ridge does contain ore .

V, CONCLUSIONS
It is believed that the interpreted depths are within
ten (10) percent of the actual depths. The error is probably a
result of the following. The inaccuracies due to the velocity
function increase with depth. The fact that three maps are used
to produce the final map induces e r ro r . Migration may lead to as
much as five (5) percent er ror and boat position adds perhaps another
two (2) percent. The source receiver measurent will possibly add
'two (2)"percent as the measurement was taken while the cable was
under zero s t r e s s . Correlation with D.D.H. 1363Vas accurate to within
two (2) percent. This accuracy is well within geophysical limits,
but should not be construed to apply to the entire survey area .
All these considerations, however, do not destroy the
relative value of the contours which provide a picture of the bedrock
surface.
J . B. Henry, B . S c , (Eng.) Geophysicist
Kenting Earth Sciences
M. I . Ehrlich, M.A. , Head Marine Seismics. Kenting Earth Sciences

rrf i
'i
J '2
J
? 1 E*
■3
BIBLIOGRAPHY
Prior , W. Report on HYDROSONDE Survey, Kootenay Lake, Riondel, B .C. 1967
1 [■ Rice, H.M.A. Nelson Map Area, East Half
British Columbia Geological Survey of Canada Memoir 28
I
REPORT ON
HYDROSONDE SURVEY
KOOTENAY LAKE
RIONDEL, B . C .
for
COMINCO LIMITED
by
HUNTEC LIMITED
TORONTO, ONTARIO
APRIL, 1967

TABLE OF CONTENT!
ABSTRACT
INTRODUCTION
1. P u r p o s e
2 . Area
3. Genera l Information
SURVEY
1. T r a v e r s e Lines
2. Survey P r o c e d u r e
INSTRUMENTATION
1« Hydrosonde Mark 2A
a. Power supply b . Pu l se conversion unit c. / i r c o m p r e s s o r d. Bolt pneumatic source e. Hydrophone a r r a y : n e e l f. Rece iver
2. Radios
3 . Reco rd Annotation
DATA REDUCTION
1. Velocity Function
2. Migration P r o c e d u r e
3 . Borehole Checks

2.
V INTERPRETATION 23
1. Kootenay Lake 23
a. Regional Setting 23 b. S t ruc ture 24 c. Prof i les and plan 24 d. Conclusions 25
2. Tail ings Area 26
VI ACKNOWLEDGEMENTS 27
VII REFERENCES 28
L is t of P lans accompanying the r epor t ;
Plan 1 T r a v e r s e Location and B c i r o c k Elevat ion Contours - 1 inch:400 ft.
P lan 2 Tail ings A r e a . 4 sppachytes of dump, and Prof i les a c r o s s Tail ings A r e a -1 inch:50 ft.

A B S T R A C T
The survey procedure and ins t rumentat ion a r e desc r ibed .
The data reduct ion p roces s is desc r ibed and the outlines of
the migra t ion theory presen ted ; for a more complete descr ip t ion see
Reference 2.
The contours and profi les over Kootenay Lake show an
over -deepened glacial valley to below sea leve l . The ea s t e rn bank
follows the prevai l ing dip slope of about 40 d e g r e s s whereas the west bank,
a s t r ike s lope, is considerably s teeper and may be a ve r t i ca l cliff in places
A dex t ra l d i sp lacement occurs at Woodbury Point .
The tai l ings a r e a is par t ia l ly defined and isopachytes
p re sen ted over the surveyed a r e a ,

- 1 -
I INTRODUCTION
1. Pu rpose
Huntec Limited of Toronto was commiss ioned by Cominco
Limi ted to under take a Hydrosonde survey over pa r t of Kootenay Lake ,
Br i t i sh Columbia, the purpose of the survey being to de te rmine bedrock
surface beneath the lake, i r r e spec t ive of depth. It ^r^ understood that the
r e s u l t s of the survey would define the future limits of underground workings
from the Bluebell Mine at Riondel .
A secondary survey was also requ i red ever an old tai l ings dump.
2. Area
Kootenay Lake is elongate in a n o r t h - s o ath d i rec t ion , about
56 mi les long, and with an average width of approximately 2. 5 miles over
mos t of its length: 2 mi les at Riondel and the Bluebell Mine (approx.
49M6 fN, 116*5!W).
The survey extended from Riondel (Min^ Coordinate 7 600N.7 600E)
to a point approximately 3 nniles nor th with th i r ty-nine ea s t -wes t oriented
l ines at a nominal separa t ion of 400 ft. , a total of approximately eighty
line m i l e s .
3. Genera l Information
The equipment was mounted aboard the "Kokanee" , a wooden
tug under the supervis ion of Mr . V a l te r Tozer of Nelson Marine S e r v i c e s .

- 2 -
Two-way rad ios were provided by Huntec Limited for sh ip - to - sho re
communicat ions; the shore par ty respons ib le for the surveying and navigation
was under the di rect ion of Mr . H. Dixon of Comin:o Limi ted .
Mr . R . W . Hutchins and Mr . J . W . P r i o r of Huntec Limited were
respons ib le for the operat ion of the Hydrosonde Mark 2A sys t em and
anc i l l a ry equipment , Mr . P r i o r la ter ca r ry ing out the data reduct ion and
in te rpre ta t ion .
The field work was commencedoh October 21st , 1966 and completed
on October 30th, 1966.

- 3 -
II SURVEY
1. T r a v e r s e Lines
The survey was made over eas t -wes t or iented l ines a nominal
400 ft. apa r t . Thi r ty-n ine such lines were run from 7 600N at the southern
end of the a r e a to 22800N at the nor the rn end, the lines varying from 8550
ft. to 12, 560 ft. in length. A tie line was run and positioned by dead reckon
ing f rom the west end of Line 22800N to the eas t end of Line 10400N.
The e a s t e r n halves of Lines 7400N, 7SOON and 7 600N were run as
a s epa ra t e survey to de te rmine the position and extent of the old tai l ings
dump. \
.An exper imenta l line was run from the eas t end of Line 10400N
at an azimuth of 27 5* over a known ore zone to de te rmine if the equipment
could detect the p re sence of ore within the bedrock.
Lines 6540N and 5955N were run over the locations of dr i l l holes
D.D. 920 and D.D. 1363 respec t ive ly , in o rder to check the data reduction
p r o c e d u r e s .
2. Survey P r o c e d u r e
The navigation control and survey were pe r fo rmed as an in tegrated
p rocedure by sho re -ba sed pa r t i e s provided by Cominco Limited under the
d i rec t ion of Mr . H. Dixon.

- 4 -
Survey points were located on the eas t bank opposite each t r a v e r s e
l ine, and at se lec ted control s tat ions on ei ther bank (control stations G . S . C . 11
and H. 10); l ines nor thwards to 12000N inclusive were controlled from G.S . 11
(16096. 66N. 1128. 96E) and Line 12400N nor thwards from H. 10 (10469. 35N
7499. 43E). The eas t bank par ty de te rmined the azimuth of the t r a v e r s e line
and "talked the survey boat along the l ine. Simultaneously, at one minute
in t e rva l s , bear ings were taken on the boat and the s e i smic r e c o r d marked .
The in te rsec t ions of these bear ings were used to t:-ace the path of the boat,
and the s e i smic data was l inear ly interpolated between the points .
The r e su l t s of the survey are; p resen ted in*the form of coordinates
and presen ted in Plan 1: the t r a v e r s e line plot. The boat par ty noted the
dis tance to the west bank from the f i rs t or las t fix as appropr ia t e , and this
information is a l so incorpora ted in P lan 1.
The fixes were taken on the boat mas t ; the plotted point is the
appropr ia te position for the centre of the s o u r c e - r e c e i v e r a r r a y , the
t r a v e r s e d i rec t ion having been taken into cons idera t ion .
- 5 -
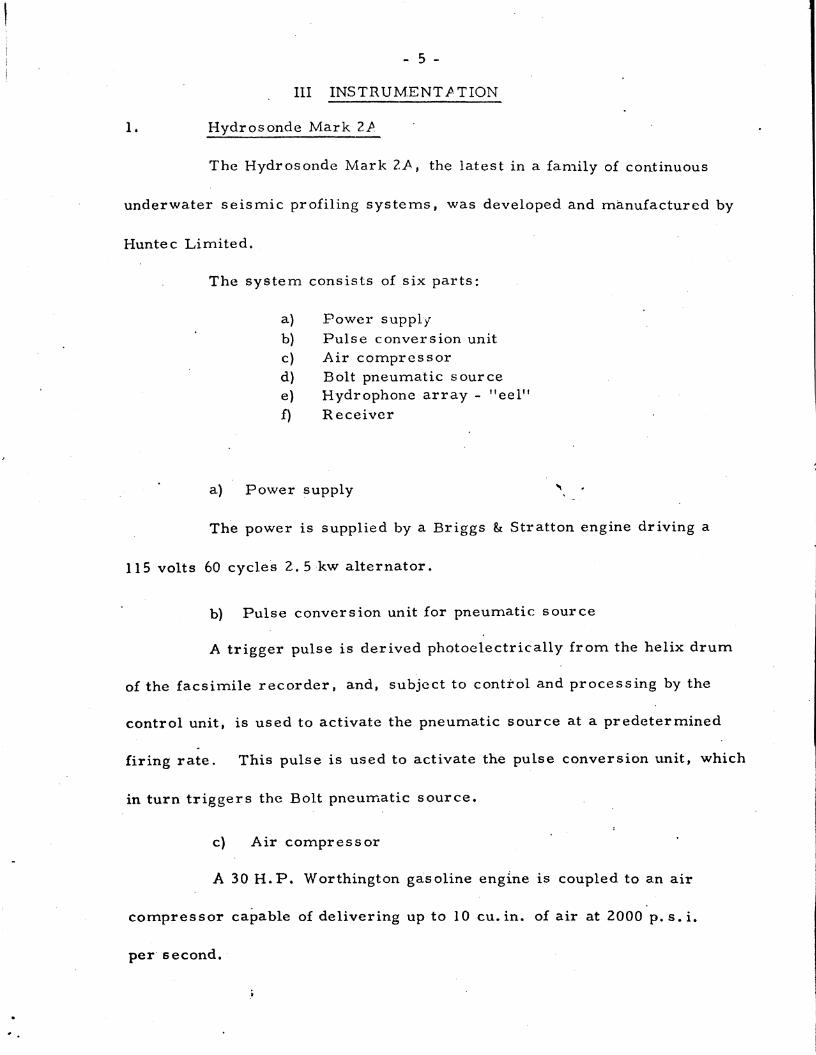
III INSTRUMENTATION
1. Hydrosonde Mark 2A
The Hydrosonde Mark 2A, the la tes t in a family of continuous
underwater s e i s m i c profiling s y s t e m s , was developed and manufactured by
Huntec Limi ted .
The sys t em consis ts of six p a r t s :
a) Power supply b) Pu lse conversion unit c) Air c o m p r e s s o r d) Bolt pneumatic source e) Hydrophone a r r a y - "ee l " f) Rece iver
a) Power supply \ •
The power is supplied by a Briggs & Strat ton engine driving a
115 volts 60 cycles 2 .5 kw a l t e rna to r .
b) Pulse conversion unit for pneumatic source
A t r igger pulse is der ived photoelectr ical ly from the helix d r u m
of the facsimile r e c o r d e r , and, subject to control and process ing by the
control unit, is used to activate the pneumatic source at a p rede te rmined
firing r a t e . This pulse is used to activate the pulse conversion unit, which
in turn t r i g g e r s the Bolt pneumatic s o u r c e .
c) Air c o m p r e s s o r
A 30 H . P . Worthington gasoline engine is coupled to an a i r
c o m p r e s s o r capable of del ivering up to 10 cu . i n . of air at 2000 p . s . i .
per second.

- 6 -
d) Bolt pneumatic source
The P . A . R . pneumatic source Model 600 is manufactured by
Bolt Assoc ia tes Inc. , E a s t Norwalk, Conn.
Throughout the p re sen t survey a 10 cu . :n . chamber was used.
A pulse f rom the pulse conversion unit act ivates a solenoid
within the Bolt source which r e l ea se s the air p r e s s u r e through a valve
sys t em.
e) Hydrophone a r r a y ; "ee l "
A single hydrophone, or an f |eelM , compris ing 20 p r e s s u r e
sensi t ive MP-7 hydrophones at 1-foot in terva ls in iid^ a plas t ic tube was
used for the survey . The eel was towed in a zon* outside the boat 's
wash in o rder to reduce turbulent no ise .
f) Receiver
This unit incorpora tes a signal amplif ier , adjustable bandpass
f i l t e r s , the facs imi le- type r e c o r d e r and the p rogramming logic which
controls the t iming of the record ing operat ion in re la t ion to the firing
pulse sent to the t r a n s m i t t e r .
The hydrophone signals a r e passed through a low noise , low
level p re -ampl i f i e r and fed into the var iab le bandpass f i l t e r s . The
twelve high frequency cut-off points a r e between 100-3027 cps . The ten
low frequency cut-off points a r e between 20-1730 cps . The frequency

- 7 -
response of the open filter is f rom 20 to 20, 000 cps . Throughout the
presen t survey , the f i l ters were in the 101-628 cps r ange .
The band- l imi ted signals a re fed via a logar i thmic gain control
to a d r ive r amplif ier which in turn provides the irput to the printing amplif ier .
The overa l l voltage gain of the signal p r o c e s s o r is well over one mill ion.
The helix of the 8 inch r e c o r d e r is dr iven di rec t ly by a pr inted
circui t D . C . motor phase- locked to a c rys ta l osc: l la tor through a hybrid
digital se rvo sys t em. The following r e c o r d sweeps speeds a r e avai lable:
.0625; .125; .250; .500; 1.00 and 2. 00 s e e s , full s ca l e . The recording
can be delayed by 1 /2 full scale increments up to 18. The firing ra t e is
var iable f rom 3 per minute to 480 per minute . ^ ,
The half wave rect i f ied signals a r e recDrded in the form of
intensi ty shades on e l ec t ro - sens i t ive paper .
The ins t rument is equipped with facil i t ies to pr in t scale and
fiducial m a r k e r s ,
2. Radios
Smal l t r ansce ive r rad ios were used by the field par t i es whilst
a Johnson 5 watt base radio was used on the boat.
3 . Record Annotation
E v e r y fiducial m a r k on the r e c o r d was numbered to co r r e l a t e
with the survey; s imultaneously a log was kept n Dting all data per t inent
to the su rvey .

- 8 -
IV DATA REDUCTION
The process of data reduction converts the raw field profiles,
which are vertically plotted as a function of reflection time, into fully
migrated elevation contours of the bedrock;, the major considerations
in the processing operation are the choice of appropriate velocity-depth
function and migration technique.
1. Velocity Function
The velocity of sound normally increases with depth in sediments
such as are found in the lake; however, in this case no direct velocity
measurements or drill hole sections through the mconsolidated sedimentary
section were available. Such information would provide an absolute depth
which could be used to correct the survey.
In the absence of definite velocity information, it was assumed
for the purpose of converting the time profiles in':o depth profiles that the
velocity within the lake sediments increased linearly with depth according
to the following equation (Ref. 1):
Z = (V0 sinh at)/a + V0 (cosh at - l)/a (])
where Z = depth in feet
V Q ■= velocity in feet per second at zero feet depth
t *= reflection time in seconds (one way)
a = equation constant

- 9 -
An a l ternat ive form of the same equation is as follows:
■ Z = R f D . (2)
where R = (Vd sinh a t ) / a (3)
= -radius of wave front c i rc le at t ime t sees*
D * V 0 (cosh a t - l ) / a (4) - depth to cen t re of v. ive front cir i : ' at t ime t s ec .
a = V 0 / L (5)
where V0 = Velocity in feet per second at ze ro feet depth
L = scale length used in migrat ion
Due to the lack of velocity infc rmat ion over the survey a r e a
a specia l technique was developed by the staff of lunfec Limi ted , whereby the
average velocity could be computed for any partic ular two way reflection t ime
from the diffraction pa t te rns appearing en the rec o r d s . Knowing the ditr ibution
of average velocity against two way ref lect ion t in e, it is possible to der ive the
appropr ia te veloci ty-depth function for the a r e a . F igure 1 shows the plot of
one way reflect ion t ime against average velocity :or this survey . A velocity
curve was se lec ted after considering the re l iabi l i ty of each determinat ion
and the sca t t e r of the plotted points .
F igure 2 shows a t r i a l re la t icnsh ip between the average
veloci ty, ref lect ion time and total depth for this survey; the subsequent
de terminat ions used the lake bottom as datum and the constants a r e
d i scussed l a t e r .

8500 r-
8000
K 7500 O
o _J UJ > UJ O 7000 < or >
> £ 6500
6000
5500 X X
o
X X X X 100 200 300
t , ONE-WAY REFLECTION T I M E , MILLISECONDS 400
P H - 5 1 3 / 6 6 FIGURE I

Z, TOTAL DEPTH 3000 4000 5000 T
6000 7000 Vov, AVERAGE VELOCITY
8000 9000
» » , . . ~ . ^ i* F I G U R E

- 1?. -
A h i s t o g r a m plot of average velocity produced two maxima, at
6200 f t / sec* and 7200 f t / s e c . with an inclusive average over the total points
of 7000 f t / s e c .
The velocity of sound in the lake water was assumed to be a
constant 5000 f t / s e c .
The p a r a m e t e r s of Equation (1) chosen for this survey were*
V = 6000 f t / s e c . o
a = 1.?.
By using these values for the p a r a m e t e r s in Equation (1) the reflection
t ime profi les were t ransposed to a plan of depth to bedrock beneath water
su r face , due allowance being made in the t ransposi t ion p r o c e s s for the depth
of the w a t e r . Two plans were made of the depth contours : one for each bank;
the two banks were separa ted for ease of opera t ion. The situation*pertaining
at Kootenay Lake is demonst ra ted in F i g . 3 which shows how a complex
r e c o r d with a c ro s sove r is obtained towards the cent re of the profile when
the bedrock surface exceeds a ce r ta in l imiting con :avity i . e , two surfaces
having equal reflect ion t imes*
The se t s of depth contours for each bank e r e then the bas i s for the
migra t ion p rocedu re .
2 . Migrat ion P r o c e d u r e
The hydrosonde r e c o r d is a two dimensional sect ion in which the
total ref lect ion t ime is ve r t i ca l ly plotted beneath the a r r a y c e n t r e . This

BOAT POSITION 1 1 1 1 r 1 2 3 4 5
s
3,3' ,x.. RECORD SURFACE
REFLECTOR
FIGURE 3 . A surface of equal reflection time is a sur face of maximum available concavity.
JPH 519/66

- 14 -
point has no other significance than that of being one point determining a
surface of equal reflect ion t i m e s , this surface being tangential to the actual
ref lector at some point in space . "Migra t ion" , the re fo re , is the procedure
of determining the t rue three dimensional reflecting surface from a surface
de termined by a number of ve r t i ca l ly plotted points . Only in the case when
the ve r t i ca l section through t r a n s m i t t e r and r ece ive r l ies in the di rect ion
of maximum dip of the r e f l ec to r , can migra t ion be ca r r i ed out in the same
ve r t i ca l plane as the ve r t i ca l plotting.
Hagedoorn (Ref. 2) developed the concept of curves of maximum
convexity, whereby the p r o c e s s *of migrat ion is performed by determining
the surface of equal reflection t i m e s , or surfaces of concavity, belonging
to each ver t i ca l ly plotted point. F ig . 3 gives an example of the surface of
max imum concavity. The inverse c a s e , the surface of max imum convexity,
can be summar i zed as the apparent horizon formed by ver t i ca l ly plotting
the ref lect ion t imes from one reflecting point (Fig. 4) .
Three -d imens iona l migrat ion of a ve r t i ca ly plotted point can be
reduced to a two-dimensional migrat ion in the ve r t i ca l plane in the di rect ion
of max imum dip, i . e . in the di rect ion normal to the con tou r s . The migrat ion
is per formed therefore by center ing a family of su 'faces of equal reflection
t imes (depths) or wave fronts at the ve r t i ca l through a ve r t i ca l ly plotted point
and moving a family of sur faces of maximum convexity to the bes t tangential
fit to the ver t i ca l ly plotted horizon; the migra ted point is then determined by
following the surface of maximum convexity to the axis of the family of
surfaces of maximum convexity.

SURFACE
FIGURE 4. A vert ical ly plotted horizon from one reflecting point is a surface of maximum obtainable convexity.
PH 5 1 9 / 6 6

- 16 -
The family of surfaces of equal reflection times (depths), or
wave front chart, is drawn graphically according to the velocity function
desired. Hagedoorn presents wave front charts derived from the velocity
function
V /V = 1 + Z /L (6) Z o
where V- = velocity in f t /sec . at depth Z ft.
V = velocity in f t /sec. at 0 ft. o ' Z = depth in ft.
L = equation constant.
This .equation is equivalent to Equation 1 in that succeeding wave fronts are
circles of increasing radius with increasing depth to the centre point.
Hagedoorn also presents the procedure for constructing the chart
of curves of maximum convexity from the appropriate wave front chart.
The sets of depth contours for each bank are then migrated using
the wave front chart and the maximum convexity chart.
Several profiles (Figures 5 to 9 inclusive) were constructed after the
migration process was completed to ensure that the two banks met at depth,
and also that the banks below the lake bottom and above lake bottom respectively
match up. The information from plan and profile was coordinated to produce a
plan (1) of bedrock elevation contours with respect to sea level.

LINE 10,000-N
LINE 9.200-N
WEST BANK
EAST BANK
HORIZONTAL AND VERTICAL SCALE
L E G E N D L.S LAKE SURFACE
M.S.L. MEAN SEA LEVEL BEDROCK SURFACE
-INTERPOLATED BEDROCK SURFACE
FIGURE 5

w I L.S.
LINE 13,200-N
M.S.L.
LINE > I2.400*T*
W i L.S.
M.S.L. \
GRID . COORDINATE -2000
. LINE. : ^H II.60Q-N s
10000
LINE 10.800-N
WEST BANK EAST BANK
BEDROCK P R O F I L E S o 1000 2000 FT
J i 1 i 1—I
HORIZONTAL AND VERTICAL SCALE
L E G E N D
L.3 m.s.L.
LAKE SURFACE MEAN SEA LEVEL
BEDROCK SURFACE INTERPOLATED BEDROCK SURFACE
ESTIMATED BEDROCK SUHFflCF

LINE 16,400 'N
GRID COORDINATE
LINE 15.600-N
2 0 0 0 4000 6000 8000 10000
w L.S.
tA.ado-N
- » . - *w^ ■•£
LINE 14.000-N
WEST BANK EAST BANK
BEDROCK P R O F I L E S o 1000 2000 FT
- i — I
HORIZONTAL AND VERTICAL SCALE
L E G E N D L.S M.S.L.
LAKE SURFACE MEAN SEA LEVEL
BEOROCK SURFACE ___ - . INTERPOLATED BEDROCK SURFACE
ESTIMATED BEDROCK SURFACE _ i

'
LINE 16,400'N
GRID COORDINATE
h L.S.
I M C
LINE 15.600-N
2 0 0 0
_ —
4000 6000 8000
L t h c \4.aOON
10000
M.S.L. !,7^sS?7='"
LINE 14.000-N
WEST BANK EAST BANK
BEDROCK P R O F I L E S 1000 2000 FT
HORIZONTAL AND VERTICAL SCALE
L E G E N D L.S M.S.L.
LAKE SURFACE MEAN SEA LEVEL
BEDROCK SURFACE INTERPOLATED BEDROCK SURFACE
ESTIMATED BEDROCK SURFACE
FIGURE 7

LINE I9JS00-N
I
r
LINE 18.800-N
GRID COORDINATE 0
LINE 18.000-N
2000 4000 6000 8900 !CCOO
*:t^-_ --iiie^Jfc*, -.•V-i^*" I
r̂
LINE 17200-N
W E S T B A N K
E A S T BANK
BEDROCK P R O F I L E S 1000
I I 2000 FT
H O R I Z O N T A L AND V E R T I C A L S C A L E
L E G E N D L.S L A K E SURFACE
M.S.L. M E A N SEA L E V E L
BEDROCK SURFACE
I N T E R P O L A T E D B E D R O C K SURFACE
ESTIMATED BEDROCK SURFACE
FIGURE 8

w JLfeA
E
LINE 22.800-N
M.S.L.
LINE 22.000-N
GRIO COORDINATEL
-IOOO
■ • • : • - ; . - . * • - * ,
0 ■*■-' t ;***;%^ ^^if^t*
LINE 20.400-N
W E S T B A N K
E A S T S A N K
EDROCK P R O F I L E S 1 0 0 0
-I 1 1 I 2000 FT
H O R I Z O N T A L AND V E R T I C A L S C A L E
L E G E N D L.S. L A K E SURFACE
S9.S.L. MEAN SEA L E V E L
BEDROCK S U R F A C E
. INTERPOLATED B E D R O C K SURFACE
.ESTIMATED BEDROCK S U R F A C E
FIGURE 9 ' " | W " m , w ' : : ? ^ » - i . , ' ' .:■.■'■■ n.»i"«.

- 22 -
3 . Borehole Checks
The migrated sect ions agreed exactly with borehole DD 1363,
but there remained a smal l d i screpancy over borehole DD 920; the
discrepancy could be due to any one of a number of c a u s e s , but is not
considered s e r i o u s .

- 23 -
V INTERPRETATION
1. Kootenay Lake
a) Regional Sett ing.
Kootenay Lake l i es on the general ly acknowledged boundary
between two major physiographic regions : the Selkirk Mountains to the
wes t and the Pu rce l l Mountains to the ea s t . Holland (Ref. 3) r e f e r s to
the valley: . " . . . . .which extends southwards from the Rocky Mountain Trench
and contains the Beaver R ive r , Duncan Rive r , Duncan Lake , anil
Kootenay R i v e r , " a l te rna t ive ly , Schofield (4) r e f e r s to the Kootenay Valley
as the P u r c e l l T rench . The mountains on e i ther side of the Kootenay Valley
compr i se a number of individual ranges which at Nelson t rend northward, '
and to the north trend nor thwestward to form a curve convex to the eas t
which is the local topographic express ion of the Kootenay A r c , a major
s t ruc tu re of the underlying bedrock.
The Purce l l t r ench is carved in a s e r i e s cf sed imenta ry rocks
ranging in age from Belt ian to Carboniferous , intruded by m a s s e s of
g ranod io r i t e . The genera l dip of the rocks is 40-4.5 degrees towards the
centre of the a r c , so that at Riondel the rocks dip a lmos t due wes t . The
grani te m a s s e s , the e a s t e r n fringe of the West Kootenay-Nelson batholi th,
have had li t t le effect in the genera l s t r ike of the sed imenta ry s e r i e s , therefore
the conclusion is reached that the Pu rce l l Trench in carved into the t e r r a in
without r e fe rence to the s t ruc tu re (4).

- 24 -
b) S t ruc tu re .
Daly ( repor ted in 4) considered the Purce l l Trench to be a fault
bounded graben s t r u c t u r e , but severa l r e s e a r c h e r s investigating the
theory have found no evidence of major faulting. The genera l ly accepted
theory (4, 5) is that in the ea r ly T e r t i a r y the Selkirk mountains were uplifted;
the effect of the uplift was to r a i s e the old land surface to its p re sen t
height with the r e su l t that the s t r e a m s which meandered over the old surface
were re juvenated. These s t r e a m s bore no rela t ion to the underlying s t r u c t u r e ,
hence the rejuvenated val leys bore no re la t ion to s t r u c t u r e . During the ice
ages the p re -ex i s t ing val leys were modified to their p resen t form (5);
though the Kootenay Lake is overdeepened, there is no-evidence of it being
a moraine dammed lake . There is evidence of glacial overdeepening e l s e
where inland in Br i t i sh Columbia, but only in the coasta l fiord3 is it repor ted
to be in excess of 2000 ft (3).
c) Prof i les and P l a n s .
The presented profi les a r e derived from the bedrock elevation
plan. They show that in genera l the eas t bank of Kootenay Lake follows
essent ia l ly the prevai l ing geological dip slope of 4C-45 deg rees ; this slope
can invariably be followed to depth on the hydroson ie r e c o r d s .
The we3t bank is the s t r ike slope and is considerably s teeper than
the eas t bank; this can be seen c lear ly on the profiles f rom north of
Woodbury Poin t . To the south of Woodbury Point the west bank gave a
complex r e c o r d . The outwash fan of Woodbury Creek had a s t rong m?.:.king

- 25 -
effect; this i s considered to be due to the high boulder content which the
c reek had dumped on the bot tom, the boulders being an excellent ref lector
hence minimizing the propor t ion of t ransmi t ted energy . The l a t e r a l extent
of this masking effect is shown on the bedrock elevation plan. The second
complicating factor is that the bank is considerably s teeper : a lmos t a
ve r t i ca l cliff, and under these conditions ve ry l i t t le or no ref lect ion will
occur .
The contours and profi les for the west bank south of V/oodbury
Point r e p r e s e n t an interpolated bank which may in rea l i ty be considerably
s t eeper ; this bank is shown by broken ' ^ub i . i - and profile l i ne s .
The contour plan r e v e a l s a dext ra l d isplacement of the valley at
Woodbury Point on the west bank and at "North Bay" on the eas t bank. This
sha rp turn and resu l tan t s teep slope have tested the migra t ion procedure
a lmos t to its l imi t , therefore any work in the vicinity of this inflection should
thoroughly p re check the contouring in o rde r to es tabl ish the extent of any
e r r o r s .
d) Conclus ions .
The Hydrosonde survey shows the Kootenay Lake to be a
considerably overdeepened glacial valley which follows the line of a
p r e - E a r l y T e r t i a r y uplift r i v e r cou r se ; the r ive r course was not controlled
to any g rea t extent by the underlying geological s t r u c t u r e . The overdeepening
io of the same o rde r of magnitude as the coas ta l f io rds .

- 26 -
2 . Tai l ings / r e a
Severa l t r a v e r s e s were made with the e x p r e s s purpose of de te r
mining the extent and depth of the old tail ings dump. A r e -examina t ion of
r e c o r d s f rom an e a r l i e r survey chows that they did not have sat isfactory
definition of the bottom of the dump; the p re sen t survey de termined the
c r o s s - s e c t i o n profile along a r e s t r i c t e d number of l ines which, whilst not
giving complete information, do give an indication of the probable volume
and hence the tonnage of the dump. The profi les a re shown on Plan 3 for
l ines 7400N, 7500N, and 7600N; Line 7500N was repeated at different
ve r t i c a l s c a l e s , and over a slightly different t r a c k . The position of the bank
shown on the profi les is the es t imated migrated position; it will be apprecia ted
that the predominant ly horizontal bottom r equ i r e s l i t t le , if any, migra t ion
whereas the steep bank, for accu racy , must be fully migra ted , /.ny useful
information available on the old r e c o r d s has been incorporated wherever
poss ib le , and the t r a ck r ecove ry for the ea r ly survey ha3 been es t imated
f rom the available p lans .
The isopachyte map, P lan 2 , shows the Uopachytes of the tailings
area surveyed .
Cn the bas i s of the profi les and isopachyte plan the conclusion
is reached that Line 7400N is over the approximate; cen t re of the tai l ings
dump.
- 27 -
The dense ta i l ings , when dumped, would probably rol l down
the bank somewhat after the manner of a turbidity c u r r e n t , and sett le
as a fan over the unconsolidated lake sed iments ; the tai l ings would then
set t le into the lake sediments due to the effects of differential compaction.
VI ACKNCW LODGEMENTS
The crew of Huntec Limited wish to exp res s the i r grat i tude to
the management and staff, pa r t i cu la r ly the survey c r e w s , for their
hospi ta l i ty and cooperat ion while at Riondel, Br i t i sh Columbia.
HUNTEC LIMITED
J . W. P r i o r , M. Sc. , Geophysicist
Apr i l , 1967

- 2C -
VII REFERENCES
Jakosky, J . J . , Explorat ion Geophysics , Tr i ja Publishing
Company, 1961.
Hagedoorn, J . G . , A P r o c e s s of Geismic Reflection In te rpre ta t ion ,
in Geophysical P rospec t ing , Volume II, Number 2 ,
June , 1954.
Holland, S . 3 . , Landforms of Br i t i sh Columbia, A Physiographic
Outline, Bulletin No. 48 , Br i t i sh Columbia Depar tment
of Mines and Pe t ro l eum R e s o u r c e s , 1964.
Schofield, S. J . , Geology and Ore Deposits of Ainsworth Mining
Camp, Br i t i sh Columbia, Memoir 117, Canada
Geological Survey 19^0.
R ice , H . M , / . , Nelson Map / r e a , E a s t e r n Half, Br i t i sh Columbia,
Memoir 228, Geological Survey of Canada, 1941.