vue international q2 fy2017 noteholder presentation - q2 2017.pdf · 7 market performance –...
TRANSCRIPT

25 July 2017
Vue International Q2 FY2017 Noteholder Presentation

2
IMPORTANT: You must read the following before continuing
PRESENTATION OF FINANCIAL DATA
On 12 August 2016 Vougeot Bidco plc changed its name to Vue International Bidco plc.
This presentation refers to market information obtained from third party sources. “Market Admissions” for UK, Italy and the Netherlands are a measure of paid and unpaid box office admissions and are sourced from the Cinema Advertising Association (“CAA”), Cinetel and Rentrak respectively. Market Admissions for Germany and Poland includes only paid admissions and the sources are Rentrak through www.IBOE.com and www.boxoffice.pl respectively. Gross Box Office Revenue (“GBOR”) measures box office revenue including local sales taxes by film and in aggregate. Market GBOR refers to total GBOR for markets referred to. “Major Territories” and “Vue Major Territories” specifically refer to UK, Germany, Poland, Italy and the Netherlands being the major markets in which Bidco operates. Major Territories Total Market GBOR and Vue Major Territories GBOR are aggregated measures of GBOR for the total market and for Bidco. “Market Share” is Vue Major Territories GBOR as a proportion of Major Territories Total Market GBOR. Market and Vue GBOR information for UK & Ireland, Germany and the Netherlands is sourced from Rentrak through www.IBOE.com, Poland from www.boxoffice.pl and Italy from Cinetel.
The Pro Forma financial information presented in this report has been derived from the consolidated financial statements of Bidco, and the pre-acquisition consolidated financial information of Tulip UK NewCo Limited and its subsidiaries which includes Vue Nederland B.V. (together “VNL”), adjusted to give pro forma effect to the €120m Term Loan B which was issued in July 2016, and the application of the proceeds therefrom.
The Pro Forma financial information also includes the Pro Forma savings resulting from the strategic decision made by the board of directors of the Company to purchase certain contractual digital equipment related to the projection of 3D Films. This decision will result in significant savings in costs and an associated increase in consolidated EBITDA. The Company currently has license arrangements on rolling 5 year terms and where such licenses have terminated or will terminate within the next 24 months the Company has added back the associated cost savings in arriving at Consolidated EBITDA. At 31 May 2017 the increase in Consolidated LTM EBITDA resulting from this reduction in administration expenses is £4.4m comprising £2.8m of actual savings already achieved and £1.6m of annualised pro forma savings which will be achieved on licenses expiring in the next 24 months.
Effective from 28th November 2014, the Company has elected to adopt International Financial Reporting Standards (“IFRS”). All financial information in this presentation has been prepared in accordance with IFRS.
A summary of the financial information on the Pro Forma basis and the Bidco “As Acquired” basis is set out in the Appendices. A reconciliation between the Bidco As Acquired Profit and Loss Account and the audited Statutory Consolidated Profit and Loss Account for Vue International Bidco plc is also provided within the Appendices.
DISCLAIMER
This presentation is for information purposes only and does not constitute an offer to sell or the solicitation of an offer to buy securities. This presentation does not contain all of the information that is material to an investor.
Forward-Looking Statements
This presentation contains “forward-looking statements” as that term is defined by the U.S. federal securities laws and within the meaning of the securities laws of certain other jurisdictions. These forward-looking statements include, without limitation, those regarding our intentions, beliefs or current expectations concerning our future financial condition and performance, results of operations and liquidity; our strategy, plans, objectives, prospects, growth, goals and targets; future developments in the markets in which we participate or are seeking to participate; and anticipated regulatory changes in the industry in which we operate.
These statements often include words such as “anticipate,” “believe,” “could,” “estimates,” “expect,” “forecast,” “intend,” “may,” “plan,” “projects,” “should,” “suggests,” “targets,” “would,” “will,” and other similar expressions. These statements are not guarantees of performance or results. Many factors could affect our actual financial results or results of operations and could cause actual results to differ materially from those expressed in the forward-looking statements and projections.
We undertake no obligation to review or confirm analysts’ expectations or estimates or to release publicly any revisions to any forward-looking statements to reflect events or circumstances after the date of this presentation.
Important Information
2

3
Agenda and Today’s Speakers
Tim Richards CEO
Alison Cornwell CFO
3
Key Financials
Market Update
Highlights Q2 2017
Current Trading Update and Outlook
Summary
Q&A
Steve Knibbs COO

4
Q2 2017 Q2 2016 YTD 2017 YTD 2016
Turnover (£m) 184.7 161.9 7.4% 421.3 402.6 (2.1)%
Consolidated EBITDA (£m) 24.4 21.1 8.5% 80.7 82.5 (9.6)%
Consolidated EBITDA % 13.2% 13.0% 0.1ppt 19.2% 20.5% (1.6)ppt
Admissions (m) 19.0 17.4 9.5% 43.6 44.2 (1.2)%
ATP (£) 6.43 6.07 0.0% 6.36 6.00 (0.6)%
SPP (£) 2.30 2.09 3.5% 2.22 2.01 3.2%
LTM EBITDA (£m) 133.9
Net Leverage 4.6x (Net Leverage 4.6x in constant currency)
Q2 Constant
Currency
YTD Constant
Currency
(LTM EBITDA (£m) in constant currency £136.0)
Highlights Q2 2017
4
• Q2 2017 delivered strong results with growth in admissions and all key revenue and profit metrics vs. Q2 2016
• LTM EBITDA increased to £136.0m in constant currency
• Net leverage 4.6x
– Down from 6.1x peak at Q4 2014
• Slate highlights included Beauty And The Beast, Fast & Furious 8, Guardians Of The Galaxy Vol. 2 and The Boss Baby
• The Manchester Printworks site was rebranded and started to trade as Vue from 25 May 2017, less than 1 week after acquisition
• The redevelopment of Vue’s London West End flagship site was completed and the site re-opened to great acclaim in July 2017

5
Market Performance – UK & Ireland
• UK Market Admissions 12.7% up on Q2 2016 with GBOR up 16.0% due largely to the strong performance of Disney’s live action remake of Beauty And The Beast and inflationary growth in ticket prices
• Q2 2017 also saw a number of titles from popular franchises perform very well including Guardians Of The Galaxy Vol. 2, Fast & Furious 8 and Logan
5
(m)
(£m)
86.0 89.4
YTD 2016 YTD 2017
37.7 42.6
Q2 2016 Q2 2017
Admissions (UK only)
639 671
YTD 2016 YTD 2017
276 320
Q2 2016 Q2 2017
GBOR (UK only)
12.7% 4.0%
16.0% 5.0%
Source: DCM for admissions, IBOE / Rentak for GBOR
Top Titles Q2 2017 - UK & Ireland GBOR (£m) 3D Local
Beauty And The Beast 71.9 Yes No
Guardians Of The Galaxy Vol. 2 36.9 Yes No
Fast & Furious 8 29.5 No No
Boss Baby, The 26.9 Yes No
Logan 23.9 No No
Total Top 5 189.0 3 0
Other 154.3
Total Market 343.3
Top 5 as a % of total market 55.1%
Top Titles Q2 2016 - UK & Ireland GBOR (£m) 3D Local
The Jungle Book 41.8 Yes No
Batman V Superman: Dawn Of Justice 36.6 Yes No
Captain America: Civil War 35.0 Yes No
Zootropolis 23.1 Yes No
Kung Fu Panda 3 13.7 Yes No
Total Top 5 150.2 5 0
Other 143.6
Total Market 293.8
Top 5 as a % of total market 51.1%

6
Market Performance – Germany
• Market Admissions higher by 10.5% in Q2 2017, due mainly to the growth of the Top 5 titles which delivered GBOR of €108.8m (+21.6% on Q2 2016)
• Market GBOR higher by 13.0% due to higher admissions and inflationary growth in ticket prices
• As in the UK, growth was led by the success of Beauty And The Beast and other successful franchise titles
6
(m)
(€m)
62.2 60.9
YTD 2016 YTD 2017
24.1 26.7
Q2 2016 Q2 2017
Admissions
543 531
YTD 2016 YTD 2017
207 234
Q2 2016 Q2 2017
GBOR
10.5% (2.2)%
13.0% (2.1)%
Source: IBOE / Rentrak
Top Titles Q2 2016 - Germany GBOR (€m) 3D Local
Zootopia 29.6 Yes No
Captain America: Civil War 17.7 Yes No
The Jungle Book 16.4 Yes No
Batman V Superman: Dawn Of Justice 15.8 Yes No
Der Geilste Tag 10.0 No Yes
Total Top 5 89.5 4 1
Other 117.9
Total Market 207.4
Top 5 as a % of total market 43.2%
Top Titles Q2 2017 - Germany GBOR (€m) 3D Local
Beauty And The Beast 32.2 Yes No
Fast & Furious 8 29.8 No No
Guardians Of The Galaxy Vol. 2 24.5 Yes No
The Boss Baby 13.0 Yes No
Logan 9.3 No No
Total Top 5 108.8 3 0
Other 125.7
Total Market 234.4
Top 5 as a % of total market 46.4%

7
Market Performance – Poland
• Market Admissions 24.7% up on Q2 2016, with GBOR up 28.8% driven by the Top 5 titles and inflationary growth in ticket prices
• Local content still an important contributor to growth with Porady Na Zdrady achieving GBOR of PLN14.4m
• Strong performance from titles outside the top 5, delivering growth of PLN30.8m (29.8%) including Logan PLN9.2m, Kong: Skull Island PLN8.1m and A Dog's Purpose PLN7.5m
7
168
217
Q2 2016 Q2 2017
(m)
(PLNm)
25.8 28.4
YTD 2016 YTD 2017
9.1 11.4
Q2 2016 Q2 2017
Admissions
480 536
YTD 2016 YTD 2017
GBOR
24.7% 10.0%
28.8% 11.6%
Source: Boxoffice.pl
Top Titles Q2 2017 - Poland GBOR (Złm) 3D Local
Fast & Furious 8 22.1 No No
Beauty And The Beast 19.3 Yes No
The Boss Baby 15.9 Yes No
Porady Na Zdrady 14.4 No Yes
Guardians Of The Galaxy Vol. 2 10.8 Yes No
Total Top 5 82.5 3 1
Other 134.0
Total Market 216.5
Top 5 as a % of total market 38.1%
Top Titles Q2 2016 - Poland GBOR (Złm) 3D Local
7 Rzeczy, Ktorych Nie Wiecie O Facetach 20.9 No Yes
Zootropolis 15.4 Yes No
Kung Fu Panda 3 10.0 Yes No
Captain America: Civil War 9.5 Yes No
The Jungle Book 9.1 Yes No
Total Top 5 64.9 4 1
Other 103.2
Total Market 168.1
Top 5 as a % of total market 38.6%

8
Market Performance – Italy
• Market Admissions in Q2 2017 inline with the prior year despite the strong performance of Beauty And The Beast due mainly to a stronger performance from titles outside of the Top 5 last year including Lo Chiamavano Jeeg Robot and The Huntsman: Winter's War
• GBOR decline higher than the Admissions change reflecting the popular market-wide “Cinema2Days” promotion, launched during Q4 2016 which ended during Q2 2017
8
(m)
(€m)
66.2 58.9
YTD 2016 YTD 2017
23.6 23.5
Q2 2016 Q2 2017
Admissions
428 358
YTD 2016 YTD 2017
145 142
Q2 2016 Q2 2017
GBOR
(0.2)% (11.0)%
(2.0)% (16.2)%
Source: Cinetel
Top Titles Q2 2017 - Italy GBOR (€m) 3D Local
Beauty And The Beast 20.4 Yes No
Fast & Furious 8 14.6 No No
Guardians Of The Galaxy Vol. 2 7.1 Yes No
The Boss Baby 6.7 Yes No
Demain Tout Commence 6.5 No No
Total Top 5 55.2 3 0
Other 87.0
Total Market 142.1
Top 5 as a % of total market 38.8%
Top Titles Q2 2016 - Italy GBOR (€m) 3D Local
Captain America: Civil War 11.0 Yes No
Batman Vs Superman: Dawn Of Justice 10.5 Yes No
The Jungle Book 10.3 Yes No
Kung Fu Panda 3 8.3 Yes No
Perfetti Sconosciuti 5.6 No Yes
Total Top 5 45.6 4 1
Other 99.3
Total Market 145.0
Top 5 as a % of total market 31.5%

9
Market Performance – Netherlands
• Admissions growth of 13.1% and market GBOR growth of 13.6% driven by Beauty And The Beast and strong performance from the other Top 5 titles
• Notable titles outside of the Top 5 included Smurfs: The Lost Village €3.1m, Logan €2.9m and Pirates of the Caribbean: Salazar's Revenge €2.4m
9
(m)
(€m)
17.3 18.7
YTD 2016 YTD 2017
7.1 8.0
Q2 2016 Q2 2017
Admissions
148 160
YTD 2016 YTD 2017
60 69
Q2 2016 Q2 2017
GBOR
13.1% 8.3%
13.6% 7.9%
Source: Cinetel
Top Titles Q2 2016 - Netherlands GBOR (£m) 3D Local
The Jungle Book 8.4 Yes No
Captain America: Civil War 3.7 Yes No
Batman vs. Superman: Dawn of Justice 3.7 Yes No
Rokjesdag 3.2 No Yes
Zootropolis 3.2 Yes No
Total Top 5 22.2 4 1
Other 38.2
Total Market 60.4
Top 5 as a % of total market 36.8%
Top Titles Q2 2017 - Netherlands GBOR (£m) 3D Local
Beauty And The Beast 7.8 Yes No
Fast & Furious 8 7.5 No No
The Boss Baby 5.3 Yes No
Kong: Skull Island 3.7 Yes No
Guardians Of The Galaxy Vol. 2 3.7 Yes No
Total Top 5 28.0 4 0
Other 40.6
Total Market 68.6
Top 5 as a % of total market 40.9%

10
Q2 2017 Q2 2016 Variance Constant Currency
YTD 2017 YTD 2016 Variance Constant Currency
UK Market GBOR (£m) 319.9 275.7 16.0% 16.0% 671.2 639.0 5.0% 5.0%
Germany Market GBOR (£m) 201.1 161.3 24.7% 13.0% 454.8 416.4 9.2% (2.1)%
Poland Market GBOR (£m) 44.3 30.3 46.1% 28.8% 107.0 85.2 25.6% 11.6%
Italy Market GBOR (£m) 122.0 112.8 8.2% (2.0)% 306.7 328.2 (6.6)% (16.2)%
Netherlands Market GBOR (£m) 58.9 46.9 25.4% 13.6% 136.5 113.5 20.2% 7.9%
Major Territories Total Market GBOR (£m) 746.2 627.1 19.0% 12.2% 1,676.1 1,582.3 5.9% (0.9)%
Vue Major Territories GBOR (£m) 129.9 113.0 14.9% 8.5% 295.9 284.8 3.9% (2.6)%
Vue Major Territories GBOR Market Share (%) 17.4% 18.0% (0.6)ppt (0.6)ppt 17.7% 18.0% (0.3)ppt (0.3)ppt
Market GBOR Share Summary
• Vue’s blended GBOR market share decreased by 0.6ppt in Q2 2017 against the prior year, reflecting:
– Lower market share in the UK due to the closure of the West End flagship site for its redevelopment (March to mid July), disruption caused by construction works in connection with Westfield’s expansion, various temporary screen closures due to recliner and VIP seat installations
– Continued share growth in the Netherlands, following continued benefit from the “Movie Pass” subscription scheme
– Lower market share in Germany and Poland mainly due changes in genre mix with stronger performance of kids titles in Germany overall and wider distribution of local content tiles in Poland during Q2 2017
10

11
West End Redevelopment
• First opened by Warner in 1938, located on iconic Leicester
Square, weekly footfall for the square in excess of 2.5m
• Cohesive design ethos bringing more natural light in the
new foyer and retail spaces
• Newly designed retail areas including a wider premium
range such as Malletti Pizza, Square Pie, Ben & Jerrys,
Starbucks and a full Bar offer
• New Fox Slider seating as standard throughout all screens
• Luxury fully-reclining seating options
• Dolby Atmos and Sony Finity Double Stack projection have
been installed in the two largest screens to provide the
ultimate audio visual experience
• Successful re-opening on 11 July 2017
11
Redesigned exterior
Upstairs bar

12
Other Initiatives and Developments in 2017
• Acquisition and rebranding of 20 screen Manchester
Printworks site in May 2017
• Further investment in recliner seating with installations
completed at Newcastle-Under-Lyme and Cwmbran in the
UK and orders placed for sites in Poland and the
Netherlands
• Enhanced VIP seating installed at all sites in Italy and
Poland with further phases under consideration in several
territories
• Additional screens installed at Kerkrade in the Netherlands
(2 screens in Q2 2017) and Westfield flagship site in the UK
(3 screens in Q3 2017)
• New UK site opening in Bedford on 26 July 2017
• New UK mobile booking app launched 23 May 2017
• Refurbishment including a 7 screen recliner seat roll-out
under way at Preston in the UK to be followed by further
refurbishments in Poland and Germany
12
Cwmbran Recliners
VIP seating Italy

13
Q2 2017 Q2 2016 Variance Constant Currency
YTD 2017 YTD 2016 Variance Constant Currency
Box Office Revenue (£m) 122.2 105.4 15.9% 9.5% 277.7 265.1 4.8% (1.8)%
Concessions Revenue (£m) 43.7 36.3 20.3% 13.3% 96.9 88.9 9.0% 1.9%
Screen Advertising and Other Revenue (£m) 18.8 20.2 (7.1)% (13.6)% 46.7 48.5 (3.8)% (10.9)%
Group Turnover (£m) 184.7 161.9 14.0% 7.4% 421.3 402.6 4.6% (2.1)%
Admissions (m) 19.0 17.4 9.5% 9.5% 43.6 44.2 (1.2)% (1.2)%
ATP (£) 6.43 6.07 5.9% 0.0% 6.36 6.00 6.0% (0.6)%
SPP (£) 2.30 2.09 9.9% 3.5% 2.22 2.01 10.3% 3.2%
Total Revenue per Person (£) 9.72 9.33 4.2% (1.9)% 9.66 9.11 6.0% (0.8)%
Financial Information – Turnover
• Strong increase in Group Turnover in Q2 vs. the prior year, with growth of 7.4% driven by increased admissions
• ATP marginally higher than the prior year at constant currency, reflecting price increases (mainly in Poland)
being offset by the Cinema2Days market-wide discounting scheme in Italy
• SPP up 8p (+3.5%) in constant currency with continued growth across all territories, driven by new products,
initiatives and merchandise income
• Screen Advertising and Other Revenue lower due mainly to the cessation of film distribution activities in
Poland, lower 3D glasses revenue due to lower 3D mix and a higher benefit from unredeemed vouchers in 2016
13

14
Financial Information – Margin and Costs
14
• Gross Profit % lower by 1.2ppt in constant currency due mainly to higher Film Rental % resulting from the higher
concentration of the Top 5 movies in Q2 2017 vs Q2 2016 and which typically command a higher Film Rental %
• Administrative expenses were 6.9% higher in constant currency due to the increased volume of admissions driving
staff costs and also due to lower property tax rebates. As a % of revenue administrative expenses decreased by
0.1ppt
• Rent costs were 0.6% higher in constant currency due to indexation and a new UK site (Darlington) being largely
offset by lease re-gear benefits. As a % of revenue rent costs decreased by 1.2ppt
• The group delivered EBITDA of £24.4m which was 8.5% higher than Q2 2016 driven by increased admissions
Q2 2017 Q2 2016 Variance Constant Currency
YTD 2017 YTD 2016 Variance Constant Currency
Turnover (£m) 184.7 161.9 14.0% 7.4% 421.3 402.6 4.6% (2.1)%
Gross profit (£m) 113.4 101.3 11.9% 5.3% 261.4 249.6 4.7% (2.0)%
Gross profit % 61.4% 62.6% (1.2)ppt (1.2)ppt 62.1% 62.0% 0.1ppt 0.0ppt
Administrative expenses (£m) (56.4) (49.6) (13.6)% (6.9)% (115.1) (105.8) (8.7)% (2.1)%
Administrative expenses as % of revenue 30.5% 30.7% 0.1ppt 0.1ppt 27.3% 26.3% (1.0)ppt (1.1)ppt
Rent (£m) (32.6) (30.6) (6.6)% (0.6)% (65.6) (61.2) (7.2)% (1.1)%
Rent as % of revenue 17.6% 18.9% 1.2ppt 1.2ppt 15.6% 15.2% (0.4)ppt (0.5)ppt
Consolidated EBITDA (£m) 24.4 21.1 15.7% 8.5% 80.7 82.5 (2.2)% (9.6)%
Consolidated EBITDA % 13.2% 13.0% 0.2ppt 0.1ppt 19.2% 20.5% (1.3)ppt (1.6)ppt

15
Financial Information – Cashflow and Net Debt Movement
15 Note: Q2 2016 has been restated to include VNL which was owned by the Vue International Holdco group in Q2 2016 but held outside the Restricted Group until Q3 2016
• Net debt increased by £13.5m during the quarter
• Q2 2017 highlights include:
• Significant EBITDA of £24.4m;
• Working capital outflow due mainly to the timing of film rental and VAT payments;
• Capital expenditure principally in relation to recliner seating, digital signage and the redevelopment of the West
End site in London;
• Unrealised FX losses on Euro denominated debt due to the continued weakening of GBP
Q2 2017 Q2 2016 2017 YTD 2016 YTD
Consolidated EBITDA (£m) 24.4 21.1 80.7 82.5
Working Capital (Trade) (12.4) (18.2) (4.4) (25.9)
Working Capital (Non Trade) (3.2) (1.0) (4.4) (0.7)
Net Capital Expenditure (8.3) (8.5) (14.9) (15.2)
Tax Paid (3.9) (3.6) (4.7) (4.8)
Other (Including Non-Cash Adjustments) 5.7 (5.7) (1.2) (7.1)
Operating Cash Flow (£m) 2.3 (15.9) 51.1 28.8
Interest Costs (6.4) (5.5) (25.0) (23.2)
Total Cash Flow Excluding Debt (£m) (4.1) (21.4) 26.1 5.6
Non Cash Movements in Net Debt:
Unrealised FX (loss)/gain on Euro Bonds and Term Loan B (10.1) 10.5 (9.4) (20.0)
Unrealised FX gain/(loss) on Cash, Other Loans and Finance Leases 2.8 (1.2) 3.2 0.6
Amortisation of Capitalised Fees on RCF (0.1) (0.1) (0.1) (0.1)
Amortisation of Capitalised Fees on Bond and Term Loan B (1.0) (1.2) (2.0) (2.7)
Finance Lease Liability Adjustments (1.0 ) 1.1 (2.4) 1.3
Dec/(inc) in Net Debt (per Leverage Definition) (£m) (13.5) (12.3) 15.4 (15.3)

16
Financial Information – Capital Structure and Leverage Development
• Net leverage was 4.6x at the end of Q2 2017 and relatively constant over the period driven by:
• £3.3m increase in LTM EBITDA in Q2 2017; offset by
• £13.5m increase in net debt due mainly to the strengthening of the Euro against Sterling (€1.1462: £1
at Q2 2017, €1.1747:£1 at Q1 2017) thereby increasing the GBP value of Euro denominated liabilities
• Substantial cash balances and no RCF drawings
16
Q2 2017 Q1 2017 Q4 2016
£300m Sterling Fixed Rate Notes (Net of Unamortised Financing Costs) 295.7 295.4 295.1
€360m Euro Floating Rate Notes (Net of Unamortised Financing Costs) 306.4 298.3 298.0
€120m Euro Term Loan B (Net of Unamortised Financing Costs) 102.5 99.9 99.7
Revolving Credit Facility - - -
Finance Leases and Other Loans 36.9 38.2 39.4
Unamortised Financing Fees on RCF (0.6) (0.7) (0.8)
Total External Debt Net of Fees (£m) 740.8 731.2 731.5
Cash 127.5 131.4 102.9
Restricted Cash (6.8) (6.9) (6.9)
Unrestricted Cash and Cash Equivalents (£m) 120.7 124.5 96.0
Total External Net Debt (£m) 620.1 606.7 635.6
Gross Leverage (x) 5.5x 5.6x 5.4x
Net Leverage (x) 4.6x 4.6x 4.7x
LTM Pro Forma Consolidated EBITDA (£m) 133.9 130.6 135.7
17
Current Trading Update and Outlook
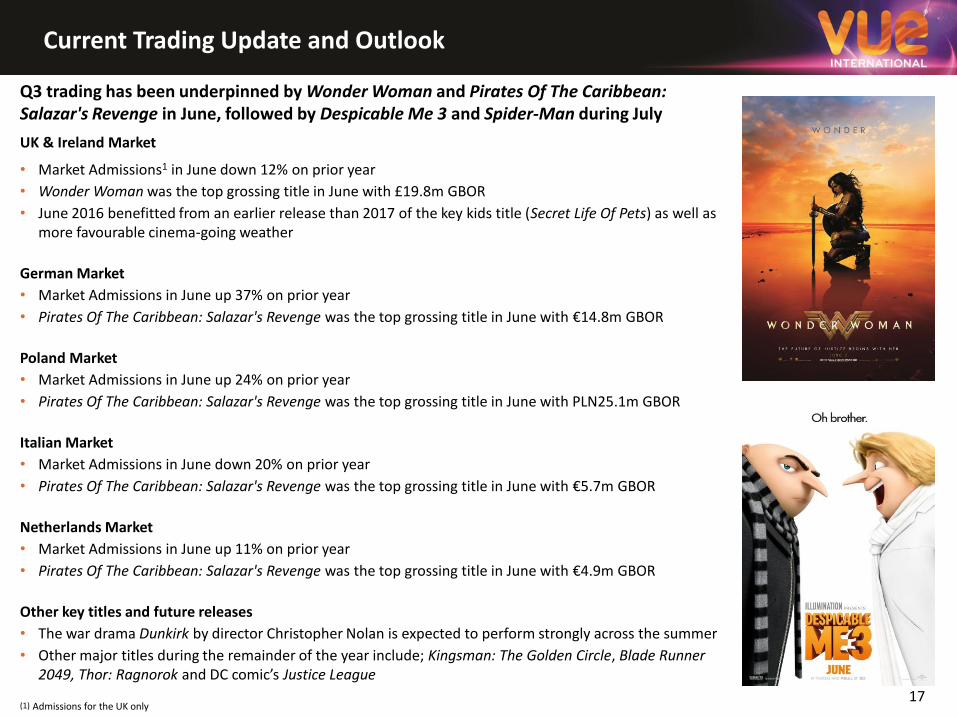
Q3 trading has been underpinned by Wonder Woman and Pirates Of The Caribbean: Salazar's Revenge in June, followed by Despicable Me 3 and Spider-Man during July
UK & Ireland Market
• Market Admissions1 in June down 12% on prior year
• Wonder Woman was the top grossing title in June with £19.8m GBOR
• June 2016 benefitted from an earlier release than 2017 of the key kids title (Secret Life Of Pets) as well as more favourable cinema-going weather
German Market
• Market Admissions in June up 37% on prior year
• Pirates Of The Caribbean: Salazar's Revenge was the top grossing title in June with €14.8m GBOR
Poland Market
• Market Admissions in June up 24% on prior year
• Pirates Of The Caribbean: Salazar's Revenge was the top grossing title in June with PLN25.1m GBOR
Italian Market
• Market Admissions in June down 20% on prior year
• Pirates Of The Caribbean: Salazar's Revenge was the top grossing title in June with €5.7m GBOR
Netherlands Market
• Market Admissions in June up 11% on prior year
• Pirates Of The Caribbean: Salazar's Revenge was the top grossing title in June with €4.9m GBOR
Other key titles and future releases
• The war drama Dunkirk by director Christopher Nolan is expected to perform strongly across the summer
• Other major titles during the remainder of the year include; Kingsman: The Golden Circle, Blade Runner 2049, Thor: Ragnorok and DC comic’s Justice League
17 (1) Admissions for the UK only

18
Summary
18
• 15.7% increase in EBITDA during the quarter against prior year at actual FX rates (8.5% in constant currency)
• Strong performance from Beauty And The Beast and comic book sequels Guardians of the Galaxy Vol. 2 and Logan
• Successful reopening of UK West End flagship site following exciting, large-scale redevelopment
• Further roll out of luxury seating options in UK, Poland and Italy
• Major site refurbishments, new screens and new UK site on track for delivery in H2 2017
• Appealing range of summer blockbusters with further highly anticipated titles in Q4 2017 and beyond

19
Q&A
Further questions can be addressed to
Provisional Dates: Q3 2017 Investor Call
18 October 2017 2.00pm
19

20
Appendices
20
21
As at 31 May
2017 UK & Ireland
Germany &
Denmark
Poland &
Baltics (1) Italy Netherlands Taiwan Group
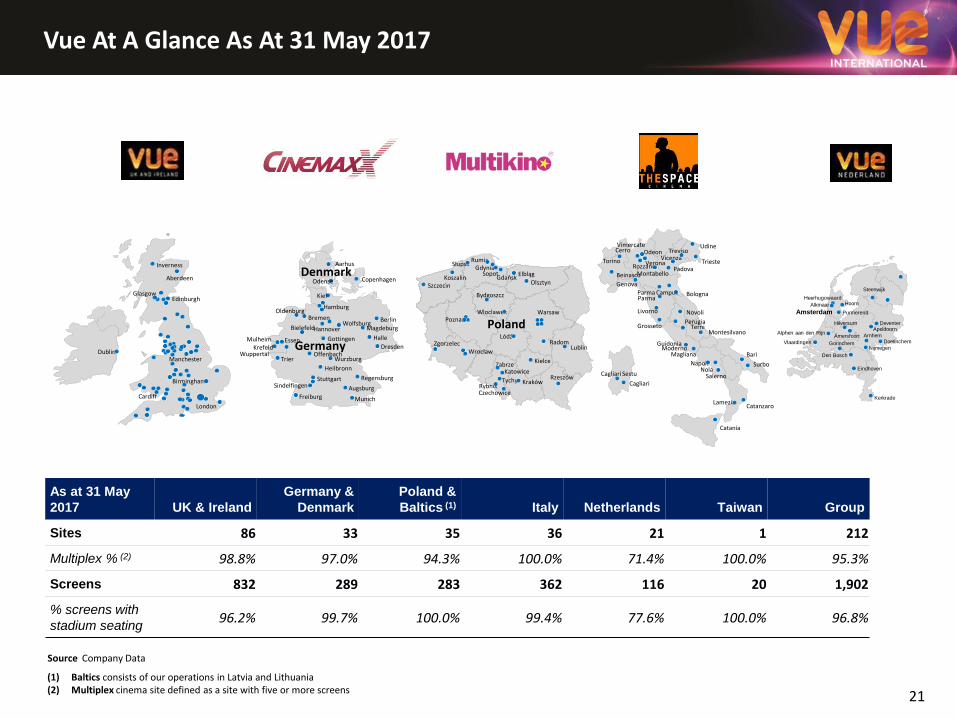
Sites 86 33 35 36 21 1 212
Multiplex % (2) 98.8% 97.0% 94.3% 100.0% 71.4% 100.0% 95.3%
Screens 832 289 283 362 116 20 1,902
% screens with
stadium seating 96.2% 99.7% 100.0% 99.4% 77.6% 100.0% 96.8%
Dublin
Inverness
Aberdeen
Glasgow Edinburgh
London
Cardiff
Birmingham
Manchester
Aarhus
Odense Copenhagen
Berlin
Magdeburg
Halle
Dresden
Regensburg
Augsburg
Munich
Kiel
Wolfsburg
Hamburg Oldenburg
Bremen
Mulheim Essen Krefeld
Wuppertal Trier
Offenbach
Stuttgart
Heilbronn
Sindelfingen
Freiburg
Germany
Denmark
Gottingen
Wurzburg
Hannover Bielefeld
Elbląg Gdańsk
Sopot Gdynia
Rumia Słupsk
Koszalin Szczecìn
Bydgoszcz
Poznań Poland
Wloclawek
Lódź Radom
Warsaw
Kielce
Rzeszów Kraków
Rybnik
Zabrze
Wrocław Zgorzelec
Tychy
Czechowice
Lublin
Katowice
Olsztyn
Cagliari
Cagliari Sestu
Catania
Catanzaro Lamezia
Surbo
Bari
Salerno Nola
Napoli
Montesilvano
Magliana Moderno
Guidonia
Terni Perugia
Novoli
Bologna
Grosseto
Livorno
Parma Parma Campus
Genova
Beinasco
Rozzano Torino
Cerro Vimercate
Odeon
Trieste
Udine Treviso
Padova
Vicenza Verona
Montabello
Steenwijk
Hoorn Heerhugowaard
Alkmaar
Amsterdam Purmerend
Hilversum Deventer Apeldoorn
Amersfoort Arnhem Doetinchem
Nijmegen
Alphen aan den Rijn
Vlaardingen Gorinchem
Den Bosch
Eindhoven
Kerkrade
Vue At A Glance As At 31 May 2017
(1) Baltics consists of our operations in Latvia and Lithuania (2) Multiplex cinema site defined as a site with five or more screens 21
Source Company Data

22
Definitions
22
Definitions
• Major Territories Total Market GBOR is the aggregate of Total Market GBOR for the UK, Germany, Poland, Italy and the Netherlands
• Vue Major Territories GBOR is the aggregate of Group GBOR in Vue UK (excluding Ireland), CinemaxX (excluding Denmark), Multikino (excluding Latvia and
Lithuania), Italy and the Netherlands
• Vue Group Admissions includes all paid and unpaid admissions in the period for UK & Ireland, Germany, Poland, Italy, the Netherlands, the Baltics,
Denmark and Taiwan
• Vue Group ATP is calculated as total Group Box Office Revenue in the period (excluding VAT) divided by Vue Group Admissions
• Vue Group SPP is calculated as total Group Concessions Revenue in the period (excluding VAT) divided by Vue Group Admissions
• Vue Group Revenue Per Head is calculated as total Group Turnover for the period (excluding VAT) divided by Vue Group Admissions
• Restricted Cash relates to rental deposits held in relation to certain Group cinema sites
• Pro Forma Consolidated EBITDA is defined as per the Quarterly Report to Noteholders published at the same time as this presentation
Currency Rates
• EUR to GBP average exchange rates: 1.1628 for Q2 2017; 1.2884 for Q2 2016
• EUR to GBP period end rates: 1.1462 at Q2 2017; 1.3148 at Q2 2016
• PLN to GBP average exchange rates: 4.8907 for Q2 2017; 5.6129 for Q2 2016
• PLN to GBP period end rates: 4.7844 for Q2 2017; 5.7965 for Q2 2016
Market Data
• UK • Q2 2017 the 13 weeks ended 25 May 2017; Q2 2016 the 13 weeks ended 26 May 2016
• YTD 2017 the 26 weeks ended 25 May 2017; YTD 2016 the 26 weeks ended 26 May 2016
• Market data sourced from IBOE.com/Rentrak for GBOR, DCM for Admissions
• Germany • Q2 2017 1 March 2017 to 31 May 2017; Q2 2016 1 March 2016 to 31 May 2016
• YTD 2017 1 December 2016 to 31 May 2017; YTD 2016 1 December 2015 to 31 May 2016
• Market data sourced from IBOE.com/Rentrak
• Poland • Q2 2017 1 March 2017 to 31 May 2017; Q2 2016 1 March 2016 to 31 May 2016
• YTD 2017 1 December 2016 to 31 May 2017; YTD 2016 1 December 2015 to 31 May 2016
• Market data sourced from Boxoffice.pl
• Italy • Q2 2017 1 March 2017 to 31 May 2017; Q2 2016 1 March 2016 to 31 May 2016
• YTD 2017 1 December 2016 to 31 May 2017; YTD 2016 1 December 2015 to 31 May 2016
• Netherlands
• Market data sourced from Cinetel
• Q2 2017 1 March 2017 to 31 May 2017; Q2 2016 1 March 2016 to 31 May 2016
• YTD 2017 1 December 2016 to 31 May 2017; YTD 2016 1 December 2015 to 31 May 2016
• Market data sourced from IBOE.com/Rentrak

23
Financial Bridges 2017
These bridges summarise the key
reconciling items between the As
Acquired, Pro Forma and Statutory
financials.
In Q2 2017 the Group had £3.4m of
non-cash/non recurring items which
were excluded from EBITDA in
accordance with definitions contained in
the Indenture and treated as
exceptional items in the Statutory
accounts. This amounts to £1.6m on a
YTD basis.
23
£m Quarter YTD
As Acquired to Pro Forma 3 Months ended 31 May 2017 Year to Date ended 31 May 2017
As Acquired Real D PF Pro Forma As Acquired Real D PF Pro Forma
Turnover 184.7 - 184.7 421.3 - 421.3
Cost of Sales (71.3) - (71.3) (159.8) - (159.8)
113.4 - 113.4 261.4 - 261.4
Admin expenses (57.2) 0.8 (56.4) (116.2) 1.1 (115.1)
Rentals under operating leases (32.6) - (32.6) (65.6) - (65.6)
EBITDA 23.6 0.8 24.4 79.6 1.1 80.7
Non-recurring / exceptional Items
2.4 (0.8) 1.5 0.6 (1.1) (0.5)
Depreciation (13.2) - (13.2) (26.6) - (26.6)
Amortisation (0.6) - (0.6) (1.2) - (1.2)
Group operating profit / (loss) 12.1 - 12.1 52.4 - 52.4
£m Quarter YTD
As Acquired to Statutory 3 Months ended 31 May 2017 Year to Date ended 31 May 2017
As Acquired Non Rec Statutory As Acquired Non Rec Statutory
Turnover 184.7 184.7 421.3 421.3
Cost of Sales (71.3) (71.3) (159.8) (159.8)
113.4 113.4 261.4 261.4
Admin expenses (57.3) (1.0) (58.3) (116.2) (1.0) (117.2)
Rentals under operating leases (32.6) (32.6) (65.6) (65.6)
EBITDA 23.6 (1.0) 22.5 79.6 (1.0) 78.6
Non-recurring / exceptional Items
2.4 1.0 3.4 0.6 1.0 1.6
Depreciation (13.2) (13.2) (26.6) (26.6)
Amortisation (0.6) (0.6) (1.2) (1.2)
Group operating profit / (loss) 12.1 - 12.1 52.4 - 52.4

24
Financial Bridges 2016
These bridges summarise the key reconciling items between the As Acquired, Pro Forma and Statutory financials.
As Acquired to Pro Forma: The results of VNL have been included in the Pro Forma results for the quarter and YTD.
As Acquired to Statutory: 2016 comparatives for Statutory accounting purposes have been restated to include VNL from 20 August 2015 which is the date on which the business was originally acquired outside of the Restricted Group. This accounting treatment is known as “predecessor accounting” which governs corporate transfers within the same group and has been recommended by Bidco’s auditor.
In Q2 2016 the Group had £2.2m of
non-cash/non recurring items which
were excluded from EBITDA in
accordance with definitions contained
in the Indenture and treated as
exceptional items in the Statutory
accounts. This amounted to £3.0m on a
YTD basis.
24
(1) The As Acquired basis excludes VNL
(2) The Pro Forma basis includes VNL for the whole Quarter and YTD
(3) The Statutory basis includes VNL for the whole Quarter and YTD
£m Quarter YTD
As Acquired to Pro Forma 13 Weeks ended 26 May 2016 26 Weeks ended 26 May 2016
As Acquired (1)
RealD PF Vue NL PF Pro Forma
(2) As Acquired
(1) RealD PF Vue NL PF
Pro Forma (2)
Turnover 153.2 - 8.7 161.9 381.8 - 20.8 402.6
Cost of Sales (57.4) - (3.3) (60.6) (145.1) - (7.9) (153.0)
95.8 - 5.5 101.3 236.7 - 12.9 249.6
Admin expenses (49.3) 2.1 (2.4) (49.6) (102.8) 2.0 (5.1) (105.8)
Rentals under operating leases (28.9) - (1.6) (30.6) (58.1) - (3.1) (61.2)
EBITDA 17.6 2.1 1.4 21.1 75.8 2.0 4.7 82.5
- - - - - - - -
Non-recurring / exceptional Items (2.2) (2.1) - (4.4) (3.0) (2.1) - (5.1)
Depreciation (12.0) - (1.0) (13.0) (24.1) - (1.7) (25.9)
Amortisation (0.4) - (0.2) (0.6) (0.5) - (0.3) (0.8)
Group operating profit / (loss) 2.9 - 0.2 3.2 48.2 - 2.7 50.8
£m Quarter YTD
As Acquired to Statutory 13 Weeks ended 26 May 2016 26 Weeks ended 26 May 2016
As Acquired (1)
Vue NL PF Statutory
(3) As Acquired
(1) Vue NL PF
Statutory (3)
Turnover 153.2 8.7 161.9 381.8 20.8 402.6
Cost of Sales (57.4) (3.3) (60.6) (145.1) (7.9) (153.0)
95.8 5.5 101.3 236.7 12.9 249.6
Admin expenses (49.3) (2.4) (51.7) (102.8) (5.1) (107.8)
Rentals under operating leases (28.9) (1.6) (30.6) (58.1) (3.1) (61.2)
EBITDA 17.6 1.4 19.0 75.8 4.7 80.6
Non-recurring / exceptional Items (2.2) - (2.2) (3.0) - (3.0)
Depreciation (12.0) (1.0) (13.0) (24.1) (1.7) (25.9)
Amortisation (0.4) (0.2) (0.6) (0.5) (0.3) (0.8)
Group operating profit / (loss) 2.9 0.2 3.2 48.2 2.7 50.8

25
Vue International Bidco plc As Acquired Consolidated Profit and Loss Account
For the 3 months and 6 months ended 31 May 2017
25
Bidco Bidco Bidco Bidco
For the 3
months ended
31 May 2017
For the 13
w eeks ended
26 May 2016
For the YTD
period ended
31 May 2017
For the YTD
period ended
26 May 2016
£m (unaudited)
Turnover 184.7 153.2 421.3 381.8
Cost of sales (71.3) (57.4) (159.8) (145.1)
113.4 95.8 261.4 236.7
Administration expenses (as per management) (57.2) (49.3) (116.2) (102.8)
Rentals under operating leases on land and buildings (32.6) (28.9) (65.6) (58.1)
Consolidated EBITDA 23.6 17.6 79.6 75.8
Non-cash & non-recurring Items 2.4 (2.2) 0.6 (3.0)
Depreciation (13.2) (12.0) (26.6) (24.1)
Amortisation (0.6) (0.4) (1.2) (0.5)
Group operating profit/(loss) 12.1 2.9 52.4 48.2
Turnover 184.7 153.2 421.3 381.8
Cost of sales (71.3) (57.4) (159.8) (145.1)
113.4 95.8 261.4 236.7
Administration expenses (101.3) (92.9) (209.0) (188.5)
Group operating profit/(loss) 12.1 3.0 52.4 48.3
Depreciation 13.2 12.0 26.6 24.1
Amortisation 0.6 0.4 1.2 0.5
EBITDA 25.9 15.4 80.2 72.9
Non-cash & non-recurring Items (2.4) 2.2 (0.6) 3.0
Consolidated EBITDA 23.6 17.6 79.6 75.8
Rentals under operating leases on land and buildings 32.6 28.9 65.6 58.1
Consolidated EBITDAR 56.2 46.5 145.4 133.9
Administration expenses (as per management) (57.2) (49.3) (116.2) (102.8)
Rentals under operating leases on land and buildings (32.6) (28.9) (65.6) (58.1)
Depreciation (13.2) (12.0) (26.6) (24.1)
Amortisation (0.6) (0.4) (1.2) (0.5)
Non-cash & non-recurring Items 2.4 (2.2) 0.6 (3.0)
Administration expenses (101.3) (92.9) (209.0) (188.5)
As Acquired

26 26
Vue International Bidco plc Pro Forma Consolidated Profit and Loss Account
For the three months and six months ended 31 May 2017
Bidco Bidco Bidco Bidco
For the 3
months ended
31 May 2017
For the 13
w eeks ended
26 May 2016
For the YTD
period ended
31 May 2017
For the YTD
period ended
26 May 2016
£m (unaudited)
Turnover 184.7 161.9 421.3 402.6
Cost of sales (71.3) (60.6) (159.8) (153.0)
113.4 101.3 261.4 249.6
Administration expenses (as per management) (56.4) (49.6) (115.1) (105.8)
Rentals under operating leases on land and buildings (32.6) (30.6) (65.6) (61.2)
Consolidated EBITDA 24.4 21.1 80.7 82.5
Non-cash & non-recurring Items 1.5 (4.4) (0.5) (5.1)
Depreciation (13.2) (13.0) (26.6) (25.9)
Amortisation (0.6) (0.6) (1.2) (0.8)
Group operating profit/(loss) 12.1 3.2 52.4 50.8
Turnover 184.7 161.9 421.6 402.6
Cost of sales (71.3) (60.6) (160.1) (153.0)
113.4 101.3 261.4 249.6
Administration expenses (101.3) (98.1) (209.0) (198.8)
Group operating profit/(loss) 12.1 3.2 52.4 50.8
Depreciation 13.2 13.0 26.6 25.9
Amortisation 0.6 0.6 1.2 0.8
EBITDA 25.9 16.7 80.2 77.4
Non-cash & non-recurring Items (1.5) 4.4 0.5 5.1
Consolidated EBITDA 24.4 21.1 80.7 82.5
Rentals under operating leases on land and buildings 32.6 30.6 65.6 61.2
Consolidated EBITDAR 57.0 51.7 146.3 143.7
Administration expenses (as per management) (56.4) (49.6) (115.1) (105.8)
Rentals under operating leases on land and buildings (32.6) (30.6) (65.6) (61.2)
Depreciation (13.2) (13.0) (26.6) (25.9)
Amortisation (0.6) (0.6) (1.2) (0.8)
Non-cash & non-recurring Items 1.5 (4.4) (0.5) (5.1)
Administration expenses (101.3) (98.1) (209.0) (198.8)
Pro Forma

27 27
Reconciliation of Bidco As Acquired to Vue International Bidco plc Condensed Consolidated Profit and Loss Account for the three months and six months ended 31 May 2017
Bond
reporting
Statutory
reporting
Bond
reporting
Statutory
reporting
For the 3
months
ended 31
May 2017
Adjs
For the 3
months
ended 31
May 2017
For the YTD
period
ended 31
May 2017
Adjs
For the YTD
period
ended 31
May 2017
£m
Turnover 184.7 - 184.7 421.3 - 421.3
Cost of sales (71.3) - (71.3) (159.8) - (159.8)
Gross margin 113.4 - 113.4 261.4 - 261.4
Administration expenses (as per management) (57.3) (1.0) (58.3) (116.2) (1.0) (117.2)
Operating lease rentals - land and buildings (32.6) - (32.6) (65.6) - (65.6)
Consolidated EBITDA 23.6 (1.0) 22.5 79.6 (1.0) 78.6
Non-cash & non-recurring Items 2.4 1.0 3.4 0.6 1.0 1.6
Depreciation (13.2) - (13.2) (26.6) - (26.6)
Amortisation (0.6) - (0.6) (1.2) - (1.2)
Group operating profit/(loss) 12.1 - 12.0 52.4 - 52.4
Gross margin 61.4% 61.4% 62.1% 62.1%
Consolidated EBITDA margin 12.8% 12.2% 18.8% 18.7%
Turnover 184.7 - 184.7 421.3 - 421.3
Cost of sales (71.3) - (71.3) (159.8) - (159.8)
Gross margin 113.4 - 113.4 261.4 - 261.4
Administration expenses (101.3) - (101.3) (209.0) (209.0)
Group operating profit/(loss) 12.1 - 12.1 52.4 - 52.4
Depreciation 13.2 - 13.2 26.6 - 26.6
Amortisation 0.6 - 0.6 1.2 - 1.2
EBITDA 25.9 - 25.9 80.2 - 80.2
Non-cash & non-recurring Items (2.4) (1.0) (3.4) (0.6) (1.0) (1.6)
Consolidated EBITDA 23.6 (1.0) 22.5 79.6 (1.0) 78.6
Operating lease rentals - land and buildings 32.6 - 32.6 65.6 - 65.6
Consolidated EBITDAR 56.1 (1.0) 55.1 145.4 (1.0) 144.4
Administration expenses (as per management) (57.2) (1.0) (58.3) (116.2) (1.0) (117.3)
Operating lease rentals - land and buildings (32.6) - (32.6) (65.6) - (65.6)
Depreciation (13.2) - (13.2) (26.6) - (26.6)
Amortisation (0.6) - (0.6) (1.2) - (1.2)
Non-cash & non-recurring Items 2.4 1.0 3.4 0.6 1.0 1.6
Administration expenses (101.3) - (101.3) (209.0) - (209.0)
As Acquired