volvo cars 2019 results presentation/media/files/v/volvo-cars-ir/results... · volvo car group...
TRANSCRIPT
Volvo Cars
2019 Results PresentationCarla De Geyseleer
Volvo Car Group Results Presentation January – December 2019
DISCLAIMER
Volvo Car Group Results Presentation January – December 2019
By accepting this document, the person to whom it is provided (the “Recipient”) agrees to be bound by thefollowing obligations and limitations.This document has been prepared and issued by Volvo Car AB (together with its subsidiaries, “Volvo Cars”).The information contained in this document is derived from sources that have not been independentlyverified. Except in the case of fraudulent misrepresentation, no responsibility or liability is accepted by VolvoCars or by any of its respective officers, employees, affiliates or agents in relation to the accuracy,completeness or sufficiency of any information contained herein or any other written or oral informationmade available by Volvo Cars in connection therewith or any data which any such information generates, orfor any loss whatsoever arising from or in connection with the use of or reliance on this document and anysuch liability is expressly disclaimed. Analyses and opinions contained herein may be based on assumptionsthat, if altered, can change the analyses or opinions expressed. This document speaks as of the date hereofand in providing this document, Volvo Cars gives no undertaking and is under no obligation to provide theRecipient with access to any additional information or to update this document or to correct anyinaccuracies in it which may become apparent. Volvo Cars’ past performance is not necessarily indicative offuture results and nothing contained herein shall constitute any representation or warranty as to futureperformance of Volvo Cars or any security, credit, currency, rate or other market or economic measure. Nordoes this document constitute a recommendation with respect to any securities.
2
Volvo Car Group Results Presentation January – December 2019
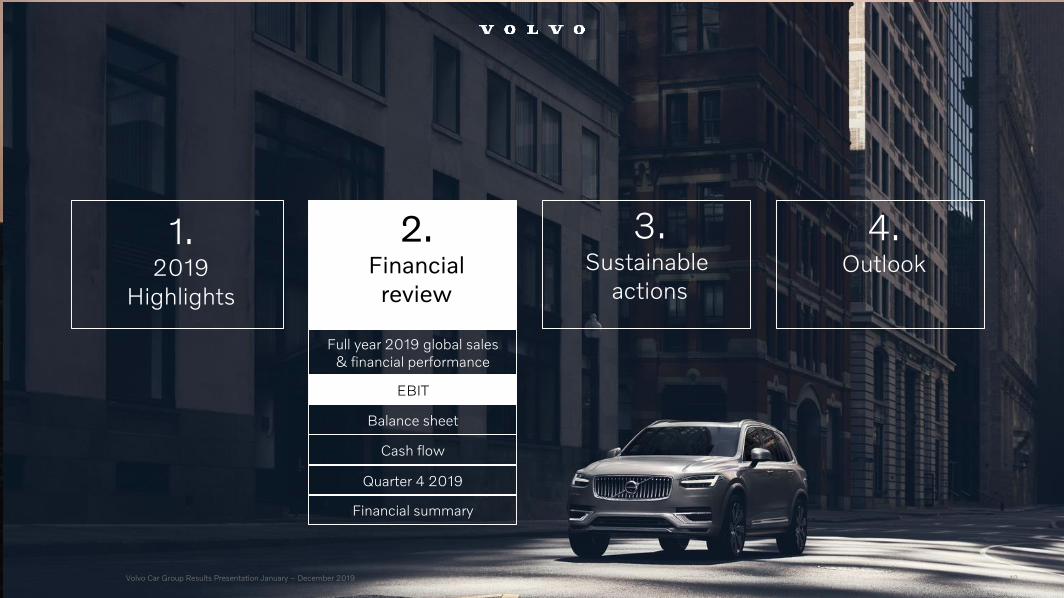
2.Financial
review
4.Outlook
1.2019
Highlights
3.Sustainable
actions
3
Volvo Car Group Results Presentation January – December 2019
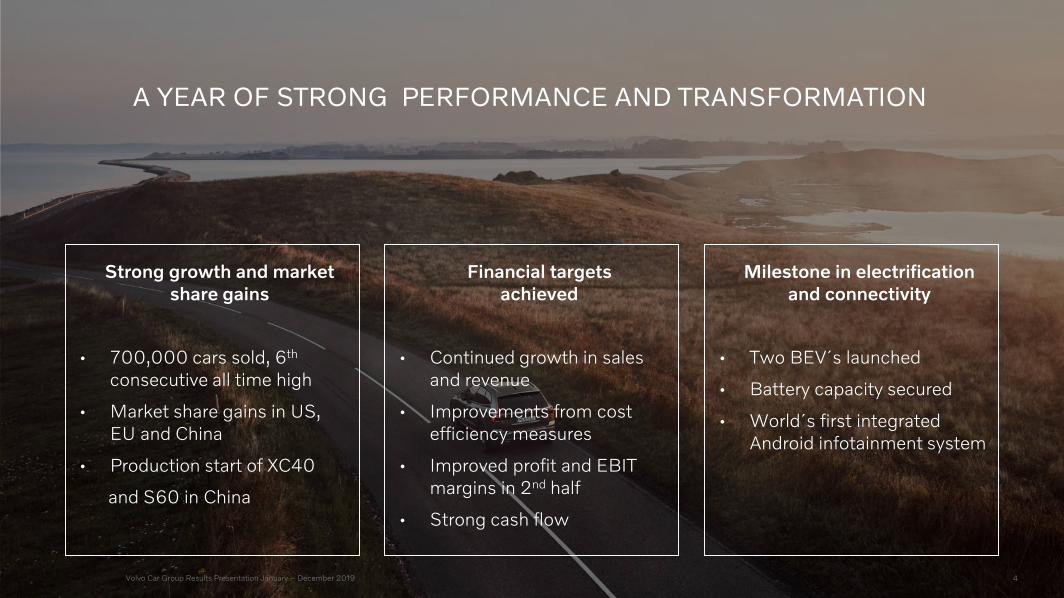
A YEAR OF STRONG PERFORMANCE AND TRANSFORMATION
Strong growth and market share gains
• 700,000 cars sold, 6th
consecutive all time high
• Market share gains in US, EU and China
• Production start of XC40
and S60 in China
Financial targets achieved
• Continued growth in sales and revenue
• Improvements from cost efficiency measures
• Improved profit and EBIT margins in 2nd half
• Strong cash flow
Milestone in electrification and connectivity
• Two BEV´s launched
• Battery capacity secured
• World´s first integrated Android infotainment system
4
Volvo Car Group Results Presentation January – December 2019
2.Financial
review
4.Outlook
1.2019
Highlights
Full year 2019 global sales & financial performance
EBIT
Balance sheet
Cash flow
Quarter 4 2019
Financial summary
5
3.Sustainable
actions
Volvo Car Group Results Presentation January – December 2019
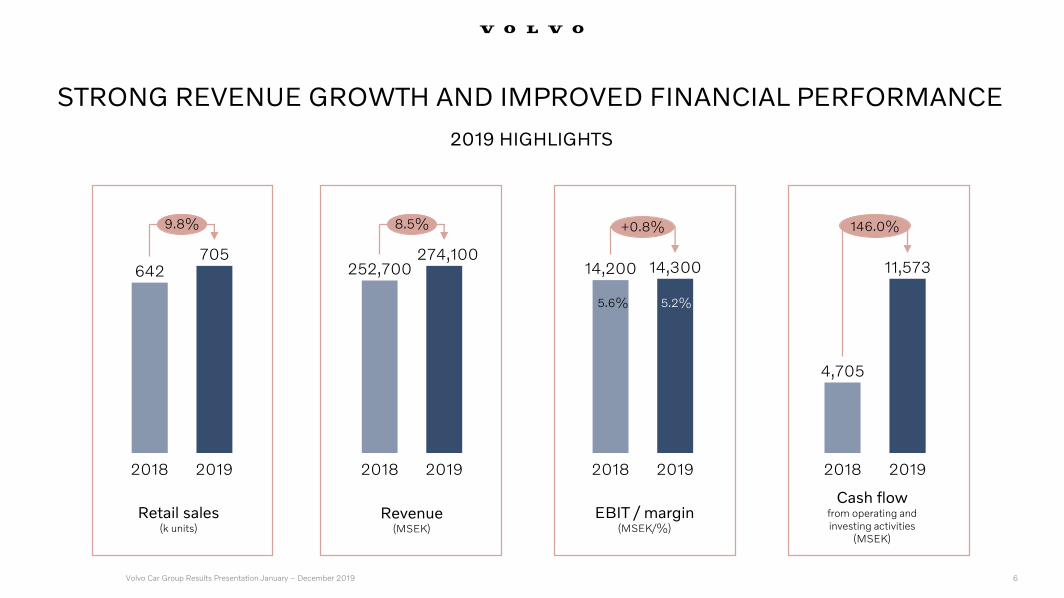
STRONG REVENUE GROWTH AND IMPROVED FINANCIAL PERFORMANCE
Revenue (MSEK)
Retail sales (k units)
EBIT / margin (MSEK/%)
642705
2018 2019
9.8%
2018 2019
252,700274,100
8.5%
14,200
20192018
14,300
+0.8%
Cash flow from operating andinvesting activities
(MSEK)
2018 2019
11,573
4,705
146.0%
5.6% 5.2%
2019 HIGHLIGHTS
6
Volvo Car Group Results Presentation January – December 2019
14%
63%
23%
7%
62%
31%
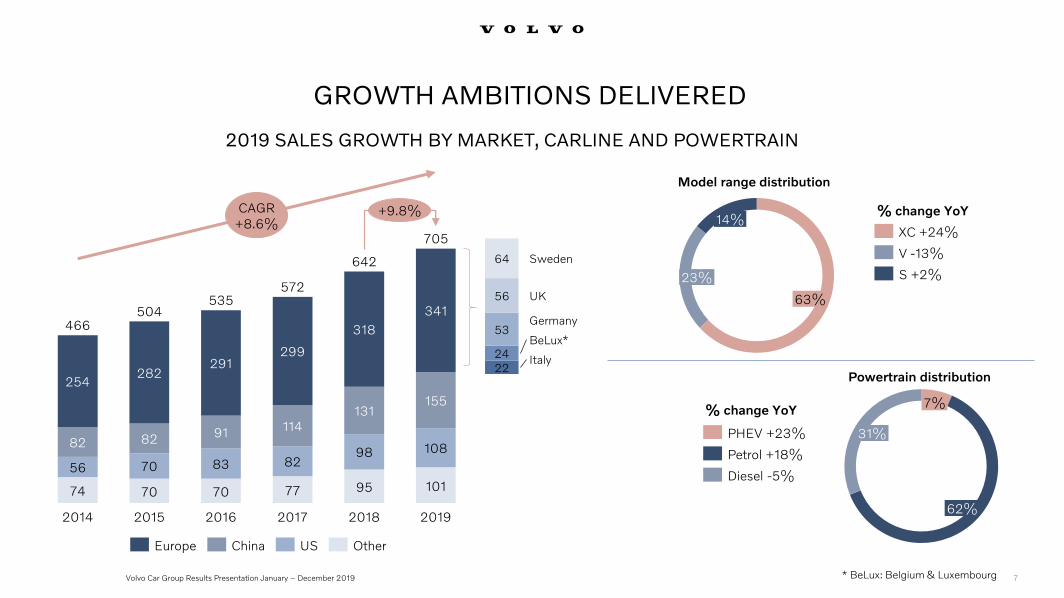
74 70 70 77 95 101
56 70 83 8298 10882 82 91 114131
155
254282
291299
318
341
20192014 2015
504
20172016
572
2018
642
466
535
705
CAGR+8.6%
+9.8%
PHEV +23%
Diesel -5%
Petrol +18%
XC +24%
V -13%
S +2%
Europe China OtherUS
2224
53
56
64 Sweden
BeLux*
Italy
UK
Germany
% change YoY
% change YoY
GROWTH AMBITIONS DELIVERED
2019 SALES GROWTH BY MARKET, CARLINE AND POWERTRAIN
Model range distribution
Powertrain distribution
* BeLux: Belgium & Luxembourg 7
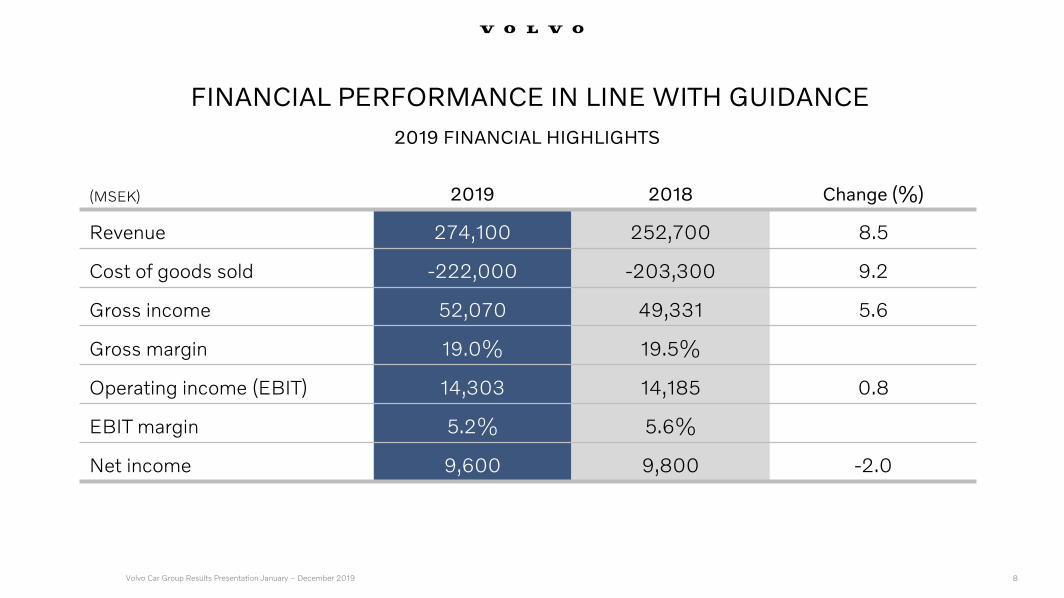
(MSEK) 2019 2018 Change (%)
Revenue 274,100 252,700 8.5
Cost of goods sold -222,000 -203,300 9.2
Gross income 52,070 49,331 5.6
Gross margin 19.0% 19.5%
Operating income (EBIT) 14,303 14,185 0.8
EBIT margin 5.2% 5.6%
Net income 9,600 9,800 -2.0
Volvo Car Group Results Presentation January – December 2019
FINANCIAL PERFORMANCE IN LINE WITH GUIDANCE
2019 FINANCIAL HIGHLIGHTS
8
Volvo Car Group Results Presentation January – December 2019
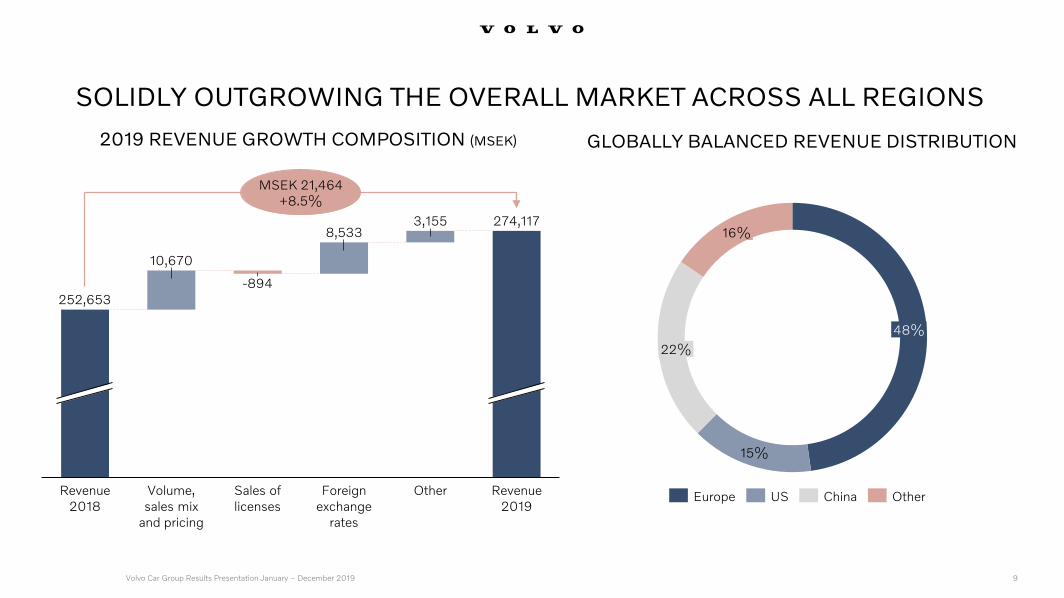
OtherRevenue 2018
10,670
Volume, sales mix
and pricing
252,653-894
Sales of licenses
8,533
Foreign exchange
rates
3,155
Revenue 2019
274,117
MSEK 21,464+8.5%
15%
48%
22%
16%
SOLIDLY OUTGROWING THE OVERALL MARKET ACROSS ALL REGIONS
2019 REVENUE GROWTH COMPOSITION (MSEK)
USEurope China Other
GLOBALLY BALANCED REVENUE DISTRIBUTION
9
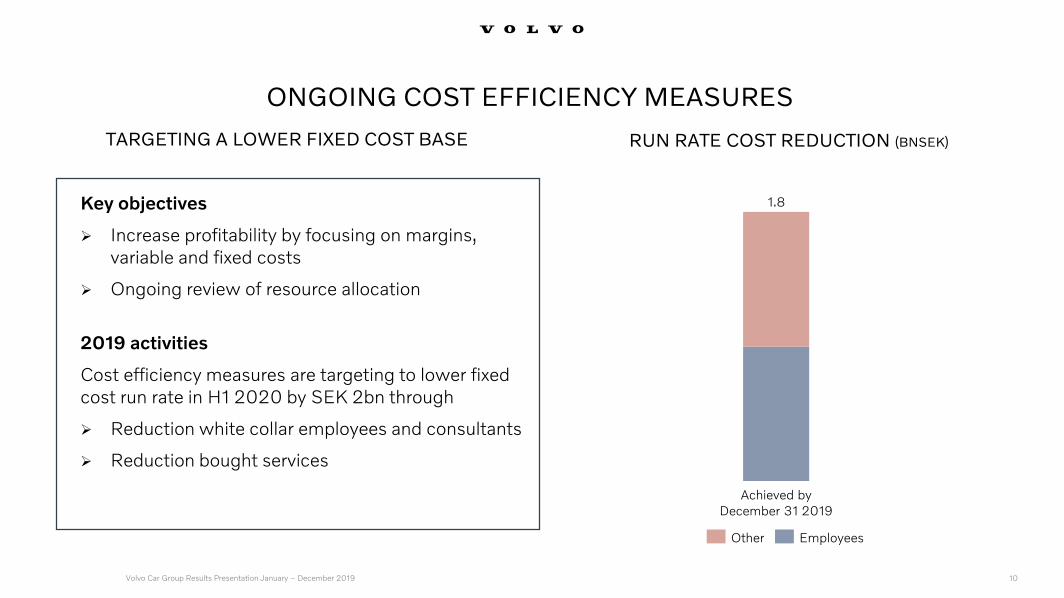
Key objectives
Increase profitability by focusing on margins, variable and fixed costs
Ongoing review of resource allocation
2019 activities
Cost efficiency measures are targeting to lower fixed cost run rate in H1 2020 by SEK 2bn through
Reduction white collar employees and consultants
Reduction bought services
Volvo Car Group Results Presentation January – December 2019
Achieved by December 31 2019
1.8
Other Employees
ONGOING COST EFFICIENCY MEASURES
TARGETING A LOWER FIXED COST BASE RUN RATE COST REDUCTION (BNSEK)
10
Volvo Car Group Results Presentation January – December 2019
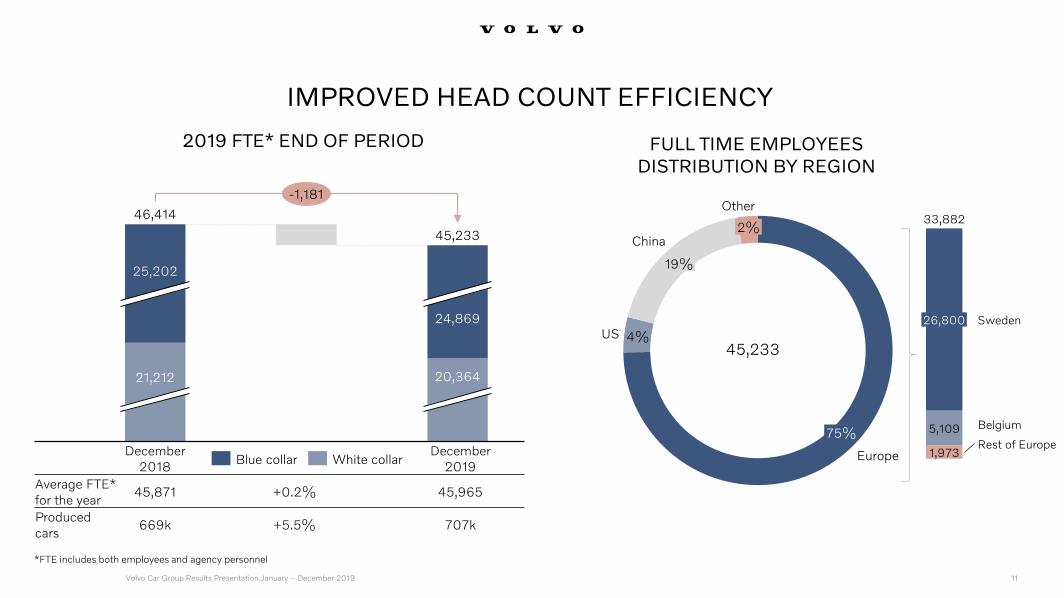
21,212
24,869
25,202
20,364
46,414
45,233
-1,181
4%US
Europe
75%
19%
China2%
Other
IMPROVED HEAD COUNT EFFICIENCY
2019 FTE* END OF PERIOD FULL TIME EMPLOYEESDISTRIBUTION BY REGION
Rest of Europe
Sweden26,800
5,109
1,973
33,882
Belgium
Blue collar White collar
11
*FTE includes both employees and agency personnel
45,233
December2018
December2019
Average FTE*for the year
45,871 +0.2% 45,965
Produced cars
669k +5.5% 707k
Volvo Car Group Results Presentation January – December 2019
2.Financial
review
4.Outlook
1.2019
Highlights
Full year 2019 global sales & financial performance
EBIT
Balance sheet
Cash flow
Quarter 4 2019
Financial summary
12
3.Sustainable
actions
Volvo Car Group Results Presentation January – December 2019
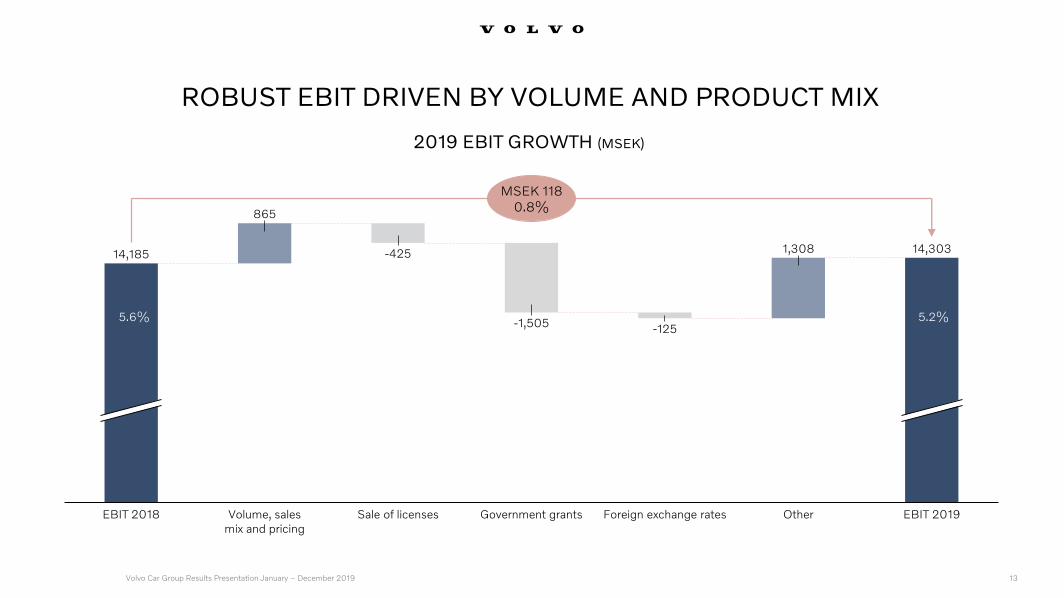
865
14,3031,308
EBIT 2018
-125
Volume, sales mix and pricing
-425
Sale of licenses Foreign exchange rates Other EBIT 2019Government grants
-1,505
14,185
MSEK 1180.8%
5.6% 5.2%
ROBUST EBIT DRIVEN BY VOLUME AND PRODUCT MIX
2019 EBIT GROWTH (MSEK)
5.2%
13
Volvo Car Group Results Presentation January – December 2019
2.Financial
review
4.Outlook
1.2019
Highlights
Full year 2019 global sales & financial performance
EBIT
Balance sheet
Cash flow
Quarter 4 2019
Financial summary
14
3.Sustainable
actions
Volvo Car Group Results Presentation January – December 2019
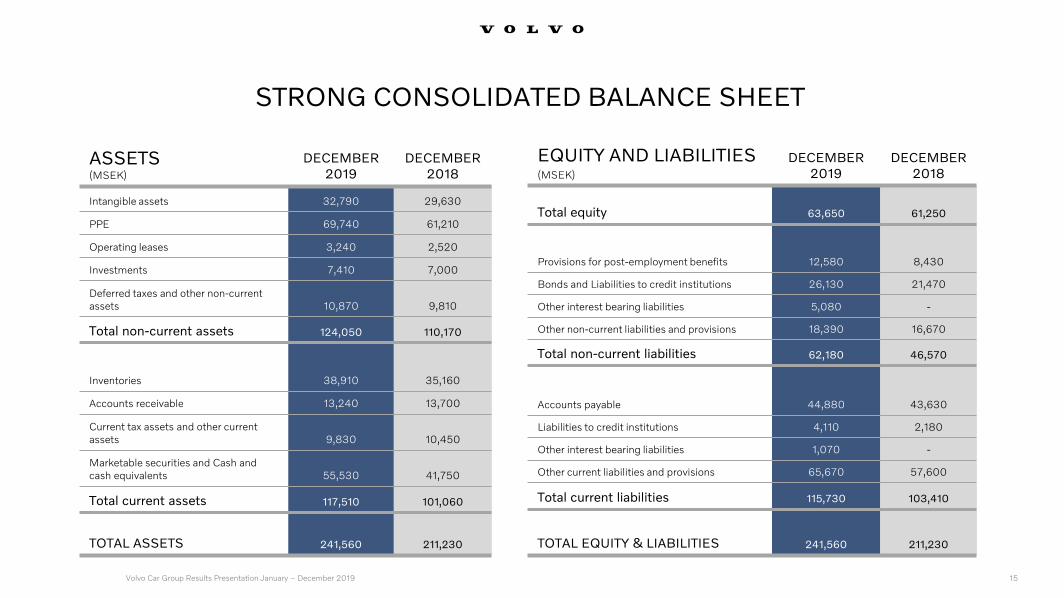
ASSETS (MSEK)
DECEMBER 2019
DECEMBER 2018
Intangible assets 32,790 29,630
PPE 69,740 61,210
Operating leases 3,240 2,520
Investments 7,410 7,000
Deferred taxes and other non-current assets 10,870 9,810
Total non-current assets 124,050 110,170
Inventories 38,910 35,160
Accounts receivable 13,240 13,700
Current tax assets and other current assets 9,830 10,450
Marketable securities and Cash and cash equivalents 55,530 41,750
Total current assets 117,510 101,060
TOTAL ASSETS 241,560 211,230
EQUITY AND LIABILITIES(MSEK)
DECEMBER 2019
DECEMBER2018
Total equity 63,650 61,250
Provisions for post-employment benefits 12,580 8,430
Bonds and Liabilities to credit institutions 26,130 21,470
Other interest bearing liabilities 5,080 -
Other non-current liabilities and provisions 18,390 16,670
Total non-current liabilities 62,180 46,570
Accounts payable 44,880 43,630
Liabilities to credit institutions 4,110 2,180
Other interest bearing liabilities 1,070 -
Other current liabilities and provisions 65,670 57,600
Total current liabilities 115,730 103,410
TOTAL EQUITY & LIABILITIES 241,560 211,230
STRONG CONSOLIDATED BALANCE SHEET
15
Volvo Car Group Results Presentation January – December 2019
2.Financial
review
4.Outlook
1.2019
Highlights
Full year 2019 global sales & financial performance
EBIT
Balance sheet
Cash flow
Quarter 4 2019
Financial summary
16
3.Sustainable
actions
Volvo Car Group Results Presentation January – December 2019
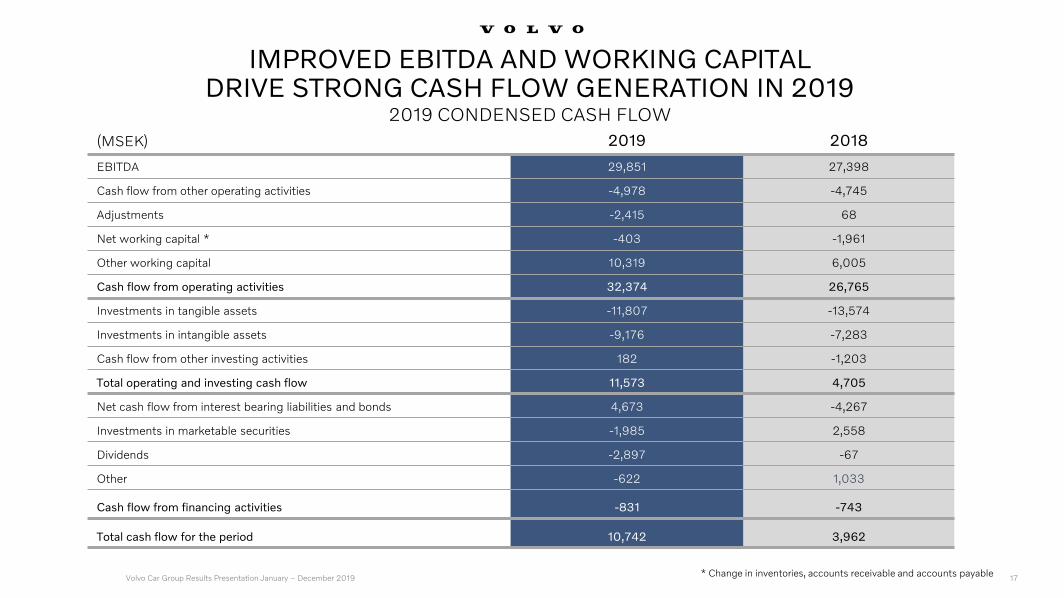
IMPROVED EBITDA AND WORKING CAPITAL DRIVE STRONG CASH FLOW GENERATION IN 2019
2019 CONDENSED CASH FLOW
* Change in inventories, accounts receivable and accounts payable17
(MSEK) 2019 2018
EBITDA 29,851 27,398
Cash flow from other operating activities -4,978 -4,745
Adjustments -2,415 68
Net working capital * -403 -1,961
Other working capital 10,319 6,005
Cash flow from operating activities 32,374 26,765
Investments in tangible assets -11,807 -13,574
Investments in intangible assets -9,176 -7,283
Cash flow from other investing activities 182 -1,203
Total operating and investing cash flow 11,573 4,705
Net cash flow from interest bearing liabilities and bonds 4,673 -4,267
Investments in marketable securities -1,985 2,558
Dividends -2,897 -67
Other -622 1,033
Cash flow from financing activities -831 -743
Total cash flow for the period 10,742 3,962
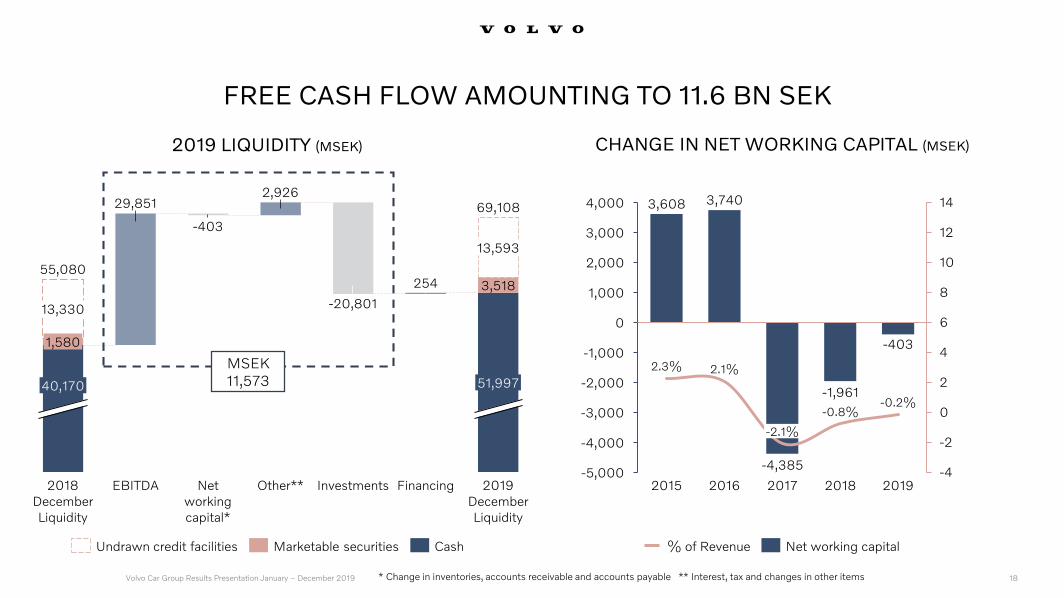
-403
-4
-2
0
2
4
6
8
10
12
14
-5,000
-4,000
-3,000
-2,000
-1,000
0
1,000
2,000
3,000
4,000
2018
2.1%2.3%
2015
3,608
2016
-0.8%
2017
-2.1%
-0.2%
2019
-4,385
3,740
-1,961
254
69,108
13,330
1,580
13,593
40,170 51,997
2019 December Liquidity
2018 December Liquidity
FinancingOther** InvestmentsEBITDA
55,080
-403
3,518
Net working capital*
-20,801
29,8512,926
Undrawn credit facilities Marketable securities Cash
Volvo Car Group Results Presentation January – December 2019 * Change in inventories, accounts receivable and accounts payable ** Interest, tax and changes in other items
% of Revenue Net working capital
FREE CASH FLOW AMOUNTING TO 11.6 BN SEK
2019 LIQUIDITY (MSEK) CHANGE IN NET WORKING CAPITAL (MSEK)
MSEK11,573
18
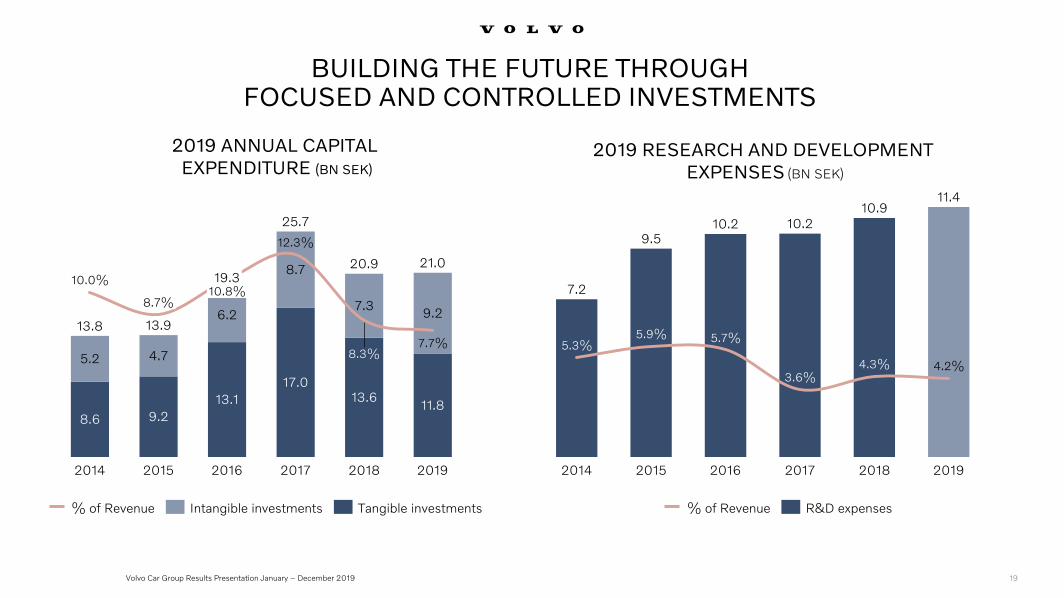
10.0%
8.3%
20172014 2015
8.7%
2016
10.8%
12.3%
11.8
17.0
2018
7.7%
2019
13.8
4.7
13.9
19.3
25.7
20.9 21.0
13.1
8.6
5.2
9.2
6.2
8.7
13.6
7.39.2
Intangible investments% of Revenue Tangible investments
Volvo Car Group Results Presentation January – December 2019
0
2
4
6
8
10
12
14
0
1
2
3
4
5
6
7
8
9
10
11
12
3.6%
2014 2019
5.3%
2017
5.9%
2015
5.7%
2016
4.3%
2018
4.2%
7.2
9.510.2 10.2
10.911.4
% of Revenue R&D expenses
BUILDING THE FUTURE THROUGH FOCUSED AND CONTROLLED INVESTMENTS
2019 ANNUAL CAPITAL EXPENDITURE (BN SEK)
2019 RESEARCH AND DEVELOPMENTEXPENSES (BN SEK)
19
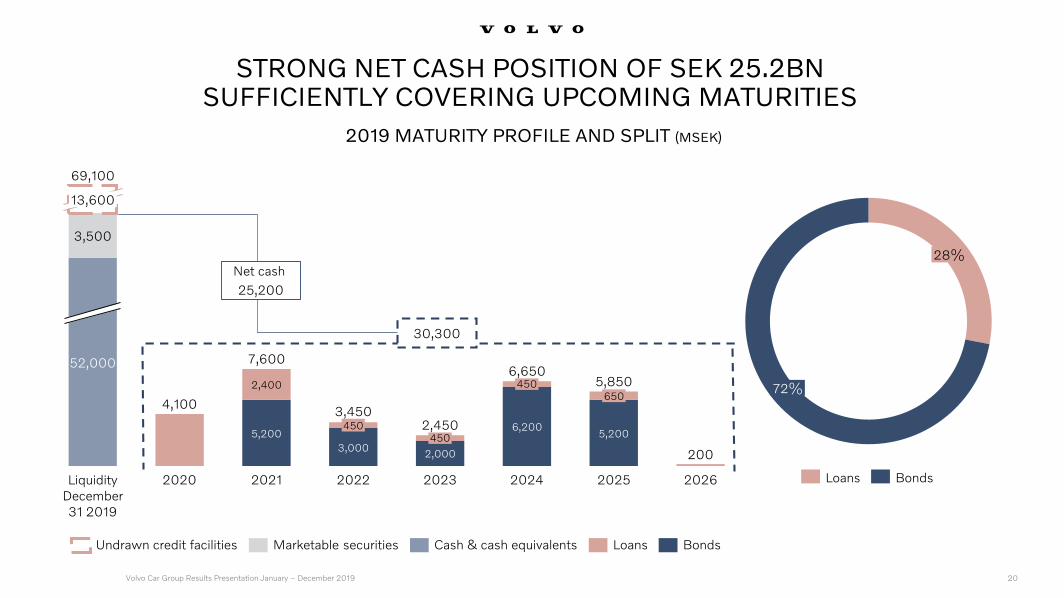
4,100
5,200
3,0002,000
6,2005,200
200
3,500
2,400
2023
52,000
13,600
6,650
3,450
Liquidity December 31 2019
450
2020 2021
450
2022
5,850
2,450
450
2024
650
2025 2026
69,100
7,600
Volvo Car Group Results Presentation January – December 2019
Undrawn credit facilities BondsCash & cash equivalentsMarketable securities Loans
30,300
STRONG NET CASH POSITION OF SEK 25.2BN SUFFICIENTLY COVERING UPCOMING MATURITIES
2019 MATURITY PROFILE AND SPLIT (MSEK)
28%
72%
Loans Bonds
Net cash
25,200
20
Volvo Car Group Results Presentation January – December 2019
2.Financial
review
4.Outlook
1.2019
Highlights
Full year 2019 global sales & financial performance
EBIT
Balance sheet
Cash flow
Quarter 4 2019
Financial summary
21
3.Sustainable
actions
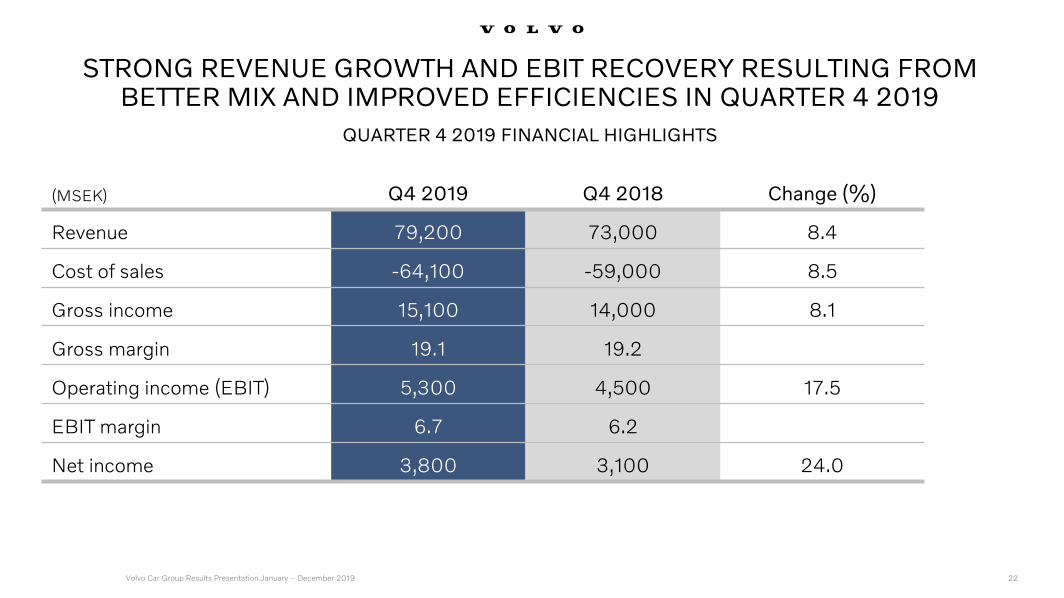
(MSEK) Q4 2019 Q4 2018 Change (%)
Revenue 79,200 73,000 8.4
Cost of sales -64,100 -59,000 8.5
Gross income 15,100 14,000 8.1
Gross margin 19.1 19.2
Operating income (EBIT) 5,300 4,500 17.5
EBIT margin 6.7 6.2
Net income 3,800 3,100 24.0
Volvo Car Group Results Presentation January – December 2019
STRONG REVENUE GROWTH AND EBIT RECOVERY RESULTING FROM BETTER MIX AND IMPROVED EFFICIENCIES IN QUARTER 4 2019
QUARTER 4 2019 FINANCIAL HIGHLIGHTS
22
Volvo Car Group Results Presentation January – December 2019
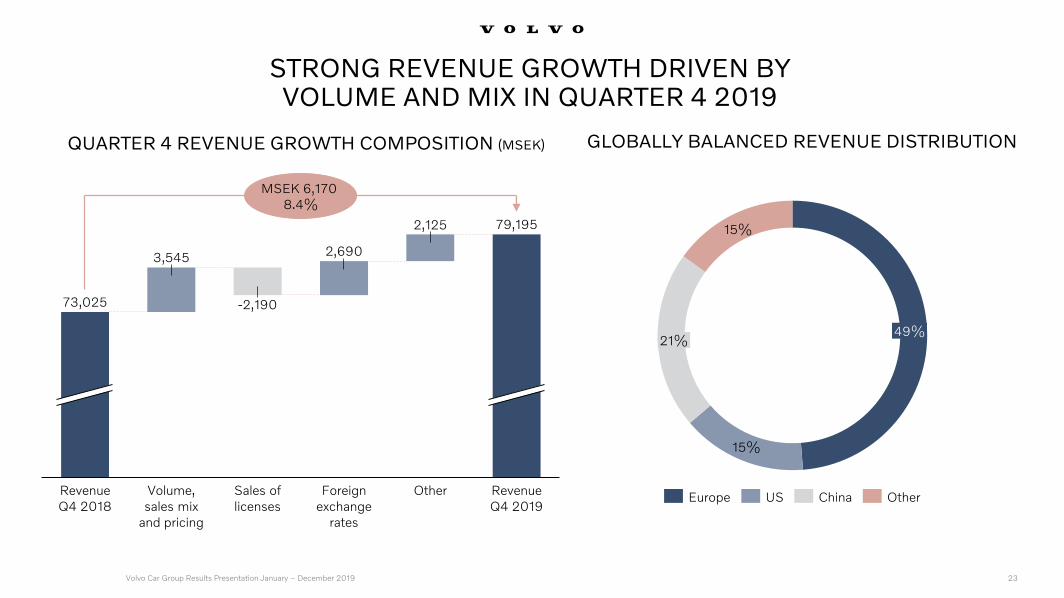
3,545 2,690
2,125
Volume, sales mix
and pricing
Revenue Q4 2019
Revenue Q4 2018
-2,190
Sales of licenses
Foreign exchange
rates
Other
73,025
79,195
MSEK 6,170 8.4%
15%
15%
49%21%
Europe US OtherChina
STRONG REVENUE GROWTH DRIVEN BY VOLUME AND MIX IN QUARTER 4 2019
QUARTER 4 REVENUE GROWTH COMPOSITION (MSEK)
23
GLOBALLY BALANCED REVENUE DISTRIBUTION
Volvo Car Group Results Presentation January – December 2019
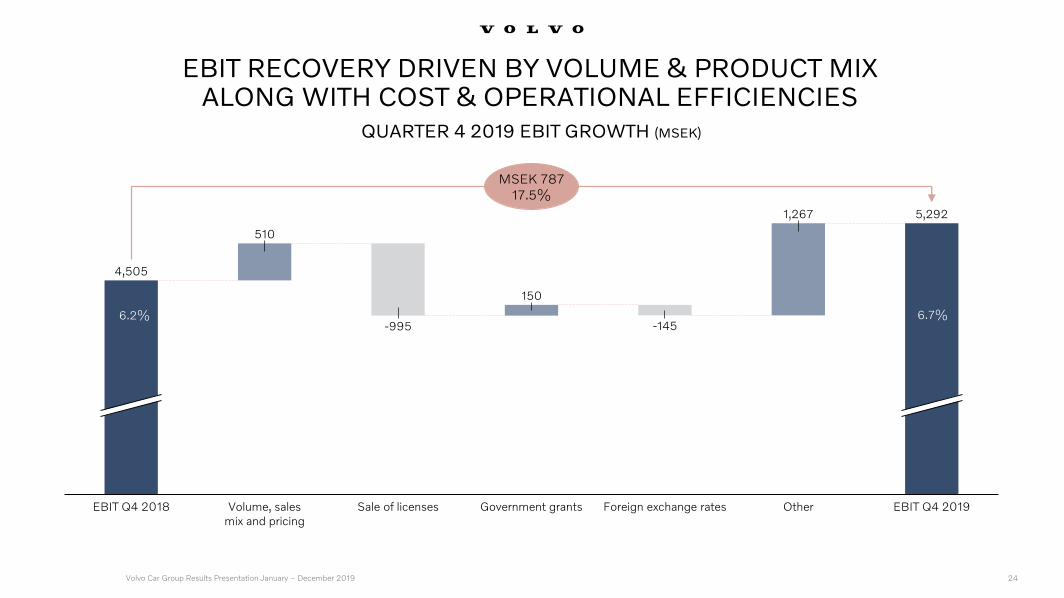
510
150
OtherGovernment grants
1,267
EBIT Q4 2019
-145
Sale of licenses
-995
Volume, sales mix and pricing
Foreign exchange rates
4,505
5,292
EBIT Q4 2018
MSEK 78717.5%
6.2% 6.7%
EBIT RECOVERY DRIVEN BY VOLUME & PRODUCT MIX ALONG WITH COST & OPERATIONAL EFFICIENCIES
QUARTER 4 2019 EBIT GROWTH (MSEK)
6.7%
24
Volvo Car Group Results Presentation January – December 2019
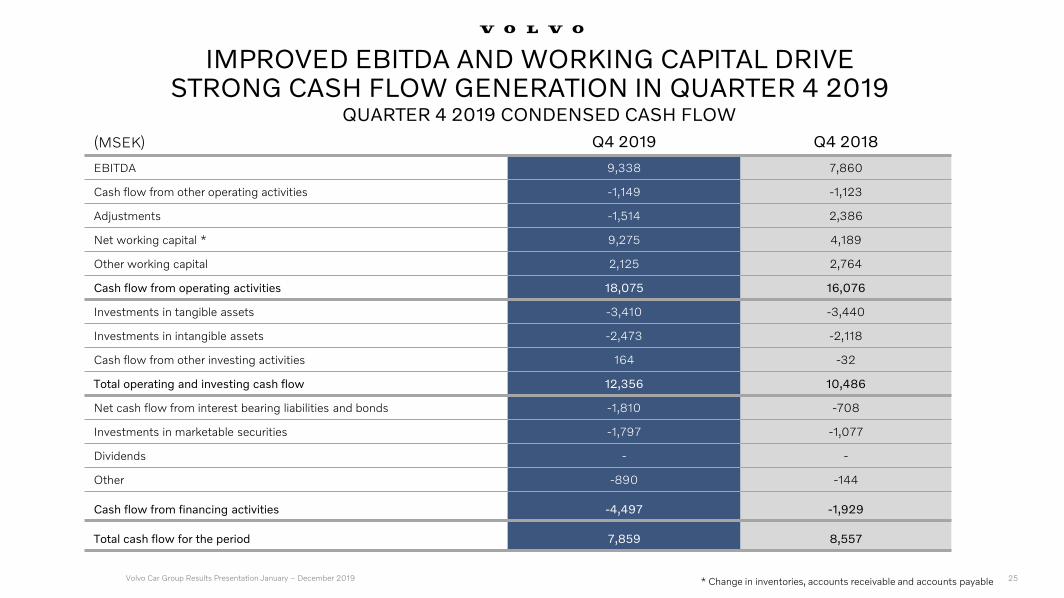
IMPROVED EBITDA AND WORKING CAPITAL DRIVE STRONG CASH FLOW GENERATION IN QUARTER 4 2019
QUARTER 4 2019 CONDENSED CASH FLOW
25* Change in inventories, accounts receivable and accounts payable
(MSEK) Q4 2019 Q4 2018
EBITDA 9,338 7,860
Cash flow from other operating activities -1,149 -1,123
Adjustments -1,514 2,386
Net working capital * 9,275 4,189
Other working capital 2,125 2,764
Cash flow from operating activities 18,075 16,076
Investments in tangible assets -3,410 -3,440
Investments in intangible assets -2,473 -2,118
Cash flow from other investing activities 164 -32
Total operating and investing cash flow 12,356 10,486
Net cash flow from interest bearing liabilities and bonds -1,810 -708
Investments in marketable securities -1,797 -1,077
Dividends - -
Other -890 -144
Cash flow from financing activities -4,497 -1,929
Total cash flow for the period 7,859 8,557
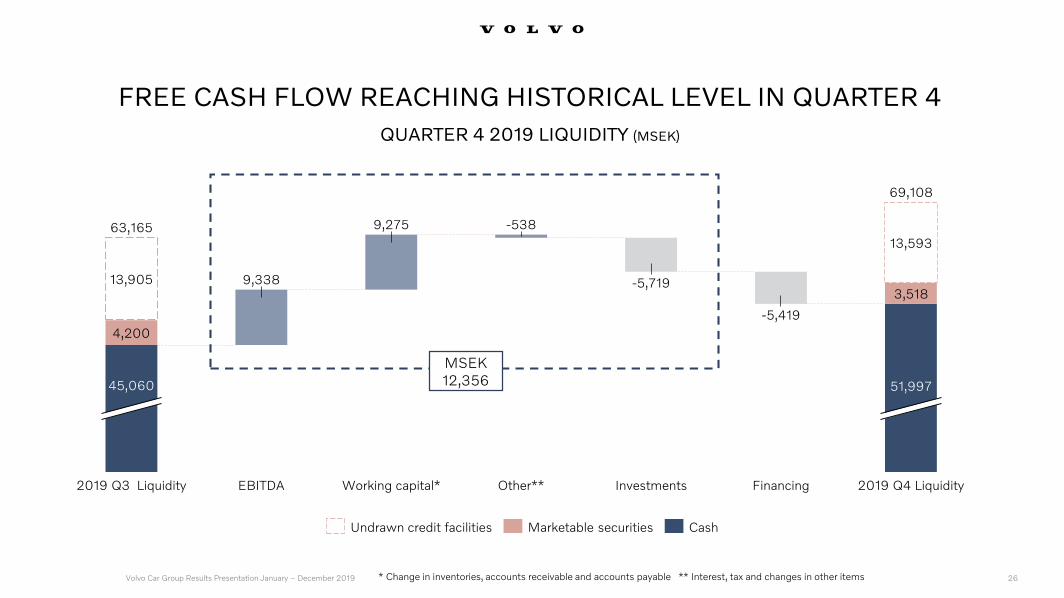
3,518
2019 Q4 Liquidity
13,905
-5,419
51,997
FinancingOther**
-5389,275
45,060
2019 Q3 Liquidity
63,165
69,108
EBITDA Working capital*
-5,719
Investments
4,200
9,338
13,593
Undrawn credit facilities Marketable securities Cash
Volvo Car Group Results Presentation January – December 2019 * Change in inventories, accounts receivable and accounts payable ** Interest, tax and changes in other items
FREE CASH FLOW REACHING HISTORICAL LEVEL IN QUARTER 4
QUARTER 4 2019 LIQUIDITY (MSEK)
MSEK 12,356
26

Volvo Car Group Results Presentation January – December 2019
2.Financial
review
4.Outlook
1.2019
Highlights
Full year 2019 global sales & financial performance
EBIT
Balance sheet
Cash flow
Quarter 4 2019
Financial summary
27
3.Sustainable
actions

Volvo Car Group Results Presentation January – December 2019
FINANCIAL SUMMARY
Revenue growth
of 8.5% reaching SEK 274bn, driven by volume growth and mix
Record EBIT
of 14.3bn, driven by volume and product mix, combined with cost
and operational efficiencies
Cost optimisation measures
successfully implemented achieving 1.8bn lower cost run
rate
Increased profit and margin improvement
in the 2nd half of the year, outperforming last year
Historically strong cash flow
of SEK 11.6bn resulting in a net cash position of 25.2bn
28

Volvo Car Group Results Presentation January – December 2019
2.Financial
review
4.Outlook
1.2019
Highlights
29
3.Sustainable
actions
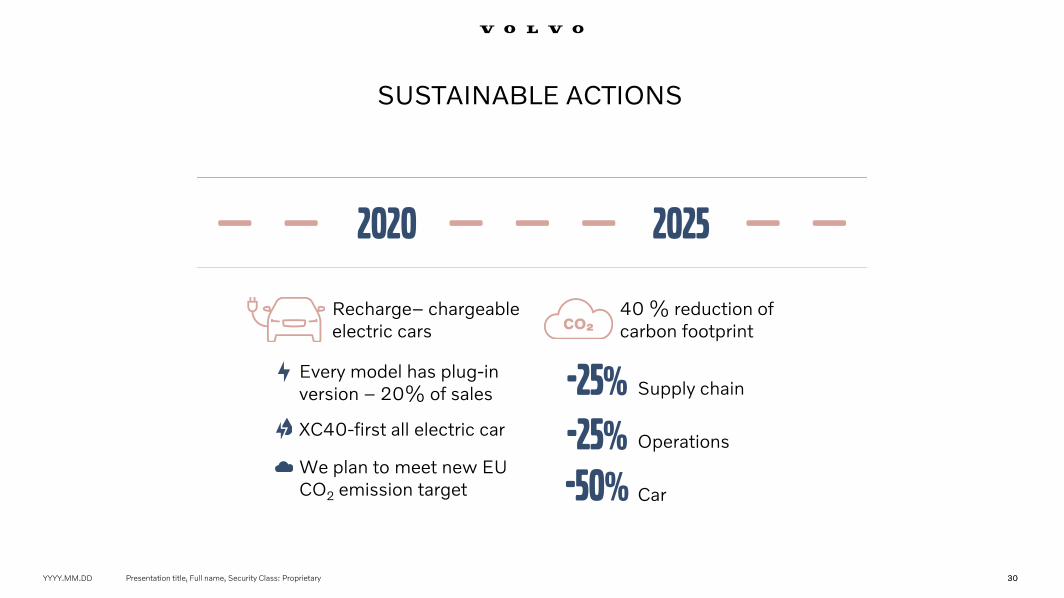
YYYY.MM.DD Presentation title, Full name, Security Class: Proprietary 3030
Supply chain
Operations
Car
40 % reduction of carbon footprint
Every model has plug-in version – 20% of sales
Recharge– chargeable electric cars
XC40-first all electric car
We plan to meet new EU CO2 emission target
SUSTAINABLE ACTIONS
2020 2025
-25%
-25%
-50%
Volvo Car Group Results Presentation January – December 2019
2.Financial
review
4.Outlook
1.2019
Highlights
31
3.Sustainable
actions
Volvo Car Group Results Presentation January – December 2019
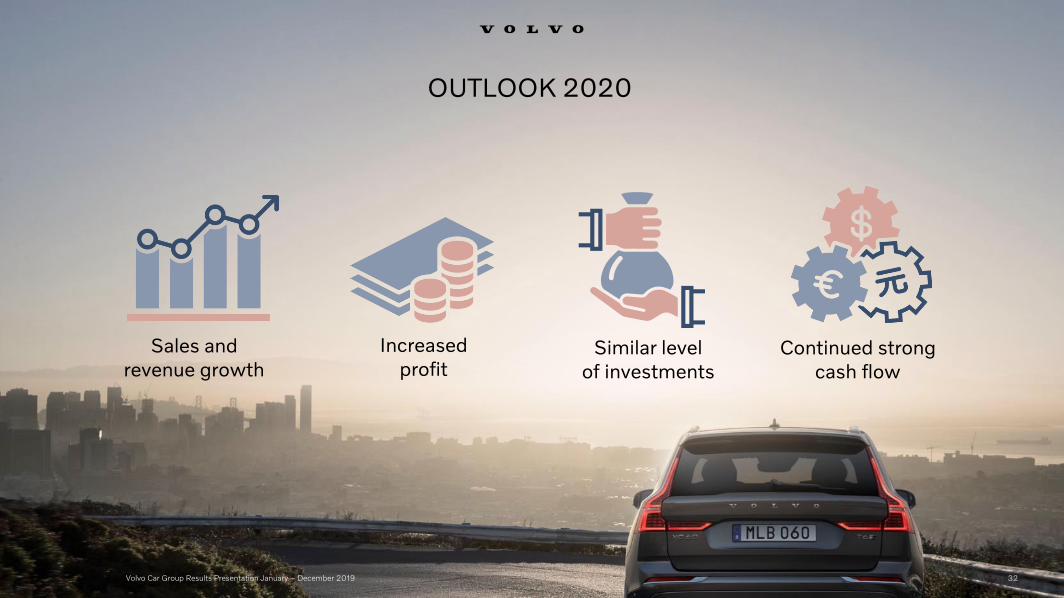
OUTLOOK 2020
32
Sales and revenue growth
Increased profit
Similar level of investments
Continued strong cash flow
32
Volvo Car Group Results Presentation January – December 2019
A YEAR OF STRONG PERFORMANCE AND TRANSFORMATION
Strong growth and market share gains
Financial targets achieved
Milestone in electrification and connectivity
33

Volvo Car Group Results Presentation January – December 2019
APPENDIX
35
Volvo Car Group Results Presentation January – December 2019
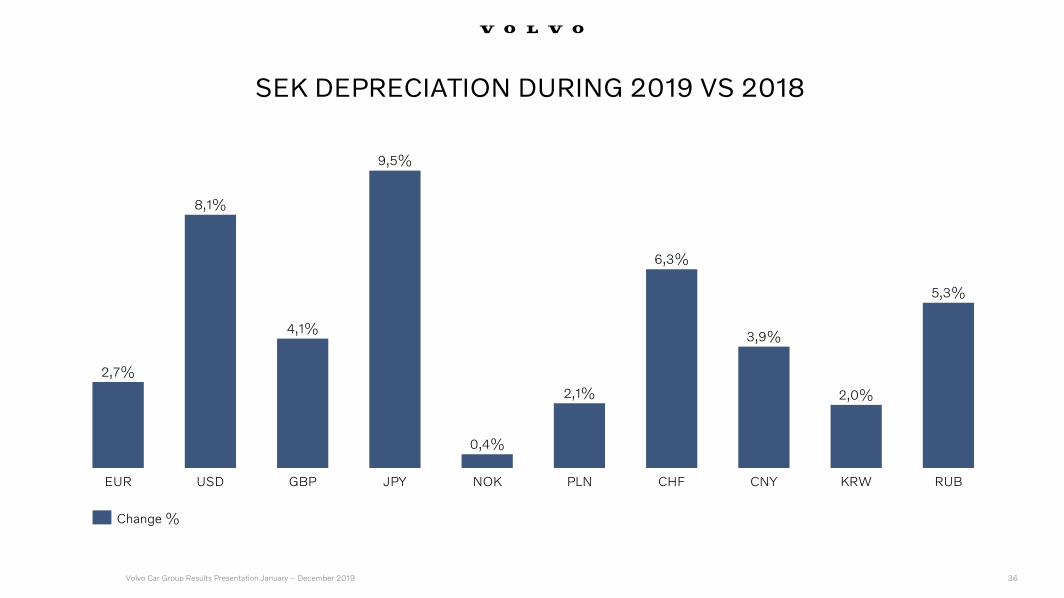
SEK DEPRECIATION DURING 2019 VS 2018
36
GBP
6,3%
EUR USD CNY
2,0%
PLNJPY NOK CHF KRW RUB
9,5%
2,7%
3,9%4,1%
8,1%
0,4%
2,1%
5,3%
Change %
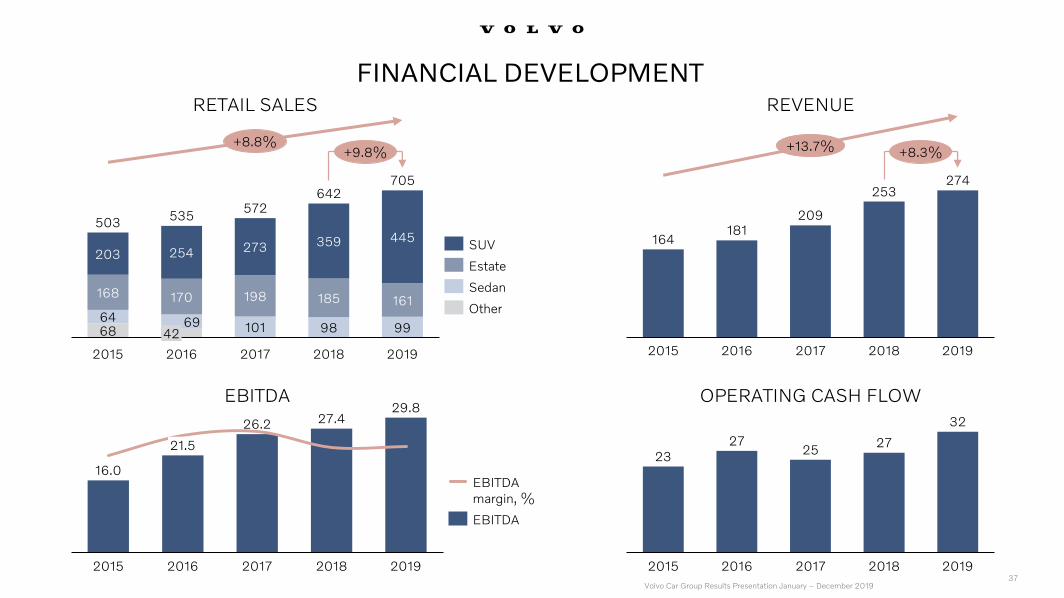
FINANCIAL DEVELOPMENT
Volvo Car Group Results Presentation January – December 2019
68 101 98 9964 69
198 185 161168 170
273 359 445
203 254
2019
642
42
2015 2016
705
2017 2018
503535
572
+8.8%+9.8%
Other
SUV
Estate
Sedan
RETAIL SALES
164181
209
253274
201820172015 2016 2019
+13.7% +8.3%
REVENUE
0
2
4
6
8
10
12
14
0
5
10
15
20
25
30
2019
27.4
2015
26.2
2016 2017
16.0
2018
21.5
29.8
EBITDA
EBITDAmargin, %
EBITDA
2327
2527
32
20162015 2017 2018 2019
OPERATING CASH FLOW
37