voltage stability monitoring using sensitivities …517159/...1 voltage stability monitoring using...
TRANSCRIPT
1
Voltage Stability Monitoring using SensitivitiesComputed from Synchronized Phasor Measurement Data
Rujiroj Leelaruji, Student Member, IEEE, Luigi Vanfretti, Member, IEEE, and M. Shoaib Almas
Abstract—Wide-area early warning systems are dependenton synchrophasor data-based applications for providing timelyinformation to operators so that preventive actions can be taken.This article proposes the use of voltage sensitivities computedfrom syncrhophasor data for voltage stability monitoring, anda visualization approach that can be implemented in wide-areaearly warning systems. In order to provide reliable information,synchrophasor data must be pre-processed to extract only theuseful features embedded in measurements and correct for errors.Hence, this article also addresses the issue of data filteringand correction, and proposes a filtering methodology for robustvoltage sensitivity computation. The methodology is developedconsidering both positive-sequence simulations for methodologydevelopment purposes, and real phasor measurement data from areal-time (RT) hardware-in-the-loop (HIL) laboratory for testingthe robustness of the developed approach for use in the controlroom. The results from both approaches are contrasted againsteach other, the limitations of the positive-sequence simulation ap-proach for developing PMU-data applications are highlighted andthe challenges of working with the RT HIL lab are recognized.
Index Terms—Wide-Area Voltage Instability Detection, Wide-Area Monitoring Systems, Wide-Area Early Warning Systems,Visualization, PMU-based applications, Filtering
I. INTRODUCTION
PHasor Measurement Units (PMUs) have been adoptedto provide a high-sampling rate positive-sequence volt-
age and current phasors for Wide-Area Monitoring, Controland Protection (WAMPAC) Systems [1]. The successful de-ployment of PMUs [2] and applications that harvest theirdata in WAMPAC systems have the potential of graduallytransforming today’s power transmission networks into SmartTransmission Grids [3]. Within WAMPAC systems, wide-area early warning systems are dependent on synchrophasordata-based applications for providing timely information tooperators so that preventive actions can be taken.
As recognized in [3], the development and deployment ofPMU data-based applications have been slow, limiting the po-tential of WAMPAC systems. Nevertheless, to date, a numberof applications have been implemented in industrial Wide-AreaMonitoring Systems (WAMS), mainly to provide awarenessto disruptive events. The use of these applications is catered,for example, to provide the wide-area visibility [4], [5], thedetection of critical oscillatory mode properties [6], [7], andthe voltage instability detection [8]. Note that the design of
Manuscript submitted to the IEEE PES General Meeting 2012.Invited Paper for the Panel Session: “Wide-Area Early Warning Sys-tems”, IEEE PES General Meeting 2012, San Diego, CA.
This work was supported in part by EKC2 - The Swedish Centre ofExcellence in Electric Power Engineering.L. Vanfretti is supported by the STandUP for Energy collaboration initiativeand the KTH School of Electrical Engineering.
The authors are with the Electric Power Systems Division, School ofElectrical Engineering, KTH Royal Institute of Technology, Teknikringen33, SE-100 44, Stockholm, Sweden. E-mail: [email protected], [email protected],[email protected]
WAMS and WAMPAC systems in general also includes thepossibility for implementing other applications [9].
Most of the voltage instability detection methods that havebeen proposed, with two notable exceptions [10], [11], relyupon the construction of Thevenin equivalent models withsynthesized parameters. Although useful and reliable, thesemethods have limitations which have been recognized in [11],[12] . With “wide-area methods” [10], [11], the use of sensi-tivities may have great potential for detecting the inception ofvoltage instabilities in wide-areas without depending on circuitsynthesis. However, the computation of sensitivities fromsynchronized phasor-measurement data has several challenges.
First, the development of these methods has been tradi-tionally carried out through positive-sequence-based modelsand simulations. This is reasonable in principle as the timescale of this type of instability is, in most cases, larger incomparison to other types of instabilities [13]. However, thishas the disadvantage that the synthetic data generated by thesimulation of these models does not contain the actual featuresthat one expects from actual PMU data, nor do they dealwith the possible data errors and inconsistencies embeddedin synchrophasor streams.A lack of and/or incorrect dataprocessing can yield incorrect information, which can misleadoperators to a non-optimal preventive action, or even animproper corrective action that could lead to system collapse.
This article proposes the use of voltage sensitivities com-puted from syncrhophasor data for voltage stability monitor-ing, and a visualization approach that can be implementedin wide-area early warning systems. A filtering methodologyfor robust voltage sensitivity computation is proposed. Themethodology is developed considering both positive-sequencesimulations, and real phasor measurement data from a real-time (RT) hardware-in-the-loop (HIL) laboratory for testingthe robustness of the developed approach in control roomapplications. The results from both approaches are contrastedagainst each other, the limitations of the positive-sequencesimulation approach for developing PMU-data applications arehighlighted and the challenges of working with the RT HILlab are recognized.
The remainder of this article is structured as follows.Section II offers a synthesis of wide-area voltage stabilitymonitoring concepts. Section III presents the experimentaland simulation set-ups used for methodology development inthis article, while Section IV briefly contrasts the differencebetween using standard simulations and PMU data. SectionV describes the sensitivities considered, while Section VI de-scribes the proposed filtering methodologies for pre-processingdata for robust sensitivity calculations. Section VII proposesa visualization approach for monitoring voltage instabilities.Finally, in Section VIII, conclusions are drawn and future workis outlined.
2
II. WIDE-AREA VOLTAGE STABILITY MONITORING
CONCEPTS
Voltage instability detection methods can be categorizedin to the following branches: local [14], [15] versus wide-area measurement [16] or synchornized [17] versus non-synchornized [18] approaches. The idea behind these cate-gories is on how the accumulated measurement informationis used. To have an overall situation awareness, it appearsthat the entire power system state needs to be reconstructedfrom synchrophasor measurements and other data [19], or thatdifferent indices for different system components need to becomputed to determine instabilities [20]. It can be argued thatwide-area early warning systems could contain monitoringtools that display voltage stability indicators; however it isnot clear how to present this information to operators so thatit is easy to understand. Therefore, the ultimate goal of thisarticle is to create the voltage stability indicators by computingsensitivities that are simple to comprehend.
As mentioned earlier, PMU data must be first pre-processedin order to compute accurate and robust sensitivities if theyare to be used for control room applications. This issue isavoided in [10] by extracting the slope of the sensitivitiesinstead of sensitivities itself. To achieve this, a parcel of datais needed, delaying the delivery of information to a wide-area early warning system. The pre-processing issue is partlyaddressed in [12] by using filtering to separate the quasi-steadystate components of simulated data; however, the approachis limited because the simulated data does not contain thecorrect features observed from PMU data and it is not capableto cater for inconsistencies and errors embedded in them.Hence, a filtering methodology for robust voltage sensitivitycomputation is proposed in Section VI.
III. EXPERIMENTAL AND SIMULATION SET-UPS
A. Real-Time Hardware-In-Loop (RT HIL) Data Generation
It is costly to adopt a real power system for an experimentalpurpose, and PMU data from utilities is not always available.Thus, to bridge the gap between theory and reality, a develop-ment and testing platform that performs as close as possible toreal existing networks is adopted for the experiments involvingreal PMU data. This platform is available at SmarTS Lab,detailed information about this laboratory can be found in [21],a brief summary on how real-time data is generated is providedbelow.
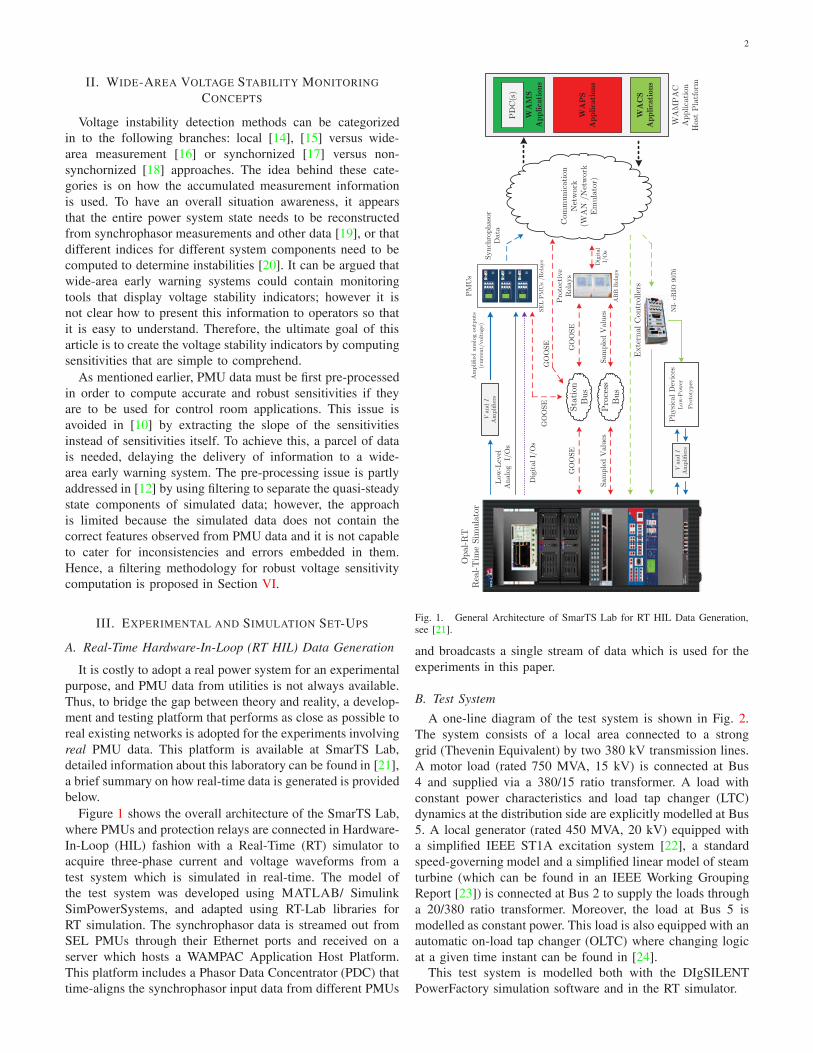
Figure 1 shows the overall architecture of the SmarTS Lab,where PMUs and protection relays are connected in Hardware-In-Loop (HIL) fashion with a Real-Time (RT) simulator toacquire three-phase current and voltage waveforms from atest system which is simulated in real-time. The model ofthe test system was developed using MATLAB/ SimulinkSimPowerSystems, and adapted using RT-Lab libraries forRT simulation. The synchrophasor data is streamed out fromSEL PMUs through their Ethernet ports and received on aserver which hosts a WAMPAC Application Host Platform.This platform includes a Phasor Data Concentrator (PDC) thattime-aligns the synchrophasor input data from different PMUs
Opa
l-R
TR
eal-T
ime
Sim
ulat
or
Com
mun
icat
ion
Net
wor
k(W
AN
/N
etw
ork
Em
ulat
or)
Stat
ion
Bus
Low
-Lev
elA
nalo
g I
/Os
Phy
sica
l D
evic
esLow
-Pow
er
Pro
toty
pes
Van
d I
Am
plifie
rs
Dig
ital
I/O
s
Am
plifie
d an
alog
out
puts
(c
urre
nt/v
olta
ge)
SEL P
MU
s /R
elay
s
AB
B R
elay
s
NI-
cRIO
907
6
Sync
hrop
haso
r D
ata
WAMS
Applications
PD
C(s
)
WAPS
Applications
PM
Us
Ext
erna
l C
ontr
olle
rs
Van
d I
Am
plifie
rs
GO
OSE
Sam
pled
Val
ues
GO
OSE
Sam
pled
Val
ues
Pro
tect
ive
Rel
ays
WACS
Applications
WA
MP
AC
A
pplic
atio
nH
ost
Pla
tfor
m
GO
OSE Pro
cess
B
us
GO
OSE
Dig
ital
I/
Os
Fig. 1. General Architecture of SmarTS Lab for RT HIL Data Generation,see [21].
and broadcasts a single stream of data which is used for theexperiments in this paper.
B. Test System
A one-line diagram of the test system is shown in Fig. 2.The system consists of a local area connected to a stronggrid (Thevenin Equivalent) by two 380 kV transmission lines.A motor load (rated 750 MVA, 15 kV) is connected at Bus4 and supplied via a 380/15 ratio transformer. A load withconstant power characteristics and load tap changer (LTC)dynamics at the distribution side are explicitly modelled at Bus5. A local generator (rated 450 MVA, 20 kV) equipped witha simplified IEEE ST1A excitation system [22], a standardspeed-governing model and a simplified linear model of steamturbine (which can be found in an IEEE Working GroupingReport [23]) is connected at Bus 2 to supply the loads througha 20/380 ratio transformer. Moreover, the load at Bus 5 ismodelled as constant power. This load is also equipped with anautomatic on-load tap changer (OLTC) where changing logicat a given time instant can be found in [24].
This test system is modelled both with the DIgSILENTPowerFactory simulation software and in the RT simulator.
3
Thev
enin
Eq
uiva
lent
`
`
M
`1
2
3
5
L1-3
T120
/380
Mot
or
Load
OLT
C
T238
0/15
L3-5
4
Fig. 2. Test system used for generating voltage instability scenarios
IV. PSB SIMULATIONS VS. “REAL” PMU DATA
The reason of having the test system in two test platforms(positive-sequence-based (PSB) simulations and RT-HIL) isto demonstrate that the development of a monitoring toolcannot rely only on simulation results. This is because the PSBsimulation-based PMU applications may not give satisfactoryresults when being exposed to “real-data”. PSB simulationsmay exclude the effect of switching devices and events onmeasurements, ambient behavior, noise and outliers in actualPMU data.
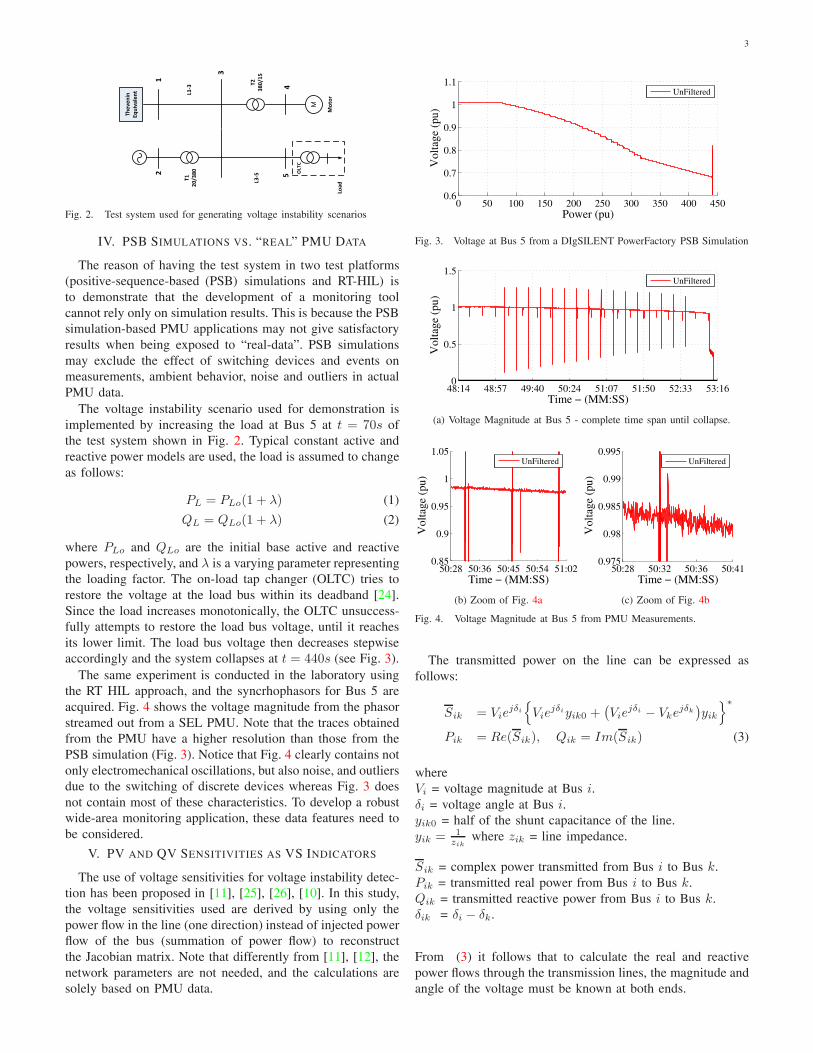
The voltage instability scenario used for demonstration isimplemented by increasing the load at Bus 5 at t = 70s ofthe test system shown in Fig. 2. Typical constant active andreactive power models are used, the load is assumed to changeas follows:
PL = PLo(1 + λ) (1)
QL = QLo(1 + λ) (2)
where PLo and QLo are the initial base active and reactivepowers, respectively, and λ is a varying parameter representingthe loading factor. The on-load tap changer (OLTC) tries torestore the voltage at the load bus within its deadband [24].Since the load increases monotonically, the OLTC unsuccess-fully attempts to restore the load bus voltage, until it reachesits lower limit. The load bus voltage then decreases stepwiseaccordingly and the system collapses at t = 440s (see Fig. 3).
The same experiment is conducted in the laboratory usingthe RT HIL approach, and the syncrhophasors for Bus 5 areacquired. Fig. 4 shows the voltage magnitude from the phasorstreamed out from a SEL PMU. Note that the traces obtainedfrom the PMU have a higher resolution than those from thePSB simulation (Fig. 3). Notice that Fig. 4 clearly contains notonly electromechanical oscillations, but also noise, and outliersdue to the switching of discrete devices whereas Fig. 3 doesnot contain most of these characteristics. To develop a robustwide-area monitoring application, these data features need tobe considered.
V. PV AND QV SENSITIVITIES AS VS INDICATORS
The use of voltage sensitivities for voltage instability detec-tion has been proposed in [11], [25], [26], [10]. In this study,the voltage sensitivities used are derived by using only thepower flow in the line (one direction) instead of injected powerflow of the bus (summation of power flow) to reconstructthe Jacobian matrix. Note that differently from [11], [12], thenetwork parameters are not needed, and the calculations aresolely based on PMU data.
0 50 100 150 200 250 300 350 400 4500.6
0.7
0.8
0.9
1
1.1
Power (pu)
Vol
tage
(pu
)
UnFiltered
Fig. 3. Voltage at Bus 5 from a DIgSILENT PowerFactory PSB Simulation
48:14 48:57 49:40 50:24 51:07 51:50 52:33 53:160
0.5
1
1.5
Time − (MM:SS)
Vol
tage
(pu
)
UnFiltered
(a) Voltage Magnitude at Bus 5 - complete time span until collapse.
50:28 50:36 50:45 50:54 51:020.85
0.9
0.95
1
1.05
Time − (MM:SS)
Vol
tage
(pu
)
UnFiltered
(b) Zoom of Fig. 4a
50:28 50:32 50:36 50:410.975
0.98
0.985
0.99
0.995
Time − (MM:SS)V
olta
ge (
pu)
UnFiltered
(c) Zoom of Fig. 4b
Fig. 4. Voltage Magnitude at Bus 5 from PMU Measurements.
The transmitted power on the line can be expressed asfollows:
Sik = Viejδi
{Vie
jδiyik0 +(Vie
jδi − Vkejδk
)yik
}∗
Pik = Re(Sik), Qik = Im(Sik) (3)
whereVi = voltage magnitude at Bus i.δi = voltage angle at Bus i.yik0 = half of the shunt capacitance of the line.yik = 1
zikwhere zik = line impedance.
Sik = complex power transmitted from Bus i to Bus k.Pik = transmitted real power from Bus i to Bus k.Qik = transmitted reactive power from Bus i to Bus k.δik = δi − δk.
From (3) it follows that to calculate the real and reactivepower flows through the transmission lines, the magnitude andangle of the voltage must be known at both ends.
4
+ PMUData
HP Filter
-MA Filter
FilteredDataNoise and
OutliersRemoved
(i)
(ii)
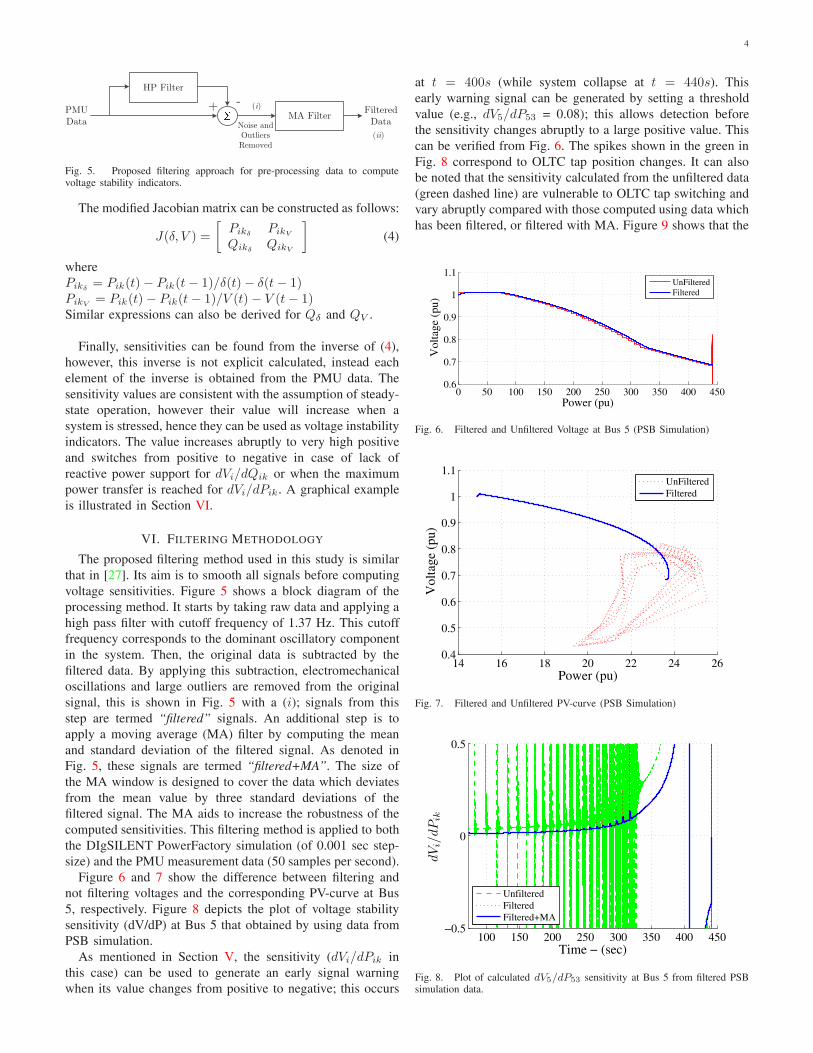
Fig. 5. Proposed filtering approach for pre-processing data to computevoltage stability indicators.
The modified Jacobian matrix can be constructed as follows:
J(δ, V ) =
[Pikδ
PikV
QikδQikV
](4)
wherePikδ
= Pik(t)− Pik(t− 1)/δ(t)− δ(t− 1)PikV = Pik(t)− Pik(t− 1)/V (t)− V (t− 1)Similar expressions can also be derived for Qδ and QV .
Finally, sensitivities can be found from the inverse of (4),however, this inverse is not explicit calculated, instead eachelement of the inverse is obtained from the PMU data. Thesensitivity values are consistent with the assumption of steady-state operation, however their value will increase when asystem is stressed, hence they can be used as voltage instabilityindicators. The value increases abruptly to very high positiveand switches from positive to negative in case of lack ofreactive power support for dVi/dQik or when the maximumpower transfer is reached for dVi/dPik . A graphical exampleis illustrated in Section VI.
VI. FILTERING METHODOLOGY
The proposed filtering method used in this study is similarthat in [27]. Its aim is to smooth all signals before computingvoltage sensitivities. Figure 5 shows a block diagram of theprocessing method. It starts by taking raw data and applying ahigh pass filter with cutoff frequency of 1.37 Hz. This cutofffrequency corresponds to the dominant oscillatory componentin the system. Then, the original data is subtracted by thefiltered data. By applying this subtraction, electromechanicaloscillations and large outliers are removed from the originalsignal, this is shown in Fig. 5 with a (i); signals from thisstep are termed “filtered” signals. An additional step is toapply a moving average (MA) filter by computing the meanand standard deviation of the filtered signal. As denoted inFig. 5, these signals are termed “filtered+MA”. The size ofthe MA window is designed to cover the data which deviatesfrom the mean value by three standard deviations of thefiltered signal. The MA aids to increase the robustness of thecomputed sensitivities. This filtering method is applied to boththe DIgSILENT PowerFactory simulation (of 0.001 sec step-size) and the PMU measurement data (50 samples per second).
Figure 6 and 7 show the difference between filtering andnot filtering voltages and the corresponding PV-curve at Bus5, respectively. Figure 8 depicts the plot of voltage stabilitysensitivity (dV/dP) at Bus 5 that obtained by using data fromPSB simulation.
As mentioned in Section V, the sensitivity (dVi/dPik inthis case) can be used to generate an early signal warningwhen its value changes from positive to negative; this occurs
at t = 400s (while system collapse at t = 440s). Thisearly warning signal can be generated by setting a thresholdvalue (e.g., dV5/dP53 = 0.08); this allows detection beforethe sensitivity changes abruptly to a large positive value. Thiscan be verified from Fig. 6. The spikes shown in the green inFig. 8 correspond to OLTC tap position changes. It can alsobe noted that the sensitivity calculated from the unfiltered data(green dashed line) are vulnerable to OLTC tap switching andvary abruptly compared with those computed using data whichhas been filtered, or filtered with MA. Figure 9 shows that the
0 50 100 150 200 250 300 350 400 4500.6
0.7
0.8
0.9
1
1.1
Power (pu)
Vol
tage
(pu
)
UnFilteredFiltered
Fig. 6. Filtered and Unfiltered Voltage at Bus 5 (PSB Simulation)
14 16 18 20 22 24 260.4
0.5
0.6
0.7
0.8
0.9
1
1.1
Power (pu)
Vol
tage
(pu
)
UnFilteredFiltered
Fig. 7. Filtered and Unfiltered PV-curve (PSB Simulation)
100 150 200 250 300 350 400 450−0.5
0
0.5
Time − (sec)
dV
i/dP
ik
UnfilteredFilteredFiltered+MA
Fig. 8. Plot of calculated dV5/dP53 sensitivity at Bus 5 from filtered PSBsimulation data.
5
250 300 3500
0.05
0.1
0.15
0.2
Time − (sec)
dV
i/dP
ik
FilteredFiltered+MA
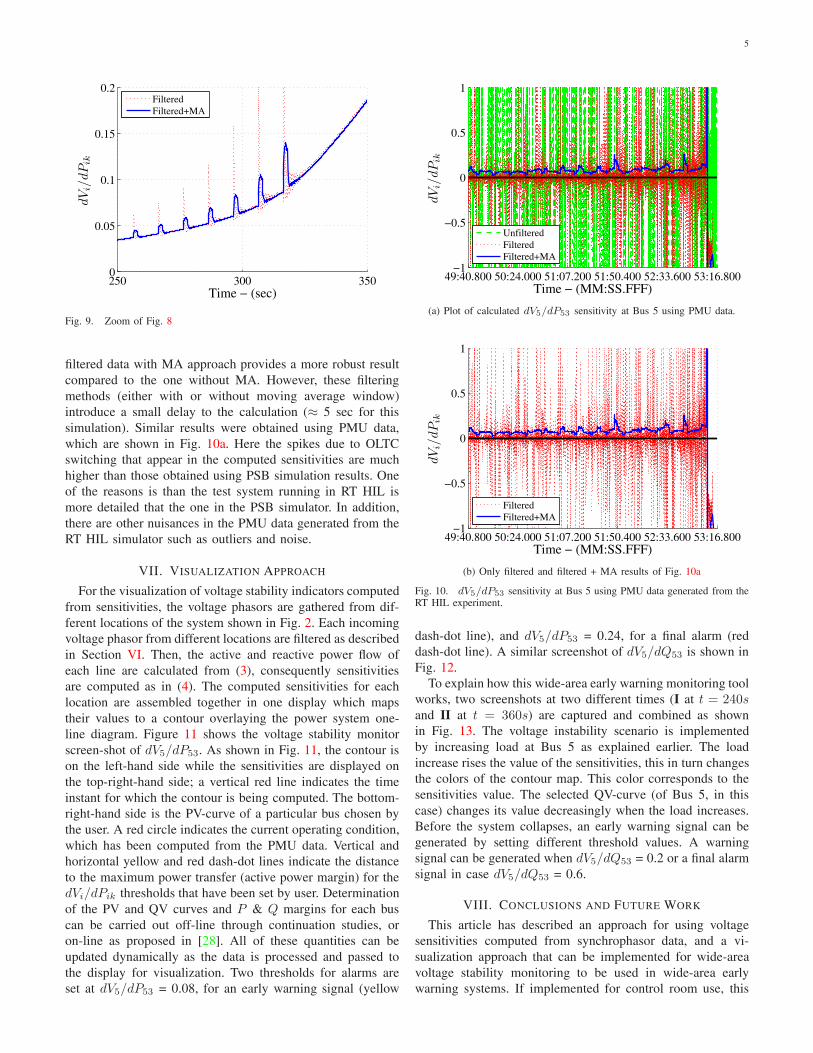
Fig. 9. Zoom of Fig. 8
filtered data with MA approach provides a more robust resultcompared to the one without MA. However, these filteringmethods (either with or without moving average window)introduce a small delay to the calculation (≈ 5 sec for thissimulation). Similar results were obtained using PMU data,which are shown in Fig. 10a. Here the spikes due to OLTCswitching that appear in the computed sensitivities are muchhigher than those obtained using PSB simulation results. Oneof the reasons is than the test system running in RT HIL ismore detailed that the one in the PSB simulator. In addition,there are other nuisances in the PMU data generated from theRT HIL simulator such as outliers and noise.
VII. VISUALIZATION APPROACH
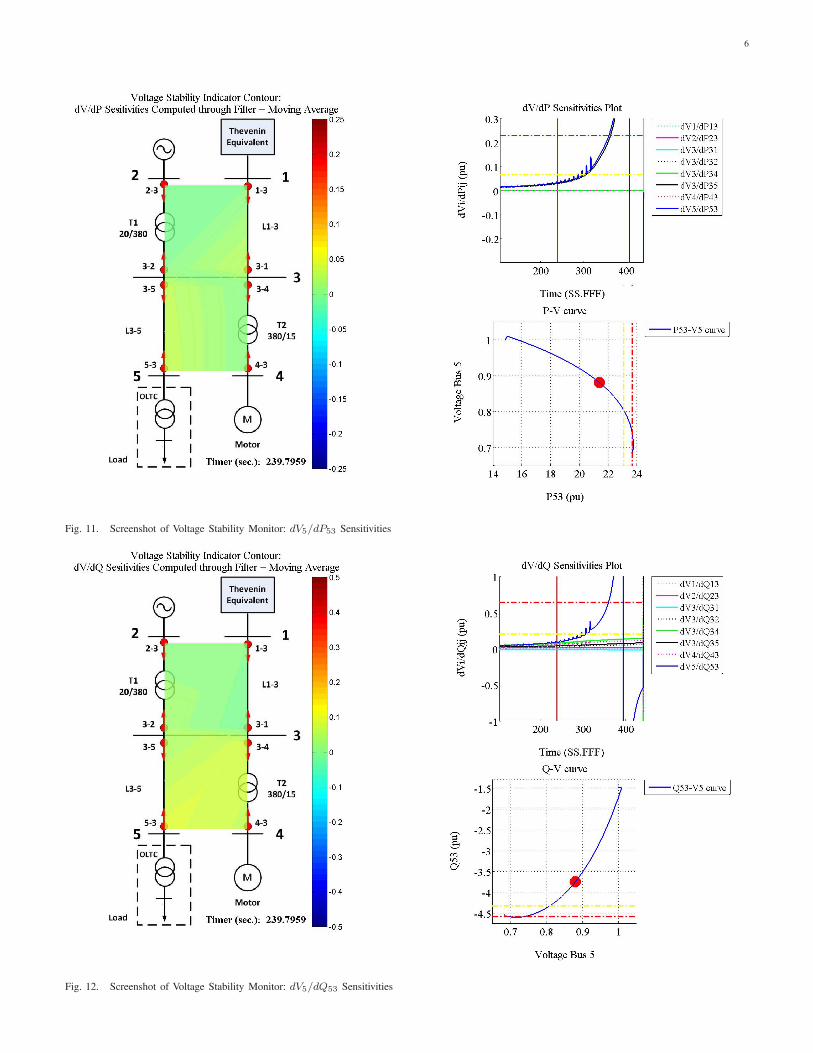
For the visualization of voltage stability indicators computedfrom sensitivities, the voltage phasors are gathered from dif-ferent locations of the system shown in Fig. 2. Each incomingvoltage phasor from different locations are filtered as describedin Section VI. Then, the active and reactive power flow ofeach line are calculated from (3), consequently sensitivitiesare computed as in (4). The computed sensitivities for eachlocation are assembled together in one display which mapstheir values to a contour overlaying the power system one-line diagram. Figure 11 shows the voltage stability monitorscreen-shot of dV5/dP53. As shown in Fig. 11, the contour ison the left-hand side while the sensitivities are displayed onthe top-right-hand side; a vertical red line indicates the timeinstant for which the contour is being computed. The bottom-right-hand side is the PV-curve of a particular bus chosen bythe user. A red circle indicates the current operating condition,which has been computed from the PMU data. Vertical andhorizontal yellow and red dash-dot lines indicate the distanceto the maximum power transfer (active power margin) for thedVi/dPik thresholds that have been set by user. Determinationof the PV and QV curves and P & Q margins for each buscan be carried out off-line through continuation studies, oron-line as proposed in [28]. All of these quantities can beupdated dynamically as the data is processed and passed tothe display for visualization. Two thresholds for alarms areset at dV5/dP53 = 0.08, for an early warning signal (yellow
49:40.800 50:24.000 51:07.200 51:50.400 52:33.600 53:16.800−1
−0.5
0
0.5
1
Time − (MM:SS.FFF)
dV
i/dP
ik
UnfilteredFilteredFiltered+MA
(a) Plot of calculated dV5/dP53 sensitivity at Bus 5 using PMU data.
49:40.800 50:24.000 51:07.200 51:50.400 52:33.600 53:16.800−1
−0.5
0
0.5
1
Time − (MM:SS.FFF)
dV
i/dP
ik
FilteredFiltered+MA
(b) Only filtered and filtered + MA results of Fig. 10a
Fig. 10. dV5/dP53 sensitivity at Bus 5 using PMU data generated from theRT HIL experiment.
dash-dot line), and dV5/dP53 = 0.24, for a final alarm (reddash-dot line). A similar screenshot of dV5/dQ53 is shown inFig. 12.
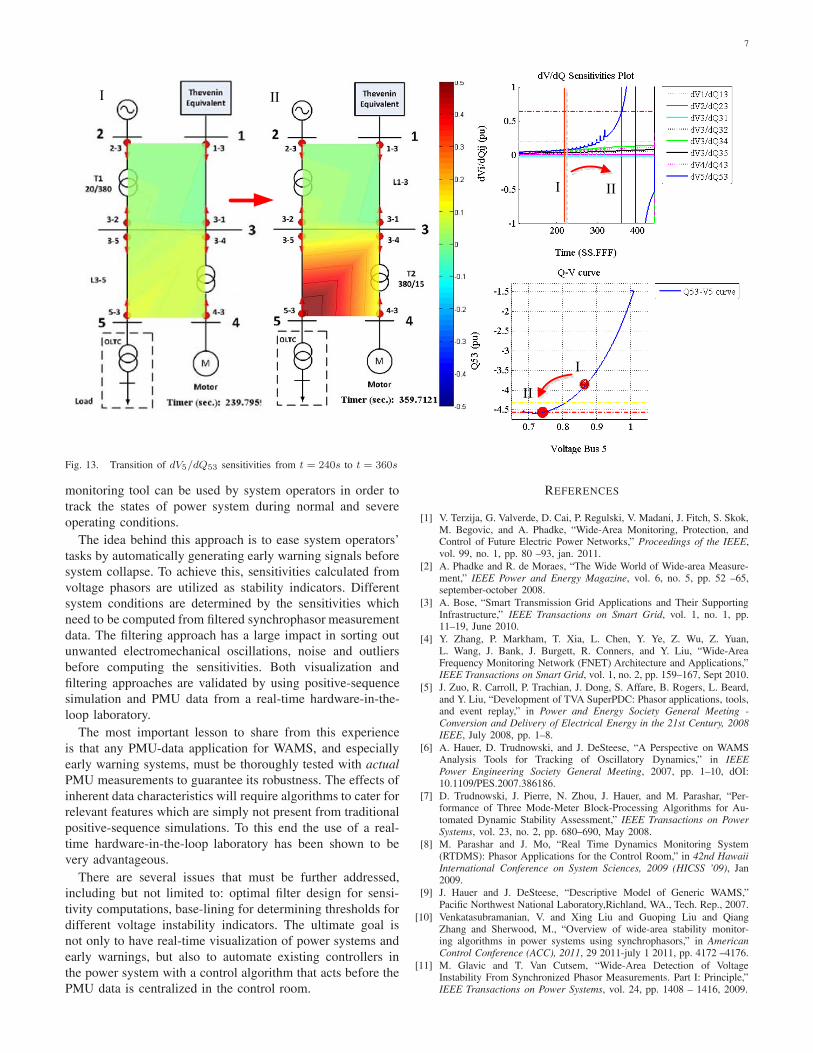
To explain how this wide-area early warning monitoring toolworks, two screenshots at two different times (I at t = 240sand II at t = 360s) are captured and combined as shownin Fig. 13. The voltage instability scenario is implementedby increasing load at Bus 5 as explained earlier. The loadincrease rises the value of the sensitivities, this in turn changesthe colors of the contour map. This color corresponds to thesensitivities value. The selected QV-curve (of Bus 5, in thiscase) changes its value decreasingly when the load increases.Before the system collapses, an early warning signal can begenerated by setting different threshold values. A warningsignal can be generated when dV5/dQ53 = 0.2 or a final alarmsignal in case dV5/dQ53 = 0.6.
VIII. CONCLUSIONS AND FUTURE WORK
This article has described an approach for using voltagesensitivities computed from synchrophasor data, and a vi-sualization approach that can be implemented for wide-areavoltage stability monitoring to be used in wide-area earlywarning systems. If implemented for control room use, this
6
Fig. 11. Screenshot of Voltage Stability Monitor: dV5/dP53 Sensitivities
Fig. 12. Screenshot of Voltage Stability Monitor: dV5/dQ53 Sensitivities
7
III
I II
IIIdV/dQ Sensitivities Plot
III
I II
Fig. 13. Transition of dV5/dQ53 sensitivities from t = 240s to t = 360s
monitoring tool can be used by system operators in order totrack the states of power system during normal and severeoperating conditions.
The idea behind this approach is to ease system operators’tasks by automatically generating early warning signals beforesystem collapse. To achieve this, sensitivities calculated fromvoltage phasors are utilized as stability indicators. Differentsystem conditions are determined by the sensitivities whichneed to be computed from filtered synchrophasor measurementdata. The filtering approach has a large impact in sorting outunwanted electromechanical oscillations, noise and outliersbefore computing the sensitivities. Both visualization andfiltering approaches are validated by using positive-sequencesimulation and PMU data from a real-time hardware-in-the-loop laboratory.
The most important lesson to share from this experienceis that any PMU-data application for WAMS, and especiallyearly warning systems, must be thoroughly tested with actualPMU measurements to guarantee its robustness. The effects ofinherent data characteristics will require algorithms to cater forrelevant features which are simply not present from traditionalpositive-sequence simulations. To this end the use of a real-time hardware-in-the-loop laboratory has been shown to bevery advantageous.
There are several issues that must be further addressed,including but not limited to: optimal filter design for sensi-tivity computations, base-lining for determining thresholds fordifferent voltage instability indicators. The ultimate goal isnot only to have real-time visualization of power systems andearly warnings, but also to automate existing controllers inthe power system with a control algorithm that acts before thePMU data is centralized in the control room.
REFERENCES
[1] V. Terzija, G. Valverde, D. Cai, P. Regulski, V. Madani, J. Fitch, S. Skok,M. Begovic, and A. Phadke, “Wide-Area Monitoring, Protection, andControl of Future Electric Power Networks,” Proceedings of the IEEE,vol. 99, no. 1, pp. 80 –93, jan. 2011.
[2] A. Phadke and R. de Moraes, “The Wide World of Wide-area Measure-ment,” IEEE Power and Energy Magazine, vol. 6, no. 5, pp. 52 –65,september-october 2008.
[3] A. Bose, “Smart Transmission Grid Applications and Their SupportingInfrastructure,” IEEE Transactions on Smart Grid, vol. 1, no. 1, pp.11–19, June 2010.
[4] Y. Zhang, P. Markham, T. Xia, L. Chen, Y. Ye, Z. Wu, Z. Yuan,L. Wang, J. Bank, J. Burgett, R. Conners, and Y. Liu, “Wide-AreaFrequency Monitoring Network (FNET) Architecture and Applications,”IEEE Transactions on Smart Grid, vol. 1, no. 2, pp. 159–167, Sept 2010.
[5] J. Zuo, R. Carroll, P. Trachian, J. Dong, S. Affare, B. Rogers, L. Beard,and Y. Liu, “Development of TVA SuperPDC: Phasor applications, tools,and event replay,” in Power and Energy Society General Meeting -Conversion and Delivery of Electrical Energy in the 21st Century, 2008IEEE, July 2008, pp. 1–8.
[6] A. Hauer, D. Trudnowski, and J. DeSteese, “A Perspective on WAMSAnalysis Tools for Tracking of Oscillatory Dynamics,” in IEEEPower Engineering Society General Meeting, 2007, pp. 1–10, dOI:10.1109/PES.2007.386186.
[7] D. Trudnowski, J. Pierre, N. Zhou, J. Hauer, and M. Parashar, “Per-formance of Three Mode-Meter Block-Processing Algorithms for Au-tomated Dynamic Stability Assessment,” IEEE Transactions on PowerSystems, vol. 23, no. 2, pp. 680–690, May 2008.
[8] M. Parashar and J. Mo, “Real Time Dynamics Monitoring System(RTDMS): Phasor Applications for the Control Room,” in 42nd HawaiiInternational Conference on System Sciences, 2009 (HICSS ’09), Jan2009.
[9] J. Hauer and J. DeSteese, “Descriptive Model of Generic WAMS,”Pacific Northwest National Laboratory,Richland, WA., Tech. Rep., 2007.
[10] Venkatasubramanian, V. and Xing Liu and Guoping Liu and QiangZhang and Sherwood, M., “Overview of wide-area stability monitor-ing algorithms in power systems using synchrophasors,” in AmericanControl Conference (ACC), 2011, 29 2011-july 1 2011, pp. 4172 –4176.
[11] M. Glavic and T. Van Cutsem, “Wide-Area Detection of VoltageInstability From Synchronized Phasor Measurements. Part I: Principle,”IEEE Transactions on Power Systems, vol. 24, pp. 1408 – 1416, 2009.
8
[12] M. Glavic, M and T. Van Cutsem,, “Wide-Area Detection of VoltageInstability From Synchronized Phasor Measurements. Part II: SimulationResults,” IEEE Transactions on Power Systems, vol. 24, pp. 1417 – 1425,2009.
[13] C. Taylor, Power System Voltage Stability, N. Balu and D. Maratukulam,Eds. McGraw-Hill, 1994.
[14] K. Vu, M. Begovic, D. Novosel, and M. Saha, “Use of local measure-ments to estimate voltage-stability margin,” IEEE Transactions on PowerSystems, vol. 14, pp. 1029 – 1035, 1999.
[15] I. Smon, G. Verbic, and F. Gubina, “Local Voltage-Stability Index UsingTellegen’s Theorem,” IEEE Transactions on Power Systems, vol. 21, pp.1267–1275, 2006.
[16] C. D. Vournas and N. G. Sakellaridis, “Tracking Maximum LoadabilityConditions in Power Systems,” in 2007 iREP Symposium Bulk PowerSystem Dynamics and Control - VII. Revitalizing Operational Reliability,2007.
[17] B. Milosevic and M. Begovic, “Voltage-stability protection and controlusing a wide-area network of phasor measurements,” IEEE Transactionson Power Systems, vol. 18, pp. 121–127, 2003.
[18] L. Bao, Z. Huang, and W. Xu, “Online Voltage Stability MonitoringUsing Var Reserves,” IEEE Transactions on Power Systems, vol. 18, pp.1461–1469, 2003.
[19] M. Glavic and T. Van Cutsem, “Investigating state reconstruction fromscarce synchronized phasor measurements,” in 2011 IEEE TrondheimPowerTech, 2011.
[20] B. Milosevic and M. Begovic, “Voltage Stability Protection and Controlusing a Wide-Area Network of Phasor Measurements,” IEEE Transac-tions on Power Systems, vol. 18, pp. 121–127, 2003.
[21] L. Vanfretti et al, “SmarTS Lab — A Laboratory for DevelopingApplications for WAMPAC Systems,” in submitted for publication, IEEEPES General Meeting 2012, july 2012.
[22] R. Leelaruji and L. Vanfretti, “‘All-in-one’ test system modelling andsimulation for multiple instability scenarios,” KTH, Royal Institute ofTechnology, Internal Report, April 2011.
[23] IEEE Committee Report, “Dynamic Models for Steam and Hydro Tur-bines in Power System Studies,” IEEE Transactions on Power Apparatusand Systems, vol. PAS-92, pp. 1904–1915, 1973.
[24] T. Van Cutsem and C. Vournas, Voltage Stability of Electric PowerSystems. Kluwer Academic Publishers, 1998.
[25] T. Van Cutsem, “An approach to corrective control of voltage instabilityusing simulation and sensitivity,” IEEE Transactions on Power Systems,vol. 2, pp. 616–622, 1995.
[26] M. Begovic and A. G. Phadke, “Control of voltage stability usingsensitivity analysis,” IEEE Transactions on Power Systems, vol. 7, pp.114–123, 1992.
[27] L. Vanfretti, J. H. Chow, U. Aliyu, L. Dosiek, J.Pierre, D. Trudnowski,and R. Garcia-Valle, “Estimation of the Nigerian Power System Elec-tromechanical Modes using FDR Measurements,” in 9th InternationalConference on Power System Operations and Planning (ICPSOP), 2010.
[28] M. Parniani, J. Chow, L. Vanfretti, B. Bhargava, and A. Salazar, “VoltageStability Analysis of a Multiple-Infeed Load Center Using PhasorMeasurement Data,” in 2006 IEEE PES Power Systems Conference andExposition, 2006 (PSCE ’06), Nov 2006, pp. 1299 –1305.
Rujiroj Leelaruji received the B.Sc. degree in electrical engineering fromSirindhorn International Institute of Technology (SIIT), Thailand, in 2004,and the M.Sc. degree in electric power engineering from KTH Royal Instituteof technology, Stockholm, Sweden, in 2007. He is currently a Ph.D. studentwithin the Electric Power Systems (EPS) Division at KTH. The main themeof his current research is the development and implementation of an algorithmfor coordinating system protections and HVDC/FACTS controllers that canresult in preventive measures mitigating wide-area system collapses.
Luigi Vanfretti (Student Member ’03, M’10) is an Assistant Professor atthe Electric Power Systems Division, School of Electrical Engineering, KTHRoyal Institute of Technology, Stockholm, Sweden. He received the ElectricalEngineering Degree from Universidad de San Carlos de Guatemala in June2005. He was a visiting researcher at the Department of Electronics andElectrical Engineering of The University of Glasgow, Scotland in 2005.He received his M.Sc. in 2007 and Ph.D. in 2009, both in Electric PowerEngineering, from Rensselaer Polytechnic Institute (RPI), Troy, NY, USA.For his research and teaching work towards his Ph.D. he was awarded theCharles M. Close Award from Rensselaer Polytechnic Institute.
Since 2009, he has served as Secretary of the IEEE Task Force on OpenSource Software and as WG Organizer for the IEEE PSDP Working Groupon Power System Dynamic Measurements. His research interests are in thegeneral area of modeling, dynamics, stability and control of power systems;while his main focus is on the development of applications of PMU data. Heis an evangelist of Free/Libre and Open Source Software for power systemengineering education.
Shoaib Almas has recently completed his M.Sc. in Electric Power Engineer-ing from KTH Royal Institute of Technology, Stockholm Sweden. Previouslyhe did his B.Sc. in Electrical Engineering from NUST, Pakistan. He has aprofessional experience in substation automation and protection. Currently heis working at the SmarTS Laboratory at KTH