vodafoneziggo group b.v
TRANSCRIPT

VodafoneZiggo Group B.V.
Quarterly ReportSeptember 30, 2021
VodafoneZiggo Group B.V.Boven Vredenburgpassage 128,
3511 WR UtrechtThe Netherlands

VODAFONEZIGGO GROUP B.V.
TABLE OF CONTENTS
Page
NumberCONDENSED CONSOLIDATED FINANCIAL STATEMENTS
Condensed Consolidated Balance Sheets as of September 30, 2021 and December 31, 2020 (unaudited) ............. 2
Condensed Consolidated Statements of Operations for the Three and Nine Months Ended September 30, 2021 and 2020 (unaudited) ............................................................................................................................................. 4
Condensed Consolidated Statement of Owner’s Equity for the Nine Months Ended September 30, 2021 (unaudited) ............................................................................................................................................................. 5
Condensed Consolidated Statements of Cash Flows for the Nine Months Ended September 30, 2021 and 2020 (unaudited) ............................................................................................................................................................. 6
Notes to Condensed Consolidated Financial Statements (unaudited) ...................................................................... 8
MANAGEMENT’S DISCUSSION AND ANALYSIS OF FINANCIAL CONDITION AND RESULTS OF OPERATIONS ........................................................................................................................................................... 28
1

VODAFONEZIGGO GROUP B.V.
CONDENSED CONSOLIDATED BALANCE SHEETS
(unaudited)
September 30, December 31,2021 2020
in millionsASSETS
Current assets:Cash and cash equivalents ........................................................................................................ € 174.7 € 300.9 Trade receivables, net ............................................................................................................... 162.6 167.2 Related-party receivables (note 10) .......................................................................................... 44.9 33.6 Prepaid expenses ....................................................................................................................... 35.7 41.2 Derivative instruments (note 4) ................................................................................................ 76.7 51.1 Contract assets (note 3) ............................................................................................................. 150.7 154.0 Other current assets, net (note 3) .............................................................................................. 100.4 124.9
Total current assets ............................................................................................................... 745.7 872.9 Property and equipment, net (notes 6 and 8) ............................................................................... 4,748.2 4,877.3 Goodwill (note 6) ........................................................................................................................ 7,375.5 7,375.5 Intangible assets subject to amortization, net (note 6) ................................................................ 5,283.6 5,586.4 Long-term contract assets (note 3) .............................................................................................. 60.8 60.0 Other assets, net (notes 3, 4 and 8) .............................................................................................. 526.2 556.2
Total assets ........................................................................................................................... € 18,740.0 € 19,328.3
The accompanying notes are an integral part of these condensed consolidated financial statements.
2

VODAFONEZIGGO GROUP B.V.
CONDENSED CONSOLIDATED BALANCE SHEETS — (Continued)
(unaudited)
September 30, December 31,2021 2020
in millionsLIABILITIES AND OWNER’S EQUITY
Current liabilities:Accounts payable (note 10) ...................................................................................................... € 227.4 € 312.5 Accrued and other current liabilities (notes 6, 8 and 10) 467.0 389.8Deferred revenue and advance payments from subscribers and others (note 3) ...................... 210.6 208.0 VAT payable ............................................................................................................................. 144.6 140.9 Derivative instruments (note 4) ................................................................................................ 88.4 82.6 Accrued interest (note 7) .......................................................................................................... 89.8 136.8 Current portion of third-party debt and finance lease obligations (notes 7 and 8) ................... 1,038.4 1,156.8
Total current liabilities ......................................................................................................... 2,266.2 2,427.4 Long-term debt and finance lease obligations (notes 7 and 8):
Third-party ................................................................................................................................ 9,802.5 9,508.5 Related-party (note 10) ............................................................................................................. 1,815.8 1,607.9
Deferred income taxes (note 9) ................................................................................................... 1,119.7 1,173.9 Other long-term liabilities (notes 3, 4 and 8) .............................................................................. 742.4 1,165.3
Total liabilities ..................................................................................................................... 15,746.6 15,883.0
Commitments and contingencies (notes 4, 10 and 11)
Total owner’s equity ................................................................................................................... 2,993.4 3,445.3 Total liabilities and owner’s equity ...................................................................................... € 18,740.0 € 19,328.3
The accompanying notes are an integral part of these condensed consolidated financial statements.
3
VODAFONEZIGGO GROUP B.V.
CONDENSED CONSOLIDATED STATEMENTS OF OPERATIONS
(unaudited)
Three months ended Nine months ended
September 30, September 30,
2021 2020 2021 2020
in millions
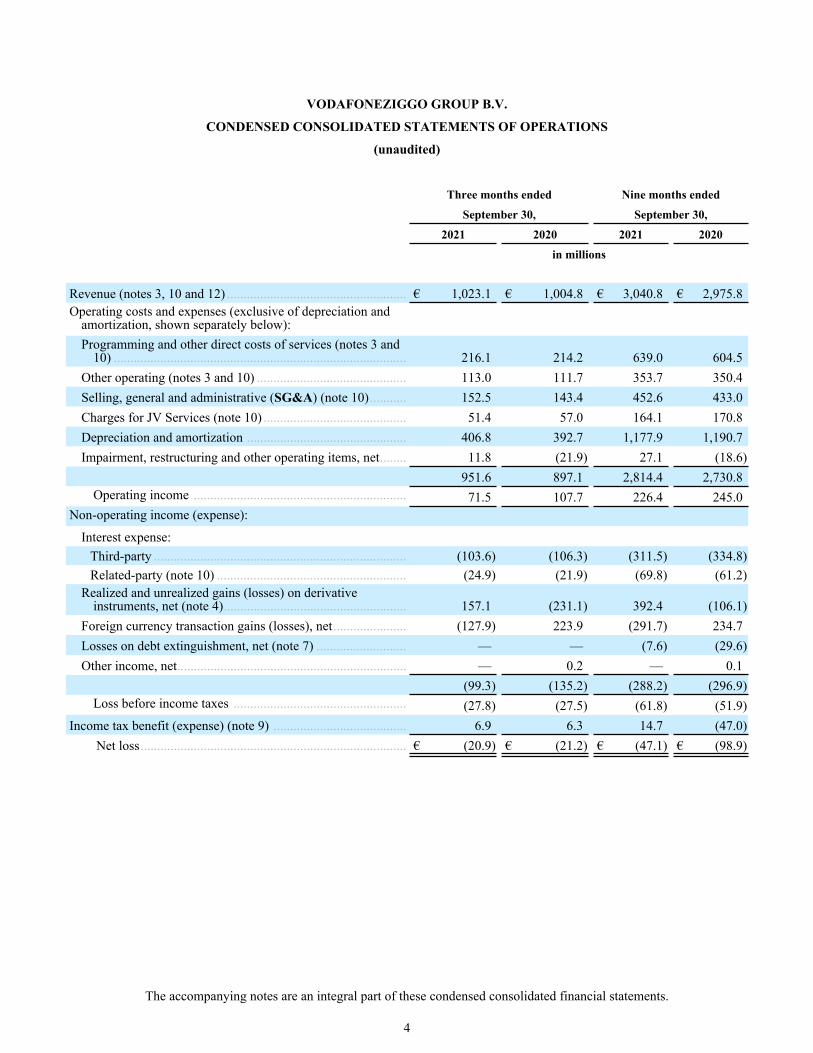
Revenue (notes 3, 10 and 12) ...................................................... € 1,023.1 € 1,004.8 € 3,040.8 € 2,975.8 Operating costs and expenses (exclusive of depreciation and
amortization, shown separately below):Programming and other direct costs of services (notes 3 and
10) ........................................................................................ 216.1 214.2 639.0 604.5 Other operating (notes 3 and 10) ............................................. 113.0 111.7 353.7 350.4 Selling, general and administrative (SG&A) (note 10) ........... 152.5 143.4 452.6 433.0 Charges for JV Services (note 10) ........................................... 51.4 57.0 164.1 170.8 Depreciation and amortization ................................................ 406.8 392.7 1,177.9 1,190.7 Impairment, restructuring and other operating items, net ........ 11.8 (21.9) 27.1 (18.6)
951.6 897.1 2,814.4 2,730.8 Operating income ................................................................ 71.5 107.7 226.4 245.0
Non-operating income (expense):
Interest expense:Third-party ............................................................................ (103.6) (106.3) (311.5) (334.8) Related-party (note 10) ......................................................... (24.9) (21.9) (69.8) (61.2)
Realized and unrealized gains (losses) on derivative instruments, net (note 4) ....................................................... 157.1 (231.1) 392.4 (106.1)
Foreign currency transaction gains (losses), net ...................... (127.9) 223.9 (291.7) 234.7 Losses on debt extinguishment, net (note 7) ........................... — — (7.6) (29.6) Other income, net ..................................................................... — 0.2 — 0.1
(99.3) (135.2) (288.2) (296.9) Loss before income taxes .................................................... (27.8) (27.5) (61.8) (51.9)
Income tax benefit (expense) (note 9) ........................................ 6.9 6.3 14.7 (47.0) Net loss ................................................................................ € (20.9) € (21.2) € (47.1) € (98.9)
The accompanying notes are an integral part of these condensed consolidated financial statements.
4

VODAFONEZIGGO GROUP B.V.
CONDENSED CONSOLIDATED STATEMENT OF OWNER’S EQUITY
(unaudited)
in millionsTotal owner’s equity at January 1, 2021 ............................................................................................................. € 3,445.3 Net loss .............................................................................................................................................................. (47.1) Distributions to VodafoneZiggo Group Holding (note 10) .............................................................................. (405.0) Share-based compensation (note 10) ................................................................................................................ 0.5 Other ................................................................................................................................................................. (0.3)
Total owner’s equity at September 30, 2021 ...................................................................................................... € 2,993.4
The accompanying notes are an integral part of these condensed consolidated financial statements.
5

VODAFONEZIGGO GROUP B.V.
CONDENSED CONSOLIDATED STATEMENTS OF CASH FLOWS
(unaudited)
Nine months endedSeptember 30,
2021 2020 in millionsCash flows from operating activities:
Net loss ................................................................................................................................ € (47.1) € (98.9) Adjustments to reconcile net loss to net cash provided by operating activities:Share-based compensation expense .................................................................................. 0.5 0.3 Depreciation and amortization .......................................................................................... 1,177.9 1,190.7 Impairment, restructuring and other operating items, net ................................................. 27.1 (18.6) Amortization of debt premiums, deferred financing costs and non-cash interest ............. 6.1 6.7 Realized and unrealized losses (gains) on derivative instruments, net ............................. (392.4) 106.1 Foreign currency transaction losses (gains), net ................................................................ 291.7 (234.7) Losses on debt extinguishment, net ................................................................................... 7.6 29.6 Deferred income tax expense (benefit) .............................................................................. (54.3) 47.0 Changes in operating assets and liabilities ........................................................................ 17.9 (64.3)
Net cash provided by operating activities .................................................................... 1,035.0 963.9
Cash flows from investing activities:
Capital expenditures ............................................................................................................ (232.0) (243.6) Total cash paid for spectrum licenses ................................................................................. (207.9) (207.9) Other investing activities, net .............................................................................................. 0.2 2.1
Net cash used by investing activities ........................................................................... € (439.7) (449.4)
The accompanying notes are an integral part of these condensed consolidated financial statements.
6

VODAFONEZIGGO GROUP B.V.
CONDENSED CONSOLIDATED STATEMENTS OF CASH FLOWS — (Continued)
(unaudited)
Nine months endedSeptember 30,
2021 2020in millions
Cash flows from financing activities:Repayments of third-party debt and finance lease obligations .......................................... € (1,089.5) € (2,975.7) Borrowings of third-party debt ......................................................................................... 565.9 2,454.9
Related-party borrowings, net ........................................................................................... 207.9 207.9 Distributions to VodafoneZiggo Group Holding ............................................................... (405.0) (175.0) Receipt (payment) of financing costs and debt premiums ................................................. 0.8 (51.4) Other financing activities, net ............................................................................................ (0.8) (1.2)
Net cash used by financing activities .......................................................................... (720.7) (540.5)
Effect of exchange rate changes on cash and cash equivalents and restricted cash ............. 0.2 2.5
Net decrease in cash and cash equivalents and restricted cash ............................................. (125.2) (23.5)
Cash and cash equivalents and restricted cash:Beginning of period ........................................................................................................... 302.1 207.1
End of period € 176.9 € 183.6
Cash paid for third-party interest .......................................................................................... € 355.9 € 377.6 Cash paid for related-party interest ....................................................................................... 69.8 61.2
Details of end of period cash and cash equivalents and restricted cash:Cash and cash equivalents ................................................................................................ € 174.7 € 180.0 Restricted cash included in other current assets, net ........................................................ 2.2 3.6
Total cash and cash equivalents and restricted cash ................................................... € 176.9 € 183.6
The accompanying notes are an integral part of these condensed consolidated financial statements.
7

(1) Basis of Presentation
VodafoneZiggo Group B.V. (VodafoneZiggo) provides video, broadband internet, fixed-line telephony and mobile services to residential and business-to-business (B2B) customers in the Netherlands. In these notes, the terms “we,” “our,” “our company” and “us” may refer, as the context requires, to VodafoneZiggo or collectively to VodafoneZiggo and its subsidiaries.
VodafoneZiggo is a wholly-owned subsidiary of VodafoneZiggo Group Holding B.V. (VodafoneZiggo Group Holding). VodafoneZiggo Group Holding is a 50:50 joint venture (the VodafoneZiggo JV) between Vodafone Group Plc (Vodafone) and Liberty Global plc (Liberty Global) (each a “Shareholder”).
Our unaudited condensed consolidated financial statements have been prepared in accordance with accounting principles generally accepted in the United States (GAAP) and do not include all of the information required by GAAP for complete financial statements. In the opinion of management, these financial statements reflect all adjustments (consisting of normal recurring adjustments) necessary for a fair presentation of the results of operations for the interim periods presented. The results of operations for any interim period are not necessarily indicative of results for the full year. These unaudited condensed consolidated financial statements should be read in conjunction with our GAAP 2020 consolidated financial statements and notes thereto included in our 2020 annual report.
The preparation of financial statements in conformity with GAAP requires management to make estimates and assumptions that affect the reported amounts of assets and liabilities at the date of the financial statements and the reported amounts of revenue and expenses during the reporting period. Estimates and assumptions are used in accounting for, among other things, the valuation of acquisition-related assets and liabilities, allowances for uncollectible accounts, certain components of revenue, programming and copyright costs, deferred income taxes and related valuation allowances, loss contingencies, fair value measurements, impairment assessments, capitalization of internal costs associated with construction and installation activities, lease terms and useful lives of long-lived assets. Actual results could differ from those estimates.
Our functional currency is the euro (€). Unless otherwise indicated, convenience translations into euros are calculated as of September 30, 2021.
Certain prior period amounts have been reclassified to conform to the current period presentation. These unaudited condensed consolidated financial statements reflect our consideration of the accounting and disclosure
implications of subsequent events through November 22, 2021, the date of issuance.
(2) Accounting Changes and Recent Accounting Pronouncements
Accounting Changes ASU 2019-12
In December 2019, the Financial Accounting Standards Board (FASB) issued Accounting Standards Update (ASU) No. 2019-12, Simplifying the Accounting for Income Taxes, which is intended to improve consistency and simplify several areas of existing guidance. ASU 2019-12 removes certain exceptions to the general principles related to the approach for intraperiod tax allocation, the methodology for calculating income taxes in an interim period and the recognition of deferred tax liabilities for outside basis differences. The new guidance also clarifies the accounting for transactions that result in a step-up in the tax basis of goodwill. We adopted ASU 2019-12 on January 1, 2021, and such adoption did not have a significant impact on our condensed consolidated financial statements.
VODAFONEZIGGO GROUP B.V.Notes to Condensed Consolidated Financial Statements
September 30, 2021(unaudited)
8

(3) Revenue Recognition and Related Costs
Contract Balances
The timing of revenue recognition may differ from the timing of invoicing to our customers. We record a trade receivable when we have transferred goods or services to a customer but have not yet received payment. Our trade receivables are reported net of an allowance for doubtful accounts. Such allowance aggregated €29.1 million and €31.5 million at September 30, 2021, and December 31, 2020, respectively.
If we transfer goods or services to a customer but do not have an unconditional right to payment, we record a contract asset. Contract assets typically arise from the uniform recognition of introductory promotional discounts or the delivery of a handset that is paid for over the duration of the contract period. Our contract assets were €211.5 million and €214.0 million as of September 30, 2021, and December 31, 2020, respectively. Our contract assets are reported net of an allowance for doubtful accounts. Such allowance aggregated €4.4 million and €5.5 million at September 30, 2021, and December 31, 2020, respectively.
We record deferred revenue when we receive payment prior to transferring goods or services to a customer. We primarily defer revenue for (i) installation and other upfront services and (ii) other services that are invoiced prior to when services are provided. Our deferred revenue balances were €204.8 million and €199.0 million as of September 30, 2021, and December 31, 2020, respectively. The current and long-term portions of our deferred revenue balance are included within deferred revenue and advance payment from subscribers and others and other long-term liabilities, respectively, in our condensed consolidated balance sheets.
Contract Costs
Our aggregate assets associated with incremental costs to obtain and fulfill our contracts were €69.9 million and €84.4 million at September 30, 2021, and December 31, 2020, respectively. The current and long-term portions of our assets related to contract costs are included within other current assets, net and other assets, net, respectively, in our condensed consolidated balance sheets. We recorded amortization of €21.5 million and €67.8 million during the three and nine months ended September 30, 2021, respectively, and €24.9 million and €75.7 million during the three and nine months ended September 30, 2021, respectively, related to these assets, included in programming and other direct costs of service expenses and other operating expenses.
Unsatisfied Performance Obligations
A large portion of our revenue is derived from customers who are not subject to contracts. Revenue from customers who are subject to contracts will be recognized over the term of such contracts, which is generally 12 or 24 months for our residential and mobile service contracts and one to five years for our B2B service contracts.
(4) Derivative Instruments
In general, we enter into derivative instruments to protect against (i) increases in the interest rates on our variable-rate debt and (ii) foreign currency movements with respect to borrowings that are denominated in a currency other than our functional currency. In this regard, we have entered into various derivative instruments to manage interest rate exposure and foreign currency exposure with respect to the United States dollar ($).
VODAFONEZIGGO GROUP B.V.Notes to Condensed Consolidated Financial Statements — (Continued)
September 30, 2021(unaudited)
9

The following table provides details of the fair values of our derivative instrument assets and liabilities:
September 30, 2021 December 31, 2020
Current Long-term (a) Total Current Long-term (a) Total
in millionsAssets:
Cross-currency and interest rate derivative contracts (b) .............. € 76.4 € 93.8 € 170.2 € 51.1 € 95.0 € 146.1
Foreign currency forward contracts .................................... 0.3 — 0.3 — — —
Total ............................................. € 76.7 € 93.8 € 170.5 € 51.1 € 95.0 € 146.1 Liabilities:
Cross-currency and interest rate derivative contracts (b) .............. € 88.4 € 348.2 € 436.6 € 81.8 € 726.9 € 808.7
Foreign currency forward contracts .................................... — — — 0.8 — 0.8
Total ............................................. € 88.4 € 348.2 € 436.6 € 82.6 € 726.9 € 809.5 ___________________
(a) Our long-term derivative assets and liabilities are included in other assets, net, and other long-term liabilities, respectively, in our condensed consolidated balance sheets.
(b) We consider credit risk relating to our and our counterparties’ nonperformance in the fair value assessment of our derivative instruments. In all cases, the adjustments take into account offsetting liability or asset positions. The changes in the credit risk valuation adjustments associated with our cross-currency and interest rate derivative contracts resulted in a net gain (loss) of (€19.8 million) and €36.8 million during the three months ended September 30, 2021 and 2020, respectively, and a net gain (loss) of (€50.0 million) and €59.0 million during the nine months ended September 30, 2021 and 2020, respectively. These amounts are included in realized and unrealized gains on derivative instruments, net, in our condensed consolidated statements of operations. For further information regarding our fair value measurements, see note 5.
The details of our realized and unrealized gains (losses) on derivative instruments, net, are as follows:
Three months ended Nine months endedSeptember 30, September 30,
2021 2020 2021 2020in millions
Cross-currency and interest rate derivative contracts ............ € 156.8 € (230.4) € 391.9 € (105.3) Foreign currency forward contracts ........................................ 0.3 (0.7) 0.5 (0.8)
Total ................................................................................... € 157.1 € (231.1) € 392.4 € (106.1)
VODAFONEZIGGO GROUP B.V.Notes to Condensed Consolidated Financial Statements — (Continued)
September 30, 2021(unaudited)
10

The net cash received or paid related to our derivative instruments is classified as an operating, investing or financing activity in our condensed consolidated statements of cash flows based on the objective of the derivative instrument and the classification of the applicable underlying cash flows. For derivative contracts that are terminated prior to maturity, the cash paid or received upon termination that relates to future periods is classified as a financing activity. The classification of these net cash inflows (outflows) is as follows:
Nine months endedSeptember 30,
2021 2020in millions
Operating activities .............................................................................................................. € (4.9) € 25.4 Financing activities .............................................................................................................. (0.1) (0.6)
Total ................................................................................................................................ € (5.0) € 24.8
Counterparty Credit Risk
We are exposed to the risk that the counterparties to our derivative instruments will default on their obligations to us. We manage these credit risks through the evaluation and monitoring of the creditworthiness of and concentration of risk with the respective counterparties. In this regard, credit risk associated with our derivative instruments is spread across a relatively broad counterparty base of banks and financial institutions. Collateral is generally not posted by either party under our derivative instruments. At September 30, 2021, our exposure to counterparty credit risk included derivative assets with an aggregate fair value of €11.9 million.
Details of our Derivative Instruments
Cross-currency Swaps
We generally match the denomination of our borrowings with the functional currency of the supporting operations or, when it is more cost effective, we provide for an economic hedge against foreign currency exchange rate movements by using derivative instruments to synthetically convert unmatched debt into the applicable underlying currency. At September 30, 2021, substantially all of our debt was either directly or synthetically matched to our functional currency. The following table sets forth the total notional amounts and the related weighted average remaining contractual life of our cross-currency swap contracts at September 30, 2021:
Notional amount due from counterparty (in millions) (a) ............................................................................... $ 8,433.5 Notional amount due to counterparty (in millions) ......................................................................................... € 7,241.2 Weighted average remaining life .................................................................................................................... 4.8 years
___________________
(a) Includes certain derivative instruments that do not involve the exchange of notional amounts at the inception and maturity of the instruments. Accordingly, the only cash flows associated with these derivative instruments are interest-related payments and receipts. At September 30, 2021, the total euro equivalent of the notional amounts due from counterparties, of these derivative instruments was €1,614.0 million.
Interest Rate Derivative Contracts
As noted above, we enter into interest rate swaps to protect against increases in the interest rates on our variable-rate debt. Pursuant to these derivative instruments, we typically pay fixed interest rates and receive variable interest rates on specified notional amounts. At September 30, 2021, the notional amounts due from counterparties was €3,142.4 million and the related weighted average remaining contractual life of our interest rate swap contracts was 7.1 years.
VODAFONEZIGGO GROUP B.V.Notes to Condensed Consolidated Financial Statements — (Continued)
September 30, 2021(unaudited)
11
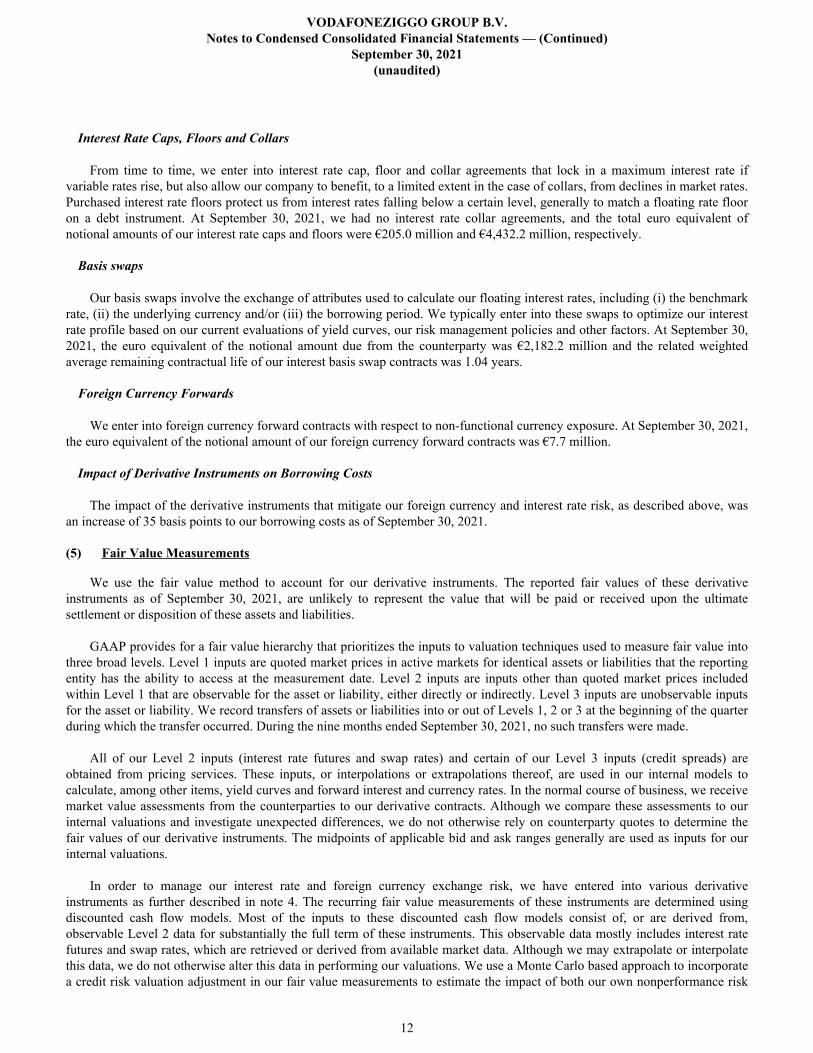
Interest Rate Caps, Floors and Collars
From time to time, we enter into interest rate cap, floor and collar agreements that lock in a maximum interest rate if variable rates rise, but also allow our company to benefit, to a limited extent in the case of collars, from declines in market rates. Purchased interest rate floors protect us from interest rates falling below a certain level, generally to match a floating rate floor on a debt instrument. At September 30, 2021, we had no interest rate collar agreements, and the total euro equivalent of notional amounts of our interest rate caps and floors were €205.0 million and €4,432.2 million, respectively.
Basis swaps
Our basis swaps involve the exchange of attributes used to calculate our floating interest rates, including (i) the benchmark rate, (ii) the underlying currency and/or (iii) the borrowing period. We typically enter into these swaps to optimize our interest rate profile based on our current evaluations of yield curves, our risk management policies and other factors. At September 30, 2021, the euro equivalent of the notional amount due from the counterparty was €2,182.2 million and the related weighted average remaining contractual life of our interest basis swap contracts was 1.04 years.
Foreign Currency Forwards
We enter into foreign currency forward contracts with respect to non-functional currency exposure. At September 30, 2021, the euro equivalent of the notional amount of our foreign currency forward contracts was €7.7 million.
Impact of Derivative Instruments on Borrowing Costs
The impact of the derivative instruments that mitigate our foreign currency and interest rate risk, as described above, was an increase of 35 basis points to our borrowing costs as of September 30, 2021.
(5) Fair Value Measurements
We use the fair value method to account for our derivative instruments. The reported fair values of these derivative instruments as of September 30, 2021, are unlikely to represent the value that will be paid or received upon the ultimate settlement or disposition of these assets and liabilities.
GAAP provides for a fair value hierarchy that prioritizes the inputs to valuation techniques used to measure fair value into three broad levels. Level 1 inputs are quoted market prices in active markets for identical assets or liabilities that the reporting entity has the ability to access at the measurement date. Level 2 inputs are inputs other than quoted market prices included within Level 1 that are observable for the asset or liability, either directly or indirectly. Level 3 inputs are unobservable inputs for the asset or liability. We record transfers of assets or liabilities into or out of Levels 1, 2 or 3 at the beginning of the quarter during which the transfer occurred. During the nine months ended September 30, 2021, no such transfers were made.
All of our Level 2 inputs (interest rate futures and swap rates) and certain of our Level 3 inputs (credit spreads) are obtained from pricing services. These inputs, or interpolations or extrapolations thereof, are used in our internal models to calculate, among other items, yield curves and forward interest and currency rates. In the normal course of business, we receive market value assessments from the counterparties to our derivative contracts. Although we compare these assessments to our internal valuations and investigate unexpected differences, we do not otherwise rely on counterparty quotes to determine the fair values of our derivative instruments. The midpoints of applicable bid and ask ranges generally are used as inputs for our internal valuations.
In order to manage our interest rate and foreign currency exchange risk, we have entered into various derivative instruments as further described in note 4. The recurring fair value measurements of these instruments are determined using discounted cash flow models. Most of the inputs to these discounted cash flow models consist of, or are derived from, observable Level 2 data for substantially the full term of these instruments. This observable data mostly includes interest rate futures and swap rates, which are retrieved or derived from available market data. Although we may extrapolate or interpolate this data, we do not otherwise alter this data in performing our valuations. We use a Monte Carlo based approach to incorporate a credit risk valuation adjustment in our fair value measurements to estimate the impact of both our own nonperformance risk
VODAFONEZIGGO GROUP B.V.Notes to Condensed Consolidated Financial Statements — (Continued)
September 30, 2021(unaudited)
12

and the nonperformance risk of our counterparties. Certain inputs used for our credit risk valuations, such as market correlations, represent our most significant Level 3 inputs, and these inputs are used to derive the credit risk valuation adjustments with respect to these instruments. As we would not expect changes in these elements to have a significant impact on the valuations of these instruments, we have determined that these valuations fall under Level 2 of the fair value hierarchy. Our credit risk valuation adjustments with respect to our cross-currency and interest rate swaps are quantified and further explained in note 4.
Fair value measurements are also used in connection with nonrecurring valuations performed in connection with impairment assessments and acquisition accounting. We did not perform significant nonrecurring fair value measurements during the nine months ended September 30, 2021.
A summary of our assets and liabilities that are measured at fair value on a recurring basis is as follows:
September 30, December 31,
2021 (a) 2020 (a)
in millionsAssets:
Cross-currency and interest rate derivative contracts ........................................................... € 170.2 € 146.1 Foreign currency forward contracts ....................................................................................... 0.3 — Total ...................................................................................................................................... € 170.5 € 146.1
Liabilities:Cross-currency and interest rate derivative contracts ........................................................... € 436.6 € 808.7 Foreign currency forward contracts ....................................................................................... — 0.8 Total ...................................................................................................................................... € 436.6 € 809.5
___________________
(a) At September 30, 2021 and December 31, 2020, we used significant other observable inputs (Level 2) to measure all of our fair value assets and liabilities.
(6) Long-lived Assets
Property and Equipment, Net
The details of our property and equipment and the related accumulated depreciation are set forth below:
September 30, December 31,
2021 2020in millions
Distribution systems .................................................................................................................. € 6,125.2 € 5,836.6 Support equipment, buildings and land .................................................................................... 1,469.1 1,342.9 Customer premises equipment .................................................................................................. 1,020.2 966.7
8,614.5 8,146.2 Accumulated depreciation ........................................................................................................ (3,866.3) (3,268.9)
Total property and equipment, net ........................................................................................ € 4,748.2 € 4,877.3
During the nine months ended September 30, 2021 and 2020, we recorded non-cash increases to our property and equipment related to vendor financing arrangements of €364.1 million and €372.8 million, respectively, which exclude related value added taxes (VAT) of €29.8 million and €30.0 million, respectively, that were also financed by our vendors under these arrangements.
VODAFONEZIGGO GROUP B.V.Notes to Condensed Consolidated Financial Statements — (Continued)
September 30, 2021(unaudited)
13

Goodwill
There were no changes in the carrying amount of our goodwill during the nine months ended September 30, 2021.
If, among other factors, the adverse impact of economic competitive, regulatory or other factors were to cause our operations or cash flows to be worse than anticipated, we could conclude in future periods that impairment charges are required in order to reduce the carrying values of our goodwill, and, to a lesser extent, other long-lived assets. Any such impairment charges could be significant.
Intangible Assets Subject to Amortization, Net
The details of our intangible assets subject to amortization are set forth below:
September 30, 2021 December 31, 2020Gross
carrying amount
Accumulated amortization
Net carrying amount
Gross carrying amount
Accumulated amortization
Net carrying amount
in millions
Customer relationships ................................. € 6,420.0 € (2,422.0) € 3,998.0 € 6,420.0 € (2,039.6) € 4,380.4 Licenses (a) ................................................... 1,470.9 (404.0) 1,066.9 1,331.2 (352.0) 979.2 Trade name ................................................... 270.0 (51.3) 218.7 270.0 (43.2) 226.8
Total ........................................................ € 8,160.9 € (2,877.3) € 5,283.6 € 8,021.2 € (2,434.8) € 5,586.4 ___________________
(a) During the first quarter of 2021, we recorded spectrum license additions of €163.3 million associated with the renewal of our existing license in the 2100 MHz band. The spectrum license additions were funded by borrowings under our shareholder loans, as further described in note 10.
(7) Debt
The euro equivalents of the components of our third-party debt are as follows:
September 30, 2021 Principal amount
Weighted average
interest rate (a)
Unused borrowing
capacity (b)September 30,
2021December 31,
2020in millions
Senior and Senior Secured Notes ............................................. 4.65 % € — € 5,234.0 € 5,062.0 Credit Facilities (c) (d) ............................................................. 2.79 % 800.0 4,474.1 4,466.8 Vendor financing (e) ................................................................ 1.85 % — 990.8 999.4 Other debt ................................................................................. 0.28 % — 168.9 173.4
Total principal amount of third-party debt before premiums, discounts and deferred financing costs (f) .... 3.56 % € 800.0 € 10,867.8 € 10,701.6
___________________
(a) Represents the weighted average interest rate in effect at September 30, 2021 for all borrowings outstanding pursuant to each debt instrument, including any applicable margin. The interest rates presented represent stated rates and do not include the impact of derivative instruments, deferred financing costs, original issue premiums or discounts and commitment fees, all of which affect our overall cost of borrowing. Including the effects of derivative instruments, original issue premiums or discounts and commitment fees, but excluding the impact of deferred financing costs, the weighted average interest rate on our aggregate third-party variable- and fixed-rate indebtedness was 4.1% at September 30, 2021. For information regarding our derivative instruments, see note 4.
VODAFONEZIGGO GROUP B.V.Notes to Condensed Consolidated Financial Statements — (Continued)
September 30, 2021(unaudited)
14

(b) The Credit Facilities include a revolving facility with a maximum borrowing capacity of €800.0 million, which was undrawn at September 30, 2021. Unused borrowing capacity represents the maximum availability under the Credit Facilities at September 30, 2021 without regard to covenant compliance calculations or other conditions precedent to borrowing. At September 30, 2021, based on the most restrictive applicable leverage covenants and leverage-based restricted payment tests, the full €800.0 million of unused borrowing capacity was available to be borrowed and there were no additional restrictions on our ability to make loans or distributions from this availability. Upon completion of the relevant September 30, 2021 compliance reporting requirements and based on the most restrictive applicable leverage covenants and leverage-based restricted payment tests, we expect that the full amount of unused borrowing capacity will continue to be available to be borrowed and that there will be no additional restrictions with respect to loans or distributions from this availability. Our above expectations do not consider any actual or potential changes in our borrowing levels or any amounts loaned or distributed subsequent to September 30, 2021, or the impact of additional amounts that may be available to borrow, loan or distribute under certain defined baskets under the Credit Facilities.
(c) Principal amounts include €41.9 million and €151.4 million at September 30, 2021 and December 31, 2020, respectively, of borrowings pursuant to an excess cash facility under the Credit Facilities. These borrowings are owed to a non-consolidated special purpose financing entity that has issued notes to finance the purchase of receivables due from our company to certain other third parties for amounts that we and our subsidiaries have vendor financed. To the extent that the proceeds from these notes exceed the amount of vendor financed receivables available to be purchased, the excess proceeds are used to fund this excess cash facility.
(d) The Revolving Facility bears interest at a rate of EURIBOR plus 2.75% (subject to a margin ratchet) and has a fee on unused commitments of 40% of such margin per year.
(e) Represents amounts owed to various creditors pursuant to interest-bearing vendor financing arrangements that are used to finance certain of our property and equipment additions and operating expenses. These arrangements extend our repayment terms beyond a vendor’s original due dates (e.g. extension beyond a vendor’s customary payment terms, which are generally 90 days or less) and as such are classified outside of accounts payable on our condensed consolidated balance sheet. These obligations are generally due within one year and include VAT that was also financed under these arrangements. Repayments of vendor financing obligations are included in repayments of third-party debt and finance lease obligations in our condensed consolidated statements of cash flows.
(f) At September 30, 2021 and December 31, 2020, our third party debt had an estimated fair value of €11.0 billion and €10.9 billion, respectively. The estimated fair values of our debt instruments are generally determined using the average of applicable bid and ask prices (mostly Level 1 of the fair value hierarchy) or, when quoted market prices are unavailable or not considered indicative of fair value, discounted cash flow models (mostly Level 2 of the fair value hierarchy). The discount rates used in the cash flow models are based on the market interest rates and estimated credit spreads, to the extent available, and other relevant factors. For additional information regarding fair value hierarchies, see note 5.
Financing Transactions
Below we provide summary descriptions of certain financing transactions completed during the first nine months of 2021. A portion of our financing transactions may include non-cash borrowings and repayments. During the nine months ended September 30, 2021 and 2020, non-cash borrowings and repayments aggregated €173.0 million and €2,324.9 million, respectively. Unless otherwise noted, the terms and conditions of any new notes and/or credit facilities are largely consistent with those of existing notes and credit facilities with regard to covenants, events of default and change of control provisions, among other items. For information regarding the general terms and conditions of our debt and capitalized terms not defined herein, see note 8 to the consolidated financial statements included in our 2020 annual report.
2021 Financing Transactions. In March 2021, pursuant to a private placement, we issued $200.0 million (€170.2 million) principal amount of 2030 Dollar Senior Secured Notes at an issue price of 104.25% of par. The net proceeds from the issuance of these notes were used to redeem 10% of the original aggregate principal amount of our 2027 Dollar Senior Secured Notes at a premium of 3%.
VODAFONEZIGGO GROUP B.V.Notes to Condensed Consolidated Financial Statements — (Continued)
September 30, 2021(unaudited)
15

In connection with this transaction, we recognized a net loss on debt extinguishment of €7.6 million related to (i) the payment of €5.0 million of redemption premiums and (ii) the write-off of €2.6 million of fair value adjustments and unamortized deferred financing costs.
The following table provides a reconciliation of total third-party debt before premiums, discounts and deferred financing costs to total debt and finance lease obligations:
September 30, December 31,2021 2020
in millionsTotal principal amount of third-party debt before deferred financing costs, discounts and
premiums .......................................................................................................................... € 10,867.8 € 10,701.6 Deferred financing costs, discounts and premiums, net ....................................................... (47.0) (58.5)
Total carrying amount of third-party debt ........................................................................ 10,820.8 10,643.1 Third-party finance lease obligations (note 8) ..................................................................... 20.1 22.2
Total third-party debt and finance lease obligations ......................................................... 10,840.9 10,665.3 Related-party debt (note 10) ................................................................................................. 1,815.8 1,607.9
Total debt and finance lease obligations ...................................................................... 12,656.7 12,273.2 Current maturities of debt and finance lease obligations .................................................... (1,038.4) (1,156.8) Long-term debt and finance lease obligations ..................................................................... € 11,618.3 € 11,116.4
Maturities of Debt
The euro equivalents of the maturities of our debt as of September 30, 2021 are presented below:
Third-party (a)
Related-party Total
in millionsYear ending December 31:
2021 (remainder of year) (a) ................................................................................... € 357.8 € — € 357.8 2022 (a) (b) .............................................................................................................. 841.3 — 841.3 2023 ........................................................................................................................ — — — 2024 ......................................................................................................................... — — — 2025 ......................................................................................................................... — — — 2026 ......................................................................................................................... — — — Thereafter ................................................................................................................ 9,668.7 1,815.8 11,484.5 Total debt maturities .............................................................................................. 10,867.8 1,815.8 12,683.6
Deferred financing costs, discounts and premiums, net ............................................. (47.0) — (47.0) Total debt ............................................................................................................... € 10,820.8 € 1,815.8 € 12,636.6
Current portion ........................................................................................................... € 1,030.4 € — € 1,030.4 Noncurrent portion ..................................................................................................... € 9,790.4 € 1,815.8 € 11,606.2
___________________
(a) Third-party amounts include vendor financing obligations of €990.8 million, as set forth below (in millions):
VODAFONEZIGGO GROUP B.V.Notes to Condensed Consolidated Financial Statements — (Continued)
September 30, 2021(unaudited)
16
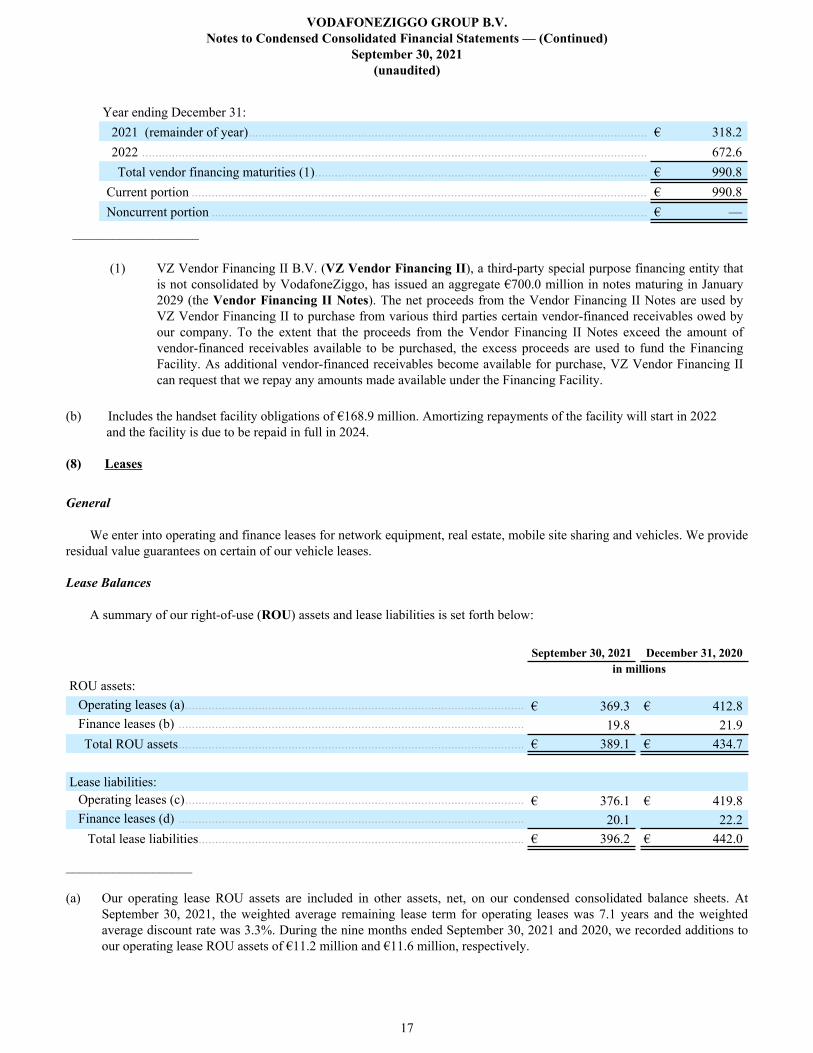
Year ending December 31:2021 (remainder of year) ........................................................................................................................ € 318.2 2022 ........................................................................................................................................................ 672.6 Total vendor financing maturities (1) .................................................................................................... € 990.8
Current portion ......................................................................................................................................... € 990.8 Noncurrent portion ................................................................................................................................... € —
___________________
(1) VZ Vendor Financing II B.V. (VZ Vendor Financing II), a third-party special purpose financing entity that is not consolidated by VodafoneZiggo, has issued an aggregate €700.0 million in notes maturing in January 2029 (the Vendor Financing II Notes). The net proceeds from the Vendor Financing II Notes are used by VZ Vendor Financing II to purchase from various third parties certain vendor-financed receivables owed by our company. To the extent that the proceeds from the Vendor Financing II Notes exceed the amount of vendor-financed receivables available to be purchased, the excess proceeds are used to fund the Financing Facility. As additional vendor-financed receivables become available for purchase, VZ Vendor Financing II can request that we repay any amounts made available under the Financing Facility.
(b) Includes the handset facility obligations of €168.9 million. Amortizing repayments of the facility will start in 2022 and the facility is due to be repaid in full in 2024.
(8) Leases
General
We enter into operating and finance leases for network equipment, real estate, mobile site sharing and vehicles. We provide residual value guarantees on certain of our vehicle leases.
Lease Balances
A summary of our right-of-use (ROU) assets and lease liabilities is set forth below:
September 30, 2021 December 31, 2020in millions
ROU assets:Operating leases (a) ...................................................................................................... € 369.3 € 412.8 Finance leases (b) ........................................................................................................ 19.8 21.9 Total ROU assets ........................................................................................................ € 389.1 € 434.7
Lease liabilities:Operating leases (c) ...................................................................................................... € 376.1 € 419.8 Finance leases (d) ........................................................................................................ 20.1 22.2 Total lease liabilities .................................................................................................. € 396.2 € 442.0
___________________
(a) Our operating lease ROU assets are included in other assets, net, on our condensed consolidated balance sheets. At September 30, 2021, the weighted average remaining lease term for operating leases was 7.1 years and the weighted average discount rate was 3.3%. During the nine months ended September 30, 2021 and 2020, we recorded additions to our operating lease ROU assets of €11.2 million and €11.6 million, respectively.
VODAFONEZIGGO GROUP B.V.Notes to Condensed Consolidated Financial Statements — (Continued)
September 30, 2021(unaudited)
17

(b) Our finance lease ROU assets are included in property and equipment, net, on our condensed consolidated balance sheets. At September 30, 2021, the weighted average remaining lease term for finance leases was 3.0 years and the weighted average discount rate was 3.5%. During the nine months ended September 30, 2021 and 2020, we recorded additions to our finance lease ROU assets of €4.6 million and €11.2 million, respectively.
(c) The current and long-term portions of our operating lease liabilities are included within other accrued and current liabilities and other long-term liabilities, respectively, on our condensed consolidated balance sheets.
(d) The current and long-term portions of our finance lease obligations are included within current portion of debt and finance lease obligations and long-term debt and finance lease obligations, respectively, on our condensed consolidated balance sheets.
A summary of our aggregate lease expense is set forth below:
Three months ended Nine months endedSeptember 30, September 30,
2021 2020 2021 2020in millions
Finance lease expense:Depreciation and amortization ........................................................... € 2.5 € 2.4 € 7.1 € 7.6 Interest expense .................................................................................. 0.1 0.2 0.4 0.7 Total finance lease expense .............................................................. 2.6 2.6 7.5 8.3
Operating lease expense (a) .................................................................. 17.9 19.7 57.0 61.6 Variable lease expense, net (b) ............................................................. (0.3) (0.2) (0.8) (0.7)
Total lease expense ........................................................................ € 20.2 € 22.1 € 63.7 € 69.2
___________________
(a) Our operating lease expense is included in other operating expenses and SG&A expenses in our condensed consolidated statements of operations.
(b) Variable lease expense represents payments made to a lessor during the lease term that vary because of a change in circumstance that occurred after the lease commencement date. Variable lease payments are expensed as incurred and are included in other operating expenses in our condensed consolidated statements of operations.
A summary of our cash outflows from operating and finance leases is set forth below:
Nine months ended September 30,2021 2020
in millionsCash paid for amounts included in the measurement of lease liabilities:
Operating cash outflows from operating leases .................................................................... € 62.5 € 65.7 Operating cash outflows from finance leases ........................................................................ 0.4 0.7 Financing cash outflows from finance leases ........................................................................ 6.6 7.6 Total cash outflows from operating and finance leases ....................................................... € 69.5 € 74.0
VODAFONEZIGGO GROUP B.V.Notes to Condensed Consolidated Financial Statements — (Continued)
September 30, 2021(unaudited)
18
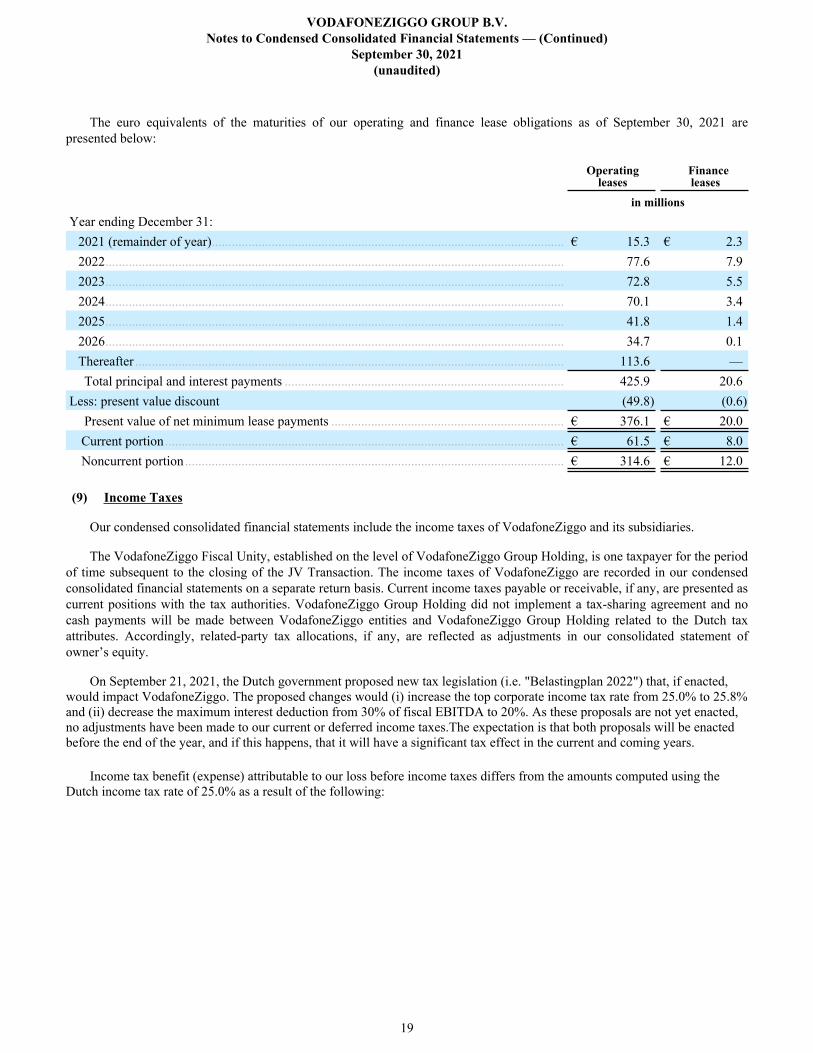
The euro equivalents of the maturities of our operating and finance lease obligations as of September 30, 2021 are presented below:
Operating leases
Finance leases
in millionsYear ending December 31:
2021 (remainder of year) .......................................................................................................... € 15.3 € 2.3 2022 .......................................................................................................................................... 77.6 7.9 2023 .......................................................................................................................................... 72.8 5.5 2024 .......................................................................................................................................... 70.1 3.4 2025 .......................................................................................................................................... 41.8 1.4 2026 .......................................................................................................................................... 34.7 0.1 Thereafter ................................................................................................................................. 113.6 — Total principal and interest payments .................................................................................... 425.9 20.6
Less: present value discount (49.8) (0.6) Present value of net minimum lease payments ...................................................................... € 376.1 € 20.0 Current portion ........................................................................................................................ € 61.5 € 8.0 Noncurrent portion .................................................................................................................. € 314.6 € 12.0
(9) Income Taxes
Our condensed consolidated financial statements include the income taxes of VodafoneZiggo and its subsidiaries.
The VodafoneZiggo Fiscal Unity, established on the level of VodafoneZiggo Group Holding, is one taxpayer for the period of time subsequent to the closing of the JV Transaction. The income taxes of VodafoneZiggo are recorded in our condensed consolidated financial statements on a separate return basis. Current income taxes payable or receivable, if any, are presented as current positions with the tax authorities. VodafoneZiggo Group Holding did not implement a tax-sharing agreement and no cash payments will be made between VodafoneZiggo entities and VodafoneZiggo Group Holding related to the Dutch tax attributes. Accordingly, related-party tax allocations, if any, are reflected as adjustments in our consolidated statement of owner’s equity.
On September 21, 2021, the Dutch government proposed new tax legislation (i.e. "Belastingplan 2022") that, if enacted, would impact VodafoneZiggo. The proposed changes would (i) increase the top corporate income tax rate from 25.0% to 25.8% and (ii) decrease the maximum interest deduction from 30% of fiscal EBITDA to 20%. As these proposals are not yet enacted, no adjustments have been made to our current or deferred income taxes.The expectation is that both proposals will be enacted before the end of the year, and if this happens, that it will have a significant tax effect in the current and coming years.
Income tax benefit (expense) attributable to our loss before income taxes differs from the amounts computed using the Dutch income tax rate of 25.0% as a result of the following:
VODAFONEZIGGO GROUP B.V.Notes to Condensed Consolidated Financial Statements — (Continued)
September 30, 2021(unaudited)
19

Three months ended Nine months endedSeptember 30, September 30,
2021 2020 2021 2020in millions
Computed "expected" tax benefit ................................................ € 7.0 € 7.0 € 15.5 € 13.0 Enacted tax law and rate changes ................................................ — (0.9) — 6.2 Non-deductible expenses (a) ....................................................... (0.1) — (0.8) (68.8) Other, net ..................................................................................... — 0.2 — 2.6 Total income tax benefit (expense) ........................................... € 6.9 € 6.3 € 14.7 € (47.0)
_______________
(a) Amount for the nine months ended 2020 consists mainly of a change in estimate relating to the deductibility of depreciation of certain intangible assets.
(10) Related-party Transactions
Our related-party transactions are set forth below:
Three months ended Nine months endedSeptember 30, September 30,
2021 2020 2021 2020in millions
Revenue .............................................................................. € 5.0 € 3.8 € 12.0 € 10.5 Programming and other direct costs of services .................. (18.4) (10.1) (32.6) (20.9) Selling, general and administrative recharges ..................... 3.8 3.3 11.9 9.6 Share-based compensation expense ..................................... — — (0.5) (0.3) Charges for JV Services:
Charges from Liberty Global:Operating (a) ................................................................... (21.5) (21.7) (66.7) (58.7) Capital (b) ........................................................................ (4.0) (7.3) (12.2) (21.8)
Total Liberty Global corporate charges ........................ (25.5) (29.0) (78.9) (80.5) Charges from Vodafone:Operating (c) ................................................................... (18.4) (20.5) (62.7) (67.8) Brand fees (d) .................................................................. (7.5) (7.5) (22.5) (22.5)
Total Vodafone corporate charges ................................ (25.9) (28.0) (85.2) (90.3) Total charges for JV Services ................................... (51.4) (57.0) (164.1) (170.8)
Included in operating income ................................. (61.0) (60.0) (173.3) (171.9) Impairment, restructuring and other operating items, net .... (0.5) — (0.9) — Interest expense .................................................................... (24.9) (21.9) (69.8) (61.2) Included in loss before income taxes .................................. € (86.4) € (81.9) € (244.0) € (233.1) Property and equipment additions, net ................................ € 17.5 € 38.9 € 124.3 € 141.6
___________________
(a) Represents amounts charged for technology and other services, which are included in the calculation of the “EBITDA” metric specified by our debt agreements (Covenant EBITDA).
VODAFONEZIGGO GROUP B.V.Notes to Condensed Consolidated Financial Statements — (Continued)
September 30, 2021(unaudited)
20

(b) Represents amounts charged for capital expenditures made by Liberty Global related to assets that we use or will otherwise benefit our company. These charges are not included in the calculation of Covenant EBITDA.
(c) Represents amounts charged by Vodafone for technology and other services, a portion of which are included in the calculation of Covenant EBITDA.
(d) Represents amounts charged for our use of the Vodafone brand name. These charges are not included in the calculation of Covenant EBITDA.
Revenue. Amount represents interconnect fees charged by us to certain subsidiaries of Vodafone.
Programming and other direct costs of services. Amount represents interconnect fees charged to us by certain subsidiaries of Vodafone.
Selling, general and administrative recharges. Amount represents recharges for certain personnel services provided to Vodafone and Liberty Global.
Share-based compensation expense. Amounts relate to charges to our company by Liberty Global and Vodafone for share-based incentive awards held by certain employees of our subsidiaries associated with ordinary shares of Liberty Global and Vodafone. Share-based compensation expense is included within SG&A in our condensed consolidated statements of operations.
Charges for JV Services - Framework and Trade Mark Agreements
Pursuant to a framework and a trade name agreement (collectively, the JV Service Agreements) entered into in connection with the formation of the VodafoneZiggo JV, Liberty Global and Vodafone charge us fees for certain services provided to us by the respective subsidiaries of the Shareholders (collectively, the JV Services). The JV Services are provided to us on a transitional or ongoing basis. Pursuant to the terms of the JV Service Agreements, the ongoing services will be provided for a period of four to six years depending on the type of service, while transitional services will be provided for a period of not less than 12 months after which the Shareholders or VodafoneZiggo will be entitled to terminate based on specified notice periods. The JV Services provided by the respective subsidiaries of the Shareholders consist primarily of (i) technology and other services, (ii) capital-related expenditures for assets that we use or otherwise benefit us and (iii) brand name and procurement fees. The fees that Liberty Global and Vodafone charge us for the JV Services, as set forth in the table above, include both fixed and usage-based fees.
Interest expense. Amount relates to the Liberty Global Notes and the Vodafone Notes, as defined and described below.
Property and equipment additions, net. These amounts, which are cash settled, represent customer premises and network-related equipment acquired from certain Liberty Global and Vodafone subsidiaries, which subsidiaries centrally procure equipment on behalf of our company.
VODAFONEZIGGO GROUP B.V.Notes to Condensed Consolidated Financial Statements — (Continued)
September 30, 2021(unaudited)
21

The following table provides details of our related-party balances:
September 30, December 31,2021 2020
in millionsAssets:
Related-party receivables (a) ................................................................................................... € 44.9 € 33.6
Liabilities:Accounts payable (b) ............................................................................................................... € 22.6 € 103.9 Accrued and other current liabilities (b) .................................................................................. 98.6 17.7 Debt (c):
Liberty Global Note .............................................................................................................. 907.9 803.9 Vodafone Note ...................................................................................................................... 907.9 803.9
Other long-term liabilities (d) .................................................................................................. 0.6 2.5 Total liabilities .................................................................................................................. € 1,937.6 € 1,731.9
_______________
(a) Represents non-interest bearing receivables from certain Liberty Global and Vodafone subsidiaries.
(b) Represents non-interest bearing payables, accrued capital expenditures and other accrued liabilities related to transactions with certain Liberty Global and Vodafone subsidiaries that are cash settled.
(c) Represents debt obligations, as further described below.
(d) Represents operating lease liabilities related to Vodafone.
Related-party Debt
Liberty Global Notes
The Liberty Global Notes comprise (i) a euro-denominated note payable to a subsidiary of Liberty Global with a principal amount of €700.0 million at September 30, 2021 (the Liberty Global Note Payable I) and (ii) a euro-denominated note payable to a subsidiary of Liberty Global entered into during the third quarter of 2020 with a principal amount of €207.9 million at September 30, 2021 (the Liberty Global Note Payable II, and, together with the Liberty Global Note Payable I, the Liberty Global Notes Payable), out of which, €103.9 million was drawn during July 2021, to fund the final installment of spectrum license fees due to the Dutch government. The Liberty Global Note Payable I, as amended in June 2020, and the Liberty Global Note Payable II each bear interest at a fixed rate of 5.55% and have a final maturity date of December 31, 2030. During the nine months ended September 30, 2021, interest accrued on the Liberty Global Notes Payable was €34.9 million, all of which has been cash settled.
Vodafone Notes
The Vodafone Notes comprise (i) a euro-denominated note payable to a subsidiary of Vodafone with a principal amount of €700.0 million at September 30, 2021 (the Vodafone Note Payable I) and (ii) a euro-denominated note payable to a subsidiary of Vodafone entered into during the third quarter of 2020 with a principal amount of €207.9 million at September 30, 2021 (the Vodafone Note Payable II, and, together with the Vodafone Note Payable I, the Vodafone Notes Payable), out of which, €103.9 million was drawn during July 2021, to fund the final installment of spectrum license fees due to the Dutch government.. The Vodafone Note Payable I, as amended in July 2020, and the Vodafone Note Payable II each bear interest at a fixed rate of 5.55% and have a final maturity date of December 31, 2030. During the nine months ended September 30, 2021, interest accrued on the Vodafone Notes Payable was €34.9 million, all of which has been cash settled.
VODAFONEZIGGO GROUP B.V.Notes to Condensed Consolidated Financial Statements — (Continued)
September 30, 2021(unaudited)
22

Other
In accordance with the dividend policy prescribed in the joint venture agreement governing our company (the Shareholders Agreement), VodafoneZiggo made total distributions of €405.0 million during the nine months ended September 30, 2021, to VodafoneZiggo Group Holding who ultimately distributed 50% to each of Liberty Global and Vodafone. The distributions are reflected as a decrease to owner’s equity in our condensed consolidated statement of owner’s equity.
(11) Commitments and Contingencies
Commitments
As further described in note 10, we have commitments related to the JV Service Agreements. Additionally, in the normal course of business, we have entered into agreements that commit our company to make cash payments in future periods with respect to programming contracts, purchases of customer premises and other equipment and services and other items. The following table sets forth these commitments as of September 30, 2021: Payments due during:
Remainder
of 2021 2022 2023 2024 2025 2026 Thereafter Total in millions
Programming commitments ....................... € 42.1 € 125.3 € 115.9 € 86.2 € 42.5 € — € — € 412.0 Purchase commitments .............................. 246.5 86.0 10.7 5.7 4.0 0.7 — 353.6 JV Service Agreements (a) ........................ 40.2 138.4 32.8 30.6 30.4 30.0 60.0 362.4 Network and connectivity commitments ... 4.1 8.7 0.2 — — — — 13.0 Other commitments .................................. 3.5 16.9 10.4 2.1 1.8 1.6 1.8 38.1
Total (b) ................................................. € 336.4 € 375.3 € 170.0 € 124.6 € 78.7 € 32.3 € 61.8 € 1,179.1
___________________
(a) Amounts represent fixed minimum charges from Liberty Global and Vodafone pursuant to the JV Service Agreements. In addition to the fixed minimum charges, the JV Service Agreements provide for certain JV Services to be charged to us based upon usage of the services received. The fixed minimum charges set forth in the table above exclude fees for the usage-based services as these fees will vary from period to period. Accordingly, we expect to incur charges in addition to those set forth in the table above for usage-based services. For additional information regarding fees related to the JV Service Agreements, see note 10.
(b) The commitments included in this table do not reflect any liabilities that are included in our September 30, 2021, condensed consolidated balance sheet.
Programming commitments consist of obligations associated with certain of our programming contracts that are enforceable and legally binding on us as we have agreed to pay minimum fees without regard to (i) the actual number of subscribers to the programming services or (ii) whether we terminate service to a portion of our subscribers or dispose of a portion of our distribution systems. In addition, programming commitments do not include increases in future periods associated with contractual inflation or other price adjustments that are not fixed. Accordingly, the amounts reflected in the above table with respect to these contracts are significantly less than the amounts we expect to pay in these periods under these contracts. Historically, payments to programming vendors have represented a significant portion of our operating costs, and we expect that this will continue to be the case in future periods. In this regard, during the nine months ended September 30, 2021, and 2020, the programming and copyright costs incurred by our operations aggregated €237.1 million and €225.5 million, respectively.
VODAFONEZIGGO GROUP B.V.Notes to Condensed Consolidated Financial Statements — (Continued)
September 30, 2021(unaudited)
23
Purchase commitments include unconditional and legally binding obligations related to the purchase of customer premises equipment, other equipment and mobile handsets.
Network and connectivity commitments include commitments associated with certain operating costs associated with our leased networks.
Other commitments primarily include sponsorships and certain fixed minimum contractual commitments.
In addition to the commitments set forth in the table above, we have commitments under (i) derivative instruments and (ii) multiemployer defined benefit plans, pursuant to which we expect to make payments in future periods. For information regarding our derivative instruments, including the net cash paid or received in connection with these instruments during 2021, see note 4.
Guarantees and Other Credit Enhancements
In the ordinary course of business, we may provide (i) indemnifications to our lenders, our vendors and certain other parties and (ii) performance and/or financial guarantees to local municipalities, our customers and vendors. Historically, these arrangements have not resulted in our company making any material payments and we do not believe that they will result in material payments in the future.
Regulations and Contingencies
ACM Local Loop Unbundling Decision. On February 27, 2018, the ACM published a draft decision in its Local Loop Unbundling market analysis, now referred to as Wholesale Fixed Access (WFA) in which it aims to regulate VodafoneZiggo by imposing an obligation to offer wholesale cable access in addition to continuing existing regulation on KPN. Following a market consultation, the ACM notified the draft decision to the European Commission (EC). On August 31, 2018, the EC responded, making a number of critical comments, but not rejecting the ACM’s proposals (no serious doubts). The ACM then published a final decision on September 28, 2018, which entered into force October 1, 2018. We appealed ACM’s decision and complied with the first obligation on VodafoneZiggo, namely to publish a reference offer before January 1, 2019. Our appeal of ACM’s decision turned out successful and on March 17, 2020, the Court annulled ACM’s decision. The Court’s verdict is final. As a result, VodafoneZiggo is not obligated to offer cable access. Also, KPN is no longer obligated to offer regulated access. KPN has announced it will continue offering access under commercial conditions. During the third quarter of 2020, ACM announced to start a new market analysis of the fixed consumer market. On July 9, 2021, ACM announced to publish a draft decision in the fall of 2021. Before a final decision will be published, there will be a market consultation and notification to the EC. Around the same time, we expect clarity on the possible application of symmetric access regulation. This is a new tool, introduced via the European Electronic Communications Code (EECC) and available to the ACM since December 21, 2020, based on which ACM could, under certain conditions, impose access obligations.
Data Protection. On May 25, 2018, the E.U. General Data Protection Regulation (GDPR), that replaces the European Data Protection Directive, came into force. The GDPR has direct effect in the Netherlands with additional data protection obligations relevant to our operations that include: (i) clear explanation and transparency of personal data usage to customers and employees, and maintaining an internal data processing register, (ii) affirmative consent from users for profiling by automated means, (iii) stronger privacy rights for users and (iv) application of privacy by design/default to data processes.
In June 2018, the European Parliament and the Council reached an overall political agreement on the EECC and BEREC Regulation, with formal adoption finalized in December 2018. This means that member states must have completed transposition into national law by the end of 2020. This deadline has not been met in the Netherlands, except for three topics that have gone through the parliamentary process already. These are switching, symmetrical access and geographical mapping. The transposition of the rest of the EECC is expected by the end of 2021.
On January 10, 2017, a draft ePrivacy Regulation (ePR) was proposed by the EC to replace the ePrivacy Directive. The EU member states, after four years, reached an agreement, on February 10, 2021, on a common position regarding the ePR. The trilogue between EC, EP and member states began in the second quarter of 2021.
Digital Services Act, Digital Markets Act. Amending the current eCommerce Directive, the EC published its proposal on the Digital Services Act (DSA) on December 15, 2020. The DSA aims to set obligations and accountability rules for providers
VODAFONEZIGGO GROUP B.V.Notes to Condensed Consolidated Financial Statements — (Continued)
September 30, 2021(unaudited)
24

of network infrastructure (such as Internet access providers like VodafoneZiggo), hosting service providers, and online platforms for the content provided by their users. Specific obligations would apply to very large online platforms which have at least 45 million monthly active users in the EU. Rules would also apply to non-EU established providers that provide services to EU citizens. The proposal contains full-fledged oversight and enforcement rules with the ability to set fines of up to 6% of the global annual turnover of platforms.
Also on December 15, 2020, the EC published a proposal on the Digital Markets Act (DMA). This act would establish an ex ante framework for digital platforms designated as gatekeepers. These platforms, with “considerable market power”, exert substantial control over access to digital markets. The DMA’s overall objective is to address market failures and unfair conduct by gatekeeper platforms to promote a fair and contestable online platform environment. The DSA and the DMA would complement each other (both have status of regulation) and will be directly applicable in the member states' legal order without the need for transposition. The negotiations on the DSA and DMA are still ongoing in Brussels. The intention for the adoption of both DSA and DMA is expected in the first half of 2022.
Other Regulatory Issues. Video distribution, broadband internet, fixed-line telephony, mobile and content businesses are subject to significant regulation and supervision by various regulatory bodies in the Netherlands, including Dutch and EU authorities. Adverse regulatory developments could subject our businesses to a number of risks. Regulation, including conditions imposed on us by competition or other authorities as a requirement to close acquisitions or dispositions, could limit growth, revenue and the number and types of services offered and could lead to increased operating costs and property and equipment additions. In addition, regulation may restrict our operations and subject them to further competitive pressure, including pricing restrictions, interconnect and other access obligations, and restrictions or controls on content, including content provided by third parties. Failure to comply with current or future regulation could expose our businesses to various penalties.
VAT. Our application of VAT with respect to certain mobile revenue generating activities has been challenged by the Dutchtax authorities in two different court cases. The Dutch tax authorities challenged the multipurpose character of certain mobile subscriptions that we entered into during 2017 and 2018. No amounts have been accrued by our company as the likelihood of loss is not considered to be probable. The total asserted claimed amount is approximately €33.4 million.
The oral hearing of our first court case was held on May 31, 2021. The court’s verdict in this case was in favor of the tax authorities. We have appealed this decision to the higher court and proceedings are pending. We still await a hearing date of our other court case.
In addition to the foregoing item, we have contingent liabilities related to matters arising in the ordinary course of business including (i) legal proceedings, (ii) issues involving VAT and wage, property and other tax issues and (iii) disputes over interconnection, programming, copyright and channel carriage fees. While we generally expect that the amounts required to satisfy these contingencies will not materially differ from any estimated amounts we have accrued, no assurance can be given that the resolution of one or more of these contingencies will not result in a material impact on our results of operations, cash flows or financial position in any given period. Due, in general, to the complexity of the issues involved and, in certain cases, the lack of a clear basis for predicting outcomes, we cannot provide a meaningful range of potential losses or cash outflows that might result from any unfavorable outcomes.
VODAFONEZIGGO GROUP B.V.Notes to Condensed Consolidated Financial Statements — (Continued)
September 30, 2021(unaudited)
25

(12) Segment Reporting
We have one reportable segment that provides video, broadband internet, fixed-line telephony and mobile services to residential and business customers in the Netherlands.
Our revenue by major category is set forth below:
Three months ended Nine months ended September 30, September 30,
2021 2020 2021 2020
in millionsConsumer fixed revenue (a):
Subscription revenue .............................................................. € 521.4 € 521.6 € 1,559.3 € 1,549.3 Non-subscription revenue ...................................................... 5.5 6.2 20.8 14.3 Total consumer fixed revenue .............................................. 526.9 527.8 1,580.1 1,563.6
Consumer mobile revenue (b): Service revenue ...................................................................... 163.7 157.4 480.1 468.0 Non-service revenue ............................................................... 59.5 61.4 178.9 178.3 Total consumer mobile revenue ........................................... 223.2 218.8 659.0 646.3
Total consumer revenue 750.1 746.6 2,239.1 2,209.9 B2B fixed revenue (c):
Subscription revenue .............................................................. 129.2 123.4 385.7 357.0 Non-subscription revenue ...................................................... 3.4 3.8 10.7 12.0 Total B2B fixed revenue ...................................................... 132.6 127.2 396.4 369.0
B2B mobile revenue (d): Service revenue ...................................................................... 92.3 92.2 273.6 286.1 Non-service revenue ............................................................... 32.8 26.8 92.2 81.4 Total B2B mobile revenue ................................................... 125.1 119.0 365.8 367.5
Total B2B revenue .............................................................. 257.7 246.2 762.2 736.5 Other revenue (e) ....................................................................... 15.3 12.0 39.5 29.4
Total .................................................................................... € 1,023.1 € 1,004.8 € 3,040.8 € 2,975.8
___________________
(a) Consumer fixed revenue is classified as either subscription revenue or non-subscription revenue. Consumer fixed subscription revenue includes revenue from subscribers for ongoing broadband internet, video, and voice services offered to residential customers and the amortization of installation fee. Consumer fixed non-subscription revenue includes, among other items, interconnect, channel carriage fees, late fees and revenue from the sale of equipment. Subscription revenue from subscribers who purchase bundled services at a discounted rate is generally allocated proportionally to each service based on the stand-alone price for each individual service. As a result, changes in the stand-alone pricing of our fixed and mobile products or the composition of bundles can contribute to changes in our product revenue categories from period to period.
(b) Consumer mobile revenue is classified as either service revenue or non-service revenue. Consumer mobile service revenue includes revenue from ongoing mobile and data services offered under postpaid and prepaid arrangements to residential customers. Consumer mobile non-service revenue includes, among other items, interconnect revenue, mobile handset and accessories sales, and late fees.
VODAFONEZIGGO GROUP B.V.Notes to Condensed Consolidated Financial Statements — (Continued)
September 30, 2021(unaudited)
26

(c) B2B fixed revenue is classified as either subscription revenue or non-subscription revenue. B2B fixed subscription revenue includes revenue from business broadband internet, video, voice, and data services, offered to small or home office (SOHO) customers and small and medium to large enterprises. B2B fixed non-subscription revenue includes, among other items, revenue from hosting services, installation fees, carriage fees and interconnect.
(d) B2B mobile revenue is classified as either service revenue or non-service revenue. B2B mobile service revenue includes revenue from ongoing mobile and data services offered to SOHO, small and medium to large enterprise customers as well as wholesale customers. B2B mobile non-service revenue includes, among other items, interconnect (including visitor) revenue, mobile handset and accessories sales, and late fees.
(e) Other revenue includes, among other items, programming, advertising and site sharing revenue.
VODAFONEZIGGO GROUP B.V.Notes to Condensed Consolidated Financial Statements — (Continued)
September 30, 2021(unaudited)
27

MANAGEMENT’S DISCUSSION AND ANALYSIS OF FINANCIAL CONDITION AND RESULTS OF OPERATIONS
The following discussion and analysis, which should be read in conjunction with our condensed consolidated financial statements and the discussion and analysis included in our 2020 annual report, is intended to assist in providing an understanding of our results of operations and financial condition and is organized as follows:
• Forward-looking Statements. This section provides a description of certain factors that could cause actual results or events to differ materially from anticipated results or events.
• Overview. This section provides a general description of our business and recent events.
• Material Changes in Results of Operations. This section provides an analysis of our results of operations for the three and nine months ended September 30, 2021 and 2020.
• Material Changes in Financial Condition. This section provides an analysis of our corporate and subsidiary liquidity, condensed consolidated statements of cash flows and contractual commitments.
The capitalized terms used below have been defined in the notes to our condensed consolidated financial statements. In the following text, the terms “we”, “our”, “our company” and “us” may refer, as the context requires, to VodafoneZiggo or collectively to VodafoneZiggo and its subsidiaries.
Unless otherwise indicated, convenience translations into euros are calculated, and operational data (including subscriber statistics) is presented, as of September 30, 2021.
Forward-looking Statements
Certain statements in this quarterly report constitute forward-looking statements. To the extent that statements in this quarterly report are not recitations of historical fact, such statements constitute forward-looking statements, which, by definition, involve risks and uncertainties that could cause actual results to differ materially from those expressed or implied by such statements. In particular, statements under Management’s Discussion and Analysis of Financial Condition and Results of Operations may contain forward-looking statements, including statements regarding our business, product, foreign currency and finance strategies, subscriber growth and retention rates, competitive, regulatory and economic factors, the timing and impacts of proposed transactions, the maturity of our market, the potential impact of COVID-19 on our company, the anticipated impacts of new legislation (or changes to existing rules and regulations), anticipated changes in our revenue, costs or growth rates, our liquidity, credit risks, foreign currency risks, target leverage levels, our future projected contractual commitments and cash flows and other information and statements that are not historical fact. Where, in any forward-looking statement, we express an expectation or belief as to future results or events, such expectation or belief is expressed in good faith and believed to have a reasonable basis, but there can be no assurance that the expectation or belief will result or be achieved or accomplished. In evaluating these statements, you should consider the risks and uncertainties in the following list, and those described herein, as some but not all of the factors that could cause actual results or events to differ materially from anticipated results or events:
• economic and business conditions and industry trends in the Netherlands;
• the competitive environment in the Netherlands for both the fixed and mobile markets, including competitor responses to our products and services for our residential and business customers;
• fluctuations in currency exchange rates and interest rates;
• instability in global financial markets, including sovereign debt issues and related fiscal reforms;
• consumer disposable income and spending levels, including the availability and amount of individual consumer debt;
• changes in consumer television viewing preferences and habits;
• changes in consumer mobile usage behavior;
28

• customer acceptance of our existing service offerings, including our television, broadband internet, fixed-line telephony, mobile and business service offerings, and of new technology, programming alternatives and other products and service offerings in the future;
• the outcome of governmental requests for proposals related to contracts for B2B communication services;
• our ability to manage rapid technological changes;
• our ability to maintain or increase the number of subscriptions to our television, broadband internet, fixed-line telephony and mobile service offerings and our average revenue per household;
• our ability to provide satisfactory customer service, including support for new and evolving products and services;
• our ability to maintain or increase rates to our subscribers or to pass through increased costs to our subscribers;
• the impact of our future financial performance, or market conditions generally, on the availability, terms and deployment of capital;
• changes in, or failure or inability to comply with, applicable laws and/or government regulations in the Netherlands and adverse outcomes from regulatory proceedings, including regulation related to interconnect rates;
• government and/or regulatory intervention that requires opening our broadband distribution network to competitors, and/or other regulatory interventions;
• our ability to obtain regulatory approval and satisfy other conditions necessary to close acquisitions and dispositions and the impact of conditions imposed by competition and other regulatory authorities in connection with acquisitions;
• our ability to successfully acquire new businesses and, if acquired, to integrate, realize anticipated efficiencies from, and implement our business plan with respect to the businesses we have acquired;
• changes in laws or treaties relating to taxation, or the interpretation thereof, in the Netherlands;
• changes in laws and government regulations that may impact the availability and cost of capital and the derivative instruments that hedge certain of our financial risks;
• the ability of suppliers and vendors to timely deliver quality products, equipment, software, services and access;
• the availability of attractive programming for our video services and the costs associated with such programming, including retransmission and copyright fees payable to public and private broadcasters;
• uncertainties inherent in the development and integration of new business lines and business strategies;
• our ability to adequately forecast and plan future network requirements, including the costs and benefits associated with our planned network extensions;
• the availability of capital for the acquisition and/or development of telecommunications networks and services;
• problems we may discover post-closing with the operations, including the internal controls and financial reporting process, of businesses we acquire;
• the leakage of sensitive customer data;
• the outcome of any pending or threatened litigation;
• the loss of key employees and the availability of qualified personnel;
• changes in the nature of key strategic relationships with partners and joint ventures; and
• events that are outside of our control, such as political unrest in international markets, terrorist attacks, malicious human acts, natural disasters, pandemics or epidemics (such as COVID-19) and other similar events.
29

The broadband distribution and mobile service industries are changing rapidly and, therefore, the forward-looking statements of expectations, plans and intent in this quarterly report are subject to a significant degree of risk. These forward-looking statements and the above-described risks, uncertainties and other factors speak only as of the date of this quarterly report, and we expressly disclaim any obligation or undertaking to disseminate any updates or revisions to any forward-looking statement contained herein, to reflect any change in our expectations with regard thereto, or any other change in events, conditions or circumstances on which any such statement is based. Readers are cautioned not to place undue reliance on any forward-looking statement.
Overview
General
VodafoneZiggo is a provider of video, broadband internet, fixed-line telephony and mobile services to residential and business customers in the Netherlands.
Operations
At September 30, 2021, we owned and operated networks that passed 7,320,700 homes and served 9,216,600 revenue generating units (RGUs), consisting of 3,754,700 video subscribers (including 3,223,000 enhanced video subscribers), 3,337,300 broadband internet subscribers and 2,124,600 fixed-line telephony subscribers. In addition, at September 30, 2021, we served 5,327,700 mobile subscribers, which includes 4,940,200 postpaid subscribers.
The following table provides details of our organic RGU and mobile subscriber changes for the periods indicated. Organic RGU and mobile subscriber changes exclude the effect of acquisitions (RGUs and mobile subscribers added on the acquisition date) and other non-organic adjustments, but includes post-acquisition date RGU and mobile subscriber additions or losses.
Three months ended Nine months endedSeptember 30, September 30,
2021 2020 2021 2020Organic RGU additions (losses):
Video:Basic * ............................................................................................ 7,200 400 13,200 9,000 Enhanced * ..................................................................................... (30,100) (18,500) (79,900) (31,400)
Total video ................................................................................... (22,900) (18,100) (66,700) (22,400) Broadband internet ........................................................................... (10,400) (6,700) (26,000) 9,100 Fixed-line telephony ........................................................................ (52,400) (38,800) (148,100) (94,000) Total organic RGU losses .............................................................. (85,700) (63,600) (240,800) (107,300)
Organic mobile subscriber additions (losses):Postpaid net additions ...................................................................... 66,500 75,800 183,100 206,400 Prepaid net losses ............................................................................. (8,800) (25,300) (45,200) (116,500) Total organic mobile subscriber additions ..................................... 57,700 50,500 137,900 89,900
* During the third quarter of 2021, we made changes in our subscriber count methodology associated with certain of our B2B multiple dwelling unit subscribers, which resulted in a non-organic reduction of our Fixed-Line Customer and Basic Video subscriber count of 10,000. Furthermore, we reclassified 23,500 subscribers from Enhanced Video to Basic Video during the third quarter of 2021 on a non-organic basis.
Impact of COVID-19
The global COVID-19 pandemic continues to impact the economy of the Netherlands. However, during the third quarter of 2021, the impact on our company continued to be relatively minimal as demand for our products and services remained strong. It is not currently possible to estimate the duration and severity of the COVID-19 pandemic or the adverse economic impact resulting from the preventative measures taken to contain or mitigate its outbreak, therefore no assurance can be given that an extended period of global economic disruption would not have a material adverse impact on our business, financial condition and results of operations in future periods. For additional information regarding the impact of COVID-19 on our results of operations for the three and nine months ended September 30, 2021, see Material Changes in Results of Operations below.
30

Competition and Other External Factors
The Dutch market for mobile and fixed services is highly competitive and rapidly evolving. Within our mobile operations we continue to experience pressure on pricing, characterized by aggressive promotion campaigns, heavy marketing spend and increasing or unlimited data bundles. Furthermore, there is growing competition from MVNOs that focus on certain niche segments such as no frill, youth or ethnic markets. Within our fixed operations we experience increased competition, mainly as a result of competitors’ emphasis on accelerating the rollout of their fiber footprint. This significant competition, together with the macroeconomic factors, has adversely impacted our revenue, RGU and average monthly subscription revenue per average fixed RGU or mobile subscriber, as applicable (ARPU). For additional information regarding the revenue impact of changes in the RGUs and ARPU, see Results of Operations below.
Material Changes in Results of Operations
This section provides an analysis of our results of operations for the three and nine months ended September 30, 2021 and 2020.
General
Our revenue is earned in the Netherlands and is subject to applicable VAT. Any increases in these taxes could have an adverse impact on our ability to maintain or increase our revenue to the extent that we are unable to pass such tax increases onto our customers.
We pay interconnection fees to other telephony providers when calls or text messages from our subscribers terminate on another network, and we receive similar fees from such providers when calls or text messages from their customers terminate on our network. The amounts we charge and incur with respect to fixed-line telephony and mobile interconnection fees are subject to regulatory oversight. To the extent that regulatory authorities introduce fixed-line or mobile termination rate changes, we would experience prospective changes in our interconnect revenue and costs. The ultimate impact of any such changes in termination rates on our interconnect revenue and costs would be dependent on the call or text messaging patterns that are subject to the changed termination rates.
We are subject to inflationary pressures with respect to certain costs and foreign currency exchange risk. Any cost increases that we are not able to pass on to our subscribers through rate increases would result in increased pressure on our operating margins.
Adjusted EBITDA
Adjusted EBITDA, which is a non-GAAP measure, is the primary measure used by our management to evaluate the operating performance of our businesses. It is also a key factor that is used by our management and our Supervisory Board to evaluate the effectiveness of our management for purposes of annual and other incentive compensation plans. As we use the term, “Adjusted EBITDA” is defined as operating income before depreciation and amortization, share-based compensation, provisions, and provision releases related to significant litigation and impairment, restructuring and other operating items. Other operating items include (i) gains and losses on the disposition of long-lived assets, (ii) third-party costs directly associated with successful and unsuccessful acquisitions and dispositions, including legal, advisory and due diligence fees, as applicable, and (iii) other acquisition-related items, such as gains and losses on the settlement of contingent consideration. Investors should view Adjusted EBITDA as a supplement to, and not a substitute for, GAAP measures of performance included in our condensed consolidated statements of operations.
Revenue
We earn revenue from (i) subscribers to our consumer broadband communications and mobile services and (ii) B2B services, interconnect fees, channel carriage fees, installation fees and late fees. Consistent with the presentation of our revenue categories in note 12 to our condensed consolidated financial statements, we use the term “subscription revenue” and “service revenue” in the following discussion to refer to amounts received from subscribers for ongoing services. In the below tables, mobile service revenue excludes the related interconnect revenue.
Variances in the subscription and/or service revenue from our customers are a function of (i) changes in the number of RGUs or mobile subscribers outstanding during the period and (ii) changes in ARPU. Changes in ARPU can be attributable to
31
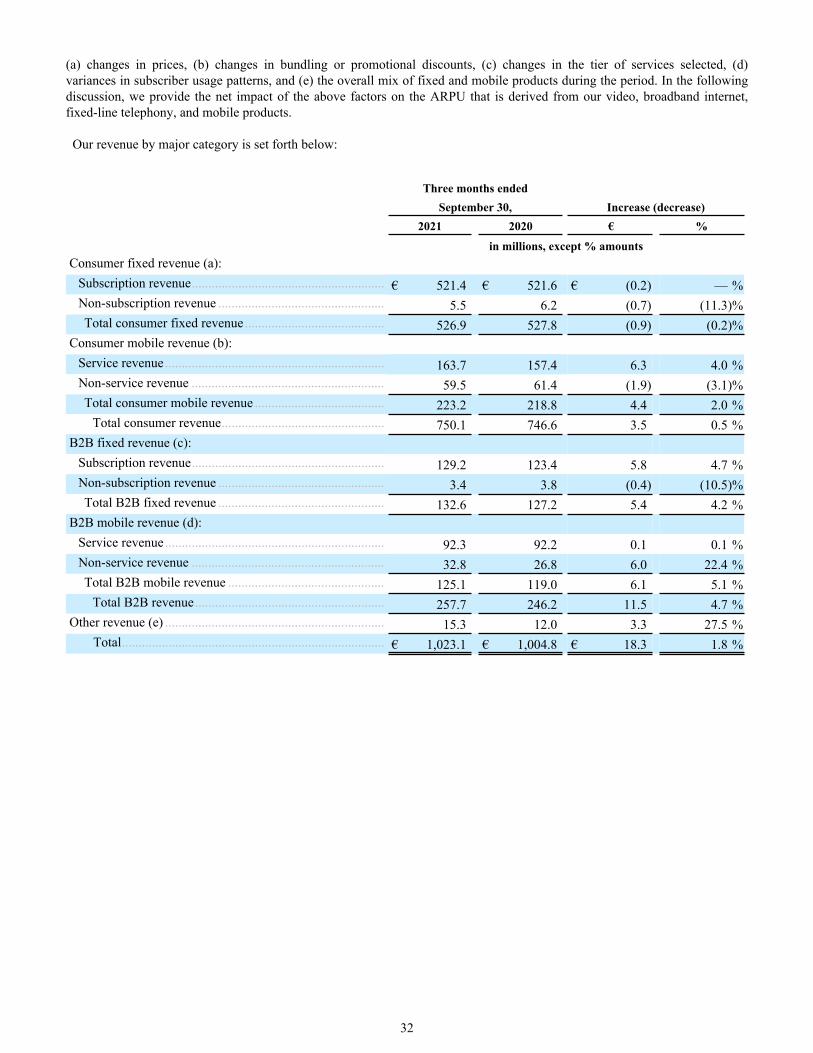
(a) changes in prices, (b) changes in bundling or promotional discounts, (c) changes in the tier of services selected, (d) variances in subscriber usage patterns, and (e) the overall mix of fixed and mobile products during the period. In the following discussion, we provide the net impact of the above factors on the ARPU that is derived from our video, broadband internet, fixed-line telephony, and mobile products.
Our revenue by major category is set forth below:
Three months ended September 30, Increase (decrease)
2021 2020 € %
in millions, except % amountsConsumer fixed revenue (a):
Subscription revenue .......................................................... € 521.4 € 521.6 € (0.2) — %Non-subscription revenue .................................................. 5.5 6.2 (0.7) (11.3) %Total consumer fixed revenue .......................................... 526.9 527.8 (0.9) (0.2) %
Consumer mobile revenue (b):Service revenue .................................................................. 163.7 157.4 6.3 4.0 %Non-service revenue .......................................................... 59.5 61.4 (1.9) (3.1) %Total consumer mobile revenue ....................................... 223.2 218.8 4.4 2.0 %
Total consumer revenue ................................................. 750.1 746.6 3.5 0.5 %B2B fixed revenue (c):
Subscription revenue .......................................................... 129.2 123.4 5.8 4.7 %Non-subscription revenue .................................................. 3.4 3.8 (0.4) (10.5) %Total B2B fixed revenue .................................................. 132.6 127.2 5.4 4.2 %
B2B mobile revenue (d):Service revenue .................................................................. 92.3 92.2 0.1 0.1 %Non-service revenue .......................................................... 32.8 26.8 6.0 22.4 %Total B2B mobile revenue ............................................... 125.1 119.0 6.1 5.1 %
Total B2B revenue ......................................................... 257.7 246.2 11.5 4.7 %Other revenue (e) .................................................................. 15.3 12.0 3.3 27.5 %
Total ............................................................................... € 1,023.1 € 1,004.8 € 18.3 1.8 %
32
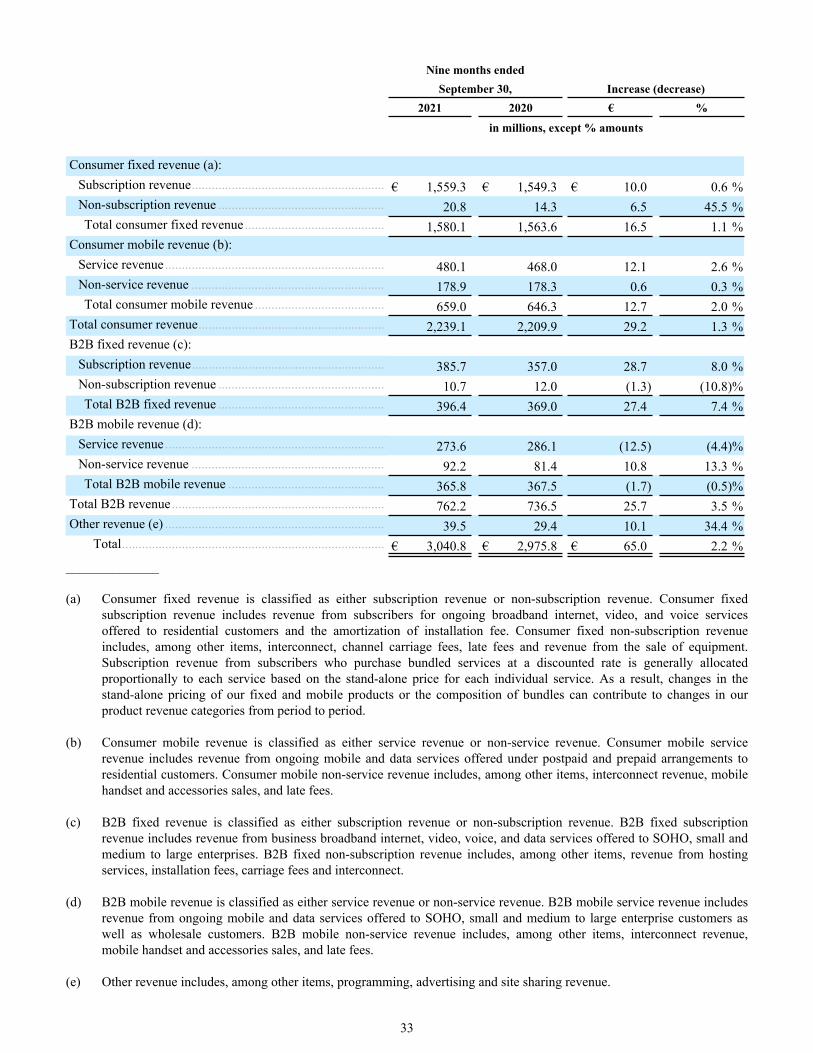
Nine months ended September 30, Increase (decrease)
2021 2020 € %
in millions, except % amounts
Consumer fixed revenue (a):Subscription revenue .......................................................... € 1,559.3 € 1,549.3 € 10.0 0.6 %Non-subscription revenue .................................................. 20.8 14.3 6.5 45.5 %Total consumer fixed revenue .......................................... 1,580.1 1,563.6 16.5 1.1 %
Consumer mobile revenue (b):Service revenue .................................................................. 480.1 468.0 12.1 2.6 %Non-service revenue .......................................................... 178.9 178.3 0.6 0.3 %Total consumer mobile revenue ....................................... 659.0 646.3 12.7 2.0 %
Total consumer revenue ........................................................ 2,239.1 2,209.9 29.2 1.3 %B2B fixed revenue (c):
Subscription revenue .......................................................... 385.7 357.0 28.7 8.0 %Non-subscription revenue .................................................. 10.7 12.0 (1.3) (10.8) %Total B2B fixed revenue .................................................. 396.4 369.0 27.4 7.4 %
B2B mobile revenue (d):Service revenue .................................................................. 273.6 286.1 (12.5) (4.4) %Non-service revenue .......................................................... 92.2 81.4 10.8 13.3 %Total B2B mobile revenue ............................................... 365.8 367.5 (1.7) (0.5) %
Total B2B revenue ................................................................ 762.2 736.5 25.7 3.5 %Other revenue (e) .................................................................. 39.5 29.4 10.1 34.4 %
Total ............................................................................... € 3,040.8 € 2,975.8 € 65.0 2.2 %______________
(a) Consumer fixed revenue is classified as either subscription revenue or non-subscription revenue. Consumer fixed subscription revenue includes revenue from subscribers for ongoing broadband internet, video, and voice services offered to residential customers and the amortization of installation fee. Consumer fixed non-subscription revenue includes, among other items, interconnect, channel carriage fees, late fees and revenue from the sale of equipment. Subscription revenue from subscribers who purchase bundled services at a discounted rate is generally allocated proportionally to each service based on the stand-alone price for each individual service. As a result, changes in the stand-alone pricing of our fixed and mobile products or the composition of bundles can contribute to changes in our product revenue categories from period to period.
(b) Consumer mobile revenue is classified as either service revenue or non-service revenue. Consumer mobile service revenue includes revenue from ongoing mobile and data services offered under postpaid and prepaid arrangements to residential customers. Consumer mobile non-service revenue includes, among other items, interconnect revenue, mobile handset and accessories sales, and late fees.
(c) B2B fixed revenue is classified as either subscription revenue or non-subscription revenue. B2B fixed subscription revenue includes revenue from business broadband internet, video, voice, and data services offered to SOHO, small and medium to large enterprises. B2B fixed non-subscription revenue includes, among other items, revenue from hosting services, installation fees, carriage fees and interconnect.
(d) B2B mobile revenue is classified as either service revenue or non-service revenue. B2B mobile service revenue includes revenue from ongoing mobile and data services offered to SOHO, small and medium to large enterprise customers as well as wholesale customers. B2B mobile non-service revenue includes, among other items, interconnect revenue, mobile handset and accessories sales, and late fees.
(e) Other revenue includes, among other items, programming, advertising and site sharing revenue.
33
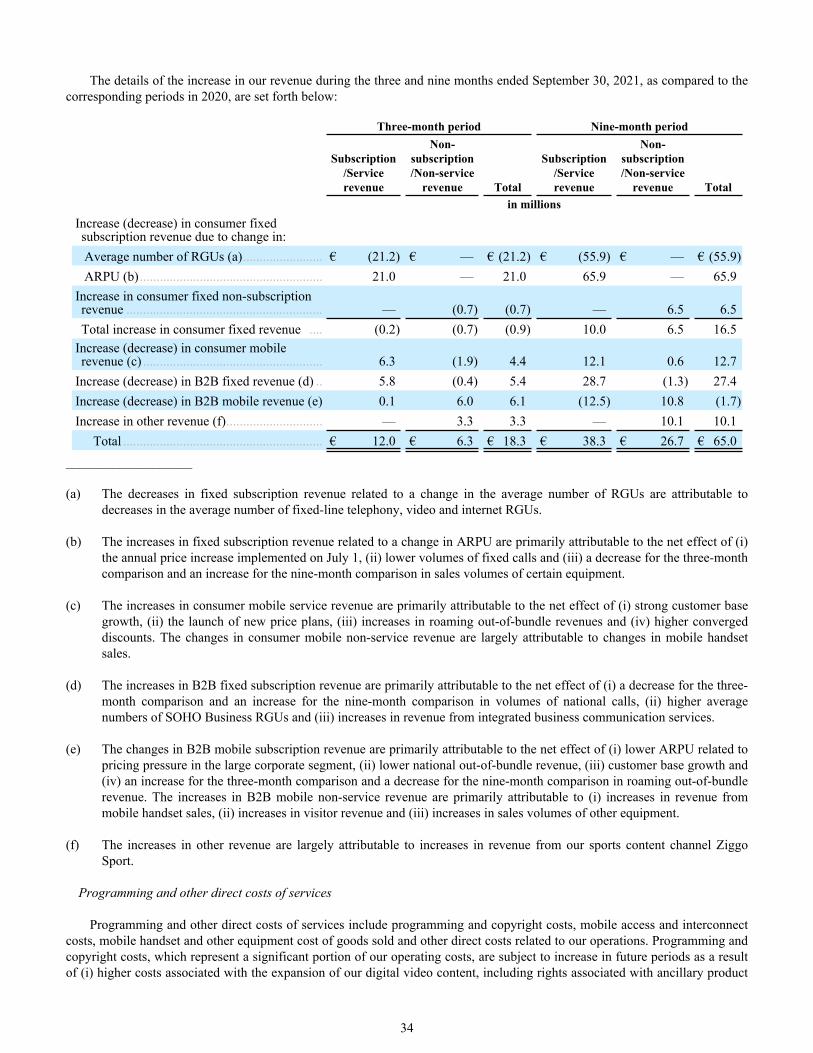
The details of the increase in our revenue during the three and nine months ended September 30, 2021, as compared to the corresponding periods in 2020, are set forth below:
Three-month period Nine-month period
Subscription/Service revenue
Non-subscription/Non-service
revenue Total
Subscription/Service revenue
Non-subscription/Non-service
revenue Totalin millions
Increase (decrease) in consumer fixed subscription revenue due to change in:Average number of RGUs (a) ........................ € (21.2) € — € (21.2) € (55.9) € — € (55.9) ARPU (b) ....................................................... 21.0 — 21.0 65.9 — 65.9
Increase in consumer fixed non-subscription revenue ........................................................... — (0.7) (0.7) — 6.5 6.5 Total increase in consumer fixed revenue .... (0.2) (0.7) (0.9) 10.0 6.5 16.5
Increase (decrease) in consumer mobile revenue (c) ...................................................... 6.3 (1.9) 4.4 12.1 0.6 12.7
Increase (decrease) in B2B fixed revenue (d) .. 5.8 (0.4) 5.4 28.7 (1.3) 27.4 Increase (decrease) in B2B mobile revenue (e) 0.1 6.0 6.1 (12.5) 10.8 (1.7) Increase in other revenue (f) ............................. — 3.3 3.3 — 10.1 10.1
Total ............................................................ € 12.0 € 6.3 € 18.3 € 38.3 € 26.7 € 65.0 ___________________
(a) The decreases in fixed subscription revenue related to a change in the average number of RGUs are attributable to decreases in the average number of fixed-line telephony, video and internet RGUs.
(b) The increases in fixed subscription revenue related to a change in ARPU are primarily attributable to the net effect of (i) the annual price increase implemented on July 1, (ii) lower volumes of fixed calls and (iii) a decrease for the three-month comparison and an increase for the nine-month comparison in sales volumes of certain equipment.
(c) The increases in consumer mobile service revenue are primarily attributable to the net effect of (i) strong customer base growth, (ii) the launch of new price plans, (iii) increases in roaming out-of-bundle revenues and (iv) higher converged discounts. The changes in consumer mobile non-service revenue are largely attributable to changes in mobile handset sales.
(d) The increases in B2B fixed subscription revenue are primarily attributable to the net effect of (i) a decrease for the three-month comparison and an increase for the nine-month comparison in volumes of national calls, (ii) higher average numbers of SOHO Business RGUs and (iii) increases in revenue from integrated business communication services.
(e) The changes in B2B mobile subscription revenue are primarily attributable to the net effect of (i) lower ARPU related to pricing pressure in the large corporate segment, (ii) lower national out-of-bundle revenue, (iii) customer base growth and (iv) an increase for the three-month comparison and a decrease for the nine-month comparison in roaming out-of-bundle revenue. The increases in B2B mobile non-service revenue are primarily attributable to (i) increases in revenue from mobile handset sales, (ii) increases in visitor revenue and (iii) increases in sales volumes of other equipment.
(f) The increases in other revenue are largely attributable to increases in revenue from our sports content channel Ziggo Sport.
Programming and other direct costs of services
Programming and other direct costs of services include programming and copyright costs, mobile access and interconnect costs, mobile handset and other equipment cost of goods sold and other direct costs related to our operations. Programming and copyright costs, which represent a significant portion of our operating costs, are subject to increase in future periods as a result of (i) higher costs associated with the expansion of our digital video content, including rights associated with ancillary product
34
offerings and rights that provide for the broadcast of live sporting events, and (ii) rate increases. In addition we are subject to inflationary pressures with respect to our labor and other costs. Any cost increases that we are not able to pass on to our subscribers through rate increases would result in increased pressure on our operating margins.
Our programming and other direct costs of service increased by €1.9 million or 0.9% and €34.5 million or 5.7% during the three and nine months ended September 30, 2021, respectively, as compared to the corresponding periods in 2020. These increases include the following factors:
• Increases in equipment costs of €2.9 million or 3.5% and €20.1 million or 8.3%, respectively, primarily attributable to the net effect of (i) higher average costs per mobile handset sold and (ii) a decrease for the three-month comparison and an increase for the nine-month comparison in sales volumes of mobile handsets and other equipment;
• An increase (decrease) in programming costs of (€1.4 million) or (1.8%) and €11.6 million or 5.2%, respectively, primarily attributable to the net effect of (i) a decrease for the three-month comparison and an increase for the nine-month comparison in content costs following contract renewals, (ii) higher production and rights costs resulting from the impact of temporary broadcasting suspensions of certain sporting events during 2020 following the COVID-19 pandemic and (iii) decreases in costs of video on demand services due to lower volumes; and
• Increases in interconnect costs of €0.4 million or 0.8% and €2.9 million or 2.1%, respectively, primarily attributable to the net effect of (i) increases in costs due to higher volumes of national calls, (ii) decreases in leased line costs, (iii) increases in mobile roaming costs and (iv) for the nine-month comparison, an increase in costs as a result of a network usage settlement that was recorded during the second quarter of 2020.
Other operating expenses
Other operating expenses include network operations, customer operations, customer care and other costs related to our operations.
Our other operating expenses increased by €1.3 million or 1.2% and €3.3 million or 0.9% during the three and nine months ended September 30, 2021, respectively, as compared to the corresponding periods in 2020. These increases include the following factors:
• Increases in access costs of €0.9 million or 21.5% and €4.9 million or 41.4%, respectively, primarily due to higher maintenance costs;
• Increases in customer service costs of €0.9 million or 5.1% and €4.0 million or 7.2%, respectively, mainly due to more inbound traffic; and
• Decreases in bad debt expense of €1.6 million and €7.1 million, respectively.
SG&A expenses
SG&A expenses include human resources, information technology, general services, management, finance, legal, external sales and marketing costs, share-based compensation and other general expenses.
Our SG&A expenses increased by €9.1 million or 6.3% and €19.6 million or 4.5% during the three and nine months ended September 30, 2021, respectively, as compared to the corresponding periods in 2020. Our SG&A expenses include share-based compensation expense, which remained stable and increased by €0.2 million during the three and nine months ended September
35

30, 2021, respectively. Excluding the effects of share-based compensation expense, our SG&A expenses increased by €9.1 million or 6.3% and €19.4 million or 3.7%, respectively. These increases include the following factors:
• Increases in sales and marketing costs of €2.6 million or 5.1% and €6.1 million or 4.2%, respectively, primarily driven by higher expenditures on marketing campaigns;
• Increases in core network and IT costs of €2.4 million or 27.4% and €6.0 million or 25.0%, respectively, primarily driven by increases in IT maintenance cost;
• Increases in personnel costs costs of €4.2 million or 7.5% and €4.9 million or 2.7%, respectively, primarily due to higher incentive compensation costs and increases in staffing levels; and
• Increases in business services costs of €0.6 million or 3.8% and €3.5 million or 7.6%, respectively, primarily due to the net effect of (i) higher consultancy costs and (ii) decreases in facility costs.
Charges for JV Services
We recorded charges for JV Services of €51.4 million and €164.1 million during the three and nine months ended September 30, 2021, respectively, as compared to €57.0 million and €170.8 million during the three and nine months ended September 30, 2020, respectively. For additional information regarding charges for JV Services, see note 10 to our condensed consolidated financial statements.
Depreciation and amortization expense
Our depreciation and amortization expenses increased (decreased) by €14.1 million or 3.6% and (€12.8 million) or (1.1%) during the three and nine months ended September 30, 2021, respectively, as compared to the corresponding periods in 2020. These changes are primarily attributable to the impact of accelerated depreciation associated with (i) certain mobile network assets during the second quarter of 2020 and the third quarter of 2021 and (ii) the closure of certain office locations during the third quarter of 2021.
Impairment, restructuring and other operating items, net
We recognized impairment, restructuring and other operating items, net, of €11.8 million and €27.1 million during the three and nine months ended September 30, 2021, respectively, including (i) restructuring charges of €10.6 million and €24.3 million, respectively, (ii) acquisition and disposition costs of €1.3 million and €3.3 million, respectively, (iii) gains from the disposition of assets of €0.3 million and €1.1 million, respectively, and (iv) impairment charges related to tangible assets of €0.2 million and €0.6 million, respectively.
We recognized credits associated with impairment, restructuring and other operating items, net, of €21.9 million and €18.6million during the three and nine months ended September 30, 2020, respectively, including (i) contract exit and termination credits of €22.2 million and €22.7 million, respectively, primarily due to the release of an accrual, (ii) restructuring charges of €1.1 million and €4.2 million, respectively, (iii) gains from the disposition of assets of €1.0 million and €2.3 million, respectively, and (iv) impairment charges related to tangible assets of €0.2 million and €2.2 million, respectively.
Interest expense–third-party
Our third-party interest expense decreased by €2.7 million or 2.5% and €23.3 million or 7.0% during the three and nine months ended September 30, 2021, respectively, as compared to the corresponding periods in 2020, primarily due to lower weighted average interest rates.
For additional information regarding our third-party debt, see note 7 to our condensed consolidated financial statements.
It is possible that the interest rates on (i) any new borrowings could be higher than the current interest rates on our existing indebtedness and (ii) our variable-rate indebtedness could increase in future periods. As further discussed in note 4 to our condensed consolidated financial statements, we use derivative instruments to manage our interest rate risks.
In July 2017, the U.K. Financial Conduct Authority (the authority that regulates LIBOR) announced that it intends to stop compelling banks to submit rates for the calculation of LIBOR after 2021. Additionally, the European Money Markets Institute
36

(the authority that administers EURIBOR) has announced that measures will need to be undertaken by the end of 2021 to reform EURIBOR to ensure compliance with E.U. Benchmarks Regulation. In November 2020, ICE Benchmark administration (the entity that administers LIBOR) announced its intention to continue publishing USD LIBOR rates until June 30, 2023, with the exception of the one-week and two-month rates which, along with all GBP LIBOR rates, it intends to cease publishing after December 31, 2021. While this extension allows additional runway on existing contracts using USD LIBOR rates, companies are still encouraged to transition away from using USD LIBOR as soon as practicable and should not enter into new contracts that use USD LIBOR after 2021. The methodology for EURIBOR has been reformed and EURIBOR has been granted regulatory approval to continue to be used. Currently, it is not possible to predict the exact transitional arrangements for calculating applicable reference rates that may be made in the U.K., the U.S., the Eurozone or elsewhere given that a number of outcomes are possible, including the cessation of the publication of one or more reference rates.
Interest expense–related-party
Our related-party interest expense increased by €3.0 million or 13.7% and €8.6 million and 14.1% during the three and nine months ended September 30, 2021, respectively, as compared to the corresponding periods in 2020. These increases are primarily due to a higher average outstanding loan balances. For additional information regarding our related-party debt, see note 10 to our condensed consolidated financial statements.
Realized and unrealized gains (losses) on derivative instruments, net
Our realized and unrealized gains or losses on derivative instruments include (i) unrealized changes in the fair values of our derivative instruments that are non-cash in nature until such time as the derivative contracts are fully or partially settled and (ii) realized gains upon the full or partial settlement of the derivative contracts.
The details of our realized and unrealized gains (losses) on derivative instruments, net, are as follows:
Three months ended Nine months ended September 30, September 30, 2021 2020 2021 2020
in millionsCross-currency and interest rate derivative contracts (a) ......... € 156.8 € (230.4) € 391.9 € (105.3) Foreign currency forward contracts ......................................... 0.3 (0.7) 0.5 (0.8)
Total ...................................................................................... € 157.1 € (231.1) € 392.4 € (106.1) ___________________
(a) The gains for the 2021 periods are primarily attributable to (i) net gains associated with changes in the relative value of euro to the U.S. dollar and (ii) net gains associated with changes in certain market interest rates. The losses for the 2020 periods are primarily attributable to (a) net losses associated with changes in certain market interest rates and (ii) net losses associated with changes in the relative value of euro to the U.S. dollar. In addition, the results include a net gain (loss) of (€19.8 million) and €36.8 million during the three months ended September 30, 2021 and 2020, respectively, and a net gain (loss) of (€50.0 million) and €59.0 million during the nine months ended September 30, 2021 and 2020, respectively resulting from changes in credit risk valuation adjustment.
For additional information regarding our derivative instruments, see notes 4 and 5 to our condensed consolidated financial statements.
37

Foreign currency transaction gains (losses), net
Our foreign currency transaction gains or losses primarily result from the remeasurement of monetary assets and liabilities that are denominated in currencies other than our functional currency. Unrealized foreign currency transaction gains or losses are computed based on period-end exchange rates and are non-cash in nature until such time as the amounts are settled. The details of our foreign currency transaction gains (losses), net, are as follows:
Three months ended Nine months ended
September 30, September 30,
2021 2020 2021 2020
in millions
U.S. dollar-denominated debt ................................................. € (127.6) € 223.6 € (291.2) € 231.7 Other ........................................................................................ (0.3) 0.3 (0.5) 3.0
Total ...................................................................................... € (127.9) € 223.9 € (291.7) € 234.7
Losses on debt extinguishment, net
We recognized a net loss on debt extinguishment of nil and €7.6 million during the three and nine months ended September 30, 2021, respectively, attributable to (i) the payment of €5.0 million of redemption premiums and (ii) the write-off of €2.6 million of fair value adjustments and unamortized deferred financing costs.
We recognized a net loss on debt extinguishment of nil and €29.6 million during the three and nine months ended September 30, 2020, respectively, attributable to (i) the payment of €40.7 million of redemption premiums and (ii) a gain associated with the write off of €11.1 million of net unamortized deferred financing costs, discounts and premiums.
For additional information concerning our losses on debt extinguishment, net, see note 7 to our condensed consolidated financial statements.
Income tax benefit (expense)
We recognized an income tax benefit of €6.9 million and €6.3 million during the three months ended September 30, 2021, and 2020, respectively, and income tax benefit (expense) of €14.7 million and (€47.0 million) during the nine months ended September 30, 2021 and 2020, respectively.
The income tax benefit recognized during the three months ended September 30, 2021 and 2020, differs from the expected income tax benefit of €7.0 million for each of the periods, and the income tax benefit recognized during the nine months ended September 30, 2021 and 2020, differs from the expected income tax benefit of €15.5 million and €13.0 million, respectively (based on the Dutch income tax rate of 25.0%). The differences during the 2021 periods are primarily attributable to non-deductible expenses. The differences during the 2020 periods are primarily attributable to a change in estimate relating to the deductibility of depreciation of certain intangible assets included in our prior year tax returns as well as future deductibility of those assets.
For additional information regarding our income taxes, see note 9 to our condensed consolidated financial statements.
Net loss
During the three months ended September 30, 2021 and 2020, we reported net losses of €20.9 million and €21.2 million, respectively, including (i) operating income of €71.5 million and €107.7 million, respectively, (ii) net non-operating expense of €99.3 million and €135.2 million, respectively, and (iii) income tax benefit of €6.9 million and €6.3 million, respectively.
During the nine months ended September 30, 2021 and 2020, we reported net losses of €47.1 million and €98.9 million, respectively, including (i) operating income of €226.4 million and €245.0 million, respectively, (ii) net non-operating expense of €288.2 million and €296.9 million, respectively, and (iii) income tax benefit (expense) of €14.7 million and (€47.0 million), respectively.
38

Gains or losses associated with (i) changes in the fair values of derivative instruments, (ii) movements in foreign currency exchange rates and (iii) the disposition of assets are subject to a high degree of volatility and, as such, any gains from these sources do not represent a reliable source of income. In the absence of significant gains in the future from these sources or from other non-operating items, our ability to achieve earnings from operations is largely dependent on our ability to increase our Adjusted EBITDA to a level that more than offsets the aggregate amount of our (a) depreciation and amortization, (b) impairment, restructuring and other operating items, net, (c) interest expense, (d) other income and (e) income tax benefits and/or expenses.
Subject to the limitations included in our various debt instruments, we expect to maintain our debt at current levels relative to our Covenant EBITDA. As a result, we expect that we will continue to report significant levels of interest expense for the foreseeable future. For information concerning our expectations with respect to trends that may affect our operating results in future periods, see the discussion under Overview above.
Material Changes in Financial Condition
Sources and Uses of Cash
As a holding company, VodafoneZiggo’s primary assets are its investments in consolidated subsidiaries. As further described in note 7 to our condensed consolidated financial statements, the terms of the instruments governing the indebtedness of certain of these subsidiaries may restrict our ability to access the assets of these subsidiaries. The ability to access the liquidity of our subsidiaries may also be limited by tax and legal considerations and other factors. At September 30, 2021, most of our €174.7 million of consolidated cash was held by our subsidiaries.
Liquidity of VodafoneZiggo
Our sources of liquidity at the parent level include, subject to the restrictions noted above, proceeds in the form of distributions or loans from our subsidiaries. It is the intention of the Shareholders of the VodafoneZiggo JV, that VodafoneZiggo will be a self-funding company capable of financing its activities on a stand-alone basis without recourse to either Shareholder. No assurance can be given that funding from our subsidiaries or external sources would be available on favorable terms, or at all.
VodafoneZiggo’s corporate liquidity requirements include corporate general and administrative expenses and fees associated with the JV Service Agreements. From time to time, VodafoneZiggo may also require cash in connection with (i) the repayment of its related-party debt and interest, (ii) the funding of dividends or distributions pursuant to the Shareholders Agreement, which requires VodafoneZiggo to distribute all unrestricted cash (as defined in the Shareholders Agreement) to the Shareholders every two months (subject to VodafoneZiggo maintaining a minimum amount of cash and complying with the terms of its financing arrangements), (iii) the satisfaction of contingent liabilities, (iv) acquisitions and other investment opportunities or (v) income tax payments.
Liquidity of our Subsidiaries
In addition to cash, the primary sources of liquidity of our operating subsidiaries are cash provided by operations and, in the case of Ziggo B.V. and certain of its subsidiaries, any borrowing availability under the Revolving Facilities.
The liquidity of our operating subsidiaries generally is used to fund property and equipment additions, debt service
requirements and other liquidity requirements that may arise from time to time. For additional information regarding our condensed consolidated cash flows, see the discussion under Condensed Consolidated Statements of Cash Flows below. Our subsidiaries may also require funding in connection with (i) the repayment of amounts due under the third-party and related-party debt instruments of our subsidiaries, (ii) acquisitions and other investment opportunities, including the acquisition of spectrum licenses, (iii) distributions or loans to VodafoneZiggo (and ultimately to the Shareholders of the VodafoneZiggo JV) or (iv) the satisfaction of contingencies. No assurance can be given that any external funding would be available to our subsidiaries on favorable terms, or at all.
Capitalization
At September 30, 2021, the outstanding principal amount of our third-party debt and finance lease obligations aggregated €10.9 billion, including €1.0 billion that is classified as current in our condensed consolidated balance sheet and €9.7 billion
39

that is not due until 2027 or thereafter. For additional information regarding our debt and finance lease maturities, see notes 7 and 8, respectively, to our condensed consolidated financial statements.
As further discussed in note 4 to our condensed consolidated financial statements, we use derivative instruments to mitigate foreign currency and interest rate risk associated with our debt instruments.
Our ability to service or refinance our debt and to maintain compliance with the leverage covenants in our credit agreements and indentures is dependent primarily on our ability to maintain or increase our Covenant EBITDA and to achieve adequate returns on our property and equipment additions and acquisitions. Pursuant to the Shareholders Agreement, we expect to maintain a leverage ratio between 4.5 and 5.0 times Covenant EBITDA. In addition, our ability to obtain additional debt financing is limited by the leverage covenants contained in the various debt instruments of our subsidiaries. In this regard, if our Covenant EBITDA were to decline, we could be required to repay or limit our borrowings under the Credit Facility in order to maintain compliance with applicable covenants. No assurance can be given that we would have sufficient sources of liquidity, or that any external funding would be available on favorable terms, or at all, to fund any such required repayment. We do not anticipate any instances of non-compliance with respect to any of our subsidiaries’ debt covenants that would have a material adverse impact on our liquidity during the next 12 months.
Notwithstanding our negative working capital position at September 30, 2021, we believe that we have sufficient resources to repay or refinance the current portion of our debt and finance lease obligations and to fund our foreseeable liquidity requirements during the next 12 months. However, as our maturing debt grows in later years, we anticipate that we will seek to refinance or otherwise extend our debt maturities. No assurance can be given that we will be able to complete these refinancing transactions or otherwise extend our debt maturities. In this regard, it is not possible to predict how political and economic conditions (including with respect to the COVID-19 pandemic), sovereign debt concerns or any adverse regulatory developments could impact the credit markets we access and, accordingly, our future liquidity and financial position. Our ability to access debt financing at favorable terms, or at all, could be adversely impacted by (i) the financial failure of any of our counterparties, which could (a) reduce amounts available under committed credit facilities and (b) adversely impact our ability to access cash deposited with any failed financial institution and (ii) tightening of the credit markets. In addition, sustained or increased competition, particularly in combination with adverse economic or regulatory developments, could have an unfavorable impact on our cash flows and liquidity.
All of our third-party debt and finance lease obligations at September 30, 2021, have been borrowed or incurred by our subsidiaries.
For additional information regarding our debt and finance lease obligations, see notes 7 and 8, respectively, to our condensed consolidated financial statements.
Condensed Consolidated Statements of Cash Flows
Our condensed consolidated statements of cash flows for the nine months ended September 30, 2021 and 2020 are summarized as follows:
Nine months endedSeptember 30,
2021 2020 Changein millions
Net cash provided by operating activities ................................................................. € 1,035.0 € 963.9 € 71.1 Net cash used by investing activities ......................................................................... (439.7) (449.4) 9.7 Net cash used by financing activities ........................................................................ (720.7) (540.5) (180.2) Effect of exchange rate changes on cash and cash equivalents and restricted cash .. 0.2 2.5 (2.3)
Net decrease in cash and cash equivalents and restricted cash .............................. € (125.2) € (23.5) € (101.7)
Operating Activities. The increase in net cash provided by our operating activities is primarily attributable to an increase in the cash provided by our Adjusted EBITDA and related working capital changes. Adjusted EBITDA is a non-GAAP measure, which investors should view as a supplement to, and not a substitute for, GAAP measures of performance included in our condensed consolidated statements of operations.
40

Investing Activities. The decrease in net cash used by our investing activities is primarily attributable to the net effect of (i) lower property and equipment additions and (ii) a decrease in current liabilities related to capital expenditures.
The capital expenditures that we report in our condensed consolidated statements of cash flows do not include amounts that our company has financed under vendor financing or finance lease arrangements. Instead, these expenditures are reflected as non-cash additions to our property and equipment when the underlying assets are delivered, and as repayments of debt when the principal is repaid. In this discussion, we refer to (i) our capital expenditures as reported in our condensed consolidated statements of cash flows, which exclude amounts financed under vendor financing or finance lease arrangements, and (ii) our total property and equipment additions, which include our capital expenditures on an accrual basis and amounts financed under capital-related vendor financing or finance lease arrangements. For further details regarding our property and equipment additions and our debt, see notes 6 and 7, respectively, to our condensed consolidated financial statements. Spectrum license additions include capital expenditures for spectrum licenses on an accrual basis.
A reconciliation of our property and equipment additions to our capital expenditures as reported in our condensed consolidated statements of cash flows is set forth below:
Nine months endedSeptember 30,
2021 2020in millions
Property and equipment additions .............................................................................................. € 589.3 € 610.2 Assets acquired under capital-related vendor financing arrangements ...................................... (364.1) (372.8) Assets acquired under related-party finance leases .................................................................... (5.2) (11.2) Changes in current liabilities related to capital expenditures ..................................................... 12.0 17.4
Capital expenditures ................................................................................................................. € 232.0 € 243.6
The decrease in our property and equipment additions is primarily attributable to a decrease in our baseline, product and enablers, capacity and new build expenditure related to expansion of our fixed-line network, partially offset by an increase in customer premises equipment expenditure.
We paid €207.9 million in each of 2021 and 2020 related to the acquisition and renewal of spectrum licenses during the multi-band spectrum auction in July 2020. As of September 30, 2021, the full amount has been paid.
Financing Activities. The increase in net cash used by our financing activities is primarily due to an increase in distributions to shareholders as discussed in note 10 to our condensed consolidated financial statements.
41

Contractual Commitments
The following table sets forth the euro equivalents of our commitments as of September 30, 2021:
Payments due during:
TotalRemainder
of 2021 2022 2023 2024 2025 2026 Thereafter in millionsDebt (excluding interest):
Third-party .................................. € 357.8 € 841.3 € — € — € — € — € 9,668.7 € 10,867.8 Related-party .............................. — — — — — — 1,815.8 1,815.8
Finance leases (including interest) 2.3 7.9 5.5 3.4 1.4 0.1 — 20.6 Operating leases ............................ 15.3 77.6 72.8 70.1 41.8 34.7 113.6 425.9 Programming commitments .......... 42.1 125.3 115.9 86.2 42.5 — — 412.0 Purchase commitments .................. 246.5 86.0 10.7 5.7 4.0 0.7 — 353.6 JV Service Agreements (a) ............ 40.2 138.4 32.8 30.6 30.4 30.0 60.0 362.4 Network and connectivity
commitments ............................. 4.1 8.7 0.2 — — — — 13.0 Other commitments ....................... 3.5 16.9 10.4 2.1 1.8 1.6 1.8 38.1
Total (b) ...................................... € 711.8 € 1,302.1 € 248.3 € 198.1 € 121.9 € 67.1 € 11,659.9 € 14,309.2
Projected cash interest payments on debt obligations (c):Third-party .................................. € 45.1 € 379.2 € 379.5 € 379.3 € 378.6 € 371.7 € 693.0 € 2,626.4 Related-party .............................. 25.7 102.2 102.2 102.5 102.5 102.2 408.7 946.0 Total ......................................... € 70.8 € 481.4 € 481.7 € 481.8 € 481.1 € 473.9 € 1,101.7 € 3,572.4
___________________
(a) Amounts represent fixed minimum charges from Liberty Global and Vodafone pursuant to the JV Service Agreements. In addition to the fixed minimum charges, the JV Service Agreements provide for certain JV Services to be charged to us based upon usage of the services received. The fixed minimum charges set forth in the table above exclude fees for the usage-based services as these fees will vary from period to period. Accordingly, we expect to incur charges in addition to those set forth in the table above for usage-based services. For additional information concerning the JV Service Agreements, see note 10 to our condensed consolidated financial statements.
(b) The commitments included in this table do not reflect any liabilities that are included in our September 30, 2021, condensed consolidated balance sheet other than debt and finance and operating lease obligations.
(c) Amounts include interest payments on third-party debt obligations, as well as interest payments on the Liberty Global Notes and the Vodafone Notes. Amounts related to third-party debt are based on interest rates, interest payment dates, commitment fees and contractual maturities in effect as of September 30, 2021. These amounts are presented for illustrative purposes only and will likely differ from the actual cash payments required in future periods. In addition, the amounts presented do not include the impact of our interest rate derivative contracts, deferred financing costs or original issue premiums or discounts.
For information concerning our debt obligations, finance and operating lease liabilities, the Liberty Global Notes and the Vodafone Notes, and commitments, see notes 7, 8, 10 and 11, respectively, to our condensed consolidated financial statements.
In addition to the commitments set forth in the table above, we have commitments under (i) derivative instruments and (ii) multiemployer benefit plans, pursuant to which we expect to make payments in future periods. For information regarding projected cash flows associated with these derivative instruments, see Projected Cash Flows Associated with Derivative Instruments below. For information regarding our derivative instruments, including the net cash paid or received in connection with these instruments during the nine months ended September 30, 2021, and 2020, see note 4 to our condensed consolidated financial statements.
42

Projected Cash Flows Associated with Derivative Instruments
The following table provides information regarding the projected cash flows associated with our derivative instruments. The euro equivalents presented below are based on interest rates and exchange rates that were in effect as of September 30, 2021. These amounts are presented for illustrative purposes only and will likely differ from the actual cash receipts/payments in future periods. For additional information regarding our derivative instruments, including our counterparty credit risk, see note 4 to our condensed consolidated financial statements.
Receipts (payments) due during:
TotalRemainder
of 2021 2022 2023 2024 2025 2026 Thereafter
in millionsProjected derivative cash receipts
(payments), net:Interest-related (a) ................... € (28.5) € (80.4) € (80.5) € (81.0) € (91.4) € (102.9) € (256.7) € (721.4) Principal-related (b) ................ — — — — 66.0 — (171.8) (105.8)
Total .................................... € (28.5) € (80.4) € (80.5) € (81.0) € (25.4) € (102.9) € (428.5) € (827.2) ___________________
(a) Includes (i) the cash flows of our interest rate cap and floor contracts and (ii) the interest-related cash flows of our cross-currency and interest rate swap contracts.
(b) Includes the principal-related cash flows of our cross-currency swap contracts.
43