vodacom group limited preliminary · pdf fileservice revenue increased 4.9% to r49 320 million...
TRANSCRIPT

Vodacom Group LimitedPreliminary resultsfor the year ended 31 March 2016
Vodacom Group Limited Preliminary results for the year ended 31 March 2016
I am very pleased with our performance this year, with strong execution of our strategy delivering solid results. The acceleration in network investment over the past two years is a true success story of effective capital investment to ensure growth in revenue and customers. The demand for data continues to be our key driver. Overall revenue grew 7.5% with a slight decline in customers to 61.3 million, as a result of customer registration requirements in our International operations.
In South Africa, our network superiority has played a significant part in offering better value to our 34.2 million customers, 2.1 million up from last year. We spent R8.7 billion to upgrade our network infrastructure which includes more than doubling our LTE/4G sites to over 6 000. This enabled us to increase LTE/4G coverage across South Africa to 58% (from 35%) to satisfy exceptional growth in demand for data. Affordability of devices and data bundles led to a 46.8% increase in data traffic as data bundle sales jumped 85.9%. Our personalised “Just 4 You” offers, part of our wider pricing transformation strategy, assisted in improved voice revenue trends, while at the same time reducing effective price per minute by 16.9%.
Our International operations grew strongly with service revenue up by 16.2% compared to 10.0% growth in 2015. This was achieved in an environment of heightened security regulations where unregistered customers of all operators were suspended. Service revenue from International operations accounted for 26.6% of the Group equivalent. Notably, Lesotho exceeded R1 billion in revenue for the first time.
Looking ahead, we will continue to explore spectrum opportunities. South Africa is falling behind on broadband roll out and access. Due to the country’s dependency on mobile data, it is key to secure access to spectrum to unlock this growth potential and fulfil the growing data demands of the population. The proposed acquisition of Neotel lapsed in March due to regulatory complexities and certain conditions not being fulfilled. Our ambitions to increase the rollout of fibre-based broadband services to homes and businesses remain. We will also continue to drive our customer experience and network advantage by investing heavily in resources and infrastructure. As was the case a year ago, we remain cautiously optimistic while being fully cognisant of the various changing regulatory and macroeconomic environments.
Shameel JoosubVodacom Group CEO commented:
s
1
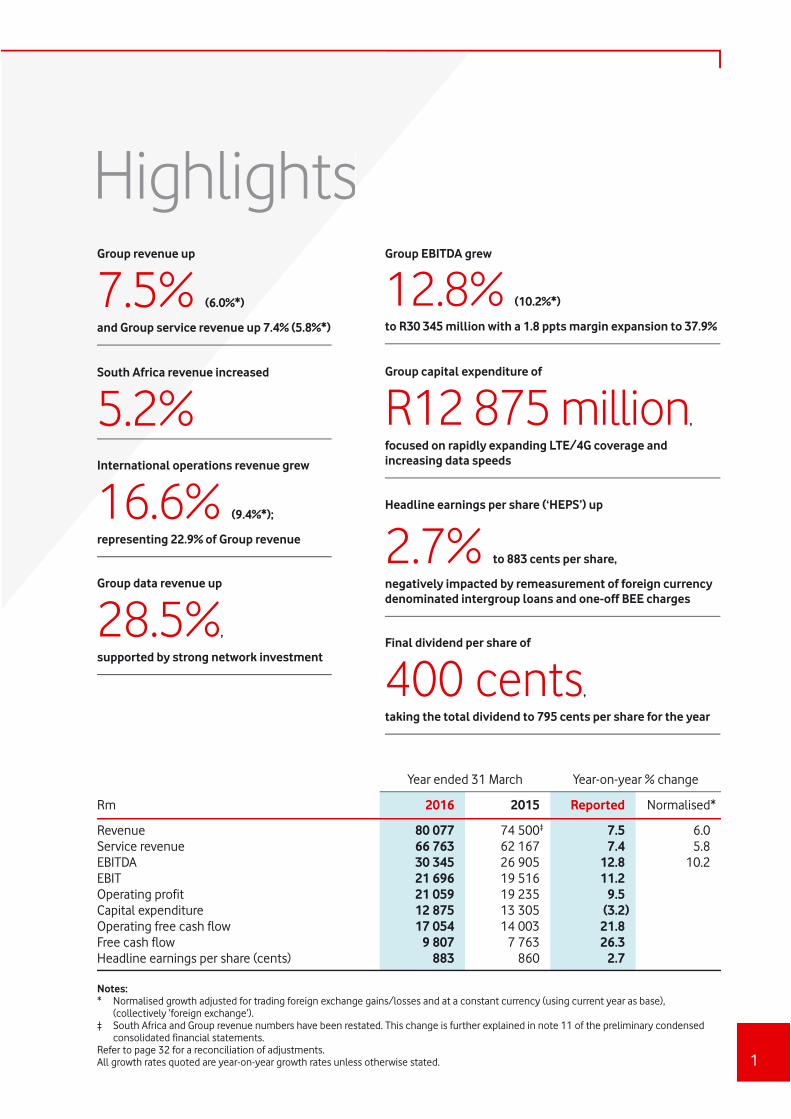
HighlightsGroup revenue up
7.5% (6.0%*)
and Group service revenue up 7.4% (5.8%*)
Group EBITDA grew
12.8% (10.2%*)
to R30 345 million with a 1.8 ppts margin expansion to 37.9%
Headline earnings per share (‘HEPS’) up
2.7% to 883 cents per share, negatively impacted by remeasurement of foreign currency denominated intergroup loans and one-off BEE charges
Final dividend per share of
400 cents,
taking the total dividend to 795 cents per share for the year
Group capital expenditure of
R12 875 million,
focused on rapidly expanding LTE/4G coverage and increasing data speedsInternational operations revenue grew
16.6% (9.4%*);
representing 22.9% of Group revenue
Group data revenue up
28.5%,
supported by strong network investment
South Africa revenue increased
5.2%
Year ended 31 March Year-on-year % change
Rm 2016 2015 Reported Normalised*
Revenue 80 077 74 500‡ 7.5 6.0Service revenue 66 763 62 167 7.4 5.8EBITDA 30 345 26 905 12.8 10.2EBIT 21 696 19 516 11.2Operating profit 21 059 19 235 9.5Capital expenditure 12 875 13 305 (3.2)Operating free cash flow 17 054 14 003 21.8Free cash flow 9 807 7 763 26.3Headline earnings per share (cents) 883 860 2.7
Notes:* Normalised growth adjusted for trading foreign exchange gains/losses and at a constant currency (using current year as base),
(collectively ‘foreign exchange’).‡ South Africa and Group revenue numbers have been restated. This change is further explained in note 11 of the preliminary condensed
consolidated financial statements.Refer to page 32 for a reconciliation of adjustments.All growth rates quoted are year-on-year growth rates unless otherwise stated.
Vodacom Group Limited Preliminary results for the year ended 31 March 2016
2
South Africa Service revenue increased 4.9% to R49 320 million as the business returned to growth following the 50% cut in mobile termination rates (‘MTRs’) last year. The successful execution of our strategy resulted in ARPU trend improvement, boosted by impressive data growth as a result of our accelerated investment programme. Revenue grew at 5.2% to R62 279 million, underpinned by a 6.2% increase in equipment revenue with 10.5 million devices sold in the year of which 61.6% were smart devices.
Active customers increased by 6.4%, adding 2.1 million customers in the year. The ARPU trend improved largely as a result of lower declines in voice revenue as customers opt into more attractively priced Just 4 You offers, coupled with the continued increase in data revenue as customers trade up their devices to either 3G or 4G. Total ARPU declined 0.9% year-on-year to R112. Adjusting for the prior year voucher release of R325 million, ARPU was almost flat, down 0.1%. We have seen great success with the next evolution in our bundle strategy, with personalised offers for customers through our Just 4 You campaign. These personalised offers optimise spend for customers, while achieving ARPU uplift. Prepaid bundle purchases increased to over 1 billion. The success of these offers, as well as the migration to better value price plans, has resulted in improving trends on voice revenue. Active prepaid customers increased 7.6% to 29.3 million. We have migrated 85% of contract customers to new price plans with better value offerings. As a result, contract in bundle spend increased to 71.3% (2015: 69.3%). Active contract customers were flat at 4.9 million; contract churn fell from 9.2% a year ago to 8.5% while contract ARPU increased 4.5% to R397.
Data revenue increased 27.7% to R17 287 million as strong growth in the demand for data continues. Data traffic growth of 46.8% was underpinned by three success factors:• Improved access to more affordable devices – active smart devices on the network increased 22.8% to
14.1 million, driven mainly by the sale of low cost Vodacom branded devices, which account for 25.7% (2015: 16.8%) of total device sales.
• Increased data coverage – the number of active data users on the network expanded 12.7% to 18.7 million customers.
• Our compelling data offers through Just 4 You – this propelled growth in data bundle sales by 85.9% with average monthly data usage increasing 49.8% to 350MB per customer; we continue to see good ARPU growth with customers migrating from 2G to 3G and 3G to 4G, growing by 20.5% and 19.7% respectively.
Enterprise continues to deliver strong growth as we leverage network reliability and our leading mobile brand to move more deeply into fixed-line. Enterprise service revenue (including mobile) now contributes 22.8% of South African service revenue. Fixed-line and business managed services increased 26.5% year-on-year and now comprises 14.9% of total Enterprise service revenue. Growth was supported by the increased demand for fixed services (particularly IP-VPN offers as well as cloud and hosting services) as customers sign up for cloud solutions such as SAP HANA software and Microsoft Office 365. We entered into a strategic partnership with IBM in the second half of the year to provide hosting solutions and the first global cloud in Africa. Our collaboration with IBM, our extensive fixed and mobile infrastructure, our Pan African and global footprint and our investment in data centre infrastructure, provides the ideal platform and environment to deliver cloud services to large and multinational enterprises. Internet of Things (‘IoT’), previously called machine-to-machine, connections increased 28.2% to 2.3 million.
EBITDA increased 9.5% to R25 016 million with strong revenue growth and EBITDA margin expanding 1.6 ppts to 40.2% due to a strong focus on cost efficiencies. Growth was impacted by a R531 million foreign exchange gain (2015: R114 million loss) which has been offset by a one-off BEE charge of R127 million included in staff expenses in the current year and a R308 million voucher release in the previous year. At an individual employee level, we have instilled a cost-conscious culture across the business driving good progress through our cost savings programme “Fit for growth”. Total expenses grew 2.5%, well below revenue growth of 5.2%. We have made several structural changes to deliver cost containment, such as optimising SIM card distribution costs and buying back our customer bases (from Nashua Mobile (Pty) Limited in the prior year, and more recently from Altech Autopage (Pty) Limited), which has reduced on-going commissions paid. Other cost saving initiatives included optimising network operational costs through maintenance contract renegotiations, self-providing more of our transmission services and outsourcing our network maintenance staff to realise scale benefits.
Capital expenditure of R8.7 billion allowed us to substantially widen 3G and LTE/4G data coverage, improve voice quality and increase data speeds. We have more than doubled the number of LTE/4G sites in the year to over 6 000 sites. 3G coverage increased to 99% of the population and LTE/4G coverage to 58%, up from 35% a
Operating review
3
year ago. We extended our high-speed transmission to 89% of our sites. Vodacom claimed top spot in MyBroadband’s 2016 War Drive, which tested the download speeds of South Africa’s mobile operators’ mobile data networks. During the year, our fibre deployment has also started gaining traction as we start to accelerate deployment to more estates. We also focused more of our capital spend on new billing systems to allow us to transition from a predominately mobile company to a unified communications provider and we aim to complete the migration of our contract customers by the end of this year.
Our strategic focus on delivering the best customer experience has resulted in a record lead of 15 points over our nearest competitor as measured through our Net Promoter Score. We have expanded our Travel Saver roaming offer from 27 to 180 countries and enabled free calls to our call centres while roaming. We are also improving our in-store experience to ensure that a customer walks out with a working device with all of their data transferred and free bonus data to ensure that they have no bill shock when setting up their new device.
The Group and Neotel confirmed that the agreement between the parties had lapsed due to regulatory complexities in concluding the transaction as well as certain conditions not being fulfilled. Accordingly, the parties agreed that the proposed restructured transaction could no longer be progressed.
InternationalService revenue in our International operations, which account for 26.6% of Group service revenue, increased by 16.2% (9.6%*) with growth in all markets. We are particularly proud of Vodacom Lesotho having now achieved revenue of over R1 billion. The International operations continue to benefit from increased voice revenue of 14.0% as well as 31.9% growth in data revenue driven by continued network investment. Mobile data revenue now comprises 22.6% (2015:19.9%) of International service revenue.
Active customers decreased 8.1% to 27.1 million, largely due to the customer registration requirements in DRC and Mozambique. In the DRC, the Government ordered all unregistered customers to be disconnected in December 2015. Vodacom has suspended customers with no registration records and communicated to such customers the requirement to register to avoid disconnection. In Mozambique, there has been a phased suspension since November 2015 and a disconnection programme for unregistered customers agreed by the Government and operators.
Mobile data revenue grew 31.9%, (excluding M-Pesa, 42.2%) supported by an increase of 73.1% in data traffic and 1.8% in active data customers to 10.1 million (also impacted by customer registration requirements), reflecting strong demand for mobile data services in all our markets. We continue to focus on our commercial and network offering to drive data growth, ensuring customers have access to better low cost smart devices, such as Vodacom Kicka and SmartTab, expanding 3G and LTE/4G network coverage and driving the adoption of data bundles.
M-Pesa revenue continues to grow strongly at 19.3%, fuelled by expansion of the distribution channel and a growing ecosystem. We added 1.2 million customers, increasing the number of active customers to 9.2 million1, an increase of 15.4% from the prior year. In Tanzania, M-Pawa (savings and loan product) is gaining traction with 1.6 million customers actively using the service.
Enterprise service revenue (including mobile) grew 31.1%. Fixed-line and business managed services grew at 18.5%, and contributes 53.0% to Group fixed-line and business managed services.
EBITDA grew 31.2% (29.9%*) to R5 385 million, contributing 17.7% to Group EBITDA. EBITDA margin increased from 26.1% to 29.3%, with margin improvement across all operations. EBITDA was positively impacted by stronger service revenue as well as cost efficiency initiatives of R705 million, partly offset by significant currency devaluation in Tanzania and Mozambique.
Capital expenditure of R4 090 million represents 22.3% of revenue. We continue to invest significantly in all our markets to strengthen network and service differentiation. To support the significant data growth and wider voice coverage, we added 869 3G, 54 LTE/4G sites and 930 2G sites during the year. The Lesotho service licence was renewed for another 20 years, expiring in 2036. In DRC, we secured a 10 year renewal of our existing spectrum until January 2028, as well as the allocation of additional spectrum in the 1 800MHz and 1 900MHz band.
1. Number of unique customers who have generated revenue related to M-Pesa in the past 90 days, of these 6.8 million have been active in the past 30 days in the International operations.
Operating review continued
Vodacom Group Limited Preliminary results for the year ended 31 March 2016
4
AccoladesWe have made headway in building our brand and earning the confidence of all our stakeholders. This focus had the South African youth once again voting Vodacom as the Coolest Brand in the Generation Next Awards and our My Vodacom App won the Best Mobile App in the Digital Impact Awards. We were also voted the Top Brand in the Telecoms categories for both consumer and business in the Sunday Times Top Brands Survey, being recognised as the Top Employer in the telecoms industry by the Top Employers Institute and named the most reputable telecoms operator in the fifth annual Mail and Guardian Top Companies Reputation Index.
Vodacom claimed top spot in MyBroadband’s 2016 War Drive, which tested the download speeds of South Africa’s mobile operators’ mobile data networks and the MyBroadband Awards, based on four consumer surveys, voted Shameel Joosub IT person of the year.
In DRC, Vodacom won the VSAT Innovation for Africa award at the 2015 AfricaCom Awards for its rural coverage system.
Prior year restatementThe Group provides financing to customers to acquire handsets at an additional contractual charge in both the direct and indirect distribution channel. In the indirect channel, the Group historically recognised equipment revenue from finance deals on a gross basis with the corresponding cost in direct expenses. This accounting treatment has been revisited, since, in the indirect channel the Group is not responsible for transferring the handset to the customer and is therefore financing the acquisition of the handset by the customer. As a result, the Group has restated its consolidated income statement to reflect only the finance income on these transactions as revenue. This resulted in a decrease in equipment revenue and a corresponding decrease in direct expenses in previous financial years. The restatement has no impact on EBITDA, earnings or earnings per share.
All prior year numbers have been restated to reflect the change and all growth rates in this document are reflective of the reported numbers. This change is further explained in note 11 of the preliminary condensed consolidated financial statements.
For the 2015 financial year, revenue was reduced by R2 833 million, with an equal decrease in direct expenses.
Quarterly restated numbers, where applicable, are available on Vodacom.com.
Outlook We are confident that the strategies that we have implemented to differentiate our network experience, to proactively change our pricing to improve in bundle spend and offer customers more value through segmented and personalised pricing, will continue to sustain revenue growth.
We expect data demand to continue to grow strongly as smart devices become more accessible, content becomes more relevant and our 3G and LTE/4G networks reach more customers. We have proactively accelerated our investment in our networks over the past two years in order to capitalise on this future demand. To support this growth over the long term, we will explore further options and opportunities to secure access to spectrum in all our markets.
We continue to focus on developing our growth areas, by driving greater contribution from our International operations, deepening our Enterprise offers, growing fibre to the home and fibre to the business, accelerating data growth, while expanding on other services such as M-Pesa, insurance and the Internet of Things.
Our markets are expected to remain highly competitive and regulatory and macroeconomic risks to persist. The challenges in South Africa’s macro environment will continue to keep customer spend under pressure. In our International operations, customer registration will continue to have a dampening effect on customer growth. Volatile currency rates will have further impact on these operations. Although not immune to these risks, we believe that through the execution of our strategies, we will continue to show resilience in all our operations.
With these factors in mind, we revise our medium-term targets upwards to low to mid single digit Group service revenue growth, mid to high single digit Group EBITDA growth and Group capital expenditure of 12 – 14% of Group revenue over the next three years. These targets are on average, over the next three years and are presented on a normalised* basis, and exclude any M&A activities and spectrum purchases. In addition, we assume broadly stable currencies in each of our markets and stable macro and regulatory environments.
5
Financial review
Summary financial informationYear ended 31 March % change Normalised*
Rm 2016 2015 15/16 % change
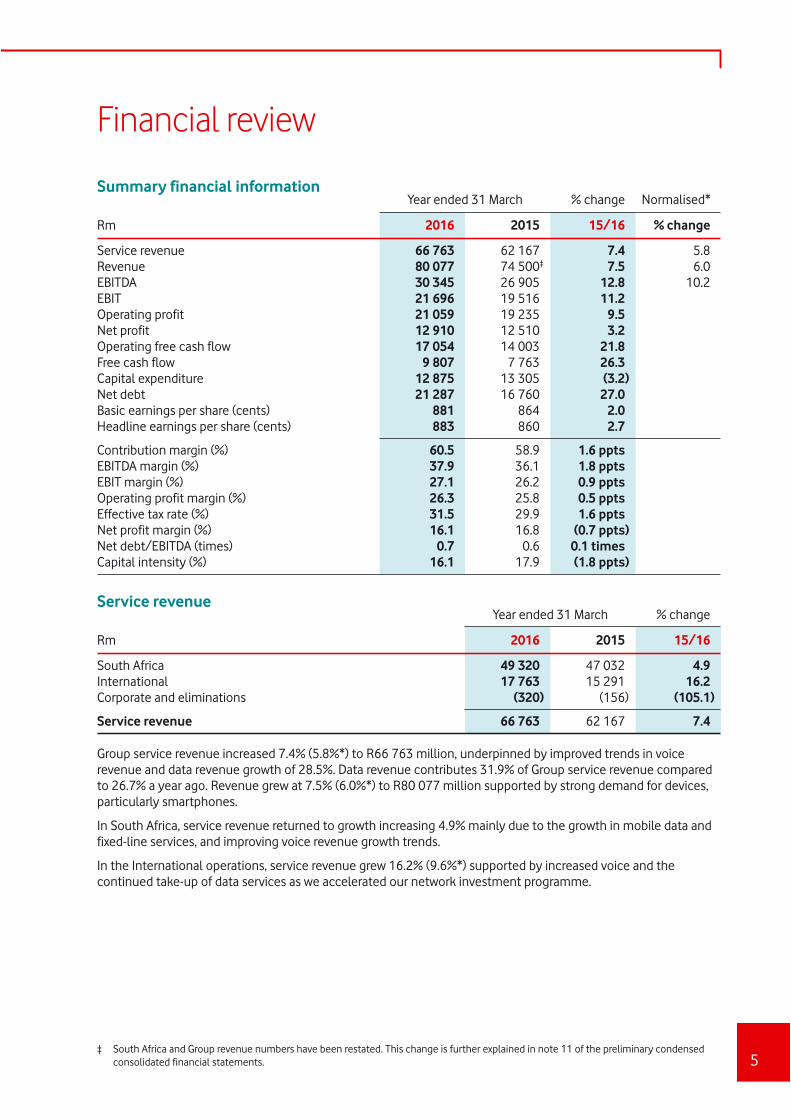
Service revenue 66 763 62 167 7.4 5.8Revenue 80 077 74 500‡ 7.5 6.0EBITDA 30 345 26 905 12.8 10.2EBIT 21 696 19 516 11.2Operating profit 21 059 19 235 9.5Net profit 12 910 12 510 3.2Operating free cash flow 17 054 14 003 21.8Free cash flow 9 807 7 763 26.3Capital expenditure 12 875 13 305 (3.2)Net debt 21 287 16 760 27.0Basic earnings per share (cents) 881 864 2.0Headline earnings per share (cents) 883 860 2.7
Contribution margin (%) 60.5 58.9 1.6 pptsEBITDA margin (%) 37.9 36.1 1.8 pptsEBIT margin (%) 27.1 26.2 0.9 pptsOperating profit margin (%) 26.3 25.8 0.5 pptsEffective tax rate (%) 31.5 29.9 1.6 pptsNet profit margin (%) 16.1 16.8 (0.7 ppts)Net debt/EBITDA (times) 0.7 0.6 0.1 timesCapital intensity (%) 16.1 17.9 (1.8 ppts)
Service revenueYear ended 31 March % change
Rm 2016 2015 15/16
South Africa 49 320 47 032 4.9International 17 763 15 291 16.2Corporate and eliminations (320) (156) (105.1)
Service revenue 66 763 62 167 7.4
Group service revenue increased 7.4% (5.8%*) to R66 763 million, underpinned by improved trends in voice revenue and data revenue growth of 28.5%. Data revenue contributes 31.9% of Group service revenue compared to 26.7% a year ago. Revenue grew at 7.5% (6.0%*) to R80 077 million supported by strong demand for devices, particularly smartphones.
In South Africa, service revenue returned to growth increasing 4.9% mainly due to the growth in mobile data and fixed-line services, and improving voice revenue growth trends.
In the International operations, service revenue grew 16.2% (9.6%*) supported by increased voice and the continued take-up of data services as we accelerated our network investment programme.
‡ South Africa and Group revenue numbers have been restated. This change is further explained in note 11 of the preliminary condensed consolidated financial statements.
Financial review continued
Vodacom Group Limited Preliminary results for the year ended 31 March 2016
6
Total expenses1 Year ended 31 March % change
Rm 2016 2015 15/16
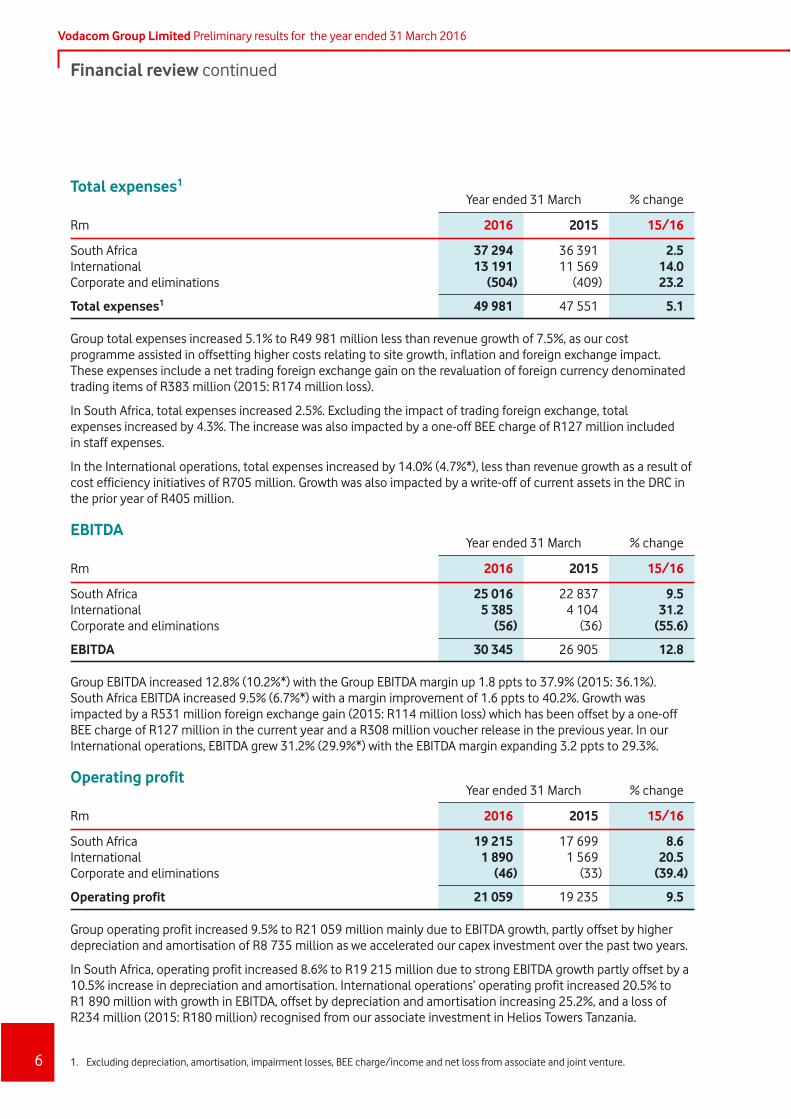
South Africa 37 294 36 391 2.5International 13 191 11 569 14.0Corporate and eliminations (504) (409) 23.2
Total expenses1 49 981 47 551 5.1
Group total expenses increased 5.1% to R49 981 million less than revenue growth of 7.5%, as our cost programme assisted in offsetting higher costs relating to site growth, inflation and foreign exchange impact. These expenses include a net trading foreign exchange gain on the revaluation of foreign currency denominated trading items of R383 million (2015: R174 million loss).
In South Africa, total expenses increased 2.5%. Excluding the impact of trading foreign exchange, total expenses increased by 4.3%. The increase was also impacted by a one-off BEE charge of R127 million included in staff expenses.
In the International operations, total expenses increased by 14.0% (4.7%*), less than revenue growth as a result of cost efficiency initiatives of R705 million. Growth was also impacted by a write-off of current assets in the DRC in the prior year of R405 million.
EBITDAYear ended 31 March % change
Rm 2016 2015 15/16
South Africa 25 016 22 837 9.5International 5 385 4 104 31.2Corporate and eliminations (56) (36) (55.6)
EBITDA 30 345 26 905 12.8
Group EBITDA increased 12.8% (10.2%*) with the Group EBITDA margin up 1.8 ppts to 37.9% (2015: 36.1%). South Africa EBITDA increased 9.5% (6.7%*) with a margin improvement of 1.6 ppts to 40.2%. Growth was impacted by a R531 million foreign exchange gain (2015: R114 million loss) which has been offset by a one-off BEE charge of R127 million in the current year and a R308 million voucher release in the previous year. In our International operations, EBITDA grew 31.2% (29.9%*) with the EBITDA margin expanding 3.2 ppts to 29.3%.
Operating profitYear ended 31 March % change
Rm 2016 2015 15/16
South Africa 19 215 17 699 8.6International 1 890 1 569 20.5Corporate and eliminations (46) (33) (39.4)
Operating profit 21 059 19 235 9.5
Group operating profit increased 9.5% to R21 059 million mainly due to EBITDA growth, partly offset by higher depreciation and amortisation of R8 735 million as we accelerated our capex investment over the past two years.
In South Africa, operating profit increased 8.6% to R19 215 million due to strong EBITDA growth partly offset by a 10.5% increase in depreciation and amortisation. International operations’ operating profit increased 20.5% to R1 890 million with growth in EBITDA, offset by depreciation and amortisation increasing 25.2%, and a loss of R234 million (2015: R180 million) recognised from our associate investment in Helios Towers Tanzania.
1. Excluding depreciation, amortisation, impairment losses, BEE charge/income and net loss from associate and joint venture.
7
Net finance chargesYear ended 31 March % change
Rm 2016 2015 15/16
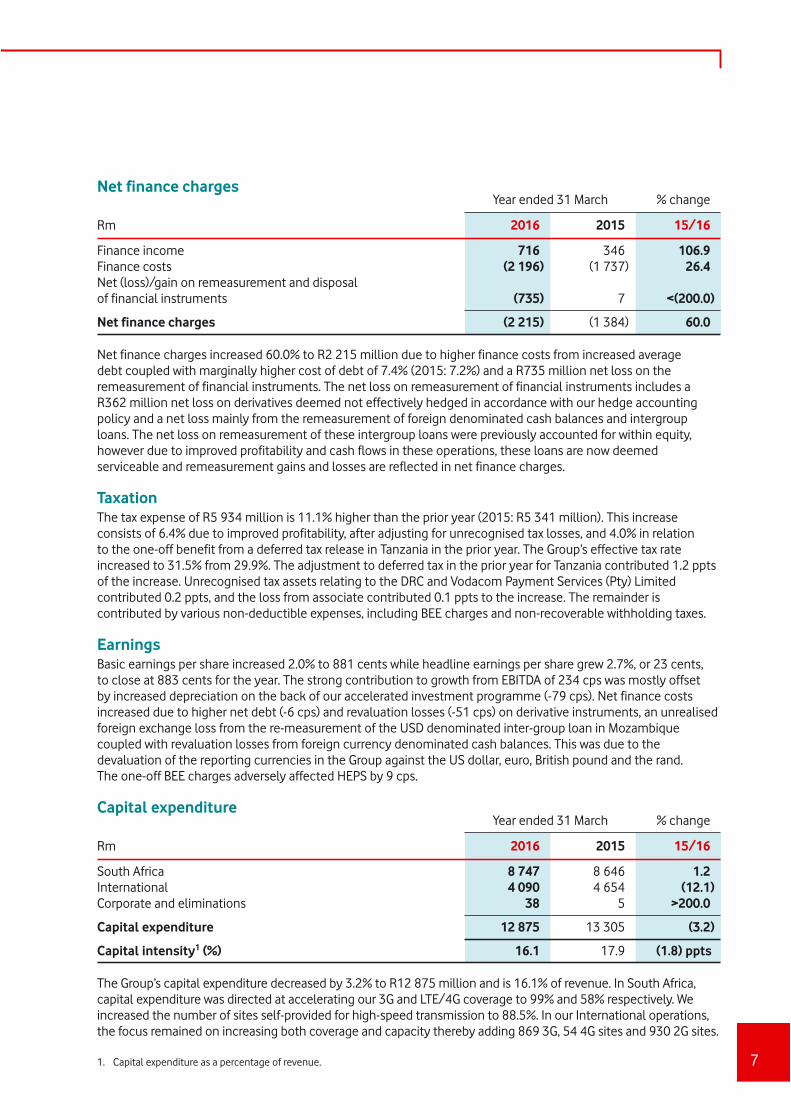
Finance income 716 346 106.9Finance costs (2 196) (1 737) 26.4Net (loss)/gain on remeasurement and disposal of financial instruments (735) 7 <(200.0)
Net finance charges (2 215) (1 384) 60.0
Net finance charges increased 60.0% to R2 215 million due to higher finance costs from increased average debt coupled with marginally higher cost of debt of 7.4% (2015: 7.2%) and a R735 million net loss on the remeasurement of financial instruments. The net loss on remeasurement of financial instruments includes a R362 million net loss on derivatives deemed not effectively hedged in accordance with our hedge accounting policy and a net loss mainly from the remeasurement of foreign denominated cash balances and intergroup loans. The net loss on remeasurement of these intergroup loans were previously accounted for within equity, however due to improved profitability and cash flows in these operations, these loans are now deemed serviceable and remeasurement gains and losses are reflected in net finance charges.
TaxationThe tax expense of R5 934 million is 11.1% higher than the prior year (2015: R5 341 million). This increase consists of 6.4% due to improved profitability, after adjusting for unrecognised tax losses, and 4.0% in relation to the one-off benefit from a deferred tax release in Tanzania in the prior year. The Group’s effective tax rate increased to 31.5% from 29.9%. The adjustment to deferred tax in the prior year for Tanzania contributed 1.2 ppts of the increase. Unrecognised tax assets relating to the DRC and Vodacom Payment Services (Pty) Limited contributed 0.2 ppts, and the loss from associate contributed 0.1 ppts to the increase. The remainder is contributed by various non-deductible expenses, including BEE charges and non-recoverable withholding taxes.
EarningsBasic earnings per share increased 2.0% to 881 cents while headline earnings per share grew 2.7%, or 23 cents, to close at 883 cents for the year. The strong contribution to growth from EBITDA of 234 cps was mostly offset by increased depreciation on the back of our accelerated investment programme (-79 cps). Net finance costs increased due to higher net debt (-6 cps) and revaluation losses (-51 cps) on derivative instruments, an unrealised foreign exchange loss from the re-measurement of the USD denominated inter-group loan in Mozambique coupled with revaluation losses from foreign currency denominated cash balances. This was due to the devaluation of the reporting currencies in the Group against the US dollar, euro, British pound and the rand. The one-off BEE charges adversely affected HEPS by 9 cps.
Capital expenditureYear ended 31 March % change
Rm 2016 2015 15/16
South Africa 8 747 8 646 1.2International 4 090 4 654 (12.1)Corporate and eliminations 38 5 >200.0
Capital expenditure 12 875 13 305 (3.2)
Capital intensity1 (%) 16.1 17.9 (1.8) ppts
The Group’s capital expenditure decreased by 3.2% to R12 875 million and is 16.1% of revenue. In South Africa, capital expenditure was directed at accelerating our 3G and LTE/4G coverage to 99% and 58% respectively. We increased the number of sites self-provided for high-speed transmission to 88.5%. In our International operations, the focus remained on increasing both coverage and capacity thereby adding 869 3G, 54 4G sites and 930 2G sites.
1. Capital expenditure as a percentage of revenue.
Financial review continued
Vodacom Group Limited Preliminary results for the year ended 31 March 2016
8
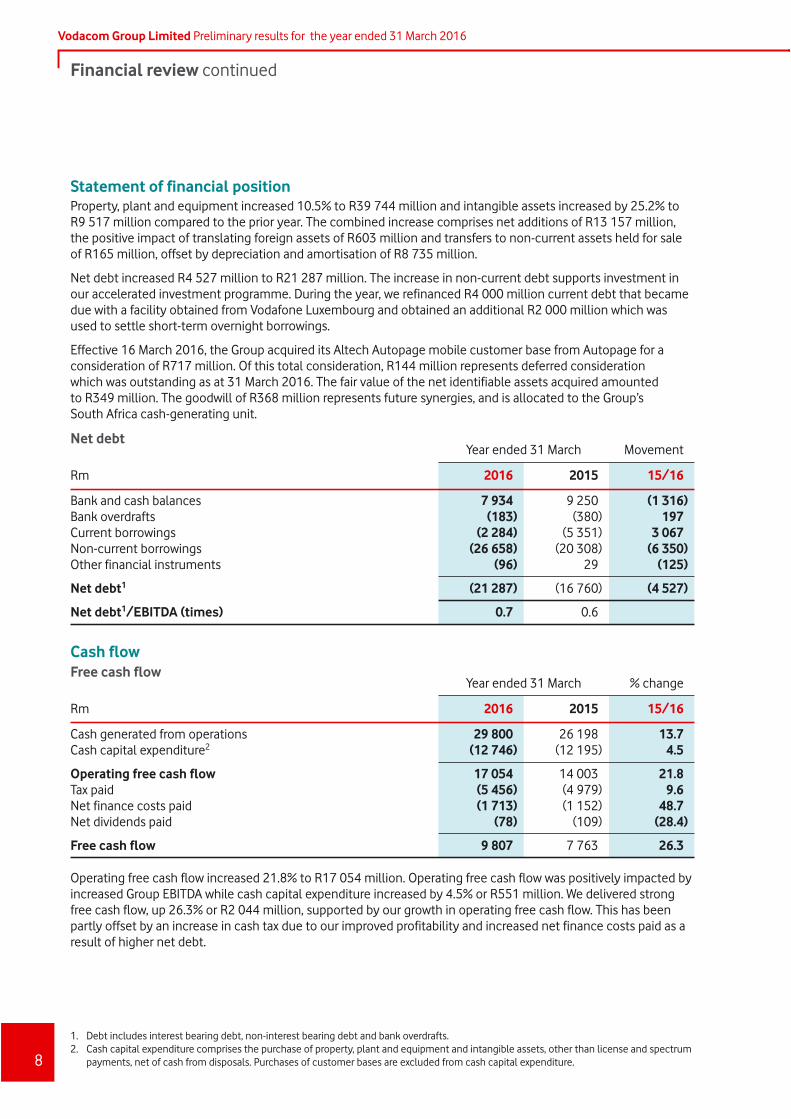
Statement of financial positionProperty, plant and equipment increased 10.5% to R39 744 million and intangible assets increased by 25.2% to R9 517 million compared to the prior year. The combined increase comprises net additions of R13 157 million, the positive impact of translating foreign assets of R603 million and transfers to non-current assets held for sale of R165 million, offset by depreciation and amortisation of R8 735 million.
Net debt increased R4 527 million to R21 287 million. The increase in non-current debt supports investment in our accelerated investment programme. During the year, we refinanced R4 000 million current debt that became due with a facility obtained from Vodafone Luxembourg and obtained an additional R2 000 million which was used to settle short-term overnight borrowings.
Effective 16 March 2016, the Group acquired its Altech Autopage mobile customer base from Autopage for a consideration of R717 million. Of this total consideration, R144 million represents deferred consideration which was outstanding as at 31 March 2016. The fair value of the net identifiable assets acquired amounted to R349 million. The goodwill of R368 million represents future synergies, and is allocated to the Group’s South Africa cash-generating unit.
Net debtYear ended 31 March Movement
Rm 2016 2015 15/16
Bank and cash balances 7 934 9 250 (1 316)Bank overdrafts (183) (380) 197Current borrowings (2 284) (5 351) 3 067Non-current borrowings (26 658) (20 308) (6 350)Other financial instruments (96) 29 (125)
Net debt1 (21 287) (16 760) (4 527)
Net debt1/EBITDA (times) 0.7 0.6
Cash flow Free cash flow
Year ended 31 March % change
Rm 2016 2015 15/16
Cash generated from operations 29 800 26 198 13.7Cash capital expenditure2 (12 746) (12 195) 4.5
Operating free cash flow 17 054 14 003 21.8Tax paid (5 456) (4 979) 9.6Net finance costs paid (1 713) (1 152) 48.7Net dividends paid (78) (109) (28.4)
Free cash flow 9 807 7 763 26.3
Operating free cash flow increased 21.8% to R17 054 million. Operating free cash flow was positively impacted by increased Group EBITDA while cash capital expenditure increased by 4.5% or R551 million. We delivered strong free cash flow, up 26.3% or R2 044 million, supported by our growth in operating free cash flow. This has been partly offset by an increase in cash tax due to our improved profitability and increased net finance costs paid as a result of higher net debt.
1. Debt includes interest bearing debt, non-interest bearing debt and bank overdrafts.2. Cash capital expenditure comprises the purchase of property, plant and equipment and intangible assets, other than license and spectrum
payments, net of cash from disposals. Purchases of customer bases are excluded from cash capital expenditure.
9
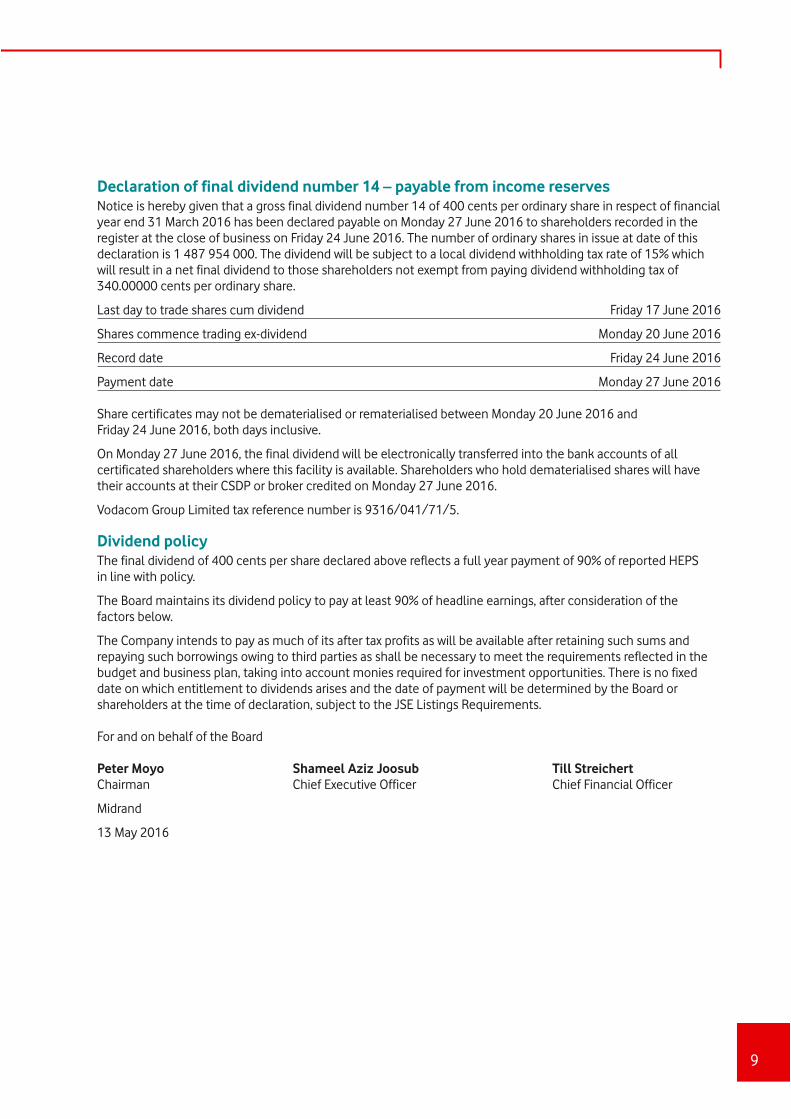
Declaration of final dividend number 14 – payable from income reservesNotice is hereby given that a gross final dividend number 14 of 400 cents per ordinary share in respect of financial year end 31 March 2016 has been declared payable on Monday 27 June 2016 to shareholders recorded in the register at the close of business on Friday 24 June 2016. The number of ordinary shares in issue at date of this declaration is 1 487 954 000. The dividend will be subject to a local dividend withholding tax rate of 15% which will result in a net final dividend to those shareholders not exempt from paying dividend withholding tax of 340.00000 cents per ordinary share.
Last day to trade shares cum dividend Friday 17 June 2016
Shares commence trading ex-dividend Monday 20 June 2016
Record date Friday 24 June 2016
Payment date Monday 27 June 2016
Share certificates may not be dematerialised or rematerialised between Monday 20 June 2016 and Friday 24 June 2016, both days inclusive.
On Monday 27 June 2016, the final dividend will be electronically transferred into the bank accounts of all certificated shareholders where this facility is available. Shareholders who hold dematerialised shares will have their accounts at their CSDP or broker credited on Monday 27 June 2016.
Vodacom Group Limited tax reference number is 9316/041/71/5.
Dividend policyThe final dividend of 400 cents per share declared above reflects a full year payment of 90% of reported HEPS in line with policy.
The Board maintains its dividend policy to pay at least 90% of headline earnings, after consideration of the factors below.
The Company intends to pay as much of its after tax profits as will be available after retaining such sums and repaying such borrowings owing to third parties as shall be necessary to meet the requirements reflected in the budget and business plan, taking into account monies required for investment opportunities. There is no fixed date on which entitlement to dividends arises and the date of payment will be determined by the Board or shareholders at the time of declaration, subject to the JSE Listings Requirements.
For and on behalf of the Board
Peter Moyo Shameel Aziz Joosub Till StreichertChairman Chief Executive Officer Chief Financial Officer
Midrand
13 May 2016
Vodacom Group Limited Preliminary results for the year ended 31 March 2016
10
Independent auditor’s review report
To the shareholders of Vodacom Group LimitedWe have reviewed the preliminary condensed consolidated financial statements of Vodacom Group Limited, set out on pages 11 to 24 of the preliminary report, which comprise the condensed consolidated statement of financial position as at 31 March 2016 and the related condensed consolidated income statement, condensed consolidated statement of comprehensive income, condensed consolidated statement of changes in equity and condensed consolidated statement of cash flows for the year then ended, and selected explanatory notes.
Directors’ responsibility for the preliminary condensed consolidated financial statementsThe directors are responsible for the preparation and presentation of these preliminary condensed consolidated financial statements in accordance with the requirements of the JSE Limited Listings Requirements for preliminary reports, as set out in note 1 to the preliminary condensed consolidated financial statements, and the requirements of the Companies Act of South Africa, and for such internal control as the directors determine is necessary to enable the preparation of financial statements that are free from material misstatement, whether due to fraud or error.
Auditor’s responsibilityOur responsibility is to express a conclusion on these financial statements. We conducted our review in accordance with International Standard on Review Engagements (‘ISRE’) 2410, which applies to a review of historical financial information performed by the independent auditor of the entity. ISRE 2410 requires us to conclude whether anything has come to our attention that causes us to believe that the financial statements are not prepared in all material respects in accordance with the applicable financial reporting framework. This standard also requires us to comply with relevant ethical requirements.
A review of financial statements in accordance with ISRE 2410 is a limited assurance engagement. We perform procedures, primarily consisting of making inquiries of management and others within the entity, as appropriate, and applying analytical procedures, and evaluate the evidence obtained. The procedures performed in a review are substantially less than those performed in an audit conducted in accordance with International Standards on Auditing. Accordingly, we do not express an audit opinion on these financial statements.
ConclusionBased on our review, nothing has come to our attention that causes us to believe that the preliminary condensed consolidated financial statements of Vodacom Group Limited for the year ended 31 March 2016 are not prepared, in all material respects, in accordance with the requirements of the JSE Limited Listings Requirements for preliminary reports, as set out in note 1 to the preliminary condensed consolidated financial statements, and the requirements of the Companies Act of South Africa.
PricewaterhouseCoopers Inc.Director: DB von HoesslinRegistered Auditor
Pretoria
13 May 2016
11
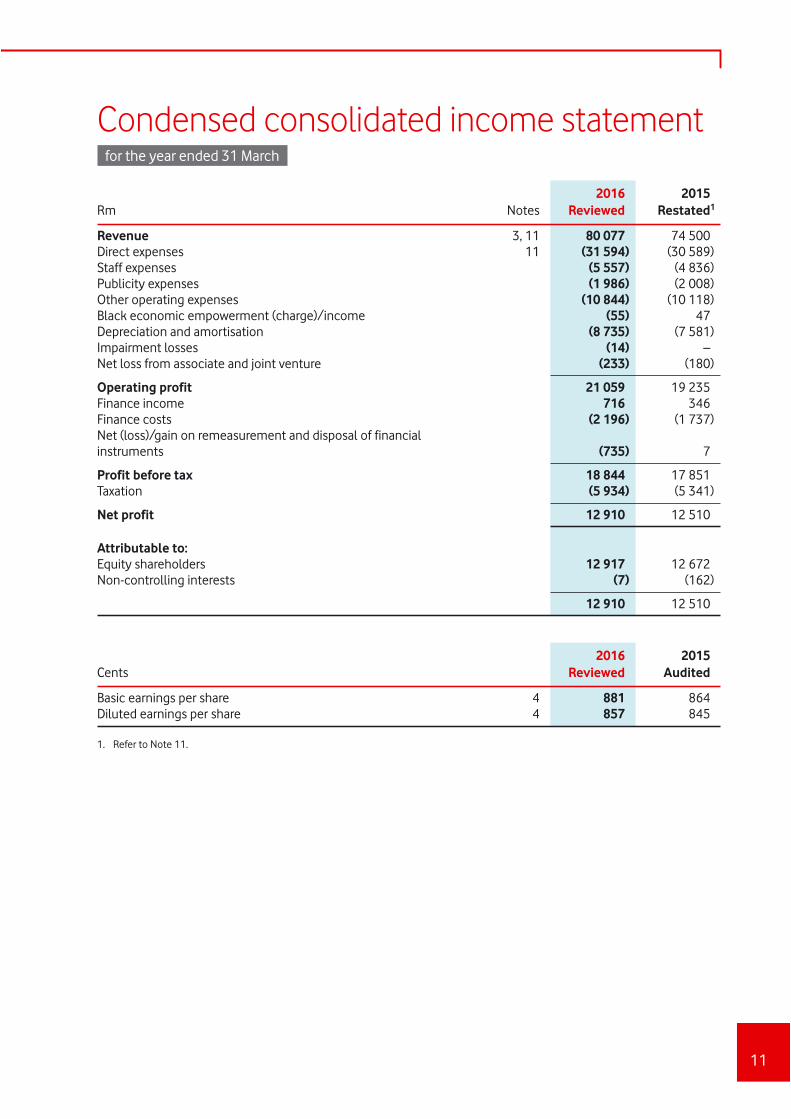
Rm Notes2016
Reviewed2015
Restated1
Revenue 3, 11 80 077 74 500 Direct expenses 11 (31 594) (30 589)Staff expenses (5 557) (4 836)Publicity expenses (1 986) (2 008)Other operating expenses (10 844) (10 118)Black economic empowerment (charge)/income (55) 47 Depreciation and amortisation (8 735) (7 581)Impairment losses (14) – Net loss from associate and joint venture (233) (180)
Operating profit 21 059 19 235 Finance income 716 346 Finance costs (2 196) (1 737)Net (loss)/gain on remeasurement and disposal of financial instruments (735) 7
Profit before tax 18 844 17 851 Taxation (5 934) (5 341)
Net profit 12 910 12 510
Attributable to:Equity shareholders 12 917 12 672 Non-controlling interests (7) (162)
12 910 12 510
Cents2016
Reviewed2015
Audited
Basic earnings per share 4 881 864 Diluted earnings per share 4 857 845
1. Refer to Note 11.
Condensed consolidated income statement for the year ended 31 March
Vodacom Group Limited Preliminary results for the year ended 31 March 2016
12
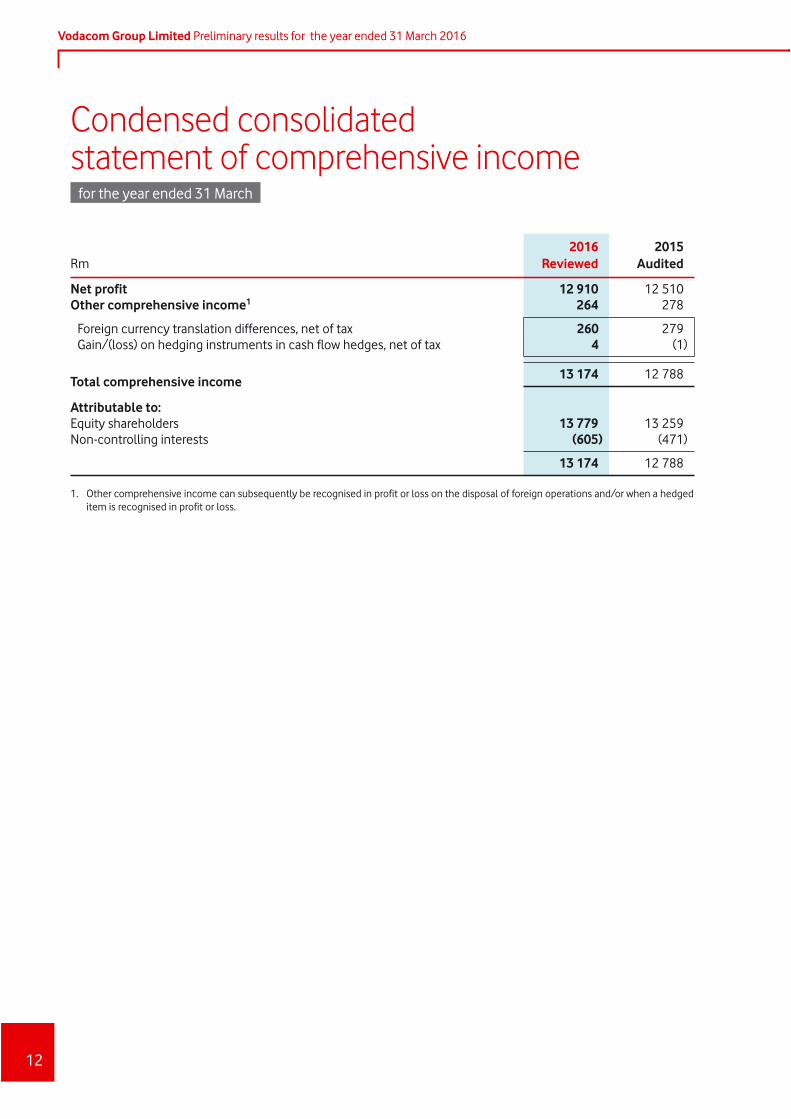
Condensed consolidated statement of comprehensive income for the year ended 31 March
Rm2016
Reviewed 2015
Audited
Net profit 12 910 12 510 Other comprehensive income1 264 278
Foreign currency translation differences, net of tax 260 279 Gain/(loss) on hedging instruments in cash flow hedges, net of tax 4 (1)
Total comprehensive income 13 174 12 788
Attributable to:Equity shareholders 13 779 13 259 Non-controlling interests (605) (471)
13 174 12 788
1. Other comprehensive income can subsequently be recognised in profit or loss on the disposal of foreign operations and/or when a hedged item is recognised in profit or loss.
13
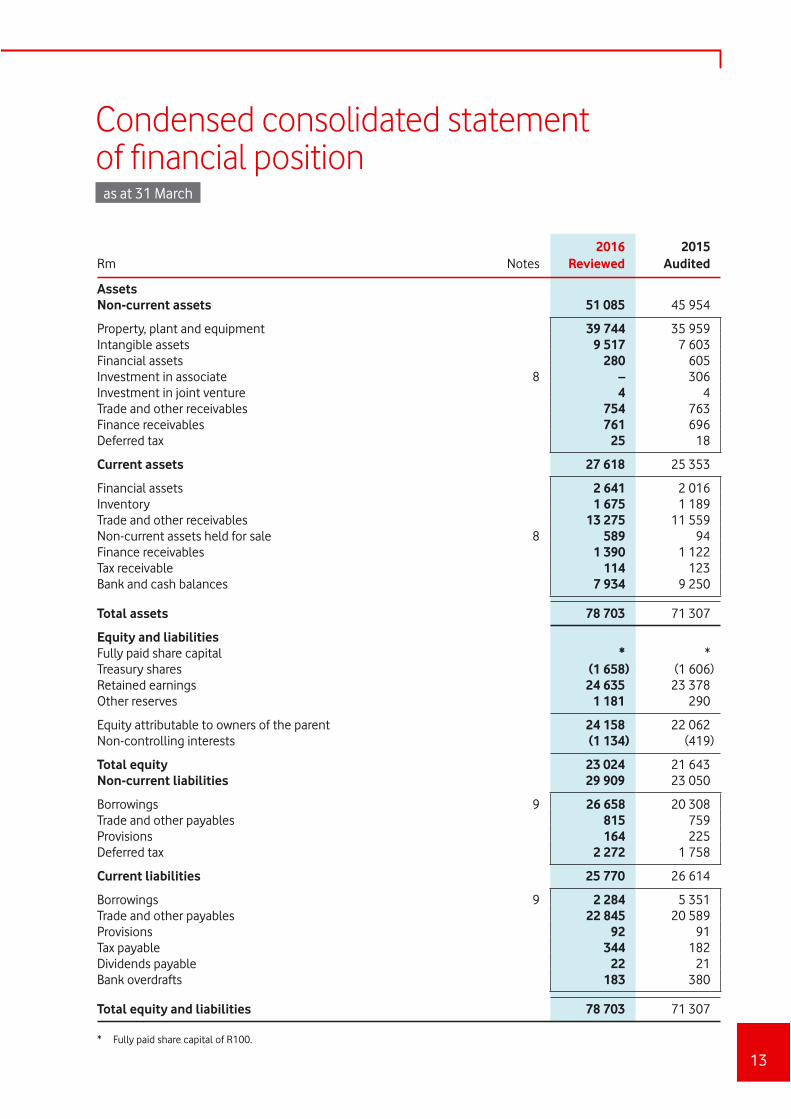
Condensed consolidated statement of fi nancial position as at 31 March
Rm Notes2016
Reviewed 2015
Audited
AssetsNon-current assets 51 085 45 954
Property, plant and equipment 39 744 35 959 Intangible assets 9 517 7 603 Financial assets 280 605 Investment in associate 8 – 306 Investment in joint venture 4 4 Trade and other receivables 754 763 Finance receivables 761 696 Deferred tax 25 18
Current assets 27 618 25 353
Financial assets 2 641 2 016 Inventory 1 675 1 189 Trade and other receivables 13 275 11 559 Non-current assets held for sale 8 589 94 Finance receivables 1 390 1 122 Tax receivable 114 123 Bank and cash balances 7 934 9 250
Total assets 78 703 71 307
Equity and liabilitiesFully paid share capital * * Treasury shares (1 658) (1 606)Retained earnings 24 635 23 378 Other reserves 1 181 290
Equity attributable to owners of the parent 24 158 22 062 Non-controlling interests (1 134) (419)
Total equity 23 024 21 643 Non-current liabilities 29 909 23 050
Borrowings 9 26 658 20 308 Trade and other payables 815 759 Provisions 164 225 Deferred tax 2 272 1 758
Current liabilities 25 770 26 614
Borrowings 9 2 284 5 351 Trade and other payables 22 845 20 589 Provisions 92 91 Tax payable 344 182 Dividends payable 22 21 Bank overdrafts 183 380
Total equity and liabilities 78 703 71 307
* Fully paid share capital of R100.
Vodacom Group Limited Preliminary results for the year ended 31 March 2016
14
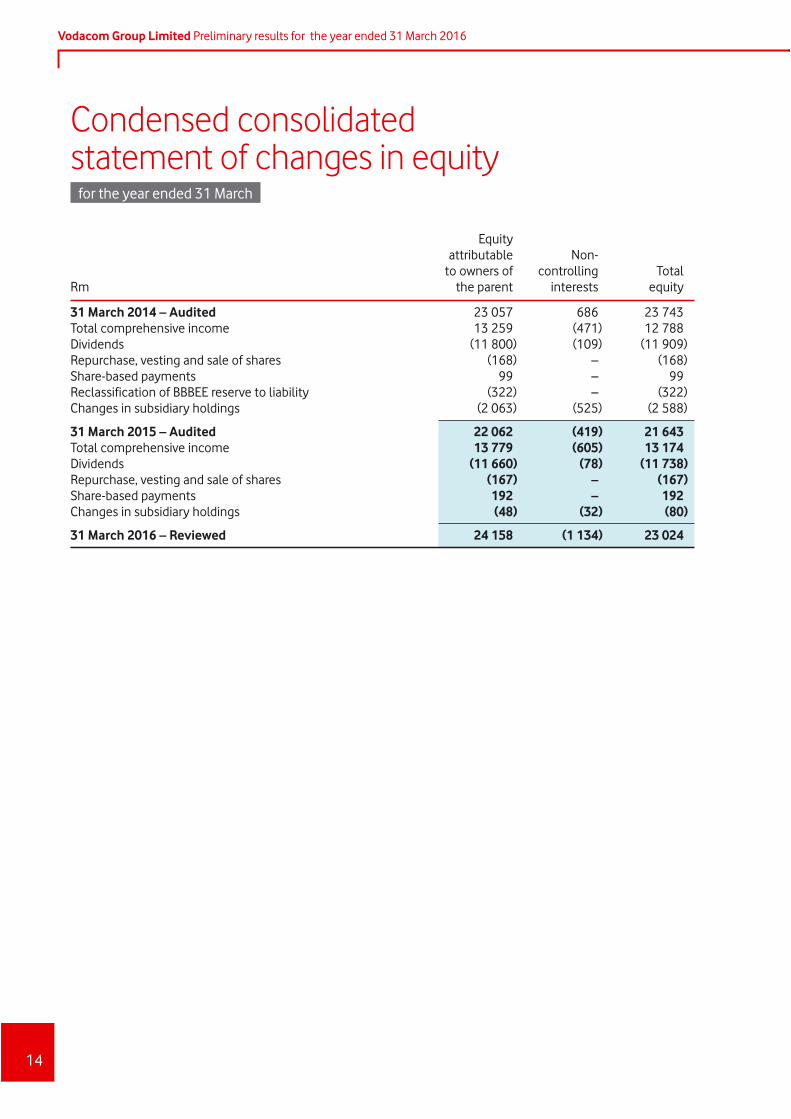
Condensed consolidated statement of changes in equity for the year ended 31 March
Rm
Equity attributableto owners of
the parent
Non-controlling
interests Total
equity
31 March 2014 – Audited 23 057 686 23 743 Total comprehensive income 13 259 (471) 12 788 Dividends (11 800) (109) (11 909)Repurchase, vesting and sale of shares (168) – (168)Share-based payments 99 – 99 Reclassification of BBBEE reserve to liability (322) – (322)Changes in subsidiary holdings (2 063) (525) (2 588)
31 March 2015 – Audited 22 062 (419) 21 643 Total comprehensive income 13 779 (605) 13 174 Dividends (11 660) (78) (11 738)Repurchase, vesting and sale of shares (167) – (167)Share-based payments 192 – 192 Changes in subsidiary holdings (48) (32) (80)
31 March 2016 – Reviewed 24 158 (1 134) 23 024
15
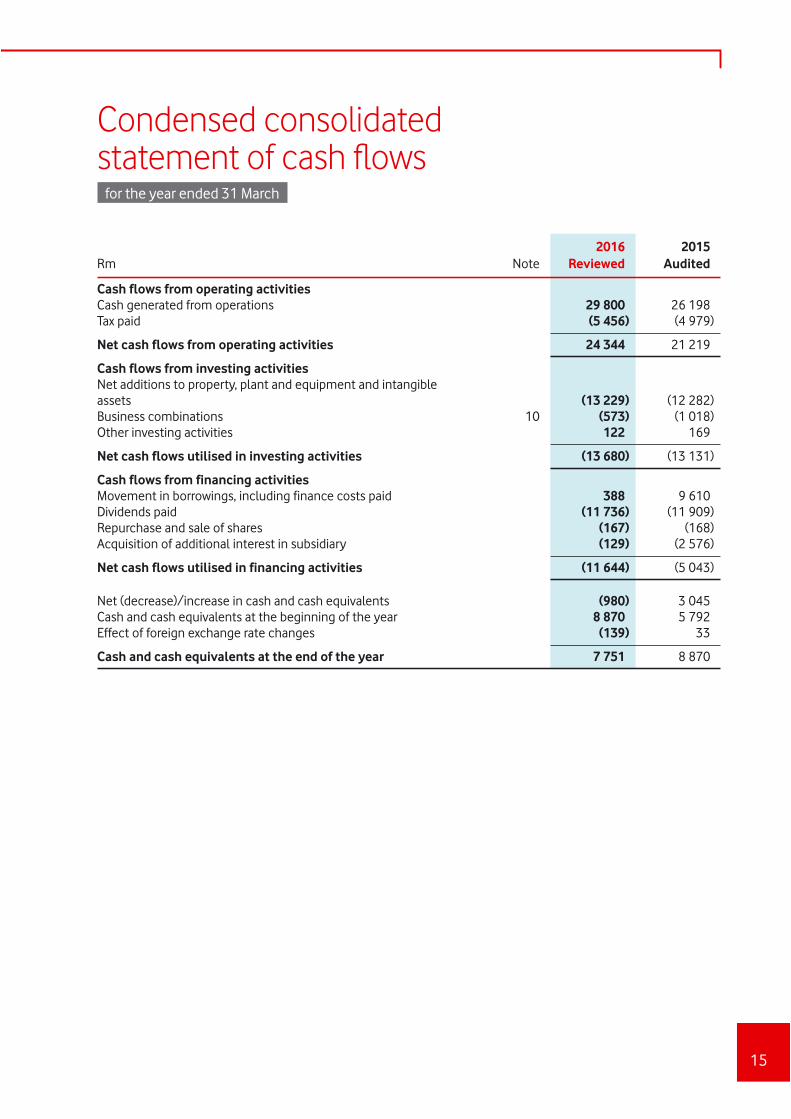
Condensed consolidated statement of cash fl ows for the year ended 31 March
Rm Note2016
Reviewed 2015
Audited
Cash flows from operating activitiesCash generated from operations 29 800 26 198 Tax paid (5 456) (4 979)
Net cash flows from operating activities 24 344 21 219
Cash flows from investing activitiesNet additions to property, plant and equipment and intangible assets (13 229) (12 282)Business combinations 10 (573) (1 018)Other investing activities 122 169
Net cash flows utilised in investing activities (13 680) (13 131)
Cash flows from financing activitiesMovement in borrowings, including finance costs paid 388 9 610 Dividends paid (11 736) (11 909)Repurchase and sale of shares (167) (168)Acquisition of additional interest in subsidiary (129) (2 576)
Net cash flows utilised in financing activities (11 644) (5 043)
Net (decrease)/increase in cash and cash equivalents (980) 3 045 Cash and cash equivalents at the beginning of the year 8 870 5 792 Effect of foreign exchange rate changes (139) 33
Cash and cash equivalents at the end of the year 7 751 8 870
Vodacom Group Limited Preliminary results for the year ended 31 March 2016
16
Notes to the preliminary condensed consolidated fi nancial statements for the year ended 31 March
1. Basis of preparation These preliminary condensed consolidated financial statements have been prepared in accordance
with the framework concepts, the recognition and measurement criteria of International Financial Reporting Standards (‘IFRS’) and in accordance with and containing the information required by International Accounting Standard (‘IAS’) 34: Interim Financial Reporting as issued by the International Accounting Standards Board (‘IASB’), the Financial Reporting Guides as issued by the South African Institute of Chartered Accountants (‘SAICA’) Accounting Practices Committee, Financial Pronouncements as issued by the Financial Reporting Standards Council, the JSE Limited (‘JSE’) Listings Requirements and the requirements of the Companies Act of 2008, as amended. They have been prepared on the historical cost basis, except for certain financial instruments which are measured at fair value or at amortised cost, and are presented in South African rand, which is the parent Company’s functional and presentation currency.
The significant accounting policies and methods of computation are consistent in all material respects with those applied in the previous year, except as disclosed in Note 2. The significant accounting policies are available for inspection at the Group’s registered office.
The Group changed the presentation of its statement of cash flows from the direct method to the indirect method in order to align with the Group’s ultimate parent, Vodafone Group Plc. This presentation will be reflected in the Group’s consolidated annual financial statements for the year ended 31 March 2016, which will be available online by 17 June 2016.
During the year, management revisited the accounting judgements applied in accounting for finance deals. Refer to Note 11 for more details. There have been no other material changes in judgements or estimates of amounts reported in prior reporting periods.
The preparation of these preliminary condensed consolidated financial statements was supervised by the Chief Financial Officer, Dr phil. T Streichert.
The financial information has been reviewed by PwC whose unmodified review report is presented on page 10.
2. Changes in accounting policies The Group adopted the new, revised or amended accounting pronouncements as issued by the IASB,
which were effective and applicable to the Group from 1 April 2015, none of which had any material impact on the Group’s financial results for the year.
Full details on changes in accounting policies will be disclosed in the Group’s consolidated annual financial statements for the year ended 31 March 2016, which will be available online by 17 June 2016.
17
Rm Note2016
Reviewed2015
Restated1
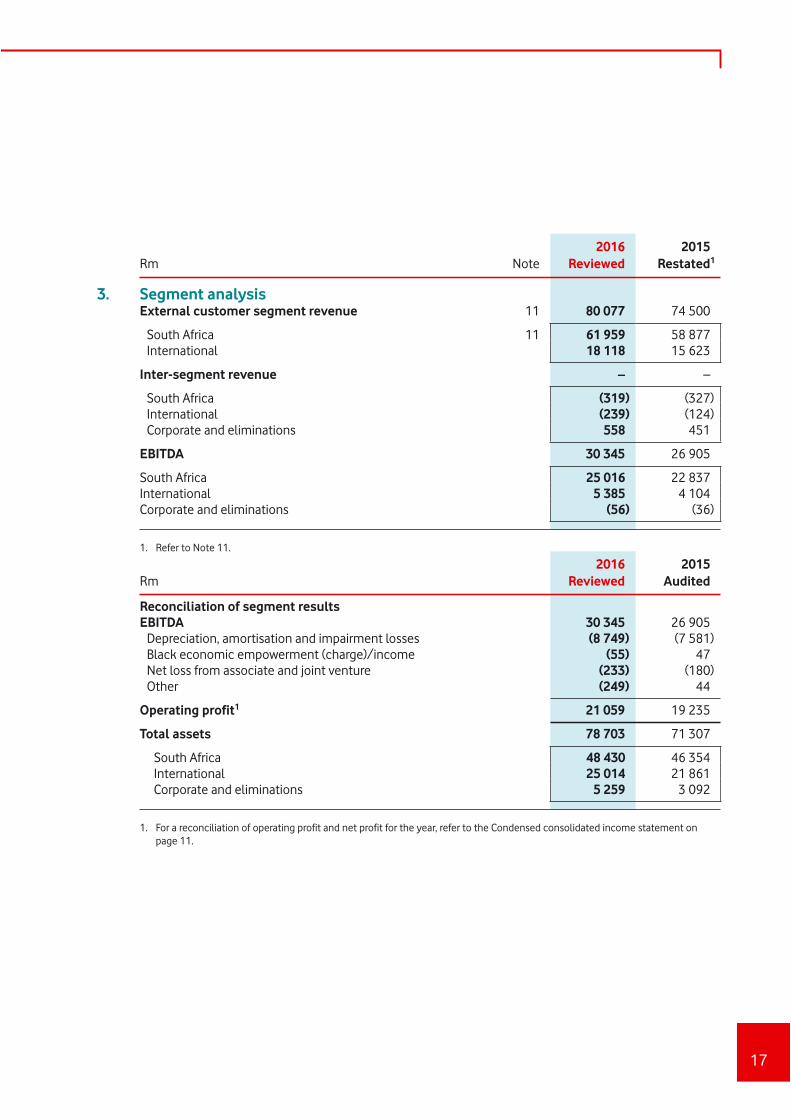
3. Segment analysisExternal customer segment revenue 11 80 077 74 500
South Africa 11 61 959 58 877 International 18 118 15 623
Inter-segment revenue – –
South Africa (319) (327) International (239) (124) Corporate and eliminations 558 451
EBITDA 30 345 26 905
South Africa 25 016 22 837 International 5 385 4 104 Corporate and eliminations (56) (36)
1. Refer to Note 11.
Rm2016
Reviewed2015
Audited
Reconciliation of segment resultsEBITDA 30 345 26 905 Depreciation, amortisation and impairment losses (8 749) (7 581) Black economic empowerment (charge)/income (55) 47 Net loss from associate and joint venture (233) (180) Other (249) 44
Operating profit1 21 059 19 235
Total assets 78 703 71 307
South Africa 48 430 46 354 International 25 014 21 861 Corporate and eliminations 5 259 3 092
1. For a reconciliation of operating profit and net profit for the year, refer to the Condensed consolidated income statement on page 11.
Vodacom Group Limited Preliminary results for the year ended 31 March 2016
18
Cents2016
Reviewed2015
Audited
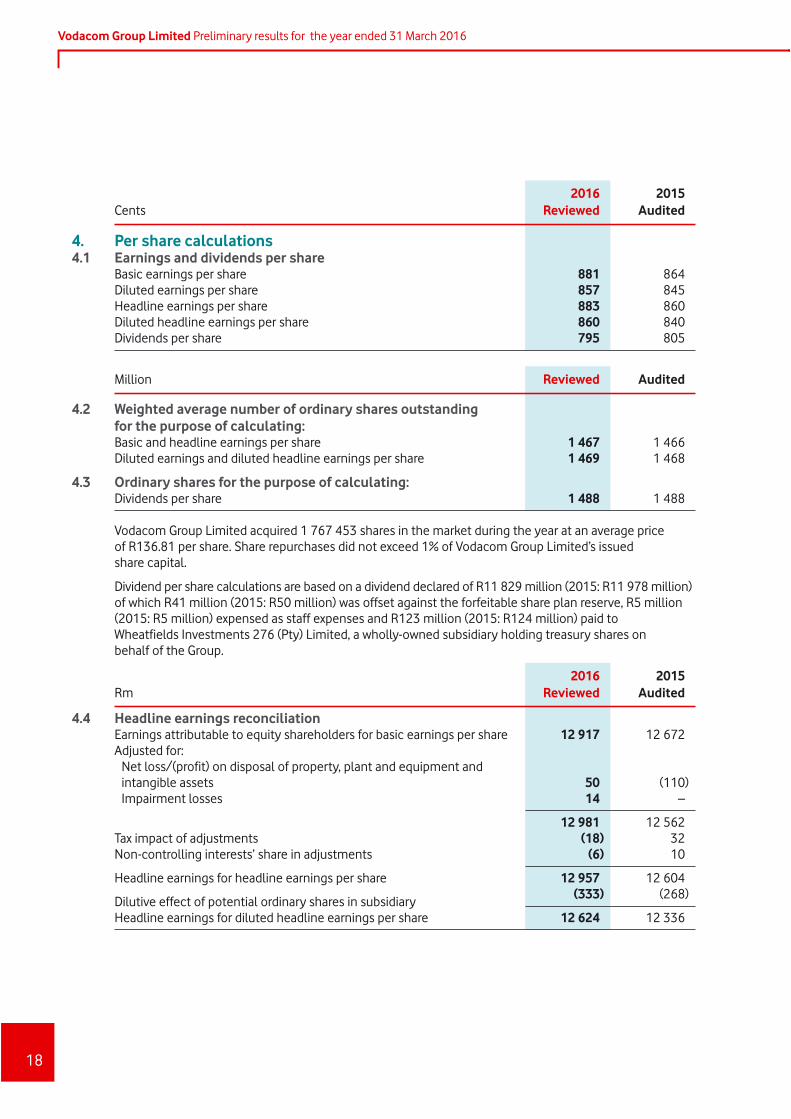
4. Per share calculations4.1 Earnings and dividends per share
Basic earnings per share 881 864 Diluted earnings per share 857 845 Headline earnings per share 883 860 Diluted headline earnings per share 860 840 Dividends per share 795 805
Million Reviewed Audited
4.2 Weighted average number of ordinary shares outstanding for the purpose of calculating:Basic and headline earnings per share 1 467 1 466Diluted earnings and diluted headline earnings per share 1 469 1 468
4.3 Ordinary shares for the purpose of calculating:Dividends per share 1 488 1 488
Vodacom Group Limited acquired 1 767 453 shares in the market during the year at an average price of R136.81 per share. Share repurchases did not exceed 1% of Vodacom Group Limited’s issued share capital.
Dividend per share calculations are based on a dividend declared of R11 829 million (2015: R11 978 million) of which R41 million (2015: R50 million) was offset against the forfeitable share plan reserve, R5 million (2015: R5 million) expensed as staff expenses and R123 million (2015: R124 million) paid to Wheatfields Investments 276 (Pty) Limited, a wholly-owned subsidiary holding treasury shares on behalf of the Group.
Rm2016
Reviewed2015
Audited
4.4 Headline earnings reconciliationEarnings attributable to equity shareholders for basic earnings per share 12 917 12 672 Adjusted for: Net loss/(profit) on disposal of property, plant and equipment and
intangible assets 50 (110) Impairment losses 14 –
12 981 12 562 Tax impact of adjustments (18) 32 Non-controlling interests’ share in adjustments (6) 10
Headline earnings for headline earnings per share 12 957 12 604
Dilutive effect of potential ordinary shares in subsidiary (333) (268)
Headline earnings for diluted headline earnings per share 12 624 12 336
19
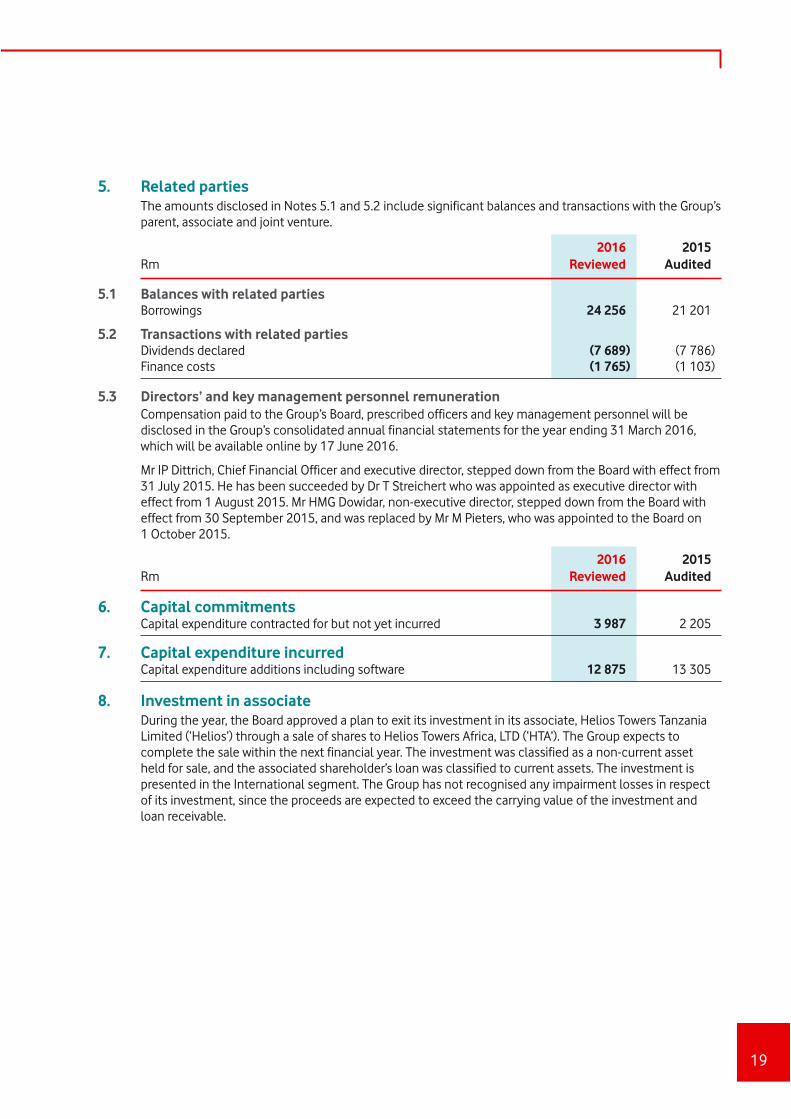
5. Related parties The amounts disclosed in Notes 5.1 and 5.2 include significant balances and transactions with the Group’s
parent, associate and joint venture.
Rm2016
Reviewed2015
Audited
5.1 Balances with related partiesBorrowings 24 256 21 201
5.2 Transactions with related partiesDividends declared (7 689) (7 786)Finance costs (1 765) (1 103)
5.3 Directors’ and key management personnel remuneration Compensation paid to the Group’s Board, prescribed officers and key management personnel will be
disclosed in the Group’s consolidated annual financial statements for the year ending 31 March 2016, which will be available online by 17 June 2016.
Mr IP Dittrich, Chief Financial Officer and executive director, stepped down from the Board with effect from 31 July 2015. He has been succeeded by Dr T Streichert who was appointed as executive director with effect from 1 August 2015. Mr HMG Dowidar, non-executive director, stepped down from the Board with effect from 30 September 2015, and was replaced by Mr M Pieters, who was appointed to the Board on 1 October 2015.
Rm2016
Reviewed2015
Audited
6. Capital commitmentsCapital expenditure contracted for but not yet incurred 3 987 2 205
7. Capital expenditure incurredCapital expenditure additions including software 12 875 13 305
8. Investment in associate During the year, the Board approved a plan to exit its investment in its associate, Helios Towers Tanzania
Limited (‘Helios’) through a sale of shares to Helios Towers Africa, LTD (‘HTA’). The Group expects to complete the sale within the next financial year. The investment was classified as a non-current asset held for sale, and the associated shareholder’s loan was classified to current assets. The investment is presented in the International segment. The Group has not recognised any impairment losses in respect of its investment, since the proceeds are expected to exceed the carrying value of the investment and loan receivable.
Vodacom Group Limited Preliminary results for the year ended 31 March 2016
20
9. Borrowings During the current year, the Group obtained an additional loan from Vodafone Investments Luxembourg
s.a.r.l. with a nominal value of R2 000 million which was utilised to settle short-term overnight borrowings. The loan bears interest payable quarterly at three-month JIBAR plus 1.15%, is unsecured, and is repayable on 16 July 2018.
A loan from Old Mutual Specialised Financing (Pty) Limited and Minervois Trading No. 2 (Pty) Limited with a nominal value of R1 000 million was repaid on 30 September 2015. The repayment was funded by a drawdown of R1 000 million on an overall loan facility of R4 000 million from Vodafone Investments Luxembourg s.a.r.l. that was approved during the year. The new loan facility is unsecured and has a three year tenure with a repayment date of 28 September 2018. The loan bears interest at a fixed rate of 8.64% payable quarterly.
The residual R3 000 million drawdown on the R4 000 million facility was used to refinance a R3 000 million term loan provided by Vodafone Investments Luxembourg s.a.r.l. which matured on 22 March 2016. The repayment date for the new term loan is 22 March 2019 and the loan bears interest at a fixed rate of 9.39% per annum.
10. Business combinations10.1 Altech Autopage Cellular a division of Altron TMT (Pty) Limited (‘Autopage’) Effective 16 March 2016, the Group acquired its Altech Autopage customer base from Autopage for a
consideration of R717 million. Of this total consideration, R144 million represents deferred consideration which was outstanding as at 31 March 2016. The fair value of the net identifiable assets acquired amounted to R349 million. The goodwill of R368 million represents future synergies, and is allocated to the Group’s South Africa cash-generating unit.
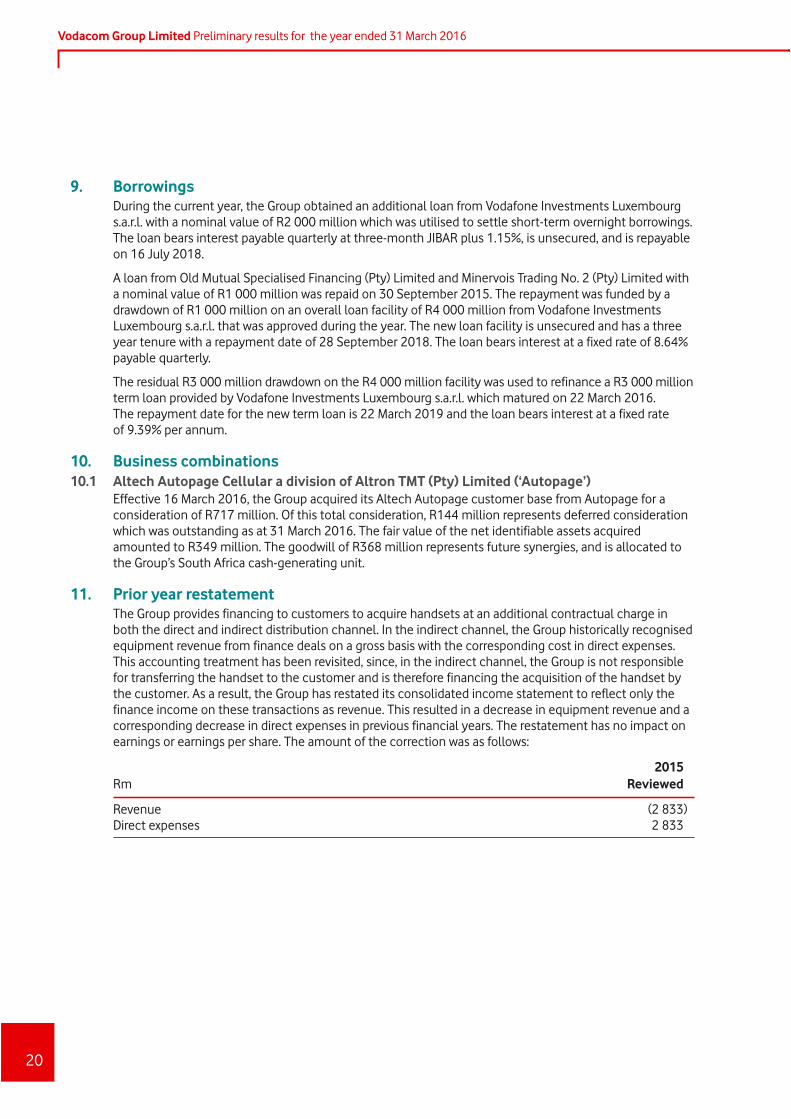
11. Prior year restatement The Group provides financing to customers to acquire handsets at an additional contractual charge in
both the direct and indirect distribution channel. In the indirect channel, the Group historically recognised equipment revenue from finance deals on a gross basis with the corresponding cost in direct expenses. This accounting treatment has been revisited, since, in the indirect channel, the Group is not responsible for transferring the handset to the customer and is therefore financing the acquisition of the handset by the customer. As a result, the Group has restated its consolidated income statement to reflect only the finance income on these transactions as revenue. This resulted in a decrease in equipment revenue and a corresponding decrease in direct expenses in previous financial years. The restatement has no impact on earnings or earnings per share. The amount of the correction was as follows:
Rm2015
Reviewed
Revenue (2 833)Direct expenses 2 833

21
12. Contingent liabilities12.1 Guarantees The Group issued various guarantees, relating to external financial obligations of its subsidiaries, which
amounted to R113 million (2015: R113 million).
Foreign denominated guarantees amounting to R1 102 million (2015: R911 million) were issued in support of Vodacom Congo (RDC) SA relating to liabilities included in the consolidated statement of financial position.
12.2 Tax matters The Group is regularly subject to an evaluation by tax authorities of its direct and indirect tax filings.
The consequence of such reviews is that disputes can arise with tax authorities over the interpretation or application of certain tax rules applicable to the Group’s business. These disputes may not necessarily be resolved in a manner that is favourable to the Group. Additionally, the resolution of the disputes could result in an obligation to the Group. The Group has made sufficient provision for any losses arising from tax exposures that are more likely to occur than not.
12.3 Legal contingencies The Group is currently involved in various legal proceedings and has, in consultation with its legal
counsel, assessed the outcome of these proceedings. Following this assessment, the Group’s management has determined that adequate provision has been made in respect of these legal proceedings as at 31 March 2016.
12.4 Kenneth Makate vs Vodacom (Pty) Limited Refer to Note 14.1.
13. Other matters13.1 Shared Networks Tanzania Limited (‘Shared Networks’) Vodacom Tanzania Limited has entered into an agreement with the shareholders of Shared Networks to
acquire 100% of their issued share capital for US$15 million. The acquisition will be funded through available cash resources. The transaction remains subject to the fulfilment of a number of conditions precedent, including the requisite regulatory approvals.
13.2 Neotel (Pty) Limited (‘Neotel’) The Group and Neotel have confirmed that the agreement between the parties has lapsed due to
regulatory complexities in concluding the transaction as well as certain conditions not being fulfilled. Accordingly, the parties have agreed that the proposed restructured transaction can no longer be progressed.
13.3 Call termination rates (‘CTR’) The application submitted by Cell C (Pty) Limited (‘Cell C’) with the High Court to review and set aside
the Independent Communications Authority of South Africa’s (‘Icasa’) decision on CTR’s has subsequently been withdrawn by Cell C.
Vodacom Group Limited Preliminary results for the year ended 31 March 2016
22
13. Other matters continued13.4 Competition Commission complaint lodged by Cell C The Group received a complaint from the Competition Commission in which it is alleged that the
Group’s South African segment has abused their market dominance in contravention of Section 8 of the Competition Act of 1998. Investigations on this complaint are ongoing and the Group is in the process of complying with new information requests in this regard.
13.5 Vodacom Congo (RDC) SA (‘Vodacom Congo’) and Vodacom International Limited (‘VIL’) There are various legal matters relating to the Group’s investment in Vodacom Congo, the most
recent of which is a claim brought in August 2015 by Mr Alieu Badara Mohamed Conteh in the Commercial Court of Kinshasa/Gombe against VIL and Vodacom Congo, which was dismissed by the courts in December 2015.
13.6 Customer registration In each country where the Group is subject to customer registration requirements, the industry is
engaging with authorities to improve the process to ensure customer registration. The difficulties experienced by the Group in the registration process include; limited number of national identity cards, the inefficiency of a paper based process, and the inability of mass market distribution partners to complete the registration processes correctly. Tanzania and Mozambique have replaced the paper based process with an electronic registration process. The Group is continuing to actively register customers and has action plans in each country to achieve full compliance.
13.7 Implementation of Numbering Plan Regulations 2016 Icasa published Numbering Plan Regulations, in terms of section 68 of the Electronic Communications
Act 36 of 2005, as amended, on 24 March 2016. The Group is in the process of implementing these regulations.
13.8 Broad Based Black Economic Empowerment (‘BBBEE’) On 29 February 2016, the Department of Trade and Industry (‘dti’) published the revised draft information
and communication technology (‘ICT’) Sector Code for a 60 day public comment period. This code follows the May 2015 implementation of the revised generic dti Codes on BBBEE, which saw a complete overhaul of the current targets and requirements. The revised codes are expected to be finalised in June 2016, with the effective date being 1 April 2016.
In February 2016, the North Gauteng High Court made the following order on the matter of regulatory requirements emanating from the Electronic Communications Act 36 of 2005: Compliance with the 30% equity ownership to be held by historically disadvantaged persons (‘HDI’) is peremptory and that Icasa does not have any discretion to either waive or relax the immediate requirement to comply with the minimum 30% HDI equity ownership threshold.
13.9 Vodacom Payment Services (Pty) Limited In March 2016, a decision was taken to phase out the South African M-Pesa product offering during the
course of the next financial year.
23
14. Events after the reporting period The Board is not aware of any matter or circumstance arising since the end of the reporting period, not
otherwise dealt with herein, which significantly affects the financial position of the Group or the results of its operations or cash flows for the period, other than the following:
14.1 Kenneth Makate (‘Mr Makate’) vs Vodacom (Pty) Limited (‘the Company’) In 2008, Mr Makate instituted legal proceedings to claim compensation for a business idea that led to a
product known as ‘Please Call Me’. On 1 July 2014, the South Gauteng High Court, Johannesburg (‘the High Court’) found that Mr Makate had proven the existence of a contract. However, the High Court ruled that the Company was not bound by that contract because the responsible director of product development and services did not have authority to enter into any such agreement on the Company’s behalf. The High Court also rejected Mr Makate’s claim on the basis that it had lapsed in terms of the Prescription Act 68 of 1969.
The High Court and Supreme Court of Appeal (‘the Supreme Court’) turned down Mr Makate’s application for leave to appeal on 11 December 2014 and 2 March 2015, respectively. Mr Makate applied for leave to appeal in the Constitutional Court. On 26 April 2016, after having heard the application on 1 September 2015, the Constitutional Court granted leave to appeal and upheld Mr Makate’s appeal. In doing so, the Constitutional Court ordered that:
• the Company is bound by the agreement concluded between Mr Makate and the then director of product development and services;
• the Company is to commence negotiations in good faith with Mr Makate to determine reasonable compensation; and
• in the event of the parties failing to agree on the reasonable compensation, the matter must be submitted to Vodacom’s Chief Executive Officer for determination of the amount within a reasonable time.
Negotiations between the Company and Mr Makate will commence soon, in accordance with the order of the Constitutional Court.
14.2 Dividend declared after the reporting date and not recognised as a liability A final dividend of R5 952 million (400 cents per ordinary share) for the year ended 31 March 2016, was
declared on 13 May 2016, payable on 27 June 2016 to shareholders recorded in the register at the close of business on 24 June 2016. The net dividend after taking into account dividend withholding tax for those shareholders not exempt from dividend withholding tax is 340.00000 cents per share.
Vodacom Group Limited Preliminary results for the year ended 31 March 2016
24
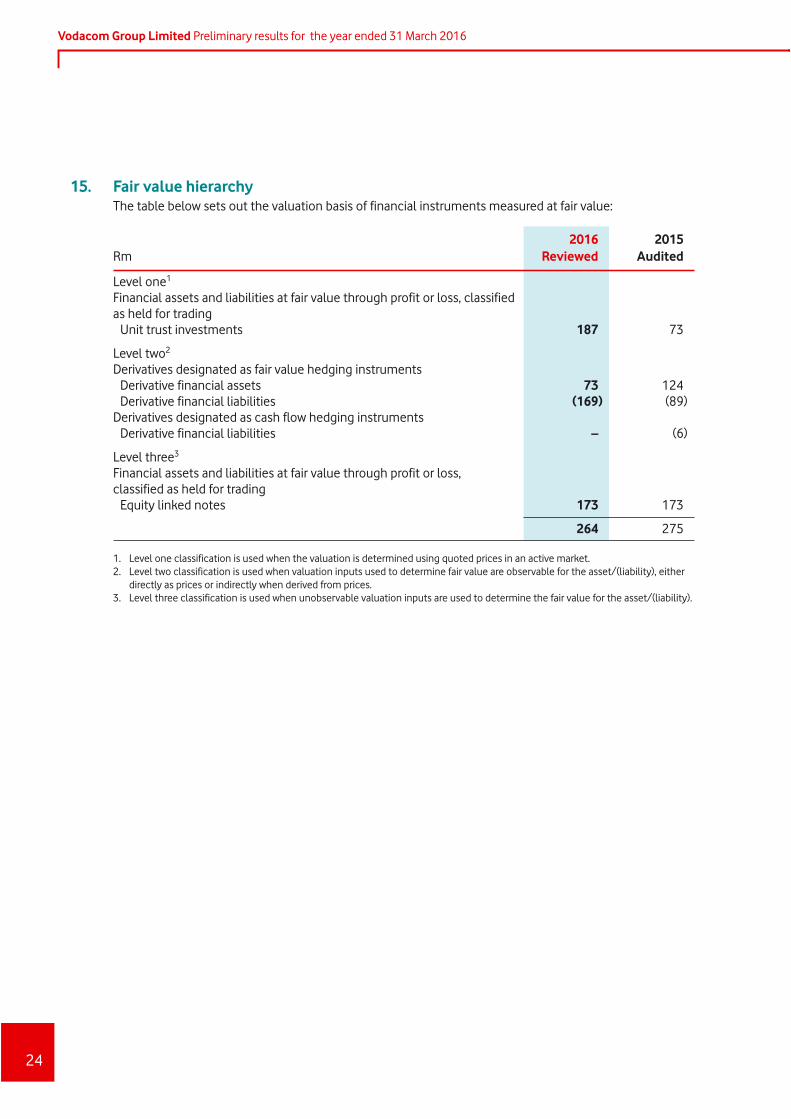
15. Fair value hierarchy The table below sets out the valuation basis of financial instruments measured at fair value:
Rm2016
Reviewed2015
Audited
Level one1 Financial assets and liabilities at fair value through profit or loss, classified as held for trading Unit trust investments 187 73
Level two2 Derivatives designated as fair value hedging instruments Derivative financial assets 73 124 Derivative financial liabilities (169) (89)Derivatives designated as cash flow hedging instruments Derivative financial liabilities – (6)
Level three3 Financial assets and liabilities at fair value through profit or loss, classified as held for trading Equity linked notes 173 173
264 275
1. Level one classification is used when the valuation is determined using quoted prices in an active market. 2. Level two classification is used when valuation inputs used to determine fair value are observable for the asset/(liability), either
directly as prices or indirectly when derived from prices. 3. Level three classification is used when unobservable valuation inputs are used to determine the fair value for the asset/(liability).
25
Supplementary information
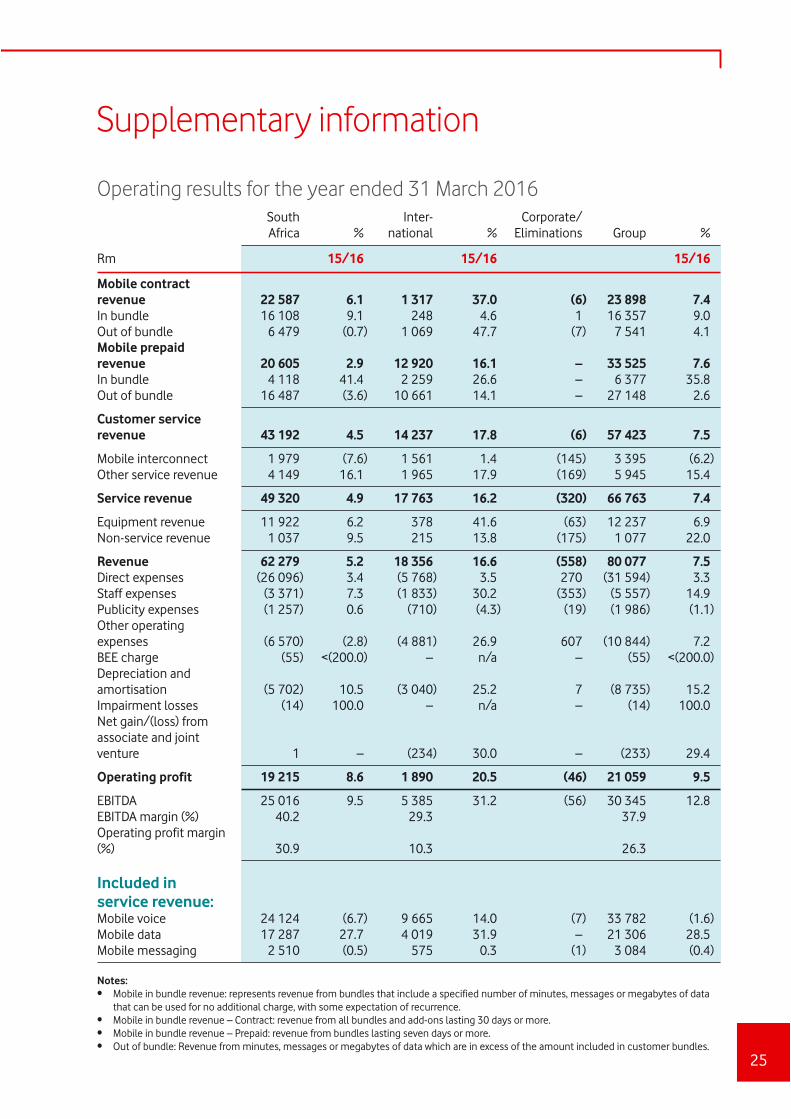
Operating results for the year ended 31 March 2016South Africa %
Inter-national %
Corporate/Eliminations Group %
Rm 15/16 15/16 15/16
Mobile contract revenue 22 587 6.1 1 317 37.0 (6) 23 898 7.4In bundle 16 108 9.1 248 4.6 1 16 357 9.0Out of bundle 6 479 (0.7) 1 069 47.7 (7) 7 541 4.1Mobile prepaid revenue 20 605 2.9 12 920 16.1 – 33 525 7.6In bundle 4 118 41.4 2 259 26.6 – 6 377 35.8Out of bundle 16 487 (3.6) 10 661 14.1 – 27 148 2.6
Customer service revenue 43 192 4.5 14 237 17.8 (6) 57 423 7.5
Mobile interconnect 1 979 (7.6) 1 561 1.4 (145) 3 395 (6.2)Other service revenue 4 149 16.1 1 965 17.9 (169) 5 945 15.4
Service revenue 49 320 4.9 17 763 16.2 (320) 66 763 7.4
Equipment revenue 11 922 6.2 378 41.6 (63) 12 237 6.9Non-service revenue 1 037 9.5 215 13.8 (175) 1 077 22.0
Revenue 62 279 5.2 18 356 16.6 (558) 80 077 7.5Direct expenses (26 096) 3.4 (5 768) 3.5 270 (31 594) 3.3Staff expenses (3 371) 7.3 (1 833) 30.2 (353) (5 557) 14.9Publicity expenses (1 257) 0.6 (710) (4.3) (19) (1 986) (1.1)Other operating expenses (6 570) (2.8) (4 881) 26.9 607 (10 844) 7.2BEE charge (55) <(200.0) – n/a – (55) <(200.0)Depreciation and amortisation (5 702) 10.5 (3 040) 25.2 7 (8 735) 15.2Impairment losses (14) 100.0 – n/a – (14) 100.0Net gain/(loss) from associate and joint venture 1 – (234) 30.0 – (233) 29.4
Operating profit 19 215 8.6 1 890 20.5 (46) 21 059 9.5
EBITDA 25 016 9.5 5 385 31.2 (56) 30 345 12.8EBITDA margin (%) 40.2 29.3 37.9Operating profit margin (%) 30.9 10.3 26.3
Included in service revenue:Mobile voice 24 124 (6.7) 9 665 14.0 (7) 33 782 (1.6)Mobile data 17 287 27.7 4 019 31.9 – 21 306 28.5Mobile messaging 2 510 (0.5) 575 0.3 (1) 3 084 (0.4)
Notes:• Mobile in bundle revenue: represents revenue from bundles that include a specified number of minutes, messages or megabytes of data
that can be used for no additional charge, with some expectation of recurrence.• Mobile in bundle revenue – Contract: revenue from all bundles and add-ons lasting 30 days or more.• Mobile in bundle revenue – Prepaid: revenue from bundles lasting seven days or more.• Out of bundle: Revenue from minutes, messages or megabytes of data which are in excess of the amount included in customer bundles.
Vodacom Group Limited Preliminary results for the year ended 31 March 2016
26
Supplementary information continued
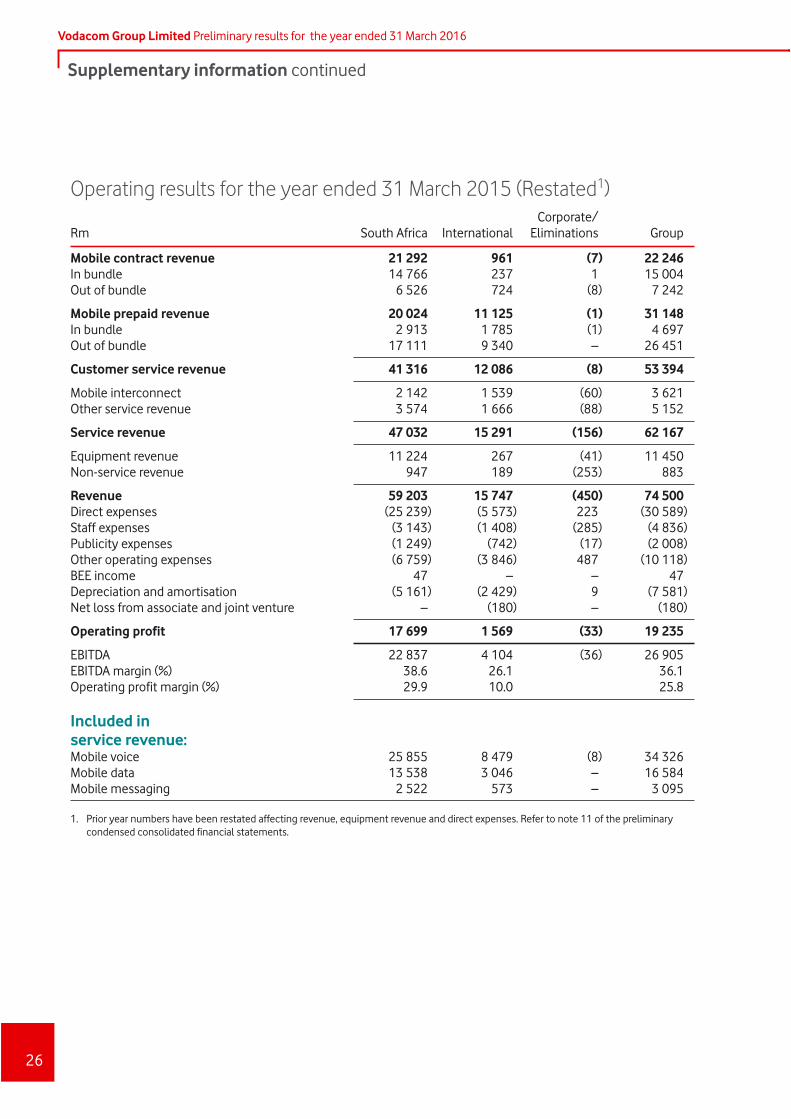
Operating results for the year ended 31 March 2015 (Restated1)
Rm South Africa InternationalCorporate/
Eliminations Group
Mobile contract revenue 21 292 961 (7) 22 246In bundle 14 766 237 1 15 004Out of bundle 6 526 724 (8) 7 242
Mobile prepaid revenue 20 024 11 125 (1) 31 148In bundle 2 913 1 785 (1) 4 697Out of bundle 17 111 9 340 – 26 451
Customer service revenue 41 316 12 086 (8) 53 394
Mobile interconnect 2 142 1 539 (60) 3 621Other service revenue 3 574 1 666 (88) 5 152
Service revenue 47 032 15 291 (156) 62 167
Equipment revenue 11 224 267 (41) 11 450Non-service revenue 947 189 (253) 883
Revenue 59 203 15 747 (450) 74 500Direct expenses (25 239) (5 573) 223 (30 589)Staff expenses (3 143) (1 408) (285) (4 836)Publicity expenses (1 249) (742) (17) (2 008)Other operating expenses (6 759) (3 846) 487 (10 118)BEE income 47 – – 47Depreciation and amortisation (5 161) (2 429) 9 (7 581)Net loss from associate and joint venture – (180) – (180)
Operating profit 17 699 1 569 (33) 19 235
EBITDA 22 837 4 104 (36) 26 905EBITDA margin (%) 38.6 26.1 36.1Operating profit margin (%) 29.9 10.0 25.8
Included in service revenue:Mobile voice 25 855 8 479 (8) 34 326Mobile data 13 538 3 046 – 16 584Mobile messaging 2 522 573 – 3 095
1. Prior year numbers have been restated affecting revenue, equipment revenue and direct expenses. Refer to note 11 of the preliminary condensed consolidated financial statements.
27
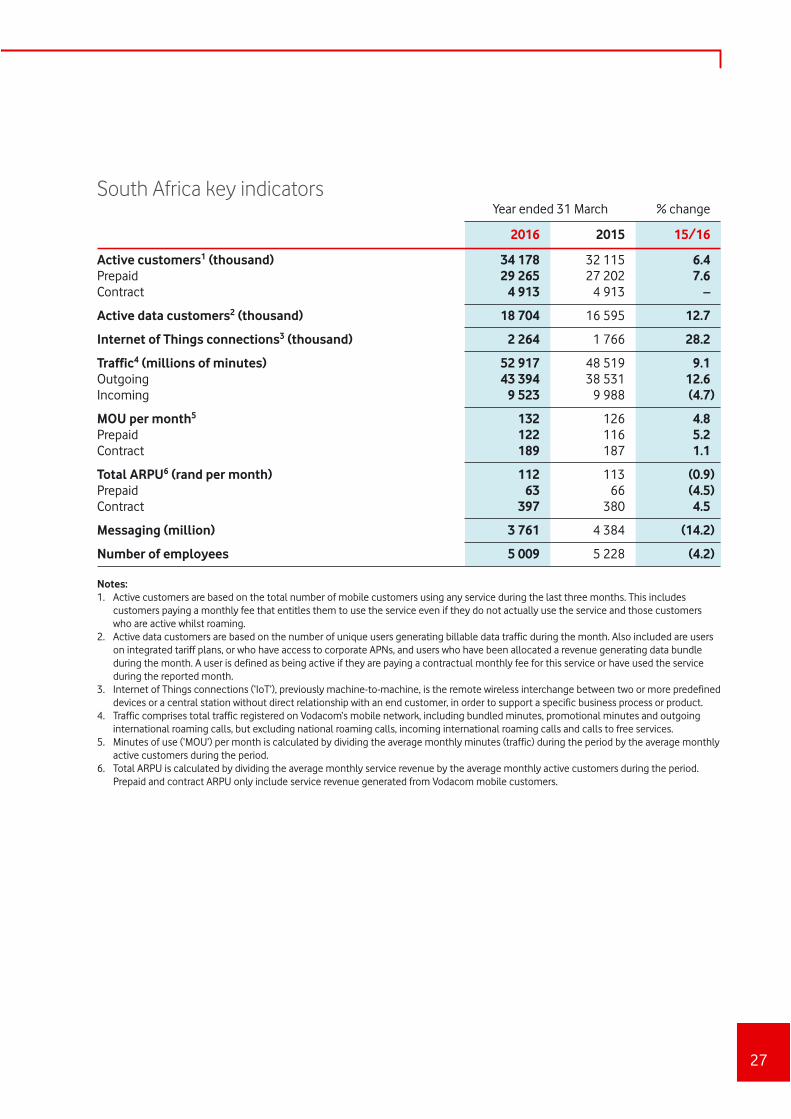
South Africa key indicatorsYear ended 31 March % change
2016 2015 15/16
Active customers1 (thousand) 34 178 32 115 6.4Prepaid 29 265 27 202 7.6Contract 4 913 4 913 –
Active data customers2 (thousand) 18 704 16 595 12.7
Internet of Things connections3 (thousand) 2 264 1 766 28.2
Traffic4 (millions of minutes) 52 917 48 519 9.1Outgoing 43 394 38 531 12.6Incoming 9 523 9 988 (4.7)
MOU per month5 132 126 4.8Prepaid 122 116 5.2Contract 189 187 1.1
Total ARPU6 (rand per month) 112 113 (0.9)Prepaid 63 66 (4.5)Contract 397 380 4.5
Messaging (million) 3 761 4 384 (14.2)
Number of employees 5 009 5 228 (4.2)
Notes:1. Active customers are based on the total number of mobile customers using any service during the last three months. This includes
customers paying a monthly fee that entitles them to use the service even if they do not actually use the service and those customers who are active whilst roaming.
2. Active data customers are based on the number of unique users generating billable data traffic during the month. Also included are users on integrated tariff plans, or who have access to corporate APNs, and users who have been allocated a revenue generating data bundle during the month. A user is defined as being active if they are paying a contractual monthly fee for this service or have used the service during the reported month.
3. Internet of Things connections (‘IoT’), previously machine-to-machine, is the remote wireless interchange between two or more predefined devices or a central station without direct relationship with an end customer, in order to support a specific business process or product.
4. Traffic comprises total traffic registered on Vodacom‘s mobile network, including bundled minutes, promotional minutes and outgoing international roaming calls, but excluding national roaming calls, incoming international roaming calls and calls to free services.
5. Minutes of use (‘MOU’) per month is calculated by dividing the average monthly minutes (traffic) during the period by the average monthly active customers during the period.
6. Total ARPU is calculated by dividing the average monthly service revenue by the average monthly active customers during the period. Prepaid and contract ARPU only include service revenue generated from Vodacom mobile customers.

Vodacom Group Limited Preliminary results for the year ended 31 March 2016
28
Supplementary information continued
International key indicatorsYear ended 31 March % change
2016 2015 15/16
Active customers1 (thousand) 27 127 29 533 (8.1)Tanzania 12 375 12 172 1.7DRC 8 527 11 216 (24.0)Mozambique 4 826 4 877 (1.0)Lesotho 1 399 1 268 10.3
Active data customers2 (thousand) 10 055 9 878 1.8Tanzania 5 415 5 265 2.8DRC 1 996 2 338 (14.6)Mozambique 2 112 1 879 12.4Lesotho 532 396 34.3
MOU per month3
Tanzania 124 149 (16.8)DRC 39 41 (4.9)Mozambique 104 113 (8.0)Lesotho 75 59 27.1
Total ARPU4 (rand per month)Tanzania 39 42 (7.1)DRC 42 32 31.3Mozambique 54 52 3.8Lesotho 62 53 17.0
Total ARPU4 (local currency per month)Tanzania (TZS) 5 972 6 530 (8.5)DRC (USD) 3.0 2.9 3.4Mozambique (MZN) 169 149 13.4
Number of employees 2 338 2 372 (1.4)
Notes:1. Active customers are based on the total number of mobile customers using any service during the last three months. This includes
customers paying a monthly fee that entitles them to use the service even if they do not actually use the service and those customers who are active whilst roaming.
2. Active data customers are based on the number of unique users generating billable data traffic during the month. Also included are users on integrated tariff plans, or who have access to corporate APNs, and users who have been allocated a revenue generating data bundle during the month. A user is defined as being active if they are paying a contractual monthly fee for this service or have used the service during the reported month.
3. Minutes of use (‘MOU’) per month is calculated by dividing the average monthly minutes (traffic) during the period by the average monthly active customers during the period.
4. Total ARPU is calculated by dividing the average monthly service revenue by the average monthly active customers during the period.
29
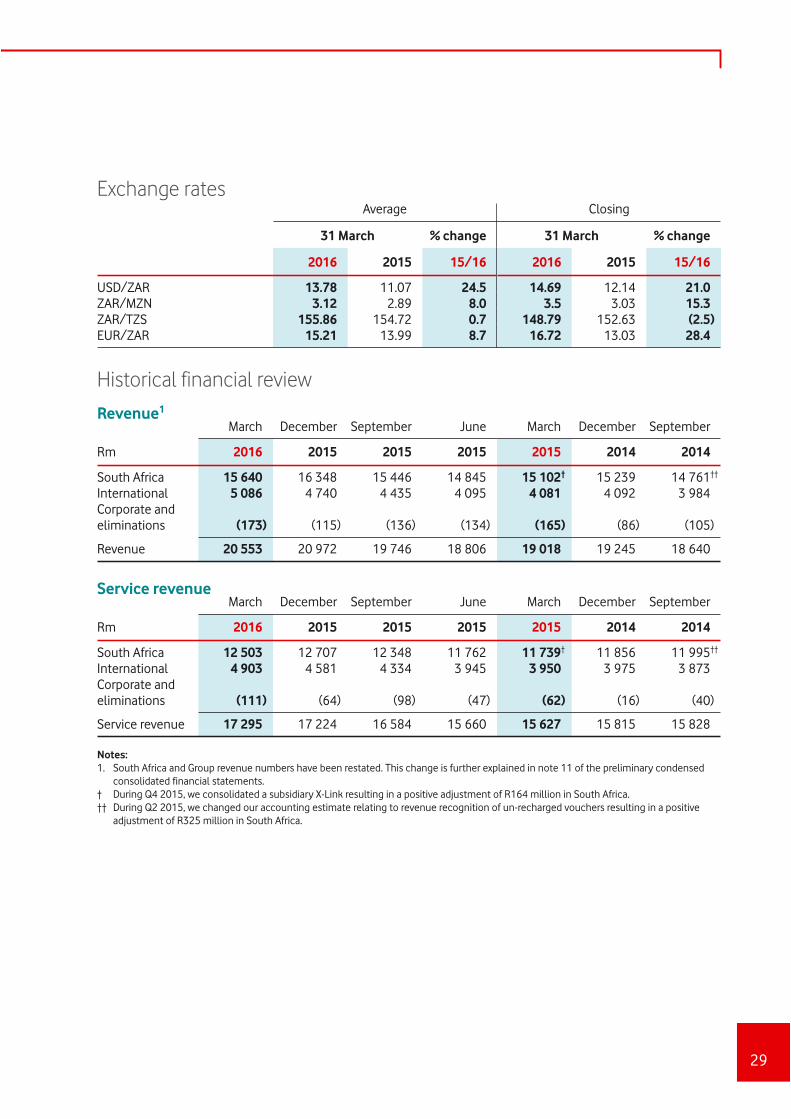
Exchange ratesAverage Closing
31 March % change 31 March % change
2016 2015 15/16 2016 2015 15/16
USD/ZAR 13.78 11.07 24.5 14.69 12.14 21.0ZAR/MZN 3.12 2.89 8.0 3.5 3.03 15.3ZAR/TZS 155.86 154.72 0.7 148.79 152.63 (2.5)EUR/ZAR 15.21 13.99 8.7 16.72 13.03 28.4
Historical financial review
Revenue1
Rm
March December September June March December September
2016 2015 2015 2015 2015 2014 2014
South Africa 15 640 16 348 15 446 14 845 15 102† 15 239 14 761††
International 5 086 4 740 4 435 4 095 4 081 4 092 3 984Corporate and eliminations (173) (115) (136) (134) (165) (86) (105)
Revenue 20 553 20 972 19 746 18 806 19 018 19 245 18 640
Service revenue
Rm
March December September June March December September
2016 2015 2015 2015 2015 2014 2014
South Africa 12 503 12 707 12 348 11 762 11 739† 11 856 11 995††
International 4 903 4 581 4 334 3 945 3 950 3 975 3 873Corporate and eliminations (111) (64) (98) (47) (62) (16) (40)
Service revenue 17 295 17 224 16 584 15 660 15 627 15 815 15 828
Notes:1. South Africa and Group revenue numbers have been restated. This change is further explained in note 11 of the preliminary condensed
consolidated financial statements. † During Q4 2015, we consolidated a subsidiary X-Link resulting in a positive adjustment of R164 million in South Africa.†† During Q2 2015, we changed our accounting estimate relating to revenue recognition of un-recharged vouchers resulting in a positive
adjustment of R325 million in South Africa.
Vodacom Group Limited Preliminary results for the year ended 31 March 2016
30
Supplementary information continued
Historical key indicators
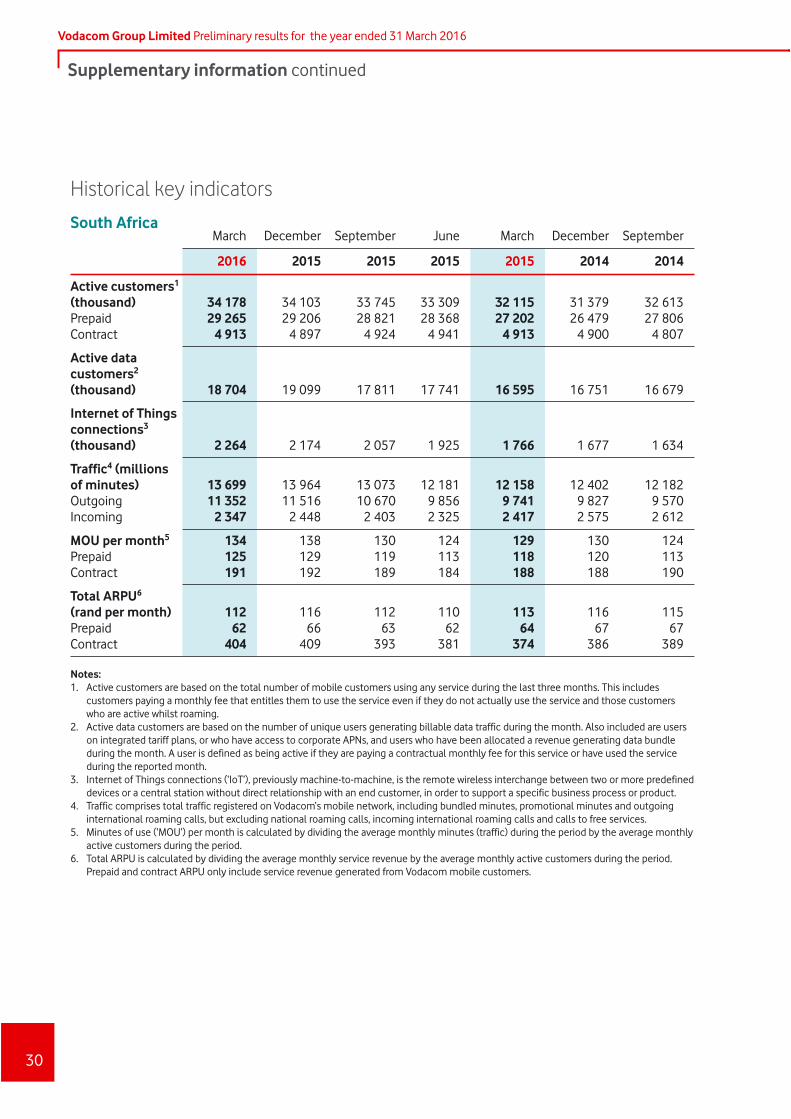
South AfricaMarch December September June March December September
2016 2015 2015 2015 2015 2014 2014
Active customers1 (thousand) 34 178 34 103 33 745 33 309 32 115 31 379 32 613Prepaid 29 265 29 206 28 821 28 368 27 202 26 479 27 806Contract 4 913 4 897 4 924 4 941 4 913 4 900 4 807
Active data customers2 (thousand) 18 704 19 099 17 811 17 741 16 595 16 751 16 679
Internet of Things connections3 (thousand) 2 264 2 174 2 057 1 925 1 766 1 677 1 634
Traffic4 (millions of minutes) 13 699 13 964 13 073 12 181 12 158 12 402 12 182Outgoing 11 352 11 516 10 670 9 856 9 741 9 827 9 570Incoming 2 347 2 448 2 403 2 325 2 417 2 575 2 612
MOU per month5 134 138 130 124 129 130 124Prepaid 125 129 119 113 118 120 113Contract 191 192 189 184 188 188 190
Total ARPU6
(rand per month) 112 116 112 110 113 116 115Prepaid 62 66 63 62 64 67 67Contract 404 409 393 381 374 386 389
Notes:1. Active customers are based on the total number of mobile customers using any service during the last three months. This includes
customers paying a monthly fee that entitles them to use the service even if they do not actually use the service and those customers who are active whilst roaming.
2. Active data customers are based on the number of unique users generating billable data traffic during the month. Also included are users on integrated tariff plans, or who have access to corporate APNs, and users who have been allocated a revenue generating data bundle during the month. A user is defined as being active if they are paying a contractual monthly fee for this service or have used the service during the reported month.
3. Internet of Things connections (‘IoT’), previously machine-to-machine, is the remote wireless interchange between two or more predefined devices or a central station without direct relationship with an end customer, in order to support a specific business process or product.
4. Traffic comprises total traffic registered on Vodacom‘s mobile network, including bundled minutes, promotional minutes and outgoing international roaming calls, but excluding national roaming calls, incoming international roaming calls and calls to free services.
5. Minutes of use (‘MOU’) per month is calculated by dividing the average monthly minutes (traffic) during the period by the average monthly active customers during the period.
6. Total ARPU is calculated by dividing the average monthly service revenue by the average monthly active customers during the period. Prepaid and contract ARPU only include service revenue generated from Vodacom mobile customers.
31
Historical key indicators
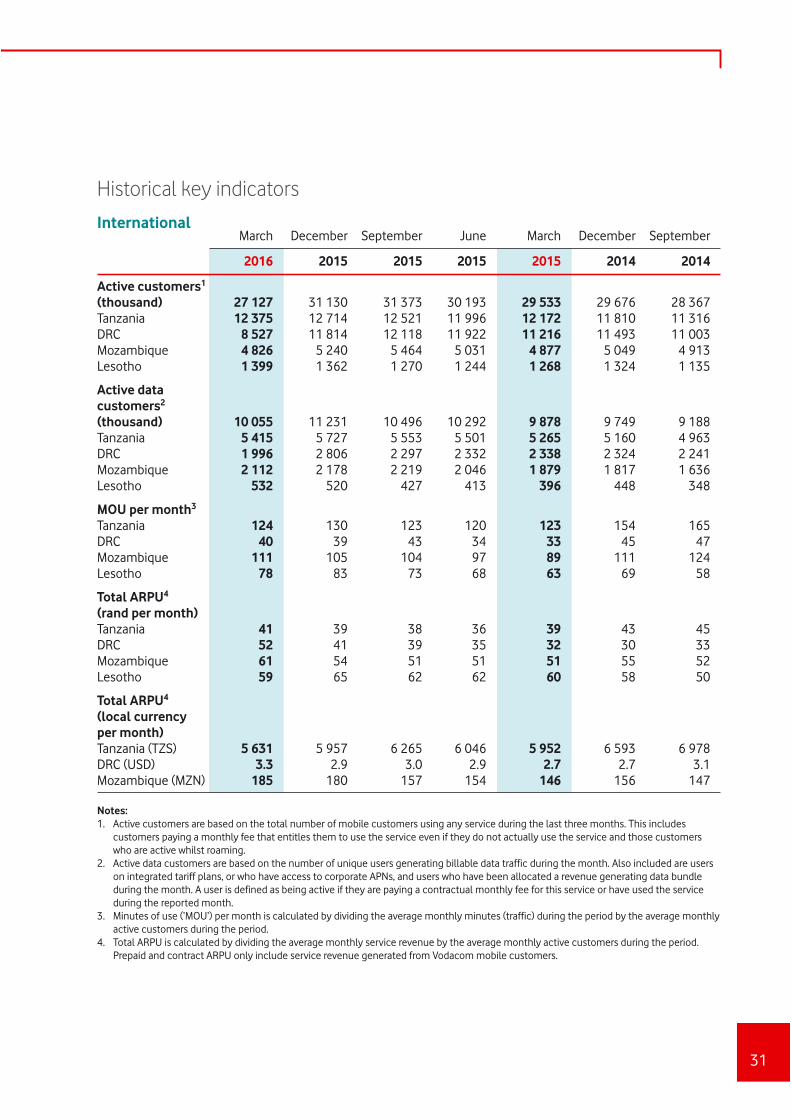
InternationalMarch December September June March December September
2016 2015 2015 2015 2015 2014 2014
Active customers1 (thousand) 27 127 31 130 31 373 30 193 29 533 29 676 28 367Tanzania 12 375 12 714 12 521 11 996 12 172 11 810 11 316DRC 8 527 11 814 12 118 11 922 11 216 11 493 11 003Mozambique 4 826 5 240 5 464 5 031 4 877 5 049 4 913Lesotho 1 399 1 362 1 270 1 244 1 268 1 324 1 135
Active data customers2
(thousand) 10 055 11 231 10 496 10 292 9 878 9 749 9 188Tanzania 5 415 5 727 5 553 5 501 5 265 5 160 4 963DRC 1 996 2 806 2 297 2 332 2 338 2 324 2 241Mozambique 2 112 2 178 2 219 2 046 1 879 1 817 1 636Lesotho 532 520 427 413 396 448 348
MOU per month3
Tanzania 124 130 123 120 123 154 165DRC 40 39 43 34 33 45 47Mozambique 111 105 104 97 89 111 124Lesotho 78 83 73 68 63 69 58
Total ARPU4 (rand per month)Tanzania 41 39 38 36 39 43 45DRC 52 41 39 35 32 30 33Mozambique 61 54 51 51 51 55 52Lesotho 59 65 62 62 60 58 50
Total ARPU4 (local currency per month)Tanzania (TZS) 5 631 5 957 6 265 6 046 5 952 6 593 6 978DRC (USD) 3.3 2.9 3.0 2.9 2.7 2.7 3.1Mozambique (MZN) 185 180 157 154 146 156 147
Notes:1. Active customers are based on the total number of mobile customers using any service during the last three months. This includes
customers paying a monthly fee that entitles them to use the service even if they do not actually use the service and those customers who are active whilst roaming.
2. Active data customers are based on the number of unique users generating billable data traffic during the month. Also included are users on integrated tariff plans, or who have access to corporate APNs, and users who have been allocated a revenue generating data bundle during the month. A user is defined as being active if they are paying a contractual monthly fee for this service or have used the service during the reported month.
3. Minutes of use (‘MOU’) per month is calculated by dividing the average monthly minutes (traffic) during the period by the average monthly active customers during the period.
4. Total ARPU is calculated by dividing the average monthly service revenue by the average monthly active customers during the period. Prepaid and contract ARPU only include service revenue generated from Vodacom mobile customers.
Vodacom Group Limited Preliminary results for the year ended 31 March 2016
32
Supplementary information continued
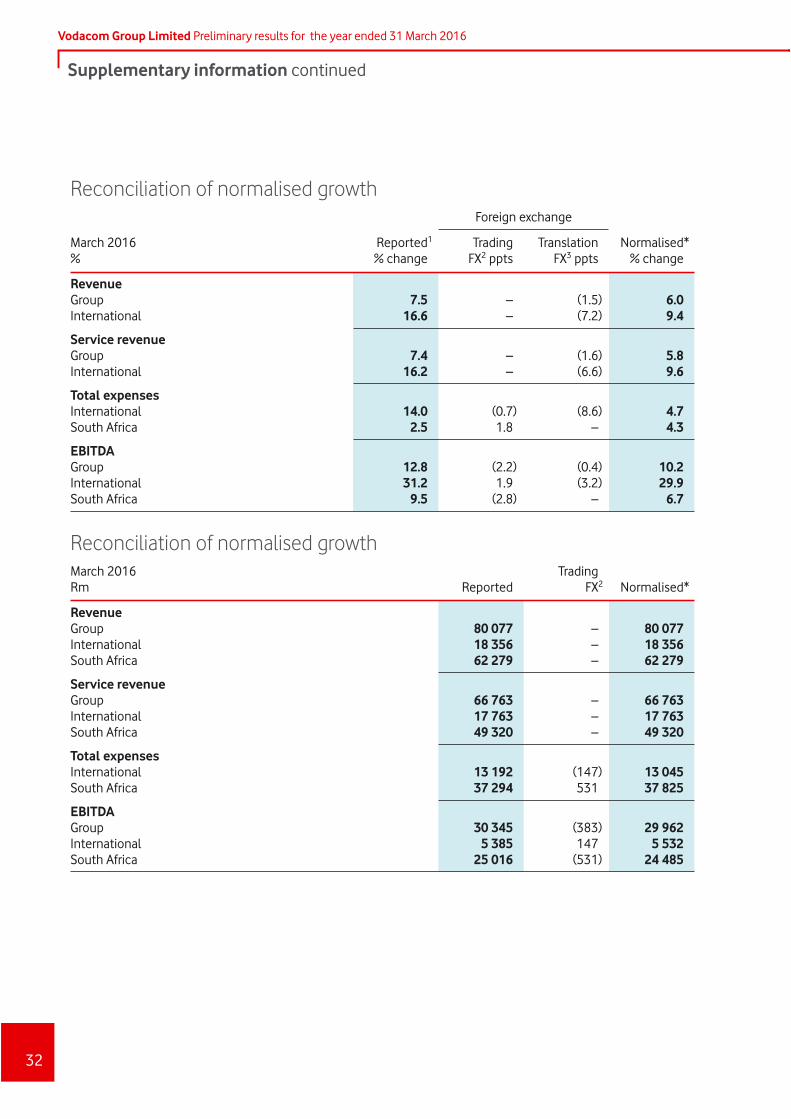
Reconciliation of normalised growthForeign exchange
March 2016%
Reported1
% changeTrading
FX2 pptsTranslation
FX3 pptsNormalised*
% change
RevenueGroup 7.5 – (1.5) 6.0International 16.6 – (7.2) 9.4
Service revenueGroup 7.4 – (1.6) 5.8International 16.2 – (6.6) 9.6
Total expensesInternational 14.0 (0.7) (8.6) 4.7South Africa 2.5 1.8 – 4.3
EBITDAGroup 12.8 (2.2) (0.4) 10.2International 31.2 1.9 (3.2) 29.9South Africa 9.5 (2.8) – 6.7
Reconciliation of normalised growthMarch 2016Rm Reported
Trading FX2 Normalised*
RevenueGroup 80 077 – 80 077International 18 356 – 18 356South Africa 62 279 – 62 279
Service revenueGroup 66 763 – 66 763International 17 763 – 17 763South Africa 49 320 – 49 320
Total expensesInternational 13 192 (147) 13 045South Africa 37 294 531 37 825
EBITDAGroup 30 345 (383) 29 962International 5 385 147 5 532South Africa 25 016 (531) 24 485
33
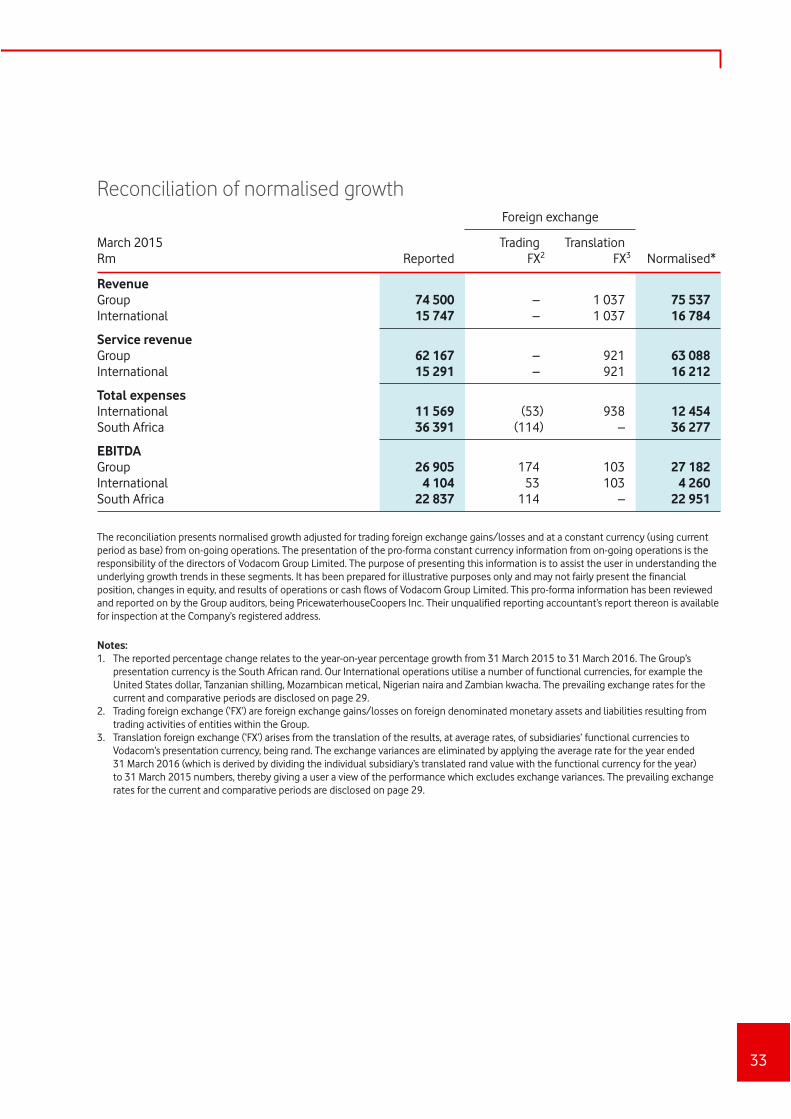
Reconciliation of normalised growthForeign exchange
March 2015Rm Reported
Trading FX2
Translation FX3 Normalised*
RevenueGroup 74 500 – 1 037 75 537International 15 747 – 1 037 16 784
Service revenueGroup 62 167 – 921 63 088International 15 291 – 921 16 212
Total expensesInternational 11 569 (53) 938 12 454South Africa 36 391 (114) – 36 277
EBITDAGroup 26 905 174 103 27 182International 4 104 53 103 4 260South Africa 22 837 114 – 22 951
The reconciliation presents normalised growth adjusted for trading foreign exchange gains/losses and at a constant currency (using current period as base) from on-going operations. The presentation of the pro-forma constant currency information from on-going operations is the responsibility of the directors of Vodacom Group Limited. The purpose of presenting this information is to assist the user in understanding the underlying growth trends in these segments. It has been prepared for illustrative purposes only and may not fairly present the financial position, changes in equity, and results of operations or cash flows of Vodacom Group Limited. This pro-forma information has been reviewed and reported on by the Group auditors, being PricewaterhouseCoopers Inc. Their unqualified reporting accountant’s report thereon is available for inspection at the Company’s registered address.
Notes:1. The reported percentage change relates to the year-on-year percentage growth from 31 March 2015 to 31 March 2016. The Group’s
presentation currency is the South African rand. Our International operations utilise a number of functional currencies, for example the United States dollar, Tanzanian shilling, Mozambican metical, Nigerian naira and Zambian kwacha. The prevailing exchange rates for the current and comparative periods are disclosed on page 29.
2. Trading foreign exchange (‘FX’) are foreign exchange gains/losses on foreign denominated monetary assets and liabilities resulting from trading activities of entities within the Group.
3. Translation foreign exchange (‘FX’) arises from the translation of the results, at average rates, of subsidiaries’ functional currencies to Vodacom’s presentation currency, being rand. The exchange variances are eliminated by applying the average rate for the year ended 31 March 2016 (which is derived by dividing the individual subsidiary’s translated rand value with the functional currency for the year) to 31 March 2015 numbers, thereby giving a user a view of the performance which excludes exchange variances. The prevailing exchange rates for the current and comparative periods are disclosed on page 29.
Vodacom Group Limited Preliminary results for the year ended 31 March 2016
34
Corporate information
Non-IFRS informationThe auditor’s report does not necessarily cover all of the information contained in this announcement. Shareholders are therefore advised that in order to obtain a full understanding of the nature of the auditor’s work they should obtain a copy of that report together with the accompanying financial information from the registered office of the company. This announcement contains certain non-IFRS financial measures which has not been reviewed or reported on by the Group’s auditors. The Group’s management believes these measures provide valuable additional information in understanding the performance of the Group or the Group’s businesses because they provide measures used by the Group to assess performance. However, this additional information presented is not uniformly defined by all companies, including those in the Group’s industry. Accordingly, it may not be comparable with similarly titled measures and disclosures by other companies. Additionally, although these measures are important in the management of the business, they should not be viewed in isolation or as replacements for or alternatives to, but rather as complementary to, the comparable IFRS measures. Refer to pages 5 to 7 for details relating to service revenue, EBITDA and headline earnings per share.
TrademarksVodafone, the Vodafone logo, Vodafone Mobile Broadband, Vodafone WebBox, Vodafone Passport, Vodafone live!, Power to You, Vodacom, Vodacom M-Pesa, Vodacom Millionaires, Vodacom 4 Less and Vodacom Change the World are trademarks of Vodafone Group Plc (or have applications pending). Other product and company names mentioned herein may be the trademarks of their respective owners.
Forward-looking statementsThis announcement which sets out the annual results for Vodacom Group Limited for the year ended 31 March 2016 contains ‘forward-looking statements’, which have not been reviewed or reported on by the Group’s auditors, with respect to the Group’s financial condition, results of operations and businesses and certain of the Group’s plans and objectives. In particular, such forward-looking statements include statements relating to: the Group’s future performance; future capital expenditures, acquisitions, divestitures, expenses, revenues, financial conditions, dividend policy, and future prospects; business and management strategies relating to the expansion and growth of the Group; the effects of regulation of the Group’s businesses by governments in the countries in which it operates; the Group’s expectations as to the launch and roll out dates for products, services or technologies; expectations regarding the operating environment and market conditions; growth in customers and usage; and the rate of dividend growth by the Group.
Forward-looking statements are sometimes, but not always, identified by their use of a date in the future or such words as ‘will’, ‘anticipates’, ‘aims’, ‘could’, ‘may’, ‘should’, ‘expects’, ‘believes’, ‘intends’, ‘plans’ or ‘targets’. By their nature, forward-looking statements are inherently predictive, speculative and involve risk and uncertainty because they relate to events and depend on circumstances that will occur in the future, involve known and unknown risks, uncertainties and other facts or factors which may cause the actual results, performance or achievements of the Group, or its industry to be materially different from any results, performance or achievement expressed or implied by such forward-looking statements. Forward-looking statements are not guarantees of future performance and are based on assumptions regarding the Group’s present and future business strategies and the environments in which it operates now and in the future.
Vodacom Group Limited(Incorporated in the Republic of South Africa)Registration number: 1993/005461/06(ISIN: ZAE000132577 Share Code: VOD)(ISIN: US92858D2009 ADR code: VDMCY)(‘Vodacom’)
DirectorsMP Moyo (Chairman), MS Aziz Joosub (CEO), T Streichert (CFO)1, DH Brown, M Joseph2, BP Mabelane, TM Mokgosi-Mwantembe, PJ Moleketi, JWL Otty3, M Pieters4, RAW Schellekens4, S Timuray5
1. German 2. American 3. British 4. Dutch 5. Turkish
Company secretary SF Linford
Registered officeVodacom Corporate Park,082 Vodacom Boulevard,Midrand 1685(Private Bag X9904, Sandton 2146)
Transfer secretaryComputershare Proprietary Limited(Registration number: 2000/006082/07)70 Marshall Street, Johannesburg 2001(PO Box 61051, Marshalltown 2107)
SponsorUBS South Africa (Pty) Limited
ADR depository bankDeutsche Bank Trust Company Americas
Media relationsByron Kennedy
Investor relationsShaun van Biljon
