vodacom group limited interim results€¦ · m-pesa’s promise of delivering financial...
TRANSCRIPT

The future is exciting.
Ready?
Vodacom Group Limited
Interim results for the six months ended 30 September 2019
In South Africa, an increase in data usage, following sustained efforts to reduce data prices and the onboarding of our new roaming partner in the second quarter, more than offset the service revenue decline reported in the first three months of the financial year. On a like-for-like basis, this resulted in service revenue growth of 1.5% during the half year, despite ongoing economic pressures and the implementation of the End-User and Subscriber Service Charter regulations.
Having announced sharp reductions in out-of-bundle tariffs by up to 70% in March, we continue to drive down the cost to communicate through various initiatives. These include the recent introduction of a Vodacom-branded 4G smart feature phone priced at just R299, and reducing the price of 1GB of data valid for 30 days from R149 to R99 for users of Vodapay and the MyVodacom App.
Ongoing initiatives to enhance customer experience through pricing transformation, modernisation of IT systems and sustained investment in network infrastructure, continue to pay dividends. This is evidenced by the additional 691 000 customers who joined Vodacom in the period. There are now 43.9 million customers connected through South Africa’s leading network each enjoying access to a wide array of financial and digital services.
Measures to introduce “one more service” to customers, as part of our strategy to build diverse revenue streams, are quickly gathering momentum. Revenue from our Financial Services business jumped by 37.1% to almost one billion rand, as Airtime Advance, insurance and our recently launched VodaPay service all gained in popularity. More than one million people have made video-on-demand purchases, while our music, sports, games and other video services – all in their infancy phase – are contributing to solid growth in our digital services business.
Our International portfolio remains a star performer, growing service revenue by 15.5% in a period characterised by macro and political stability and high demand for data and M-Pesa services in each
operation. We connected an additional 2.0 million customers, boosting the total to 36.6 million customers outside South Africa and Safaricom.
M-Pesa customers in our International markets now process more than US$2.8 billion a month in transactions through the service, underpinning M-Pesa’s promise of delivering financial inclusivity and positively contributing to economic growth in countries where it has become ubiquitous. Initiatives to further expand the M-Pesa ecosystem contributed to the 797 000 increase in customers, up to 14.3 million.
Our strategic investment in Safaricom continues to perform in line with our expectations having reported strong interim results at the beginning of November. They reported a 5.3% rise in service revenue growth, largely on the back of an 18.2% increase in revenue from M-Pesa and an overall increase in market share for the first time since 2017. Safaricom continues to invest significantly in its network and infrastructure while accelerating its pricing transformation strategy.
Looking ahead, we expect the benefits from our acquisition of a strategic stake in IoT.nxt1 will become increasingly evident in both our Consumer and Enterprise businesses. The same can be said for the other partnerships we have put in place in recent times, including our agreement with Amazon Web Services (AWS), to ensure we bring best-in-class services and products to customers right across the Group.
We will also expand M-Pesa internationally and our Financial Services and Digital Lifestyle businesses in South Africa with the expectation that these will increasingly contribute to revenue growth.
In South Africa, a key focus remains on the policy and regulatory environment where we will continue to participate in the various processes currently underway to assign available high-demand spectrum. While we have made significant progress in our pricing transformation journey, spectrum availability is a key lever to accelerating data price declines.
Following last year’s substantial investment in South Africa’s largest-ever Broad-Based Black Economic Empowerment transaction in the telecommunication sector, this year Vodacom Group posted an 18.9% increase in headline earnings per share to 460c and returning a dividend of 440cps to shareholders. Other key highlights include an improved second quarter performance in South Africa and the sustained growth of our International businesses.
Vodacom Group CEO commented:Shameel Joosub
1. The Group acquired a 51% equity interest in 10T Holdings (Pty) Limited and IoT.nxt B.V. (together “IoT.nxt”). The effective date of acquisition was 23 August 2019. Refer to note 8 in the condensed consolidated interim financial statements.
1
Vodacom Group Limited Interim results for the six months ended 30 September 2019
Notes: Certain financial information presented in this results announcement constitutes pro-forma financial information in terms of the JSE Listings Requirements. The applicable criteria on the basis of which this pro-forma financial information has been prepared is set out in the supplementary information on pages 49 to 53. The pro-forma financial information includes: • Normalised growth, which presents performance on a comparable basis. This excludes merger and acquisition activity where applicable
and adjusting for trading foreign exchange, foreign currency fluctuation on a constant currency basis (using the current year as base) and IFRS 16 related adjustments, to show a like-for-like comparison of results.
The pro-forma financial information has not been reported on by the Group external auditors.Amounts marked with an * in this document, represents normalised growth as defined above.All growth rates quoted are year-on-year and refer to the six months ended 30 September 2019 compared to the six months ended 30 September 2018, unless stated otherwise.
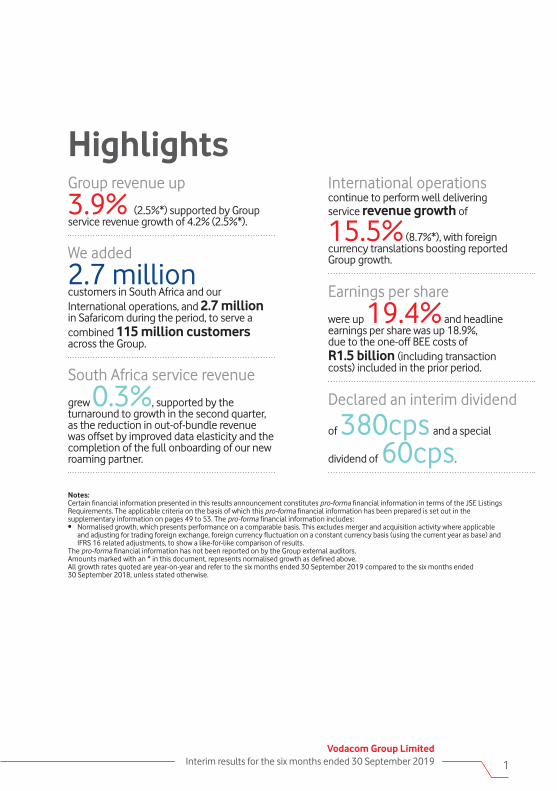
HighlightsGroup revenue up
3.9% (2.5%*) supported by Group service revenue growth of 4.2% (2.5%*).
Earnings per share
were up 19.4% and headline earnings per share was up 18.9%, due to the one-off BEE costs of R1.5 billion (including transaction costs) included in the prior period.
Declared an interim dividend
of 380cps and a special
dividend of 60cps.
We added
2.7 million customers in South Africa and our International operations, and 2.7 million in Safaricom during the period, to serve a combined 115 million customers across the Group.
South Africa service revenue
grew 0.3%, supported by the turnaround to growth in the second quarter, as the reduction in out-of-bundle revenue was offset by improved data elasticity and the completion of the full onboarding of our new roaming partner.
International operationscontinue to perform well delivering service revenue growth of
15.5% (8.7%*), with foreign currency translations boosting reported Group growth.

Highlights continued
Statutory performance measuresSix months ended
30 September % change
Rm2019
IFRS 162018
IAS 17 Reported Normalised*
Revenue 44 389 42 707 3.9 2.5Net profit from associate and joint venture 1 673 1 345 24.4Operating profit 12 883 11 106 16.0 1.2Net profit 8 199 6 789 20.8Earnings per share (EPS) (cents) 461 386 19.4Headline earnings per share (HEPS) (cents) 460 387 18.9Interim dividend per share (cents) 380 395 (3.8)Special dividend per share (cents) 60 – n/a
Alternative performance measuresSix months ended
30 September % change
Rm2019
IFRS 162018
IAS 17 Reported Normalised*
Service revenue 36 003 34 552 4.2 2.5EBITDA 18 166 16 534 9.9 0.7EBITDA-aL 16 203 n/a n/aCapital expenditure 6 349 5 334 19.0Operating free cash flow 7 476 7 074 5.7Free cash flow 2 749 2 486 10.6
Note with regard to the adoption of IFRS 16IFRS 16 was adopted by the Group on 1 April 2019 with the cumulative retrospective impact reflected as an adjustment to equity on the date of adoption. As a result, information presented for the six months ended 30 September 2018 is presented under the previous statement IAS 17, while the period ended 30 September 2019 is presented in accordance with IFRS 16. The reported change reflected in this document is done on this basis while normalised growth adjusts for differences in reporting of the current year and the prior year, to give the reader a like-for-like comparison of underlying performance.
2

3
Vodacom Group Limited Interim results for the six months ended 30 September 2019
Operating review
South AfricaService revenue increased 0.3% (Q1: -1.2%; Q2: +1.8%). Excluding the one-off benefit of R292 million from the change in revenue deferral methodology1 in the prior year, underlying growth was 1.5% for the first half of the year and 4.2% for the second quarter. We delivered positive growth in the second quarter as the expected uptick in data usage began offsetting the drag from the implementation of the End-User and Subscriber Service Charter regulations. This was further supported by the transition between roaming partners at the beginning of the quarter, boosting other service revenue. This service revenue growth was attained despite a continued weak economic environment that is weighing on consumer spending.
Revenue increased 0.8% in the first half of the year (Q1: 0.3%; Q2: 1.2%), growing faster than service revenue due to an increase in tower sharing revenue with other operators. Excluding the one-off adjustments,1,2 underlying growth was 2.2%.
Contract customer revenue declined 2.5%. Excluding the prior year’s revenue deferral impact1, contract customer revenue increased 0.3%, with significant improvement in the second quarter with growth of 4.2%. Contract ARPU declined 10.5%, or 8.1% excluding the prior year’s revenue deferral impact1. The 5.0% (Q1: -11.0%) decline in the second quarter, reflected a strong improvement in trend, despite the out-of-bundle revenue reduction, which we expect will continue for the remainder of the year. We added 192 000 customers in the first half of the year, with better growth coming through in the second quarter, reflecting the positive benefits of our pricing transformation.
Prepaid customer revenue declined 2.1% as a result of the 60% decline in out-of-bundle data revenue. The rate of decline in the second quarter reduced as a result of greater consumption of our competitive hourly, daily and weekly bundles. We added 499 000 prepaid customers in the first half of the year. During the period we enhanced our highly successful Power Hour product to include WhatsApp data, which contributed to our competitiveness.
Data traffic increased 54.6%, with data bundle purchases increasing 7.9% to 472 million. This is evidence of the value of our pricing transformation, contributing to stronger data traffic growth in the second quarter as customers benefit from lower pricing. We added 1.5 million data customers, with 4G customers increasing 28.8% to 11.0 million. The number of 4G devices on our network increased 25.9%, while the average usage per smart device increased 53.5% to 1.3GB.
Our digital services in video, music, sports and gaming are providing customers with more reasons to consume data as we increase engagement through our strategy of “one more service” to the customer. We have over 1 million customers engaged on our video platform, with 14.8 million daily, weekly and monthly subscriptions over the last six months.
We have made good progress in our fibre roll out, increasing the number of homes connected by 120.9% to 43 000.
Enterprise service revenue increased 2.8%, driven by the strong growth in national roaming revenue as Telkom fully transitioned to our network, offsetting the decline in mobile customer revenue from the reduction in out-of-bundle spend. Improved usage in this segment has also seen the rate of decline in mobile revenue halving during the second quarter. Fixed-line revenue increased 11.1%, supported by strong growth in cloud and hosting and connectivity revenue. IoT connections increased 14.2% to 4.6 million.
Our strategic focus on financial services supported strong performance, growing revenue by 37.1% to R972 million. We advanced R4.9 billion in airtime via our Airtime Advance platform to 9.9 million customers. Insurance revenue increased 21.8%, driven by the launch of innovative products. We continue to expand on our financial services offerings; in June 2019, we launched VodaPay, enabling direct airtime purchases and bill payments for electricity and other payments.
1. R292 million revenue deferral release in the prior year.2. During the period we refined our IFRS 15 model to more accurately reflect contract performance obligations. This impacted a small
number of contracts for which a R177 million negative adjustment to equipment revenue relating to prior years was made during the period.

Operating review continued
On a normalised basis, EBITDA declined 3.9%*. This includes a one-off revenue deferral release benefit in the prior year of R292 million, the impacts of Rain roaming costs as we continue to scale up our roaming agreement, BEE staff expense of R113 million and an adjustment relating to refining the IFRS 15 model1 of R177 million, when excluded underlying growth was 0.6%. EBITDA growth was achieved by managing our cost growth successfully under our ‘Fit for growth’ programme. Underlying costs grew by 1.9% for the period when excluding the BEE staff costs and Rain roaming impacts, with savings materialising from our cost programme and digitising and automating an increasing number of business processes.
Our capital expenditure of R4.8 billion was utilised to modernise the network, increase high capacity backhaul fibre and microwave and further enhance our IT systems as part of our focus on becoming smarter and more agile in delivering products and services to our customers.
InternationalOur International operations performed well, as successful execution of our strategic priorities contributed to double digit service revenue growth of 15.5% (8.7%*). The growth was a result of strong demand for data and M-Pesa services in all our operations. Macro and political environments have remained stable in all our markets. International operations now contribute 29.9% (2018: 27.0%) to Group service revenue.
We continue to see good customer growth, adding 2.0 million customers in the first half, up 5.4% to 36.6 million customers.
We added 2.0 million data customers, as we accelerated our rollout of 4G and increased the availability of affordable data devices across all of our operations. Data usage per customer grew in all markets as we drove usage through our personalised ‘Just 4 You’ product offers.
M-Pesa continues to deliver on its promise of delivering financial inclusion, empowering customers to transact easily and contributing to economic growth. M-Pesa revenue grew by 37.4% (28.9%*) to R1.9 billion, contributing 18.0% to service revenue. We added 797 000 new customers growing the base to 14.3 million2, up 8.5%. This equates to 39.1% of our customer base now using this service, processing US$2.8 billion in transactions a month in the period. We continue to expand our services in the ecosystem, such as micro-loans, merchant payments and further interconnection with banks and other operators. We have seen very good traction in our recently launched overdraft product known as ‘Songesha’, with 1.9 million customers utilising the service. This service enables customers to continue to transact in periods where they run out of money in between deposits. We launched a number of initiatives during the year to drive the uptake of the M-Pesa in all operations and improve monetisation.
EBITDA grew 15.4%*. Underlying margins improved by 2.2ppts, as a result of strong revenue growth and efforts to minimise cost growth through our ‘Fit for growth’ programme. A 2G licence penalty in DRC3 impacted growth by 2.6ppts.
We invested R1.6 billion in rolling out 4G services, improving capacity and widening our network reach and quality. We added 590 4G sites and 218 3G sites.
The Group has acquired all of our local partner Mirambo Limited’s 588 million shares in Vodacom Tanzania. This has resulted in the Group increasing its total interest in Vodacom Tanzania from 61.6% to 75.0%.
1. During the period we refined our IFRS 15 model to more accurately reflect contract performance obligations. This impacted a small number of contracts for which a R177 million negative adjustment to equipment revenue relating to prior years was made during the period.
2. 90-day active customers were 18.5 million.3. Vodacom Congo resolved a long standing dispute over a claim that its 2G licence was not properly renewed. Vodacom Congo paid
US$6.9 million in penalties and administrative costs in return for the extension of our licence by an additional 10 years.
4

5
Vodacom Group Limited Interim results for the six months ended 30 September 2019
SafaricomSafaricom continues to post solid growth with net income increasing 14.4%1. The recovery in the growth of the customer base continued into the first half of this year with customers growing 15.5% to 34.6 million. M-Pesa continues to perform strongly, growing at 18.2% despite a slow-down in the gaming (online betting) industry. M-Pesa now contributes 33.8% to service revenue, an increase of nearly 2.5ppts since FY19. M-Pesa customers grew 12.4% to 23.6 million. Data revenue performance remained subdued in the period, growing at 3.5%, with growth for the month of September above 10% as it lapped the price adjustments from the prior year. Data customers grew 14.8% to 20.2 million, while usage increased 43.6% to an average of 919MB per customer per month. Investment in capital expenditure was KSh18.1 billion in the period, an increase of 6.7% driven by accelerated 4G rollout. 4G sites increased 49.7% with coverage now at 63% of the population.
These results are available on www.safaricom.co.ke/investor-relation/financials/reports/financial-results.
Regulatory mattersPolicy on high demand spectrum and Policy directionThe policy on high demand spectrum (HDS) and Policy direction on the licensing of a wireless open access network (WOAN) was gazetted in July 2019. The Ministry of Telecommunications and Postal services highlighted the negative impacts from the lack of spectrum and proposed a shared approach to maximise the socioeconomic benefits derived from spectrum. The policy recommends that HDS be assigned to the WOAN and HDS assigned to other Electronic Communications Network Service (ECNS) licensees subject to commitments to the WOAN. Under the Policy direction, ICASA is directed to issue an Invitation to Apply (ITA) and consider applications for an individual ECNS licence for the WOAN. ICASA issued an Information Memorandum (IM) on 1 November 2019. The IM sets out ICASA’s proposal requirements, options for spectrum allotments, obligations and other consideration for assignment of HDS. Interested parties are invited to make proposals and recommendations on a number of aspects including the option for spectrum allocation, obligations, process and other requirements by 31 January 2020.
Competition Commission data service market inquiryThe Competition Commission initiated a market inquiry into data services on 30 November 2017. The purpose of the inquiry is to understand what factors or features of the market or markets and value chain may cause or lead to high prices for data services, and to make recommendations that would result in lower prices for data services. This inquiry covers all market participants involved at any point in the value chain for any form of data services that are provided to customers such as government, businesses and consumers in South Africa. The Competition Commission issued provisional findings and recommendations on 24 April 2019. Vodacom submitted comments to these findings and recommendations on 14 June 2019. This submission reflects on a wide range of pricing strategies to ensure that services are accessible by all (including low-income households); the impact on costs as a result of the lack of spectrum; and the level of competition across markets. The submission also included updated information on outdated pricing and facts used in the preliminary report. The Competition Commission indicated that the target date for completion of the report is before 31 December 2019. We anticipate that the findings from the data service market inquiry will be used as input into ICASA’s inquiry into mobile broadband services.
1. Growth is based on an IAS 17 basis both years as reported by Safaricom.

Operating review continued
ICASA inquiry into mobile broadband servicesOn 16 November 2018, ICASA gave notice of its intention to conduct an inquiry into mobile broadband services. The purpose of the inquiry is to assess the state of competition, and to determine whether there are markets or market segments within the mobile broadband services value chain that may require regulatory intervention in terms of Chapter 10 to the Electronic Communications Act. The inquiry consist of six phases:
• Phase 1–Commencement of the inquiry• Phase 2–Discussion Document• Phase 3–Public hearings on the Discussion Document• Phase 4–Findings document and draft regulations• Phase 5–Public hearings• Phase 6–Final regulations and the reasons document
ICASA has completed Phase 1. It is expected that ICASA will publish the Phase 2 Discussion Document for comment in the fourth calendar quarter of 2019. ICASA aims to finalise the process by the second calendar quarter of 2020.
Tanzania customer registrationThe Tanzania Telecommunication Authority (TCRA) directed biometric registration of customers using national identification cards to commence on 1 May 2019. Vodacom Tanzania PLC in alignment with the industry has continuously engaged with the TCRA to ensure compliance. The implementation of biometric registration will be challenging given the low penetration of national identification cards, the associated cost as well as the ambitious deadline of 31 December 2019 set by the regulator. We are taking all the reasonable necessary measures to ensure compliance.
OutlookIn South Africa, we have made considerable progress over the past two years in transforming pricing in the provisioning of data services. This included introducing much more affordable bundles with varying validity periods, providing greater value in our integrated price plans, lowering pricing on larger bundles by leveraging our Rain roaming agreement and more recently reducing pricing on monthly bundles. These efforts will further support the ever increasing data and connectivity demands of customers, increasingly offsetting the negative effects from lower out-of-bundle revenue, and positioning us for improved growth during the year.
We have re-invigorated our digital and financial services platform around the motto of “one more service”, with the aim of providing customers with more services, through these platforms. We are making good progress, with rapid uptake of our digital services. We continue to expand our financial services proposition in South Africa, as well as M-Pesa mobile money in Safaricom and our International operations.
Enterprise solutions are becoming increasingly competitive, while our partnerships with AWS and new service offerings support future growth.
Regulatory, macro and political scenarios in our International operations remain stable and hence we expect strong growth to continue in these markets. Demand for data and M-Pesa services remains strong, underpinning our strategy for financial and digital inclusion. We are monitoring the progress of registering customers in Tanzania, which could potentially impact growth in this market in the short term.
With the above in mind, we re-affirm our medium targets of:
1. Mid-single digit Group service revenue growth2. Mid-high single digit Group operating profit growth (including profit from associate – Safaricom)3. 13.0% – 14.5% of Group capital expenditure as a % of Group revenue.
These targets are on average, over the next three years, and are on a reported basis in constant currency, excluding spectrum purchases, exceptional items and any merger and acquisition activity.
6
7
Vodacom Group Limited Interim results for the six months ended 30 September 2019
Financial review
Summary financial informationSix months ended
30 September % change
Rm2019
IFRS 162018
IAS 17 Reported Normalised*
Revenue 44 389 42 707 3.9 2.5Service revenue 36 003 34 552 4.2 2.5EBITDA 18 166 16 534 9.9 0.7EBITDA-aL 16 203 n/a n/aNet profit from associate and joint venture 1 673 1 345 24.4Operating profit 12 883 11 106 16.0 1.2Net profit 8 199 6 789 20.8Capital expenditure 6 349 5 334 19.0Operating free cash flow 7 476 7 074 5.7Free cash flow 2 749 2 486 10.6Net debt 41 357 28 621 44.5Basic earnings per share (cents) 461 386 19.4Headline earnings per share (cents) 460 387 18.9
Contribution margin (%) 63.6 64.1 (0.5ppt)EBITDA margin (%) 40.9 38.7 2.2pptEBITDA-aL margin (%) 36.5 n/a n/aOperating profit margin (%) 29.0 26.0 3.0pptEffective tax rate (%) 27.3 33.1 (5.8ppt)Net profit margin (%) 18.5 15.9 2.6pptCapital intensity (%) 14.3 12.5 1.8pptNet debt/EBITDA (times) 1.1 0.9 0.2ppt
Service revenueSix months ended
30 September % change
Rm2019
IFRS 162018
IAS 17 Reported Normalised*
South Africa 25 797 25 721 0.3 0.3International 10 780 9 332 15.5 8.7Corporate and eliminations (574) (501) 14.6 14.6
Group service revenue 36 003 34 552 4.2 2.5
Safaricom1 17 650 15 680 12.6 5.3
1. The Group’s effective interest of 34.94% in Safaricom Plc (Safaricom) is accounted for as an investment in associate. Results represent 100% of Safaricom and is for information purposes only.

1. Excluding depreciation, amortisation, impairments and share based payment charges.
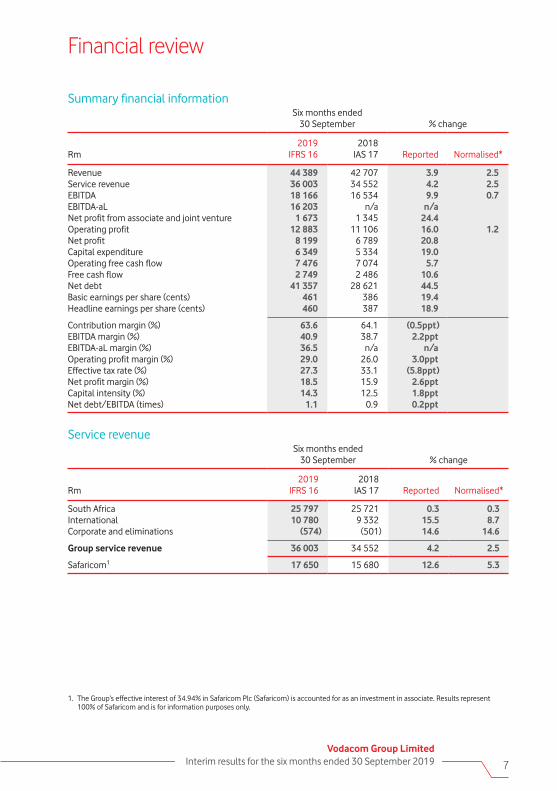
CommentaryGroup service revenue grew 2.5%* to R36.0 billion, with strong growth in International and 0.3% growth in South Africa.
In South Africa, service revenue increased 0.3% to R25.8 billion, supported by an increase in data elasticity in the second quarter following the implementation of the EUSSC regulations in March.
In our International operations, service revenue increased 8.7%* to R10.8 billion driven by the success of M-Pesa and data revenue, commercial executions as well as the strong net customer additions of 2.0 million.
Safaricom service revenue increased 5.3%* during the six month period, driven by M-Pesa revenue growths.
Total expenses1
Six months ended 30 September % change
Rm2019
IFRS 162018
IAS 17 Reported Normalised*
South Africa 20 036 19 886 0.8 4.3International 6 800 6 751 0.7 3.8Corporate and eliminations (624) (411) 51.8 51.8
Group total expenses 26 212 26 226 (0.1) 3.5
Understanding the effects of IFRS 16The difference between IFRS 16 and IAS 17 is most notable in operating expenses and the recognition of operating leases. Previously operating leases were expensed on a straight line basis within operating expenses, while under IFRS 16, these leases are capitalised and classified as right of use assets and depreciated over their useful lives. In addition a lease liability is raised and the resultant finance costs included in finance costs. Operating lease expense included in the prior period amounted to R1 274 million for the Group.
CommentaryGroup total expenses increased 3.5%* to R26.2 billion.
In South Africa expenses increased 4.3%* to R20.0 billion. The increase in costs includes BEE staff expenses of R113 million as a result of our new deal and higher costs relating to our roaming agreement with Rain. Excluding which, total expenses grew 1.9% benefitting from savings realised through our ‘Fit for growth’ programme.
International expenses increased 3.8%* to R6.8 billion, below revenue growth of 8.7%*. These costs include the one-off DRC licence penalty, offset by continued focus on cost containment from our ‘Fit for growth’ programme which included the re-negotiation of supplier contracts.
8

9
Vodacom Group Limited Interim results for the six months ended 30 September 2019
EBITDASix months ended
30 September % change
Rm2019
IFRS 162018
IAS 17 Reported Normalised*
South Africa 13 916 13 810 0.8 (3.9)International 4 298 2 910 47.7 15.4Corporate and eliminations (48) (186) (74.2) (74.2)
Group EBITDA 18 166 16 534 9.9 0.7
Safaricom1 9 703 8 183 18.6 10.7
Understanding the effects of IFRS 16The difference between IFRS 16 and IAS 17 is most notable in operating expenses and the recognition of operating leases. Previously operating leases were expensed on a straight line basis within operating expenses, while under IFRS 16, these leases are capitalised and classified as right of use assets and depreciated over their useful lives. In addition a lease liability is raised and the resultant finance costs included in finance costs. Operating lease expenses included in the prior period amounted to R1 274 million for the Group.
CommentaryGroup EBITDA increased 0.7%* to R18.2 billion. The margin improved by 2.2ppts to 40.9%. South Africa EBITDA declined 3.9%* to R13.9 billion. The growth was impacted by the one-off deferral release benefit in the prior year of R292 million2, the impacts of increased Rain roaming costs, a BEE staff expense charge of R113 million in the current year, and an adjustment relating to refinement of our IFRS 15 model of R177 million3, which collectively had a 4.5ppts negative impact on EBITDA growth. EBITDA in our International operations increased 15.4%* to R4.3 billion. Margins improved from strong revenue growth and the continued improvements made on cost containment.
Operating profitSix months ended
30 September % change
Rm2019
IFRS 162018
IAS 17 Reported Normalised*
South Africa 9 170 8 821 4.0 (6.6)International 2 094 1 383 51.4 26.3Safaricom 1 673 1 345 24.4 13.7Corporate and eliminations (54) (443) (87.8) (87.8)
Group operating profit 12 883 11 106 16.0 1.2
1. The Group’s effective interest of 34.94% in Safaricom Plc (Safaricom) is accounted for as an investment in associate. Results represent 100% of Safaricom and is for information purposes only.
2. R292 million revenue deferral release in the prior year.3. During the period we refined our IFRS 15 model to more accurately reflect contract performance obligations. This impacted a small number
of contracts for which a R177 million negative adjustment to equipment revenue relating to prior years was made during the period.

Financial review continued
Understanding the effects of IFRS 16:The difference between IFRS 16 and IAS 17 is most notable in operating expenses and the recognition of operating leases. Previously operating leases were expensed on a straight line basis within operating expenses, while under IFRS 16, these leases are capitalised and classified as right of use assets and depreciated over their useful lives. In addition a lease liability is raised and the resultant finance costs included in finance costs. Operating lease expenses included in the prior period amounted to R1 375 million, and depreciation relating to the right of use assets amounted to R1 396 million in the current period for the Group.
Commentary:Group operating profit increased 1.2%* to R12.9 billion. The prior year includes a R1.4 billion non-cash, non-recurring charge arising from our new BEE deal (IFRS 2 charge). In South Africa, operating profit declined 6.6%* to R9.2 billion. Adjusting for the one-off deferral release benefit in the prior year of R292 million, a BEE staff expense of R113 million in the current year and an adjustment relating to refinement of our IFRS 15 model of R177 million1, operating profit declined 1.1%. The International operations’ operating profit increased 26.3%* to R2.1 billion mainly driven by improved operational performance.
Net finance chargesSix months ended
30 September % change
Rm2019
IFRS 162018
IAS 17 18/19
Finance income 456 325 40.3Finance costs2 (2 196) (1 440) 52.5
Net finance costs (1 740) (1 115) 56.1Net gain on remeasurement and disposal of financial instruments 140 163 (14.1)
Net finance charges (1 600) (952) 68.1
Net finance charges increased 68.1% to R1.6 billion while the average cost of debt decreased from 8.2% to 7.7%. The finance costs includes interest of R155 million (2018: R14 million) on the YeboYethu preference shares held by external parties, partly offset by lower interest on the Group’s long term borrowings achieved through lower cost of debt and the repayment of debt in the Group. The increase in finance income is mainly related to interest on M-Pesa balances. The change in the net gain on remeasurement and disposal of financial instruments of R23 million mainly relates to the increase in the net gain from the remeasurement of foreign denominated cash balances, offset by net gains on the revaluation of a derivative compared to the prior year.
TaxationThe tax expense of R3.1 billion was 8.4% lower than the prior year (2018: R3.4 billion). The prior year profit before tax included a non-deductible, non-cash, non-recurring IFRS 2 charge relating to the BEE ownership transaction, of R1.4 billion which increased the tax charge.
The effective tax rate decreased to 27.3% for the current period (2018: 33.1%) mainly due to the inclusion of the non-recurring, non-deductible, non-cash IFRS 2 charge in the prior year, a decrease in the unrecognised deferred tax assets relating to the losses incurred primarily in the DRC and the increase in the share in the associates after tax profits included in profit before tax.
1. During the period we refined our IFRS 15 model to more accurately reflect contract performance obligations. This impacted a small number of contracts for which a R177 million negative adjustment to equipment revenue relating to prior years was made during the period.
2. Includes interest on lease liabilities recognised in accordance with IFRS 16 of R650 million.
10

11
Vodacom Group Limited Interim results for the six months ended 30 September 2019
EarningsSix months ended
30 September % change
Rm2019
IFRS 162018
IAS 17 18/19
Earnings per share (cents) 461 386 19.4
Headline earnings per share (cents) 460 387 18.9
Weighted average number of ordinary shares outstanding for the purpose of calculating EPS and HEPS (million) 1 698 1 699 n/a
EPS and HEPS grew at 19.4% and 18.9% respectively. The growth benefitted from the recognition of the BEE related IFRS 2 charge of R1.4 billion and transaction costs of R105 million in the prior year. Excluding these, EPS decreased 2.9%, and HEPS decreased 3.3%. The negative growth is slightly below operating profit growth as a result of the adoption of IFRS 16, which requires a higher interest charge in the initial period of a lease due to the higher lease liability required by the standard.
DividendSix months ended
30 September % change
Rm2019
IFRS 162018
IAS 17 18/19
Headline earnings 7 807 6 573 18.8Adjusted for:Net profit from associate and joint venture (1 673) (1 345) (24.4)
Attributable profits from Safaricom (1 998) (1 649) (21.2) Amortisation on assets, net of tax 325 304 6.9
Withholding tax 140 115 21.7Non-controlling interest and other 210 172 22.1
Add back: Non-cash non-recurring IFRS 2 charge – 1 404 n/a
Headline earnings available for dividend distribution 6 484 6 919 (6.3)
Interim dividend declared per share (cents) 395Safaricom special dividend declared per share (cents) –
Total interim dividend declared per share (cents) 395

Financial review continued
Owned capital expenditure1
Six months ended 30 September % change
Rm2019
IFRS 162018
IAS 17 18/19
South Africa 4 777 4 043 18.2International 1 571 1 290 21.8Corporate and eliminations 1 1 –
Group capital expenditure 6 349 5 334 19.0
Group capital intensity2 (%) 14.3 12.5 1.8ppt
Safaricom 2 589 2 290 13.1
Safaricom capital intensity2 (%) 14.0 14.0 –
The Group’s capital expenditure was R6.3 billion, representing 14.3% of revenue. In South Africa, capital expenditure was directed at modernising the network and enhancing our IT system. We now have 92.4% (2018: 82.5%) 4G population coverage. Capital intensity in South Africa was elevated during this period, due to the subdued revenue growth, but should normalise. In our International operations, the focus remained on increasing both coverage and capacity as well as increasing the 4G rollout. We added 212 2G sites, 218 3G sites and 590 4G sites since March 2019.
1. Owned capital expenditure, excluding spectrum, licences and capitalised right of use assets. Right of use assets include R962 million for the Group, of which R794 million for South Africa and R168 million in international.
2. Capital expenditure as a percentage of revenue.
12

13
Vodacom Group Limited Interim results for the six months ended 30 September 2019
Statement of financial positionProperty, plant and equipment increased 24.4% to R54.7 billion and intangible assets increased 15.7% to R12.6 billion when compared to 31 March 2019. This includes right of use assets recognised as a result of the implementation of IFRS 16 of R9.8 billion, net additions of R7.9 billion and net foreign currency translation gains of R1.3 billion, offset by depreciation and amortisation of R7.0 billion. Intangible assets also include R551 million of goodwill recognised on the acquisition of IoT.nxt1 during the period and the licence costs associated with the extension of our 2G licence in the DRC and spectrum costs in Mozambique and Tanzania totalling R787 million. Net debt increased by R18.0 billion to R41.4 billion from March 2019 which includes lease liabilities of R11.5 billion raised in line with IFRS 16. Bank and cash reduced by R2.8 billion, as a result of funding the increase in our stake in Vodacom Tanzania from 61.6% to 75%, the funding of the IoT.nxt1 acquisition from cash, as well as the payment of dividends during the period. Total borrowings, excluding lease liabilities, increased by R1.7 billion to R36.0 billion mainly due to a new R1.5 billion facility obtained from Vodafone Investments in Luxembourg as well as a US$98 million short-term loan from Vodafone Group Plc to facilitate the payment of the acquisition of additional shares in Vodacom Tanzania. Borrowings as at 31 March 2019, included R1.6 billion in finance leases now included in lease liabilities.
As at30 September
As at31 March Movement
As at30 September
Rm2019
IFRS 162019
IAS 17 Mar/Sep2018
IAS 17
Bank and cash balances 8 252 11 066 (2 814) 8 135Bank overdrafts (2 177) – (2 177) (300)Current borrowings2 (14 844) (10 603) (4 241) (4 052)Non-current borrowings3 (32 585) (23 641) (8 944) (32 304)Other financial instruments (3) (176) 173 (100)
Net debt4 (41 357) (23 354) 18 003 (28 621)
Net debt/EBITDA (times) 1.1 0.7 0.4 0.9
Net debt4 (excluding lease liabilities) (29 884) – n/a –
Net debt/EBITD-aL (times) (excluding lease liabilities) 0.9 – n/a –
1. The Group acquired a 51% equity interest in 10T Holdings (Pty) Limited and IoT.nxt B.V. (together “IoT.nxt”). The effective date of acquisition was 23 August 2019. Refer to note 8 in the condensed consolidated interim financial statements.
2. Includes current lease liabilities of R1 964 million.3. Includes non-current lease liabilities of R9 509 million.4. Debt includes interest bearing debt, non-interest bearing debt and bank overdrafts.

Financial review continued
Cash flowFree cash flow
Six months ended 30 September % change
Rm2019
IFRS 162018
IAS 17 18/19
EBITDA 18 166 16 534 9.9Working capital (2 821) (4 251) (33.6)Capital expenditure1 (6 349) (5 334) 19.0Disposal of property, plant and equipment 100 13 >200.0Lease liability payments (1 894) n/a –Other 274 112 144.6
Operating free cash flow 7 476 7 074 5.7Tax paid (3 192) (3 350) (4.7)Finance income received 444 328 35.4Finance costs paid (1 812) (1 519) 19.3Net dividends paid (167) (47) >200.0
Free cash flow 2 749 2 486 10.6
Operating free cash flow was up 5.7%, supported by EBITDA growth of 9.9% offset by the adoption of IFRS 16 and the inclusion of lease payments of R1.9 billion under lease liability payments. Growth was supported by strong working capital management during the period. Finance costs paid was up, as a result of payments made in respect of finance costs for external preference shares in terms of our new BEE deal.
1. Capital expenditure comprises the purchase of property, plant and equipment and intangible assets, other than licence and spectrum payments. Purchases of customer bases are excluded from capital expenditure.
14

15
Vodacom Group Limited Interim results for the six months ended 30 September 2019
DividendDeclaration of interim dividend number 21 and special dividend No 1 – payable from income reservesNotice is hereby given that a gross interim dividend number 21 of 380 cents per ordinary share and special dividend number 1 of 60 cents per ordinary share in respect of the six months ended 30 September 2019 has been declared payable on Monday 2 December 2019 to shareholders recorded in the register at the close of business on Friday 29 November 2019. The number of ordinary shares in issue at the date of this declaration is 1 835 864 961. The ordinary and special dividend will be subject to a local dividend withholding tax rate of 20%. Accordingly, for those shareholders not exempt from paying dividend withholding tax, the net ordinary dividend will be 304.00000 cents per ordinary share and the net special dividend will be 48.00000 cents per ordinary share.
Last day to trade shares cum dividend Tuesday 26 November 2019Shares commence trading ex-dividend Wednesday 27 November 2019Record date Friday 29 November 2019Payment date Monday 2 December 2019
Share certificates may not be dematerialised or rematerialised between Wednesday 27 November 2019 and Friday 29 November 2019, both days inclusive.
On Monday 2 December 2019, the final dividend will be electronically transferred into the bank accounts of all certificated shareholders where this facility is available. Shareholders who hold dematerialised shares will have their accounts at their CSDP or broker credited on Monday 2 December 2019.
Vodacom Group Limited tax reference number is 9316/041/71/5.
South African Reserve Bank approval has been obtained for the declaration of the special dividend.
Dividend policyThe Board maintains its dividend policy of paying at least 90% of adjusted headline earnings which excludes the contribution of the attributable net profit or loss from Safaricom and any associated intangible amortisation. In addition, the Group intends to distribute any dividend it receives from Safaricom, up to a maximum amount of the dividend received, net of withholding tax.
The Group intends to pay as much of its after tax profits as will be available after retaining such sums and repaying such borrowings owing to third parties as shall be necessary to meet the requirements reflected in the budget and business plan, taking into account monies required for investment opportunities. There is no fixed date on which entitlement to dividends arises and the date of payment will be determined by the Board or shareholders at the time of declaration, subject to the JSE Listings Requirements.
For and on behalf of the Board
Jabu Moleketi Shameel Aziz Joosub Till StreichertChairman Chief Executive Officer Chief Financial Officer
Midrand08 November 2019

To the shareholders of Vodacom Group LimitedWe have reviewed the condensed consolidated interim financial statements of Vodacom Group Limited set out on pages 17 to 39, contained in the accompanying interim report, which comprises the condensed consolidated statement of financial position as at 30 September 2019, and the condensed consolidated income statement, comprehensive income, changes in equity and cash flows for the six months period then ended, and selected explanatory notes.
Directors’ Responsibility for the Condensed Consolidated Interim Financial StatementsThe directors are responsible for the preparation and presentation of these condensed consolidated interim financial statements in accordance with the International Financial Reporting Standard, (IAS) 34 Interim Financial Reporting, the SAICA Financial Reporting Guides, as issued by the Accounting Practices Committee and Financial Pronouncements as issued by Financial Reporting Standards Council and the requirements of the Companies Act of South Africa, and for such internal control as the directors determine is necessary to enable the preparation of condensed consolidated interim financial statements that are free from material misstatement, whether due to fraud or error.
Auditor’s responsibilityOur responsibility is to express a conclusion on these condensed consolidated interim financial statements. We conducted our review in accordance with International Standard on Review Engagements ISRE 2410, Review of Interim Financial Information performed by the Independent Auditor of the Entity. ISRE 2410 requires us to conclude whether anything has come to our attention that causes us to believe that the condensed consolidated interim financial statements are not prepared in all material respects in accordance with the applicable financial reporting framework. This standard also requires us to comply with relevant ethical requirements.
A review of condensed consolidated interim financial statements in accordance with ISRE 2410 is a limited assurance engagement. We perform procedures, primarily consisting of making inquiries of management and others within the entity, as appropriate, and applying analytical procedures, and evaluate the evidence obtained.
The procedures performed in a review are substantially less than and differ in nature from those performed in an audit conducted in accordance with International Standards on Auditing. Accordingly, we do not express an audit opinion on these condensed consolidated interim financial statements.
ConclusionBased on our review, nothing has come to our attention that causes us to believe that the accompanying condensed consolidated interim financial statements of Vodacom Group Limited for the six months period ended 30 September 2019 are not prepared, in all material respects, in accordance with the International Financial Reporting Standard, (IAS) 34 Interim Financial Reporting, the SAICA Financial Reporting Guides as issued by the Accounting Practices Committee and Financial Pronouncements as issued by Financial Reporting Standards Council and the requirements of the Companies Act of South Africa.
Other matter – Prior Period(s) Reviewed / Audited by Another AuditorThe condensed consolidated interim financial statements of Vodacom Group Limited for the six months period ended 30 September 2018 and the annual financial statements of Vodacom Group Limited for the year ended 31 March 2019, were reviewed and audited by another auditor who expressed an unmodified conclusion and an unmodified opinion on those statements on 9 November 2018 and 31 May 2019, respectively.
Ernst & Young Inc.Director–Vinodhan PillayRegistered AuditorChartered Accountant (SA)
08 November 2019
Independent auditor’s review report
16

17
Vodacom Group Limited Interim results for the six months ended 30 September 2019
Condensed consolidated income statementfor the six months ended 30 September
Six months ended 30 September
Year ended31 March
Rm Notes20191
Reviewed2018
Reviewed2019
Audited
Revenue 3 44 389 42 707 86 627 Direct expenses (16 161) (15 331) (31 427)Staff expenses (3 289) (3 083) (6 026)Publicity expenses (902) (925) (1 920)Other operating expenses (5 860) (6 887) (13 462)Broad-based black economic empowerment charge – (1 404) (1 404)Depreciation and amortisation (6 967) (5 316) (10 642)Impairment losses – – (30)Net profit from associate and joint venture 1 673 1 345 2 774
Operating profit 12 883 11 106 24 490 Finance income 456 325 630 Finance costs (2 196) (1 440) (3 008)Net gain/(loss) on remeasurement and disposal of financial instruments 140 163 (23)
Profit before tax 11 283 10 154 22 089 Taxation (3 084) (3 365) (6 557)
Net profit 8 199 6 789 15 532
Attributable to:Equity shareholders 7 834 6 564 14 822 Non-controlling interests 365 225 710
8 199 6 789 15 532
Six months ended 30 September
Year ended31 March
Cents Notes2019
Reviewed2018
Reviewed2019
Audited
Basic earnings per share 4 461 386 872 Diluted earnings per share 4 454 379 856
1. The reported figures for the six months ended 30 September 2019 have been significantly impacted by the adoption of IFRS 16 on 1 April 2019. Refer to Note 2 for a detailed analysis of the impact.

Condensed consolidated statement of comprehensive incomefor the six months ended 30 September
Six months ended 30 September
Year ended31 March
Rm2019
Reviewed2018
Reviewed2019
Audited
Net profit 8 199 6 789 15 532
Other comprehensive income
Foreign currency translation differences, net of tax1 2 090 11 018 11 879 Mark-to-market of financial assets held at fair value through
other comprehensive income, net of tax 16 – 10
Total comprehensive income 10 305 17 807 27 421
Attributable to:Equity shareholders 9 746 16 628 25 709 Non-controlling interests 559 1 179 1 712
10 305 17 807 27 421
1. Other comprehensive income can subsequently be recognised in profit or loss on the disposal of foreign operations.
18

19
Vodacom Group Limited Interim results for the six months ended 30 September 2019
Condensed consolidated statement of financial positionas at 30 September
As at 30 September
As at31 March
Rm Notes20191
Reviewed2018
Reviewed2019
Audited
AssetsNon-current assets 124 925 109 279 113 897
Property, plant and equipment 2 54 744 42 577 43 989 Intangible assets 8 12 551 10 123 10 845 Financial assets 628 508 632 Investment in associate 52 748 51 895 54 292 Investment in joint venture 7 7 7 Trade and other receivables 2 2 246 2 146 2 137 Finance receivables 1 917 1 578 1 699 Tax receivable 59 183 183 Deferred tax 25 262 113
Current assets 46 409 40 921 39 746
Financial assets 6 929 6 470 6 391 Inventory 1 418 1 720 1 413 Trade and other receivables 2 25 226 22 193 17 649 Non-current assets held for sale 846 14 619 Finance receivables 2 729 2 040 2 251 Tax receivable 1 009 349 357 Bank and cash balances 8 252 8 135 11 066
Total assets 171 334 150 200 153 643
Equity and liabilities
Fully paid share capital 57 073 57 073 57 073 Treasury shares (16 618) (16 434) (16 387)Retained earnings 33 707 31 177 32 670 Other reserves 5 642 3 395 4 636
Equity attributable to owners of the parent 79 804 75 211 77 992 Non-controlling interests 7 706 7 339 8 396
Total equity 87 510 82 550 86 388 Non-current liabilities 38 346 38 729 29 084
Borrowings 2, 10 32 585 32 304 23 641 Trade and other payables 409 1 497 820 Provisions 591 419 329 Deferred tax 2 4 761 4 509 4 294
Current liabilities 45 478 28 921 38 171
Borrowings 2, 10 14 844 4 052 10 603 Trade and other payables 27 373 24 150 26 607 Liabilities directly associated with non-current assets held for sale 304 – 286 Provisions 249 189 218 Tax payable 367 208 340 Dividends payable 164 22 117 Bank overdrafts 2 177 300 –
Total equity and liabilities 171 334 150 200 153 643
1. The reported figures for the six months ended 30 September 2019 have been significantly impacted by the adoption of IFRS 16 on 1 April 2019. Refer to Note 2 for a detailed analysis of the impact.

Condensed consolidated statement of changes in equity for the six months ended 30 September
Rm Notes
Equity attributable
to owners of the parent
Non-controlling
interests Total
equity
31 March 2019 – Audited 77 992 8 396 86 388 Adoption of IFRS 16 2 23 1 24
1 April 2019 78 015 8 397 86 412 Total comprehensive income 9 746 559 10 305 Dividends (6 826) (167) (6 993)Repurchase and sale of shares (420) – (420)Share-based payments 154 – 154 Business combination 8 – 23 23 Changes in subsidiary holdings 9 (865) (1 106) (1 971)
30 September 2019 – Reviewed 79 804 7 706 87 510
31 March 2018 – Audited 64 468 6 184 70 652 Adoption of IFRS 15 and IFRS 9 3 187 (57) 3 130
1 April 2018 67 655 6 127 73 782 Total comprehensive income 16 628 1 179 17 807 Dividends (7 216) (47) (7 263)Repurchase and sale of shares (353) – (353)Share-based payments 1 204 – 1 204
Broad-based black economic empowerment transaction 1 119 – 1 119
Share-based payments – other 85 – 85
Changes in subsidiary holdings (2 707) 80 (2 627)
30 September 2018 – Reviewed 75 211 7 339 82 550
31 March 2018 – Audited 64 468 6 184 70 652 Adoption of IFRS 15 and IFRS 9 3 187 (57) 3 130
1 April 2018 67 655 6 127 73 782 Total comprehensive income 25 709 1 712 27 421 Dividends (13 982) (473) (14 455)Repurchase and sale of shares (352) – (352)Share-based payments 1 862 – 1 862
Broad-based black economic empowerment transaction 1 669 – 1 669
Share-based payments – other 193 – 193
Changes in subsidiary holdings (2 900) 80 (2 820)Shareholder's loan converted to equity – 950 950
31 March 2019 – Audited 77 992 8 396 86 388
20

21
Vodacom Group Limited Interim results for the six months ended 30 September 2019
Condensed consolidated statement of cash flowsfor the six months ended 30 September
Six months ended 30 September
Year ended31 March
Rm Notes2019
Reviewed2018
Restated12019
Audited
Cash generated from operations 16 349 13 889 34 575 Tax paid (3 192) (3 350) (6 535)
Net cash flows from operating activities 13 157 10 539 28 040
Cash flows from investing activitiesAdditions to property, plant and equipment and intangible assets (7 365) (7 070) (13 653)Proceeds from disposal of property, plant and equipment and intangible assets 126 13 467 Acquisition of subsidiary (net of cash and cash equivalents acquired) 8 (266) – –Dividends received from associate – – 2 466 Finance income received 444 328 943 Other investing activities2 (291) (1 078) (1 411)
Net cash flows utilised in investing activities (7 352) (7 807) (11 188)
Cash flows from financing activitiesBorrowings incurred 10 3 508 4 624 5 080 Borrowings repaid 10 (1 694) (846) (3 026)Finance costs paid (2 420) (1 519) (3 179)Dividends paid – equity shareholders (6 633) (7 217) (13 978)Dividends paid – non-controlling interests (167) (47) (473)Repurchase and sale of shares (420) (353) (352)Changes in subsidiary holdings 9 (3 466) (3 167) (3 449)
Net cash flows utilised in financing activities (11 292) (8 525) (19 377)
Net decrease in cash and cash equivalents (5 487) (5 793) (2 525)Cash and cash equivalents at the beginning of the period 11 066 12 538 12 538 Effect of foreign exchange rate changes 496 1 090 1 053
Cash and cash equivalents at the end of the period 6 075 7 835 11 066
1. Certain amounts were restated in the 30 September 2018 comparative period. Refer to Note 11. 2. Consists mainly of the net movement in restricted cash deposits of R593 million inflow (30 September 2018: R780 million outflow;
31 March 2019: R1 142 million outflow) as a result of M-Pesa related activities, and investment in treasury bills in Tanzania of R863 million.

Notes to the condensed consolidated interim financial statementsfor the six months ended 30 September
1. Basis of preparationThe condensed consolidated interim financial statements are prepared in accordance with International Financial Reporting Standard, (IAS) 34 Interim Financial Reporting, the SAICA Financial Reporting Guides as issued by the Accounting Practices Committee and Financial Pronouncements as issued by Financial Reporting Standards Council, the JSE Limited (JSE) Listings Requirements and the requirements of the Companies Act of South Africa. They have been prepared on the historical cost basis, except for certain financial instruments which are measured at fair value or at amortised cost, and are presented in South African rand, which is the parent Company’s functional and presentation currency.
The significant accounting policies and methods of computation are consistent in all material respects with those applied in the previous year, except as disclosed in Note 2. The significant accounting policies are available for inspection at the Group’s registered office.
The preparation of these condensed consolidated interim financial statements was supervised by the Chief Financial Officer, Dr. phil. T Streichert.
The financial information has been reviewed by Ernst & Young Inc., whose unmodified review report is presented on page 16.
Ernst & Young Inc. was appointed by shareholders at the annual general meeting as auditor of the Group and as auditor of its subsidiaries in South Africa and certain of its African subsidiaries for the financial year ending 31 March 2020.
2. Changes in accounting policiesThe Group adopted the new, revised or amended accounting pronouncements as issued by the IASB, which were effective and applicable to the Group from 1 April 2019. The accounting pronouncement considered by the Group as significant on adoption is IFRS 16 Leases as set out below.
Other IFRS changes adopted on 1 April 2019 have no material impact on the consolidated results, financial position or cash flows of the Group. Full details on changes in accounting policies will be disclosed in the Group’s consolidated annual financial statements for the year ended 31 March 2020, which will be available online.
IFRS 16 Leases (IFRS 16)IFRS 16 Leases was adopted by the Group on 1 April 2019 with the cumulative retrospective impact reflected as an adjustment to equity on the date of adoption. The Group has applied the following expedients in relation to the adoption of IFRS 16, in terms of the transitional provisions of that standard:
• The right of use assets were measured at an amount equal to the lease liability at adoption, and initial direct costs incurred when obtaining leases were excluded from this measurement. Lease prepayments and accruals previously recognised under IAS 17 at 31 March 2019 were added and deducted, respectively, from the value of the right of use assets on adoption in determining the cumulative retrospective impact recorded on 1 April 2019.
• A single discount rate was applied to a portfolio of leases with reasonably similar characteristics, such as leases with a similar remaining lease term for a similar class of underlying asset in a similar economic environment.
The key differences between the Group’s IAS 17 accounting policy (the ‘previous policy’ which is disclosed in the Group’s annual financial statements for the year ended 31 March 2019) and the Group’s IFRS 16 accounting policy (which is provided below), as well as the primary impacts of applying IFRS 16 in the current financial period are disclosed on pages 27 to 28 and below.
22

23
Vodacom Group Limited Interim results for the six months ended 30 September 2019
2. Changes in accounting policies continued IFRS 16 Leases (IFRS 16) continued Primary impacts of applying the IFRS 16 accounting policy
The primary impacts on the Group’s primary financial statements, and the key causes of the movements recorded in the consolidated statement of financial position on 1 April 2019 (see pages 27 to 28), as a result of applying the IFRS 16 (‘current’) accounting policy in place of the previous policy under IAS 17 are:
As a lessee• Under IAS 17, lessees classified leases as either operating or finance leases.
– Operating lease costs were expensed on a straight-line basis over the period of the lease. – Finance leases resulted in the recognition, in the statement of financial position, of an asset and a
corresponding liability for lease payments, at present value.• Under IFRS 16 all lease agreements give rise to the recognition of a ‘right of use asset’ representing
the right to use the leased item and a liability for any future lease payments (see pages 27 to 28) over the ‘reasonably certain’ period of the lease, which may include future lease periods for which the Group has extension options.
• Lessee accounting under IFRS 16 is similar to finance lease accounting for lessees under IAS 17; lease costs are recognised in the form of depreciation of the right of use asset and finance costs on the lease liability which is generally discounted at the incremental borrowing rate of the relevant Group entity, although the interest rate implicit in the lease is used when it is more readily determinable. Interest charges will typically be higher in the early stages of a lease and will reduce over the term.
• Under IFRS 16 inflows from operating activities and payments classified within cash flow from financing activities both increase, as payments made at both lease inception and subsequently are characterised as repayments of lease liabilities and interest. Under IAS 17 operating lease payments were treated as operating cash outflows. Net cash flow is not impacted by the change in policy.
As a lessor• Lessor accounting under IFRS 16 is similar to IAS 17. The only substantive change is that when the
Group sub-leases assets it classifies the lease out as either operating leases or finance leases by reference to the terms of head lease contract whereas under IAS 17 the classification was determined by reference to the underlying asset leased out. This has resulted in additional finance leases out being recognised under IFRS 16 (see pages 27 to 28).
The expedients applied at adoption, above, have resulted in reclassifications of lease-related prepayments, accruals and provisions as at 1 April 2019 (see pages 27 to 28) to the right of use assets or lease liabilities.
IFRS 16 Accounting Policy As a lessee
When the Group leases an asset a ‘right of use asset’ is recognised for the leased item and a lease liability is recognised for any lease payments due at the lease commencement date. The right of use asset is initially measured at cost, being the present value of the lease payments paid or payable, plus any initial direct costs incurred in entering the lease and dismantling costs, less any lease incentives received.
Right of use assets are depreciated on a straight-line basis from the commencement date to the earlier of the end of the asset’s useful life or the end of the lease term. The lease term is the non-cancellable period of the lease plus any periods for which the Group is ‘reasonably certain’ to exercise any extension options (see below). The useful life of the asset is determined in a manner consistent to that for owned property, plant and equipment. If right of use assets are considered to be impaired, the carrying value is reduced accordingly.

Notes to the preliminary condensed consolidated financial statements continued
2. Changes in accounting policies continued IFRS 16 Leases (IFRS 16) continued IFRS 16 Accounting Policy continued As a lessee continued
Lease liabilities are initially measured at the present value of the lease payments that are not paid at the commencement date and are usually discounted using the incremental borrowing rates of the applicable Group entity (the rate implicit in the lease is used if it is readily determinable). Lease payments included in the lease liability include:
• fixed payments and in-substance fixed payments during the term of the lease;• variable lease payments that depend on an index or a rate;• amounts expected to be payable by the lessee under residual value guarantees;• the exercise price of a purchase option if the lessee is reasonably certain to exercise that option;• payments of penalties for terminating the lease, if the lease term reflects the lessee exercising
an option to terminate the lease.
After initial recognition, the lease liability is recorded at amortised cost using the effective interest method. It is remeasured when:
• there is a change in the residual value guarantee;• there is a change in future lease payments arising from a change in an index or rate (e.g. an inflation
related increase);• the Group’s assessment of the lease term changes;• lease modifications occur that are not treated as separate leases.
Any change in the lease liability as a result of these changes also results in a corresponding change in the right of use asset.
As a lessorWhere the Group is a lessor, it determines at inception whether the lease is a finance or an operating lease. When a lease transfers substantially all the risks and rewards of ownership of the underlying asset then the lease is a finance lease; otherwise, the lease is an operating lease.
Where the Group is an intermediate lessor, the interest in the head lease and the sub-lease is accounted for separately and the lease classification of a sub-lease is determined by reference to the right of use asset arising from the head lease. Income from operating leases is recognised on a straight-line basis over the lease term. Profit or loss from finance leases is recognised in full at lease commencement.
Lease income is recognised as other revenue for transactions that are part of the Group’s ordinary activities (primarily leases of handsets or other equipment to customers or leases of wholesale access to the Group’s fibre and cable networks). The Group uses IFRS 15 to allocate the consideration in contracts between any lease and non-lease components. Lease income is recognised as a credit in operating expenses for transactions that are not part of the Group’s ordinary activities (primarily leases or sub leases of surplus assets).
Critical accounting judgements and key sources of estimation relating to IFRS 16 Lease identification
Whether the arrangement is considered a lease or a service contract depends on the analysis by management of both the legal form and substance of the arrangement between the Group and the counter-party to determine if control of an identified asset has been passed between the parties; if not, the arrangement is a service arrangement. Control exists if the Group obtains substantially all of the economic benefit from the use of the asset, and has the ability to direct its use, for a period of time. An identified asset exists where an agreement explicitly or implicitly identifies an asset or a physically distinct portion of an asset which the lessor has no substantive right to substitute.
24

25
Vodacom Group Limited Interim results for the six months ended 30 September 2019
2. Changes in accounting policies continued IFRS 16 Leases (IFRS 16) continued Critical accounting judgements and key sources of estimation relating to IFRS 16 continued Lease identification continued
The scenarios requiring the greatest judgement include those where the arrangement is for the use of fibre or other fixed telecommunication lines. Generally, where the Group has exclusive use of a physical line it is determined that the Group can also direct the use of the line and therefore leases will be recognised. Where the Group provides access to fibre or other fixed telecommunication lines to another operator on a wholesale basis the arrangement will generally be identified as a lease, whereas when the Group provides fixed line services to an end-user, generally control over such lines is not passed to the end-user and a lease is not identified.
The impact of determining whether an agreement is a lease or a service contract depends on whether the Group is a potential lessee or lessor in the arrangement and, where the Group is a lessor, whether the arrangement if classified as an operating or finance lease. The impacts for each scenario are described below where the Group is potentially:
• A lessee. The judgment impacts the nature and timing of both costs and reported assets and liabilities. A lease results in depreciation and interest being recognised and an asset and a liability being reported; the interest charge will decrease over the life of the lease. A service contract results in operating expenses being recognised evenly over the life of the contract and no assets or liabilities being recorded (other than trade payables, prepayments and accruals).
• An operating lessor. The judgment impacts the nature of income recognised. An operating lease results in lease income being recognised whilst a service contract results in service revenue. Both are recognised evenly over the life of the contract.
• A finance lessor. The judgment impacts the nature and timing of both income and reported assets. A finance lease results in the lease income being recognised at commencement of the lease and an asset (the net investment in the lease) being recorded.
Lease termWhere leases include additional optional periods after an initial lease term, significant judgement is required in determining whether these optional periods should be included when determining the lease term. The impact of this judgment is significantly greater where the Group is a lessee. As a lessee, optional periods are included in the lease term if the Group is reasonably certain it will exercise an extension option or will not exercise a termination option; this depends on an analysis by management of all relevant facts and circumstances including the leased asset’s nature and purpose, the economic and practical potential for replacing the asset and any plans that the Group has in place for the future use of the asset. Where a leased asset is highly customised (either when initially provided or as a result of leasehold improvements) or it is impractical or uneconomic to replace then the Group is more likely to judge that lease extension options are reasonably certain to be exercised. Where extension options are included the greater the value of the right of use asset and lease liability that will be recognised. The normal approach adopted for lease term by asset class is described below.

Notes to the preliminary condensed consolidated financial statements continued
2. Changes in accounting policies continued IFRS 16 Leases (IFRS 16) continued Critical accounting judgements and key sources of estimation relating to IFRS 16 continued Lease term continued
The lease terms can vary significantly by type and use of asset and geography. In addition, the exact lease term is subject to the non-cancellable period and rights and options in each contract. In most instances the Group has options to renew or extend leases for additional periods after the end of the lease term which are assessed using the criteria below. Generally, lease terms are judged to be the longer of the minimum lease term and:
• Between 5 and 10 years for land and buildings (excluding retail), with terms at the top end of this range if the lease relates to assets that are considered to be difficult to exit sooner for economic, practical or reputational reasons;
• To the next contractual lease break date for retail premises (excluding breaks within the next 12 months);
• Where leases are used to provide internal connectivity the lease term for the connectivity is aligned to the lease term or useful economic life of the assets connected; and
• The customer service agreement length for leases of local loop connections or other assets required to provide fixed line services to individual customers.
In most instances the Group has options to renew or extend leases for additional periods after the end of the lease term which are assessed using the criteria above.
Transition disclosuresThe weighted average incremental borrowing rate applied to the Group’s lease liabilities recognised in the statement of financial position at 1 April 2019 was 12.46%.
The Group’s undiscounted operating lease commitments at 31 March 2019 were R13 376 million; the most significant differences between the IAS 17 lease commitments and the lease liabilities recognised on transition to IFRS 16 are set out below:
Rm
Operating lease commitment at 31 March 2019 13 376 Less effect of discounting on payments included in the operating lease commitment (5 326)Plus lease liabilities in respect of additional ‘reasonably certain’ lease extensions assumed under IFRS 16 1 785
Increase in borrowings 9 835Plus finance lease liabilities already reported under IAS 17 1 647
Lease liability opening balance reported at 1 April 2019 11 482
26

27
Vodacom Group Limited Interim results for the six months ended 30 September 2019
2. Changes in accounting policies continued IFRS 16 Leases (IFRS 16) continued Opening condensed consolidated statement of financial position as at 1 April 2019
Rm
31 March2019
Audited
Impact of adoption
of IFRS 16Reviewed
1 April 2019Reviewed
AssetsNon-current assets 113 897 9 608 123 505
Property, plant and equipment 43 989 9 780 53 769
Of which: Right of use assets 9 780
Intangible assets 10 845 – 10 845 Financial assets 632 – 632 Investment in associate 54 292 2 54 294 Investment in joint venture 7 – 7 Trade and other receivables 2 137 (174) 1 963
Of which: Net investment in leases 129 Prepayments and operating lease receivables (303)
Finance receivables 1 699 – 1 699 Tax receivable 183 – 183 Deferred tax 113 – 113
Current assets 39 746 (5) 39 741
Financial assets 6 391 – 6 391 Inventory 1 413 – 1 413 Trade and other receivables 17 649 (5) 17 644
Of which: Net investment in leases 135 Prepayments and operating lease receivables (140)
Non-current assets held for sale 619 – 619 Finance receivables 2 251 – 2 251 Tax receivable 357 – 357 Bank and cash balances 11 066 – 11 066
Total assets 153 643 9 603 163 246

Notes to the preliminary condensed consolidated financial statements continued
2. Changes in accounting policies continued IFRS 16 Leases (IFRS 16) continued Opening condensed consolidated statement of financial position as at 1 April 2019 continued
Rm
31 March2019
Audited
Impact of adoption
of IFRS 16Reviewed
1 April 2019Reviewed
Equity and liabilitiesFully paid share capital 57 073 – 57 073 Treasury shares (16 387) – (16 387)Retained earnings 32 670 28 32 698 Other reserves 4 636 (5) 4 631
Equity attributable to owners of the parent 77 992 23 78 015 Non-controlling interests 8 396 1 8 397
Total equity 86 388 24 86 412 Non-current liabilities 29 084 7 623 36 707
Borrowings 23 641 7 879 31 520
Of which: Lease liabilities 7 879
Trade and other payables 820 (255) 565
Of which: Reduction in operating lease payables (255)
Provisions 329 – 329 Deferred tax 4 294 (1) 4 293
Current liabilities 38 171 1 956 40 127
Borrowings 10 603 1 956 12 559
Of which: Lease liabilities 1 956
Trade and other payables 26 607 – 26 607 Liabilities directly associated with non-current assets held for sale 286 – 286 Provisions 218 – 218 Tax payable 340 – 340 Dividends payable 117 – 117
Total equity and liabilities 153 643 9 603 163 246
28

29
Vodacom Group Limited Interim results for the six months ended 30 September 2019
3. Segment analysisSix months ended
30 SeptemberYear ended
31 March
Rm2019
Reviewed2018
Reviewed2019
Audited
External customer segment revenue 44 389 42 707 86 627
South Africa 33 652 33 449 67 445 International 10 737 9 258 19 182 Corporate and eliminations – – –
Safaricom1 18 442 16 304 34 113 Inter-segment revenue – – –
South Africa 265 213 442 International 408 384 799 Corporate and eliminations (673) (597) (1 241)
Disaggregated revenue per product type
RmSouthAfrica International
Corporate and
eliminations Total Safaricom
30 September 2019 –reviewedMobile contract revenue 9 824 656 (3) 10 477 1 708 Mobile prepaid revenue 11 548 8 513 (1) 20 060 14 215
Customer service revenue 21 372 9 169 (4) 30 537 15 923 Mobile interconnect 992 650 (320) 1 322 594 Fixed service revenue 1 518 895 (234) 2 179 646 Other service revenue 1 915 66 (16) 1 965 487
Service revenue 25 797 10 780 (574) 36 003 17 650 Equipment revenue 6 478 205 (9) 6 674 603 Non-service revenue 1 568 152 (90) 1 630 189
Revenue from contracts with customers 33 843 11 137 (673) 44 307 *Interest income recognised as revenue 30 8 – 38 *Other2 44 – – 44 *
Revenue 33 917 11 145 (673) 44 389 18 442
1. The Group’s effective interest of 34.94% in Safaricom Plc (Safaricom) is accounted for as an investment in associate. Due to the significance of this investment, and the information available for review by the chief operating decision maker, Safaricom is presented as a separate segment. The above results represent 100% of the results of Safaricom.
2. Other revenue largely represents lease revenues recognised under IFRS 16 Leases.* Not reviewed by the chief operating decision maker.

Notes to the preliminary condensed consolidated financial statements continued
3. Segment analysis continued Disaggregated revenue per product type continued
RmSouthAfrica International
Corporate and
eliminations Total Safaricom
30 September 2018 –reviewedMobile contract revenue 10 080 534 (2) 10 612 2 110 Mobile prepaid revenue 11 799 7 272 (1) 19 070 12 047
Customer service revenue 21 879 7 806 (3) 29 682 14 157 Mobile interconnect 990 641 (314) 1 317 561 Fixed service revenue 1 308 804 (174) 1 938 511 Other service revenue 1 544 81 (10) 1 615 451
Service revenue 25 721 9 332 (501) 34 552 15 680 Equipment revenue 6 510 182 (5) 6 687 469 Non-service revenue 1 301 121 (91) 1 331 155
Revenue from contracts with customers 33 532 9 635 (597) 42 570 *Interest income recognised as revenue 82 7 – 89 *Other2 48 – – 48 *
Revenue 33 662 9 642 (597) 42 707 16 304
RmSouthAfrica International
Corporate and
eliminations Total Safaricom
31 March 2019 – auditedMobile contract revenue 19 856 1 169 (7) 21 018 4 628 Mobile prepaid revenue 23 713 15 132 1 38 846 24 869
Customer service revenue 43 569 16 301 (6) 59 864 29 497 Mobile interconnect 2 001 1 253 (646) 2 608 1 161 Fixed service revenue 2 809 1 659 (372) 4 096 1 106 Other service revenue 3 162 164 (27) 3 299 934
Service revenue 51 541 19 377 (1 051) 69 867 32 698 Equipment revenue 13 377 368 (12) 13 733 1 063 Non-service revenue 2 730 223 (178) 2 775 352
Revenue from contracts with customers 67 648 19 968 (1 241) 86 375 *Interest income recognised as revenue 116 13 – 129 *Other2 123 – – 123 *
Revenue 67 887 19 981 (1 241) 86 627 34 113
2. Other revenue largely represents lease revenues recognised under IFRS 16 Leases.* Not reviewed by the chief operating decision maker.
30

31
Vodacom Group Limited Interim results for the six months ended 30 September 2019
3. Segment analysis continuedSix months ended
30 SeptemberYear ended
31 March
Rm2019
Reviewed2018
Reviewed2019
Audited
EBITDA 18 166 16 534 33 714
South Africa 13 916 13 810 27 741 International 4 298 2 910 6 252 Corporate and eliminations (48) (186) (279)
Safaricom1 9 703 8 183 16 913 Operating profit2 12 883 11 106 24 490
South Africa 9 170 8 821 18 904 International 2 094 1 383 3 353 Corporate and eliminations 1 619 902 2 233
Safaricom1 5 983 4 772 9 886
Reconciliation of segment resultsEBITDA 18 166 16 534 33 714 Depreciation and amortisation excluding acquired
brands and customer bases (6 967) (5 316) (10 642) Net profit/(loss) on disposal of property, plant and
equipment and intangible assets 44 (25) 205 Impairment losses – – (30) Broad-based black economic empowerment charge – (1 404) (1 404) Net profit from associate and joint venture 1 673 1 345 2 774 Other (33) (28) (127)
Operating profit3 12 883 11 106 24 490
Total assets 171 334 150 200 153 643
South Africa 74 516 63 671 66 881 International 44 310 32 108 30 761 Corporate and eliminations 52 508 54 421 56 001
Safaricom1 68 648 64 768 63 432
Total liabilities (83 824) (67 649) (67 255)
South Africa (56 221) (51 885) (48 560) International (24 987) (17 875) (17 245) Corporate and eliminations (2 616) 2 111 (1 450)
Safaricom1 (26 928) (21 806) (16 039)
1 The Group's effective interest of 34.94% in Safaricom is accounted for as an investment in associate. Due to the significance of this investment, and the information available for review by the chief operating decision maker, Safaricom is presented as a separate segment. The above results represent 100% of the results of Safaricom, including the impact of net fair value adjustments on tangible assets.
2 During the period, the Group changed its measure of profit or loss from EBIT to operating profit, in order to take into account net profit from associate and joint venture, following the acquisition of a material equity accounted associate investment in Safaricom.
3 For a reconciliation of operating profit to net profit for the year, refer to the Condensed consolidated income statement on page 17.

Notes to the preliminary condensed consolidated financial statements continued
4. Per share calculationsSix months ended
30 SeptemberYear ended
31 March
Cents2019
Reviewed2018
Reviewed2019
Audited
4.1 Earnings and dividends per share Basic earnings per share 461 386 872 Diluted earnings per share 454 379 856 Headline earnings per share 460 387 868 Diluted headline earnings per share 452 379 852 Dividends per share 400 425 820
Six months ended 30 September
Year ended31 March
Million2019
Reviewed2018
Reviewed2019
Audited
4.2 Weighted average number of ordinary shares outstanding for the purpose of calculating:Basic and headline earnings per share 1 698 1 699 1 699Diluted earnings and diluted headline earnings per share 1 727 1 734 1 731
4.3 Ordinary shares for the purpose of calculating dividends per share:425 cents per share declared on 11 May 2018 – 1 721 1 721395 cents per share declared on 9 November 2018 – – 1 836400 cents per share declared on 10 May 2019 1 836 – –
Vodacom Group Limited acquired 3 335 087 shares in the market during the period at an average price of R117.86 per share. Share repurchases did not exceed 1% of Vodacom Group Limited’s issued share capital.
Dividend per share calculations are based on a dividend paid of R7 343 million (30 September 2018: R7 316 million; 31 March 2019: R14 568 million) of which R29 million (30 September 2018: R30 million; 31 March 2019: R52 million) was offset against the forfeitable share plan reserve, R4 million (30 September 2018: R4 million; 31 March 2019: R8 million) expensed as staff expenses and R62 million (30 September 2018: R66 million; 31 March 2018: R126 million) paid to Wheatfields Investments 276 (Pty) Limited, a wholly-owned subsidiary holding treasury shares on behalf of the Group. An amount of R459 million (30 September 2018: Rnil; 31 March 2019: R452 million) was paid to YeboYethu Investment Company (RF) (Pty) Limited, a special purpose vehicle holding shares in Vodacom Group Limited on behalf of broad-based black economic participants. The Group declared an interim and a special dividend in respect of the six months ended 30 September 2019 after the reporting period (Note 13).
32

33
Vodacom Group Limited Interim results for the six months ended 30 September 2019
Six months ended 30 September
Year ended31 March
Rm2019
Reviewed2018
Reviewed2019
Audited
4.4 Headline earnings reconciliationEarnings attributable to equity shareholders for basic and diluted earnings per share 7 834 6 564 14 822 Adjusted for: Net (profit)/loss on disposal of property, plant and
equipment, right of use assets and intangible assets1 (47) 21 (214) Impairment losses – – 30
7 787 6 585 14 638 Tax impact of adjustments 15 (7) (34)Non-controlling interests’ share in adjustments 5 (5) 140
Headline earnings for headline earnings per share and diluted headline earnings per share2 7 807 6 573 14 744
1. Includes attributable share of profit on disposal of property, plant and equipment, right of use assets and intangible assets of associate and joint ventures of R3 million (30 September 2018: R4 million; 31 March 2019: R9 million).
2. This disclosure is a requirement of the JSE Limited. It has been calculated in accordance with Circular 4/2018 as issued by SAICA.
5. Related parties The amounts disclosed in Notes 5.1 and 5.2 include significant balances and transactions with the Group’s
parent, entities in its group as well as associates and joint venture.
Six months ended 30 September
Year ended31 March
Rm2019
Reviewed2018
Reviewed2019
Audited
5.1 Balances with related partiesBorrowings 28 240 27 106 25 251 Dividend received from associate included in trade and other receivables 4 394 2 466 –
5.2 Transactions with related partiesDividends declared (4 443) (4 720) (9 107)Finance costs (1 124) (1 007) (2 294)
5.3 Directors’ and key management personnel remuneration Compensation paid to the Group’s Board and key management personnel will be disclosed
in the Group’s consolidated annual financial statements for the year ended 31 March 2020, which will be available online.
M Joseph stepped down from the Board with effect from 24 July 2019 and was replaced by LS Wood, who was appointed to the Board as a non-executive director on the same day. F Bianco was appointed as alternate director to LS Wood on 24 July 2019.

Notes to the preliminary condensed consolidated financial statements continued
6. Capital commitmentsSix months ended
30 SeptemberYear ended
31 March
Rm2019
Reviewed2018
Reviewed2019
Audited
Capital expenditure contracted for but not yet incurred 1 5 263 5 177 3 210
1. In terms of the Group’s facilities leasing, services and roaming agreements with Rain Networks (Pty) Limited, the Group will incur R1 088 million (30 September 2018: R1 325 million; 31 March 2019: R1 121 million) future capital expenditure. The majority of this expenditure is non-current. Capital commitments do not include the aforementioned.
7. Capital expenditure incurredSix months ended
30 SeptemberYear ended
31 March
Rm2019
Reviewed2018
Reviewed2019
Audited
Capital expenditure additions including software 6 349 5 334 12 957
8. Business combination 10T Holdings (Pty) Limited and IoT.nxt B.V. acquisition The Group acquired a 51% equity interest in 10T Holdings (Pty) Limited and IoT.nxt B.V. (together “IoT.nxt”)
for a maximum consideration of R1 028 million, of which R469 million was settled in cash, with the remainder being contingent on the future performance of the business. IoT.nxt creates data-connectivity between new data sources and legacy systems which allows for real-time data availability across a wide business segment. The effective date of the acquisition was 23 August 2019.
The acquisition of IoT.nxt will help in accelerating the Group’s internet of things (IoT) strategy, and take advantage of the significant opportunities within the IoT space.
The fair value of receivables acquired approximates their carrying amount due to the short-term nature thereof.
34

35
Vodacom Group Limited Interim results for the six months ended 30 September 2019
8. Business combination continued 10T Holdings (Pty) Limited and IoT.nxt B.V. acquisition continued The preliminary amounts recognised as at the acquisition date were as follows:
Rm Reviewed
Property, plant and equipment 8 Brand 7 Technology 28 Right of use asset 13 Financial assets 2 Inventory 6 Trade and other receivables 139 Bank and cash balances 203 Trade and other payables (93)Borrowings (142)Deferred tax (13)
Fair value of net assets acquired 158 Non-controlling interest (23)Goodwill 551
Purchase price 686
– Cash 469 – Fair value of contingent consideration 217
Cash and cash equivalents (203)Final settlement adjustment receivable (217)
Cash consideration 266
Due to the proximity of the acquisition to the interim reporting date and the complexity involved with regards to fair value determinations of the assets acquired and the consideration paid, the preliminary numbers will be finalised during the measurement period of twelve months from date of acquisition.
Non-controlling interest was measured at the proportionate value of assets and liabilities.
Goodwill recognised amounted to R551 million and represents future synergies.
The acquisition date fair value of the consideration has been determined as R686 million, after raising a liability for contingent consideration payable of R217 million. The estimate of the fair value of the contingent consideration payable is based on the probability weighted payout approach.
Due to the proximity of the acquisition to the interim reporting date the amounts of revenue and profit or loss included in the income statement are insignificant.
9. Changes in subsidiary holdingsThe Group acquired 588 million shares in Vodacom Tanzania Plc (Vodacom Tanzania) from its local Tanzanian shareholder, Mirambo Limited (Mirambo), resulting in the Group increasing its total interest in Vodacom Tanzania from 61.6% (direct and indirect) to 75% (direct). The transaction was effective on 27 September 2019, and a purchase consideration to the value of US$224 million (R 3 417 million) was paid in cash.

Notes to the preliminary condensed consolidated financial statements continued
10. BorrowingsOn 7 June 2019, a R1 500 million loan facility was obtained from Vodafone Investments Luxembourg s.a.r.l. for a 3 year term at a rate of 3 months Jibar +1.04%. The loan is repayable 7 June 2022.
On 10 September 2019, a short term loan of US$98 million was obtained from Vodafone Group Plc at a rate of Overnight Libor +0.2% for payment of a portion of the purchase consideration for the acquisition of additional shares in Vodacom Tanzania (Note 9).
Vodacom Congo (RDC) SA (Vodacom Congo) refinanced its existing loan of US$75 million with Standard Bank South Africa at a rate of 6 month LIBOR +1.90% with a repayment date of 25 September 2022. This loan is guaranteed by Vodacom Group Limited. Vodacom Congo also obtained an additional US$25 million non-recourse loan at a rate of 6 month Libor +3,60% with a repayment date of 5 August 2022.
11. Prior period restatementUnrealised gains and losses on the mark-to-market of open forward exchange contracts (FECs) were recognised incorrectly on a gross basis as cash flows on the condensed consolidated statement of cash flows for the six months ended 30 September 2018. This treatment was subsequently corrected for the financial year ended 31 March 2019. The impact of this restatement on the consolidated statement of cash flows was as follows:
Six months ended 30 September 2018
RmPreviously
reported Restated Restatement
Finance income received 1 513 328 1 185Net cash flows utilised in investing activities (6 622) (7 807) 1 185
Finance costs paid (2 704) (1 519) (1 185)Net cash flows utilised in financing activities (9 710) (8 525) (1 185)
12. Contingent liabilities12.1 Guarantees
The Group has various guarantees in issue, relating to external financial obligations of its subsidiaries, which amounted to R43 million (30 September 2018: R125 million; 31 March 2019: R138 million).
Foreign denominated guarantees amounting to R1 137 million (30 September 2018: R1 063 million; 31 March 2019: R1 082 million) are in issue in support of Vodacom Congo relating to liabilities included in the consolidated statement of financial position.
12.2 Tax mattersThe Group is regularly subject to an evaluation by tax authorities of its direct and indirect tax filings. The consequence of such reviews is that disputes may arise with tax authorities over the interpretation or application of certain tax rules to the Group’s business. The tax laws are in some instances ambiguous and subject to a broad range of interpretations. To address and manage this tax uncertainty, good governance is fundamental to the Group’s business sustainability. All major tax positions taken are subject to review by executive management and are reported to the Board. The Group has support from external advisors supporting the positions taken in respect of the significant tax matters which confirms the application and interpretation of the tax legislation. The Group has considered all matters in dispute and has accounted for any exposure identified, if required. These disputes may not necessarily be resolved in a manner that is favourable to the Group.
12.3 Legal contingenciesThe Group is currently involved in various legal proceedings and has, in consultation with its legal counsel, assessed the outcome of these proceedings. Following this assessment, the Group’s management has determined that adequate provision has been made in respect of these legal proceedings as at 30 September 2019.
36

37
Vodacom Group Limited Interim results for the six months ended 30 September 2019
13. Other matters13.1 Kenneth Makate (Mr Makate) vs Vodacom (Pty) Limited
Following the failure of the parties to reach an agreement, Mr Makate declared a deadlock and referred the matter to the Group’s Chief Executive Officer, in his judicially sanctioned role as a deadlock breaking mechanism (the deadlock breaker), to make a determination on the reasonable amount of compensation payable to him. The deadlock breaker has made such a determination, in accordance with the Constitutional Court order, but Mr Makate has rejected the deadlock breaker’s determination. Mr Makate is applying to the High Court of South Africa’s Gauteng Division, for an order to have the decision of the deadlock breaker reviewed and set aside.
13.2 Competition Commission data service market inquiryThe Competition Commission initiated a market inquiry into data services and issued provisional findings and recommendations on 24 April 2019, the final report of which is expected towards the end of December 2019.
13.3 ICASA inquiry into mobile broadband servicesICASA is currently conducting an inquiry to identify priority markets in terms of section 4B of the ICASA Act. The purpose of the study is to identify markets to be prioritised for potential review and regulation. On 16 November 2018, ICASA commenced a market inquiry into mobile broadband services. The purpose of the inquiry is to assess the state of competition and determine whether or not there are markets or market segments within the mobile broadband services value chain which may require regulatory intervention. ICASA aims to finalise the inquiry by the second calendar quarter of 2020.
13.4 Policy on High Demand Spectrum and policy directionThe policy on High Demand Spectrum (HDS) and policy direction on the licensing of a wireless open access network (WOAN) was gazetted in July 2019. The policy recommends that HDS be assigned to the WOAN and the remaining HDS assigned to other Electronic Communications Network Service (ECNS) licencees. Under the policy direction, ICASA is directed to issue an Invitation to Apply (ITA), and consider applications for an individual ECNS license for the WOAN.
ICASA issued an Information memorandum (IM) on 1 November 2019. The IM sets out ICASA’s proposed requirements, options for spectrum allotments, obligations and other consideration for assignment of HDS. Interested parties are invited to make proposals and recommendations on a number of aspects including the options for spectrum allocation, obligations, process and other requirements by 31 January 2020.
13.5 Vodacom Congo (RDC) SA (Vodacom Congo)13.5.1 Organisation for the Harmonisation of Business Law in Africa (OHADA)
Vodacom Congo is not in compliance with the minimum capital requirements as set out under the OHADA. Vodacom Congo has to increase its share capital to meet the minimum OHADA requirements. In a bid to remedy this non- compliance, the shareholders of Vodacom Congo agreed on 28 December 2018 to convert the initial shareholder loans into equity. This recapitalisation resulted in a 32% improvement in the negative equity position. A non-compliance gap remains, which is under discussion by the Board and shareholders of Vodacom Congo.
13.5.2 Investigation on unpaid taxes for devicesThe Democratic Republic of Congo (DRC) Customs Authority (DGDA) has instituted a criminal claim against Vodacom Congo for unpaid custom duties on alleged smuggled devices bought by Vodacom Congo from a local supplier, who subsequently closed its business in the DRC. The Group has noted an objection to this claim, and is co-operating with the relevant authorities.
13.5.3 Vodacom Congo 2G LicenseVodacom Congo resolved a long standing dispute over a claim that its 2G license was not properly renewed in December 2015. Vodacom Congo paid US$30 million for the renewal of its 2G license extending its validity to 2039, plus US$7 million in penalties and administrative costs.

Notes to the preliminary condensed consolidated financial statements continued
13. Other matters continued13.6 Customer registration
The Group continues to register customers to achieve full compliance, and continues to participate in government and industry coordinated meetings overseeing the implementation of customer registration.
The Tanzania Telecommunication Authority (TCRA) directed biometric registration of customers using national identification cards to commence on 1 May 2019. The implementation of biometric registration will be a challenge given the low penetration of national identification cards, the associated cost as well as the deadline of 31 December 2019 set by the regulator. While all the necessary measures are taken to ensure compliance, there are concerns on the wider impact of the envisaged December deadline if customers will have to be disconnected to ensure compliance.
14. Events after the reporting periodThe Board is not aware of any matter or circumstance arising since the end of the reporting period, not otherwise dealt with herein, which significantly affects the financial position of the Group or the results of its operations or cash flows for the period, other than the following:
14.1 Dividend declared after the reporting date and not recognised as a liabilityAn interim dividend of R6 976 million (380 cents per ordinary share) for the year ending 31 March 2020, as well as a special dividend of R1 102 million (60 cents per share) was declared on 8 November 2019, payable on 2 December 2019 to shareholders recorded in the register at the close of business on 29 November 2019. The net interim dividend after taking into account dividend withholding tax for those shareholders not exempt from dividend withholding tax is 304.00000 cents per share. The net special dividend after taking into account dividend withholding tax for those shareholders not exempt from dividend withholding tax is 48.00000 cents per share.
38
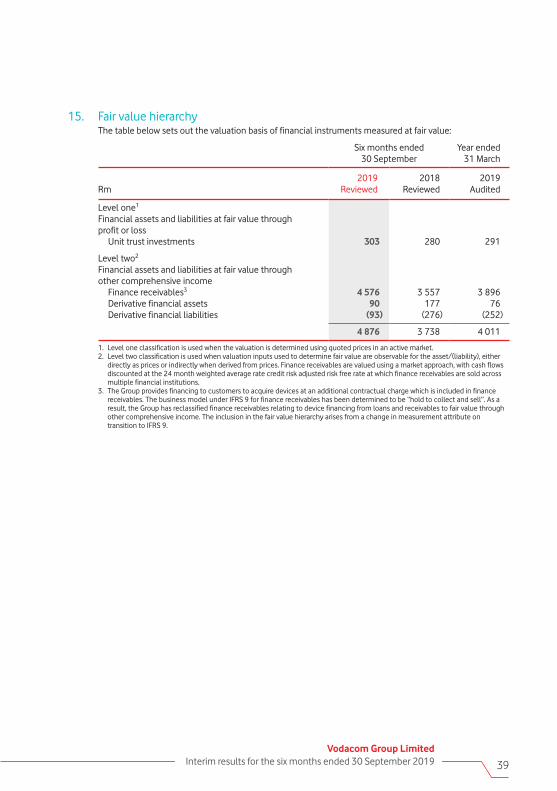
39
Vodacom Group Limited Interim results for the six months ended 30 September 2019
15. Fair value hierarchy The table below sets out the valuation basis of financial instruments measured at fair value:
Six months ended 30 September
Year ended31 March
Rm2019
Reviewed2018
Reviewed2019
Audited
Level one1 Financial assets and liabilities at fair value through profit or loss Unit trust investments 303 280 291
Level two2
Financial assets and liabilities at fair value through other comprehensive income Finance receivables3 4 576 3 557 3 896 Derivative financial assets 90 177 76 Derivative financial liabilities (93) (276) (252)
4 876 3 738 4 011
1. Level one classification is used when the valuation is determined using quoted prices in an active market. 2. Level two classification is used when valuation inputs used to determine fair value are observable for the asset/(liability), either
directly as prices or indirectly when derived from prices. Finance receivables are valued using a market approach, with cash flows discounted at the 24 month weighted average rate credit risk adjusted risk free rate at which finance receivables are sold across multiple financial institutions.
3. The Group provides financing to customers to acquire devices at an additional contractual charge which is included in finance receivables. The business model under IFRS 9 for finance receivables has been determined to be “hold to collect and sell”. As a result, the Group has reclassified finance receivables relating to device financing from loans and receivables to fair value through other comprehensive income. The inclusion in the fair value hierarchy arises from a change in measurement attribute on transition to IFRS 9.

Supplementary information
1. The Group’s effective interest of 34.94% in Safaricom Pic (Safaricom) is accounted for as an investment in associate. Results represent 100% of Safaricom and is for information purposes only.
Operating results for the six months ended 30 September 2019
IFRS 16Rm
South Africa
%18/19
Inter-national
%18/19
Corporate/Eliminations Group
%18/19 Safaricom1
Mobile contract revenue 9 824 (2.5) 656 22.8 (3) 10 477 (1.3) 1 708Mobile prepaid revenue 11 548 (2.1) 8 513 17.1 (1) 20 060 5.2 14 215
Customer service revenue 21 372 (2.3) 9 169 17.5 (4) 30 537 2.9 15 923
Mobile interconnect 992 0.2 650 1.4 (320) 1 322 0.4 594Fixed service revenue 1 518 16.1 895 11.3 (234) 2 179 12.4 646Other service revenue 1 915 24.0 66 (18.5) (16) 1 965 21.7 487
Service revenue 25 797 0.3 10 780 15.5 (574) 36 003 4.2 17 650
Equipment revenue 6 508 (1.3) 213 12.7 (9) 6 712 (0.9) 603Non-service revenue 1 612 19.5 152 25.6 (90) 1 674 21.4 189
Revenue 33 917 0.8 11 145 15.6 (673) 44 389 3.9 18 442Direct expenses (13 512) 4.4 (3 233) 11.3 584 (16 161) 5.4 (5 371)Staff expenses (2 177) 7.1 (870) 7.0 (242) (3 289) 6.7 (1 025)Publicity expenses (606) (2.4) (297) – 1 (902) (2.5) (482)Other operating expenses (3 741) (12.7) (2 400) (12.2) 281 (5 860) (14.9) (1 855)Share based payment charges – – – – – – – –Depreciation and amortisation (4 711) 23.8 (2 251) 49.3 (5) (6 967) 31.1 (3 733)Impairment charges – – – – – – – –Net profit from associate and joint venture – – – – 1 673 1 673 24.4 7
Operating profit 9 170 4.0 2 094 51.4 1 619 12 883 16.0 5 983
EBITDA 13 916 0.8 4 298 47.7 (48) 18 166 9.9 9 703EBITDA margin (%) 41.0 – 38.6 8.4ppt – 40.9 2.2ppt 52.6EBITDA-aL 12 872 n/a 3 351 n/a (20) 16 203 n/a 9 386 EBITDA-aL margin (%) 38.0 n/a 30.1 n/a – 36.5 n/a 50.9
Included in service revenue:M-Pesa revenue – – 1 937 37.4 – 1 937 37.4 5 957
40

41
Vodacom Group Limited Interim results for the six months ended 30 September 2019
1. The Group’s effective interest of 34.94% in Safaricom Pic (Safaricom) is accounted for as an investment in associate. Results represent 100% of Safaricom and is for information purposes only.
Operating results for the six months ended 30 September 2018
IAS 17Rm South Africa International
Corporate/ Eliminations Group Safaricom1
Mobile contract revenue 10 080 534 (2) 10 612 2 110Mobile prepaid revenue 11 799 7 272 (1) 19 070 12 047
Customer service revenue 21 879 7 806 (3) 29 682 14 157
Mobile interconnect 990 641 (314) 1 317 561Fixed service revenue 1 308 804 (174) 1 938 511Other service revenue 1 544 81 (10) 1 615 451
Service revenue 25 721 9 332 (501) 34 552 15 680
Equipment revenue 6 592 189 (5) 6 776 469Non-service revenue 1 349 121 (91) 1 379 155
Revenue 33 662 9 642 (597) 42 707 16 304Direct expenses (12 946) (2 906) 521 (15 331) (4 690)Staff expenses (2 032) (813) (238) (3 083) (946)Publicity expenses (621) (298) (7) (925) (394)Other operating expenses (4 287) (2 734) 135 (6 887) (2 080)Share based payment charge (1 150) – (254) (1 404) (1)Depreciation and amortisation (3 805) (1 508) (3) (5 316) (3 421)Impairment charges – – – – – Net profit from associate and joint venture – – 1 345 1 345
Operating profit 8 821 1 383 902 11 106 4 772
EBITDA 13 810 2 910 (186) 16 534 8 183EBITDA margin (%) 41.0 30.2 38.7 50.2EBITDA-aL – – – – –EBITDA-aL margin (%) – – – – –
Included in service revenue:M-Pesa revenue – 1 410 – 1 410 4 720

Supplementary information continued
South Africa key indicatorsSix months ended
30 September % change
2019 2018 18/19
Customers1 (thousand) 43 857 44 089 (0.5)Prepaid 37 830 38 552 (1.9)Contract 6 027 5 537 8.8
Data customers2 (thousand) 21 420 20 538 4.3
Internet of Things connections3 (thousand) 4 574 4 004 14.2
Traffic4 (millions of minutes) 32 018 31 756 0.8Outgoing 27 038 27 101 (0.2)Incoming 4 980 4 655 7.0
MOU per month5 122 123 (0.8)Prepaid 111 112 (0.9)Contract 193 201 (4.0)
Total ARPU6 (rand per month) 85 88 (3.4)Prepaid 53 54 (1.9)Contract 291 325 (10.5)
Messaging (million) 4 453 4 425 0.6
Number of employees 5 149 5 163 (0.3)
Notes:1. Customers are based on the total number of mobile customers using any service during the last three months. This includes customers
paying a monthly fee that entitles them to use the service even if they do not actually use the service and those customers who are active whilst roaming.
2. Data customers are based on the number of unique users generating billable data traffic during the month. Also included are users on integrated tariff plans, or who have access to corporate APNs, and users who have been allocated a revenue generating data bundle during the month. A user is defined as being active if they are paying a contractual monthly fee for this service or have used the service during the reported month.
3. Internet of Things connections (IoT), is the remote wireless interchange between two or more predefined devices or a central station without direct relationship with an end customer, in order to support a specific business process or product.
4. Traffic comprises total traffic registered on Vodacom‘s mobile network, including bundled minutes, promotional minutes and outgoing international roaming calls, but excluding national roaming calls, incoming international roaming calls and calls to free services.
5. Minutes of use (MOU) per month is calculated by dividing the average monthly minutes (traffic) during the period by the average monthly customers during the period.
6. Total ARPU is calculated by dividing the average monthly service revenue by the average monthly customers during the period. Prepaid and contract ARPU only include service revenue generated from Vodacom mobile customers.
42

43
Vodacom Group Limited Interim results for the six months ended 30 September 2019
International key indicatorsSix months ended
30 September % change
2019 2018 18/19
Customers1 (thousand) 36 587 34 715 5.4Tanzania 14 755 13 991 5.5DRC 12 995 12 801 1.5Mozambique 7 279 6 405 13.6Lesotho 1 558 1 518 2.6
Data customers2 (thousand) 19 678 17 964 9.5Tanzania 8 166 8 064 1.3DRC 6 071 5 042 20.4Mozambique 4 656 4 161 11.9Lesotho 785 697 12.6
30-day active M-Pesa customers3 (thousand) 14 297 13 182 8.5Tanzania 7 197 6 818 5.6DRC 2 228 2 324 (4.1)Mozambique 4 217 3 579 17.8Lesotho 655 461 42.1
MOU per month4
Tanzania 175 181 (3.3)DRC 33 38 (13.2)Mozambique 130 132 (1.5)Lesotho 83 70 18.6
Total ARPU5 (rand per month)Tanzania 38 36 5.6DRC 46 40 15.0Mozambique 59 55 7.3Lesotho 72 63 14.3
Total ARPU5 (local currency per month)Tanzania (TZS) 5 976 6 045 (1.1)DRC (US$) 3.2 3.0 6.7Mozambique (MZN) 251 243 3.3
Number of employees 2 372 2 388 (0.7)
Notes:1. Customers are based on the total number of mobile customers using any service during the last three months. This includes customers
paying a monthly fee that entitles them to use the service even if they do not actually use the service and those customers who are active whilst roaming.
2. Data customers are based on the number of unique users generating billable data traffic during the month. Also included are users on integrated tariff plans, or who have access to corporate APNs, and users who have been allocated a revenue generating data bundle during the month. A user is defined as being active if they are paying a contractual monthly fee for this service or have used the service during the reported month. Three month active.
3. M-Pesa customers are based on the number of unique customers who have generated revenue related to M-Pesa during the last month.4. Minutes of use (MOU) per month is calculated by dividing the average monthly minutes (traffic) during the period by the average monthly
customers during the period.5. Total ARPU is calculated by dividing the average monthly service revenue by the average monthly customers during the period.
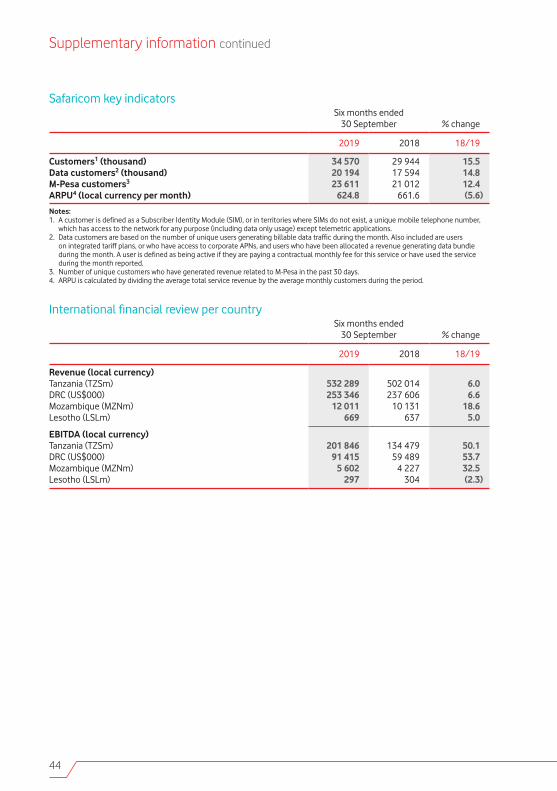
Supplementary information continued
Safaricom key indicatorsSix months ended
30 September % change
2019 2018 18/19
Customers1 (thousand) 34 570 29 944 15.5Data customers2 (thousand) 20 194 17 594 14.8M-Pesa customers3 23 611 21 012 12.4ARPU4 (local currency per month) 624.8 661.6 (5.6)
Notes:1. A customer is defined as a Subscriber Identity Module (SIM), or in territories where SIMs do not exist, a unique mobile telephone number,
which has access to the network for any purpose (including data only usage) except telemetric applications.2. Data customers are based on the number of unique users generating billable data traffic during the month. Also included are users
on integrated tariff plans, or who have access to corporate APNs, and users who have been allocated a revenue generating data bundle during the month. A user is defined as being active if they are paying a contractual monthly fee for this service or have used the service during the month reported.
3. Number of unique customers who have generated revenue related to M-Pesa in the past 30 days.4. ARPU is calculated by dividing the average total service revenue by the average monthly customers during the period.
International financial review per countrySix months ended
30 September % change
2019 2018 18/19
Revenue (local currency)Tanzania (TZSm) 532 289 502 014 6.0DRC (US$000) 253 346 237 606 6.6Mozambique (MZNm) 12 011 10 131 18.6Lesotho (LSLm) 669 637 5.0
EBITDA (local currency)Tanzania (TZSm) 201 846 134 479 50.1DRC (US$000) 91 415 59 489 53.7Mozambique (MZNm) 5 602 4 227 32.5Lesotho (LSLm) 297 304 (2.3)
44

45
Vodacom Group Limited Interim results for the six months ended 30 September 2019
Historical financial reviewRevenue for the quarter ended
Rm30 September
201930 June
201931 March
201931 December
201830 September
201830 June
2018
South Africa 17 358 16 559 17 053 17 172 17 147 16 515International 5 869 5 276 5 027 5 312 5 218 4 424Corporate and eliminations (365) (308) (332) (312) (311) (286)
Group revenue 22 862 21 527 21 748 22 172 22 054 20 653
Revenue yoy % change for the quarter endedReported Normalised*
%30 September
201930 June
201930 September
2019
South Africa 1.2 0.3 1.2International 12.5 19.3 9.5Corporate and eliminations 17.4 7.7 17.2
Group revenue 3.7 4.2 3.0
Service revenue for the quarter ended
Rm30 September
201930 June
201931 March
201931 December
201830 September
201830 June
2018
South Africa 13 220 12 577 12 845 12 975 12 985 12 736International 5 668 5 112 4 885 5 160 5 057 4 275Corporate and eliminations (318) (256) (289) (261) (263) (238)
Group service revenue 18 570 17 433 17 441 17 874 17 779 16 773
Service revenue yoy % change for the quarter endedReported Normalised*
%30 September
201930 June
201930 September
2019
South Africa 1.8 (1.2) 1.8International 12.1 19.6 9.2Corporate and eliminations 20.9 7.6 20.1
Group service revenue 4.4 3.9 3.6

Supplementary information continued
Exchange ratesAverage YTD Closing
30 September % change 30 September % change
2019 2018 18/19 2019 2018 18/19
US$/ZAR 14.54 13.37 8.8 15.16 14.17 7.0ZAR/MZN 4.29 4.48 (4.2) 4.07 4.26 (4.5)ZAR/TZS 158.29 170.80 (7.3) 151.56 161.23 (6.0)EUR/ZAR 16.24 15.73 3.2 16.53 16.46 0.4ZAR/KES 7.05 7.57 (6.9) 6.85 7.11 (3.7)
Average QTD Closing
30 September2019
30 June2019
31 March2019
31 December2018
30 September2019
30 June2019
31 March2019
31 December2018
US$/ZAR 14.68 14.39 14.02 14.30 15.16 14.10 14.42 14.38ZAR/MZN 4.20 4.39 4.45 4.27 4.07 4.41 4.40 4.27ZAR/TZS 156.76 159.82 165.36 160.27 151.56 163.11 160.37 159.85EUR/ZAR 16.32 16.17 15.92 16.31 16.53 16.06 16.18 16.47ZAR/KES 7.05 7.04 7.19 7.13 6.85 7.25 6.99 7.09
46

47
Vodacom Group Limited Interim results for the six months ended 30 September 2019
Historical key indicatorsSouth Africa for the quarter ended
30 September 2019
30 June 2019
31 March2019
31 December2018
30 September2018
30 June2018
31 March2018
Customers1 (thousand) 43 857 43 774 43 166 43 838 44 089 43 107 41 635Prepaid 37 830 37 853 37 331 38 215 38 552 37 671 36 275Contract 6 027 5 921 5 835 5 623 5 537 5 436 5 360
Data customers2 (thousand) 21 420 19 930 19 952 20 345 20 538 20 434 20 347
Internet of Things connections3 (thousand) 4 574 4 537 4 514 4 335 4 004 3 881 3 628
Traffic4 (millions of minutes) 16 324 15 695 15 330 15 987 16 128 15 628 15 385Outgoing 13 784 13 255 12 996 13 595 13 768 13 333 13 101Incoming 2 540 2 440 2 334 2 392 2 360 2 295 2 284
MOU per month5 124 120 118 121 123 123 124Prepaid 113 109 106 110 112 111 113Contract 194 191 193 197 201 201 199
Total ARPU6 (rand per month) 85 85 87 86 88 89 n/aPrepaid 53 53 54 55 54 55 n/aContract 291 290 304 307 325 326 n/a
Notes:1. Customers are based on the total number of mobile customers using any service during the last three months. This includes customers
paying a monthly fee that entitles them to use the service even if they do not actually use the service and those customers who are active whilst roaming.
2. Data customers are based on the number of unique users generating billable data traffic during the month. Also included are users on integrated tariff plans, or who have access to corporate APNs, and users who have been allocated a revenue generating data bundle during the month. A user is defined as being active if they are paying a contractual monthly fee for this service or have used the service during the reported month.
3. Internet of Things connections (IoT), is the remote wireless interchange between two or more predefined devices or a central station without direct relationship with an end customer, in order to support a specific business process or product.
4. Traffic comprises total traffic registered on Vodacom‘s mobile network, including bundled minutes, promotional minutes and outgoing international roaming calls, but excluding national roaming calls, incoming international roaming calls and calls to free services.
5. Minutes of use (MOU) per month is calculated by dividing the average monthly minutes (traffic) during the period by the average monthly customers during the period.
6. Total ARPU is calculated by dividing the average monthly service revenue by the average monthly customers during the period. Prepaid and contract ARPU only include service revenue generated from Vodacom mobile customers.

Supplementary information continued
Historical key indicators continuedInternational for the quarter ended
30 September 2019
30 June 2019
31 March2019
31 December2018
30 September2018
30 June2018
31 March2018
Customers1 (thousand) 36 587 35 180 34 620 35 164 34 715 33 401 32 415Tanzania 14 755 14 322 14 133 14 070 13 991 13 277 12 899DRC 12 995 12 348 12 180 12 830 12 801 12 279 11 821Mozambique 7 279 7 108 6 843 6 689 6 405 6 255 6 108Lesotho 1 558 1 402 1 464 1 575 1 518 1 590 1 587
Data customers2 (thousand) 19 678 18 964 17 664 18 522 17 964 17 472 16 573Tanzania 8 166 8 106 7 892 8 132 8 064 7 682 7 345DRC 6 071 5 660 4 749 5 021 5 042 5 150 4 825Mozambique 4 656 4 455 4 289 4 577 4 161 3 952 3 730Lesotho 785 743 734 792 697 688 673
MOU per month3
Tanzania 180 170 157 168 186 177 161DRC 34 32 31 36 39 38 36Mozambique 133 127 136 146 134 129 144Lesotho 85 81 74 82 73 68 71
30-day active M-Pesa customers4 (thousand) 14 297 14 186 13 500 13 409 13 182 12 711 11 757Tanzania 7 197 7 277 6 989 6 892 6 818 6 805 6 369DRC 2 228 2 284 2 116 2 240 2 324 2 127 1 891Mozambique 4 217 4 028 3 860 3 775 3 579 3 367 3 109Lesotho 655 597 535 502 461 412 388
Total ARPU5 (rand per month)Tanzania 39 37 35 39 38 33 n/aDRC 48 44 41 41 43 37 n/aMozambique 62 55 53 60 59 51 n/aLesotho 71 73 66 72 64 61 n/a
Total ARPU5 (local currency per month)Tanzania (TZS) 6 050 5 901 5 752 6 205 6 116 5 969 n/aDRC (US$) 3.3 3.1 2.9 2.9 3.0 3.0 n/aMozambique (MZN) 261 241 234 255 248 239 n/a
Notes:1. Customers are based on the total number of mobile customers using any service during the last three months. This includes customers
paying a monthly fee that entitles them to use the service even if they do not actually use the service and those customers who are active whilst roaming.
2. Data customers are based on the number of unique users generating billable data traffic during the month. Also included are users on integrated tariff plans, or who have access to corporate APNs, and users who have been allocated a revenue generating data bundle during the month. A user is defined as being active if they are paying a contractual monthly fee for this service or have used the service during the reported month.
3. Minutes of use (MOU) per month is calculated by dividing the average monthly minutes (traffic) during the period by the average monthly customers during the period.
4. M-Pesa customers are based on the number of unique customers who have generated revenue related to M-Pesa during the last month.5. Total ARPU is calculated by dividing the average monthly service revenue by the average monthly active customers during the period.
Prepaid and contract ARPU only include service revenue generated from Vodacom mobile customers.
48

49
Vodacom Group Limited Interim results for the six months ended 30 September 2019
Pro-forma financial informationThe presentation of the pro-forma financial information and related reconciliations as detailed below on pages 49 – 53, is the responsibility of the directors of Vodacom Group Limited. The purpose of presenting financial information on a comparable and normalised growth constant currency basis is to assist the user in understanding the underlying growth trends on a comparable basis. The information has been adjusted for differences in reporting under IFRS 16 in the current year and IAS 17 in the prior year to ensure comparability of underlying growth. The presentation of operating free cash flow and free cash flow is to provide users with relevant information and measures used by the Group to assess performance. Operating profit has been adjusted for significant merger and acquisition events which includes the BEE ownership transaction completed in the prior year. It has been prepared for illustrative purposes only and may not fairly present the financial position, changes in equity, and results of operations or cash flows of Vodacom Group Limited. This pro-forma financial information has not been reported on by the Group’s auditors, being Ernst and Young Inc.
Reconciliation of normalised growth for the six months ended 30 September 2019
Rm Reported1 Trading FX2Merger andAcquisition4
IFRS 16related
adjustment5 Normalised*
RevenueGroup 44 389 – – – 44 389International 11 145 – – – 11 145
Service revenueGroup 36 003 – – – 36 003International 10 780 – – – 10 780
M-Pesa revenueInternational 1 937 – – – 1 937
Total expensesGroup 26 212 (25) – – 26 187International 6 800 (4) – – 6 796South Africa 20 036 (19) – – 20 017
EBITDAGroup 18 166 25 – – 18 191International 4 298 4 – – 4 302South Africa 13 916 19 – – 13 935
Operating profitGroup 12 883 25 – 1 396 14 304International 2 094 4 – 552 2 650South Africa 9 170 19 – 775 9 964

Supplementary information continued
Reconciliation of normalised growth for the six months ended 30 September 2018 Foreign exchange
Rm Reported1Trading
FX2Translation
FX3
Mergerand
Acquisition4
IFRS 16related
adjustment5 Normalised*
RevenueGroup 42 707 – 614 – – 43 321International 9 642 – 614 – – 10 256
Service revenueGroup 34 552 – 585 – – 35 137International 9 332 – 585 – – 9 917
M-Pesa revenueInternational 1 410 – 93 – – 1 503
Total expensesGroup 26 226 (45) 451 – (1 320) 25 312International 6 751 (8) 451 – (649) 6 545South Africa 19 886 (22) – – (671) 19 193
EBITDAGroup 16 534 45 162 – 1 320 18 061International 2 910 8 162 – 649 3 729South Africa 13 810 22 – – 671 14 503
Operating profitGroup 11 106 45 156 1 404 1 428 14 139International 1 383 8 58 – 649 2 098South Africa 8 821 22 – 1 150 671 10 664
50

51
Vodacom Group Limited Interim results for the six months ended 30 September 2019
Reconciliation of normalised growth for the six months ended 30 September 2019The reconciliation below presents normalised growth adjusted for trading foreign exchange gains/losses, merger and acquisition and at a constant currency (using current period as base) from on-going operations and IFRS 16 related adjustments, to show a like-for-like comparison of results.
Foreign exchange
% % change6Trading FX2
pptsTranslation
FX3 ppts
Merger and
Acquisition4
ppts
IFRS 16 related
adjustment5Normalised*
% change
RevenueGroup 3.9 – (1.4) – – 2.5International 15.6 – (6.9) – – 8.7
Service revenueGroup 4.2 – (1.7) – – 2.5International 15.5 – (6.8) – – 8.7
M-Pesa revenueInternational 37.4 – (8.5) – – 28.9
Total expenses –Group (0.1) 0.1 (1.7) – 5.2 3.5International 0.7 0.1 (6.3) – 9.3 3.8South Africa 0.8 – – – 3.5 4.3
EBITDAGroup 9.9 (0.2) (1.0) – (8.0) 0.7International 47.7 (0.3) (7.7) – (24.3) 15.4South Africa 0.8 (0.1) – – (4.6) (3.9)
Operating profitGroup 16.0 (0.2) (1.6) (12.7) (0.3) 1.2International 51.4 (0.6) (6.0) – (18.5) 26.3South Africa 4.0 (0.1) – (11.9) 1.4 (6.6)

Supplementary information continued
Reconciliation of normalised growth for the quarter ended30 September 2019Rm Reported Translation FX3 Normalised*
RevenueGroup 22 862 (70) 22 792International 5 869 (70) 5 799
Service revenueGroup 18 570 (68) 18 502International 5 668 (68) 5 600
30 September 2018Rm Reported Translation FX3 Normalised*
RevenueGroup 22 054 77 22 131International 5 218 77 5 295
Service revenueGroup 17 779 73 17 852International 5 057 73 5 130
30 September 2019% % change7
Translation FX3
pptsNormalised*
% change
RevenueGroup 3.7 (0.7) 3.0International 12.5 (3.0) 9.5
Service revenueGroup 4.4 (0.8) 3.6International 12.1 (2.9) 9.2
Notes:1. The financial information relating to revenue, service revenue, total expenses, EBITDA and operating profit are derived from the condensed
consolidated interim financial statements for the six months ended 30 September 2019.2. Trading foreign exchange adjustments (FX) are foreign exchange gains/losses on foreign denominated monetary assets and liabilities
resulting from trading activities of entities within the Group, which is included with other operating expenses as per the condensed consolidated income statement.
3. The Group’s presentation currency is the South African rand. Our International operations utilise a number of functional currencies, for example the United States dollar, Tanzanian shilling, Mozambican metical, Nigerian naira and Zambian kwacha. The prevailing exchange rates for the current and comparative periods are disclosed on page 46. Translation foreign exchange (FX) arises from the translation of the results, at average rates, of subsidiaries’ functional currencies to Vodacom’s presentation currency, being rand. The exchange variances are eliminated by applying the average rate for the six months ended 30 September 2019 (which is derived by dividing the individual subsidiary’s translated rand value with the functional currency for the period) to 30 September 2018 numbers, thereby giving a user a view of the performance which excludes exchange variances.
4. Merger and Acquisition relates to the IFRS 2 charge as disclosed in Note 8 in the condensed consolidated financial statements for the six months ended 30 September 2018.
5. In the current year, we account for depreciation expensed on the right of use assets recognised on 1 April 2019 on the adoption of IFRS 16. In the 2018 period, the adjustment relates to the operating lease expense recognised in terms of IAS 17 and includes foreign currency fluctuation on a constant basis (using the current year base).
6. The percentage change relates to the year-on-year percentage growth calculated as the percentage change between the year-to-date 30 September 2019 and year-to-date 30 September 2018.
7. The percentage change relates to the quarter to date year-on-year percentage growth calculated as the percentage change between the quarter-to-date 30 September 2019 and the quarter-to-date 30 September 2018 IFRS 16 values.
52

53
Vodacom Group Limited Interim results for the six months ended 30 September 2019
Reconciliation of operating free cash flow and free cash flowSix months ended
30 September
Rm 2019 2018
Cash generated from operations1 16 349 13 889Cash capital expenditure2 (6 414) (6 283)Leased liability payments (1 894) –Movement in amounts due to M-Pesa account holders3 (565) (532)
Operating free cash flow 7 476 7 074Tax paid1 (3 192) (3 350)Finance income received1 444 328Finance costs paid1 (2 420) (1 519)Add back: Interest on lease liabilities 608 –Net dividends paid1 (167) (47)
Free cash flow 2 749 2 486
The reconciliation presents the reconciliation of cash generated from operators to free cash flow. Free cash flow excludes the movement in amounts due to M-Pesa account holders, and held on their behalf. Management excludes these balances to present a view of the true commercial cash conversion in the operation.
Notes:1. As per the condensed consolidated statement of cash flows.2. Cash capital expenditure as per the condensed consolidated statement of cash flows, excluding net capital expenditure of licence
and spectrum fee of R810 million (2018: R774 million) and acquisition of customer base of R15 million (2018: R0).3. Movements included in cash generated from operations relate to money held on behalf of M-Pesa customers.
IFRS 16 LeasesIFRS 16 Leases was adopted by the Group on 1 April 2019 with the cumulative retrospective impact reflected as an adjustment to equity on the date of adoption. The Group has applied the following expedients in relation to the adoption of IFRS 16, in terms of the transitional provisions of that standard:
• The right of use assets were measured at an amount equal to the lease liability at adoption, and initial direct costs incurred when obtaining leases were excluded from this measurement. Leases prepayments and accruals previously recognised under IAS 17 at 31 March 2019 were added and deducted, respectively, from the value of the right of use assets on adoption. In determining the cumulative retrospective impact recorded on 1 April 2019.
• The Group impaired the right of use assets recognised on adoption by the value of the provisions for onerous leases held under IAS 17 at 31 March 2019 instead of performing a new impairment assessment for those assets on adoption; and
• The Group excluded initial costs from measurement of the right of use assets on adoption.
Further details are explained in note 2 of the Notes to the condensed consolidated interim financial statements for the six months ended 30 September 2019 on pages 22 – 28.

Additional financial and operational measuresThis announcement contains certain financial (i.e. service revenue, enterprise service revenue and EBITDA) and operational (i.e. customers, ARPUs and number of employees) measures which are presented in addition to the financial information disclosed in the condensed consolidated interim financial statements for the six months ended 30 September 2019 which have been prepared in terms of IFRS. The Group’s management believes these measures provide valuable additional information in understanding the performance of the Group or the Group’s businesses because they provide measures used by the Group to assess performance. However, this additional information presented is not uniformly defined by all companies, including those in the Group’s industry. Accordingly, it may not be comparable with similarly titled measures and disclosures by other companies. Additionally, although these measures are important in the management of the business, they should not be viewed in isolation or as replacements for or alternatives to, but rather as complementary to, the condensed consolidated interim financial statements for the six month ended 30 September 2019. The financial measures have been extracted from the management accounts upon which the condensed consolidated financial statements for the six month ended 30 September 2019 are based. Refer to pages 7 – 9, 11 for details relating to service revenue, EBITDA, EBITDA-aL and headline earnings per share and the supplementary information on pages 49 to 53 for a reconciliation thereof to the reported results included in this announcement.
TrademarksVodafone, the Vodafone logo, M-Pesa, Connected Farmer, Vodafone Supernet, Vodafone Mobile Broadband, Vodafone WebBox, Vodafone Passport, Vodafone live!, Power to You, Vodacom, Vodacom 4 Less and Vodacom Change the World are trademarks of Vodafone Group Plc (or have applications pending). Other product and company names mentioned herein may be the trademarks of their respective owners.
Forward-looking statementsThis announcement which sets out the interim results for Vodacom Group Limited for the six month ended 30 September 2019 contains ‘forward-looking statements’, which have not been reviewed or reported on by the Group’s auditors, with respect to the Group’s financial condition, results of operations and businesses and certain of the Group’s plans and objectives. In particular, such forward-looking statements include, but are not limited to, statements with respect to: expectations regarding the Group’s financial condition or results of operations including the confirmation of the Group’s targets, expectations for the Group’s future performance generally; expectations regarding the operating environment and market conditions and trends; intentions and expectations regarding the development, launch and expansion of products, services and technologies; growth in customers and usage; expectations regarding spectrum licence acquisitions; expectations regarding adjusted EBITDA, capital additions, free cash flow, and foreign exchange rate movements; and expectations regarding the integration or performance of current and future investments, associates, joint ventures, non-controlled interests and newly acquired businesses.
Forward-looking statements are sometimes, but not always, identified by their use of a date in the future or such words as “will”, “anticipates”, “aims”, “could”, “may”, “should”, “expects”, “believes”, “intends”, “plans” or “targets” (including in their negative form). By their nature, forward-looking statements are inherently predictive, speculative and involve risk and uncertainty because they relate to events and depend on circumstances that may or may not occur in the future. There are a number of factors that could cause actual results and developments to differ materially from those expressed or implied by these forward-looking statements. These factors include, but are not limited to, the following: changes in economic or political conditions in markets served by operations of the Group; greater than anticipated competitive activity; higher than expected costs or capital expenditures; slower than expected customer growth and reduced customer retention; changes in the spending patterns of new and existing customers; the Group’s ability to expand its spectrum position or renew or obtain necessary licences; the Group’s ability to achieve cost savings; the Group’s ability to execute its strategy in fibre deployment, network expansion, new product and service roll-outs, mobile data, Enterprise and broadband; changes in foreign exchange rates, as well as changes in interest rates; the Group’s ability to realise benefits from entering into partnerships or joint ventures and entering into service franchising and brand licensing; unfavourable consequences to the Group of making and integrating acquisitions or disposals; changes to the regulatory framework in which the Group operates; the impact of legal or other proceedings; loss of suppliers or disruption of supply chains; developments in the Group’s financial condition, earnings and distributable funds and other factors that the Board takes into account when determining levels of dividends; the Group’s ability to satisfy working capital and other requirements; changes in statutory tax rates or profit mix; and/or changes in tax legislation or final resolution of open tax issues.
All subsequent written or oral forward-looking statements attributable to the Company, to any member of the Group or to any persons acting on their behalf are expressly qualified in their entirety by the factors referred to above. No assurances can be given that the forward-looking statements in this document will be realised. Subject to compliance with applicable law and regulations, Vodacom does not intend to update these forward-looking statements and does not undertake any obligation to do so.
Corporate information
54

Vodacom Group Limited(Incorporated in the Republic of South Africa)Registration number: 1993/005461/06(ISIN: ZAE000132577 Share Code: VOD)(ISIN: US92858D2009 ADR code: VDMCY)(Vodacom)
DirectorsPJ Moleketi (Chairman), MS Aziz Joosub (CEO),T Streichert (CFO)1, T Reisten1, V Badrinath2, DH Brown, L Wood3 (Alternate F Bianco4), BP Mabelane, SJ Macozoma, P Mahanyele-Dabengwa, JWL Otty3, S Sood5.1. German 2. French 3. American 4. British 5. Indian
Registered officeVodacom Corporate Park,082 Vodacom Boulevard,Midrand 1685(Private Bag X9904, Sandton 2146)
Transfer secretaryComputershare Investor Services (Proprietary) Limited(Registration number 2004/003647/07)Rosebank Towers15 Biermann AvenueRosebank 2196South Africa(PO Box 61051, Marshalltown 2107, South Africa)
SponsorUBS South Africa (Pty) Limited
ADR depository bankDeutsche Bank Trust Company Americas
Company secretarySF Linford
Investor relationsShaun van Biljon
Media relationsByron Kennedy
