visualising chord progressions in music collections...
TRANSCRIPT
Proceedings of the 9th Conference on Interdisciplinary Musicology – CIM14. Berlin, Germany 2014
VISUALISING CHORD PROGRESSIONS IN MUSIC COLLECTIONS:A BIG DATA APPROACH
Alexander Kachkaev1 , Daniel Wolff1 , Mathieu Barthet2, Dan Tidhar1,Mark Plumbley2, Jason Dykes1, Tillman Weyde1
1 City University London, Department of Computer Science2 Queen Mary University of London, Centre for Digital Music
Correspondence should be addressed to: [email protected]
Abstract: In the Digital Music Lab project we work on the auto-matic analysis of large audio databases that results in rich annotationsfor large corpora of music. The musicological interpretation of this datafrom thousands of pieces is a challenging task that can benefit greatlyfrom specifically designed interactive visualisation. Most existing bigmusic data visualisation focuses on cultural attributes, mood, or listenerbehaviour.In this ongoing work we explore chord sequence patterns extracted bysequential pattern mining of more than one million tracks from theI Like Music commercial music collection. We present here severalnew visual representations that summarise chord patterns according tochord types, chroma, pattern structure and support, enabling musicol-ogists to develop and answer questions about chord patterns in musiccollections.Our visualisations represent root movement and chord qualities mostlyin a geometrical way and use colour to represent pattern support. Weuse two individually configurable views in parallel to encourage com-parisons, either between different representations of one corpus, high-lighting complimentary musical aspects, or between different datasets,here representing different genres. We adapt several visualisationtechniques to chord pattern sets using some novel layouts to supportmusicologists with their exploration and interpretation of the corpora.We found that differences between chord patterns of different genres,e.g. Rock & Roll vs. Jazz, are visible and can be used to generatehypotheses for the study of individual pieces, further statistical inves-tigations or new data processing and visualisation. Our designs will beadapted as user needs are established through ongoing work. Means ofaggregating, focusing and filtering by selected characteristics (such askey, melodic patterns etc.) will be added as we develop our design for thevisualisation of chord patterns in close collaboration with musicologists.The visualisations are available as a web application athttp://dml.city.ac.uk/csvd/
1. INTRODUCTION
Our interest in the Digital Music Lab1 project lies in the analysisof large corpora of music, exposing their specificities, for exampleacross different genres, as well as determining the commonalitiesof the pieces within a corpus. To derive rich annotations atthe collection-level, we use automatic analysis methods from thefield of Music Information Retrieval in conjunction with Big Datamethods that enable fast and efficient analysis. The analysis of theresulting data is challenging. Graphical representations of musicand its structures can provide valuable tools for musicologists andmusic research.The musicological interpretation of the data resulting from thou-sands of pieces requires an adequate representation of this data.Various techniques exist for the analysis of harmony and chordsequences, such as chord charts, annotations of chord functions,but most conventional graphical representations are restricted to thescope of a single piece and do not trivially extend to collections ofpieces.Although recently more methods of collection-level visualisationhave been introduced, the available analysis focuses on culturalattributes, mood, or listener behaviour whereas we are focusing onattributes closer to the notation of the music itself (e.g. chords, keys,transcriptions, etc.).
1http://dml.city.ac.uk/
In this paper we present visualisations that present frequent chordsequence patterns obtained for different genres of popular music.Apart from determining the most frequent chord sequences, thedifferent visualisations can highlight various aspects of the analysisand support for comparison across different genres.
2. THE DATASETS
In our ongoing work we explore chord sequence patterns, i.e.frequently occurring parts of the chord progressions. The patterndata contain the chord sequence as it has been identified in the musicas well as the support value, which is the percentage of pieces inwhich a pattern appears.The sequences have been extracted using sequential pattern mining(the CM-SPADE algorithm [1]) on more than one million tracksof the “I Like Music” commercial music collection [2]. See [10]for details of the extraction process. In this paper we are lookingspecifically at genre-defined subsets, which are listed in Table 1.
Table 1: Genre subsets with numbers of tracks.
Genre TracksJazz 35991Rock & Roll 36654Classical 21446Blues 31618Reggae 13421Folk 45194Rap 24880
The most patterns are extracted from the genre-defined subsets.Table 2 shows the sequences of two or three chords with highestsupport in the Blues subset.
Table 2: Common chord sequences for the Blues collection.
Chord 1 Chord 2 Chord 3 ... SupportG C – – 13.134923C G – – 12.973623C F – – 11.771776C C7 – – 11.768613F C – – 11.616801...G C7 C – 6.923272D Gm – – 6.920109C7 C G7 – 6.920109...
3. THE VISUALISATION
We are designing new visual methods that summarise chord patternsets with regard to chord types, roots, structure and support,enabling musicologists to develop and answer questions about the
Proceedings of the 9th Conference on Interdisciplinary Musicology – CIM14. Berlin, Germany 2014
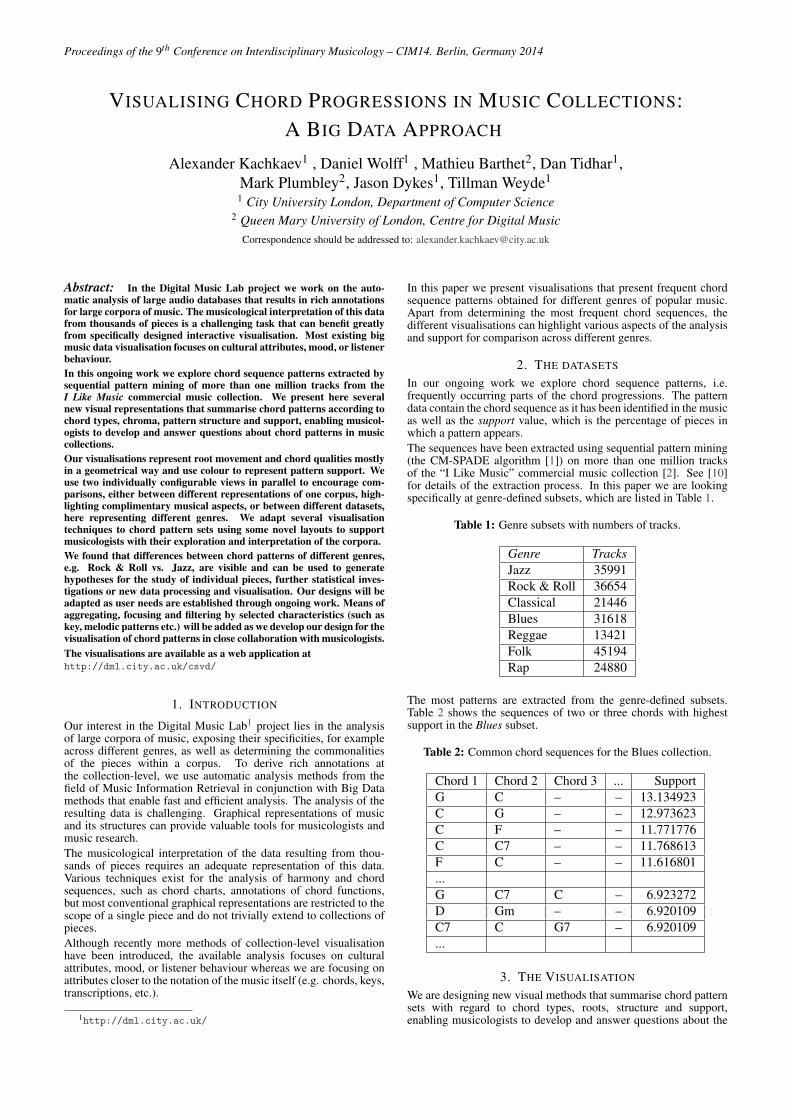
Figure 1: Interface of the chord progressions visualising tool. Available at http://dml.city.ac.uk/csvd/.
use of chord patterns in different genres. All data visualisations wehave developed are accessible through a single user interface, themain tasks of which are the following:
• to let the user observe the distribution of patterns in thedatasets;
• to support experimentation with various data layouts;• to support the visual comparison of different datasets and
visualisations.
3.1. Interface StructureThe interface is implemented as a web page, a snapshot of whichis shown in Figure 1. It consists of two independent panelswith controls to choose music genre, number of chord sequencepatterns to show, types of sequences (non-cyclic, cyclic or both),the visualisation technique to use and its configuration.This layout encourages the comparison between different visuali-sations of a corpus, which can highlight complementary musicalaspects, as well as the comparison between datasets, in this case thegenre-defined subsets.
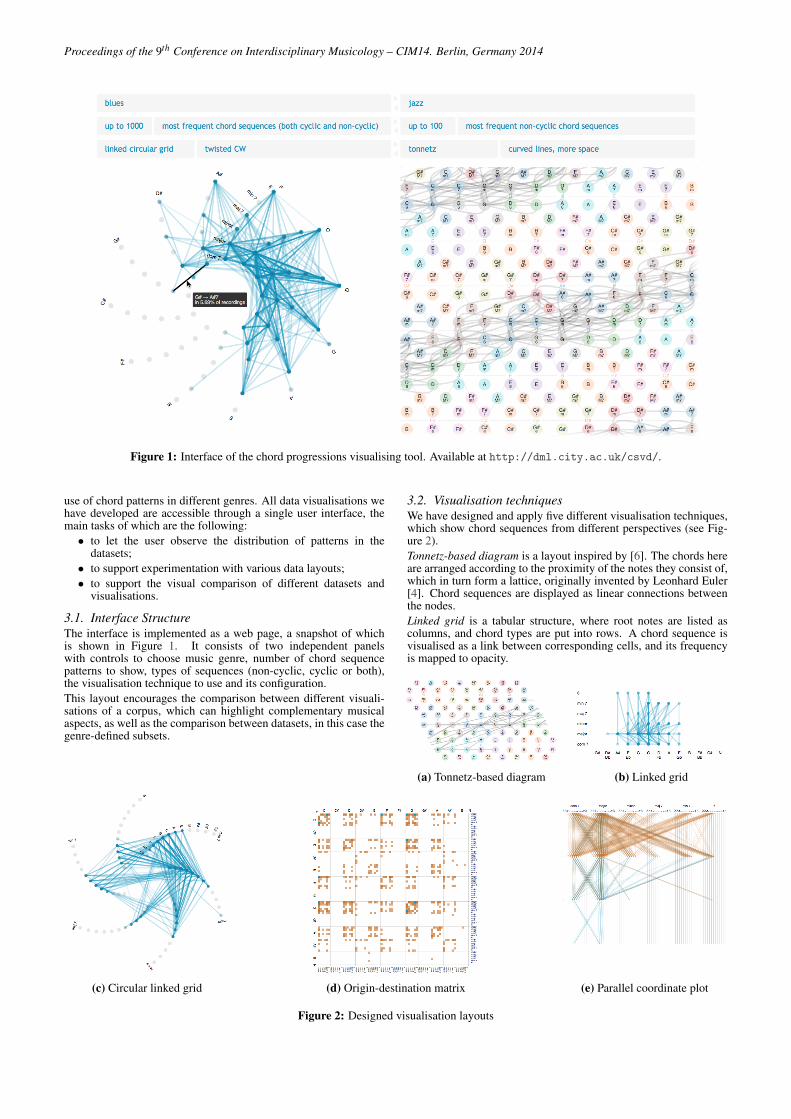
3.2. Visualisation techniquesWe have designed and apply five different visualisation techniques,which show chord sequences from different perspectives (see Fig-ure 2).Tonnetz-based diagram is a layout inspired by [6]. The chords hereare arranged according to the proximity of the notes they consist of,which in turn form a lattice, originally invented by Leonhard Euler[4]. Chord sequences are displayed as linear connections betweenthe nodes.Linked grid is a tabular structure, where root notes are listed ascolumns, and chord types are put into rows. A chord sequence isvisualised as a link between corresponding cells, and its frequencyis mapped to opacity.
(a) Tonnetz-based diagram (b) Linked grid
(c) Circular linked grid (d) Origin-destination matrix (e) Parallel coordinate plot
Figure 2: Designed visualisation layouts
Proceedings of the 9th Conference on Interdisciplinary Musicology – CIM14. Berlin, Germany 2014
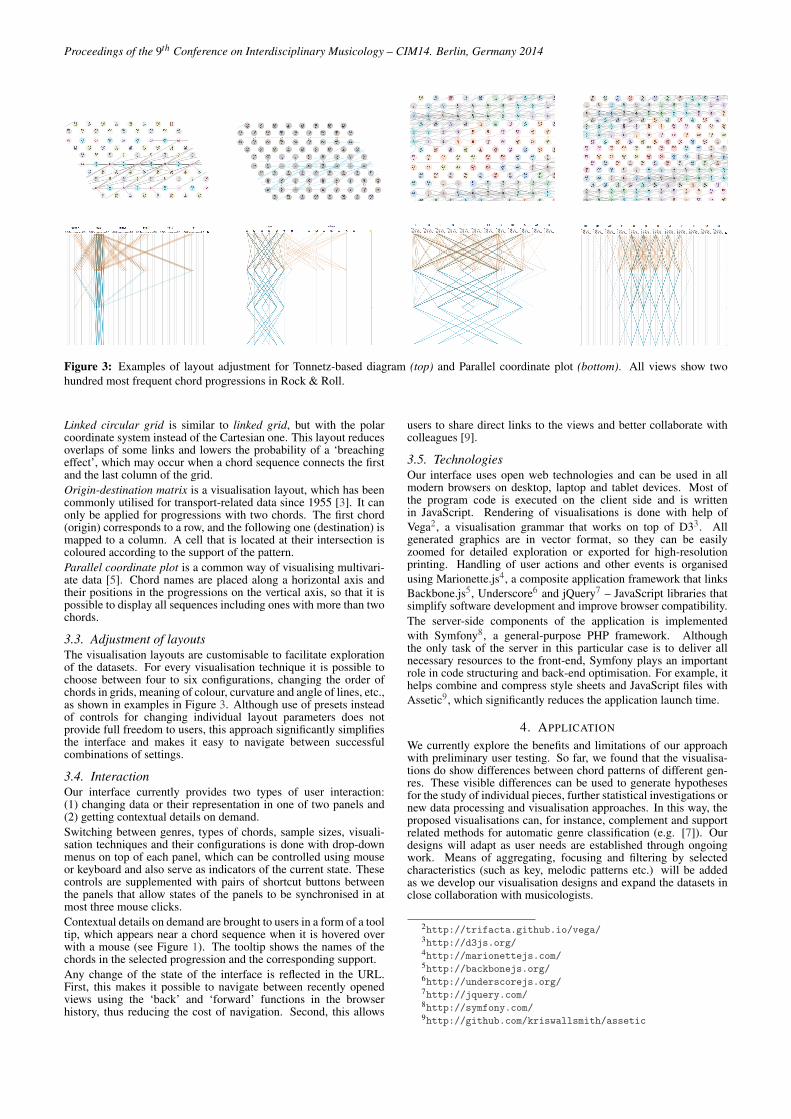
Figure 3: Examples of layout adjustment for Tonnetz-based diagram (top) and Parallel coordinate plot (bottom). All views show twohundred most frequent chord progressions in Rock & Roll.
Linked circular grid is similar to linked grid, but with the polarcoordinate system instead of the Cartesian one. This layout reducesoverlaps of some links and lowers the probability of a ‘breachingeffect’, which may occur when a chord sequence connects the firstand the last column of the grid.Origin-destination matrix is a visualisation layout, which has beencommonly utilised for transport-related data since 1955 [3]. It canonly be applied for progressions with two chords. The first chord(origin) corresponds to a row, and the following one (destination) ismapped to a column. A cell that is located at their intersection iscoloured according to the support of the pattern.Parallel coordinate plot is a common way of visualising multivari-ate data [5]. Chord names are placed along a horizontal axis andtheir positions in the progressions on the vertical axis, so that it ispossible to display all sequences including ones with more than twochords.
3.3. Adjustment of layoutsThe visualisation layouts are customisable to facilitate explorationof the datasets. For every visualisation technique it is possible tochoose between four to six configurations, changing the order ofchords in grids, meaning of colour, curvature and angle of lines, etc.,as shown in examples in Figure 3. Although use of presets insteadof controls for changing individual layout parameters does notprovide full freedom to users, this approach significantly simplifiesthe interface and makes it easy to navigate between successfulcombinations of settings.
3.4. InteractionOur interface currently provides two types of user interaction:(1) changing data or their representation in one of two panels and(2) getting contextual details on demand.Switching between genres, types of chords, sample sizes, visuali-sation techniques and their configurations is done with drop-downmenus on top of each panel, which can be controlled using mouseor keyboard and also serve as indicators of the current state. Thesecontrols are supplemented with pairs of shortcut buttons betweenthe panels that allow states of the panels to be synchronised in atmost three mouse clicks.Contextual details on demand are brought to users in a form of a tooltip, which appears near a chord sequence when it is hovered overwith a mouse (see Figure 1). The tooltip shows the names of thechords in the selected progression and the corresponding support.Any change of the state of the interface is reflected in the URL.First, this makes it possible to navigate between recently openedviews using the ‘back’ and ‘forward’ functions in the browserhistory, thus reducing the cost of navigation. Second, this allows
users to share direct links to the views and better collaborate withcolleagues [9].
3.5. TechnologiesOur interface uses open web technologies and can be used in allmodern browsers on desktop, laptop and tablet devices. Most ofthe program code is executed on the client side and is writtenin JavaScript. Rendering of visualisations is done with help ofVega2, a visualisation grammar that works on top of D33. Allgenerated graphics are in vector format, so they can be easilyzoomed for detailed exploration or exported for high-resolutionprinting. Handling of user actions and other events is organisedusing Marionette.js4, a composite application framework that linksBackbone.js5, Underscore6 and jQuery7 – JavaScript libraries thatsimplify software development and improve browser compatibility.The server-side components of the application is implementedwith Symfony8, a general-purpose PHP framework. Althoughthe only task of the server in this particular case is to deliver allnecessary resources to the front-end, Symfony plays an importantrole in code structuring and back-end optimisation. For example, ithelps combine and compress style sheets and JavaScript files withAssetic9, which significantly reduces the application launch time.
4. APPLICATION
We currently explore the benefits and limitations of our approachwith preliminary user testing. So far, we found that the visualisa-tions do show differences between chord patterns of different gen-res. These visible differences can be used to generate hypothesesfor the study of individual pieces, further statistical investigations ornew data processing and visualisation approaches. In this way, theproposed visualisations can, for instance, complement and supportrelated methods for automatic genre classification (e.g. [7]). Ourdesigns will adapt as user needs are established through ongoingwork. Means of aggregating, focusing and filtering by selectedcharacteristics (such as key, melodic patterns etc.) will be addedas we develop our visualisation designs and expand the datasets inclose collaboration with musicologists.
2http://trifacta.github.io/vega/3http://d3js.org/4http://marionettejs.com/5http://backbonejs.org/6http://underscorejs.org/7http://jquery.com/8http://symfony.com/9http://github.com/kriswallsmith/assetic
Proceedings of the 9th Conference on Interdisciplinary Musicology – CIM14. Berlin, Germany 2014
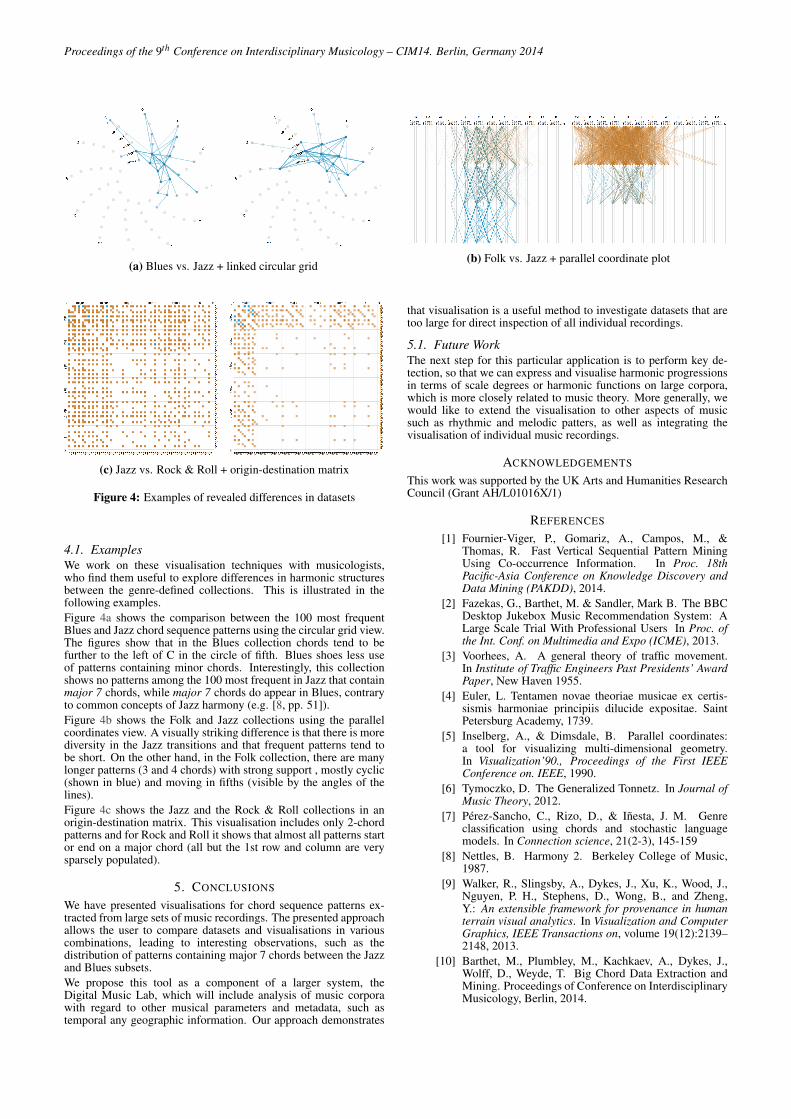
(a) Blues vs. Jazz + linked circular grid(b) Folk vs. Jazz + parallel coordinate plot
(c) Jazz vs. Rock & Roll + origin-destination matrix
Figure 4: Examples of revealed differences in datasets
4.1. ExamplesWe work on these visualisation techniques with musicologists,who find them useful to explore differences in harmonic structuresbetween the genre-defined collections. This is illustrated in thefollowing examples.Figure 4a shows the comparison between the 100 most frequentBlues and Jazz chord sequence patterns using the circular grid view.The figures show that in the Blues collection chords tend to befurther to the left of C in the circle of fifth. Blues shoes less useof patterns containing minor chords. Interestingly, this collectionshows no patterns among the 100 most frequent in Jazz that containmajor 7 chords, while major 7 chords do appear in Blues, contraryto common concepts of Jazz harmony (e.g. [8, pp. 51]).Figure 4b shows the Folk and Jazz collections using the parallelcoordinates view. A visually striking difference is that there is morediversity in the Jazz transitions and that frequent patterns tend tobe short. On the other hand, in the Folk collection, there are manylonger patterns (3 and 4 chords) with strong support , mostly cyclic(shown in blue) and moving in fifths (visible by the angles of thelines).Figure 4c shows the Jazz and the Rock & Roll collections in anorigin-destination matrix. This visualisation includes only 2-chordpatterns and for Rock and Roll it shows that almost all patterns startor end on a major chord (all but the 1st row and column are verysparsely populated).
5. CONCLUSIONS
We have presented visualisations for chord sequence patterns ex-tracted from large sets of music recordings. The presented approachallows the user to compare datasets and visualisations in variouscombinations, leading to interesting observations, such as thedistribution of patterns containing major 7 chords between the Jazzand Blues subsets.We propose this tool as a component of a larger system, theDigital Music Lab, which will include analysis of music corporawith regard to other musical parameters and metadata, such astemporal any geographic information. Our approach demonstrates
that visualisation is a useful method to investigate datasets that aretoo large for direct inspection of all individual recordings.
5.1. Future WorkThe next step for this particular application is to perform key de-tection, so that we can express and visualise harmonic progressionsin terms of scale degrees or harmonic functions on large corpora,which is more closely related to music theory. More generally, wewould like to extend the visualisation to other aspects of musicsuch as rhythmic and melodic patters, as well as integrating thevisualisation of individual music recordings.
ACKNOWLEDGEMENTS
This work was supported by the UK Arts and Humanities ResearchCouncil (Grant AH/L01016X/1)
REFERENCES
[1] Fournier-Viger, P., Gomariz, A., Campos, M., &Thomas, R. Fast Vertical Sequential Pattern MiningUsing Co-occurrence Information. In Proc. 18thPacific-Asia Conference on Knowledge Discovery andData Mining (PAKDD), 2014.
[2] Fazekas, G., Barthet, M. & Sandler, Mark B. The BBCDesktop Jukebox Music Recommendation System: ALarge Scale Trial With Professional Users In Proc. ofthe Int. Conf. on Multimedia and Expo (ICME), 2013.
[3] Voorhees, A. A general theory of traffic movement.In Institute of Traffic Engineers Past Presidents’ AwardPaper, New Haven 1955.
[4] Euler, L. Tentamen novae theoriae musicae ex certis-sismis harmoniae principiis dilucide expositae. SaintPetersburg Academy, 1739.
[5] Inselberg, A., & Dimsdale, B. Parallel coordinates:a tool for visualizing multi-dimensional geometry.In Visualization’90., Proceedings of the First IEEEConference on. IEEE, 1990.
[6] Tymoczko, D. The Generalized Tonnetz. In Journal ofMusic Theory, 2012.
[7] Perez-Sancho, C., Rizo, D., & Inesta, J. M. Genreclassification using chords and stochastic languagemodels. In Connection science, 21(2-3), 145-159
[8] Nettles, B. Harmony 2. Berkeley College of Music,1987.
[9] Walker, R., Slingsby, A., Dykes, J., Xu, K., Wood, J.,Nguyen, P. H., Stephens, D., Wong, B., and Zheng,Y.: An extensible framework for provenance in humanterrain visual analytics. In Visualization and ComputerGraphics, IEEE Transactions on, volume 19(12):2139–2148, 2013.
[10] Barthet, M., Plumbley, M., Kachkaev, A., Dykes, J.,Wolff, D., Weyde, T. Big Chord Data Extraction andMining. Proceedings of Conference on InterdisciplinaryMusicology, Berlin, 2014.