visual analytics law enforcement toolkit
TRANSCRIPT

Visual Analytics Law Enforcement ToolkitAnalyzing & Predicting Solution for Law enforcement agencies

Team Members
Subin ChoiBack-End with Django
Youngun ParkFront-End Design
Hyeonseung BaeFront-End with Backbone.JS

Problem
• Crimes are getting out of Control
• 1,163,146 violent crimes, 8,632,512 property crimes in a year.
• Police Officers are having hard time organizing crimes

Solution• Organize Crime datas with
LocationTime Type
• Predict crimes

Market Space• Business Intelligence
• GIS
• Community Crime-mapping
• Advanced Analytic
• VALET
VALET
Palantir
PredPol
Crime Reports
GeoEye
Pred
ictio
n / A
naly
tics
Accessibility

Target CustomerLafeyette Police West Lafeyette PolicePurdue Police
Evansville Police Ohio State Highway Patrol
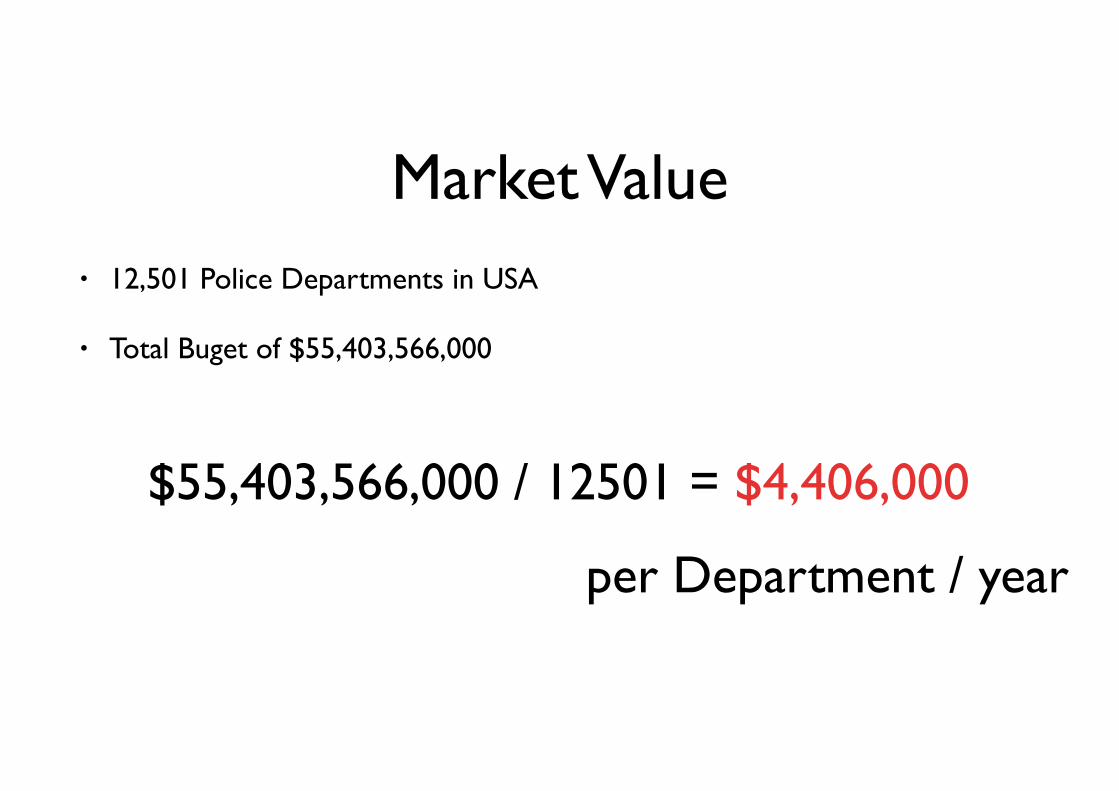
Market Value• 12,501 Police Departments in USA
• Total Buget of $55,403,566,000
$55,403,566,000 / 12501 = $4,406,000
per Department / year

Business Model• Subscription Model
• a initial $1000 , and $700 a month as the subscription fee.
• $4,406,000 / 500 = $8812
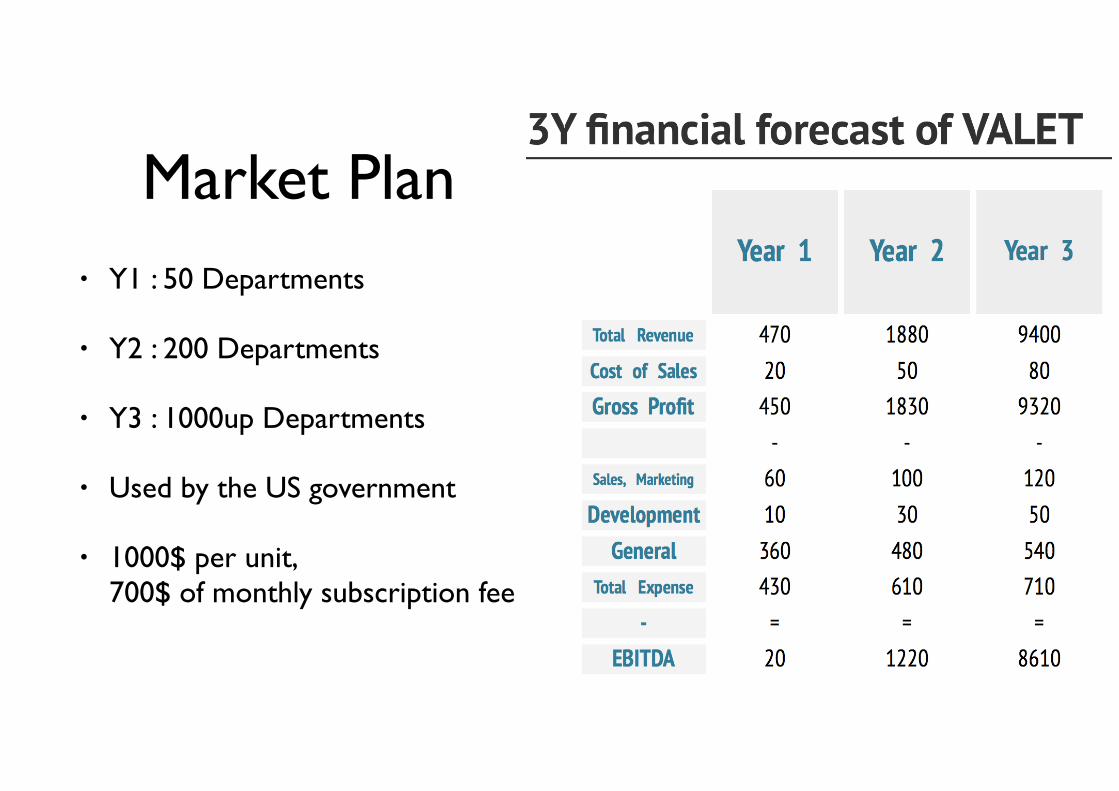
Market Plan• Y1 : 50 Departments
• Y2 : 200 Departments
• Y3 : 1000up Departments
• Used by the US government
• 1000$ per unit, 700$ of monthly subscription fee
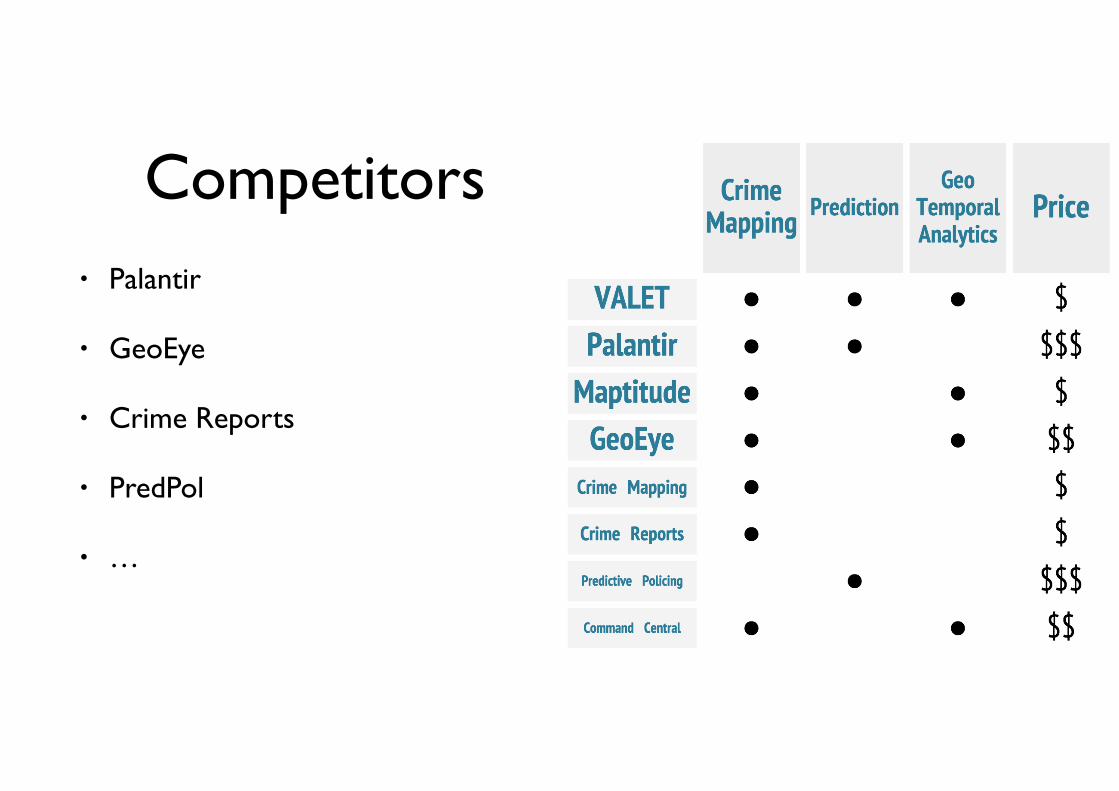
Competitors• Palantir
• GeoEye
• Crime Reports
• PredPol
• …

Milestones• What do we have right now? When could we say we’ve succeeded?
Demo• http://youtu.be/QVNGc39Jo14
• http://youtu.be/SlZ1-F308l4

Technology

Highlights• Help police officers organize and prevent crimes with ease.
• Accurate prediction algorithm and powerful visualization in lower price.
• We’re ready to launch the application RIGHT NOW

Q & AThank you for your attention