visitor satisfaction study
TRANSCRIPT
1
Visitor Satisfaction Study
Q1 2021
Prepared for: Hawai‘i Tourism Authority
1 2 3 4 5 6 7 8 9 10
TABLE OF CONTENTS
• Section – Visitor Satisfaction • Section – Activities • Section – Travelers with Disabilities • Section – Alternative Messaging • Section – Island of O‘ahu • Section – Island of Kaua‘i • Section – Island of Maui • Section – Island of Hawai‘i • Section – Visitor Profile • Section – Island Survey Methodology
*Margins of error are presented at the 95 percent level of confidence. 2
METHODOLOGY – OVERALL
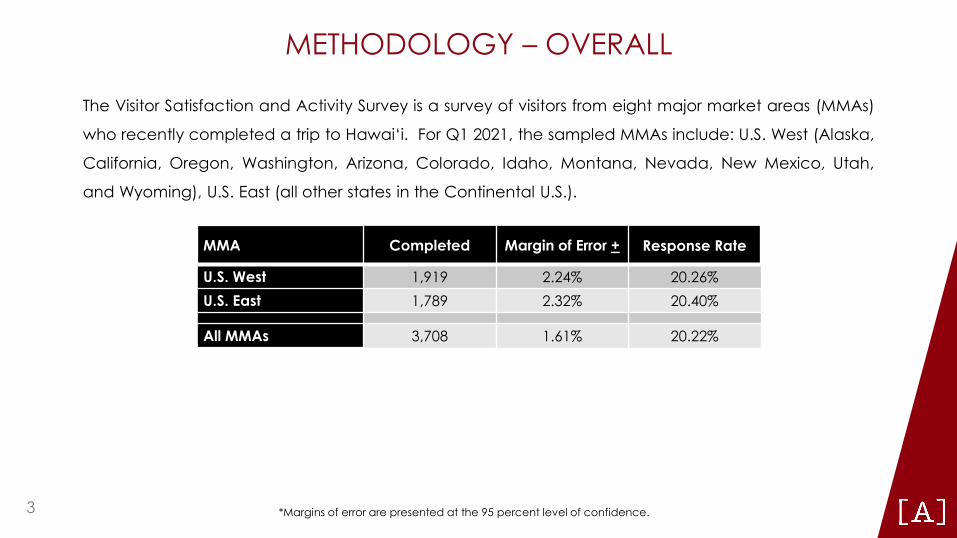
The Visitor Satisfaction and Activity Survey is a survey of visitors from eight major market areas (MMAs)
who recently completed a trip to Hawai‘i. For Q1 2021, the sampled MMAs include: U.S. West (Alaska,
California, Oregon, Washington, Arizona, Colorado, Idaho, Montana, Nevada, New Mexico, Utah,
and Wyoming), U.S. East (all other states in the Continental U.S.).
MMA Completed Margin of Error + Response Rate
U.S. West 1,919 2.24% 20.26% U.S. East 1,789 2.32% 20.40%
All MMAs 3,708 1.61% 20.22%
*Margins of error are presented at the 95 percent level of confidence. 3
METHODOLOGY – OVERALL (cont.)
Monthly samples of visitors who stayed for at least two days are drawn from completed the Domestic
In-Flight database. Selected U.S. visitors were sent an email invitation with a link to complete the
survey online.
Collected data were statistically adjusted to reflect the distribution of cases by island and first-
time/repeat visitor status in the In-Flight Survey. Data were statistically adjusted to be representative
of the population of visitor parties entering Hawai‘i during the quarter. Data from both MMAs were
reported as weighted data based on weights generated for 2021 data. The VSAT weighting system
was developed to adjust for disproportionate sampling across all MMAs.
Note: Some results are presented with very small sample sizes that produce statistics with sample error
estimates greater than 10 points. Please exercise caution in interpreting results based on small bases.
4
METHODOLOGY – Effect of COVID-19
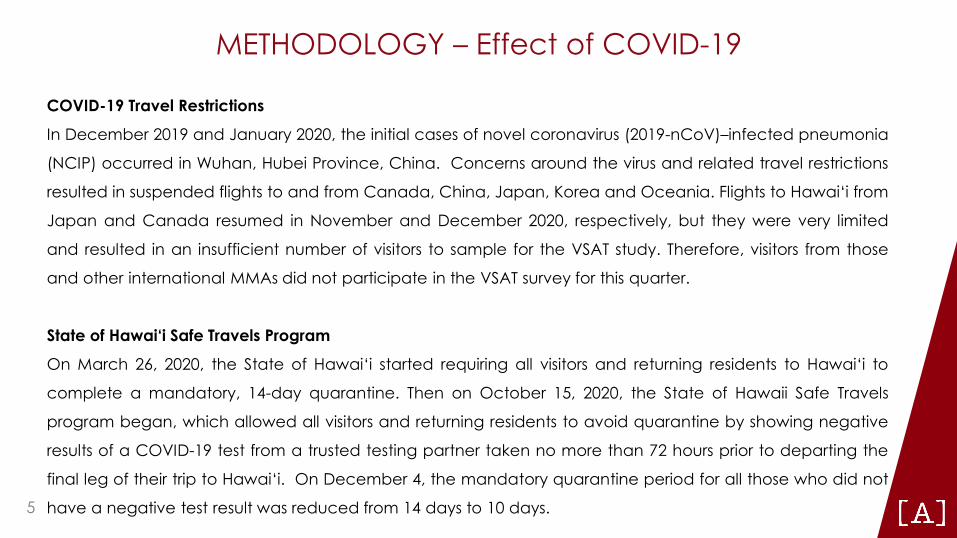
COVID-19 Travel Restrictions
In December 2019 and January 2020, the initial cases of novel coronavirus (2019-nCoV)–infected pneumonia
(NCIP) occurred in Wuhan, Hubei Province, China. Concerns around the virus and related travel restrictions
resulted in suspended flights to and from Canada, China, Japan, Korea and Oceania. Flights to Hawai‘i from
Japan and Canada resumed in November and December 2020, respectively, but they were very limited
and resulted in an insufficient number of visitors to sample for the VSAT study. Therefore, visitors from those
and other international MMAs did not participate in the VSAT survey for this quarter.
State of Hawai‘i Safe Travels Program
On March 26, 2020, the State of Hawai‘i started requiring all visitors and returning residents to Hawai‘i to
complete a mandatory, 14-day quarantine. Then on October 15, 2020, the State of Hawaii Safe Travels
program began, which allowed all visitors and returning residents to avoid quarantine by showing negative
results of a COVID-19 test from a trusted testing partner taken no more than 72 hours prior to departing the
final leg of their trip to Hawai‘i. On December 4, the mandatory quarantine period for all those who did not
have a negative test result was reduced from 14 days to 10 days. 5

SECTION 1 – VISITOR SATISFACTION
6
■
■
■
■
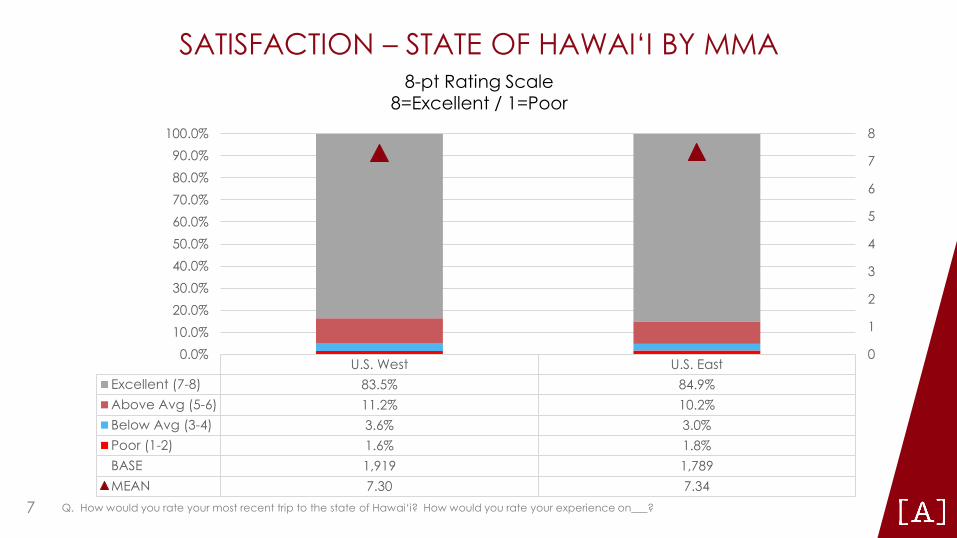
SATISFACTION – STATE OF HAWAI‘I BY MMA 8-pt Rating Scale
8=Excellent / 1=Poor 100.0%
90.0% 80.0% 70.0% 60.0% 50.0% 40.0% 30.0% 20.0%
U.S. West U.S. East Excellent (7-8) 83.5% 84.9% Above Avg (5-6) 11.2% 10.2% Below Avg (3-4) 3.6% 3.0% Poor (1-2) 1.6% 1.8% BASE 1,919 1,789 MEAN 7.30 7.34
0.0% 10.0%
8
7
6
5
4
3
2
1
0
Q. How would you rate your most recent trip to the state of Hawai‘i? How would you rate your experience on___? 7
SATISFACTION – STATE OF HAWAI‘I BY MMA
• Household income: Overall satisfaction with Hawai‘i declined incrementally among more affluent travelers in both US West and US East visitor markets .
• Age: Satisfaction ratings were the highest among younger travelers in both U.S. West and U.S. East. Satisfaction decreased among older age groups in both visitor markets.
• Gender: Female travelers from both U.S. East and West gave higher satisfaction scores than male visitors.
Q. How would you rate your most recent trip to the state of Hawai‘i? How would you rate your experience on___? 8
I : I I I
l l l l
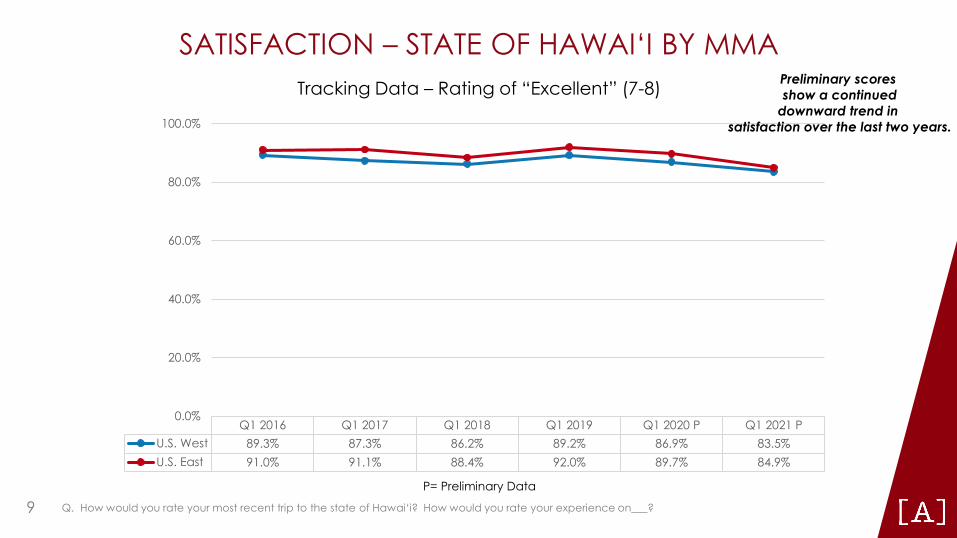
SATISFACTION – STATE OF HAWAI‘I BY MMA Preliminary scores Tracking Data – Rating of “Excellent” (7-8) show a continued downward trend in
satisfaction over the last two years. 100.0%
80.0%
60.0%
40.0%
20.0%
0.0% Q1 2016 Q1 2017 Q1 2018 Q1 2019 Q1 2020 P Q1 2021 P
U.S. West 89.3% 87.3% 86.2% 89.2% 86.9% 83.5% U.S. East 91.0% 91.1% 88.4% 92.0% 89.7% 84.9%
P= Preliminary Data
Q. How would you rate your most recent trip to the state of Hawai‘i? How would you rate your experience on___? 9
■
■
■
■
■
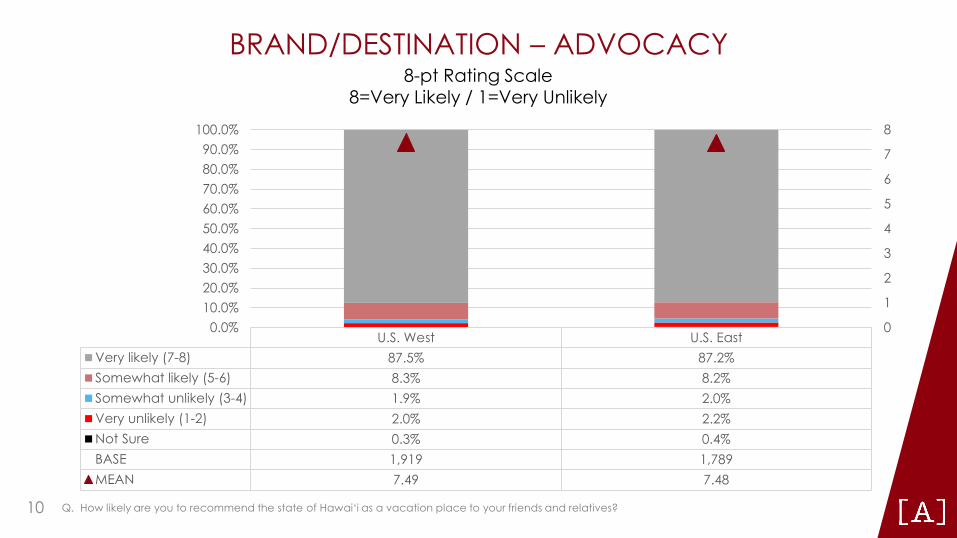
BRAND/DESTINATION – ADVOCACY 8-pt Rating Scale
8=Very Likely / 1=Very Unlikely
100.0% 90.0% 80.0% 70.0% 60.0% 50.0% 40.0% 30.0% 20.0% 10.0%
0.0%
Very likely (7-8) Somewhat likely (5-6) Somewhat unlikely (3-4) Very unlikely (1-2) Not Sure BASE MEAN
U.S. West U.S. East
8
7
6
5
4
3
2
1
0
87.2% 8.2% 2.0% 2.2% 0.4% 1,789 7.48
87.5% 8.3% 1.9% 2.0% 0.3% 1,919 7.49
Q. How likely are you to recommend the state of Hawai‘i as a vacation place to your friends and relatives? 10
BRAND/DESTINATION – ADVOCACY
• Age: Brand advocacy scores from U.S. East travelers declined incrementally among visitors in the older age groups.
• Gender: Female travelers from both U.S. West and U.S. East were more likely to recommend the state to others compared to male visitors.
• Islands visited: U.S. West travelers those whose trip consisted of visit to a single island were more likely to recommend the state compared to those who visited multiple islands.
Q. How likely are you to recommend the state of Hawai‘i as a vacation place to your friends and relatives? 11
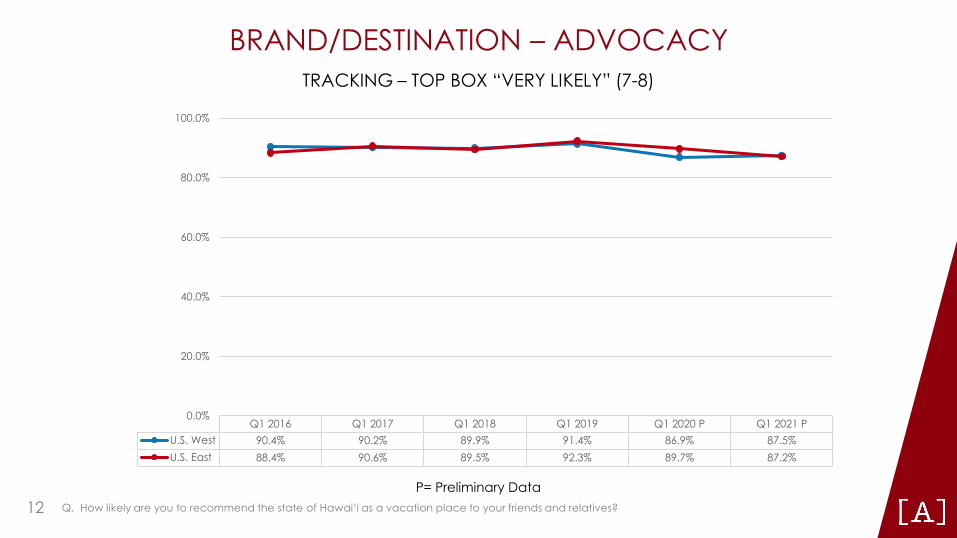
BRAND/DESTINATION – ADVOCACY TRACKING – TOP BOX “VERY LIKELY” (7-8)
100.0%
80.0%
60.0%
40.0%
20.0%
0.0% Q1 2016 Q1 2017 Q1 2018 Q1 2019 Q1 2020 P Q1 2021 P
U.S. West 90.4% 90.2% 89.9% 91.4% 86.9% 87.5% U.S. East 88.4% 90.6% 89.5% 92.3% 89.7% 87.2%
P= Preliminary Data Q. How likely are you to recommend the state of Hawai‘i as a vacation place to your friends and relatives? 12
■
■
■
■
■
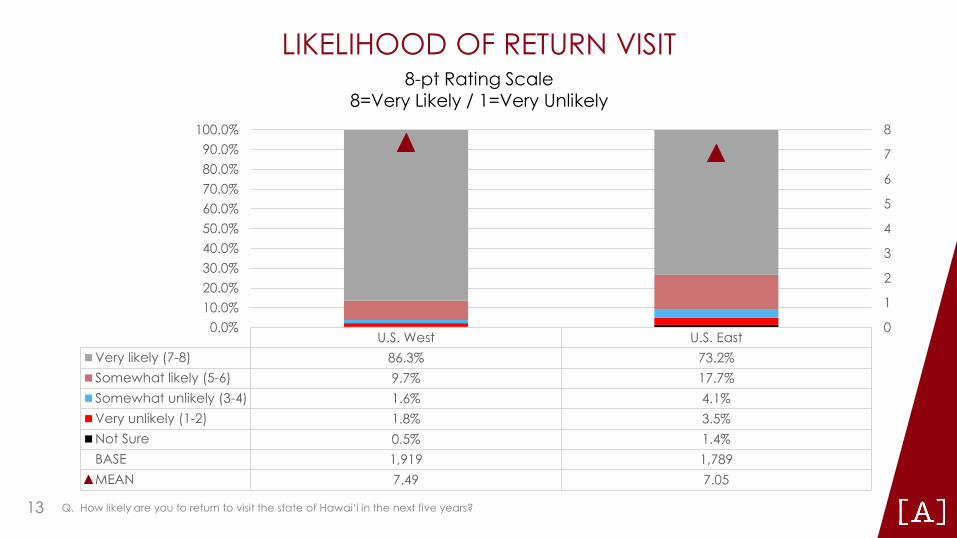
LIKELIHOOD OF RETURN VISIT 8-pt Rating Scale
8=Very Likely / 1=Very Unlikely 100.0%
90.0% 80.0% 70.0% 60.0% 50.0% 40.0% 30.0% 20.0% 10.0%
0.0%
Very likely (7-8) Somewhat likely (5-6) Somewhat unlikely (3-4) Very unlikely (1-2) Not Sure BASE MEAN
U.S. West U.S. East
8
7
6
5
4
3
2
1
0
73.2% 17.7% 4.1% 3.5% 1.4% 1,789 7.05
86.3% 9.7% 1.6% 1.8% 0.5% 1,919 7.49
Q. How likely are you to return to visit the state of Hawai‘i in the next five years? 13
LIKELIHOOD OF RETURN VISIT
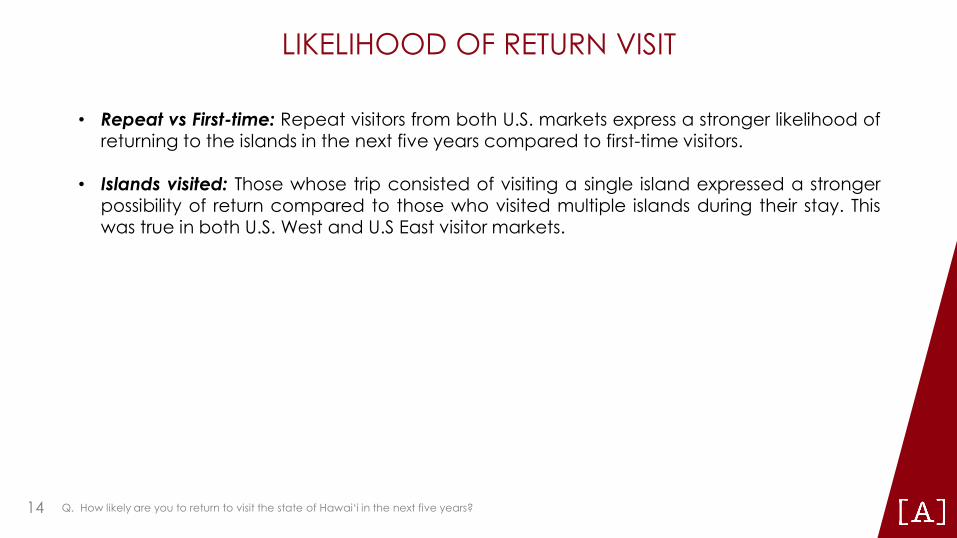
• Repeat vs First-time: Repeat visitors from both U.S. markets express a stronger likelihood of returning to the islands in the next five years compared to first-time visitors.
• Islands visited: Those whose trip consisted of visiting a single island expressed a stronger possibility of return compared to those who visited multiple islands during their stay. This was true in both U.S. West and U.S East visitor markets.
Q. How likely are you to return to visit the state of Hawai‘i in the next five years? 14
_________ ....,_. _.....,__ -.......-.~ •- I
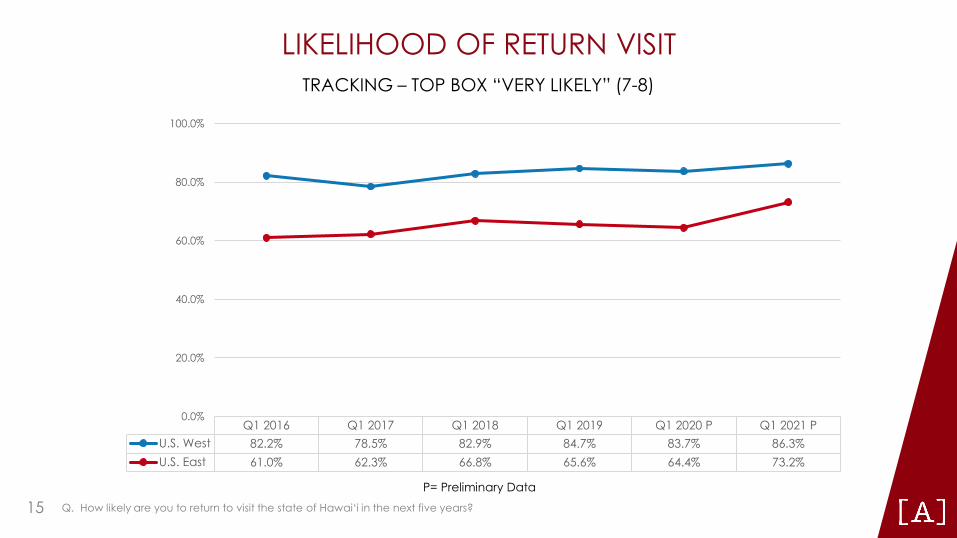
LIKELIHOOD OF RETURN VISIT TRACKING – TOP BOX “VERY LIKELY” (7-8)
100.0%
60.0%
80.0%
40.0%
20.0%
0.0% Q1 2016 Q1 2017 Q1 2018 Q1 2019 Q1 2020 P Q1 2021 P
U.S. West 82.2% 78.5% 82.9% 84.7% 83.7% 86.3% U.S. East 61.0% 62.3% 66.8% 65.6% 64.4% 73.2%
P= Preliminary Data Q. How likely are you to return to visit the state of Hawai‘i in the next five years? 15
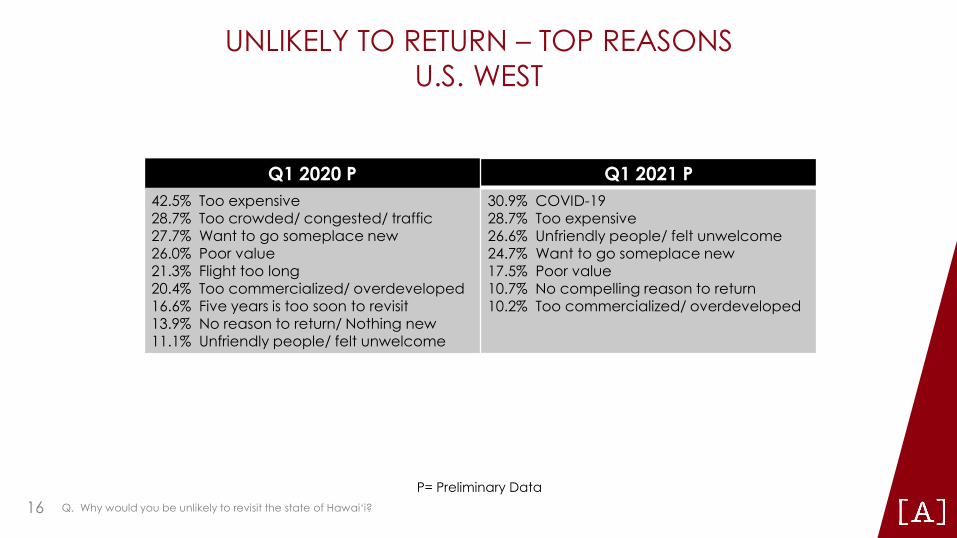
Q1 2020 P Q1 2021 P 42.5% Too expensive 30.9% COVID-19
28.7% Too crowded/ congested/ traffic 28.7% Too expensive 27.7% Want to go somepl ace new 26.6% Unfriendly peopl e/ felt unwelcome 26.0% Poor value 24.7% Want to go someplace new 21.3% Fli ght too long 17.5% Poor value 20.4% Too commerciali zed/ overdeveloped 10.7% No compelli ng reason to return
16.6% Fi ve years i s too soon to revisit 10.2% Too commercialized/ overdeveloped 13.9% No reason to return/ Nothing new
11.1% Unfriendly peopl e/ felt unwelcome
UNLIKELY TO RETURN – TOP REASONS U.S. WEST
P= Preliminary Data Q. Why would you be unlikely to revisit the state of Hawai‘i? 16
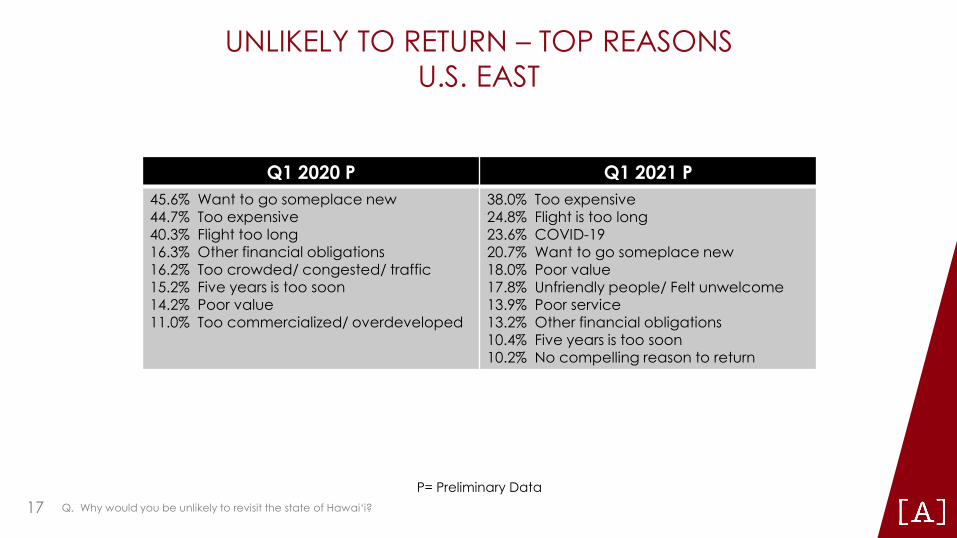
UNLIKELY TO RETURN – TOP REASONS U.S. EAST
Q1 2020 P Q1 2021 P 45.6% Want to go someplace new 44.7% Too expensive 40.3% Flight too long 16.3% Other financial obligations 16.2% Too crowded/ congested/ traffic 15.2% Five years is too soon 14.2% Poor value 11.0% Too commercialized/ overdeveloped
38.0% Too expensive 24.8% Flight is too long 23.6% COVID-19 20.7% Want to go someplace new 18.0% Poor value 17.8% Unfriendly people/ Felt unwelcome 13.9% Poor service 13.2% Other financial obligations 10.4% Five years is too soon 10.2% No compelling reason to return
P= Preliminary Data Q. Why would you be unlikely to revisit the state of Hawai‘i? 17
■
■
■ ~
■ ~
~
• L
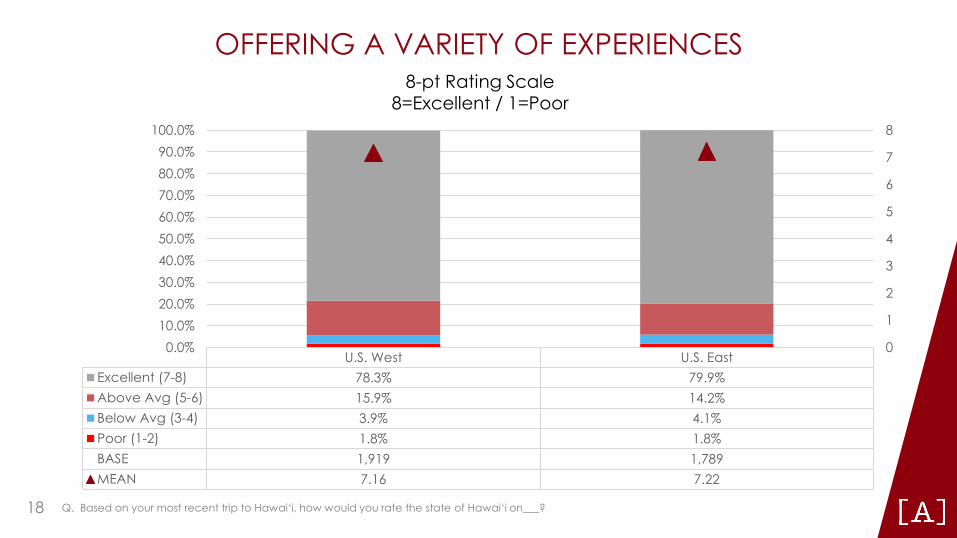
OFFERING A VARIETY OF EXPERIENCES 8-pt Rating Scale
8=Excellent / 1=Poor 100.0%
90.0% 80.0% 70.0% 60.0% 50.0% 40.0% 30.0%
U.S. West U.S. East Excellent (7-8) 78.3% 79.9% Above Avg (5-6) 15.9% 14.2% Below Avg (3-4) 3.9% 4.1% Poor (1-2) 1.8% 1.8% BASE 1,919 1,789 MEAN 7.16 7.22
0.0% 10.0% 20.0%
8
7
6
5
4
3
2
1
0
Q. Based on your most recent trip to Hawai‘i, how would you rate the state of Hawai‘i on___? 18
■
■
■
■
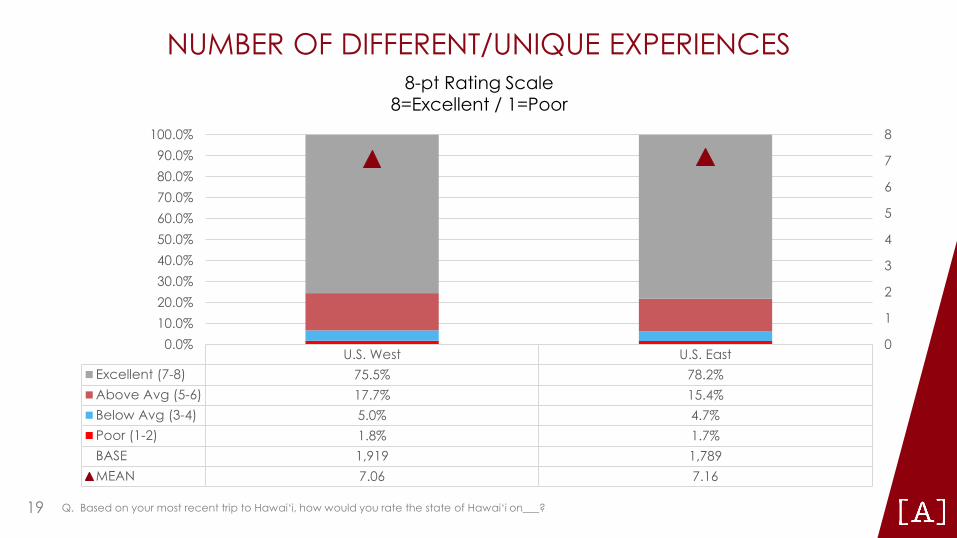
NUMBER OF DIFFERENT/UNIQUE EXPERIENCES 8-pt Rating Scale
8=Excellent / 1=Poor 100.0%
90.0% 80.0% 70.0% 60.0% 50.0% 40.0% 30.0%
U.S. West U.S. East Excellent (7-8) 75.5% 78.2% Above Avg (5-6) 17.7% 15.4% Below Avg (3-4) 5.0% 4.7% Poor (1-2) 1.8% 1.7% BASE 1,919 1,789 MEAN 7.06 7.16
0.0% 10.0% 20.0%
8
7
6
5
4
3
2
1
0
Q. Based on your most recent trip to Hawai‘i, how would you rate the state of Hawai‘i on___? 19
, ■
~
■
■
■
I •
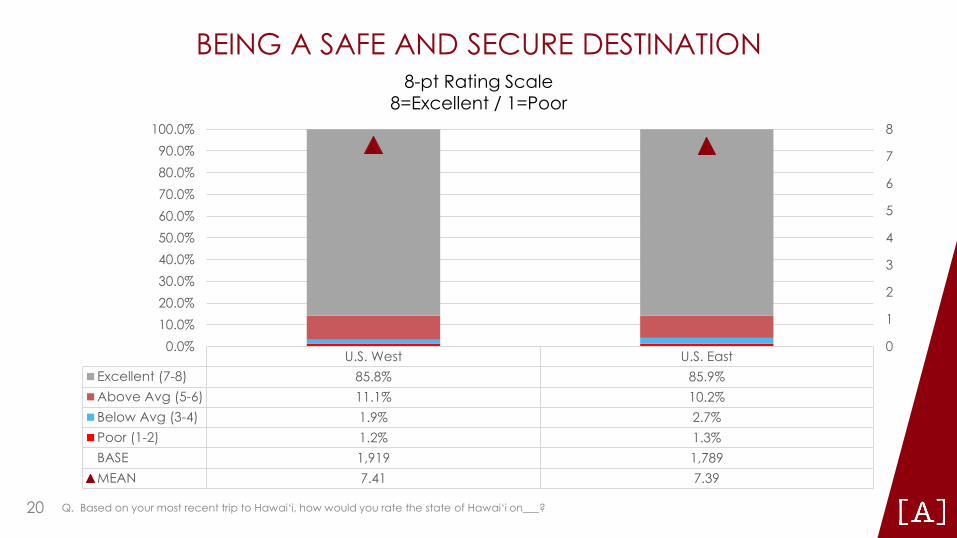
BEING A SAFE AND SECURE DESTINATION 8-pt Rating Scale
8=Excellent / 1=Poor 100.0%
90.0% 80.0% 70.0% 60.0% 50.0% 40.0% 30.0% 20.0% 10.0%
8
7
6
5
4
3
2
1
0.0% U.S. West U.S. East
0
Excellent (7-8) 85.9% Above Avg (5-6)
85.8% 11.1% 10.2%
Below Avg (3-4) 1.9% 2.7% Poor (1-2) 1.2% 1.3% BASE 1,919 1,789 MEAN 7.41 7.39
Q. Based on your most recent trip to Hawai‘i, how would you rate the state of Hawai‘i on___? 20
■
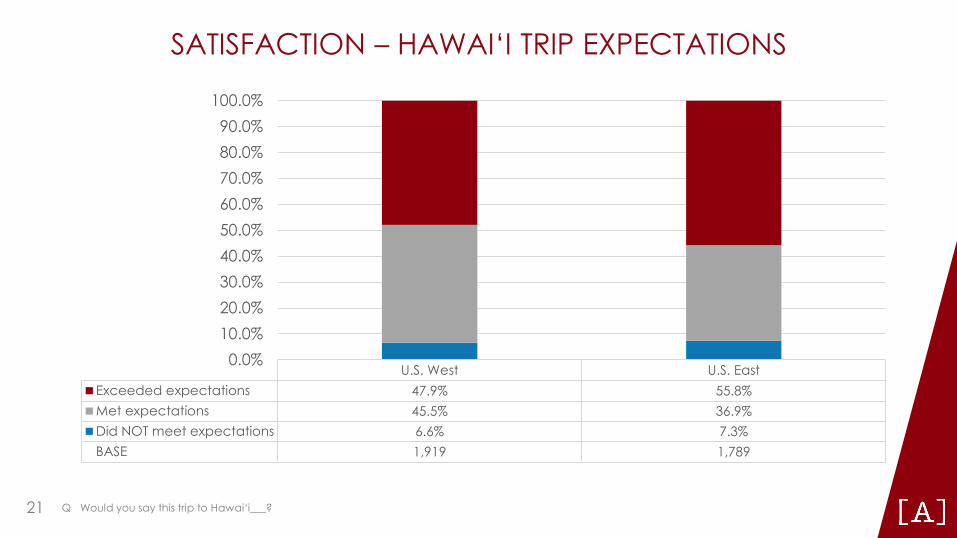
SATISFACTION – HAWAI‘I TRIP EXPECTATIONS
0.0% 10.0% 20.0% 30.0% 40.0% 50.0% 60.0% 70.0% 80.0% 90.0%
100.0%
U.S. West U.S. East Exceeded expectations 47.9% 55.8% Met expectations 45.5% 36.9% Did NOT meet expectations 6.6% 7.3% BASE 1,919 1,789
Q Would you say this trip to Hawai‘i___? 21
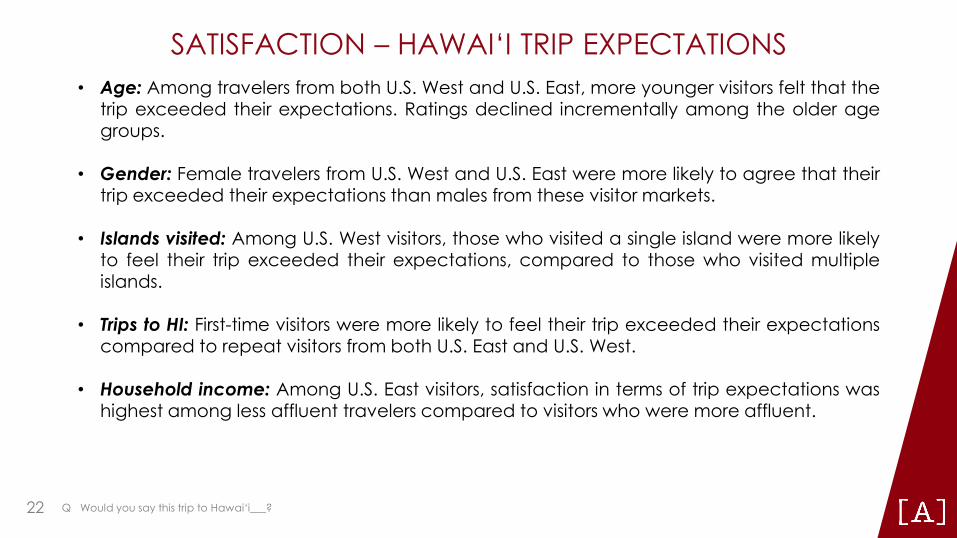
SATISFACTION – HAWAI‘I TRIP EXPECTATIONS • Age: Among travelers from both U.S. West and U.S. East, more younger visitors felt that the
trip exceeded their expectations. Ratings declined incrementally among the older age groups.
• Gender: Female travelers from U.S. West and U.S. East were more likely to agree that their trip exceeded their expectations than males from these visitor markets.
• Islands visited: Among U.S. West visitors, those who visited a single island were more likely to feel their trip exceeded their expectations, compared to those who visited multiple islands.
• Trips to HI: First-time visitors were more likely to feel their trip exceeded their expectations compared to repeat visitors from both U.S. East and U.S. West.
• Household income: Among U.S. East visitors, satisfaction in terms of trip expectations was highest among less affluent travelers compared to visitors who were more affluent.
Q Would you say this trip to Hawai‘i___? 22
• • • ,.
• •
I
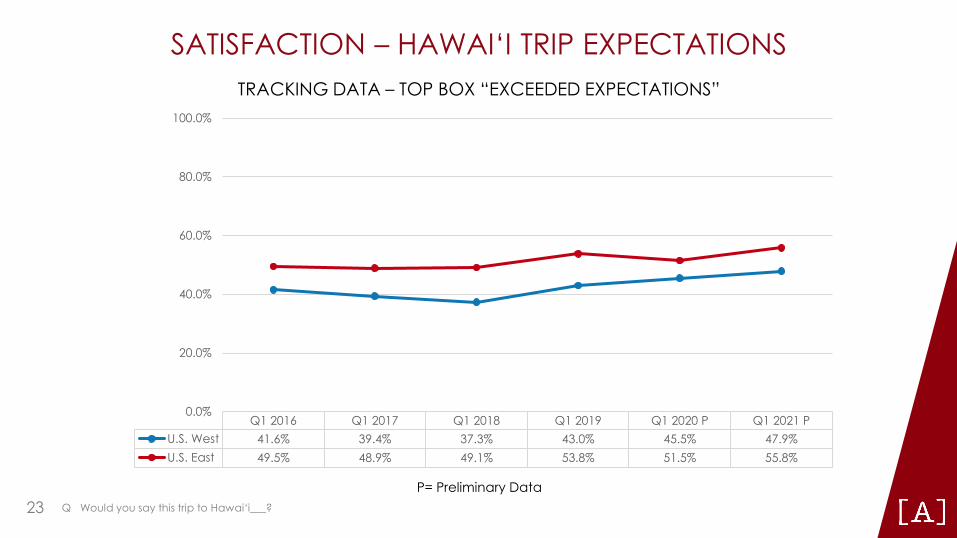
SATISFACTION – HAWAI‘I TRIP EXPECTATIONS TRACKING DATA – TOP BOX “EXCEEDED EXPECTATIONS”
100.0%
80.0%
40.0%
60.0%
20.0%
0.0% Q1 2016 Q1 2017 Q1 2018 Q1 2019 Q1 2020 P Q1 2021 P
U.S. West 41.6% 39.4% 37.3% 43.0% 45.5% 47.9% U.S. East 49.5% 48.9% 49.1% 53.8% 51.5% 55.8%
P= Preliminary Data Q Would you say this trip to Hawai‘i___? 23
SECTION 2 – ACTIVITIES 24
-
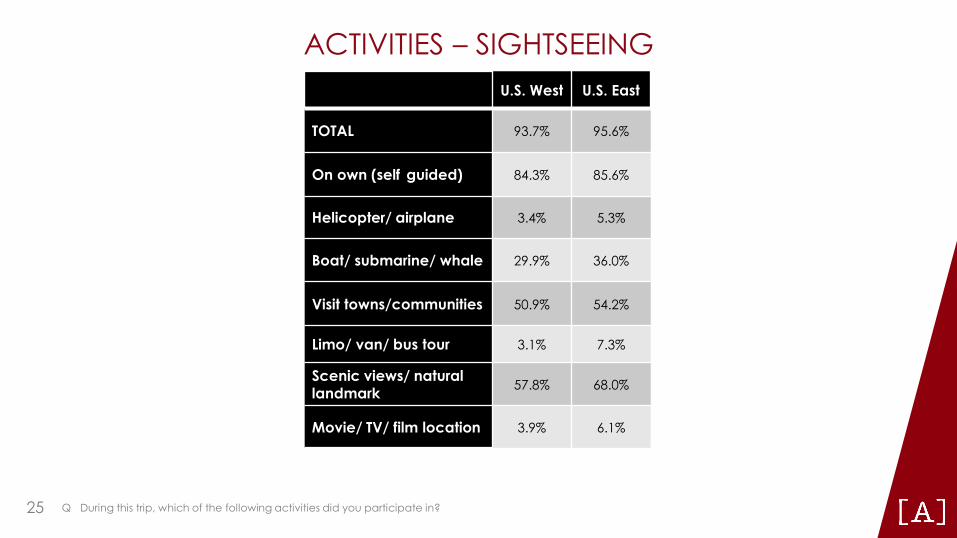
ACTIVITIES – SIGHTSEEING U.S. West U.S. East
TOTAL 93.7% 95.6%
On own (self guided) 84.3% 85.6%
Helicopter/ airplane 3.4% 5.3%
Boat/ submarine/ whale 29.9% 36.0%
Visit towns/communities 50.9% 54.2%
Limo/ van/ bus tour 3.1% 7.3%
Scenic views/ natural landmark 57.8% 68.0%
Movie/ TV/ film location 3.9% 6.1%
Q During this trip, which of the following activities did you participate in? 25
--
--
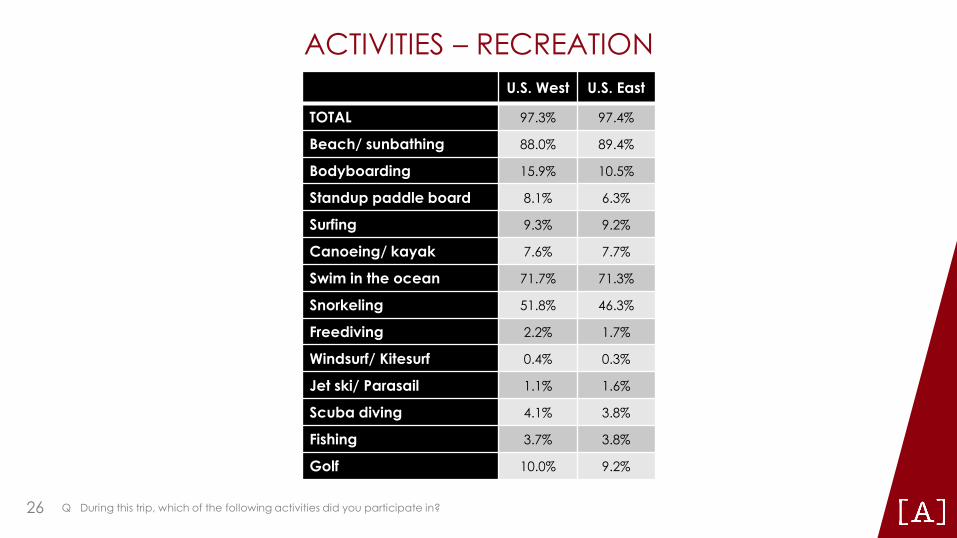
ACTIVITIES – RECREATION U.S. West U.S. East
TOTAL 97.3% 97.4%
Beach/ sunbathing 88.0% 89.4%
Bodyboarding 15.9% 10.5%
Standup paddle board 8.1% 6.3%
Surfing 9.3% 9.2%
Canoeing/ kayak 7.6% 7.7%
Swim in the ocean 71.7% 71.3%
Snorkeling 51.8% 46.3%
Freediving 2.2% 1.7%
Windsurf/ Kitesurf 0.4% 0.3%
Jet ski/ Parasail 1.1% 1.6%
Scuba diving 4.1% 3.8%
Fishing 3.7% 3.8%
Golf 10.0% 9.2%
Q During this trip, which of the following activities did you participate in? 26
-
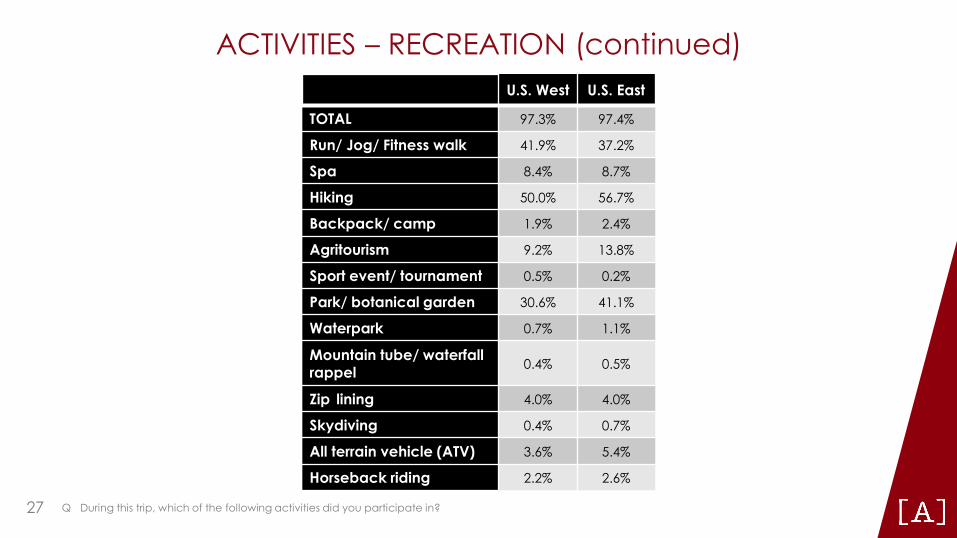
ACTIVITIES – RECREATION (continued) U.S. West U.S. East
TOTAL 97.3% 97.4%
Run/ Jog/ Fitness walk 41.9% 37.2%
Spa 8.4% 8.7%
Hiking 50.0% 56.7%
Backpack/ camp 1.9% 2.4%
Agritourism 9.2% 13.8%
Sport event/ tournament 0.5% 0.2%
Park/ botanical garden 30.6% 41.1%
Waterpark 0.7% 1.1%
Mountain tube/ waterfall rappel 0.4% 0.5%
Zip lining 4.0% 4.0%
Skydiving 0.4% 0.7%
All terrain vehicle (ATV) 3.6% 5.4%
Horseback riding 2.2% 2.6%
Q During this trip, which of the following activities did you participate in? 27
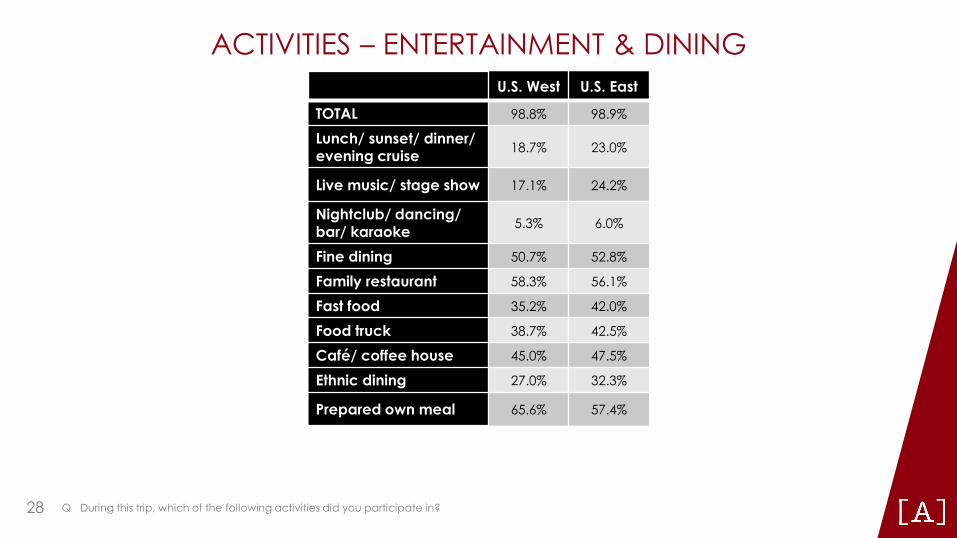
ACTIVITIES – ENTERTAINMENT & DINING U.S. West U.S. East
TOTAL 98.8% 98.9%
Lunch/ sunset/ dinner/ evening cruise 18.7% 23.0%
Live music/ stage show 17.1% 24.2%
Nightclub/ dancing/ bar/ karaoke 5.3% 6.0%
Fine dining 50.7% 52.8%
Family restaurant 58.3% 56.1%
Fast food 35.2% 42.0%
Food truck 38.7% 42.5%
Café/ coffee house 45.0% 47.5%
Ethnic dining 27.0% 32.3%
Prepared own meal 65.6% 57.4%
Q During this trip, which of the following activities did you participate in? 28
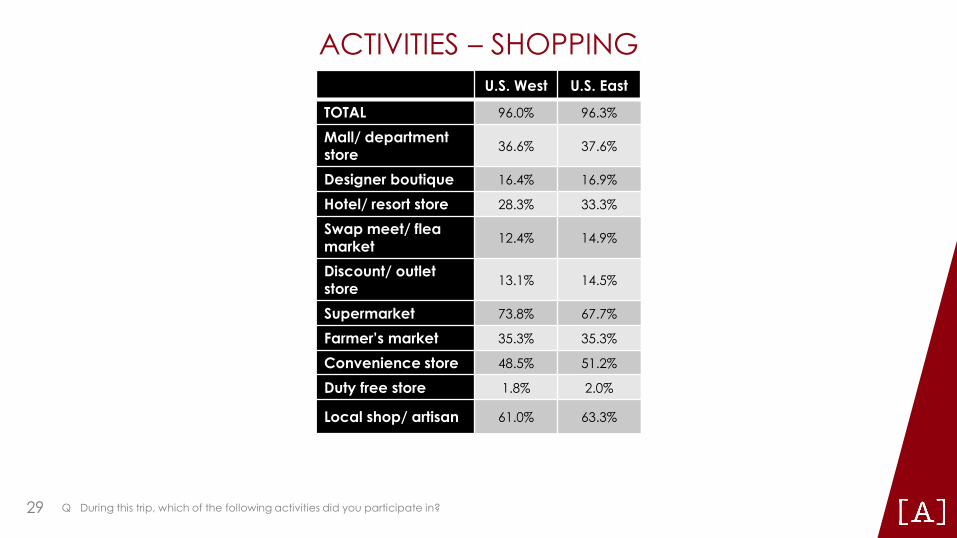
ACTIVITIES – SHOPPING U.S. West U.S. East
TOTAL 96.0% 96.3%
Mall/ department store 36.6% 37.6%
Designer boutique 16.4% 16.9%
Hotel/ resort store 28.3% 33.3%
Swap meet/ flea market 12.4% 14.9%
Discount/ outlet store 13.1% 14.5%
Supermarket 73.8% 67.7%
Farmer’s market 35.3% 35.3%
Convenience store 48.5% 51.2%
Duty free store 1.8% 2.0%
Local shop/ artisan 61.0% 63.3%
Q During this trip, which of the following activities did you participate in? 29
-
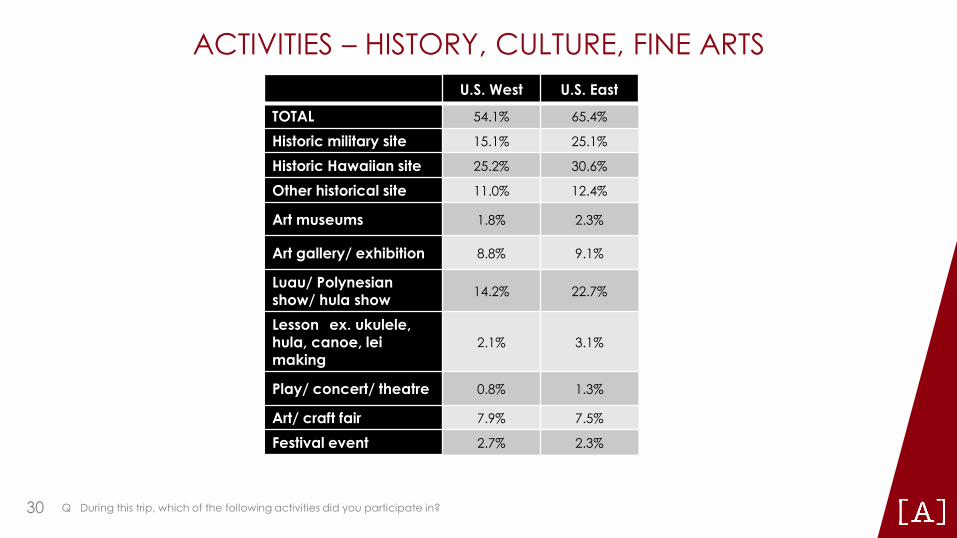
ACTIVITIES – HISTORY, CULTURE, FINE ARTS U.S. West U.S. East
TOTAL 54.1% 65.4%
Historic military site 15.1% 25.1%
Historic Hawaiian site 25.2% 30.6%
Other historical site 11.0% 12.4%
Art museums 1.8% 2.3%
Art gallery/ exhibition 8.8% 9.1%
Luau/ Polynesian show/ hula show 14.2% 22.7%
Lesson ex. ukulele, hula, canoe, lei making
2.1% 3.1%
Play/ concert/ theatre 0.8% 1.3%
Art/ craft fair 7.9% 7.5%
Festival event 2.7% 2.3%
Q During this trip, which of the following activities did you participate in? 30
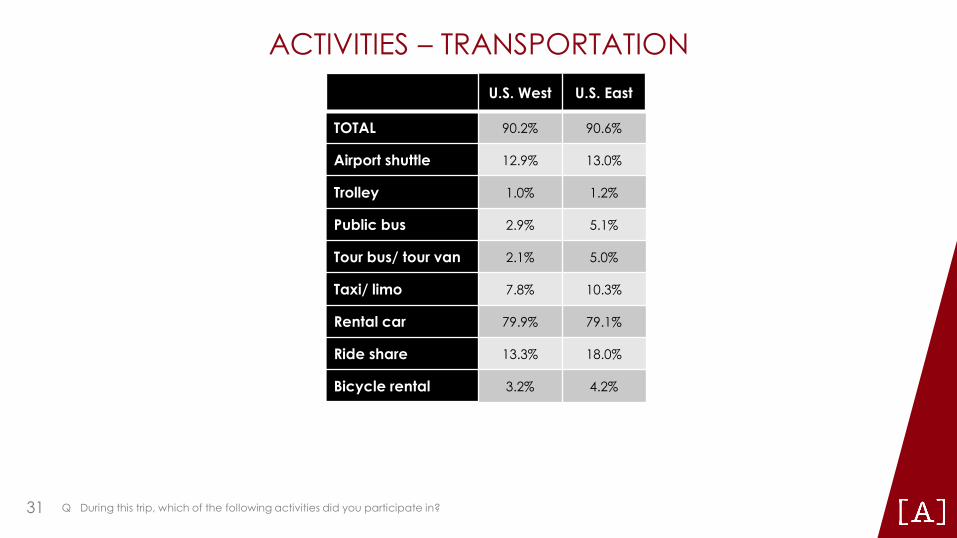
ACTIVITIES – TRANSPORTATION U.S. West U.S. East
TOTAL 90.2% 90.6%
Airport shuttle 12.9% 13.0%
Trolley 1.0% 1.2%
Public bus 2.9% 5.1%
Tour bus/ tour van 2.1% 5.0%
Taxi/ limo 7.8% 10.3%
Rental car 79.9% 79.1%
Ride share 13.3% 18.0%
Bicycle rental 3.2% 4.2%
Q During this trip, which of the following activities did you participate in? 31
-
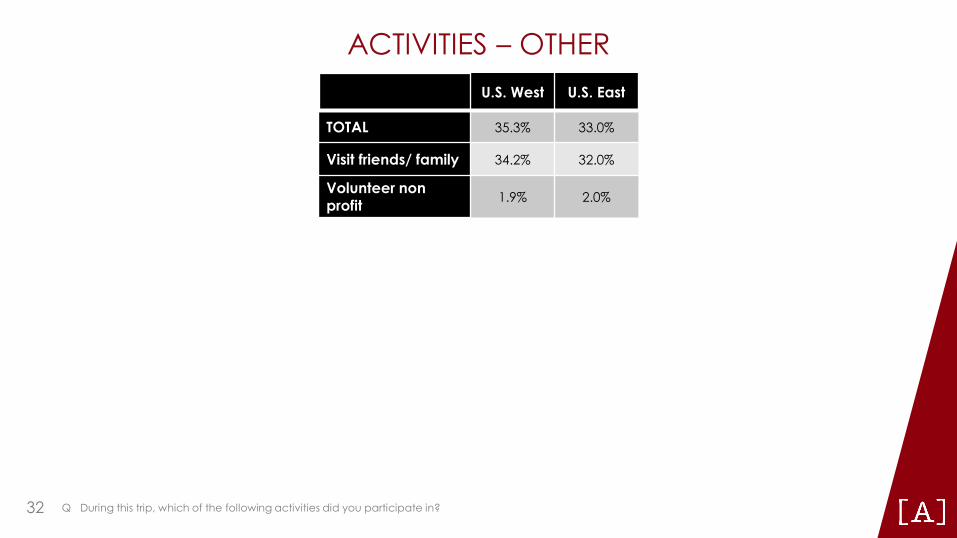
ACTIVITIES – OTHER U.S. West U.S. East
TOTAL 35.3% 33.0%
Visit friends/ family 34.2% 32.0%
Volunteer non profit 1.9% 2.0%
Q During this trip, which of the following activities did you participate in? 32
SECTION 3 – TRAVELERS WITH DISABILITIES
33
■
■
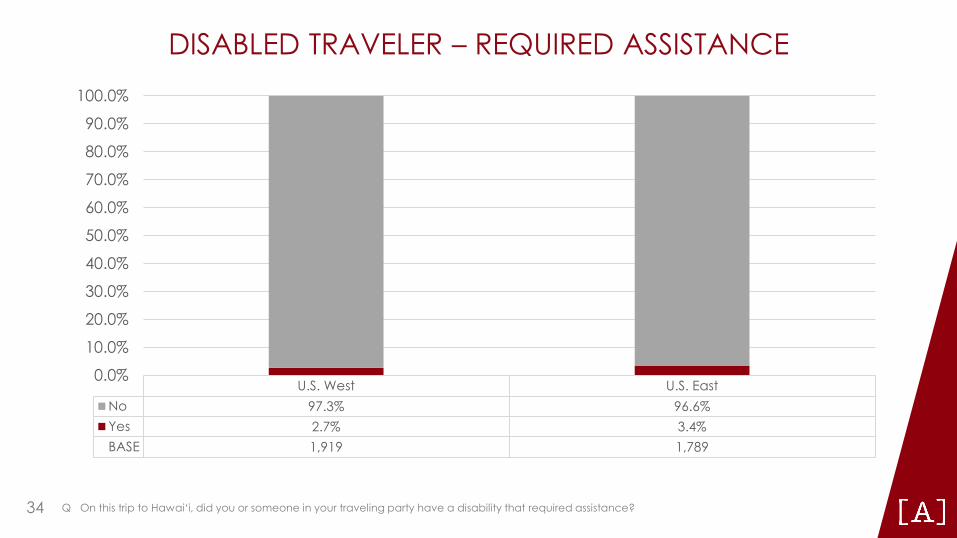
DISABLED TRAVELER – REQUIRED ASSISTANCE
U.S. West U.S. East No 97.3% 96.6% Yes 2.7% 3.4% BASE 1,919 1,789
0.0%
10.0%
20.0%
30.0%
40.0%
50.0%
60.0%
70.0%
80.0%
90.0%
100.0%
Q On this trip to Hawai‘i, did you or someone in your traveling party have a disability that required assistance? 34
-
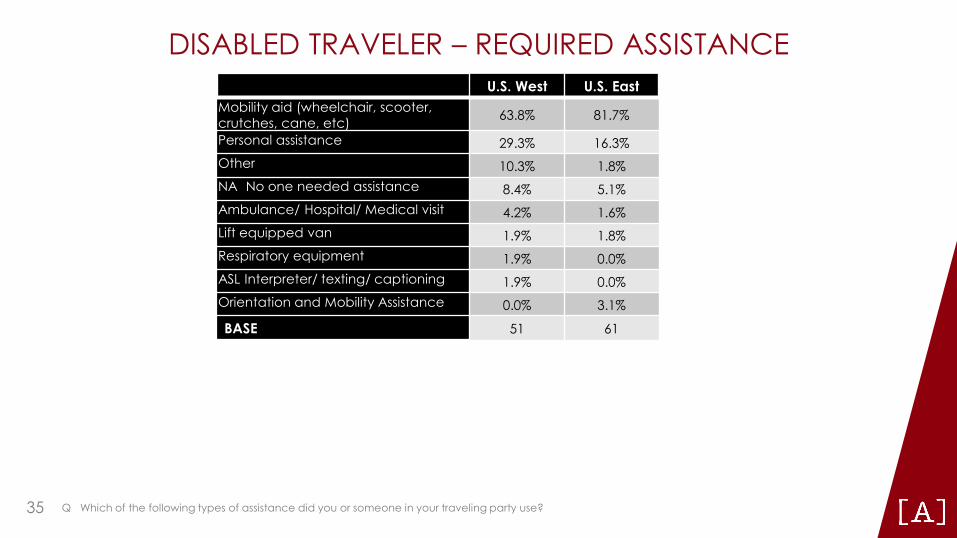
DISABLED TRAVELER – REQUIRED ASSISTANCE U.S. West U.S. East
Mobility aid (wheelchair, scooter, crutches, cane, etc) 63.8% 81.7%
Personal assistance 29.3% 16.3% Other 10.3% 1.8% NA No one needed assistance 8.4% 5.1% Ambulance/ Hospital/ Medical visit 4.2% 1.6% Lift equipped van 1.9% 1.8% Respiratory equipment 1.9% 0.0% ASL Interpreter/ texting/ captioning 1.9% 0.0% Orientation and Mobility Assistance 0.0% 3.1%
BASE 51 61
Q Which of the following types of assistance did you or someone in your traveling party use? 35
■
■
■
■
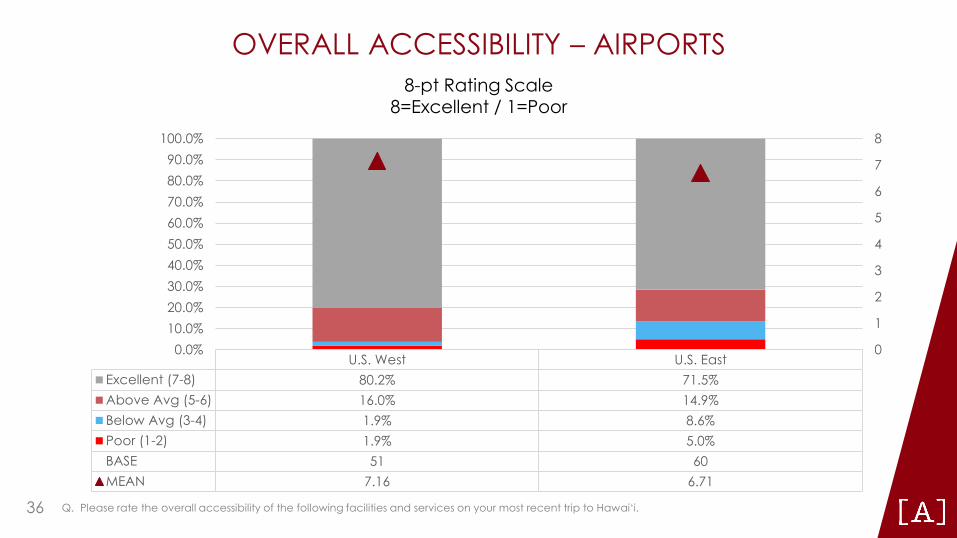
OVERALL ACCESSIBILITY – AIRPORTS 8-pt Rating Scale
8=Excellent / 1=Poor 100.0%
U.S. West U.S. East Excellent (7-8) 80.2% 71.5% Above Avg (5-6) 16.0% 14.9% Below Avg (3-4) 1.9% 8.6% Poor (1-2) 1.9% 5.0% BASE 51 60 MEAN 7.16 6.71
0.0% 10.0% 20.0%
8 90.0% 7 80.0%
670.0%
560.0% 50.0% 4 40.0% 3 30.0%
2
1
0
Q. Please rate the overall accessibility of the following facilities and services on your most recent trip to Hawai‘i. 36
■
■
■
■
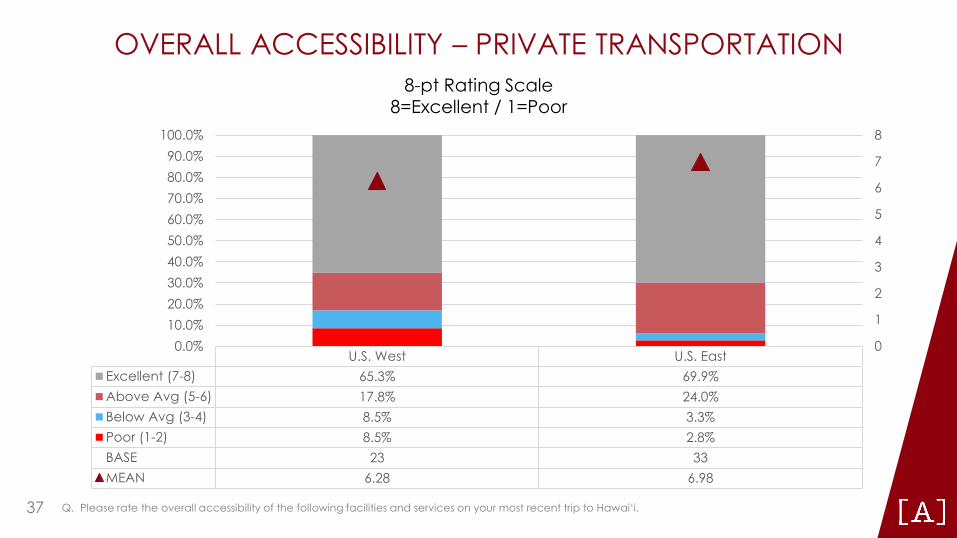
OVERALL ACCESSIBILITY – PRIVATE TRANSPORTATION 8-pt Rating Scale
8=Excellent / 1=Poor 100.0%
U.S. West U.S. East Excellent (7-8) 65.3% 69.9% Above Avg (5-6) 17.8% 24.0% Below Avg (3-4) 8.5% 3.3% Poor (1-2) 8.5% 2.8% BASE 23 33 MEAN 6.28 6.98
0.0% 10.0% 20.0% 30.0%
8 90.0% 7 80.0%
670.0%
560.0% 50.0% 4 40.0% 3
2
1
0
Q. Please rate the overall accessibility of the following facilities and services on your most recent trip to Hawai‘i. 37
■
■
■
■
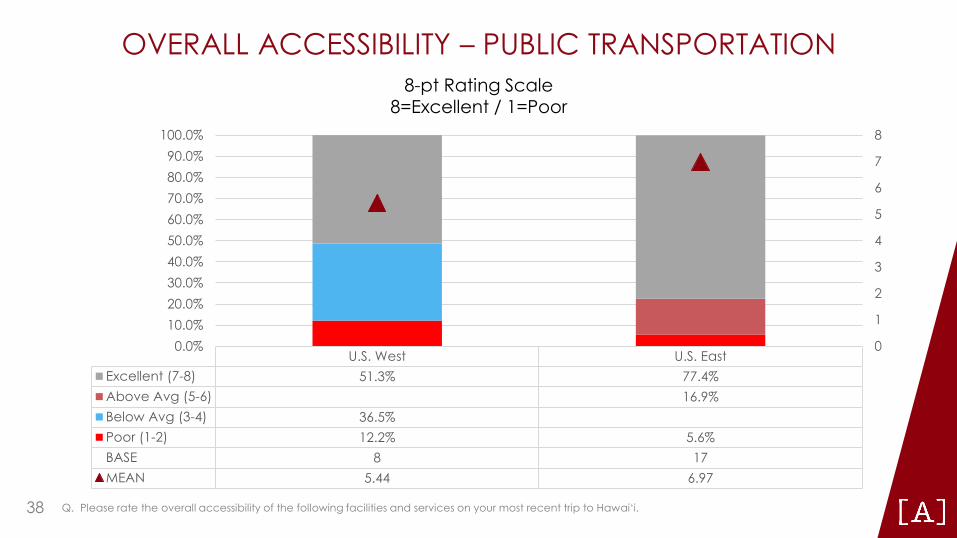
OVERALL ACCESSIBILITY – PUBLIC TRANSPORTATION 8-pt Rating Scale
8=Excellent / 1=Poor 100.0%
U.S. West U.S. East Excellent (7-8) 51.3% 77.4% Above Avg (5-6) 16.9% Below Avg (3-4) 36.5% Poor (1-2) 12.2% 5.6% BASE 8 17 MEAN 5.44 6.97
0.0% 10.0% 20.0% 30.0% 40.0%
8 90.0% 7 80.0%
670.0%
560.0% 50.0% 4
3
2
1
0
Q. Please rate the overall accessibility of the following facilities and services on your most recent trip to Hawai‘i. 38
■
■
■
■
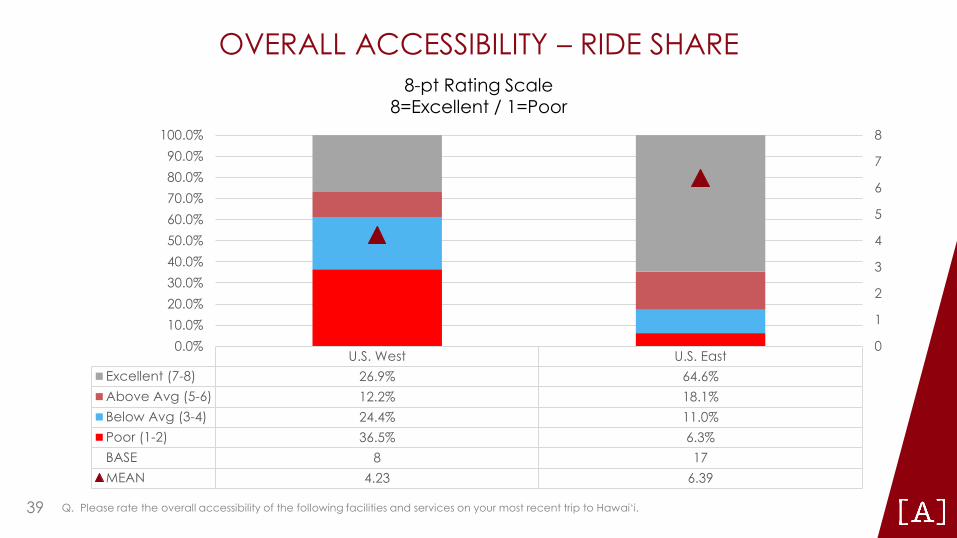
OVERALL ACCESSIBILITY – RIDE SHARE 8-pt Rating Scale
8=Excellent / 1=Poor 100.0%
U.S. West U.S. East Excellent (7-8) 26.9% 64.6% Above Avg (5-6) 12.2% 18.1% Below Avg (3-4) 24.4% 11.0% Poor (1-2) 36.5% 6.3% BASE 8 17 MEAN 4.23 6.39
0.0% 10.0% 20.0% 30.0%
8 90.0% 7 80.0%
670.0%
560.0% 50.0% 4 40.0% 3
2
1
0
Q. Please rate the overall accessibility of the following facilities and services on your most recent trip to Hawai‘i. 39
■
■
■
■
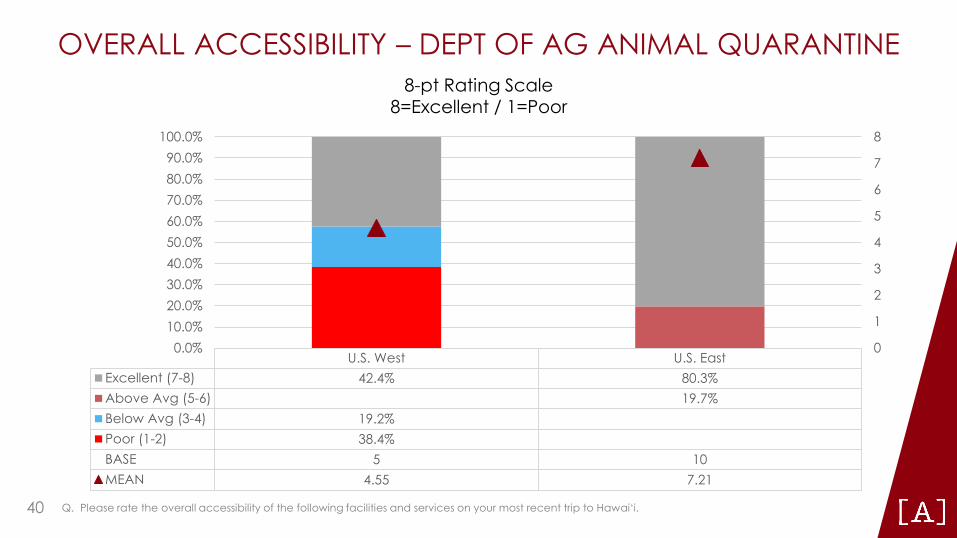
OVERALL ACCESSIBILITY – DEPT OF AG ANIMAL QUARANTINE 8-pt Rating Scale
8=Excellent / 1=Poor 100.0%
U.S. West U.S. East Excellent (7-8) 42.4% 80.3% Above Avg (5-6) 19.7% Below Avg (3-4) 19.2% Poor (1-2) 38.4% BASE 5 10 MEAN 4.55 7.21
0.0% 10.0% 20.0% 30.0%
8 90.0% 7 80.0%
670.0%
560.0% 50.0% 4 40.0% 3
2
1
0
Q. Please rate the overall accessibility of the following facilities and services on your most recent trip to Hawai‘i. 40
■
■
■
■
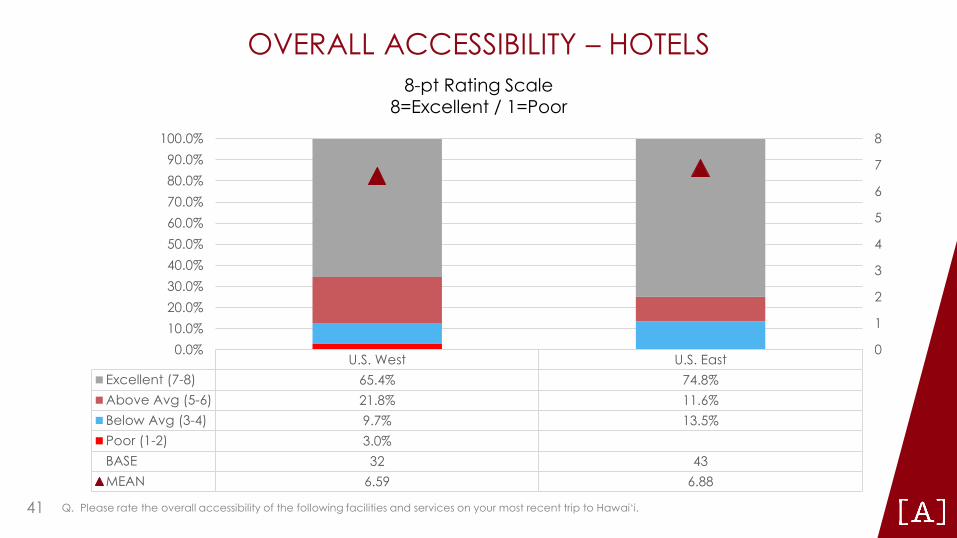
OVERALL ACCESSIBILITY – HOTELS 8-pt Rating Scale
8=Excellent / 1=Poor 100.0%
U.S. West U.S. East Excellent (7-8) 65.4% 74.8% Above Avg (5-6) 21.8% 11.6% Below Avg (3-4) 9.7% 13.5% Poor (1-2) 3.0% BASE 32 43 MEAN 6.59 6.88
0.0% 10.0% 20.0% 30.0%
8 90.0% 7 80.0%
670.0%
560.0% 50.0% 4 40.0% 3
2
1
0
Q. Please rate the overall accessibility of the following facilities and services on your most recent trip to Hawai‘i. 41
■
■
■
■
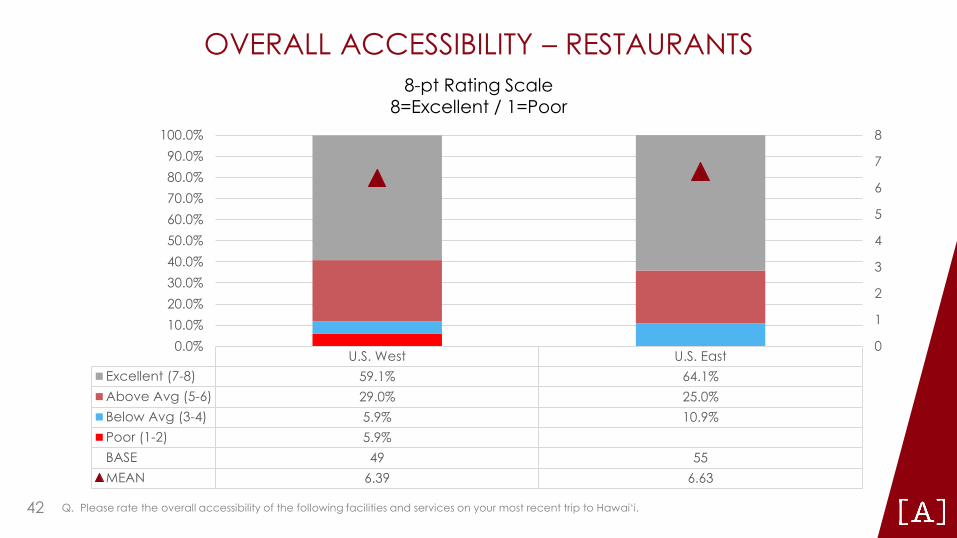
OVERALL ACCESSIBILITY – RESTAURANTS 8-pt Rating Scale
8=Excellent / 1=Poor 100.0%
U.S. West U.S. East Excellent (7-8) 59.1% 64.1% Above Avg (5-6) 29.0% 25.0% Below Avg (3-4) 5.9% 10.9% Poor (1-2) 5.9% BASE 49 55 MEAN 6.39 6.63
0.0% 10.0% 20.0% 30.0% 40.0%
8 90.0% 7 80.0%
670.0%
560.0% 50.0% 4
3
2
1
0
Q. Please rate the overall accessibility of the following facilities and services on your most recent trip to Hawai‘i. 42
■
■
■
■
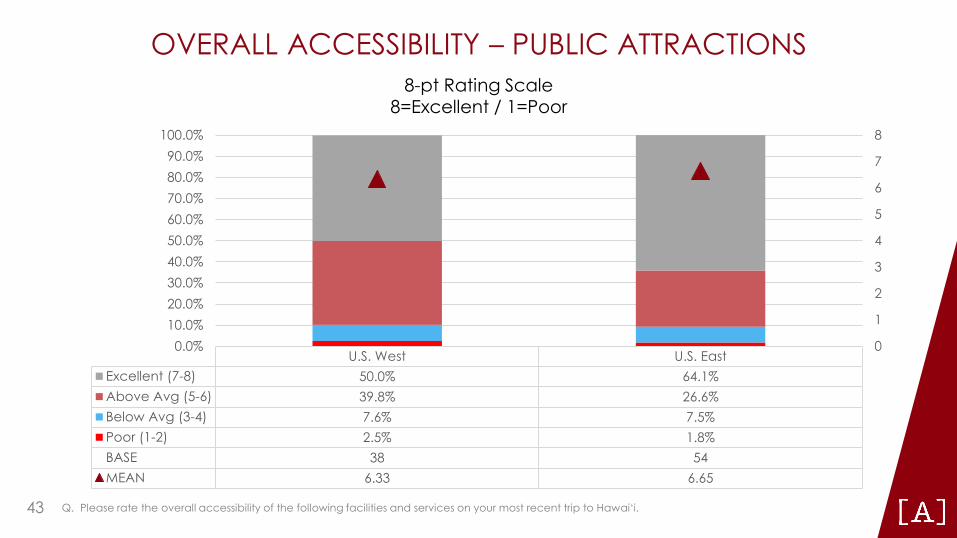
OVERALL ACCESSIBILITY – PUBLIC ATTRACTIONS 8-pt Rating Scale
8=Excellent / 1=Poor 100.0%
U.S. West U.S. East Excellent (7-8) 50.0% 64.1% Above Avg (5-6) 39.8% 26.6% Below Avg (3-4) 7.6% 7.5% Poor (1-2) 2.5% 1.8% BASE 38 54 MEAN 6.33 6.65
0.0% 10.0% 20.0% 30.0% 40.0% 50.0%
8 90.0% 7 80.0%
670.0%
560.0% 4
3
2
1
0
Q. Please rate the overall accessibility of the following facilities and services on your most recent trip to Hawai‘i. 43
■
■
■
■
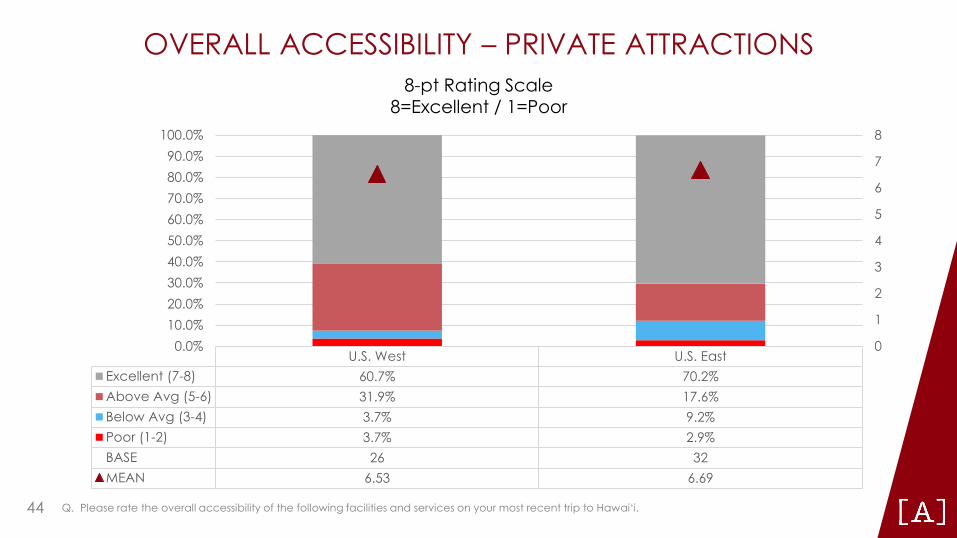
OVERALL ACCESSIBILITY – PRIVATE ATTRACTIONS 8-pt Rating Scale
8=Excellent / 1=Poor 100.0%
U.S. West U.S. East Excellent (7-8) 60.7% 70.2% Above Avg (5-6) 31.9% 17.6% Below Avg (3-4) 3.7% 9.2% Poor (1-2) 3.7% 2.9% BASE 26 32 MEAN 6.53 6.69
0.0% 10.0% 20.0% 30.0% 40.0%
8 90.0% 7 80.0%
670.0%
560.0% 50.0% 4
3
2
1
0
Q. Please rate the overall accessibility of the following facilities and services on your most recent trip to Hawai‘i. 44
SECTION 4 – ALTERNATIVE MESSAGING
45
■
■
■
■
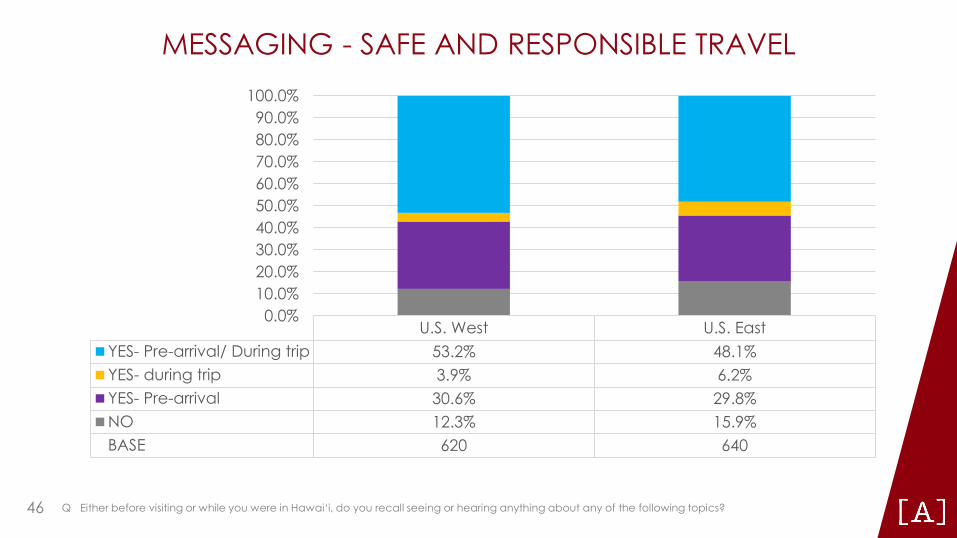
MESSAGING - SAFE AND RESPONSIBLE TRAVEL 100.0% 90.0% 80.0% 70.0% 60.0% 50.0% 40.0% 30.0% 20.0% 10.0%
U.S. West U.S. East YES- Pre-arrival/ During trip 53.2% 48.1% YES- during trip 3.9% 6.2% YES- Pre-arrival 30.6% 29.8% NO 12.3% 15.9% BASE 620 640
0.0%
Q Either before visiting or while you were in Hawai‘i, do you recall seeing or hearing anything about any of the following topics? 46
■
■
■
■
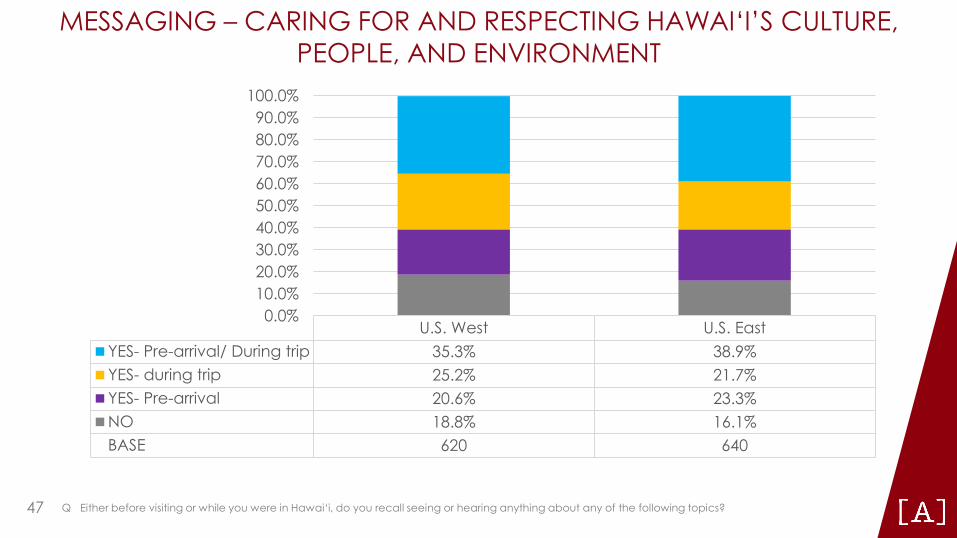
MESSAGING – CARING FOR AND RESPECTING HAWAI‘I’S CULTURE, PEOPLE, AND ENVIRONMENT
100.0% 90.0% 80.0% 70.0% 60.0% 50.0% 40.0% 30.0% 20.0% 10.0%
U.S. West U.S. East YES- Pre-arrival/ During trip 35.3% 38.9% YES- during trip 25.2% 21.7% YES- Pre-arrival 20.6% 23.3% NO 18.8% 16.1% BASE 620 640
0.0%
Q Either before visiting or while you were in Hawai‘i, do you recall seeing or hearing anything about any of the following topics? 47
■
■
■
■
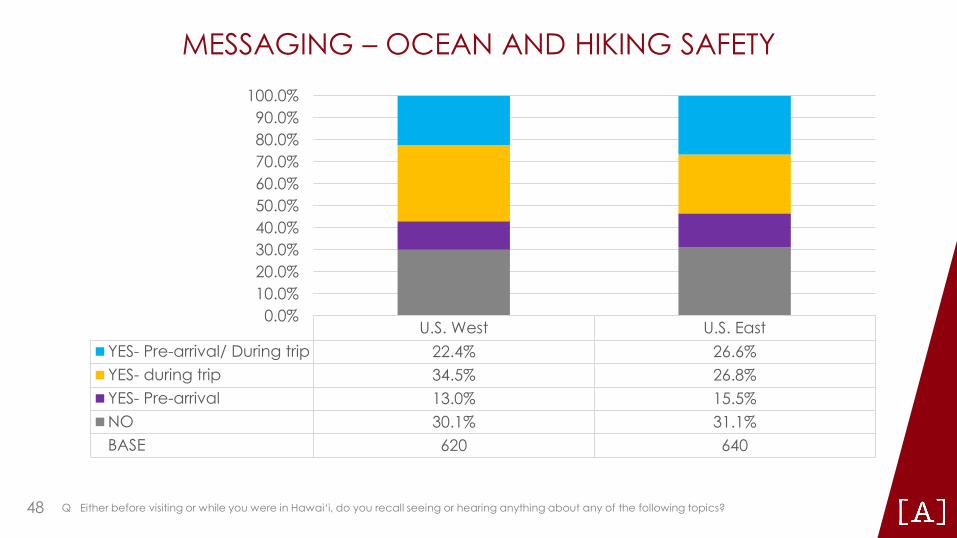
MESSAGING – OCEAN AND HIKING SAFETY 100.0% 90.0% 80.0% 70.0% 60.0% 50.0% 40.0% 30.0% 20.0% 10.0%
U.S. West U.S. East YES- Pre-arrival/ During trip 22.4% 26.6% YES- during trip 34.5% 26.8% YES- Pre-arrival 13.0% 15.5% NO 30.1% 31.1% BASE 620 640
0.0%
Q Either before visiting or while you were in Hawai‘i, do you recall seeing or hearing anything about any of the following topics? 48
SECTION 5 – O‘AHU 49

■
■
■
■
SATISFACTION – O‘AHU 8-pt Rating Scale
8=Excellent / 1=Poor 100.0%
90.0% 80.0% 70.0% 60.0% 50.0% 40.0% 30.0% 20.0% 10.0%
8
7
6
5
4
3
2
1
0.0% U.S. West U.S. East
0
Excellent (7-8) 80.6% 81.1% Above Avg (5-6) 13.9% 12.6% Below Avg (3-4) 3.6% 4.2% Poor (1-2) 1.9% 2.1% BASE 703 896 MEAN 7.18 7.21
Q. How would you rate your most recent trip to the state of Hawai’i? How would you rate your experience on___? 50
SATISFACTION – O‘AHU
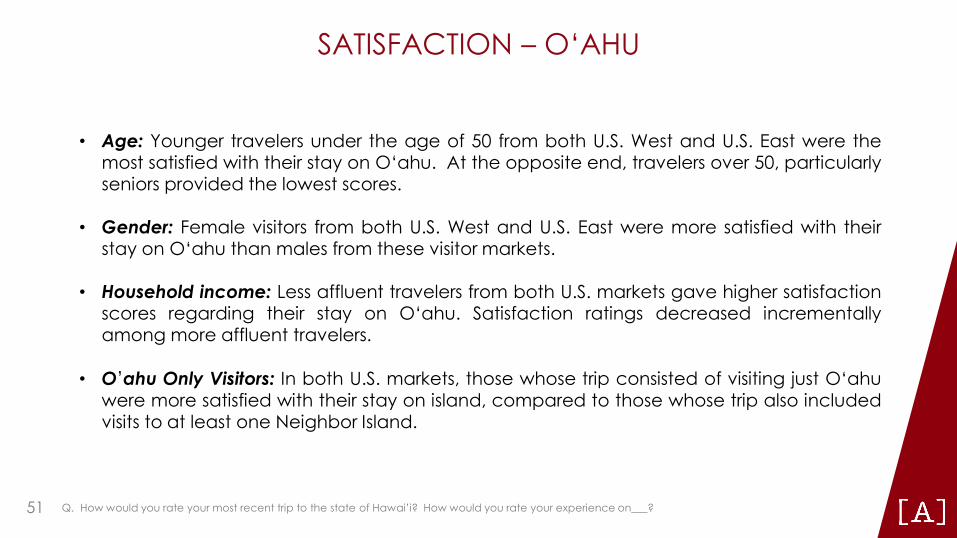
• Age: Younger travelers under the age of 50 from both U.S. West and U.S. East were the most satisfied with their stay on O‘ahu. At the opposite end, travelers over 50, particularly seniors provided the lowest scores.
• Gender: Female visitors from both U.S. West and U.S. East were more satisfied with their stay on O‘ahu than males from these visitor markets.
• Household income: Less affluent travelers from both U.S. markets gave higher satisfaction scores regarding their stay on O‘ahu. Satisfaction ratings decreased incrementally among more affluent travelers.
• O’ahu Only Visitors: In both U.S. markets, those whose trip consisted of visiting just O‘ahu were more satisfied with their stay on island, compared to those whose trip also included visits to at least one Neighbor Island.
Q. How would you rate your most recent trip to the state of Hawai’i? How would you rate your experience on___? 51
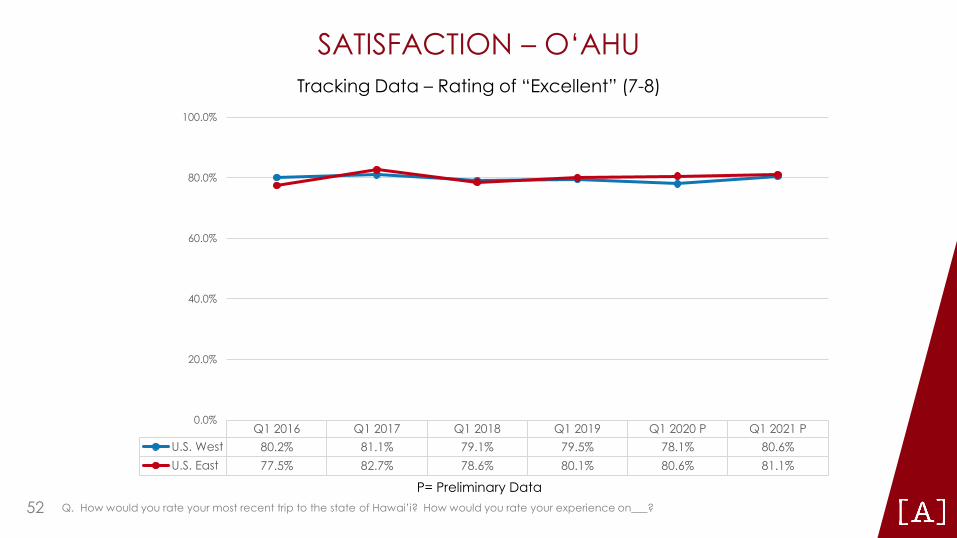
SATISFACTION – O‘AHU Tracking Data – Rating of “Excellent” (7-8)
100.0%
80.0%
60.0%
40.0%
20.0%
0.0%
P= Preliminary Data Q. How would you rate your most recent trip to the state of Hawai’i? How would you rate your experience on___?
Q1 2016 Q1 2017 Q1 2018 Q1 2019 Q1 2020 P Q1 2021 P U.S. West 80.2% 81.1% 79.1% 79.5% 78.1% 80.6% U.S. East 77.5% 82.7% 78.6% 80.1% 80.6% 81.1%
52
■
■
■
■
■
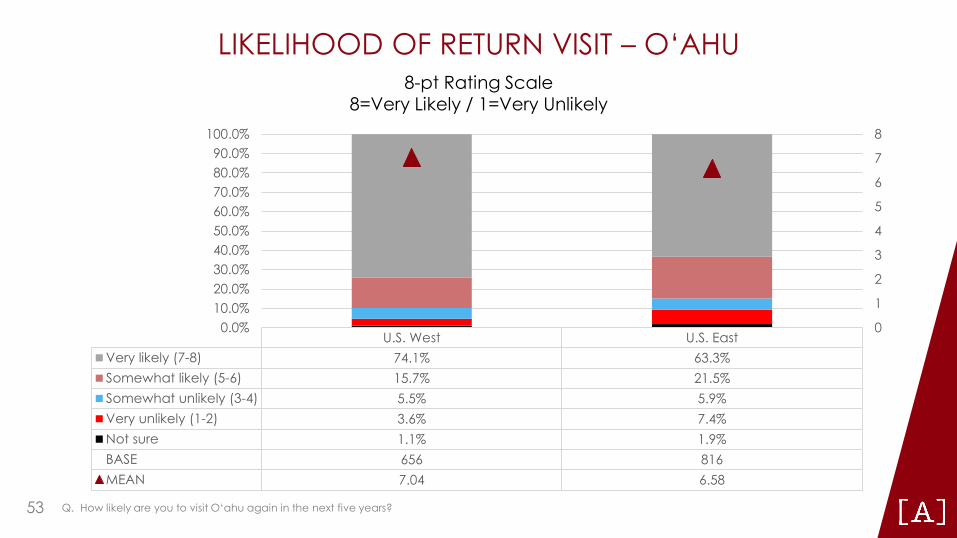
LIKELIHOOD OF RETURN VISIT – O‘AHU 8-pt Rating Scale
8=Very Likely / 1=Very Unlikely 100.0% 8
90.0% 7 80.0%
670.0%
560.0% 50.0% 4 40.0% 3 30.0%
220.0%
110.0% 0.0%
U.S. West U.S. East Very likely (7-8) 74.1% 63.3% Somewhat likely (5-6) 15.7% 21.5% Somewhat unlikely (3-4) 5.5% 5.9% Very unlikely (1-2) 3.6% 7.4% Not sure 1.1% 1.9% BASE 656 816 MEAN 7.04 6.58
Q. How likely are you to visit O‘ahu again in the next five years? 53
0
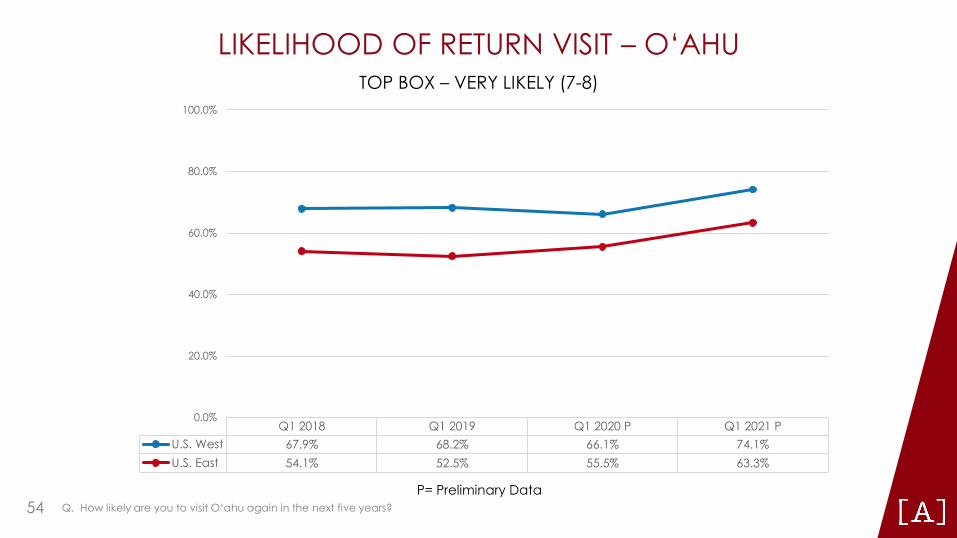
LIKELIHOOD OF RETURN VISIT – O‘AHU TOP BOX – VERY LIKELY (7-8)
100.0%
80.0%
60.0%
40.0%
20.0%
0.0% Q1 2018 Q1 2019 Q1 2020 P Q1 2021 P
U.S. West 67.9% 68.2% 66.1% 74.1% U.S. East 54.1% 52.5% 55.5% 63.3%
P= Preliminary Data Q. How likely are you to visit O‘ahu again in the next five years? 54
■
■
■
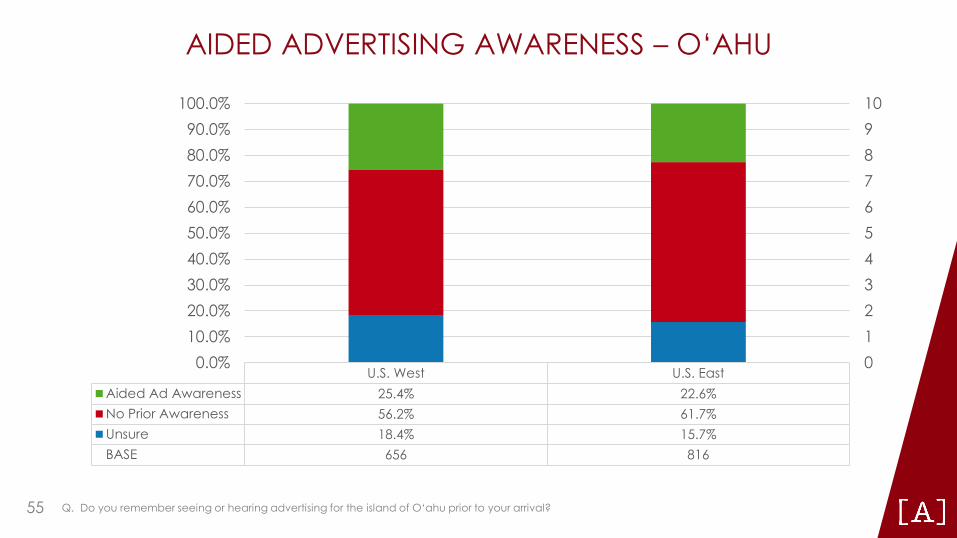
AIDED ADVERTISING AWARENESS – O‘AHU
100.0% 90.0% 80.0% 70.0% 60.0% 50.0% 40.0% 30.0% 20.0% 10.0%
U.S. West U.S. East Aided Ad Awareness 25.4% 22.6% No Prior Awareness 56.2% 61.7% Unsure 18.4% 15.7% BASE 656 816
0.0%
10 9 8 7 6 5 4 3 2 1 0
Q. Do you remember seeing or hearing advertising for the island of O‘ahu prior to your arrival? 55
-
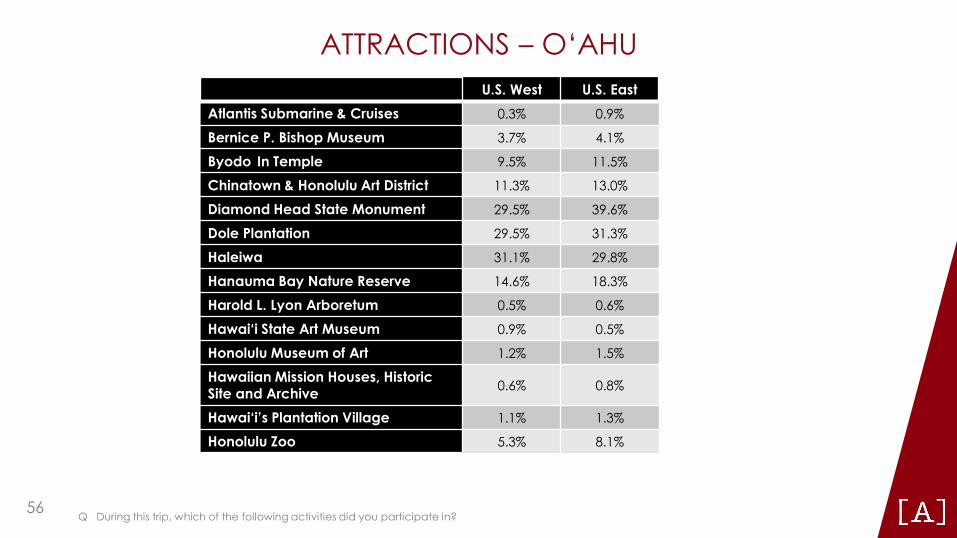
ATTRACTIONS – O‘AHU U.S. West U.S. East
Atlantis Submarine & Cruises 0.3% 0.9%
Bernice P. Bishop Museum 3.7% 4.1%
Byodo In Temple 9.5% 11.5%
Chinatown & Honolulu Art District 11.3% 13.0%
Diamond Head State Monument 29.5% 39.6%
Dole Plantation 29.5% 31.3%
Haleiwa 31.1% 29.8%
Hanauma Bay Nature Reserve 14.6% 18.3%
Harold L. Lyon Arboretum 0.5% 0.6%
Hawai‘i State Art Museum 0.9% 0.5%
Honolulu Museum of Art 1.2% 1.5%
Hawaiian Mission Houses, Historic Site and Archive 0.6% 0.8%
Hawai‘i’s Plantation Village 1.1% 1.3%
Honolulu Zoo 5.3% 8.1%
Q During this trip, which of the following activities did you participate in? 56
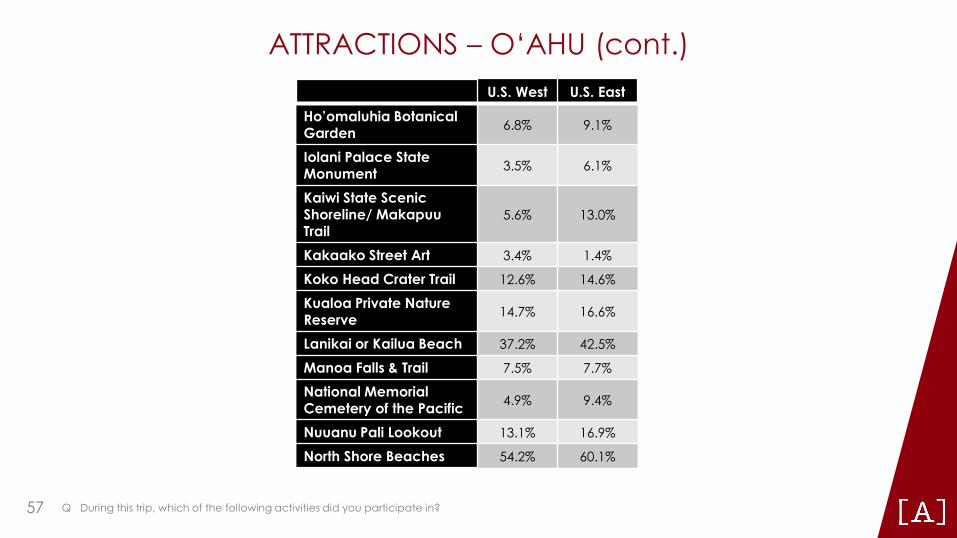
ATTRACTIONS – O‘AHU (cont.) U.S. West U.S. East
Ho’omaluhia Botanical Garden 6.8% 9.1%
Iolani Palace State Monument 3.5% 6.1%
Kaiwi State Scenic Shoreline/ Makapuu Trail
5.6% 13.0%
Kakaako Street Art 3.4% 1.4%
Koko Head Crater Trail 12.6% 14.6%
Kualoa Private Nature Reserve 14.7% 16.6%
Lanikai or Kailua Beach 37.2% 42.5%
Manoa Falls & Trail 7.5% 7.7%
National Memorial Cemetery of the Pacific 4.9% 9.4%
Nuuanu Pali Lookout 13.1% 16.9%
North Shore Beaches 54.2% 60.1%
Q During this trip, which of the following activities did you participate in? 57
--------
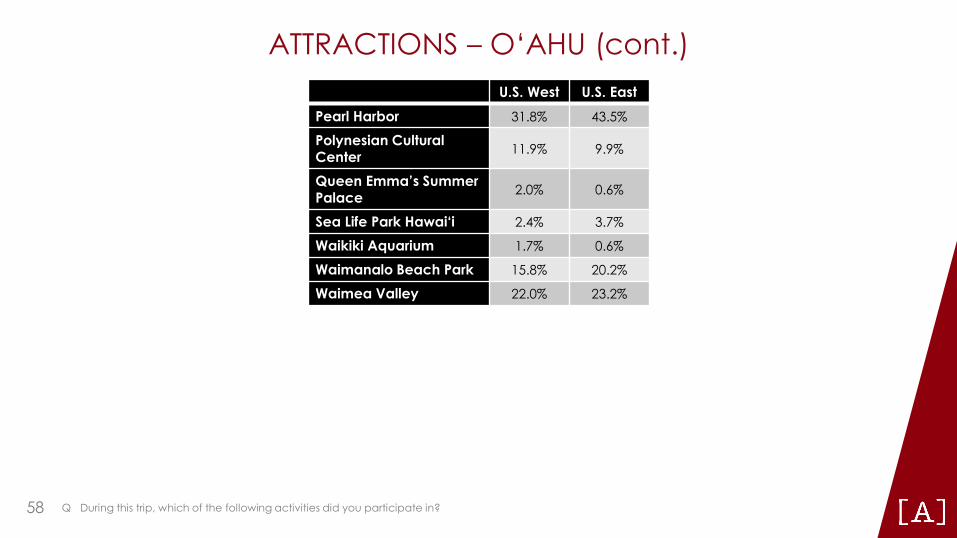
ATTRACTIONS – O‘AHU (cont.) U.S. West U.S. East
Pearl Harbor 31.8% 43.5%
Polynesian Cultural Center 11.9% 9.9%
Queen Emma’s Summer Palace 2.0% 0.6%
Sea Life Park Hawai‘i 2.4% 3.7%
Waikiki Aquarium 1.7% 0.6%
Waimanalo Beach Park 15.8% 20.2%
Waimea Valley 22.0% 23.2%
Q During this trip, which of the following activities did you participate in? 58
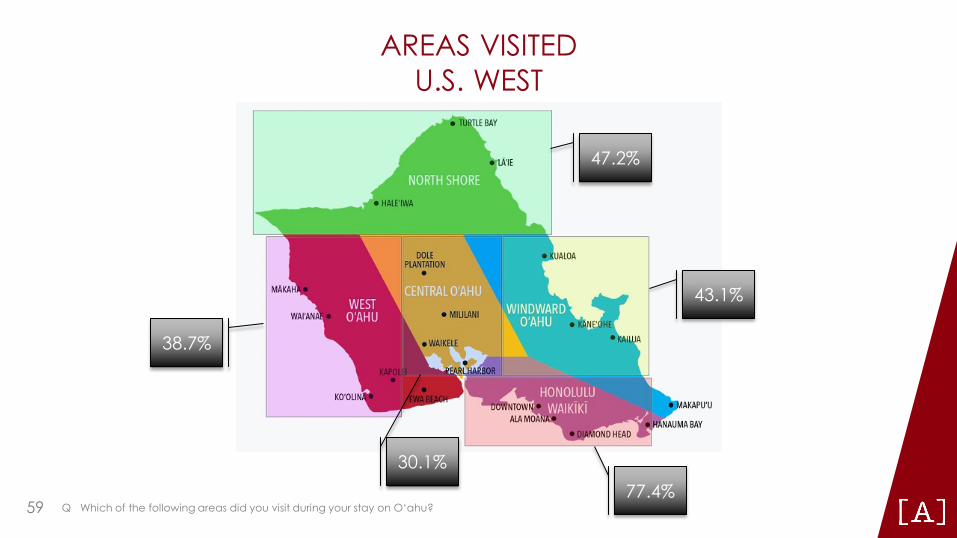
r DOLE
PIANTATION •
AREAS VISITED U.S. WEST
47.2%
43.1%
77.4% 30.1%
38.7%
Q Which of the following areas did you visit during your stay on O‘ahu? 59
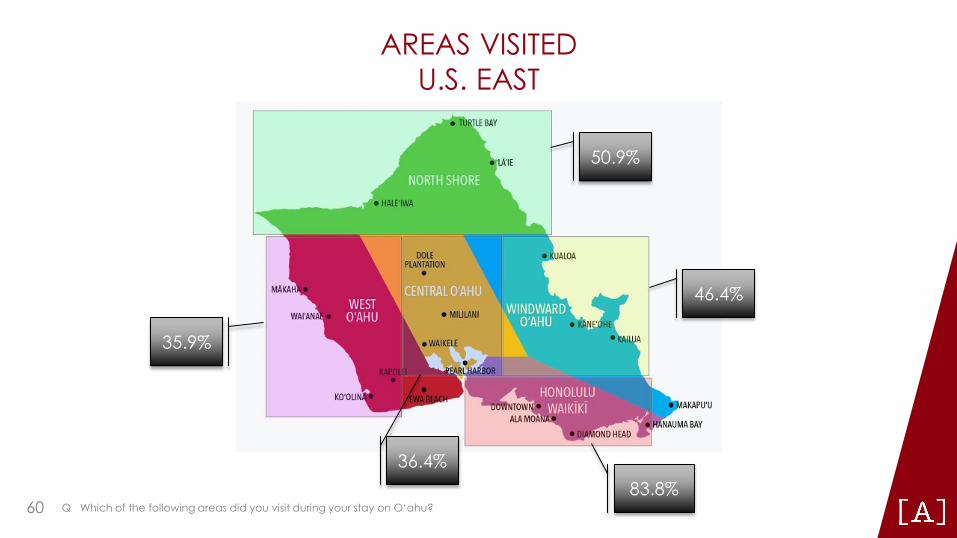
r DOLE
PIANTATION •
A.KAPU'U
AREAS VISITED U.S. EAST
50.9%
46.4%
83.8% 36.4%
35.9%
Q Which of the following areas did you visit during your stay on O‘ahu? 60
■
■
■
■
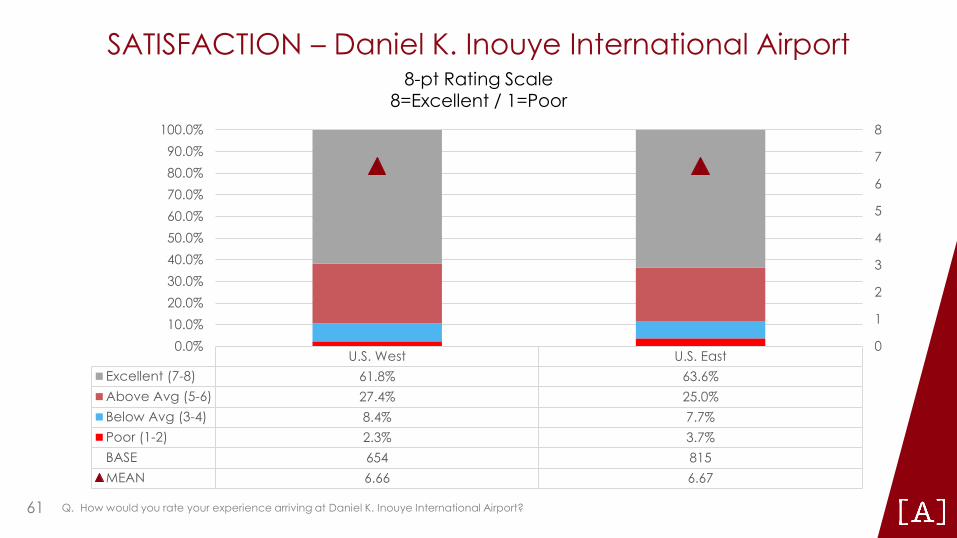
SATISFACTION – Daniel K. Inouye International Airport 8-pt Rating Scale
8=Excellent / 1=Poor 100.0%
U.S. West U.S. East Excellent (7-8) 61.8% 63.6% Above Avg (5-6) 27.4% 25.0% Below Avg (3-4) 8.4% 7.7% Poor (1-2) 2.3% 3.7% BASE 654 815 MEAN 6.66 6.67
0.0% 10.0% 20.0% 30.0%
8 90.0% 7 80.0%
6 70.0%
560.0% 50.0% 4 40.0% 3
2
1
0
Q. How would you rate your experience arriving at Daniel K. Inouye International Airport? 61

■
■
■
SNORKELING EQUIPMENT USED – O‘AHU
100.0%
90.0%
80.0%
70.0%
60.0%
50.0%
40.0%
30.0%
20.0%
10.0%
U.S. West U.S. East 2-Piece, separate mask & snorkel 85.9% 88.6% Full-face snorkel mask 19.0% 14.4% Neither of these 1.5% 0.7% BASE 261 277
0.0%
10
9
8
7
6
5
4
3
2
1
0
Q. Which type of snorkeling equipment did you use? 62
– -
-
--
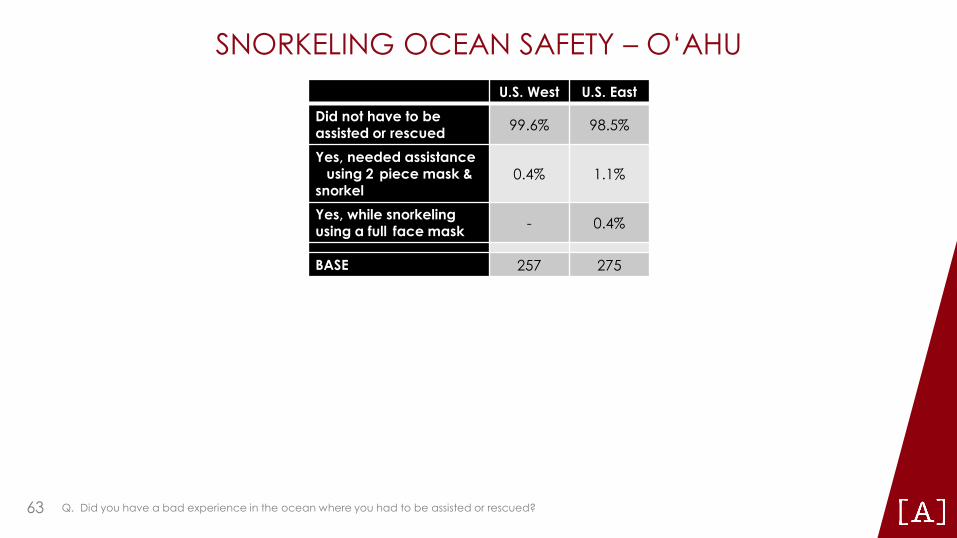
SNORKELING OCEAN SAFETY – O‘AHU U.S. West U.S. East
Did not have to be assisted or rescued 99.6% 98.5%
Yes, needed assistance using 2 piece mask &
snorkel 0.4% 1.1%
Yes, while snorkeling using a full face mask - 0.4%
BASE 257 275
Q. Did you have a bad experience in the ocean where you had to be assisted or rescued? 63
SECTION 6 – KAUA‘I 64
■
■
■
■
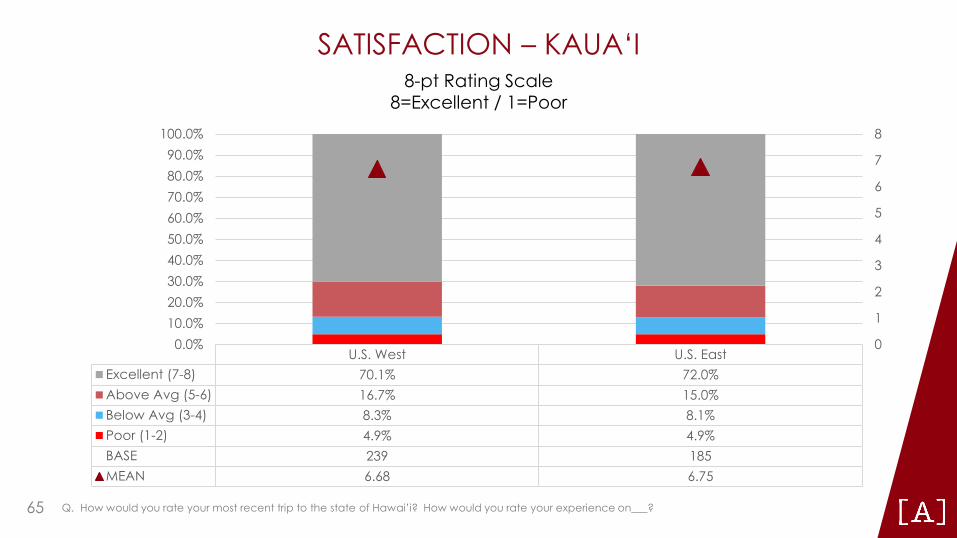
SATISFACTION – KAUA‘I 8-pt Rating Scale
8=Excellent / 1=Poor 100.0%
90.0% 80.0% 70.0% 60.0% 50.0% 40.0%
U.S. West U.S. East Excellent (7-8) 70.1% 72.0% Above Avg (5-6) 16.7% 15.0% Below Avg (3-4) 8.3% 8.1% Poor (1-2) 4.9% 4.9% BASE 239 185 MEAN 6.68 6.75
0.0% 10.0% 20.0% 30.0%
8
7
6
5
4
3
2
1
0
Q. How would you rate your most recent trip to the state of Hawai’i? How would you rate your experience on___? 65
SATISFACTION – KAUA‘I
• Age: Among travelers from U.S. West, those between the ages of 50 and 64 provided the lowest satisfaction mean scores compared to visitors in the other age groups.
• First-time vs Repeat visitor: Among travelers from U.S. West, first-time visitors to the state were more satisfied with their stay on Kaua’i compared to repeat visitors.
Q. How would you rate your most recent trip to the state of Hawai’i? How would you rate your experience on___? 66
, ....... ~ .......
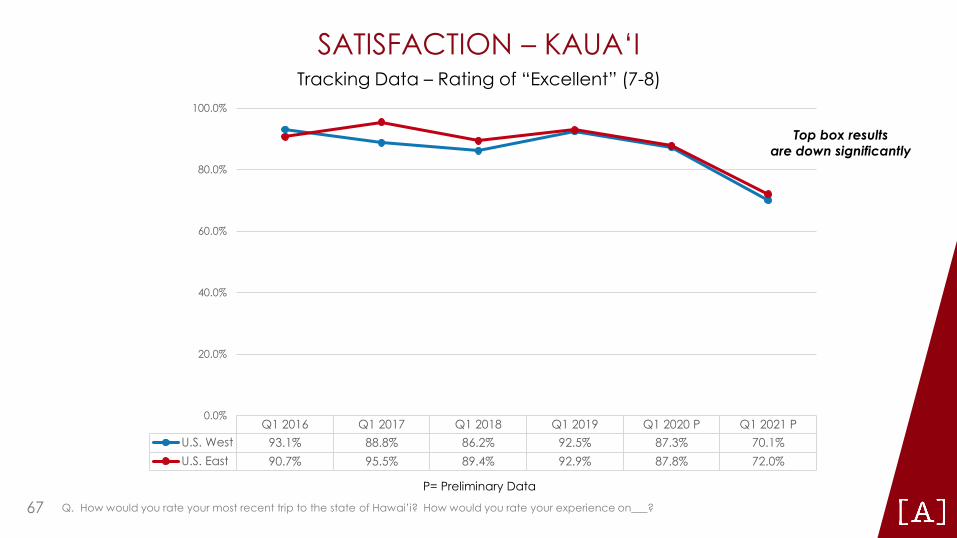
SATISFACTION – KAUA‘I Tracking Data – Rating of “Excellent” (7-8)
100.0%
80.0%
Top box results are down significantly
60.0%
40.0%
20.0%
0.0% Q1 2016 Q1 2017 Q1 2018 Q1 2019 Q1 2020 P Q1 2021 P
U.S. West 93.1% 88.8% 86.2% 92.5% 87.3% 70.1% U.S. East 90.7% 95.5% 89.4% 92.9% 87.8% 72.0%
P= Preliminary Data
Q. How would you rate your most recent trip to the state of Hawai’i? How would you rate your experience on___? 67
■
■
■
■
■
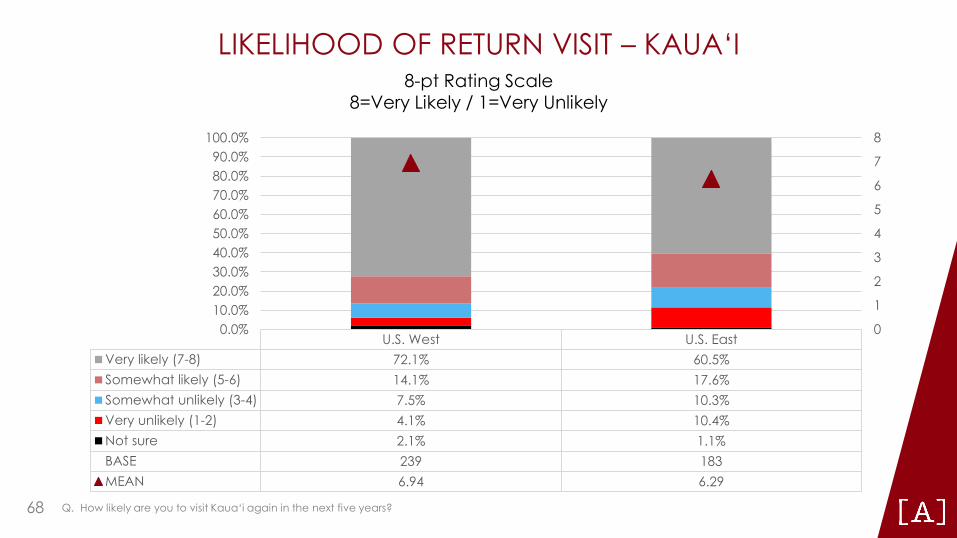
LIKELIHOOD OF RETURN VISIT – KAUA‘I 8-pt Rating Scale
8=Very Likely / 1=Very Unlikely
100.0% 8 90.0% 7 80.0%
670.0%
560.0% 50.0% 4 40.0% 3 30.0%
220.0%
110.0% 0.0%
U.S. West U.S. East Very likely (7-8) 72.1% 60.5% Somewhat likely (5-6) 14.1% 17.6% Somewhat unlikely (3-4) 7.5% 10.3% Very unlikely (1-2) 4.1% 10.4% Not sure 2.1% 1.1% BASE 239 183 MEAN 6.94 6.29
0
Q. How likely are you to visit Kaua‘i again in the next five years? 68
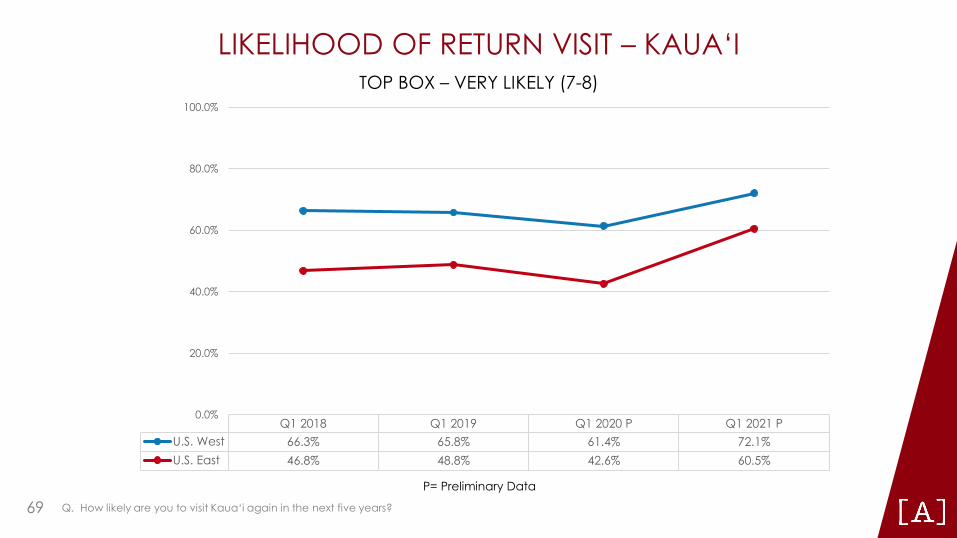
LIKELIHOOD OF RETURN VISIT – KAUA‘I TOP BOX – VERY LIKELY (7-8)
100.0%
80.0%
40.0%
60.0%
20.0%
0.0% Q1 2018 Q1 2019 Q1 2020 P Q1 2021 P
U.S. West 66.3% 65.8% 61.4% 72.1% U.S. East 46.8% 48.8% 42.6% 60.5%
P= Preliminary Data
Q. How likely are you to visit Kaua‘i again in the next five years? 69
■
■
■
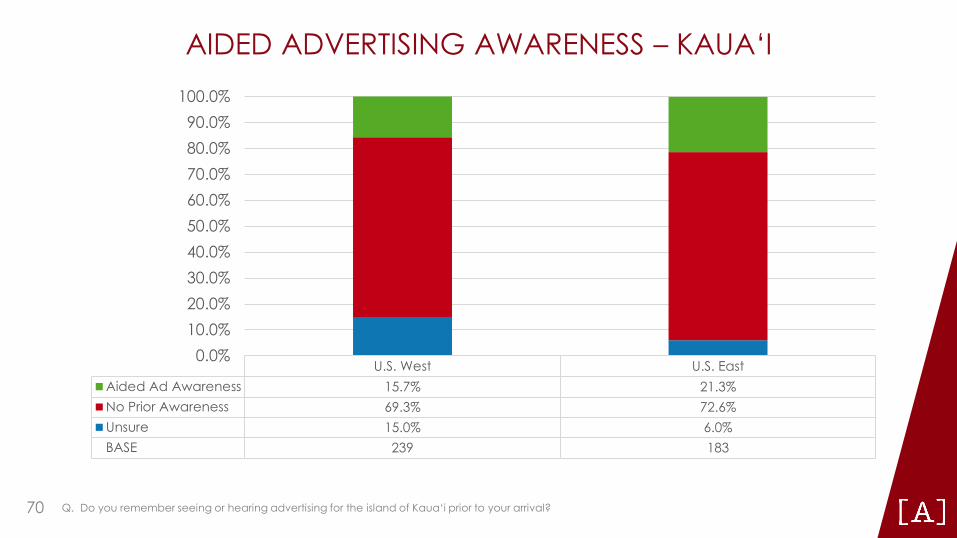
AIDED ADVERTISING AWARENESS – KAUA‘I 100.0% 90.0% 80.0% 70.0% 60.0% 50.0% 40.0% 30.0% 20.0% 10.0%
U.S. West U.S. East Aided Ad Awareness 15.7% 21.3% No Prior Awareness 69.3% 72.6% Unsure 15.0% 6.0% BASE 239 183
0.0%
Q. Do you remember seeing or hearing advertising for the island of Kaua‘i prior to your arrival? 70
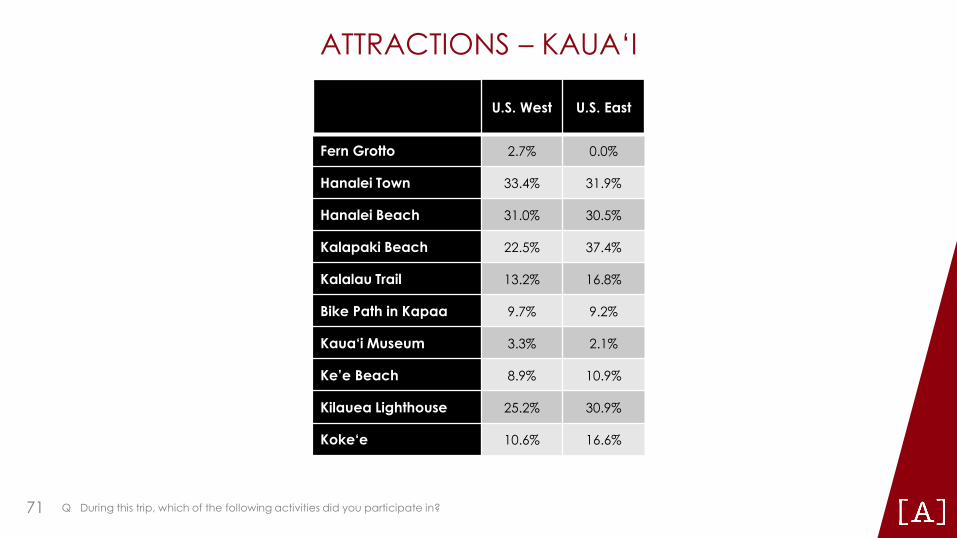
ATTRACTIONS – KAUA‘I
U.S. West U.S. East
Fern Grotto 2.7% 0.0%
Hanalei Town 33.4% 31.9%
Hanalei Beach 31.0% 30.5%
Kalapaki Beach 22.5% 37.4%
Kalalau Trail 13.2% 16.8%
Bike Path in Kapaa 9.7% 9.2%
Kaua‘i Museum 3.3% 2.1%
Ke’e Beach 8.9% 10.9%
Kilauea Lighthouse 25.2% 30.9%
Koke‘e 10.6% 16.6%
Q During this trip, which of the following activities did you participate in? 71
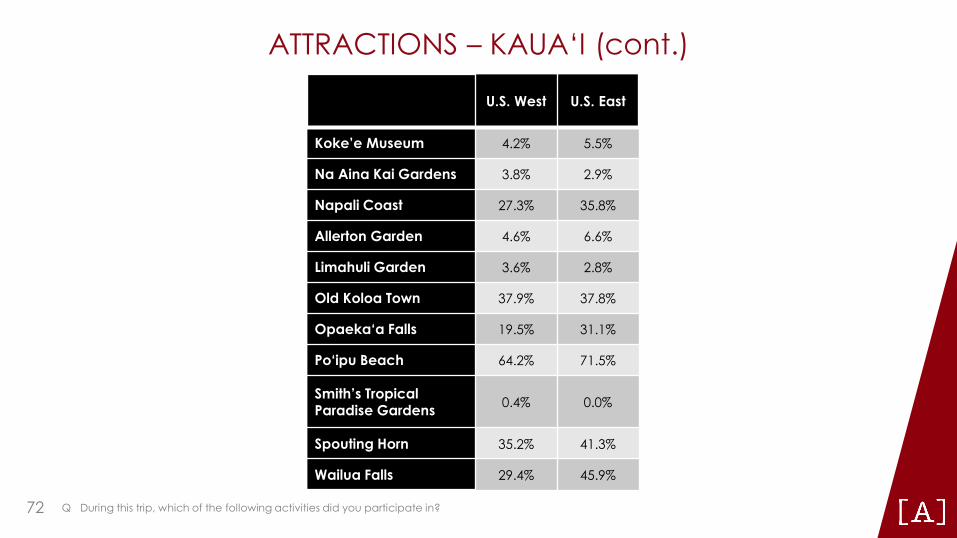
ATTRACTIONS – KAUA‘I (cont.)
U.S. West U.S. East
Koke’e Museum 4.2% 5.5%
Na Aina Kai Gardens 3.8% 2.9%
Napali Coast 27.3% 35.8%
Allerton Garden 4.6% 6.6%
Limahuli Garden 3.6% 2.8%
Old Koloa Town 37.9% 37.8%
Opaeka‘a Falls 19.5% 31.1%
Po‘ipu Beach 64.2% 71.5%
Smith’s Tropical Paradise Gardens 0.4% 0.0%
Spouting Horn 35.2% 41.3%
Wailua Falls 29.4% 45.9%
Q During this trip, which of the following activities did you participate in? 72
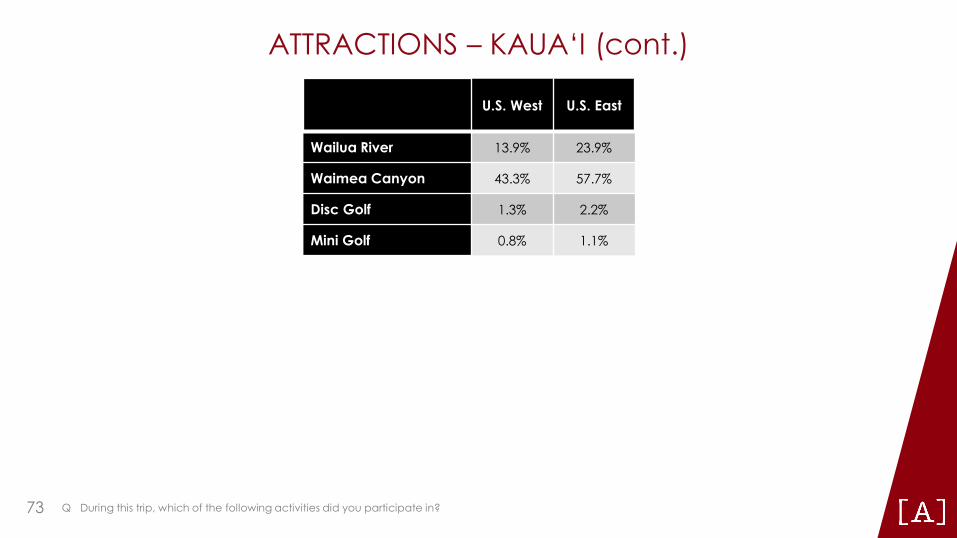
ATTRACTIONS – KAUA‘I (cont.)
U.S. West U.S. East
Wailua River 13.9% 23.9%
Waimea Canyon 43.3% 57.7%
Disc Golf 1.3% 2.2%
Mini Golf 0.8% 1.1%
Q During this trip, which of the following activities did you participate in? 73
■
■
■
■
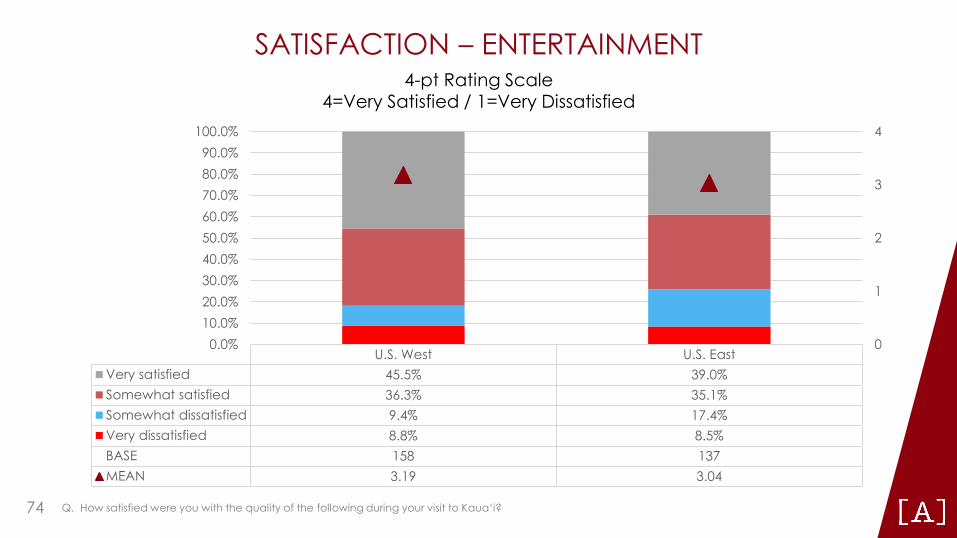
SATISFACTION – ENTERTAINMENT 4-pt Rating Scale
4=Very Satisfied / 1=Very Dissatisfied 100.0%
U.S. West U.S. East Very satisfied 45.5% 39.0% Somewhat satisfied 36.3% 35.1% Somewhat dissatisfied 9.4% 17.4% Very dissatisfied 8.8% 8.5% BASE 158 137 MEAN 3.19 3.04
0.0% 10.0% 20.0% 30.0% 40.0% 50.0% 60.0%
4 90.0% 80.0%
370.0%
2
1
0
Q. How satisfied were you with the quality of the following during your visit to Kaua‘i? 74
■
■
■
■
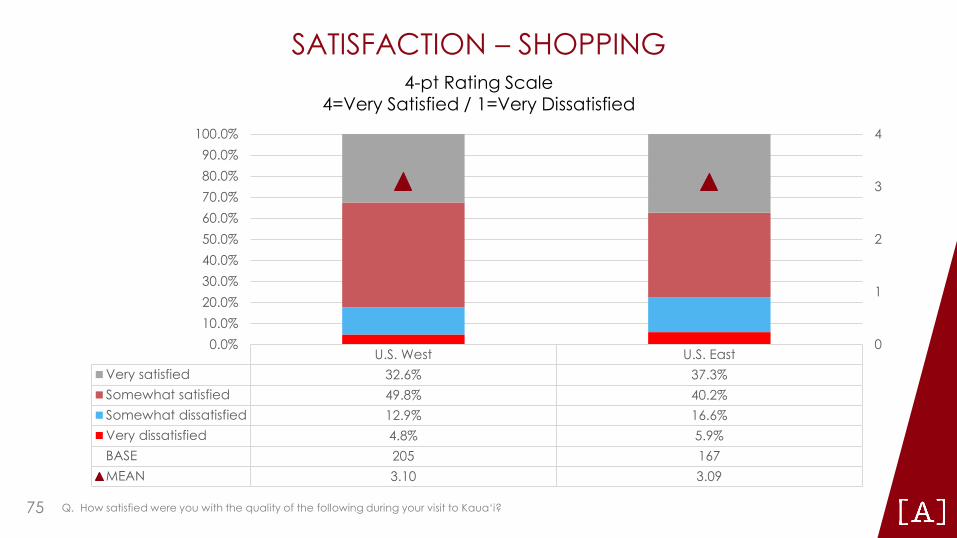
SATISFACTION – SHOPPING 4-pt Rating Scale
4=Very Satisfied / 1=Very Dissatisfied 100.0%
U.S. West U.S. East Very satisfied 32.6% 37.3% Somewhat satisfied 49.8% 40.2% Somewhat dissatisfied 12.9% 16.6% Very dissatisfied 4.8% 5.9% BASE 205 167 MEAN 3.10 3.09
0.0% 10.0% 20.0% 30.0% 40.0% 50.0% 60.0%
4 90.0% 80.0%
370.0%
2
1
0
Q. How satisfied were you with the quality of the following during your visit to Kaua‘i? 75
■
■
■
■
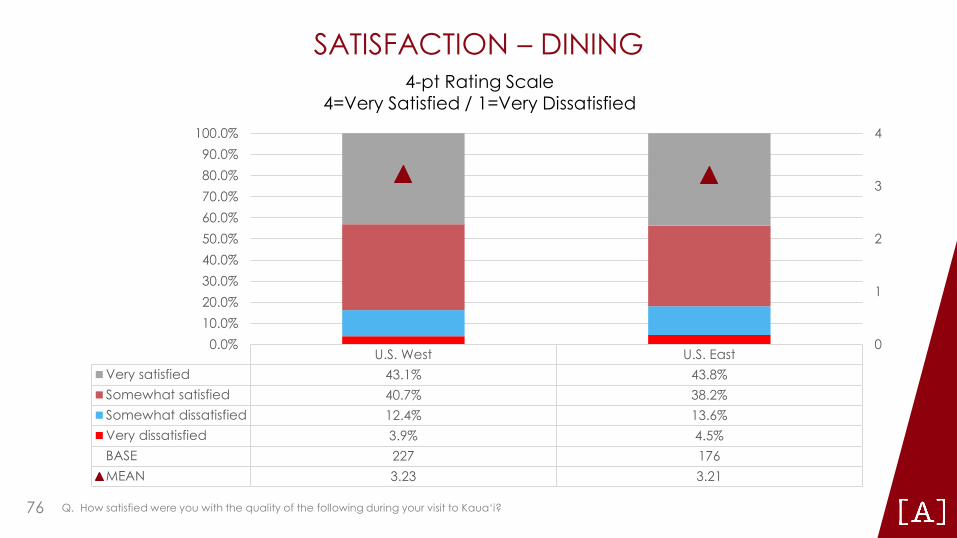
SATISFACTION – DINING 4-pt Rating Scale
4=Very Satisfied / 1=Very Dissatisfied 100.0%
U.S. West U.S. East Very satisfied 43.1% 43.8% Somewhat satisfied 40.7% 38.2% Somewhat dissatisfied 12.4% 13.6% Very dissatisfied 3.9% 4.5% BASE 227 176 MEAN 3.23 3.21
0.0% 10.0% 20.0% 30.0% 40.0% 50.0%
4 90.0% 80.0%
370.0% 60.0%
2
1
0
Q. How satisfied were you with the quality of the following during your visit to Kaua‘i? 76
■
■
■
■
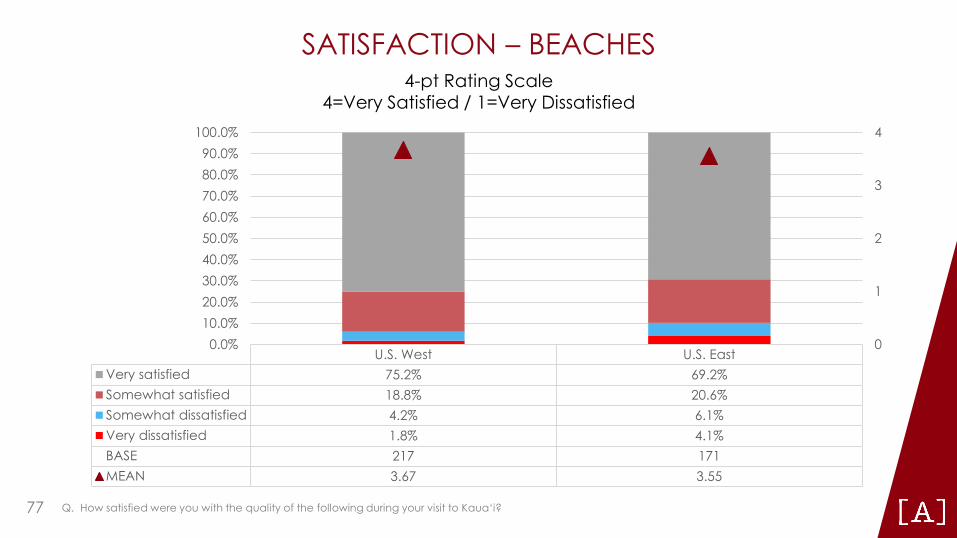
SATISFACTION – BEACHES 4-pt Rating Scale
4=Very Satisfied / 1=Very Dissatisfied 100.0%
U.S. West U.S. East Very satisfied 75.2% 69.2% Somewhat satisfied 18.8% 20.6% Somewhat dissatisfied 4.2% 6.1% Very dissatisfied 1.8% 4.1% BASE 217 171 MEAN 3.67 3.55
0.0% 10.0% 20.0% 30.0%
4 90.0% 80.0%
370.0% 60.0% 50.0% 2 40.0%
1
0
Q. How satisfied were you with the quality of the following during your visit to Kaua‘i? 77
■
■
■
■
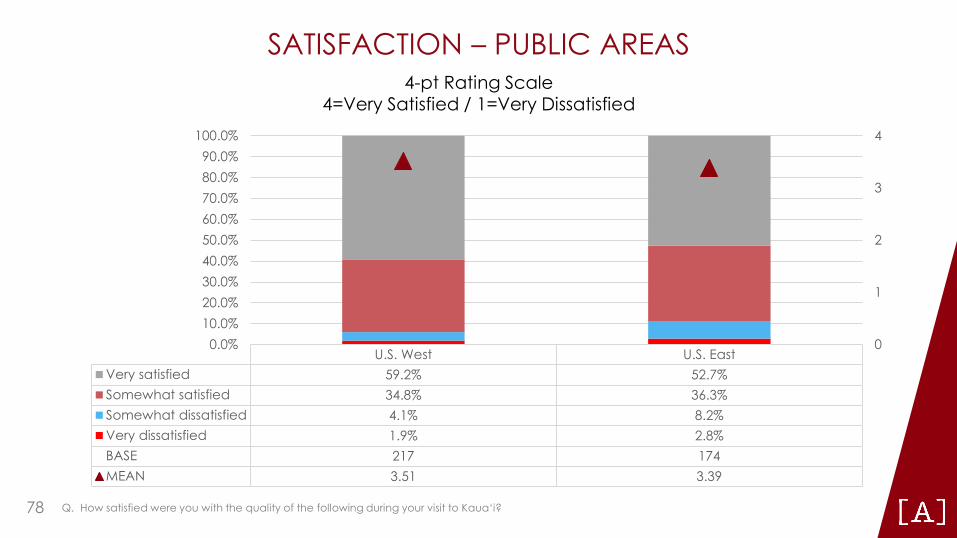
SATISFACTION – PUBLIC AREAS 4-pt Rating Scale
4=Very Satisfied / 1=Very Dissatisfied 100.0%
U.S. West U.S. East Very satisfied 59.2% 52.7% Somewhat satisfied 34.8% 36.3% Somewhat dissatisfied 4.1% 8.2% Very dissatisfied 1.9% 2.8% BASE 217 174 MEAN 3.51 3.39
0.0% 10.0% 20.0% 30.0% 40.0%
4 90.0% 80.0%
370.0% 60.0% 50.0% 2
1
0
Q. How satisfied were you with the quality of the following during your visit to Kaua‘i? 78
■
■
■
■
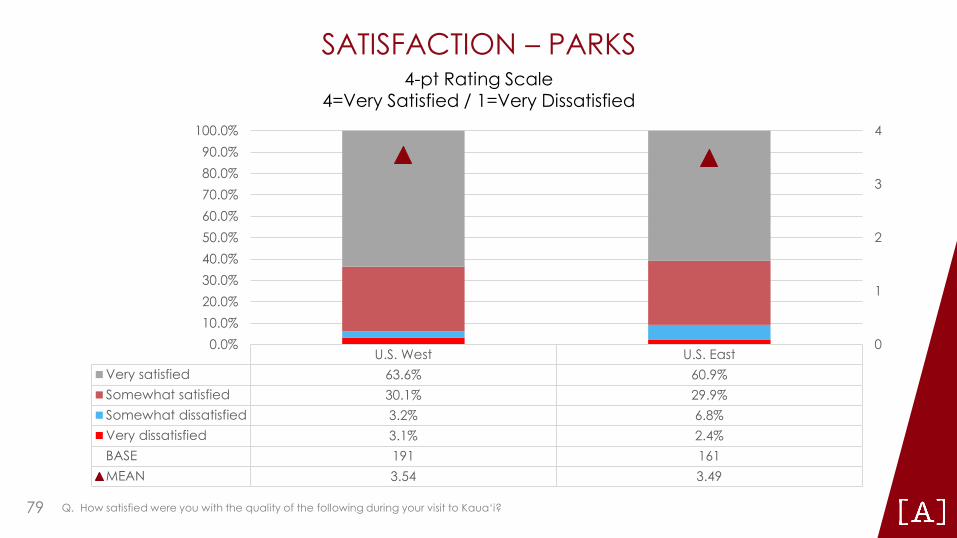
SATISFACTION – PARKS 4-pt Rating Scale
4=Very Satisfied / 1=Very Dissatisfied 100.0%
U.S. West U.S. East Very satisfied 63.6% 60.9% Somewhat satisfied 30.1% 29.9% Somewhat dissatisfied 3.2% 6.8% Very dissatisfied 3.1% 2.4% BASE 191 161 MEAN 3.54 3.49
0.0% 10.0% 20.0% 30.0% 40.0%
4 90.0% 80.0%
370.0% 60.0% 50.0% 2
1
0
Q. How satisfied were you with the quality of the following during your visit to Kaua‘i? 79
■
■
■
■
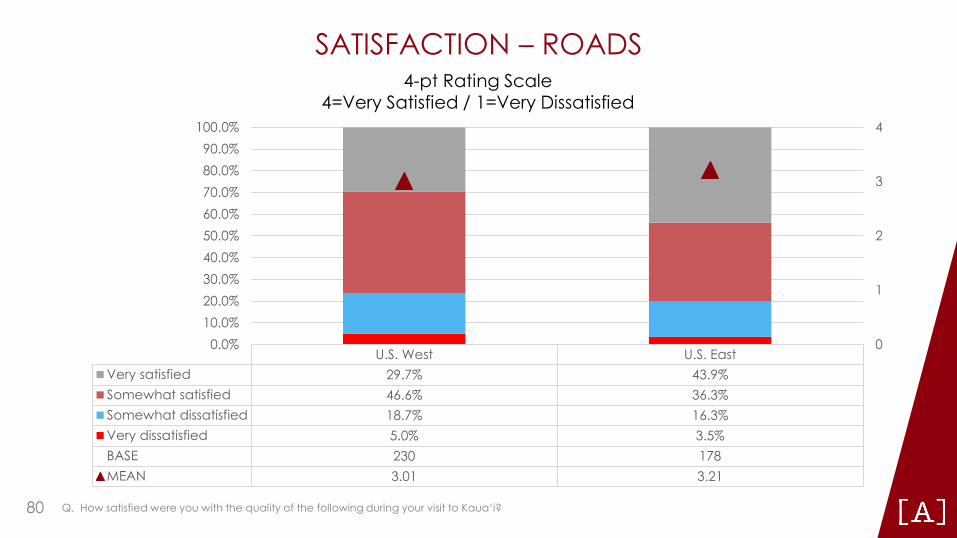
SATISFACTION – ROADS 4-pt Rating Scale
4=Very Satisfied / 1=Very Dissatisfied 100.0%
U.S. West U.S. East Very satisfied 29.7% 43.9% Somewhat satisfied 46.6% 36.3% Somewhat dissatisfied 18.7% 16.3% Very dissatisfied 5.0% 3.5% BASE 230 178 MEAN 3.01 3.21
0.0% 10.0% 20.0% 30.0% 40.0% 50.0% 60.0% 70.0%
4 90.0% 80.0%
3
2
1
0
Q. How satisfied were you with the quality of the following during your visit to Kaua‘i? 80
■
■
■
■
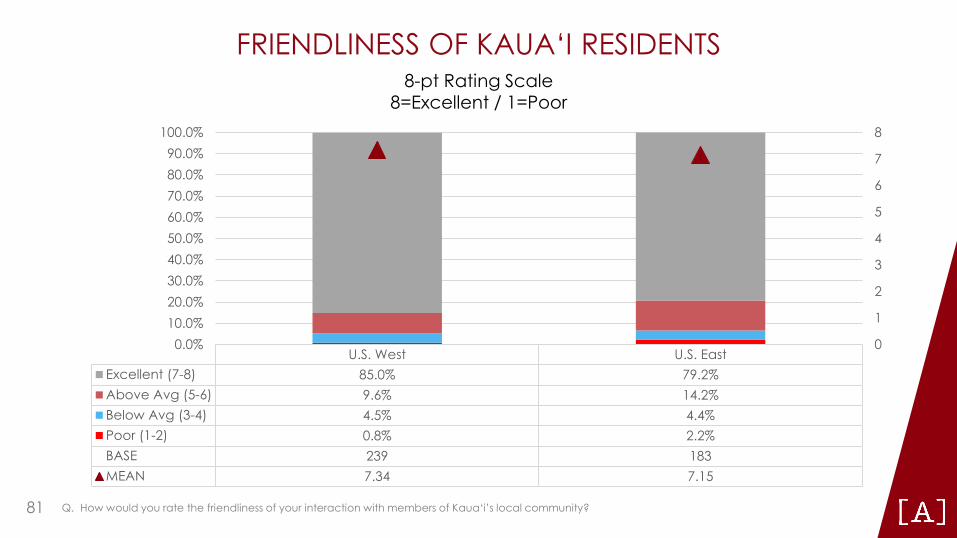
FRIENDLINESS OF KAUA‘I RESIDENTS 8-pt Rating Scale
8=Excellent / 1=Poor 100.0%
U.S. West U.S. East Excellent (7-8) 85.0% 79.2% Above Avg (5-6) 9.6% 14.2% Below Avg (3-4) 4.5% 4.4% Poor (1-2) 0.8% 2.2% BASE 239 183 MEAN 7.34 7.15
0.0% 10.0% 20.0%
8 90.0% 7 80.0%
670.0%
560.0% 50.0% 4 40.0% 3 30.0%
2
1
0
Q. How would you rate the friendliness of your interaction with members of Kaua‘i’s local community? 81
-
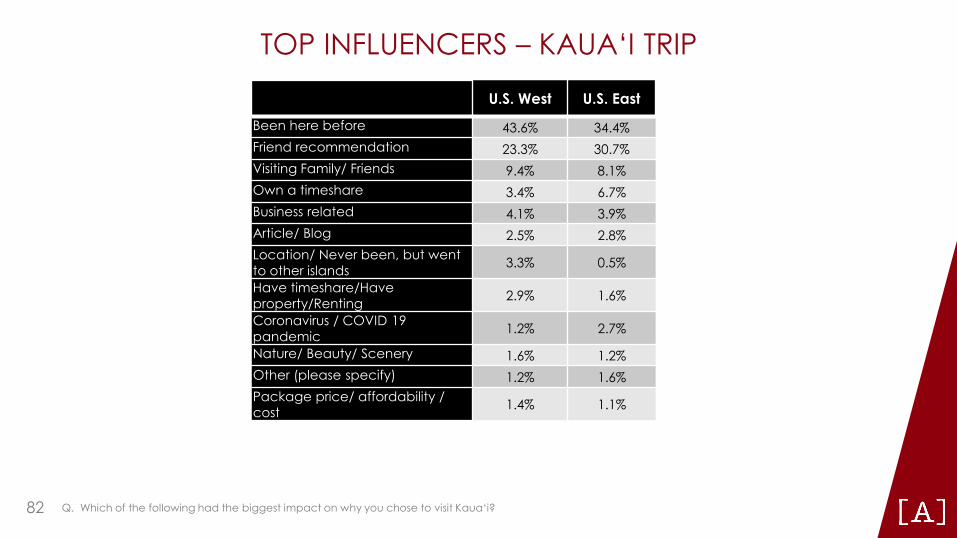
TOP INFLUENCERS – KAUA‘I TRIP U.S. West U.S. East
Been here before 43.6% 34.4% Friend recommendation 23.3% 30.7% Visiting Family/ Friends 9.4% 8.1% Own a timeshare 3.4% 6.7% Business related 4.1% 3.9% Article/ Blog 2.5% 2.8% Location/ Never been, but went to other islands 3.3% 0.5%
Have timeshare/Have property/Renting 2.9% 1.6%
Coronavirus / COVID 19 pandemic 1.2% 2.7%
Nature/ Beauty/ Scenery 1.6% 1.2% Other (please specify) 1.2% 1.6% Package price/ affordability / cost 1.4% 1.1%
Q. Which of the following had the biggest impact on why you chose to visit Kaua‘i? 82
■
■
■
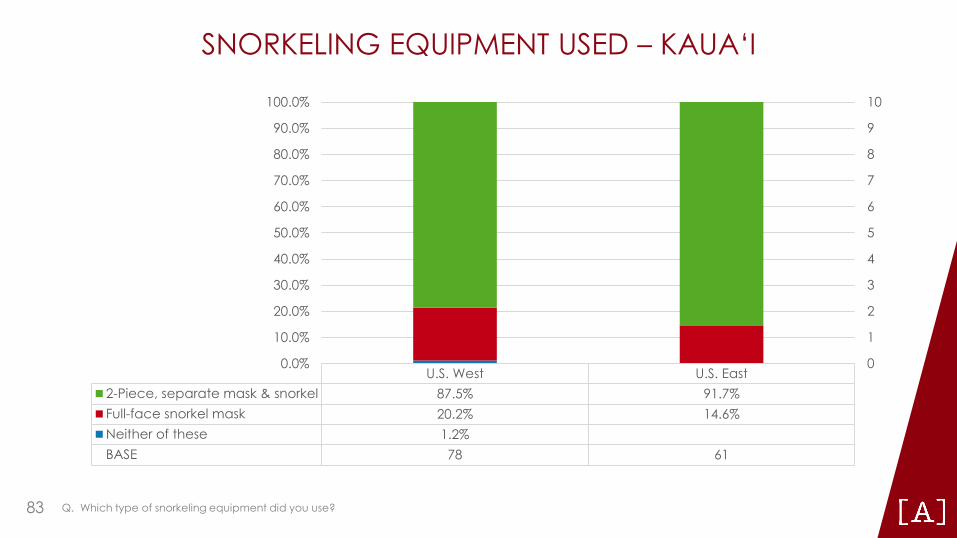
SNORKELING EQUIPMENT USED – KAUA‘I
100.0%
90.0%
80.0%
70.0%
60.0%
50.0%
40.0%
30.0%
20.0%
10.0%
U.S. West U.S. East 2-Piece, separate mask & snorkel 87.5% 91.7% Full-face snorkel mask 20.2% 14.6% Neither of these 1.2% BASE 78 61
0.0%
10
9
8
7
6
5
4
3
2
1
0
Q. Which type of snorkeling equipment did you use? 83

SNORKELING OCEAN SAFETY – KAUA‘I U.S. West U.S. East
Did not have to be assisted or rescued 98.5% 98.4%
Yes, needed assistance using 2 piece mask &
snorkel 1.5% 1.6%
Yes, needed assistance using full face snorkel
mask - -
BASE
– -
– -
. --
77 61
Q. Did you have a bad experience in the ocean where you had to be assisted or rescued? 84
SECTION 7 – MAUI 85
■
■
■
■
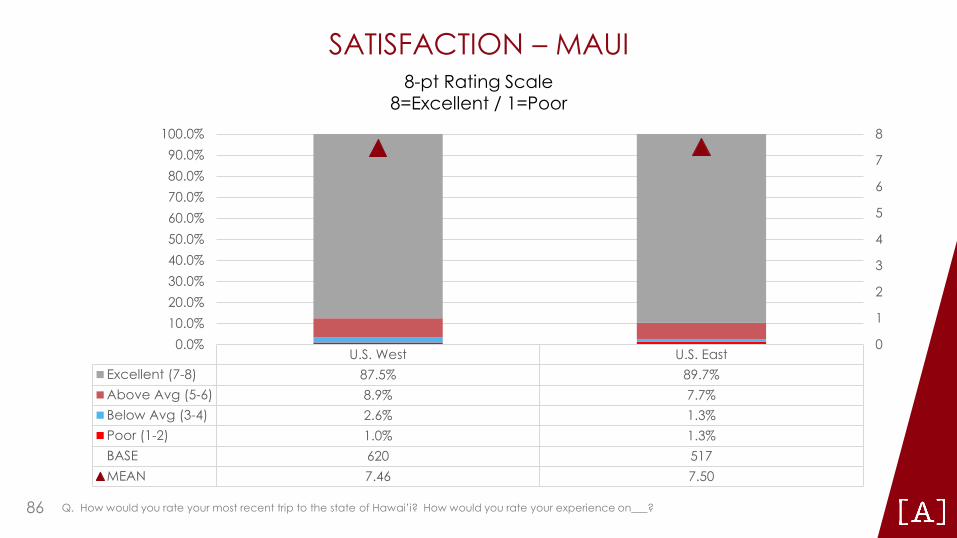
SATISFACTION – MAUI 8-pt Rating Scale
8=Excellent / 1=Poor 100.0% 8
90.0% 7 80.0%
670.0%
560.0% 50.0% 4 40.0% 3 30.0%
220.0%
110.0% 0.0% 0
U.S. West U.S. East Excellent (7-8) 87.5% 89.7% Above Avg (5-6) 8.9% 7.7% Below Avg (3-4) 2.6% 1.3% Poor (1-2) 1.0% 1.3% BASE 620 517 MEAN 7.46 7.50
Q. How would you rate your most recent trip to the state of Hawai’i? How would you rate your experience on___? 86
SATISFACTION – MAUI
• Gender: Satisfaction ratings for Maui were higher among female visitors compared to male visitors from the U.S. East market.
• Age: Among U.S. East visitors, satisfaction with Maui were the highest amongst young adults under the age of 35 and declined incrementally with the older age groups.
• Islands visited: Visitors from U.S. West and U.S. East whose entire trip was spent on Maui were more satisfied with Maui, compared to those who visited multiple islands during their stay.
Q. How would you rate your most recent trip to the state of Hawai’i? How would you rate your experience on___? 87
: : I : : I
1::: l l l
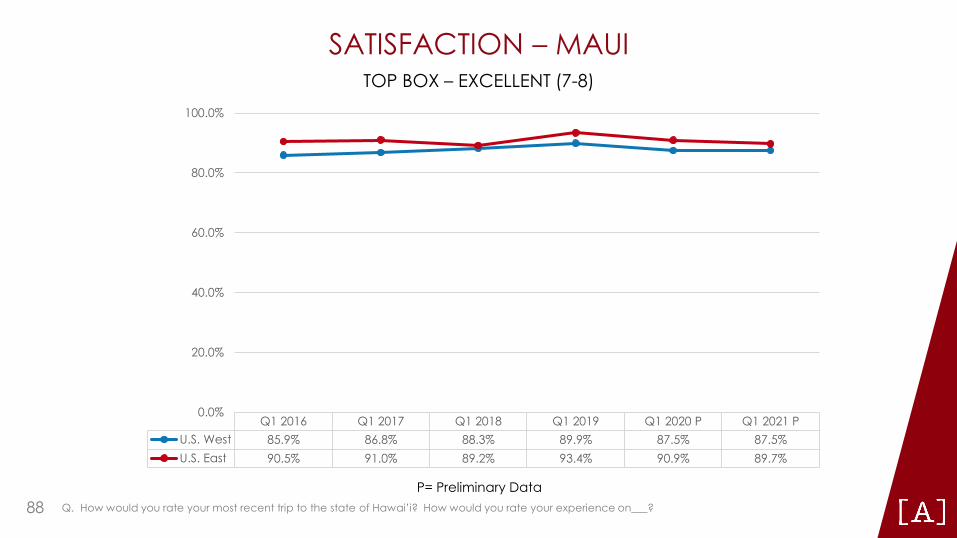
SATISFACTION – MAUI TOP BOX – EXCELLENT (7-8)
100.0%
80.0%
60.0%
40.0%
20.0%
0.0% Q1 2016 Q1 2017 Q1 2018 Q1 2019 Q1 2020 P Q1 2021 P
U.S. West 85.9% 86.8% 88.3% 89.9% 87.5% 87.5% U.S. East 90.5% 91.0% 89.2% 93.4% 90.9% 89.7%
P= Preliminary Data Q. How would you rate your most recent trip to the state of Hawai’i? How would you rate your experience on___? 88
■
■
■
■
■
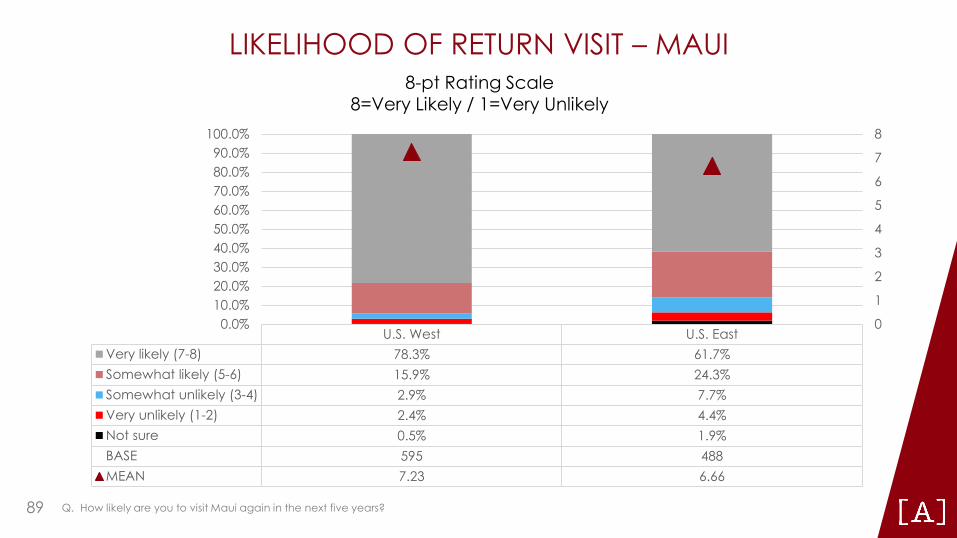
LIKELIHOOD OF RETURN VISIT – MAUI 8-pt Rating Scale
8=Very Likely / 1=Very Unlikely 100.0% 8
90.0% 7 80.0%
670.0%
560.0% 50.0% 4 40.0% 3 30.0%
220.0%
110.0% 0.0%
U.S. West U.S. East Very likely (7-8) 78.3% 61.7% Somewhat likely (5-6) 15.9% 24.3% Somewhat unlikely (3-4) 2.9% 7.7% Very unlikely (1-2) 2.4% 4.4% Not sure 0.5% 1.9% BASE 595 488 MEAN 7.23 6.66
Q. How likely are you to visit Maui again in the next five years? 89
0
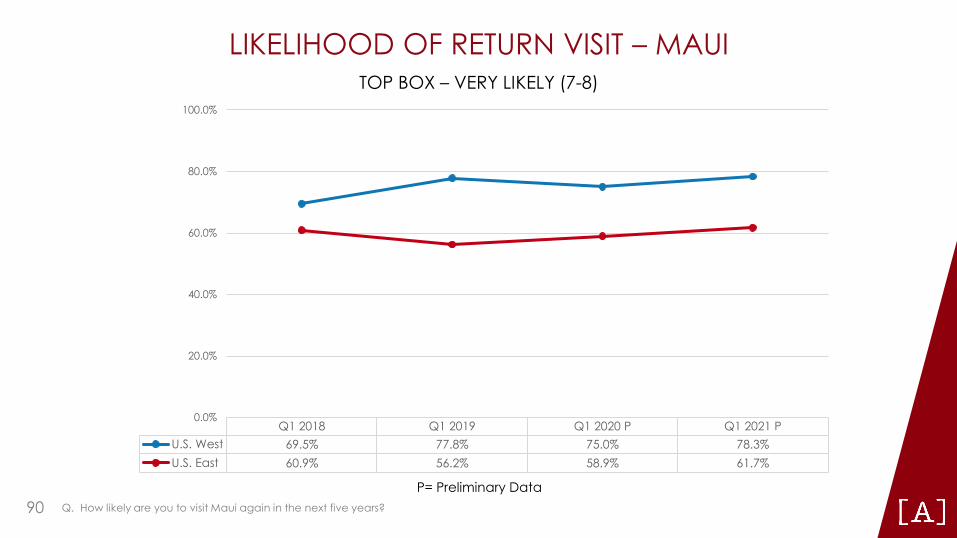
LIKELIHOOD OF RETURN VISIT – MAUI TOP BOX – VERY LIKELY (7-8)
100.0%
60.0%
80.0%
40.0%
20.0%
0.0% Q1 2018 Q1 2019 Q1 2020 P Q1 2021 P
U.S. West 69.5% 77.8% 75.0% 78.3% U.S. East 60.9% 56.2% 58.9% 61.7%
P= Preliminary Data Q. How likely are you to visit Maui again in the next five years? 90
■
■
■
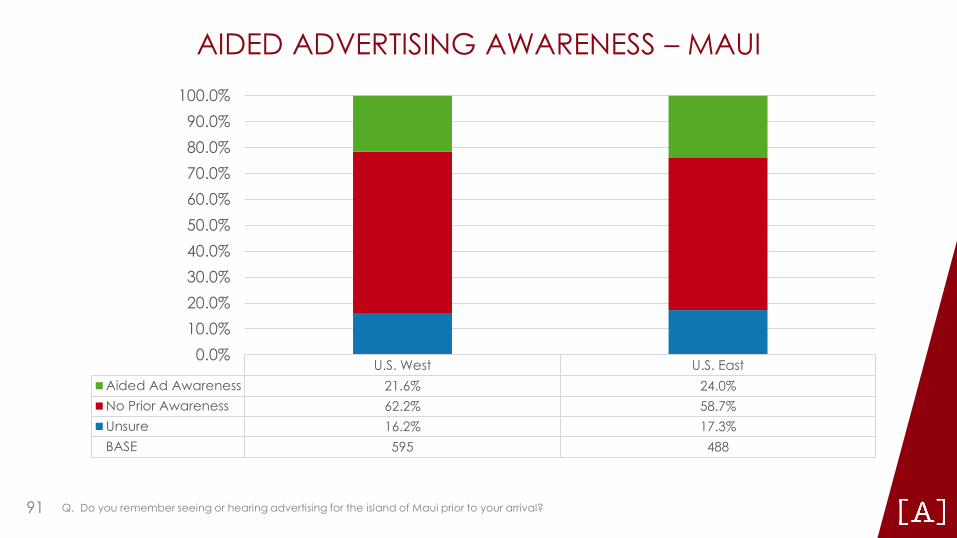
AIDED ADVERTISING AWARENESS – MAUI 100.0% 90.0% 80.0% 70.0% 60.0% 50.0% 40.0% 30.0% 20.0% 10.0%
U.S. West U.S. East Aided Ad Awareness 21.6% 24.0% No Prior Awareness 62.2% 58.7% Unsure 16.2% 17.3% BASE 595 488
0.0%
Q. Do you remember seeing or hearing advertising for the island of Maui prior to your arrival? 91
■
■
■
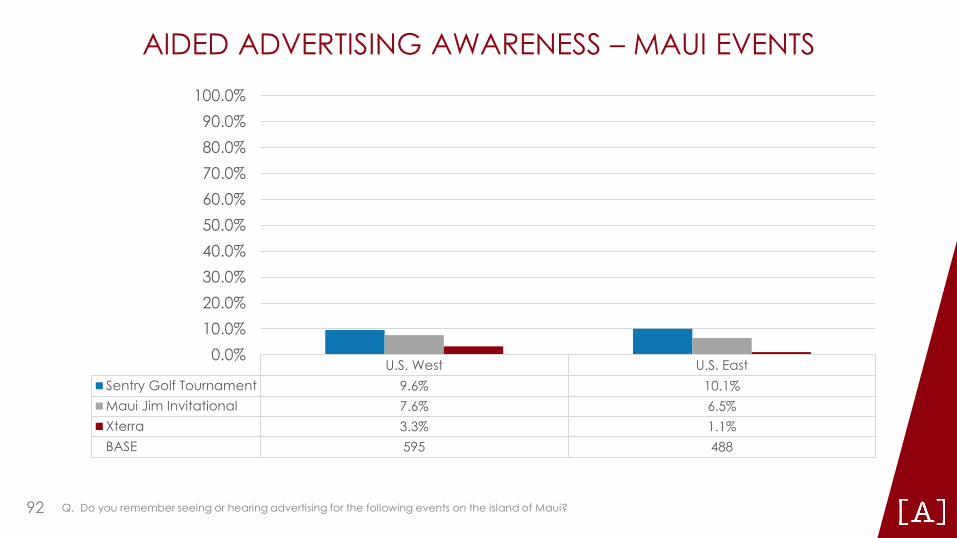
AIDED ADVERTISING AWARENESS – MAUI EVENTS 100.0% 90.0% 80.0% 70.0% 60.0% 50.0% 40.0% 30.0% 20.0% 10.0% 0.0%
U.S. West U.S. East Sentry Golf Tournament 9.6% 10.1% Maui Jim Invitational 7.6% 6.5% Xterra 3.3% 1.1% BASE 595 488
Q. Do you remember seeing or hearing advertising for the following events on the island of Maui? 92
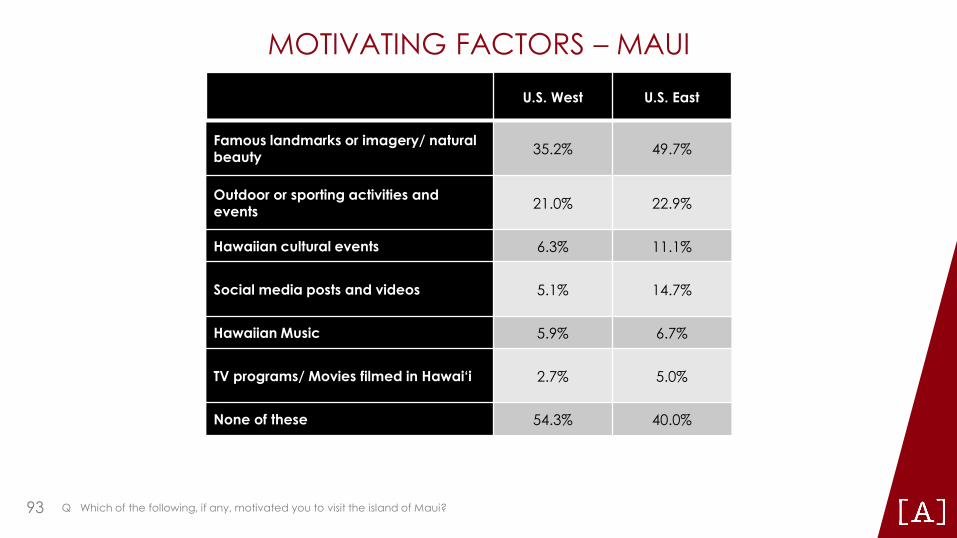
MOTIVATING FACTORS – MAUI U.S. West U.S. East
Famous landmarks or imagery/ natural beauty 35.2% 49.7%
Outdoor or sporting activities and events 21.0% 22.9%
Hawaiian cultural events 6.3% 11.1%
Social media posts and videos 5.1% 14.7%
Hawaiian Music 5.9% 6.7%
TV programs/ Movies filmed in Hawai‘i 2.7% 5.0%
None of these 54.3% 40.0%
Q Which of the following, if any, motivated you to visit the island of Maui? 93
-
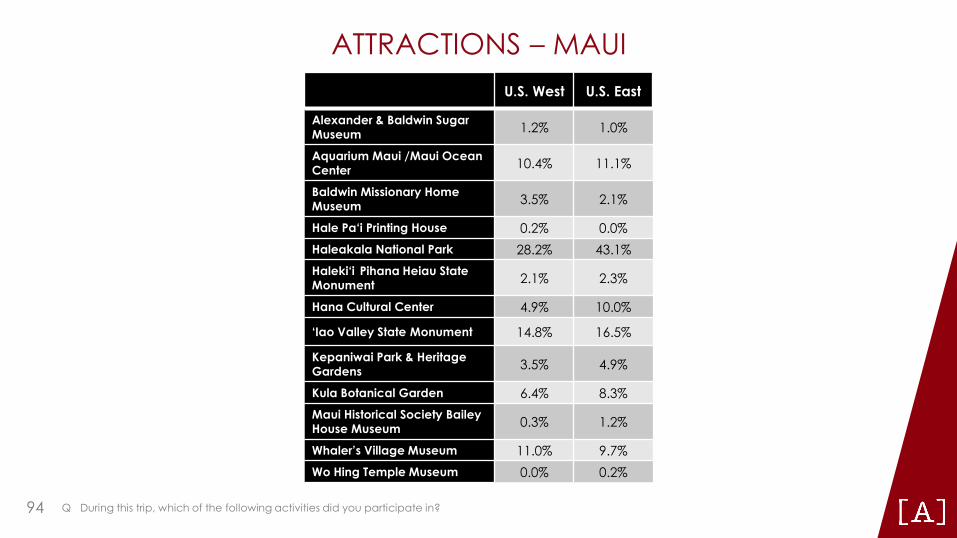
ATTRACTIONS – MAUI U.S. West U.S. East
Alexander & Baldwin Sugar Museum 1.2% 1.0%
Aquarium Maui /Maui Ocean Center 10.4% 11.1%
Baldwin Missionary Home Museum 3.5% 2.1%
Hale Pa‘i Printing House 0.2% 0.0% Haleakala National Park 28.2% 43.1% Haleki‘i Pihana Heiau State Monument 2.1% 2.3%
Hana Cultural Center 4.9% 10.0%
‘Iao Valley State Monument 14.8% 16.5%
Kepaniwai Park & Heritage Gardens 3.5% 4.9%
Kula Botanical Garden 6.4% 8.3% Maui Historical Society Bailey House Museum 0.3% 1.2%
Whaler’s Village Museum 11.0% 9.7% Wo Hing Temple Museum 0.0% 0.2%
Q During this trip, which of the following activities did you participate in? 94
■
■
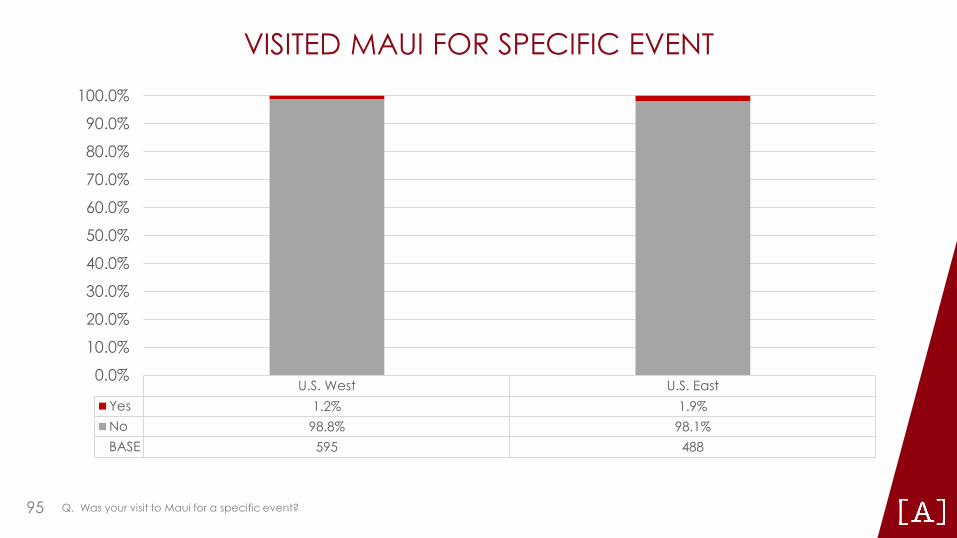
VISITED MAUI FOR SPECIFIC EVENT
U.S. West U.S. East Yes 1.2% 1.9% No 98.8% 98.1% BASE 595 488
0.0%
10.0%
20.0%
30.0%
40.0%
50.0%
60.0%
70.0%
80.0%
90.0%
100.0%
Q. Was your visit to Maui for a specific event? 95
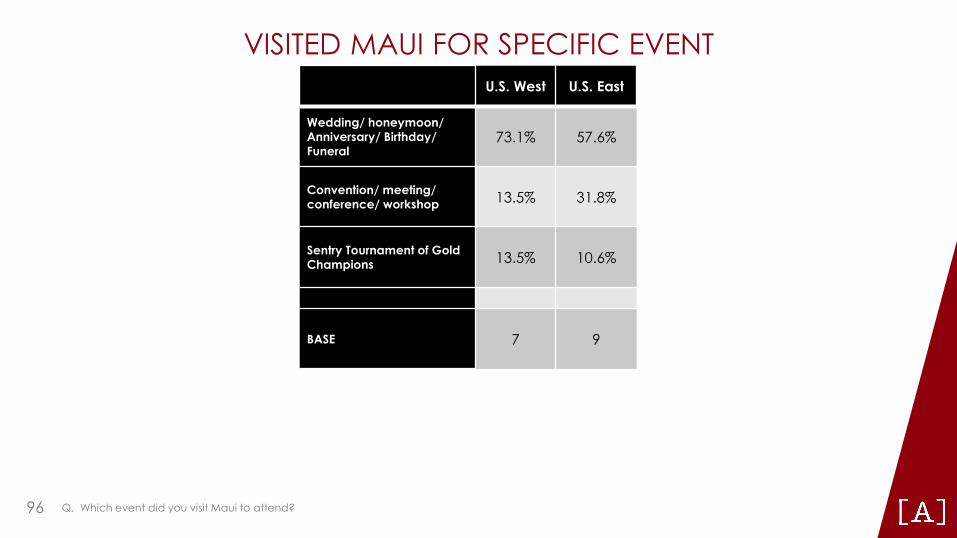
VISITED MAUI FOR SPECIFIC EVENT U.S. West U.S. East
Wedding/ honeymoon/ Anniversary/ Birthday/ Funeral
73.1% 57.6%
Convention/ meeting/ conference/ workshop 13.5% 31.8%
Sentry Tournament of Gold Champions 13.5% 10.6%
BASE 7 9
Q. Which event did you visit Maui to attend? 96
■
■
■
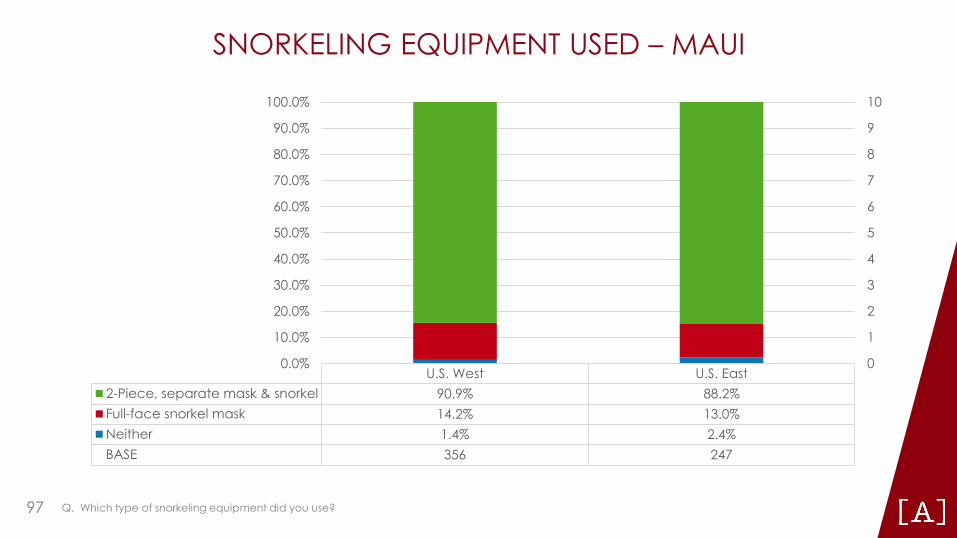
SNORKELING EQUIPMENT USED – MAUI
100.0%
90.0%
80.0%
70.0%
60.0%
50.0%
40.0%
30.0%
20.0%
10.0%
U.S. West U.S. East 2-Piece, separate mask & snorkel 90.9% 88.2% Full-face snorkel mask 14.2% 13.0% Neither 1.4% 2.4% BASE 356 247
0.0%
10
9
8
7
6
5
4
3
2
1
0
Q. Which type of snorkeling equipment did you use? 97
--
– -
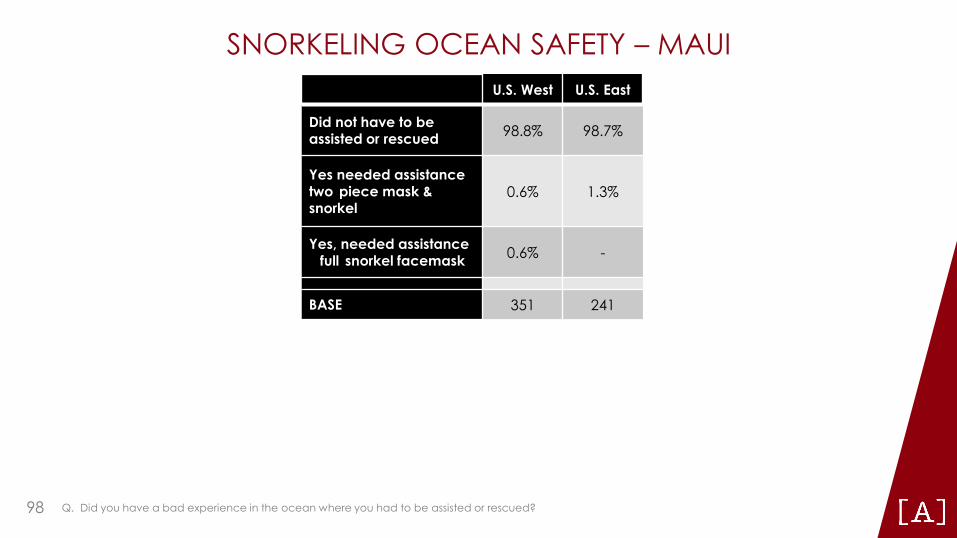
SNORKELING OCEAN SAFETY – MAUI U.S. West U.S. East
Did not have to be assisted or rescued 98.8% 98.7%
Yes needed assistance two piece mask & snorkel
0.6% 1.3%
Yes, needed assistance full snorkel facemask 0.6% -
BASE 351 241
Q. Did you have a bad experience in the ocean where you had to be assisted or rescued? 98
SECTION 8 – ISLAND OF HAWAI‘I
99

SATISFACTION – ISLAND OF HAWAI‘I 8-pt Rating Scale
8=Excellent / 1=Poor 100.0%
90.0% 80.0% 70.0% 60.0% 50.0% 40.0% 30.0% 20.0% 10.0%
8
7
6
5
4
3
2
1
0.0% U.S. West U.S. East
0
Excellent (7-8) 86.7% 86.4% Above Avg (5-6) 9.2% 10.0% Below Avg (3-4) 3.3% 1.9% Poor (1-2) 0.8% 1.8% BASE 500 464 MEAN 7.42 7.41
Q. How would you rate your most recent trip to the state of Hawai’i? How would you rate your experience on___? 100
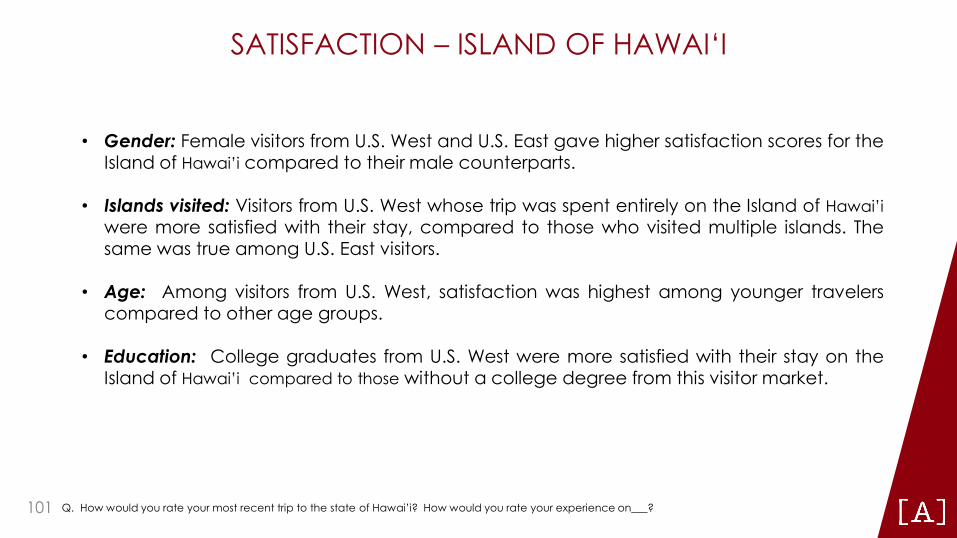
SATISFACTION – ISLAND OF HAWAI‘I
• Gender: Female visitors from U.S. West and U.S. East gave higher satisfaction scores for the Island of Hawai’i compared to their male counterparts.
• Islands visited: Visitors from U.S. West whose trip was spent entirely on the Island of Hawai’i were more satisfied with their stay, compared to those who visited multiple islands. The same was true among U.S. East visitors.
• Age: Among visitors from U.S. West, satisfaction was highest among younger travelers compared to other age groups.
• Education: College graduates from U.S. West were more satisfied with their stay on the Island of Hawai’i compared to those without a college degree from this visitor market.
Q. How would you rate your most recent trip to the state of Hawai’i? How would you rate your experience on___? 101
I : I I ◄
►
I
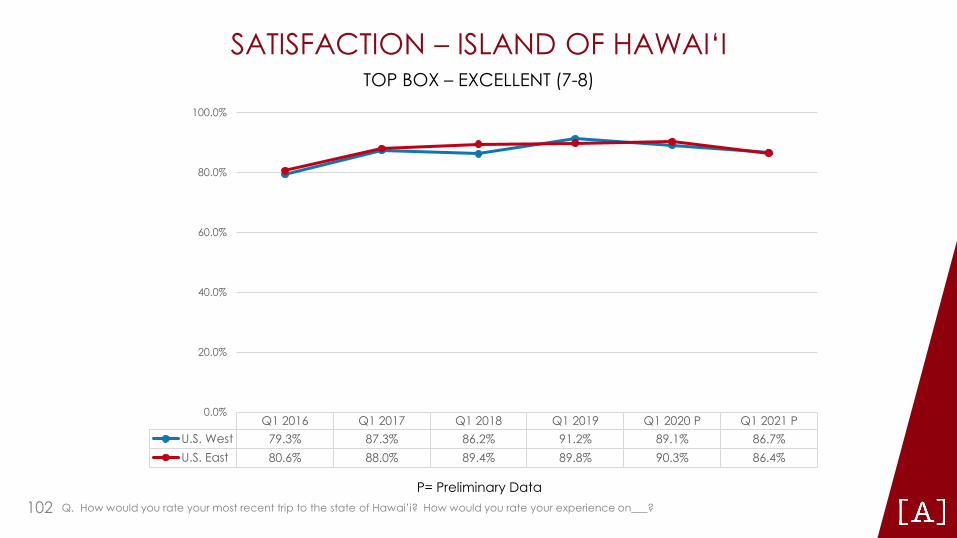
SATISFACTION – ISLAND OF HAWAI‘I TOP BOX – EXCELLENT (7-8)
100.0%
80.0%
60.0%
40.0%
20.0%
0.0% Q1 2016 Q1 2017 Q1 2018 Q1 2019 Q1 2020 P Q1 2021 P
U.S. West 79.3% 87.3% 86.2% 91.2% 89.1% 86.7% U.S. East 80.6% 88.0% 89.4% 89.8% 90.3% 86.4%
P= Preliminary Data Q. How would you rate your most recent trip to the state of Hawai’i? How would you rate your experience on___? 102
■
■
■
■
■
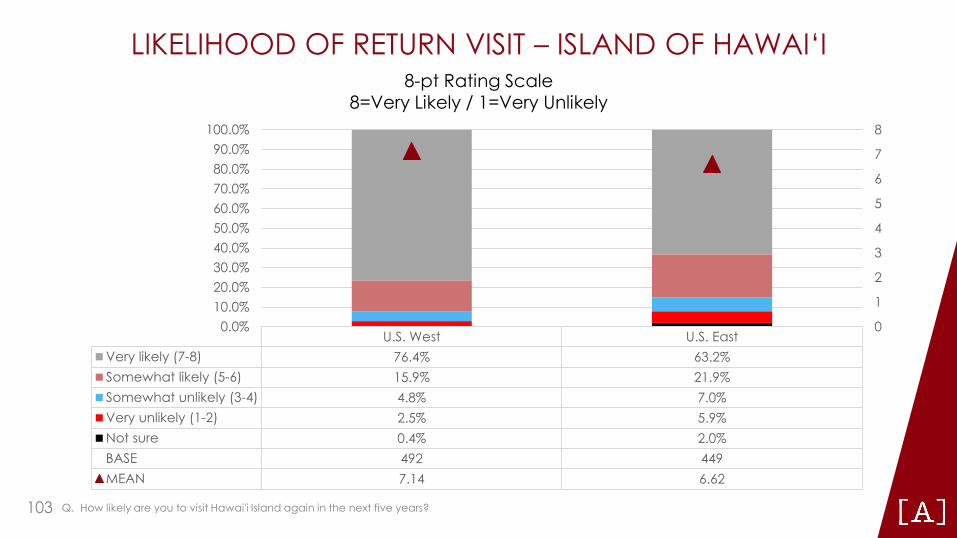
LIKELIHOOD OF RETURN VISIT – ISLAND OF HAWAI‘I 8-pt Rating Scale
8=Very Likely / 1=Very Unlikely 100.0%
U.S. West U.S. East Very likely (7-8) 76.4% 63.2% Somewhat likely (5-6) 15.9% 21.9% Somewhat unlikely (3-4) 4.8% 7.0% Very unlikely (1-2) 2.5% 5.9% Not sure 0.4% 2.0% BASE 492 449 MEAN 7.14 6.62
0.0% 10.0% 20.0% 30.0%
8 90.0% 7 80.0%
670.0%
560.0% 50.0% 4 40.0% 3
2
1
0
Q. How likely are you to visit Hawai'i Island again in the next five years? 103
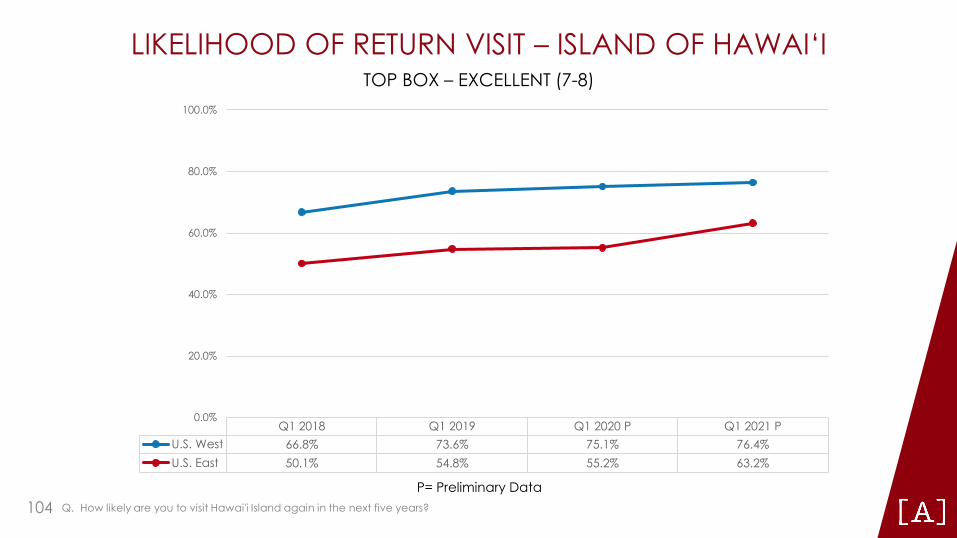
LIKELIHOOD OF RETURN VISIT – ISLAND OF HAWAI‘I TOP BOX – EXCELLENT (7-8)
100.0%
60.0%
80.0%
40.0%
20.0%
0.0% Q1 2018 Q1 2019 Q1 2020 P Q1 2021 P
U.S. West 66.8% 73.6% 75.1% 76.4% U.S. East 50.1% 54.8% 55.2% 63.2%
P= Preliminary Data Q. How likely are you to visit Hawai'i Island again in the next five years? 104
■
■
■
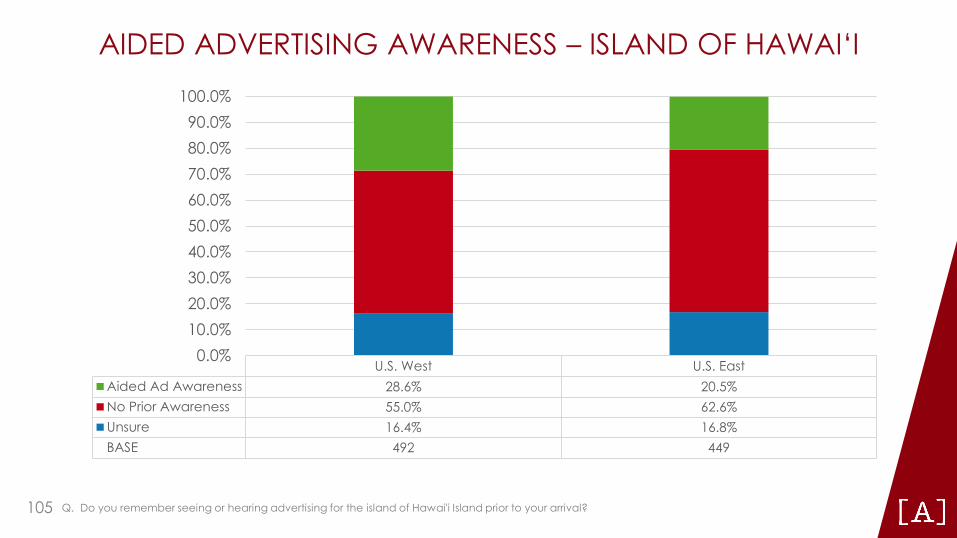
AIDED ADVERTISING AWARENESS – ISLAND OF HAWAI‘I 100.0% 90.0% 80.0% 70.0% 60.0% 50.0% 40.0% 30.0% 20.0% 10.0%
U.S. West U.S. East Aided Ad Awareness 28.6% 20.5% No Prior Awareness 55.0% 62.6% Unsure 16.4% 16.8% BASE 492 449
0.0%
Q. Do you remember seeing or hearing advertising for the island of Hawai'i Island prior to your arrival? 105
-
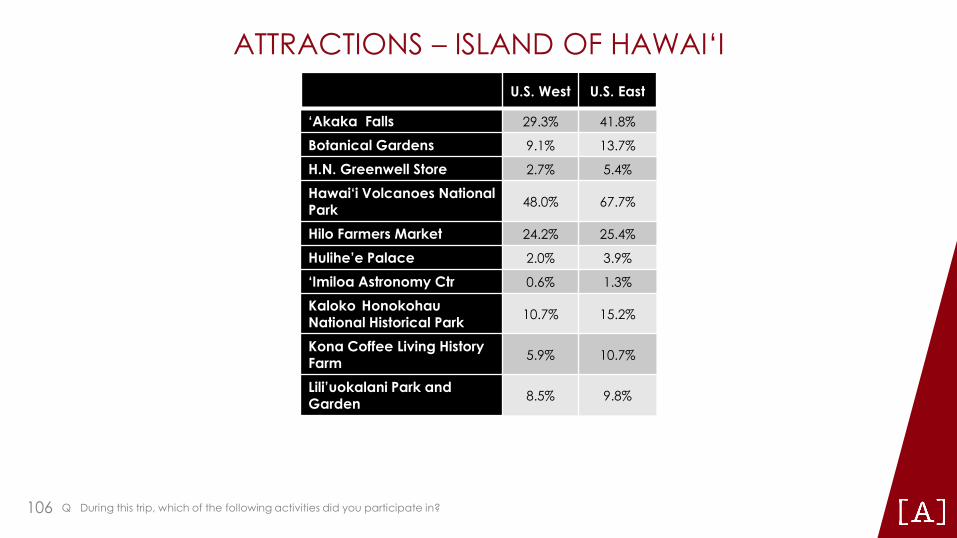
ATTRACTIONS – ISLAND OF HAWAI‘I U.S. West U.S. East
‘Akaka Falls 29.3% 41.8%
Botanical Gardens 9.1% 13.7%
H.N. Greenwell Store 2.7% 5.4%
Hawai‘i Volcanoes National Park 48.0% 67.7%
Hilo Farmers Market 24.2% 25.4%
Hulihe’e Palace 2.0% 3.9%
‘Imiloa Astronomy Ctr 0.6% 1.3%
Kaloko Honokohau National Historical Park 10.7% 15.2%
Kona Coffee Living History Farm 5.9% 10.7%
Lili’uokalani Park and Garden 8.5% 9.8%
Q During this trip, which of the following activities did you participate in? 106
--
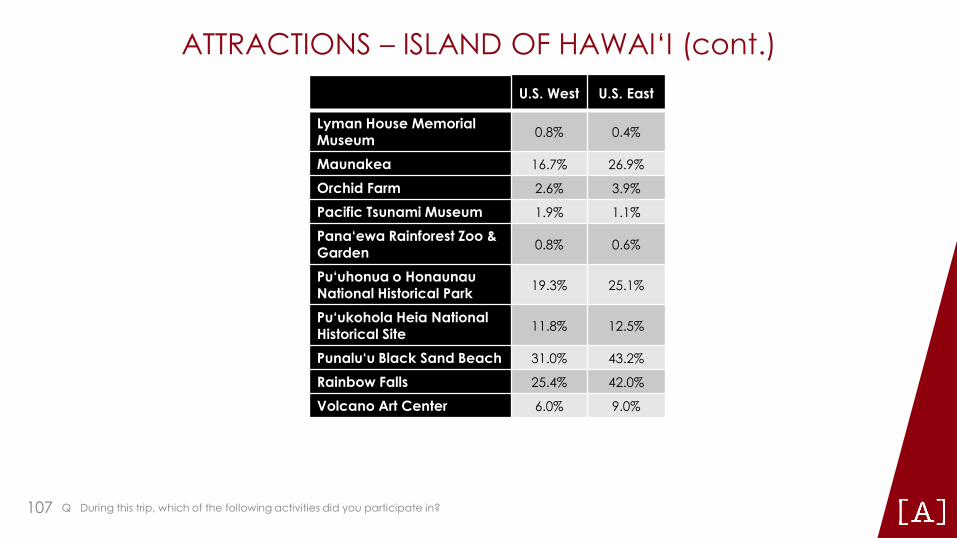
ATTRACTIONS – ISLAND OF HAWAI‘I (cont.) U.S. West U.S. East
Lyman House Memorial Museum 0.8% 0.4%
Maunakea 16.7% 26.9%
Orchid Farm 2.6% 3.9%
Pacific Tsunami Museum 1.9% 1.1%
Pana‘ewa Rainforest Zoo & Garden 0.8% 0.6%
Pu‘uhonua o Honaunau National Historical Park 19.3% 25.1%
Pu‘ukohola Heia National Historical Site 11.8% 12.5%
Punalu‘u Black Sand Beach 31.0% 43.2%
Rainbow Falls 25.4% 42.0%
Volcano Art Center 6.0% 9.0%
Q During this trip, which of the following activities did you participate in? 107
■
■
■
■
•
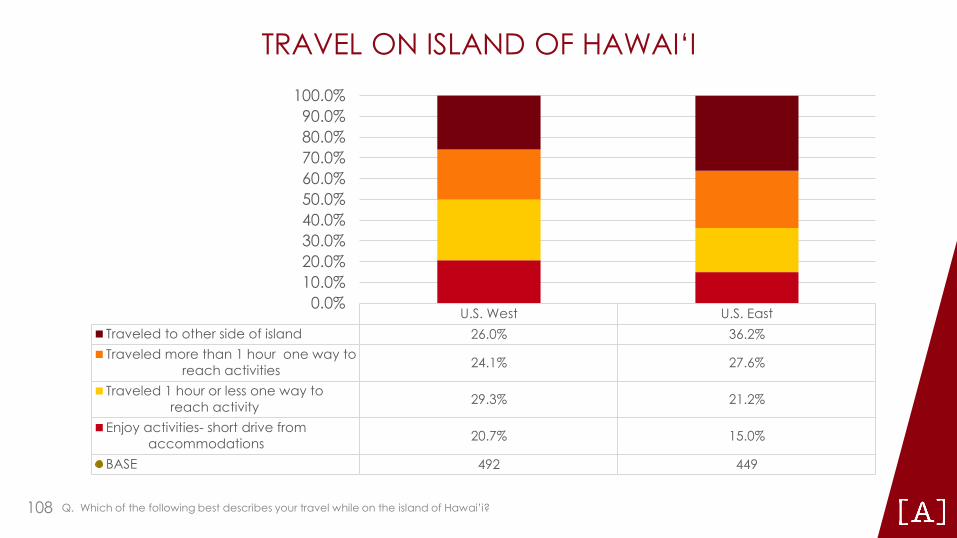
TRAVEL ON ISLAND OF HAWAI‘I 100.0% 90.0% 80.0% 70.0% 60.0% 50.0% 40.0% 30.0% 20.0% 10.0%
U.S. West U.S. East Traveled to other side of island 26.0% 36.2% Traveled more than 1 hour one way to
reach activities 24.1% 27.6%
Traveled 1 hour or less one way to reach activity 29.3% 21.2%
Enjoy activities- short drive from accommodations 20.7% 15.0%
BASE 492 449
0.0%
Q. Which of the following best describes your travel while on the island of Hawai’i? 108
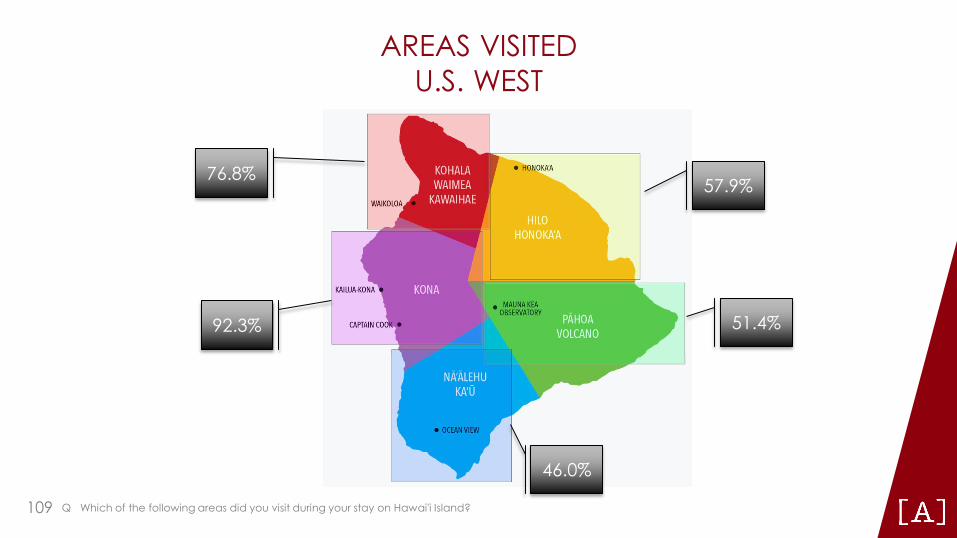
I • HONOKA'A
AREAS VISITED U.S. WEST
57.9%
51.4%
46.0%
92.3%
76.8%
Q Which of the following areas did you visit during your stay on Hawai'i Island? 109

I • HONOKA'A
AREAS VISITED U.S. EAST
72.9%
64.4%
51.4%
91.9%
74.6%
Q Which of the following areas did you visit during your stay on Hawai'i Island? 110
■
■
■
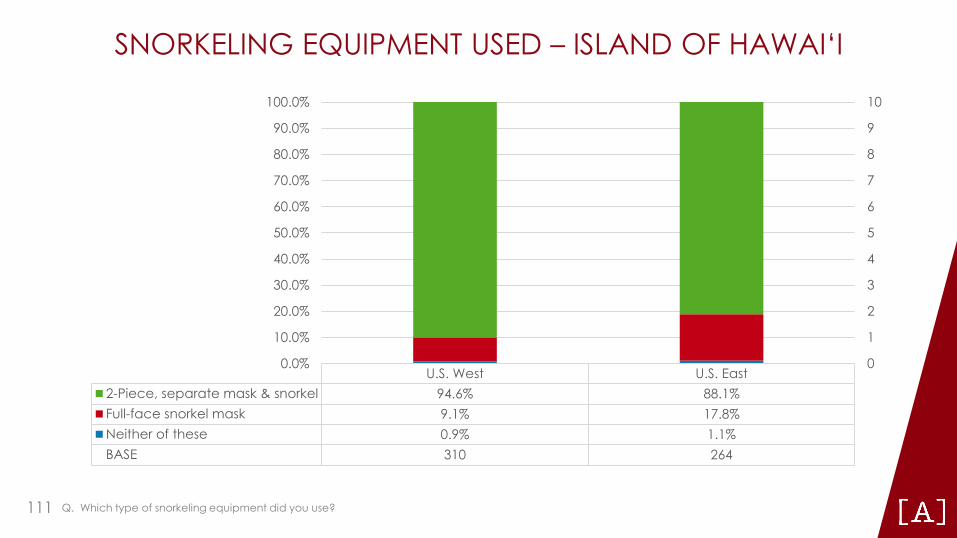
SNORKELING EQUIPMENT USED – ISLAND OF HAWAI‘I
100.0%
90.0%
80.0%
70.0%
60.0%
50.0%
40.0%
30.0%
20.0%
10.0%
U.S. West U.S. East 2-Piece, separate mask & snorkel 94.6% 88.1% Full-face snorkel mask 9.1% 17.8% Neither of these 0.9% 1.1% BASE 310 264
0.0%
10
9
8
7
6
5
4
3
2
1
0
Q. Which type of snorkeling equipment did you use? 111
– -
– -
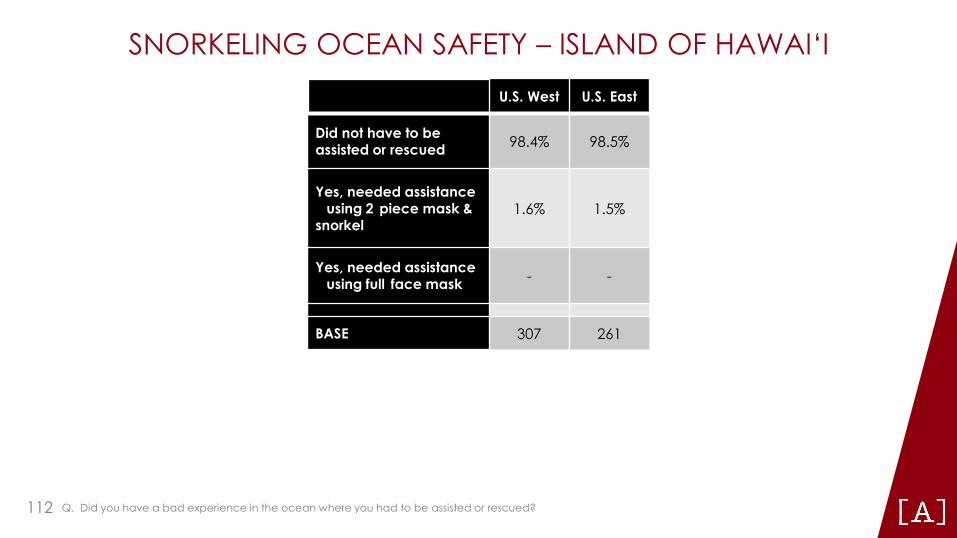
SNORKELING OCEAN SAFETY – ISLAND OF HAWAI‘I U.S. West U.S. East
Did not have to be assisted or rescued 98.4% 98.5%
Yes, needed assistance using 2 piece mask &
snorkel 1.6% 1.5%
Yes, needed assistance using full face mask - -
BASE 307 261
Q. Did you have a bad experience in the ocean where you had to be assisted or rescued? 112

SECTION 9 – VISITOR PROFILE
113
■
■
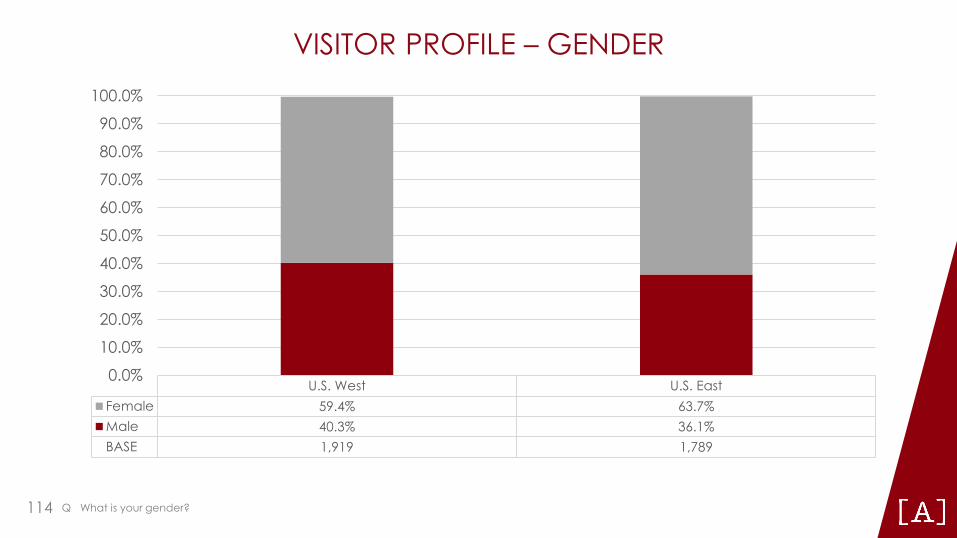
VISITOR PROFILE – GENDER 100.0%
90.0%
80.0%
70.0%
60.0%
50.0%
40.0%
30.0%
20.0%
10.0%
U.S. West U.S. East Female 59.4% 63.7% Male 40.3% 36.1% BASE 1,919 1,789
0.0%
Q What is your gender? 114
■
■
■
■
■
■
■
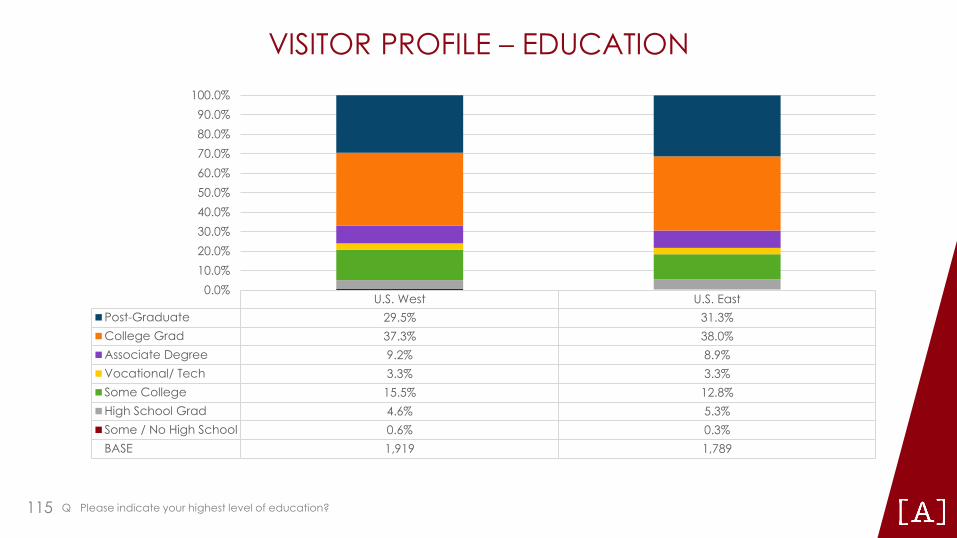
VISITOR PROFILE – EDUCATION
U.S. West U.S. East Post-Graduate 29.5% 31.3% College Grad 37.3% 38.0% Associate Degree 9.2% 8.9% Vocational/ Tech 3.3% 3.3% Some College 15.5% 12.8% High School Grad 4.6% 5.3% Some / No High School 0.6% 0.3% BASE 1,919 1,789
0.0% 10.0% 20.0% 30.0% 40.0% 50.0% 60.0% 70.0% 80.0% 90.0%
100.0%
Q Please indicate your highest level of education? 115
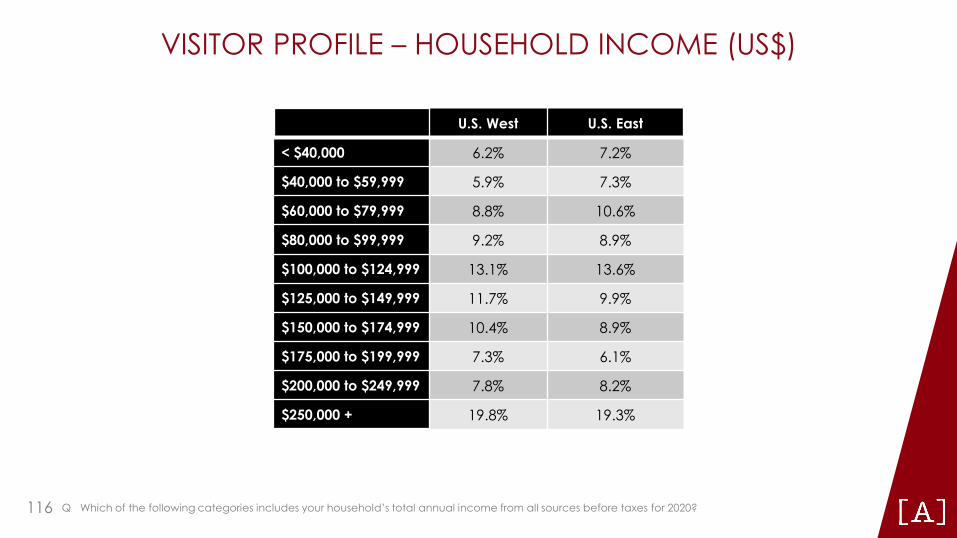
VISITOR PROFILE – HOUSEHOLD INCOME (US$)
U.S. West U.S. East
< $40,000 6.2% 7.2%
$40,000 to $59,999 5.9% 7.3%
$60,000 to $79,999 8.8% 10.6%
$80,000 to $99,999 9.2% 8.9%
$100,000 to $124,999 13.1% 13.6%
$125,000 to $149,999 11.7% 9.9%
$150,000 to $174,999 10.4% 8.9%
$175,000 to $199,999 7.3% 6.1%
$200,000 to $249,999 7.8% 8.2%
$250,000 + 19.8% 19.3%
Q Which of the following categories includes your household’s total annual income from all sources before taxes for 2020? 116
■
■
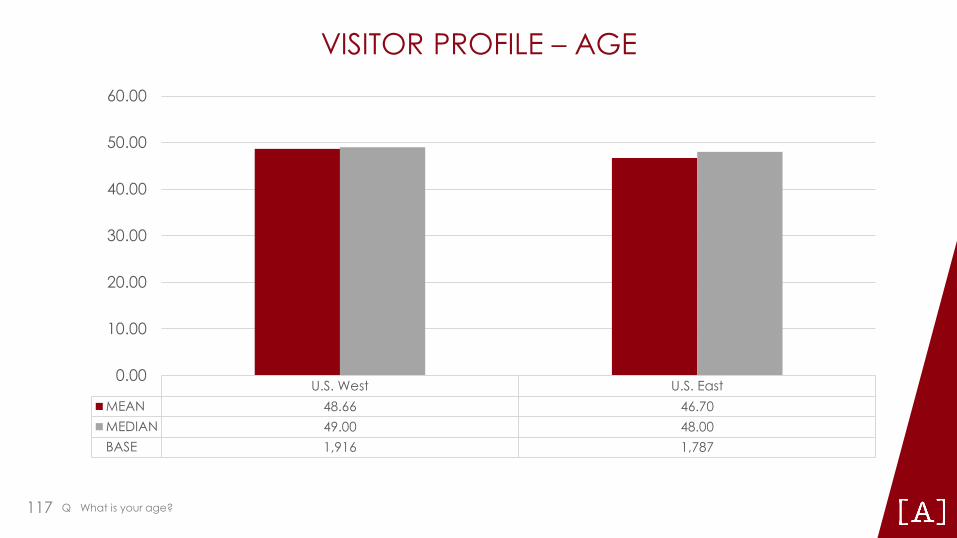
VISITOR PROFILE – AGE 60.00
50.00
U.S. West U.S. East MEAN 48.66 46.70 MEDIAN 49.00 48.00 BASE 1,916 1,787
0.00
10.00
20.00
30.00
40.00
Q What is your age? 117
■
■
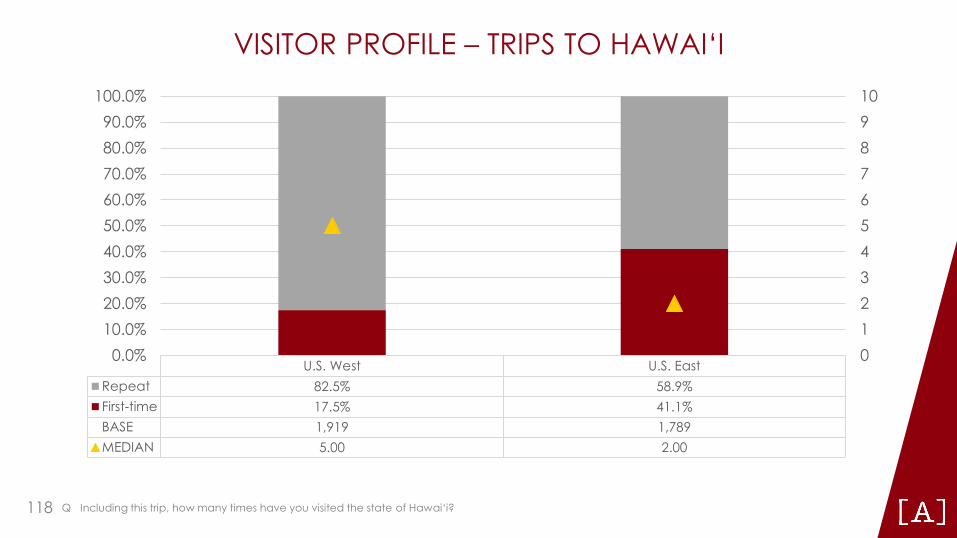
VISITOR PROFILE – TRIPS TO HAWAI‘I 100.0% 90.0% 80.0% 70.0% 60.0% 50.0% 40.0% 30.0% 20.0% 10.0%
U.S. West U.S. East Repeat 82.5% 58.9% First-time 17.5% 41.1% BASE 1,919 1,789 MEDIAN 5.00 2.00
0.0%
10 9 8 7 6 5 4 3 2 1 0
Q Including this trip, how many times have you visited the state of Hawai‘i? 118
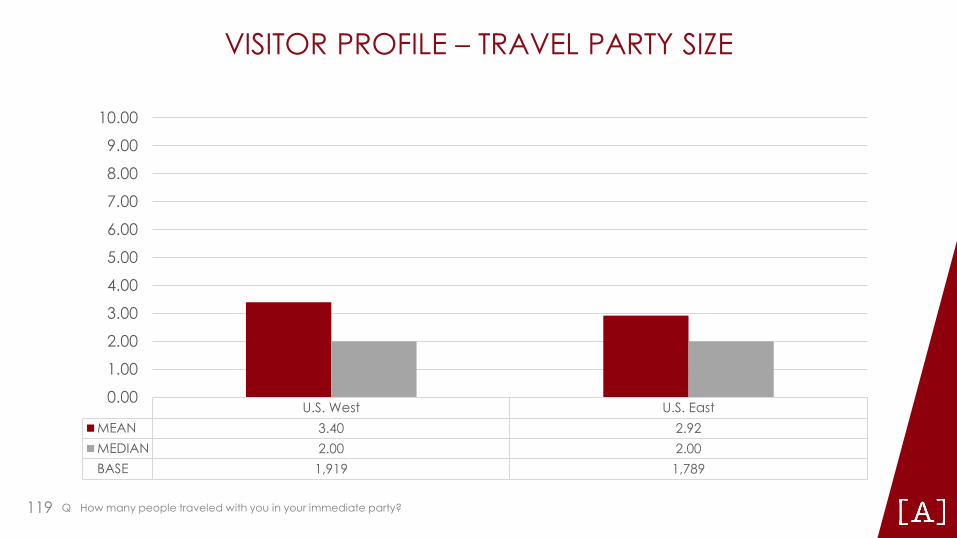
VISITOR PROFILE – TRAVEL PARTY SIZE
10.00
9.00
8.00
7.00
6.00
5.00
4.00
3.00
2.00
1.00
U.S. West U.S. East MEAN 3.40 2.92 MEDIAN 2.00 2.00 BASE 1,919 1,789
0.00
Q How many people traveled with you in your immediate party? 119
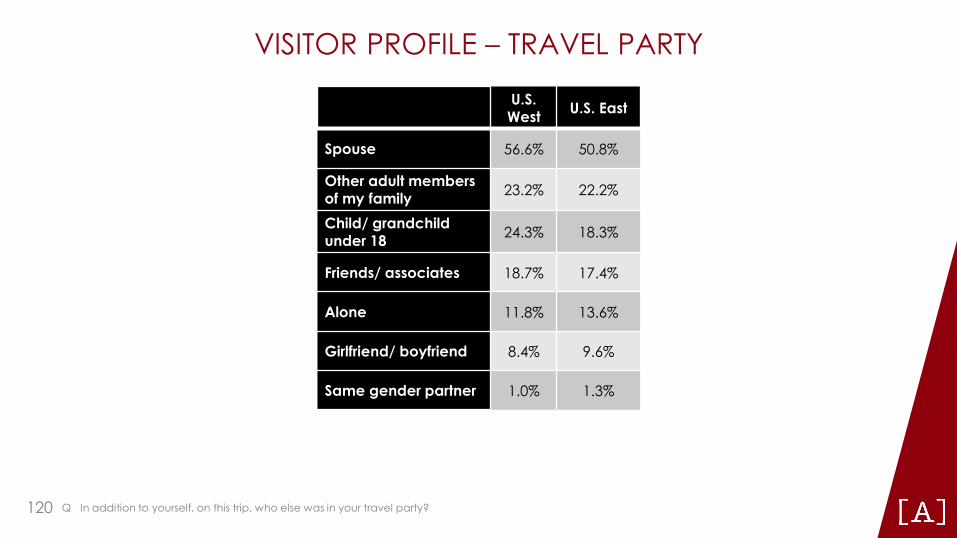
VISITOR PROFILE – TRAVEL PARTY
U.S. West U.S. East
Spouse 56.6% 50.8%
Other adult members of my family 23.2% 22.2%
Child/ grandchild under 18 24.3% 18.3%
Friends/ associates 18.7% 17.4%
Alone 11.8% 13.6%
Girlfriend/ boyfriend 8.4% 9.6%
Same gender partner 1.0% 1.3%
Q In addition to yourself, on this trip, who else was in your travel party? 120
SECTION 10 – ISLAND SURVEY METHODOLOGY
121
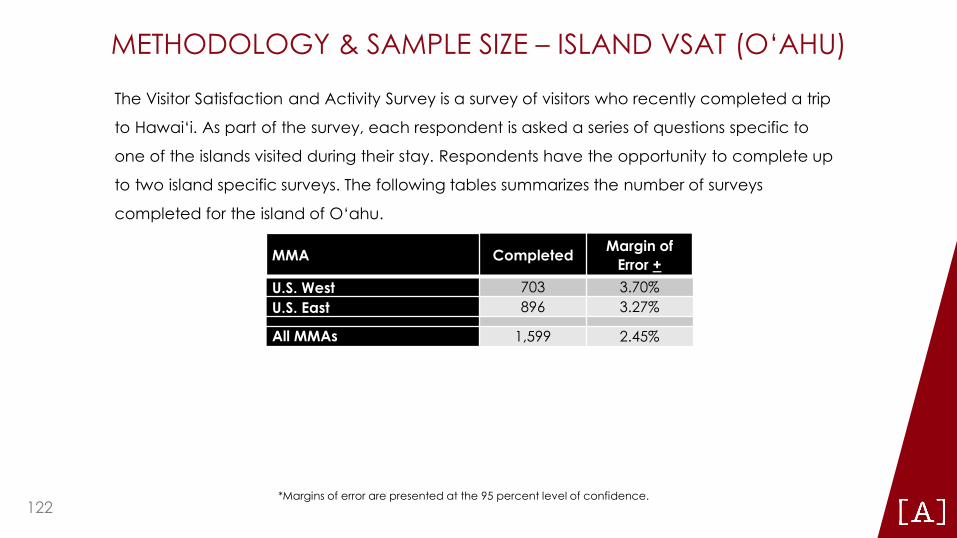
METHODOLOGY & SAMPLE SIZE – ISLAND VSAT (O‘AHU)
The Visitor Satisfaction and Activity Survey is a survey of visitors who recently completed a trip
to Hawai‘i. As part of the survey, each respondent is asked a series of questions specific to
one of the islands visited during their stay. Respondents have the opportunity to complete up
to two island specific surveys. The following tables summarizes the number of surveys
completed for the island of O‘ahu.
MMA Completed Margin of Error +
U.S. West 703 3.70% U.S. East 896 3.27%
All MMAs 1,599 2.45%
*Margins of error are presented at the 95 percent level of confidence. 122
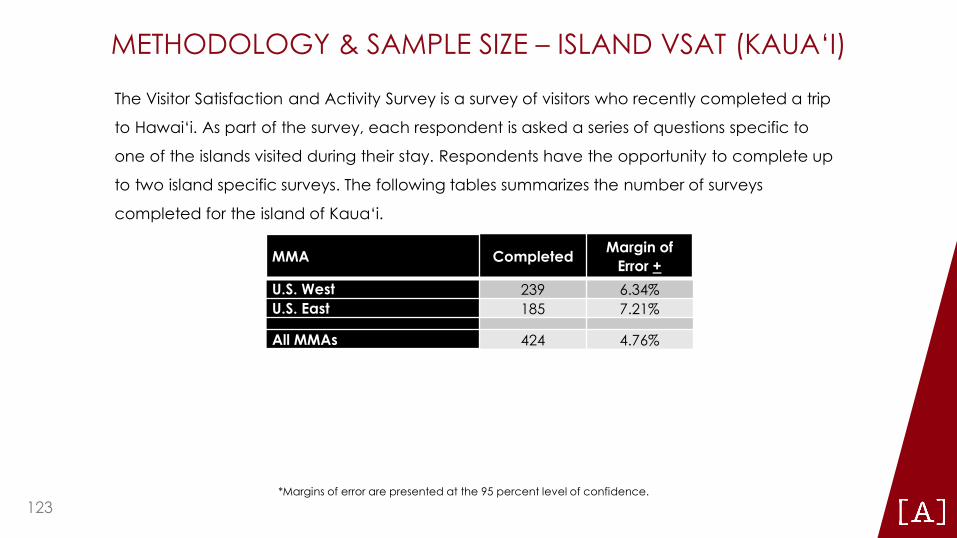
METHODOLOGY & SAMPLE SIZE – ISLAND VSAT (KAUA‘I)
The Visitor Satisfaction and Activity Survey is a survey of visitors who recently completed a trip
to Hawai‘i. As part of the survey, each respondent is asked a series of questions specific to
one of the islands visited during their stay. Respondents have the opportunity to complete up
to two island specific surveys. The following tables summarizes the number of surveys
completed for the island of Kaua‘i.
MMA Completed Margin of Error +
U.S. West 239 6.34% U.S. East 185 7.21%
All MMAs 424 4.76%
*Margins of error are presented at the 95 percent level of confidence. 123

METHODOLOGY & SAMPLE SIZE – ISLAND VSAT (MAUI)
The Visitor Satisfaction and Activity Survey is a survey of visitors who recently completed a trip
to Hawai‘i. As part of the survey, each respondent is asked a series of questions specific to
one of the islands visited during their stay. Respondents have the opportunity to complete up
to two island specific surveys. The following tables summarizes the number of surveys
completed for the island of Maui.
MMA Completed Margin of Error +
U.S. West 620 3.94% U.S. East 517 4.31%
All MMAs 1,137 2.91%
*Margins of error are presented at the 95 percent level of confidence. 124
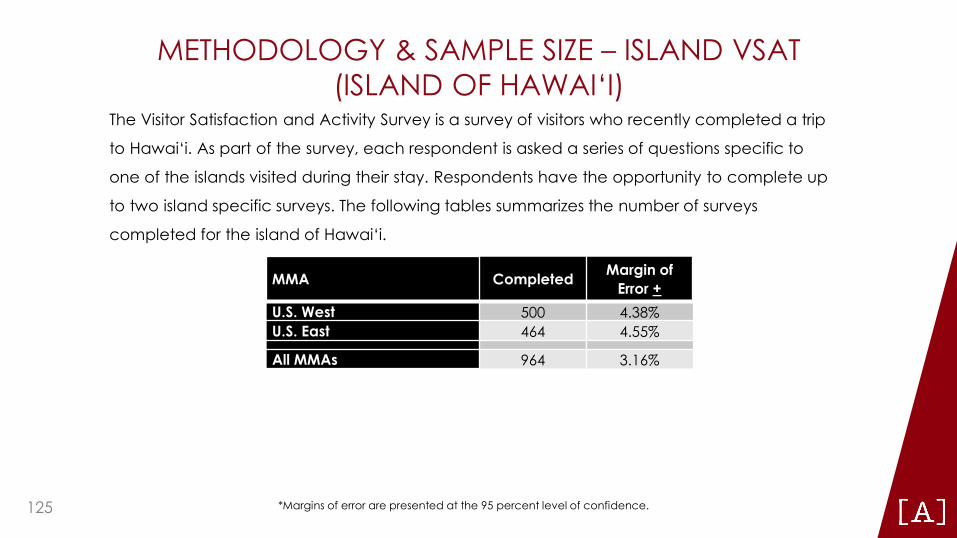
METHODOLOGY & SAMPLE SIZE – ISLAND VSAT (ISLAND OF HAWAI‘I)
The Visitor Satisfaction and Activity Survey is a survey of visitors who recently completed a trip
to Hawai‘i. As part of the survey, each respondent is asked a series of questions specific to
one of the islands visited during their stay. Respondents have the opportunity to complete up
to two island specific surveys. The following tables summarizes the number of surveys
completed for the island of Hawai‘i.
MMA Completed Margin of Error +
U.S. West 500 4.38% U.S. East 464 4.55%
All MMAs 964 3.16%
*Margins of error are presented at the 95 percent level of confidence. 125