visitor satisfaction & activity...
TRANSCRIPT
2013
Visitor Satisfaction
& Activity Report
Hawai‘i Convention Center
1801 Kālakaua Avenue
Honolulu, Hawai‘i 96815
(808) 973-2255
www.hawaiitourismauthority.org

2013 VSAT Report Page i
CONTENTS
1. ABOUT THIS REPORT ......................................................................................................... 1
COMPARING ANNUAL DATA .............................................................................................................. 1
DEFINITIONS ........................................................................................................................................ 2
AVAILABILITY OF THIS REPORT ....................................................................................................... 2
2. OVERVIEW OF VISITOR INDUSTRY ................................................................................... 3
3. VISITOR SATISFACTION ..................................................................................................... 4
OVERALL RATING OF MOST RECENT VACATION TO HAWAI‘I ..................................................... 4
MEETING VISITOR EXPECTATIONS .................................................................................................. 5
LIKELIHOOD TO RECOMMEND HAWAI‘I ........................................................................................... 6
LIKELIHOOD TO REVISIT HAWAI‘I ..................................................................................................... 7
First-Time Visitors........................................................................................................... 8
INDIVIDUAL ISLAND EXPERIENCE .................................................................................................... 9
NEW DATA: CHINA AND KOREA ...................................................................................................... 14
Satisfaction ....................................................................................................................14
Island Experience ..........................................................................................................15
4. VISITOR CHARACTERISTICS ............................................................................................16
PRIMARY PURPOSE OF TRIP .......................................................................................................... 17
TRAVEL BEHAVIORS ........................................................................................................................ 18
5. ACTIVITY PARTICIPATION .................................................................................................19
LEISURE VISITOR ACTIVITIES BY MMA .......................................................................................... 20
LEISURE VISITOR ACTIVITIES BY ISLAND ..................................................................................... 21
6. TRIP PLANNING ..................................................................................................................23
NEW INFORMATION FOR 2013 ........................................................................................................ 24
7. FIRST-TIME AND REPEAT VISITORS ................................................................................27
ACTIVITIES FOR FIRST-TIME AND REPEAT VISITORS ................................................................. 27
ACCOMMODATIONS FOR FIRST-TIME AND REPEAT VISITORS ................................................. 30
SATISFACTION AMONG FIRST-TIME AND REPEAT VISITORS .................................................... 31
8. NEGATIVE FEATURES OF THE HAWAI‘I TRIP .................................................................32
REASONS FOR NOT RETURNING ................................................................................................... 33
9. SURVEY METHODOLOGY ..................................................................................................35
VSAT MAIL AND WEB SURVEY METHODS ..................................................................................... 35
VSAT AIRPORT INTERCEPT SURVEYS, CHINA AND KOREA MMAS ........................................... 36
Background ...................................................................................................................36
Methodology ..................................................................................................................36
2013 VSAT Report Page ii
Staffing ..........................................................................................................................36
Scheduling ....................................................................................................................37
Survey Instrument .........................................................................................................37
Production .....................................................................................................................37
Data Cleaning/Processing/Submission ..........................................................................37
10. APPENDIX ....................................................................................................................38
English Language VSAT Survey Form, 2013 ..................................................................................... 39
Japanese Language VSAT Survey Form, 2013 ................................................................................. 46
LIST OF TABLES
Table 1: Measures of Satisfaction ............................................................................................14
Table 2: Island Experience .......................................................................................................15
Table 3: Selected Visitor Characteristics ..................................................................................16
Table 4: Primary Purpose of Trip..............................................................................................17
Table 5: Sources of Information Used Before Trip ....................................................................18
Table 6: Timeline of Trip Planning Elements ............................................................................23
Table 7: Early and Late Planners, 2013 (Percentage) ..............................................................24
Table 8: Characteristics of Early and Late Planners .................................................................26
Table 9: Response Rates and Sample Statistics, VSAT 2013 ..................................................35
Table 10: Response Rates for China and Korea, VSAT 2013 ..................................................37

2013 VSAT Report Page iii
LIST OF FIGURES
Figure 1: Overall Rating of Trip ................................................................................................. 4
Figure 2: Trip Exceeded Expectations ....................................................................................... 5
Figure 3: Very Likely to Recommend Hawai‘i to Friends and Relatives ..................................... 6
Figure 4: Very Likely to Revisit Hawai‘i...................................................................................... 7
Figure 5: First-Time Very Likely to Revisit Hawai‘i ..................................................................... 8
Figure 6: Island Experience Rated as “Excellent” – U.S. Visitors .............................................. 9
Figure 7: Island Experience Rated as “Excellent” – Japanese Visitors .....................................10
Figure 8: Island Experience Rated as “Excellent” – Canadian Visitors .....................................11
Figure 9: Island Experience Rated as “Excellent” – European Visitors .....................................12
Figure 10: Island Experience Rated as “Excellent” – Visitors from Oceania .............................13
Figure 11: Visitor Activities by MMA, 2013 ...............................................................................19
Figure 12: Visitor Activities by Island, 2013 ..............................................................................21
Figure 13: Timing of Planning Decisions, 2013 ........................................................................25
Figure 14: Statewide Activity Participation, First-time and Repeat Visitors, 2013 .....................28
Figure 15: Accommodations for First-time and Repeat Visitors ................................................30
Figure 16: Satisfaction Ratings for First-Time and Repeat Visitors ............................................31
Figure 17: Negative Features of the Hawai‘i Trip and Summary Satisfaction Scores ................32
Figure 18: Reasons for Not Returning and Summary Satisfaction Scores .................................34

2013 VSAT Report Page 1
1. ABOUT THIS REPORT
The 2013 Visitor Satisfaction and Activity Report (VSAT) presents the results of a survey
conducted annually by the Hawai‘i Tourism Authority (HTA) as part of its Tourism Research
program. There are four objectives for the survey and the report.
The first objective is to provide measurements of survey respondents’ satisfaction with Hawai‘i as
a visitor destination. Visitors from U.S. West, U.S. East, Japan, Canada, Europe, and Oceania
were surveyed. The report describes visitors’ evaluation of their vacation experience by
investigating their reaction to events that occurred on the island on which they stayed the longest.
Visitors rated their stay on four different evaluation categories – overall satisfaction, how well their
experience matched their expectations, likelihood of recommending Hawai‘i to others and
likelihood of returning to Hawai‘i within the next five years.
The second objective was to investigate the activities in which visitors took part as they visited
each of the islands on their itinerary. VSAT measures 50 activities which are categorized as
sightseeing, shopping, transportation, culture, entertainment and recreation. We also measured
business activities, sports, wedding and family celebrations and visiting with friends and relatives.
Those activities define the vacation trips enjoyed by our visitors and provide a measure of the
extent to which our products are being used.
The third objective was to offer some insights into the destination selection and trip planning
process, as well as the timetable involved in planning and booking a trip. Survey data show that
visitors employed a variety of resources to plan, select and book a trip to Hawai‘i. We have taken
special notice of the impact of the Internet and travel agents on the decision-making process.
The final objective was to provide demographic profiles of Hawai‘i visitors. VSAT pulls together
demographic and travel behavior patterns from this survey, the Domestic Inflight Survey and the
International Intercept Survey1. Together, these sources provide data on income and education,
employment status, life-stage segments, first time or repeat visitors, the structure and type of the
visitor party and reasons for visiting Hawai‘i. This represents an enhanced level of detail not
available from HTA’s annual and monthly visitor reports.
COMPARING ANNUAL DATA
VSAT 2013 surveys were mailed to visitors from U.S. West, U.S. East, Canada, Japan, Europe,
and Oceania. VSAT data has been collected from U.S., Canadian and Japanese visitors since
2002. Visitors from Europe were surveyed in the years 2007, 2008, 2009, 2012, 2011 and 2013.
Visitors from Oceania were surveyed in 2008, 2009, 2011, 2012 and 2013. In the last quarter of
2013, data were gathered from Chinese and Korean visitors using departure intercept interviews.
We will present some preliminary data on China and Korea in a later section for this report. All
other findings are based on the 2013 survey of visitors from the U.S., Canada, Japan, Europe
and Oceania.
1 Hawai‘i Tourism Authority, Annual Research Report, 2013, pp. 160-162.
2013 VSAT Report Page 2
DEFINITIONS
Visitor: An out-of-state traveler who stayed in Hawai‘i for at least one night and less than one year.
In this report, findings attributed to “visitors” are based on data collected from six Major Market
Areas – U.S. West, U.S. East, Canada, Japan, Europe, and Oceania. Findings related to visitors
from China and Korea are reported separately.
Major Market Area (MMA): Geographic areas used to classify visitors according to their place of
origin for the purpose of destination marketing management. VSAT 2013 reports data for the
following MMAs:
1. U.S. West – Pacific states (Alaska, California, Oregon, Washington) and Mountain states
(Arizona, Colorado, Idaho, Montana, Nevada, New Mexico, Utah, Wyoming)
2. U.S. East – Other states in the continental U.S.
3. Japan
4. Canada
5. Europe – United Kingdom, Germany, France, Italy, and Switzerland
6. Oceania – Australia and New Zealand
7. Other Asia – China and Korea only
Visitor Lifestyle and Lifestage: A classification used by HTA and other visitor industry members in
Hawai‘i to study specific market segments using the following classification:
Wedding/Honeymoon: Visitors whose primary or secondary purpose of trip is to get
married or be on their honeymoon
Family: Visitors traveling with children under 18 years of age and are not included in the
above lifestage
Young: Visitors between 18 and 34 years of age and who are not in the above lifestages
Middle Age: Visitors between 35 and 54 years of age and not in the above lifestages
Seniors: Visitors 55 years of age or over and not in the above lifestages
Length of Stay: The average number of days visitors were present in Hawai‘i including the day
of arrival and the day of departure.
AVAILABILITY OF THIS REPORT
This report and the companion Excel workbook of 2013 VSAT data tables are available on the
HTA website: http://www.Hawaiitourismauthority.org/research/reports/visitor-satisfaction.
For further information contact the HTA at (808) 973-2255.
This report was produced by HTA’s Tourism Research staff: Mr. Daniel Nahoopii, Director, Ms.
Minh-Chau T. Chun, Mr. Lawrence Liu, and Ms. Jennifer Chun. The President and CEO of HTA
is Mr. Michael McCartney.

2013 VSAT Report Page 3
2. OVERVIEW OF VISITOR INDUSTRY
2013 was another strong year for Hawai‘i’s visitor industry. Total expenditures by all visitors who
came to the Hawaiian Islands increased 1.1 percent from 2012, to a record $14.5 billion. Total
arrivals, by air or by cruise ships, of 8,174,460 visitors (+1.8%), also reached a record high.
Growth, especially accelerating growth, is generally good for the health of the visitor industry but
not always good for visitor satisfaction. Growth can cause congestion at visitor attractions and
bring about higher visitor-to-staff ratios across the industry, leading to lower visitor satisfaction
ratings.
Arrivals by air to O‘ahu increased 2.9 percent to 5,044,276 visitors in 2013. Maui reported a 2.1
percent growth to 2,358,784 air visitors. Arrivals to Hawai‘i Island of 1,435,245 visitors (+0.1%)
were similar to 2012. Kaua‘i’s arrivals rose 2.7 percent to 1,114,354 visitors. Arrivals to Lāna’i
(+2.3% to 74,310 visitors) and Moloka‘i (+3.4% to 55,157 visitors) also exceeded 2012.
For a complete analysis of Hawai‘i’s visitor industry, please refer to the 2013 Annual Visitor
Research Report at: http://www.Hawaiitourismauthority.org/default/assets/File/reports/visitor-
statistics/2013 ANNUAL REPORT (final).pdf.
2013 VSAT Report Page 4
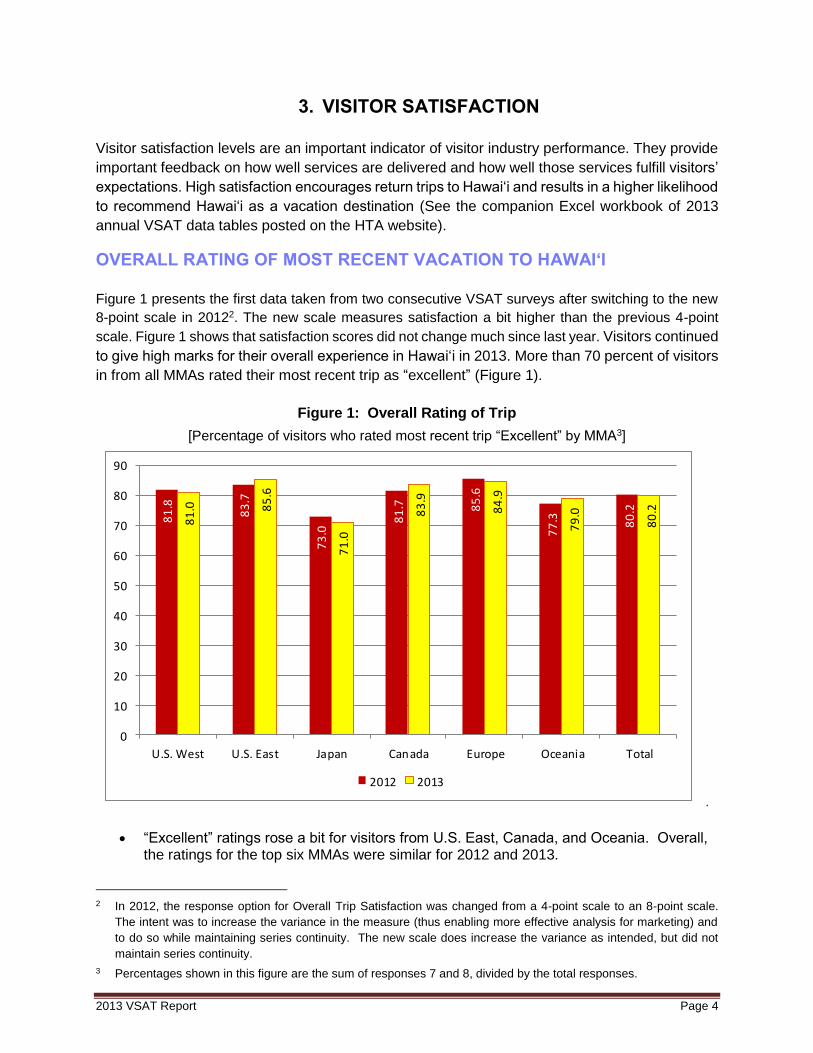
3. VISITOR SATISFACTION
Visitor satisfaction levels are an important indicator of visitor industry performance. They provide
important feedback on how well services are delivered and how well those services fulfill visitors’
expectations. High satisfaction encourages return trips to Hawai‘i and results in a higher likelihood
to recommend Hawai‘i as a vacation destination (See the companion Excel workbook of 2013
annual VSAT data tables posted on the HTA website).
OVERALL RATING OF MOST RECENT VACATION TO HAWAI‘I
Figure 1 presents the first data taken from two consecutive VSAT surveys after switching to the new
8-point scale in 20122. The new scale measures satisfaction a bit higher than the previous 4-point
scale. Figure 1 shows that satisfaction scores did not change much since last year. Visitors continued
to give high marks for their overall experience in Hawai‘i in 2013. More than 70 percent of visitors
in from all MMAs rated their most recent trip as “excellent” (Figure 1).
Figure 1: Overall Rating of Trip
[Percentage of visitors who rated most recent trip “Excellent” by MMA3]
81
.8
83
.7
73
.0
81
.7 85
.6
77
.3 80
.2
81
.0 85
.6
71
.0
83
.9
84
.9
79
.0
80
.2
0
10
20
30
40
50
60
70
80
90
U.S. West U.S. East Japan Canada Europe Oceania Total
2012 2013
.
“Excellent” ratings rose a bit for visitors from U.S. East, Canada, and Oceania. Overall, the ratings for the top six MMAs were similar for 2012 and 2013.
2 In 2012, the response option for Overall Trip Satisfaction was changed from a 4-point scale to an 8-point scale.
The intent was to increase the variance in the measure (thus enabling more effective analysis for marketing) and
to do so while maintaining series continuity. The new scale does increase the variance as intended, but did not
maintain series continuity.
3 Percentages shown in this figure are the sum of responses 7 and 8, divided by the total responses.

2013 VSAT Report Page 5
MEETING VISITOR EXPECTATIONS
Visitors’ evaluation of their trip is influenced not only by the nature of the service they receive, but
also by their needs, motivations, and interests. Therefore, it is important to measure how well the
destination meets expectations. Overall, Hawai‘i’s ability to exceed expectations remained quite
strong in 20134.
Figure 2: Trip Exceeded Expectations
[Percentage of visitors who said this trip “Exceeded Expectations” by MMA]
*Visitors from Europe and Oceania were not surveyed in 2010.
Across all MMAs except Canada and Japan in 2013, the percentages of visitors who felt their trip exceeded their expectations were up slightly from 2012. Increases were recorded for our visitors from U.S. West (37.9%), U.S. East (48.0%), Europe (47.9%), and Oceania (41.6%).
The trend for U.S. visitors rose from 2007 to 2010, then leveled off, and returned this year to its 2010 level. The steady rise in exceeded expectations among Japanese visitors ended at 35.4 percent in 2011 and has remained at that level through 2013. The four-year upward trend among our Canadian visitors ended this year with a 1.4 point drop to 41.4 percent. Exceeded expectations continued an upward trend for visitors from Oceania, reaching a high of 41.6 percent in 2013.
Ratings among European visitors showed no solid trend but their rating of 47.9 percent for 2013 was the highest posted since 2008.
4 The alternative to exceeding expectations was primarily to have met expectations. Fewer than five percent of visitors
reported that the trip failed to meet their expectations. This is a measure of excellence.
37
.4
34
.7
41
.1
31
.0 32
.5
43
.5
32
.1
36
.6
33
.6
40
.9
32
.7 36
.2
46
.3
31
.7
41
.1
37
.0
47
.3
33
.1
39
.2
38
.3
34
.5
45
.3
35
.4 38
.8
38
.7
36
.038
.3
34
.7
45
.5
35
.4
42
.8 44
.3
39
.041
.4
37
.9
48
.0
35
.4
41
.4
47
.9
41
.6
0
5
10
15
20
25
30
35
40
45
50
U.S. Total U.S. West U.S. East Japan Canada Europe Oceania
2008 2009 2010 2011 2012 2013
2013 VSAT Report Page 6
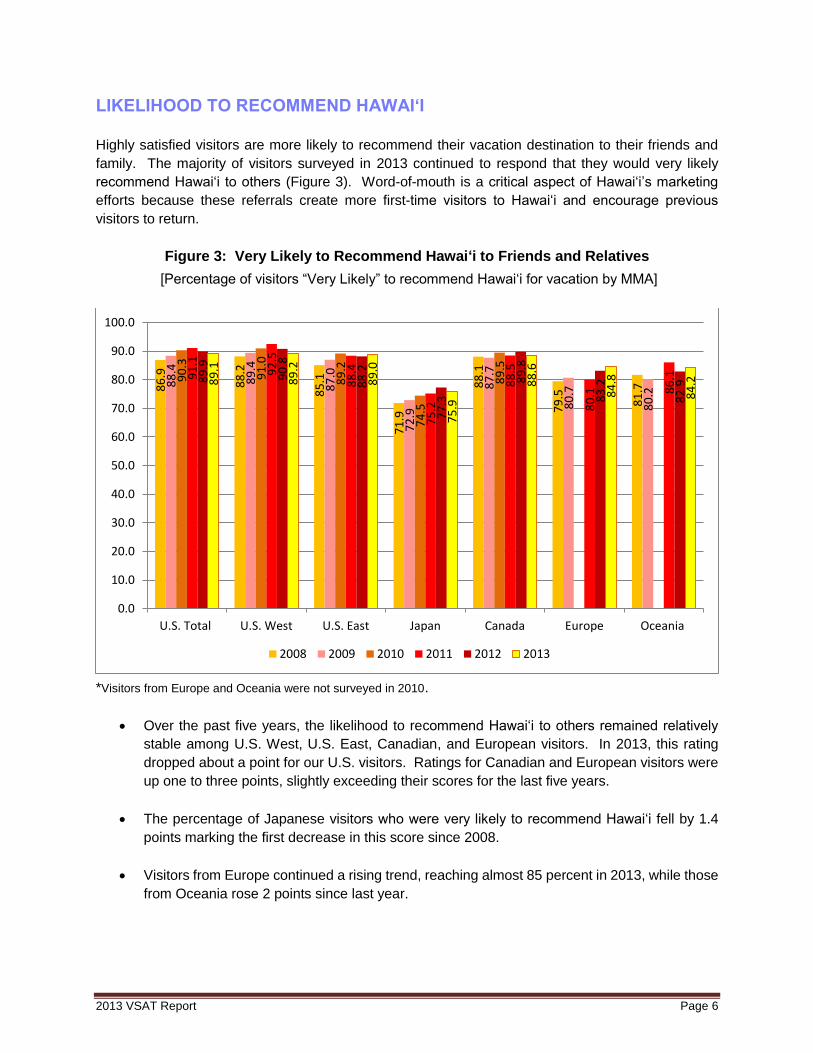
LIKELIHOOD TO RECOMMEND HAWAI‘I
Highly satisfied visitors are more likely to recommend their vacation destination to their friends and
family. The majority of visitors surveyed in 2013 continued to respond that they would very likely
recommend Hawai‘i to others (Figure 3). Word-of-mouth is a critical aspect of Hawai‘i’s marketing
efforts because these referrals create more first-time visitors to Hawai‘i and encourage previous
visitors to return.
Figure 3: Very Likely to Recommend Hawai‘i to Friends and Relatives
[Percentage of visitors “Very Likely” to recommend Hawai‘i for vacation by MMA]
*Visitors from Europe and Oceania were not surveyed in 2010.
Over the past five years, the likelihood to recommend Hawai‘i to others remained relatively
stable among U.S. West, U.S. East, Canadian, and European visitors. In 2013, this rating
dropped about a point for our U.S. visitors. Ratings for Canadian and European visitors were
up one to three points, slightly exceeding their scores for the last five years.
The percentage of Japanese visitors who were very likely to recommend Hawai‘i fell by 1.4
points marking the first decrease in this score since 2008.
Visitors from Europe continued a rising trend, reaching almost 85 percent in 2013, while those
from Oceania rose 2 points since last year.
86
.9
88
.2
85
.1
71
.9
88
.1
79
.5
81
.788
.4
89
.4
87
.0
72
.9
87
.7
80
.7
80
.2
90
.3
91
.0
89
.2
74
.5
89
.5
91
.1
92
.5
88
.4
75
.2
88
.5
80
.1 86
.189
.9
90
.8
88
.2
77
.3
89
.8
83
.2
82
.989
.1
89
.2
89
.0
75
.9
88
.6
84
.8
84
.2
0.0
10.0
20.0
30.0
40.0
50.0
60.0
70.0
80.0
90.0
100.0
U.S. Total U.S. West U.S. East Japan Canada Europe Oceania
2008 2009 2010 2011 2012 2013

2013 VSAT Report Page 7
LIKELIHOOD TO REVISIT HAWAI‘I
Each visitor’s decision to return to Hawai‘i is influenced by a variety of factors: positive experiences
during their most recent trips, a desire for new experiences, amount of time available, financial
considerations, and other commitments. Likelihood to revisit Hawai‘i is an indicator of future demand
and changes in desires. The majority of Hawai‘i visitors in all MMAs except Europe continue to indicate
their intention to return in the near future. The percentage likely to return was closely correlated to
distance from Hawai‘i – the closer the MMA, the greater the likelihood of returning. That pattern has
been the same since 2007.
Figure 4: Very Likely to Revisit Hawai‘i
[Percentage of visitors “Very Likely” to revisit in the next five years by MMA]
65
.2
75
.4
51
.1
50
.4
58
.8
36
.4
46
.9
67
.7
77
.3
53
.9
55
.8 62
.4
39
.7 45
.6
68
.6
77
.9
54
.7
57
.0 62
.767
.2
75
.4
52
.1
51
.9
63
.9
35
.3
49
.5
71
.2
79
.1
55
.6
52
.7
65
.8
43
.2
47
.4
67
.4
75
.5
52
.0
52
.2
62
.9
35
.9
51
.0
0.0
10.0
20.0
30.0
40.0
50.0
60.0
70.0
80.0
90.0
U.S. Total U.S. West U.S. East Japan Canada Europe Oceania
2008 2009 2010 2011 2012 2013
*Visitors from Europe and Oceania were not surveyed in 2010.
Nearly 76 percent of U.S. West visitors in 2013 reported that they were very likely to revisit
Hawai‘i in the next five years. This represented a 3.6 percentage point decrease since 2012.
The percentage of U.S. East visitors who reported they were very likely to return has always
been lower than the percentage of U.S. West visitors. Ratings among U.S. East visitors was
52.0 percent in 2013 after attaining a six-year high score in 2012 (55.6%).
The percentage of Japanese visitors indicating likelihood to return to the islands within the
next five years has remained relatively stable for the last three years at around 52.2 percent.
Our Canadian visitors had been steadily rising for the last five years. This year their score fell
back a bit to 62.9 percent.

2013 VSAT Report Page 8
European visitors have always been a bit less likely to take the long trip in the next five years.
In 2013, after reaching a six-year high of 43.2 percent in 2012, they dropped back to 35.9
percent.
About 51.0 percent of all visitors from Oceania reported that they were very likely to return to
Hawai‘i in the next five years. That was the highest rating among Oceania visitors since the
year 2008. It is also fully 3.6 percentage points higher than the percentage who reported in
2012 that they would be very likely to return to Hawai‘i in the next five years (47.4%).
First-Time Visitors
We expected that for first-time visitors likelihood to revisit would be correlated with repeat visitor status
in the next five years. Figure 5 presents VSAT measures for likelihood of returning for the last six
years.
Figure 5: First-Time Very Likely to Revisit Hawai‘i
[Percentage of first-time visitors “Very Likely” to revisit in the next five years by MMA]
65.2
75.4
51.1
50.4
58.8
36.4
46.9
67.7
77.3
53.9
55.8 62
.4
39.7 45
.6
68.6
77.9
54.7 57
.0 62.767
.2
75.4
52.1
51.9
63.9
35.3
49.5
71.2
79.1
55.6
52.7
65.8
43.2
47.4
67.4
75.5
52.0
52.2
62.9
35.9
51.0
0.0
10.0
20.0
30.0
40.0
50.0
60.0
70.0
80.0
90.0
U.S. Total U.S. West U.S. East Japan Canada Europe Oceania
2008 2009 2010 2011 2012 2013
52
30.8
38.3
26.5
23.6
38
54.6
37.5 40
.9
28.8
27.9 32
.7
54.5
36.3
42.9
31.4
56.5
37.7
45.2
29.1
22.7
42.9
57.2
33.9
48.8
32.5
31.8
38.9
56.8
34.8 39
.5
29.1
26.1
41.8
0
10
20
30
40
50
60
70
U.S. West U.S. East Canada Japan Europe Oceania
2008 2009 2010 2011 2012 2013
*Visitors from Europe and Oceania were not surveyed in 2010.
In 2013, about 41 percent of all first-time visitors reported they were very likely to return to Hawai‘i in
the next five years. The percentages ranged from a low of 26 percent for Europe, through 57 percent
for U.S. West visitors. The relationship between those willing to return and distance from Hawai‘i
remained largely intact. The exception was that first-time visitors from Oceania had a higher than
expected willingness to return than would be expected based on their distance from Hawai‘i alone.
However, first-time visitors have been less likely than average to be willing to revisit Hawai‘i in the next
five years. First-time U.S. West visitors were only 75 percent as likely to be willing to return in the next

2013 VSAT Report Page 9
five years compared to the average U.S. West visitors. First-time visitor likelihood to returns was 67
percent lower among U.S. East visitors, 56 percent lower for Japanese visitors, 63 percent lower for
Canadian visitors, 74 percent lower for Europeans, and 82 percent lower among visitors from Oceania.
INDIVIDUAL ISLAND EXPERIENCE
Each island has unique characteristics, activities, and products that provide different visitor
experiences. Beginning in 2006, VSAT measured satisfaction separately for each of the islands
visited. In general, the majority of visitors reported that their individual island experiences were
“excellent”. Also, note that “excellent” ratings for individual islands were always lower than the
overall satisfaction rate for their total Hawai‘i experience. Figure 6 shows island-by-island
satisfaction rating among our U.S. visitors. There were no changes to questions, response
options, or survey procedures that might have affected the ratings in 2013.
Figure 6: Island Experience Rated as “Excellent” – U.S. Visitors
(Percentage of visitors by island)
In all years since 2008, U.S. visitors gave more “excellent” ratings to Maui and Kaua‘i than to
O‘ahu and Hawai‘i Island. Between 2008 and 2011, there was a slight upward trend in ratings for
both of those islands. In 2012, ratings for Maui and Kaua‘i dropped several points. 2013 ratings
for these islands were similar to those recorded in 2012.
Since 2008, U.S. visitors’ “excellent” ratings for O‘ahu have been slightly lower compared to other
islands. O‘ahu was the lowest rated again in 2013, unchanged from 2012.
55
.3
73
.7
62
.2
74
.9
61
.1
73
.4
62
.3
72
.5
61
.9
72
.5
67
.6
74
.9
62
.2
75
.8
67
.5
77
.3
56
.9
66
.2
62
.3
70
.4
56
.9
67
.1
63
.3 69
.4
0
10
20
30
40
50
60
70
80
90
Oahu - U.S. Maui - U.S. Hawaii Island - U.S. Kauai - U.S.
2008 2009 2010 2011 2012 2013

2013 VSAT Report Page 10
U.S. visitor ratings of “excellent” for Hawai‘i Island were steady at about 62 percent from 2008 to
2009 and then rose to nearly 68 percent in 2010 and 2011. In 2012, ratings fell again to about 62
percent and in 2013 were about 63 percent.
Figure 7: Island Experience Rated as “Excellent” – Japanese Visitors
(Percentage of visitors by island)
Visitors from Japan have their own scale for measuring excellence. They have given fewer
“excellent” ratings for their overall Hawai‘i experiences. The same was true for individual island
“excellent” ratings.
Among Japanese visitors, individual island ratings differed less than the ratings reported by U.S.
visitors. Japanese 2013 ratings for O‘ahu, Maui, and Hawai‘i Island were similar at about 50 to 60
percent. The trend for O‘ahu was showing improvement between 2008 and 2011, but decreased
by about five points in 2012 and remained there for 2013. Trends for Maui and Hawai‘i Islands
have fluctuated by less than a point per year from 2008 through 2012. In 2013, the percentage of
visitors from Japan with “excellent” ratings dropped by about six points for Maui.
Japanese “excellent” ratings for Kaua‘i have generally been lower compared to other islands by
five to ten points. With the exception of a very low rating in 2010, ratings have remained around
53 percent or higher between 2008 and 2012. However, the 2013 rating was down again by about
six points from 2012. However, we note that Japanese visitors were also less likely to visit Kaua‘i
than the other islands.
56
.6
54
.3 57
.3
52
.7
59
.3
55
.7
56
.7
535
9.2
57
.4 59
.7
42
.8
62
.7
57
.1
62
53
.557
.6
57
.9 60
.1
55
.8
57
.3
52
.3
60
.4
49
.7
0
10
20
30
40
50
60
70
Oahu Maui Hawaii Island Kauai
2008 2009 2010 2011 2012 2013

2013 VSAT Report Page 11
Figure 8: Island Experience Rated as “Excellent” – Canadian Visitors
(Percentage of visitors by island)
Visitors from Canada rated their overall Hawai‘i experience about average for the major MMAs
(Figure 1). The same pattern was observed for their individual island “excellent” ratings between
2008 and 2013.
Canadian visitors’ individual island ratings were similar to U.S. visitors. Canadian visitors gave
higher percentages of “excellent” ratings for Maui and Kaua‘i than for the other two islands. In the
case of Kaua‘i, there was a decline from 2008 to 2009 before a 6.5 percent increase from 2009
to 2010. Since 2010, the percentage of “excellent” ratings for Kaua‘i has been decreasing.
Canadian visitor ratings for Maui, on the other hand, rose between 2008 and 2010 then fell almost
six points from 2011 to 2013.
Like U.S. visitors, Canadian visitors gave the lowest “excellent” ratings to O‘ahu. The trend rose
from 2008 through 2011 and fell 11 points to 53 percent in 2013.
Since 2008, the percentage of Canadian visitors who rated Hawai‘i Island as “excellent” was five
to seven points higher than their ratings for O‘ahu. In a similar pattern, Hawai‘i Island’s ratings
rose between 2008 and 2010, then fell off about two points in 2011 and dropped again in 2012,
this time by six points. In 2013, this percentage increased but by less than one point.
54
.4
66
.7
61
.2
68
.9
56
.7
65
.9
63
.5 65
.9
60
72
.3
66
.3 72
.4
64
71
64
.6 70
.7
53
.1
64
.3
58
.1
67
.5
53
.3
65
.5
58
.7 61
.8
0
10
20
30
40
50
60
70
80
Oahu Maui Hawaii Island Kauai
2008 2009 2010 2011 2012 2013

2013 VSAT Report Page 12
Figure 9: Island Experience Rated as “Excellent” – European Visitors
(Percentage of visitors by island)
Note: Visitors from Europe were not surveyed in 2010.
Our visitors from Europe rated their overall experience in the state just above the average for all
major MMAs. However, the average rating for their individual island experience was lower than
the average for the other major MMAs. Note that VSAT surveys were not administered to
European visitors in 2010.
European visitors were more likely to have declared their island experiences to be “excellent”
when they visited Maui or Kaua‘i. Their Maui ratings averaged about 66 percent “excellent” each
year. The trend has been relatively flat. Ratings dropped about four points between 2012 and
2013.
European visitors’ “excellent” ratings for Kaua‘i were highest across the four islands, but have
been decreasing steadily between 2008 and 2012. In 2013, Kaua‘i's rating rose by 5.6 points to
almost 70 percent.
Since 2008, the percentage of European visitors who rated O‘ahu as “excellent” averaged about
56 percent. No regular trend was evident in the data, but the 2013 rating (47.7%) was lower than
the 2012 rating by almost 11 percentage points.
Ratings for Hawai‘i Island among European visitors were relatively flat from 2008 to 2009,
dropped substantially (-13 points) between 2011 and 2012 and increased by almost 10
percentage points in 2013 to 59 percent.
59
.7
61
.6
57
.5
76
62 66
.2
57
.8
69
54
70
62
.2
68
.3
58
.4
67
.7
49
.1
63
.9
47
.7
63
.4
58
.9
69
.5
0
10
20
30
40
50
60
70
80
Oahu Maui Hawaii Island Kauai
2008 2009 2010 2011 2012 2013
2013 VSAT Report Page 13
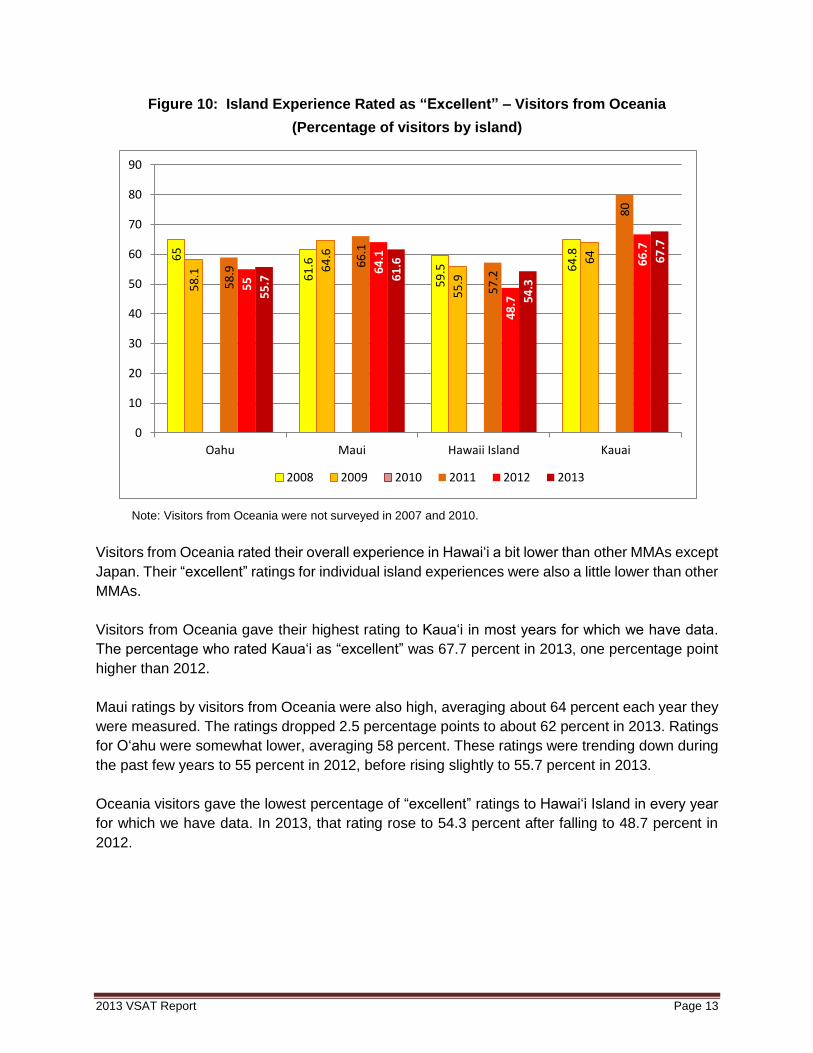
Figure 10: Island Experience Rated as “Excellent” – Visitors from Oceania
(Percentage of visitors by island)
Note: Visitors from Oceania were not surveyed in 2007 and 2010.
Visitors from Oceania rated their overall experience in Hawai‘i a bit lower than other MMAs except
Japan. Their “excellent” ratings for individual island experiences were also a little lower than other
MMAs.
Visitors from Oceania gave their highest rating to Kaua‘i in most years for which we have data.
The percentage who rated Kaua‘i as “excellent” was 67.7 percent in 2013, one percentage point
higher than 2012.
Maui ratings by visitors from Oceania were also high, averaging about 64 percent each year they
were measured. The ratings dropped 2.5 percentage points to about 62 percent in 2013. Ratings
for O‘ahu were somewhat lower, averaging 58 percent. These ratings were trending down during
the past few years to 55 percent in 2012, before rising slightly to 55.7 percent in 2013.
Oceania visitors gave the lowest percentage of “excellent” ratings to Hawai‘i Island in every year
for which we have data. In 2013, that rating rose to 54.3 percent after falling to 48.7 percent in
2012.
65
61
.6
59
.5 64
.8
58
.1 64
.6
55
.9
64
58
.9
66
.1
57
.2
80
55
64
.1
48
.7
66
.7
55
.7 61
.6
54
.3
67
.7
0
10
20
30
40
50
60
70
80
90
Oahu Maui Hawaii Island Kauai
2008 2009 2010 2011 2012 2013

2013 VSAT Report Page 14
NEW DATA: CHINA AND KOREA
HTA conducted a pilot program in 2013 to expand VSAT coverage to visitors from China and
Korea. Two data collection methods were tested – the standard after-visit mail survey and an exit
intercept interview conducted at the Honolulu International airport. The mail surveys had a much
lower response rate than any other MMA (5.7 percent for China and 2.9 percent for Korea
compared to about 30 percent of other MMAs). The intercept interview used a shorter survey
instrument and produced 600 interviews per MMA per quarter at a reasonable cost. Data reported
for the 4th Quarter of 2013 were from the intercept interviews only. For 2014, only the intercept
method will be used for visitors from China and Korea.
In this report, we will share the first data from China and Korea. Beginning in 2014, quarterly
reports will provide data for the six MMAs along with China and Korea as representative of the
Other Asia MMA. The data in Table 1 show an interesting pattern. It will be useful to track these
new satisfaction measures over the course of the coming year.
Satisfaction
Table 1: Measures of Satisfaction [Percentage of Visitors from Seven MMAs, 2013]
Japan China Korea U.S. Canada Europe Oceania
Overall (top 2 boxes) 71 71 85 83 84 85 79
Exceeded
expectations 35 11 44 41 41 48 42
Very likely recommend 76 83 88 89 90 82 85
Very likely to return 52 38 82 67 63 36 51
Data are for 4th Quarter 2013 for all MMAs.
Overall Satisfaction: Our Korean visitors reported a level of satisfaction (85%) that was similar
to visitors from the U.S., Canada, Europe and Oceania. At 71 percent, Chinese visitors were
closer to the Japanese level of satisfaction.
Exceed Expectations: The new data showed that Chinese visitors’ score of 11 percent was
quite a bit lower than Japanese visitors’ scores (35%). The Korean rating was 44 percent or about
the same as visitors from MMAs other than Japan.
Likely to Recommend: Ratings by Chinese and Korean visitors of 83 percent and 88 percent,
respectively, were very similar to visitors from other MMAs.
Very Likely to Return: For Chinese and Korean visitors, response patterns were atypical.
Chinese visitors had a low score of 38 percent while Korean visitors had a high score of 82
percent.
2013 VSAT Report Page 15
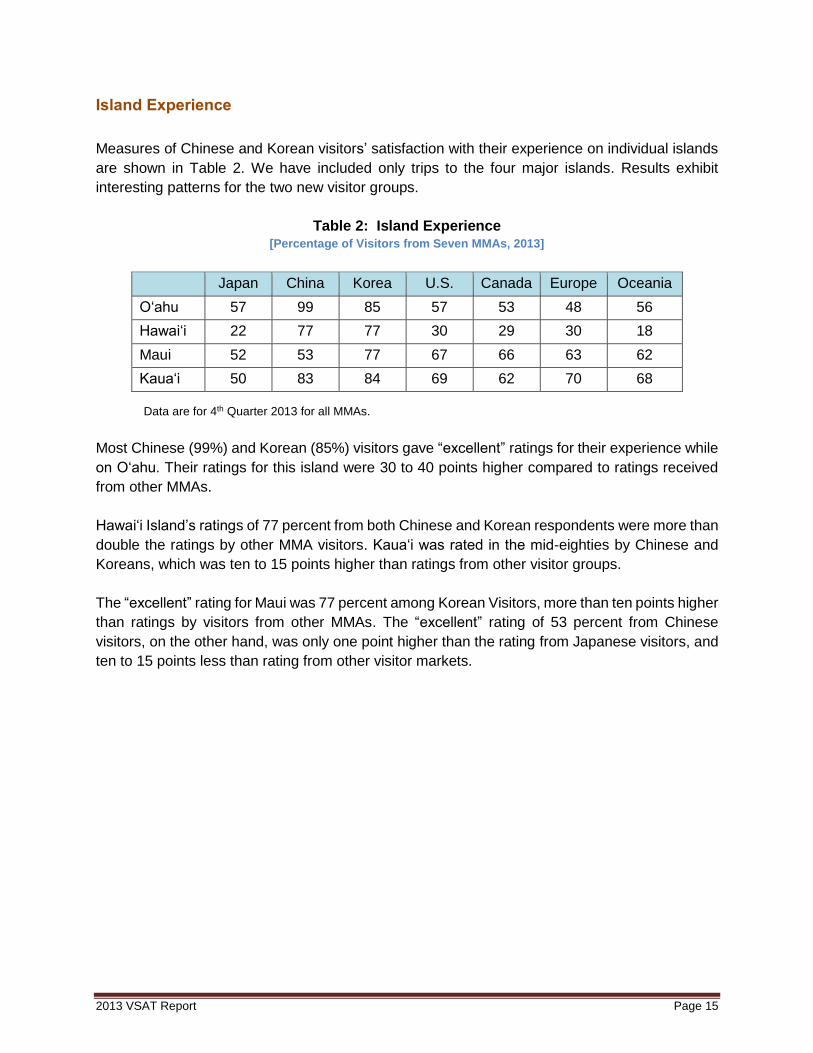
Island Experience
Measures of Chinese and Korean visitors’ satisfaction with their experience on individual islands
are shown in Table 2. We have included only trips to the four major islands. Results exhibit
interesting patterns for the two new visitor groups.
Table 2: Island Experience [Percentage of Visitors from Seven MMAs, 2013]
Japan China Korea U.S. Canada Europe Oceania
O‘ahu 57 99 85 57 53 48 56
Hawai‘i 22 77 77 30 29 30 18
Maui 52 53 77 67 66 63 62
Kaua‘i 50 83 84 69 62 70 68
Data are for 4th Quarter 2013 for all MMAs.
Most Chinese (99%) and Korean (85%) visitors gave “excellent” ratings for their experience while
on O‘ahu. Their ratings for this island were 30 to 40 points higher compared to ratings received
from other MMAs.
Hawai‘i Island’s ratings of 77 percent from both Chinese and Korean respondents were more than
double the ratings by other MMA visitors. Kaua‘i was rated in the mid-eighties by Chinese and
Koreans, which was ten to 15 points higher than ratings from other visitor groups.
The “excellent” rating for Maui was 77 percent among Korean Visitors, more than ten points higher
than ratings by visitors from other MMAs. The “excellent” rating of 53 percent from Chinese
visitors, on the other hand, was only one point higher than the rating from Japanese visitors, and
ten to 15 points less than rating from other visitor markets.
2013 VSAT Report Page 16
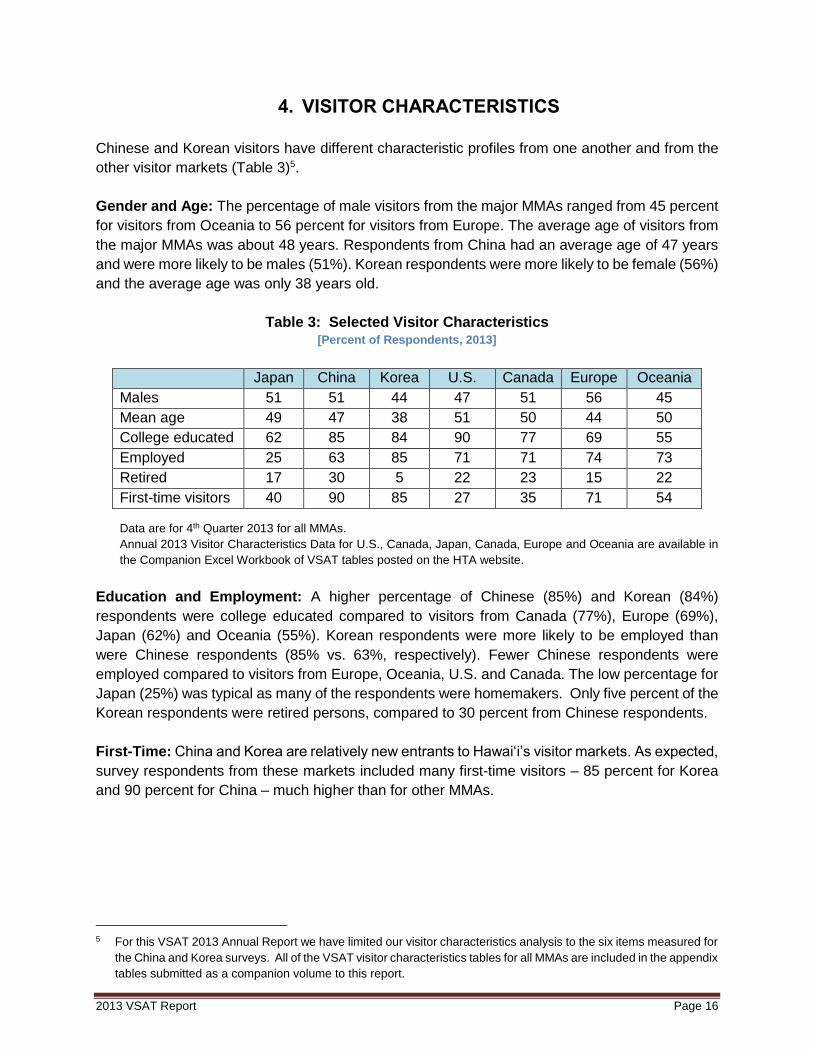
4. VISITOR CHARACTERISTICS
Chinese and Korean visitors have different characteristic profiles from one another and from the
other visitor markets (Table 3)5.
Gender and Age: The percentage of male visitors from the major MMAs ranged from 45 percent
for visitors from Oceania to 56 percent for visitors from Europe. The average age of visitors from
the major MMAs was about 48 years. Respondents from China had an average age of 47 years
and were more likely to be males (51%). Korean respondents were more likely to be female (56%)
and the average age was only 38 years old.
Table 3: Selected Visitor Characteristics [Percent of Respondents, 2013]
Japan China Korea U.S. Canada Europe Oceania
Males 51 51 44 47 51 56 45
Mean age 49 47 38 51 50 44 50
College educated 62 85 84 90 77 69 55
Employed 25 63 85 71 71 74 73
Retired 17 30 5 22 23 15 22
First-time visitors 40 90 85 27 35 71 54
Data are for 4th Quarter 2013 for all MMAs.
Annual 2013 Visitor Characteristics Data for U.S., Canada, Japan, Canada, Europe and Oceania are available in
the Companion Excel Workbook of VSAT tables posted on the HTA website.
Education and Employment: A higher percentage of Chinese (85%) and Korean (84%)
respondents were college educated compared to visitors from Canada (77%), Europe (69%),
Japan (62%) and Oceania (55%). Korean respondents were more likely to be employed than
were Chinese respondents (85% vs. 63%, respectively). Fewer Chinese respondents were
employed compared to visitors from Europe, Oceania, U.S. and Canada. The low percentage for
Japan (25%) was typical as many of the respondents were homemakers. Only five percent of the
Korean respondents were retired persons, compared to 30 percent from Chinese respondents.
First-Time: China and Korea are relatively new entrants to Hawai‘i’s visitor markets. As expected,
survey respondents from these markets included many first-time visitors – 85 percent for Korea
and 90 percent for China – much higher than for other MMAs.
5 For this VSAT 2013 Annual Report we have limited our visitor characteristics analysis to the six items measured for
the China and Korea surveys. All of the VSAT visitor characteristics tables for all MMAs are included in the appendix
tables submitted as a companion volume to this report.

2013 VSAT Report Page 17
PRIMARY PURPOSE OF TRIP
The reasons visitors came to Hawai‘i may affect the way they determine their satisfaction ratings.
Vacation continued to be the primary purpose of trip by the majority of visitors from all markets.
Table 4: Primary Purpose of Trip [Percent reporting primary purpose, 2013]
Japan China Korea U.S. Canada Europe Oceania
Vacation 66 78 52 65 83 71 88
Family 5 9 5 16 7 9 3
Wedding/
honeymoon
19 1 42 5 4 13 5
Business 2 11 2 10 3 4 1
Other 8 1 <1 4 3 4 3
Data are for 4th Quarter 2013 for all MMAs.
Family: Visit family/friends, reunion, anniversary, celebration.
Wedding: Honeymoon, get married, and attend a wedding.
Business: Business, convention, meeting, incentive trip.
More U.S. visitors came because of family (visit family/friends, reunion, anniversary, celebration)
while more Japanese visitors came for weddings and honeymoons.
Among Korean visitors, 42 percent came for weddings and honeymoons, twice as high as
Japanese visitors (19%).
Among Chinese visitors, only 1 percent came for weddings and honeymoons, but they had the
highest percentage of visitors who came on business trips (11%).
Under ‘Other’ purpose of trip, the 8 percent of Japanese respondents were mostly visitors who
came for the Honolulu Marathon in December.
2013 VSAT Report Page 18
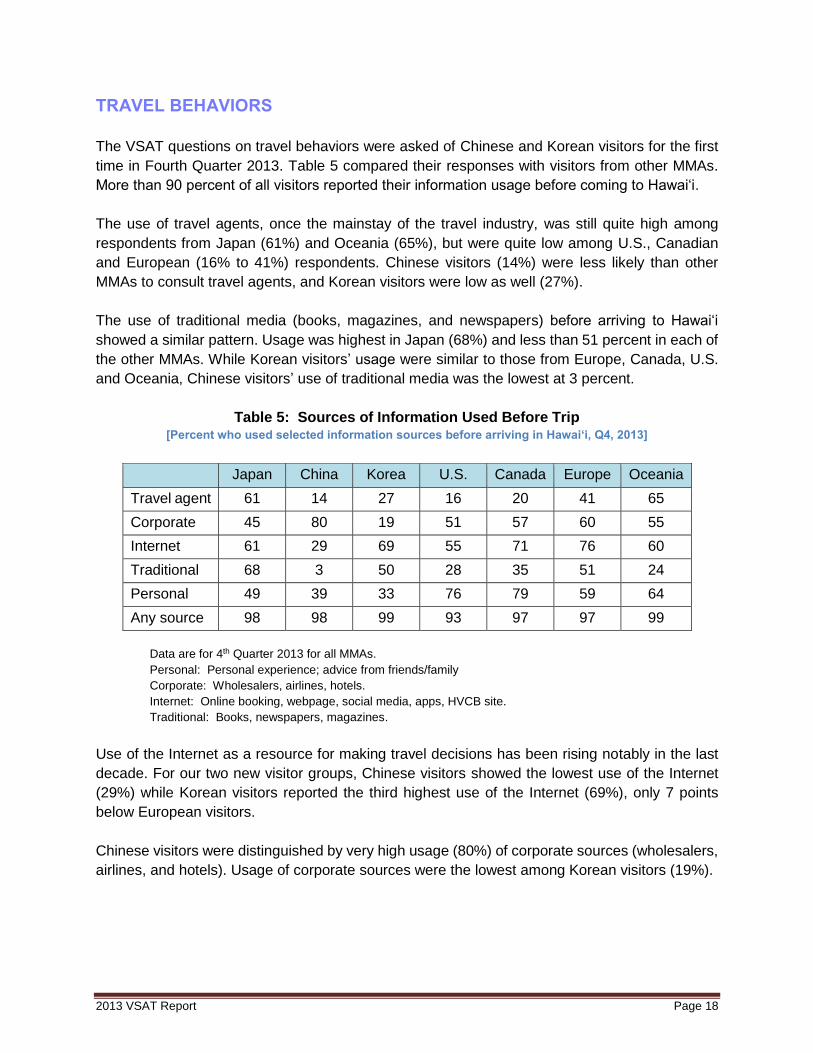
TRAVEL BEHAVIORS
The VSAT questions on travel behaviors were asked of Chinese and Korean visitors for the first
time in Fourth Quarter 2013. Table 5 compared their responses with visitors from other MMAs.
More than 90 percent of all visitors reported their information usage before coming to Hawai‘i.
The use of travel agents, once the mainstay of the travel industry, was still quite high among
respondents from Japan (61%) and Oceania (65%), but were quite low among U.S., Canadian
and European (16% to 41%) respondents. Chinese visitors (14%) were less likely than other
MMAs to consult travel agents, and Korean visitors were low as well (27%).
The use of traditional media (books, magazines, and newspapers) before arriving to Hawai‘i
showed a similar pattern. Usage was highest in Japan (68%) and less than 51 percent in each of
the other MMAs. While Korean visitors’ usage were similar to those from Europe, Canada, U.S.
and Oceania, Chinese visitors’ use of traditional media was the lowest at 3 percent.
Table 5: Sources of Information Used Before Trip [Percent who used selected information sources before arriving in Hawai‘i, Q4, 2013]
Japan China Korea U.S. Canada Europe Oceania
Travel agent 61 14 27 16 20 41 65
Corporate 45 80 19 51 57 60 55
Internet 61 29 69 55 71 76 60
Traditional 68 3 50 28 35 51 24
Personal 49 39 33 76 79 59 64
Any source 98 98 99 93 97 97 99
Data are for 4th Quarter 2013 for all MMAs.
Personal: Personal experience; advice from friends/family
Corporate: Wholesalers, airlines, hotels.
Internet: Online booking, webpage, social media, apps, HVCB site.
Traditional: Books, newspapers, magazines.
Use of the Internet as a resource for making travel decisions has been rising notably in the last
decade. For our two new visitor groups, Chinese visitors showed the lowest use of the Internet
(29%) while Korean visitors reported the third highest use of the Internet (69%), only 7 points
below European visitors.
Chinese visitors were distinguished by very high usage (80%) of corporate sources (wholesalers,
airlines, and hotels). Usage of corporate sources were the lowest among Korean visitors (19%).

2013 VSAT Report Page 19
5. ACTIVITY PARTICIPATION
A major objective of the VSAT survey is to monitor visitor activities6. Activities are the defining
elements of a vacation, the chief generator of visitor experience, and the ultimate measure of
consumption of our tourism product. The activities visitors choose when they travel tell us
something about their motives for being here and identify activities as targets for product
development. VSAT measures visitor participation for 50 different activities in seven different
geographic areas of the state. (See the companion Excel workbook of 2013 VSAT data tables
posted on the HTA website).
Figure 11: Visitor Activities by MMA, 2013
Sports activities and business activities were excluded from this figure.
6 The surveys of China and Korea visitors did not include questions related to activities.
0% 10% 20% 30% 40% 50% 60% 70% 80% 90% 100%
Entertainment activities
Cultural & historic activities
Sightseeing activities
Transportation activities
Beach & sun activities
Dining activities
Shopping activities
Canada U.S. East U.S. West Europe Oceania Japan
2013 VSAT Report Page 20
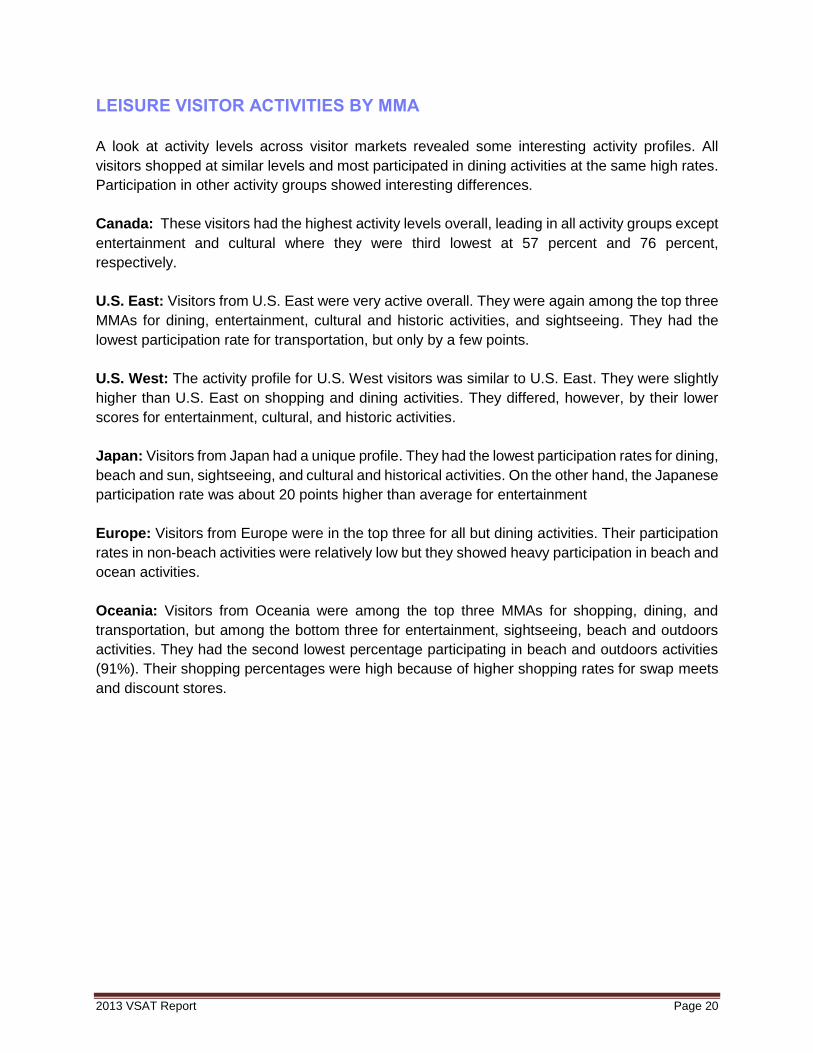
LEISURE VISITOR ACTIVITIES BY MMA
A look at activity levels across visitor markets revealed some interesting activity profiles. All
visitors shopped at similar levels and most participated in dining activities at the same high rates.
Participation in other activity groups showed interesting differences.
Canada: These visitors had the highest activity levels overall, leading in all activity groups except
entertainment and cultural where they were third lowest at 57 percent and 76 percent,
respectively.
U.S. East: Visitors from U.S. East were very active overall. They were again among the top three
MMAs for dining, entertainment, cultural and historic activities, and sightseeing. They had the
lowest participation rate for transportation, but only by a few points.
U.S. West: The activity profile for U.S. West visitors was similar to U.S. East. They were slightly
higher than U.S. East on shopping and dining activities. They differed, however, by their lower
scores for entertainment, cultural, and historic activities.
Japan: Visitors from Japan had a unique profile. They had the lowest participation rates for dining,
beach and sun, sightseeing, and cultural and historical activities. On the other hand, the Japanese
participation rate was about 20 points higher than average for entertainment
Europe: Visitors from Europe were in the top three for all but dining activities. Their participation
rates in non-beach activities were relatively low but they showed heavy participation in beach and
ocean activities.
Oceania: Visitors from Oceania were among the top three MMAs for shopping, dining, and
transportation, but among the bottom three for entertainment, sightseeing, beach and outdoors
activities. They had the second lowest percentage participating in beach and outdoors activities
(91%). Their shopping percentages were high because of higher shopping rates for swap meets
and discount stores.

2013 VSAT Report Page 21
LEISURE VISITOR ACTIVITIES BY ISLAND
Activity levels were calculated separately for each island. The data shown are the percentage of
visitors to each island who participated in at least one of the activities in each group at least once
during their stay on that island7.
Figure 12: Visitor Activities by Island, 2013
Sports activities and business activities are excluded from this figure.
7 Participation in activities on Moloka‘i and Lāna’i were omitted here due to low sample sizes. Statistics on the 50
activities for each of the six islands are reported in the companion Excel workbook of 2013 VSAT data. Note that
the data reported here for “Maui’ refer to activities only on the Island of Maui.
54%
73%
94%
94%
94%
93%
96%
54%
72%
98%
97%
96%
96%
96%
58%
72%
96%
97%
97%
96%
97%
59%
69%
93%
93%
90%
93%
98%
0% 10% 20% 30% 40% 50% 60% 70% 80% 90% 100%
Entertainment activities
Cultural & historic activities
Sightseeing activities
Transportation activities
Beach & sun activities
Dining activities
Shopping activities
O‘ahu Maui Kaua‘i Hawai‘I Island
2013 VSAT Report Page 22
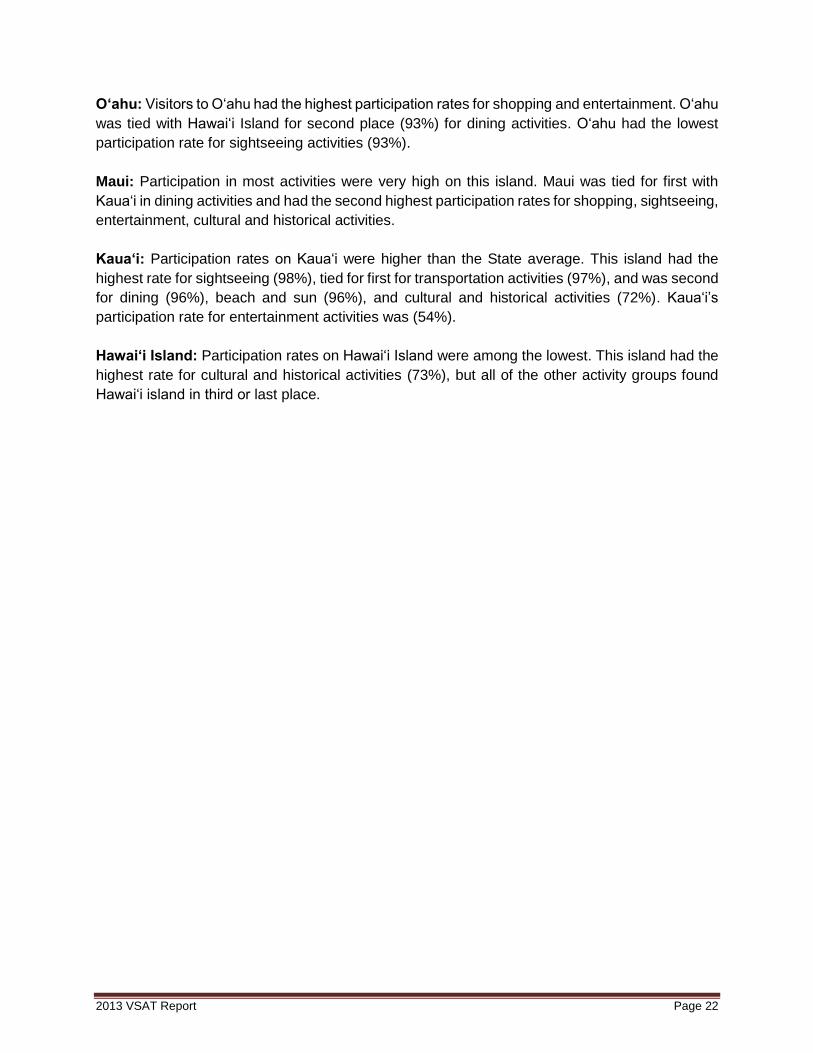
O‘ahu: Visitors to O‘ahu had the highest participation rates for shopping and entertainment. O‘ahu
was tied with Hawai‘i Island for second place (93%) for dining activities. O‘ahu had the lowest
participation rate for sightseeing activities (93%).
Maui: Participation in most activities were very high on this island. Maui was tied for first with
Kaua‘i in dining activities and had the second highest participation rates for shopping, sightseeing,
entertainment, cultural and historical activities.
Kaua‘i: Participation rates on Kaua‘i were higher than the State average. This island had the
highest rate for sightseeing (98%), tied for first for transportation activities (97%), and was second
for dining (96%), beach and sun (96%), and cultural and historical activities (72%). Kaua‘i’s
participation rate for entertainment activities was (54%).
Hawai‘i Island: Participation rates on Hawai‘i Island were among the lowest. This island had the
highest rate for cultural and historical activities (73%), but all of the other activity groups found
Hawai‘i island in third or last place.
2013 VSAT Report Page 23
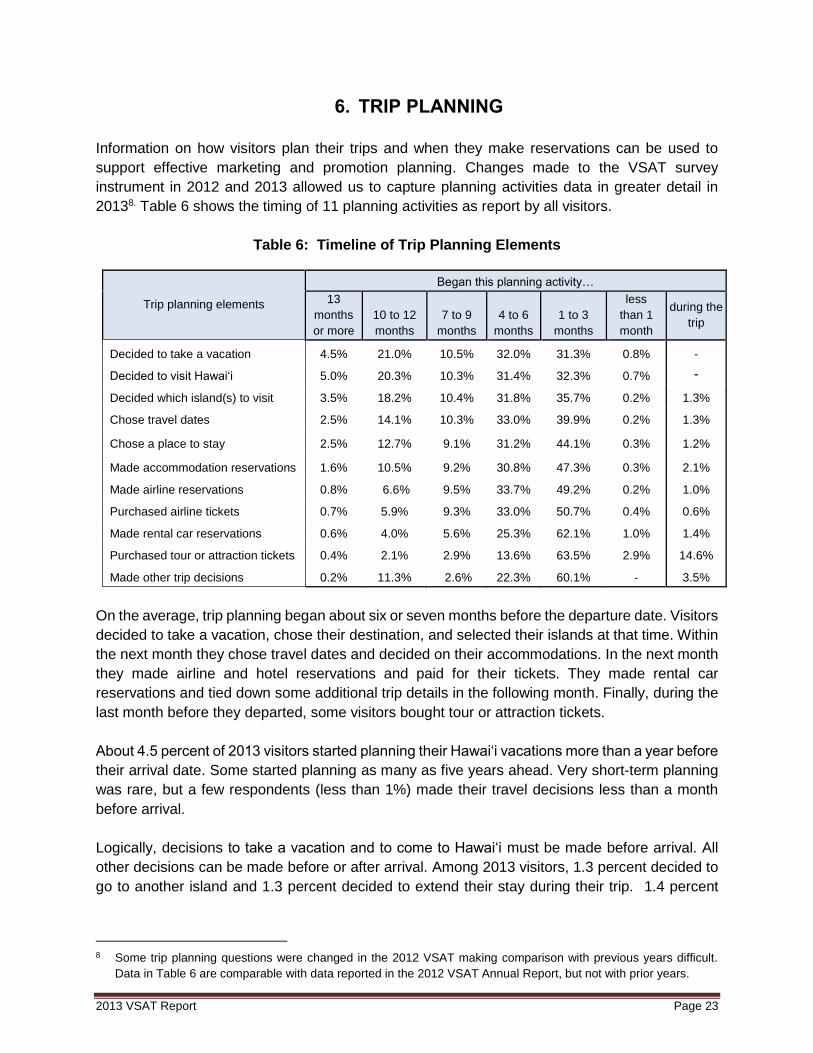
6. TRIP PLANNING
Information on how visitors plan their trips and when they make reservations can be used to
support effective marketing and promotion planning. Changes made to the VSAT survey
instrument in 2012 and 2013 allowed us to capture planning activities data in greater detail in
20138. Table 6 shows the timing of 11 planning activities as report by all visitors.
Table 6: Timeline of Trip Planning Elements
Trip planning elements
Began this planning activity…
13
months
or more
10 to 12
months
7 to 9
months
4 to 6
months
1 to 3
months
less
than 1
month
during the
trip
Decided to take a vacation 4.5% 21.0% 10.5% 32.0% 31.3% 0.8% -
Decided to visit Hawai‘i 5.0% 20.3% 10.3% 31.4% 32.3% 0.7% -
Decided which island(s) to visit 3.5% 18.2% 10.4% 31.8% 35.7% 0.2% 1.3%
Chose travel dates 2.5% 14.1% 10.3% 33.0% 39.9% 0.2% 1.3%
Chose a place to stay 2.5% 12.7% 9.1% 31.2% 44.1% 0.3% 1.2%
Made accommodation reservations 1.6% 10.5% 9.2% 30.8% 47.3% 0.3% 2.1%
Made airline reservations 0.8% 6.6% 9.5% 33.7% 49.2% 0.2% 1.0%
Purchased airline tickets 0.7% 5.9% 9.3% 33.0% 50.7% 0.4% 0.6%
Made rental car reservations 0.6% 4.0% 5.6% 25.3% 62.1% 1.0% 1.4%
Purchased tour or attraction tickets 0.4% 2.1% 2.9% 13.6% 63.5% 2.9% 14.6%
Made other trip decisions 0.2% 11.3% 2.6% 22.3% 60.1% - 3.5%
On the average, trip planning began about six or seven months before the departure date. Visitors
decided to take a vacation, chose their destination, and selected their islands at that time. Within
the next month they chose travel dates and decided on their accommodations. In the next month
they made airline and hotel reservations and paid for their tickets. They made rental car
reservations and tied down some additional trip details in the following month. Finally, during the
last month before they departed, some visitors bought tour or attraction tickets.
About 4.5 percent of 2013 visitors started planning their Hawai‘i vacations more than a year before
their arrival date. Some started planning as many as five years ahead. Very short-term planning
was rare, but a few respondents (less than 1%) made their travel decisions less than a month
before arrival.
Logically, decisions to take a vacation and to come to Hawai‘i must be made before arrival. All
other decisions can be made before or after arrival. Among 2013 visitors, 1.3 percent decided to
go to another island and 1.3 percent decided to extend their stay during their trip. 1.4 percent
8 Some trip planning questions were changed in the 2012 VSAT making comparison with previous years difficult.
Data in Table 6 are comparable with data reported in the 2012 VSAT Annual Report, but not with prior years.
2013 VSAT Report Page 24
made car reservations and 14.6 percent bought tour or attraction tickets during their stay in
Hawai‘i.
NEW INFORMATION FOR 2013
What is the extent of very early and very late planning among our visitors? Are there particular
types of visitors who tend to be early and late planners? Do early and late planners differ in terms
of what they do after they get here? All of these are questions previously asked of VSAT data.
Until now, the data were not detailed enough to answer them.
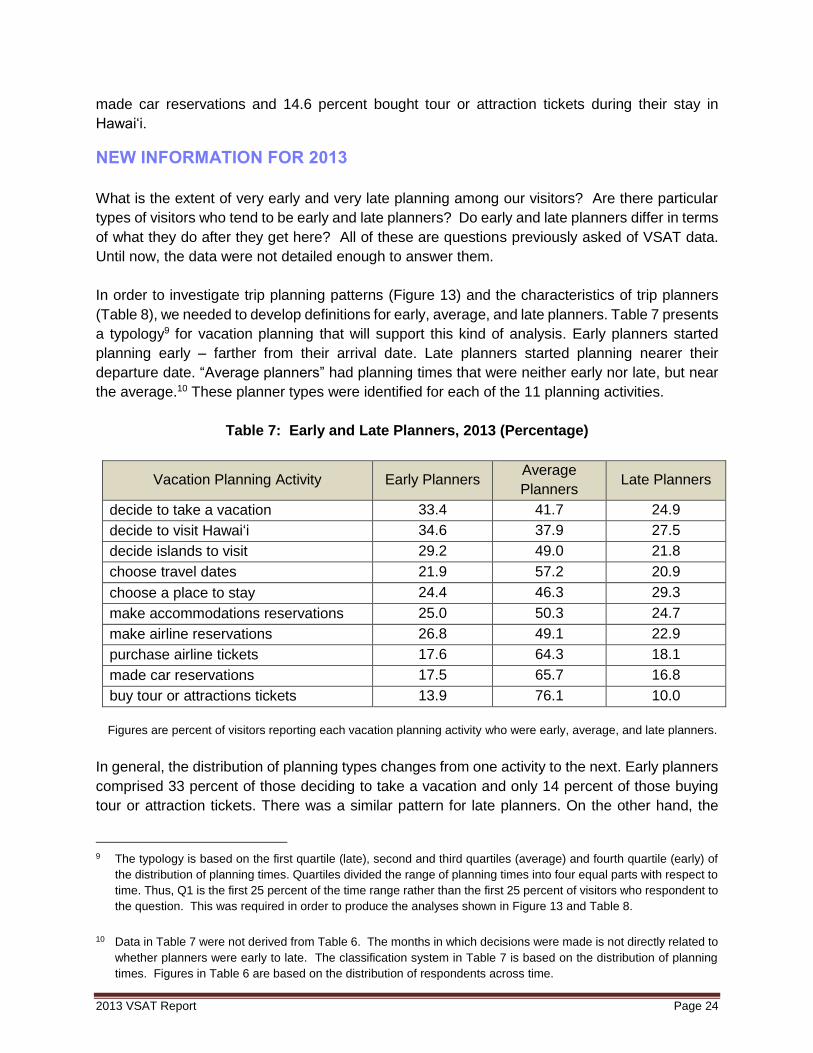
In order to investigate trip planning patterns (Figure 13) and the characteristics of trip planners
(Table 8), we needed to develop definitions for early, average, and late planners. Table 7 presents
a typology9 for vacation planning that will support this kind of analysis. Early planners started
planning early – farther from their arrival date. Late planners started planning nearer their
departure date. “Average planners” had planning times that were neither early nor late, but near
the average.10 These planner types were identified for each of the 11 planning activities.
Table 7: Early and Late Planners, 2013 (Percentage)
Vacation Planning Activity Early Planners Average
Planners Late Planners
decide to take a vacation 33.4 41.7 24.9
decide to visit Hawai‘i 34.6 37.9 27.5
decide islands to visit 29.2 49.0 21.8
choose travel dates 21.9 57.2 20.9
choose a place to stay 24.4 46.3 29.3
make accommodations reservations 25.0 50.3 24.7
make airline reservations 26.8 49.1 22.9
purchase airline tickets 17.6 64.3 18.1
made car reservations 17.5 65.7 16.8
buy tour or attractions tickets 13.9 76.1 10.0
Figures are percent of visitors reporting each vacation planning activity who were early, average, and late planners.
In general, the distribution of planning types changes from one activity to the next. Early planners
comprised 33 percent of those deciding to take a vacation and only 14 percent of those buying
tour or attraction tickets. There was a similar pattern for late planners. On the other hand, the
9 The typology is based on the first quartile (late), second and third quartiles (average) and fourth quartile (early) of
the distribution of planning times. Quartiles divided the range of planning times into four equal parts with respect to
time. Thus, Q1 is the first 25 percent of the time range rather than the first 25 percent of visitors who respondent to
the question. This was required in order to produce the analyses shown in Figure 13 and Table 8.
10 Data in Table 7 were not derived from Table 6. The months in which decisions were made is not directly related to
whether planners were early to late. The classification system in Table 7 is based on the distribution of planning
times. Figures in Table 6 are based on the distribution of respondents across time.

2013 VSAT Report Page 25
number of average plans, those closer to the average or mean planning time, increased from 42
to 76 percent from first to the last planning activity.
As we move down the list of travel planning activities, there is less and less deviation from the
average planning time. The timing of the decision to come to Hawai‘i showed wide variation. Some
visitors started years ahead of time and others started only a few months ahead of their departure
dates. Closer to arrival, we find that 66 percent of respondents made car reservations in the
“average planner” time of about three months (Figure 13).
It was difficult to define “early planners” based on a single planning activity. As we moved from
one end of the planning cycle to the next, the mean values of the planning times decreased and
the distribution11 around the means decreased as well.
Figure 13: Timing of Planning Decisions, 2013
Data in this Figure are shown in Table 7. This figure is not related in any way to Table 6.
Figure 13 presents a schematic chart of planning activities among Hawai‘i visitors in 2013 with
both axes to scale. The vertical axis showed the number of months before arriving in Hawai‘i12.
11 The distributions are also not normal, but are leptokurtic and skewed hard left. This was the basis of our decision
to use the first and third quartiles for our assignment of early and late planner status.
12 The last nine activities included post-arrival dates. For instance, visitors may have decided to visit another island
after they arrived at their port of entry and many visitors purchased attraction tickets after arrival (Table 7). None of
2013 VSAT Report Page 26
The horizontal axis showed the 11 planning activities placed in order of days prior to arrival in
Hawai‘i. The farthest point to the right on the horizontal axis represented the mean arrival date
and the number of days before arrival increases as you move leftward on the scale.
Red circles on the graph showed the mean planning date for all visitors on each planning activity.
The lower set of diamonds represented the mean number of months before arrival for late
planners and the top set of diamonds marked the mean number of months before arrival for early
planners. The length of the line connecting them represented the average planner time.
Figure 13 showed the continuous but uneven progress of trip planning through the 11 activities.
It also illustrated that variation in planning time decreased as the process gets closer to the actual
date of arrival in Hawai‘i.
Setting up the classification system for early and late planners also provided the basis for
investigating the characteristics of early and late planners. Our plan made use of a gross empirical
strategy. We tested the relationship between planning time and a series of about 25 attributes of
2013 visitors and their vacations. Table 8 presents the average percentages of early and late
planners for each of the 11 visitor characteristics and the differences between them.
Table 8: Characteristics of Early and Late Planners
Characteristic Early Planners Late Planners Difference
Owns a timeshare unit in Hawai‘i 40 12 -28
Played golf in Hawai‘i 28 17 -11
Visitor from Oceania 27 11 -16
Visitor from Europe 25 18 - 7
Employment status is retired 24 19 - 5
No prior trips outside home state 19 31 12
First-time visitor 17 26 9
Visitor is a student 12 29 17
Traveling for business 12 28 17
Visiting friends and relatives 11 27 16
Visitor from Japan 11 29 18
18 to 24 years of age 11 33 22
Data in this table are based on the classification system described in Table 7 and shown in Figure 13. This table
is not related in any way to Table 6.
The mean planning times in Figure 13 was after the arrival date. The left-hand scale expresses mean activity times
in terms of “months before arrival”. The calculations included cases for which the respondent reported activities
that occurred after arrival. The means were never negative, that is, they were always before arrival.
2013 VSAT Report Page 27
The single most definitive characteristic that distinguished early and late planners was ownership
of a timeshare unit. The data showed that 40 percent of timeshare owners were early planners
and 12 percent were late planners. The difference of 28 points put them at the top of the list.
Several other types of visitors were more likely to be early rather than late planners. Golfers were
early planners and so were older and retired visitors. Visitors from Oceania and Europe were also
early planners.
The most distinguishing characteristic of late planners was youth. Young people were much more
likely to plan late, as were visitors who were students. About 12 percent of business travelers
were early planners and 28 percent were late planners. Business trips appeared to be put together
in shorter time periods than trips for other purposes.
In 2013, Japanese visitors were more likely to be late rather than early planners, consistent with
previous VSAT reports. People who were in Hawai‘i primarily to visit friends and relatives took
less time to plan. Finally, we saw that travel experience counts. First-time visitors to Hawai‘i were
more likely to be late planners, as were those who have not made any trips outside their home
state in the three years prior to this trip.
7. FIRST-TIME AND REPEAT VISITORS
In 2012, we investigated the activity patterns for visitors who were staying with friends and
relatives (SWFR) and those who visited for other purposes. We found that the two groups had
different activity patterns and suggested that SWFR visitors should be excluded from or at least
singled out in future activities research.
For 2013, we analyzed activity patterns for first-time and repeat visitors. Visitor industry marketing
often distinguishes between these two groups for marketing, communications, and advertising
planning. Common wisdom suggests they might have different motivations, different experiences,
and different activities while on their trips. Their satisfaction levels have been different in the past
and this year we found they have different trip planning behaviors. In addition, we had several
requests for information on the activities of these two groups during the year.
ACTIVITIES FOR FIRST-TIME AND REPEAT VISITORS
Figure 14 presents visitor activities for these two groups in 2013. The initial finding was that both
first-time and repeat visitors participated in all activities. On some of the more popular activities,
like swimming and sunbathing, the two groups showed almost identical participation rates. The
largest difference between the first-time and repeat visitors was about 26 points (50 percent of
first-time and 24 percent of repeat visitors took bus or van tours in 2013). So, superficially, there
was more similarity than difference between the activity patterns of first-time and repeat visitors.

2013 VSAT Report Page 28
Figure 14: Statewide Activity Participation, First-time and Repeat Visitors, 2013
0 20 40 60 80 100 120
0 10 20 30 40 50 60 70 80 90
Prepared own meal
Supermarkets
Fine dining
Running/jogging/fitness walking
Self-guided/DriveAroundIsland
Farmers Market
Golf
Art/craft fair
Family restaurant/diner
Surfing/bodyboarding/paddleboarding
Local shops/artisans
Museum/art gallery
Visit Communities
Cafe/Coffee House
Canoeing/kayaking
Spa
Play/concert/theatre
Sports event/tournament
Festivals
Discount/outlet stores
Designer boutiques
Swap meet/Flea market
Ukulele Lessons
Ethnic dining
Jet skiing/parasailing/windsurfing
Beach/sunbathing/swimming
Mall/Department stores
Snorkeling/scuba diving
Lessons, Hula/Canoeing
StateParks/BotanicalGardens
Convenience Stores
Agritourism
Nightclub/dancing/bar/karaoke
Hotel stores
Public Bus
Movie/TV film location
Other historic site
Helicoptor/Airplane Tour
Fast Food
Backpacking/hiking/camping
Duty Free stores
ScenicViews/NaturalLandmarks
Boat/Submarine Tour, WhaleWatching
Trolley
Live music/stage show
Lunch/sunset/dinner/evening cruise
Airport Shuttle
Polynesian show/hula
Luau
Historic military site
Limo, Van/Bus Tour
Tour Bus/Tour Van
Scale for Discriminant Score
Scale for Percent of Visitors Participating
Repeat Visitors
1st Time Visitors
Discriminant Score
2013 VSAT Report Page 29
We are looking for a set of activities that are statistically different for first-time and repeat visitors.
Multiple group discriminate analysis provides a way to quickly identify activities that discriminate
between first-time and repeat visitors. We used the technique to generate a set of discriminant
scores13 for each of the 50 VSAT activities14. Those scores measure the extent to which each
activity is capable of distinguishing between our two groups from high to low.
Figure 14 presents the 50 activities measured in the 2013 VSAT survey. For each one we showed
the percent of first-time visitors who participated in the activity, the percent of repeat visitors who
participated in that activity and the value of the discriminant score. The items were arranged first
according to the extent to which first-time visitor usage exceeded repeat visitor use. Within that
classification, items were sorted by discriminant scores, descending for first-time and ascending
for repeat visitors.
First-time visitors: This group differed from repeat visitors in that they went on sightseeing tours
dinner cruises and ventured out on their own to look at scenic views and natural landmarks. They
also took air and helicopter tours, submarine rides, and visited film locations. First-time visitors
saw historical military sites (Pearl Harbor and others), and Polynesian or hula shows (Polynesian
Cultural Center and individual hotel shows). They went to luau and ate fast food. They took the
airport shuttle and rode visitor trolleys. To a lesser extent, they shopped in hotel stores, went
nightclubbing, and did some hiking. In short, those activities heavily advertised in visitor
publications and designed specifically for visitor consumption, were what first-time visitors did that
distinguishes them, from repeat visitors.
Repeat visitors: These visitors were more likely to prepare their own meals and shopped at
supermarkets, but also splurged in a more costly evening of fine dining. They rented cars and did
their own sightseeing and went surfing or body boarding, played golf, and maybe even got out
into the communities. They were more likely than first-time visitors to show up at a farmer’s
market, a crafts fair, a museum or a local arts and crafts shop. They were also distinguished by
participating much less in all those things that identify first-time visitors. We might suggest that
repeat visitors were distinguished by their tendency to act less like visitors and more like local
residents.
In between are some activities which both groups participated at roughly equal rates. Everybody
shopped and everybody got into the ocean. Not too many tourists went to the swap meet, but
among those who did, first-time and repeat visitors were evenly represented. This year the middle
list splits between ethnic dining (which gave a very tiny edge to first-timers) and ukulele lessons
(which were favored by repeat visitors by an equally small margin).
Results may also indicate that Hawai‘i products and activities catered more to first-timers than to
repeat visitors. We might think of classifying the list of activities according to the number of
advertisements that appeared for each in visitor publications each month or the number of visitor
industry dollars invested in development of each activity. Perhaps industry investment in items at
13 The standardized canonical discriminant function coefficient for the independent variables.
14 The activities were simplified by scoring them as 1 if the respondent had participated in that activity at least once
on any island during the most recent trip to Hawai‘i, and 0 if they had not.

2013 VSAT Report Page 30
the top of the list would be greater than investment in items nearer the bottom of the list. No
evidence of this type is available in the data we have now. Nevertheless, the findings may be
useful to those with an interest in visitor industry product development.
ACCOMMODATIONS FOR FIRST-TIME AND REPEAT VISITORS
The description of the two groups in terms of their characteristic activities prompted us to look into
the accommodations favored by each. If activities could be classified according to the relative
extent of participation by first-time and repeat visitors, perhaps the two groups use
accommodations in different ways as well. In particular, we wanted to look at the possibility that
first-time visitors were more likely to choose hotels than other accommodations. Figure 15 shows
the results of that effort.
Figure 15: Accommodations for First-time and Repeat Visitors
First time visitors were more likely to choose hotels than were repeat visitors. They were also
more likely to stay on cruise ships or stay at a bed and breakfast. Repeat visitors were more likely
to stay in condominiums or condominium hotels, timeshare units or other locations. Recall that
our analysis excluded visitors who came to stay with friends and relatives.
7.3%
4.6%
5.0%
6.6%
7.9%
10.7%
57.7%
17.4%
10.6%
2.0%
8.1%
13.8%
5.2%
42.9%
0% 10% 20% 30% 40% 50% 60% 70%
other
Timeshare
B&B
vacation rental
condo
cruise ship
hotel
repeat visitors 1st time visitors
2013 VSAT Report Page 31
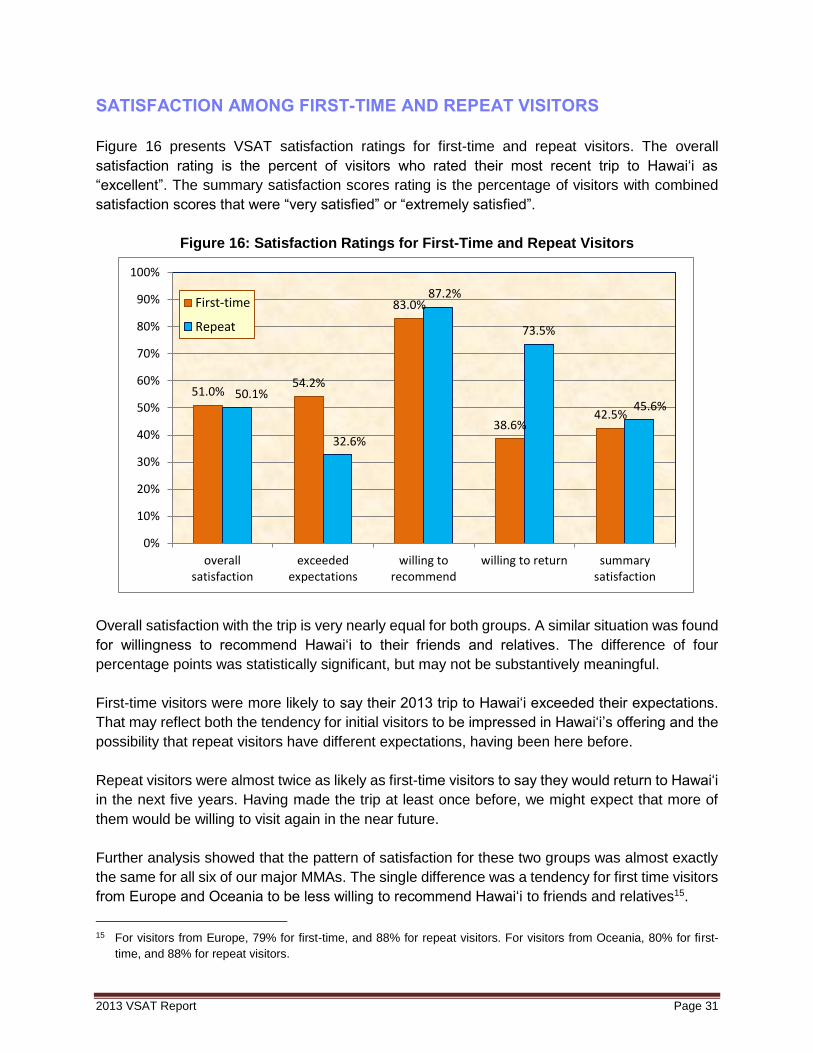
SATISFACTION AMONG FIRST-TIME AND REPEAT VISITORS
Figure 16 presents VSAT satisfaction ratings for first-time and repeat visitors. The overall
satisfaction rating is the percent of visitors who rated their most recent trip to Hawai‘i as
“excellent”. The summary satisfaction scores rating is the percentage of visitors with combined
satisfaction scores that were “very satisfied” or “extremely satisfied”.
Figure 16: Satisfaction Ratings for First-Time and Repeat Visitors
Overall satisfaction with the trip is very nearly equal for both groups. A similar situation was found
for willingness to recommend Hawai‘i to their friends and relatives. The difference of four
percentage points was statistically significant, but may not be substantively meaningful.
First-time visitors were more likely to say their 2013 trip to Hawai‘i exceeded their expectations.
That may reflect both the tendency for initial visitors to be impressed in Hawai‘i’s offering and the
possibility that repeat visitors have different expectations, having been here before.
Repeat visitors were almost twice as likely as first-time visitors to say they would return to Hawai‘i
in the next five years. Having made the trip at least once before, we might expect that more of
them would be willing to visit again in the near future.
Further analysis showed that the pattern of satisfaction for these two groups was almost exactly
the same for all six of our major MMAs. The single difference was a tendency for first time visitors
from Europe and Oceania to be less willing to recommend Hawai‘i to friends and relatives15.
15 For visitors from Europe, 79% for first-time, and 88% for repeat visitors. For visitors from Oceania, 80% for first-
time, and 88% for repeat visitors.
51.0%54.2%
83.0%
38.6%42.5%
50.1%
32.6%
87.2%
73.5%
45.6%
0%
10%
20%
30%
40%
50%
60%
70%
80%
90%
100%
overallsatisfaction
exceededexpectations
willing torecommend
willing to return summarysatisfaction
First-time
Repeat
2013 VSAT Report Page 32
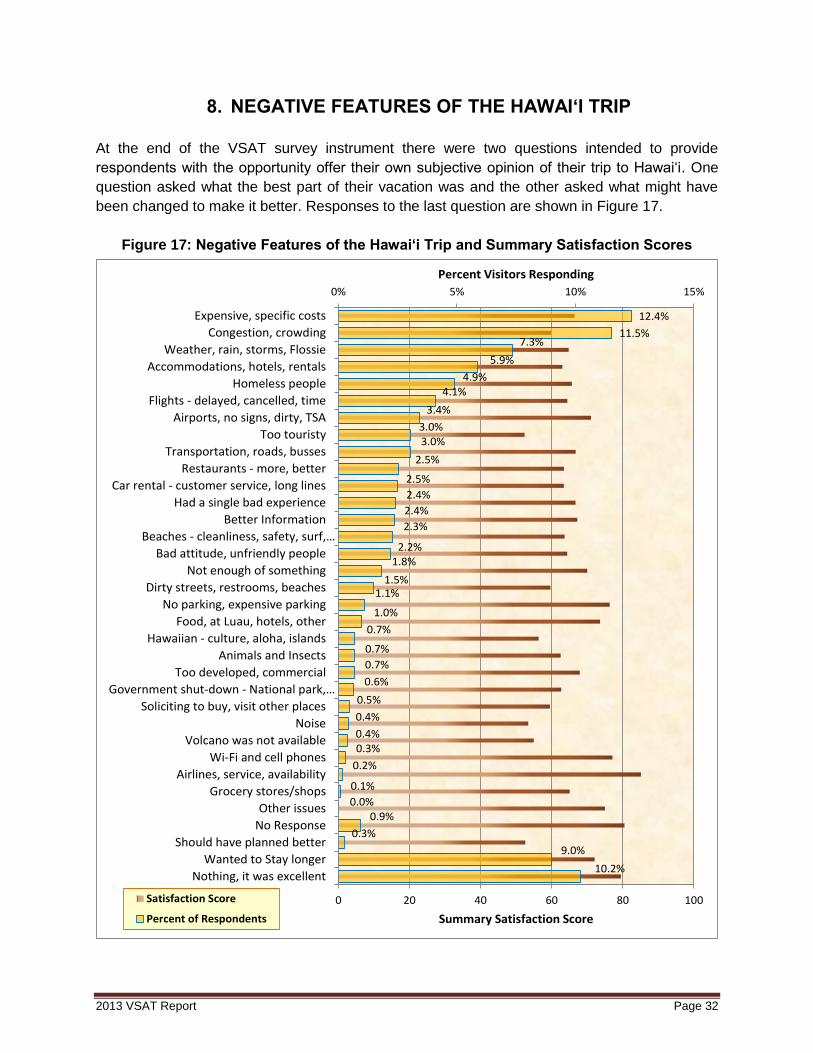
8. NEGATIVE FEATURES OF THE HAWAI‘I TRIP
At the end of the VSAT survey instrument there were two questions intended to provide
respondents with the opportunity offer their own subjective opinion of their trip to Hawai‘i. One
question asked what the best part of their vacation was and the other asked what might have
been changed to make it better. Responses to the last question are shown in Figure 17.
Figure 17: Negative Features of the Hawai‘i Trip and Summary Satisfaction Scores
10.2%
9.0%
0.3%
0.9%0.0%
0.1%
0.2%
0.3%0.4%
0.4%
0.5%
0.6%
0.7%
0.7%
0.7%
1.0%
1.1%1.5%
1.8%2.2%
2.3%
2.4%
2.4%
2.5%
2.5%
3.0%3.0%
3.4%
4.1%4.9%
5.9%
7.3%11.5%
12.4%
0% 5% 10% 15%
0 20 40 60 80 100
Nothing, it was excellent
Wanted to Stay longer
Should have planned better
No Response
Other issues
Grocery stores/shops
Airlines, service, availability
Wi-Fi and cell phones
Volcano was not available
Noise
Soliciting to buy, visit other places
Government shut-down - National park,…
Too developed, commercial
Animals and Insects
Hawaiian - culture, aloha, islands
Food, at Luau, hotels, other
No parking, expensive parking
Dirty streets, restrooms, beaches
Not enough of something
Bad attitude, unfriendly people
Beaches - cleanliness, safety, surf,…
Better Information
Had a single bad experience
Car rental - customer service, long lines
Restaurants - more, better
Transportation, roads, busses
Too touristy
Airports, no signs, dirty, TSA
Flights - delayed, cancelled, time
Homeless people
Accommodations, hotels, rentals
Weather, rain, storms, Flossie
Congestion, crowding
Expensive, specific costs
Percent Visitors Responding
Summary Satisfaction Score
Satisfaction Score
Percent of Respondents

2013 VSAT Report Page 33
Respondents were allowed to offer as many comments as they wished, so percentages will not
sum to 100%. Some examples were:
“Beaches: cleanliness, safety, surf problems” – general comments that beaches were not
what was expected.
“Government shut-down- National parks, other” – some said it interfered with park
attendance, other mentioned the shut-down in a general or generic sense.
In all, about 18.4 percent of all the VSAT survey respondents offered opinions on what might be
changed to make their trip better16. About 20 percent of them offered no negatives. Instead, they
used the opportunity to tell us that everything was fine, that the only thing that could have changed
for the better would be to extend their stay, or that the only hitch in their trips was that they had
planned incorrectly and would do better next time. The remaining 13 percent of the respondents
offered the results shown in Figure 17.
The first four items on the list accounted for the majority of the comments. Cost was always an
issue. Crowding was an international tourism problem, weather was an issue for any sunny
destination, and accommodations were the single most important element of vacation satisfaction.
All four of those items also had average summary satisfaction scores at or near the average of
61. That suggests that, while these items caused a major part of the issues reported by our
visitors, they may not be associated with dissatisfaction. “Homeless people” is item number five
on the list. It was cited by 4.9 percent of those who offered any comment about what could be
done to make the trip to Hawai‘i better for the visitor.
REASONS FOR NOT RETURNING
One of the main satisfaction items was “How likely are you to return to visit Hawai‘i in the next
five years?” Respondents who reported that they were “not very likely” or “not at all likely” to
return were asked to give the reason that was so. A list of 11 reasons was offered in the survey
and the respondents were asked to check all that apply. Finally, an “Other” category was offered
with space for the respondent to specify what that other reason might be. The responses for the
first 11 items are shown in Figure 18.
In 2013, 16.1 percent of VSAT respondents said that they did not expect to return to Hawai‘i in
the next five years. Of those, nearly all (99.5%) offered at least one reason for not returning.
The first five items at the top of Figure 18 are “barriers” to returning. They are conditions of the
marketplace, or characteristics of the traveler. They do not reflect any failing on the part of the
destination and do not suggest a need to change or improve our visitor product. About 55
percent17 of all of those who will not return in the next five years mentioned one of those barriers.
16 Based on a total visitor population of 7,427,178 visitors in 2013 that would represent the opinions of about 652,000
visitor party heads covering a total of about 1.37 million visitors in their travel parties.
17 The unduplicated count of respondents who mentioned one or more of the barriers.
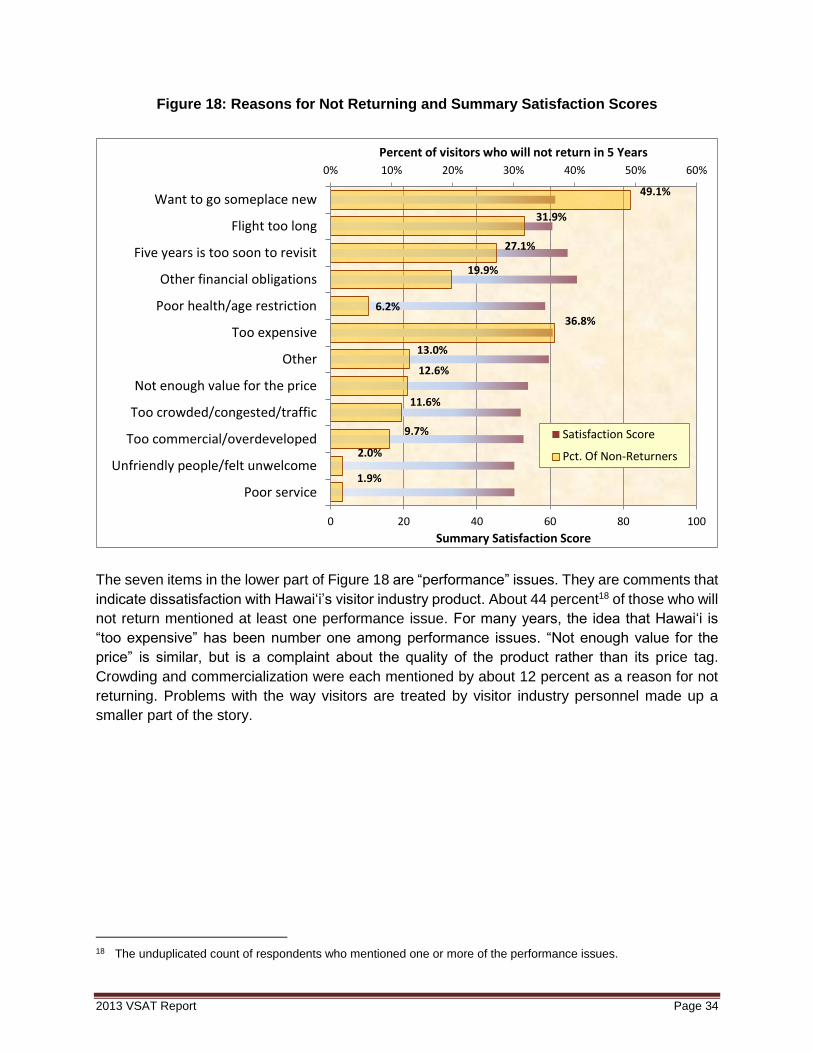
2013 VSAT Report Page 34
Figure 18: Reasons for Not Returning and Summary Satisfaction Scores
The seven items in the lower part of Figure 18 are “performance” issues. They are comments that
indicate dissatisfaction with Hawai‘i’s visitor industry product. About 44 percent18 of those who will
not return mentioned at least one performance issue. For many years, the idea that Hawai‘i is
“too expensive” has been number one among performance issues. “Not enough value for the
price” is similar, but is a complaint about the quality of the product rather than its price tag.
Crowding and commercialization were each mentioned by about 12 percent as a reason for not
returning. Problems with the way visitors are treated by visitor industry personnel made up a
smaller part of the story.
18 The unduplicated count of respondents who mentioned one or more of the performance issues.
1.9%
2.0%
9.7%
11.6%
12.6%
13.0%
36.8%6.2%
19.9%
27.1%
31.9%
49.1%
0% 10% 20% 30% 40% 50% 60%
0 20 40 60 80 100
Poor service
Unfriendly people/felt unwelcome
Too commercial/overdeveloped
Too crowded/congested/traffic
Not enough value for the price
Other
Too expensive
Poor health/age restriction
Other financial obligations
Five years is too soon to revisit
Flight too long
Want to go someplace new
Percent of visitors who will not return in 5 Years
Summary Satisfaction Score
Satisfaction Score
Pct. Of Non-Returners

2013 VSAT Report Page 35
9. SURVEY METHODOLOGY
VSAT MAIL AND WEB SURVEY METHODS
The Visitor Satisfaction and Activity Survey was designed to measure visitor satisfaction with the
State of Hawai‘i as a vacation destination and to obtain information on visitor activities and trip
planning behaviors.
Two versions of the VSAT survey instrument were used: one in English and the other in Japanese.
Both survey instruments had exactly the same content. The 2013 survey has six pages and 28
questions. Copies of these two surveys instruments are presented in the appendix to this report.
The U.S. samples were drawn from the list of completed Domestic In-Flight Survey forms.
Samples of Japanese, Canadian, European, and Oceania visitors were drawn from the list of
completed International Departure Survey forms and from completed Domestic In-Flight Survey
forms. These two sample lists were purged of forms with missing, incomplete, or unreadable
addresses. The resulting confirmed address files became the sampling frames for U.S. and
international samples. Both frames were stratified by MMA, month, visitor status (first-time vs.
repeat), and islands visited (O‘ahu vs. Neighbor Islands). Samples were selected independently
each month. The sample sizes for each MMA were calculated to produce roughly equal sampling
errors based on results of surveys from previous years.
Survey forms were mailed to a sample of visitors from U.S. West, U.S. East, Japanese, Canada,
Europe, and Oceania after they returned home from their trip to Hawai‘i. Respondents completed
forms and returned them in postage-paid envelopes supplied for that purpose. In 2013, English
and Japanese-speaking respondents were also given the option of filling out the VSAT
questionnaire online.
Table 9: Response Rates and Sample Statistics, VSAT 2013
MMA Arrivals Mailed
Returned or
completed online Sample Response Sample
number Pct. number Pct. number Pct. Fraction Rate Error
U.S. West 3,211,429 43.1% 13,668 22.1% 3,518 20.5% 0.11% 25.7% 1.44
U.S. East 1,701,852 22.8% 12,342 20.0% 3,415 19.9% 0.20% 27.7% 1.50
Canada 517,011 6.9% 11,682 18.9% 3,075 17.9% 0.59% 26.3% 1.55
Japan 1,518,517 20.4% 11,076 17.9% 3,541 20.6% 0.23% 31.9% 1.53
Europe 136,805 1.8% 6,495 10.5% 1,730 10.1% 1.26% 26.6% 2.07
Oceania 355,568 4.7% 6,501 10.5% 1,854 10.8% 0.52% 28.5% 2.05
Total 7,441,181 100.0% 61,764 100.0% 17,133 100.0% 0.18% 27.4% 0.67
The overall survey response rate for 2013 was 27.74 percent. That produced a sample error
estimate of plus-or-minus 0.67 percentage points at the 95 percent confidence level. Response
rates for individual MMAs ranged from a low of 25.7 percent (+ 1.4 percentage points) for U.S.
West visitors to a high of 32 percent (+ 1.5 percentage points) for our Japanese visitors.
2013 VSAT Report Page 36
VSAT AIRPORT INTERCEPT SURVEYS, CHINA AND KOREA MMAS
In the fall of 2013, HTA began a trial VSAT survey to cover visitors from China and Korea. The
survey took the form of an airport intercept interview. The methods used are described below.
Background
Continued lower than expected response among the Korean and Chinese visitor segments to the
established mail, self-administered Visitor Satisfaction Survey necessitated the need for a new
approach to gathering feedback regarding their Hawai‘i visit from these visitors.
In response, OmniTrak Group, Inc. suggested a new approach to gathering this feedback, using
an in-person, interviewer-administered methodology. After careful consideration, the Hawaii
Tourism Authority and the current VSAT vendor agreed to this new approach.
In order to provide HTA with a suitable sample for analysis purposes, a target of 400 completed
surveys among each visitor segment and over the period of September 2013 – December 2013
was approved.
Methodology
A random intercept of departing Chinese (Mainland China, Hong Kong, and Macau) and Korean
visitors was agreed upon. At departure lounges and holding areas of selected outbound
international flights to Korea and China destinations, every “nth” visitor was approached and if
qualified, invited to participate in the survey effort. Selected visitors were screened to ensure each
was:
A resident of Korea or China (Mainland China, Hong Kong and Macau)
A visitor to Hawai‘i for more than 24 hours but less than 30 days
Appear to be 18 years of age or older
Once deemed qualified, the visitor was engaged in a brief survey, conducted by a professional
research interviewer, fluent in the Chinese or Korean language.
Selected respondents were not engaged in any other survey effort.
Staffing
Field interviewers selected for this project were:
Primary Mandarin or Korean speaking;
Currently assigned to the HTA International or Island survey effort
Required to attend a field training covering:
Proper approach to respondent selection
Proper administration of the survey
Utilizing techniques for a proper field edit for logic and completeness
Utilize techniques for refusal avoidance

2013 VSAT Report Page 37
Scheduling
The monthly schedule used for the International Visitor survey effort was utilized for this survey
effort. Outbound flights to Korea and specific China destinations were highlighted and targeted.
Data collection was took place over the entire month to ensure a good cross-section of outbound
visitors was captured.
Survey Instrument
The current survey instruments were revised as needed for the following:
Methodology – Question text revised as necessary to accommodate an interviewer-administered
methodology
Length – Reduction in length from the current 6-page length to a 4-page length
Relevancy – Agreement made on specific questions to be retained or cut
The final survey was revised, reformatted, translated, and sent to all parties involved for review
and approval. A standard pre-test for flow, understandability, length and appropriate translation,
was conducted. The approved questionnaires were then sent to print.
Show cards required for selected questions were formatted, translated, and produced.
Production
The overall target of n=400 interviews among each visitor segment was achieved with the
breakdown by month as follows:
Table 10: Response Rates for China and Korea, VSAT 2013
Korean China Total
September 132 152 284
October 137 116 253
November 67 69 136
December 70 70 140
Totals 406 407 813
Data Cleaning/Processing/Submission
After confirming the data layout’s compatibility to the VSAT vendor’s layout, completed surveys
were formally edited for logic and completes, scanned and 100% verified. The data was then
cleaned using developed cleaning syntax and the final data set was submitted to the VSAT vendor
by the 15th of the month following data collection.

2013 VSAT Report Page 38
10. APPENDIX

2013 VSAT Report Page 39
ENGLISH LANGUAGE VSAT SURVEY FORM, 2013

2013 VSAT Report Page 40
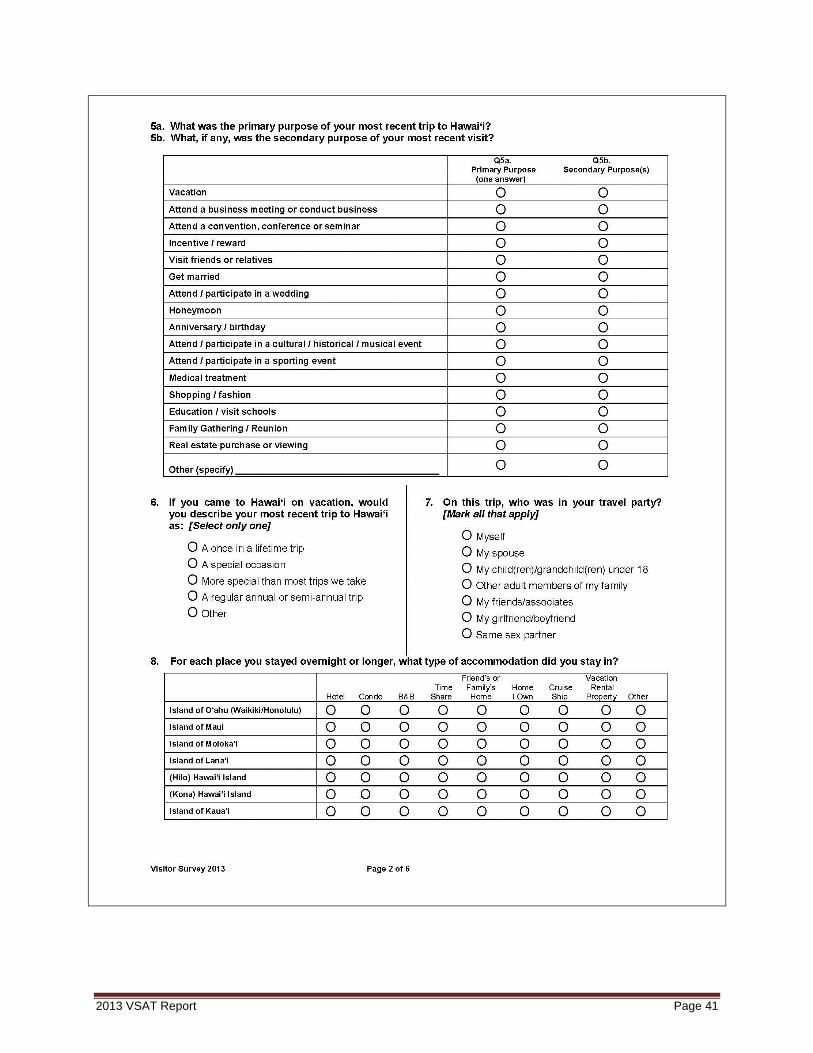
2013 VSAT Report Page 41

2013 VSAT Report Page 42
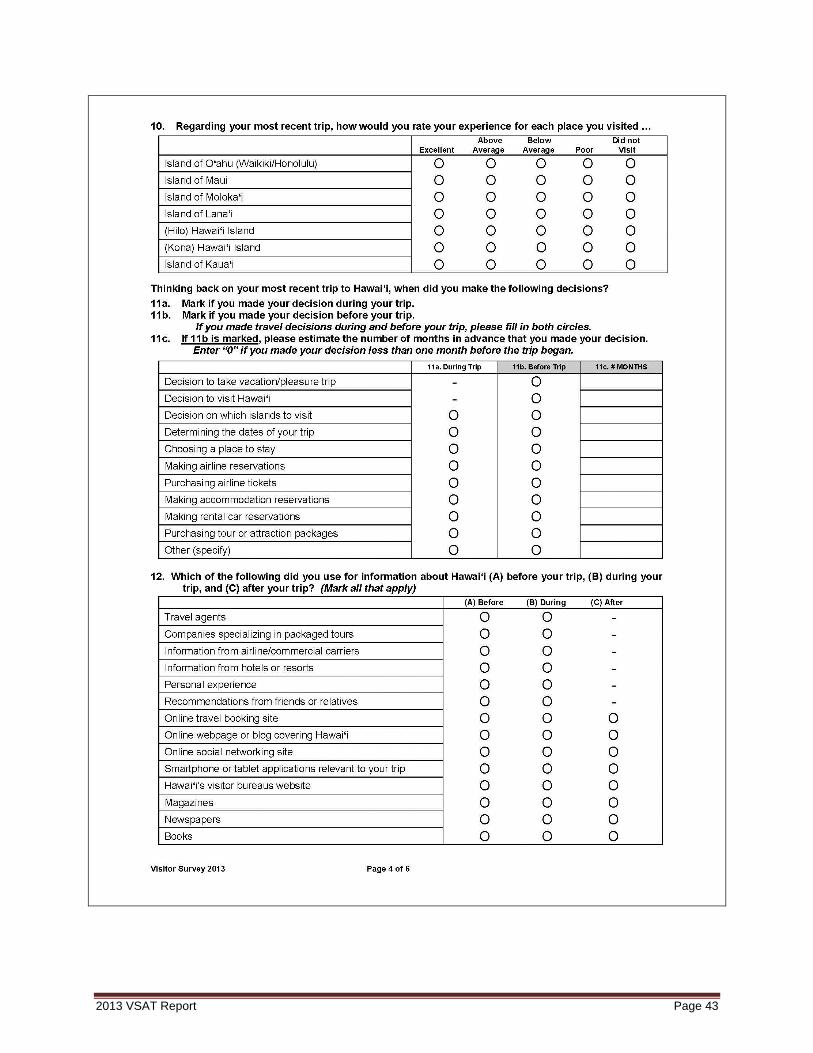
2013 VSAT Report Page 43
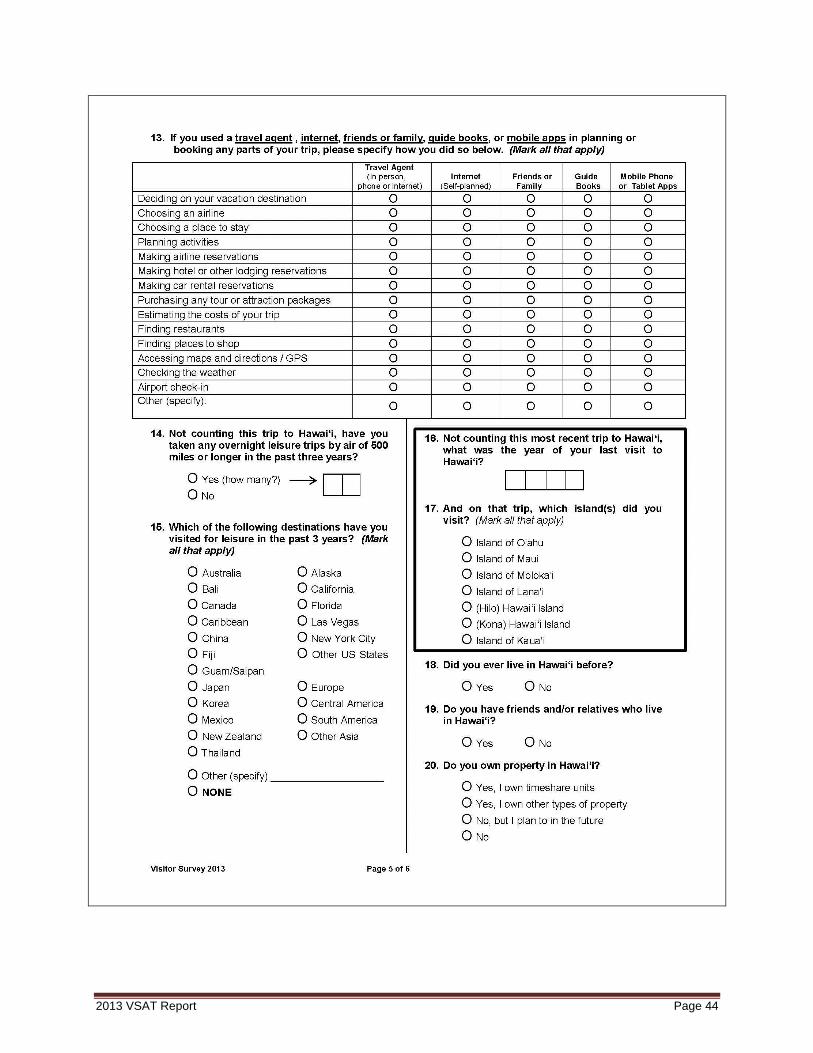
2013 VSAT Report Page 44

2013 VSAT Report Page 45

2013 VSAT Report Page 46
JAPANESE LANGUAGE VSAT SURVEY FORM, 2013
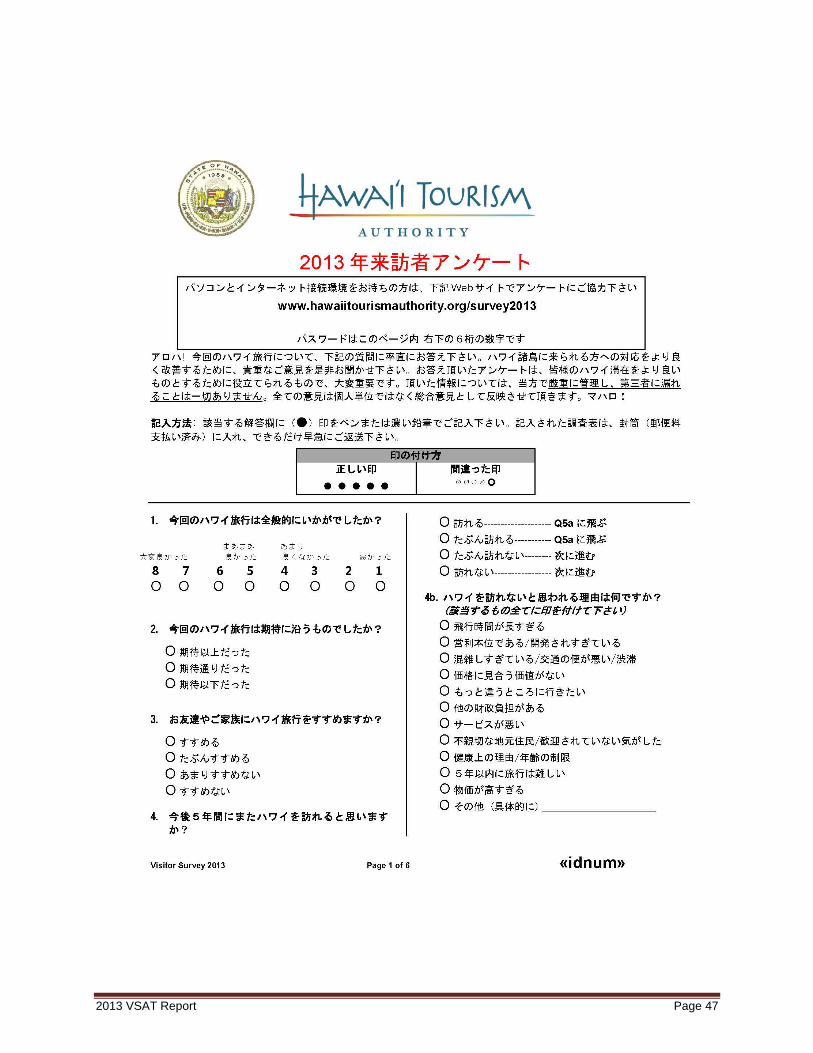
2013 VSAT Report Page 47
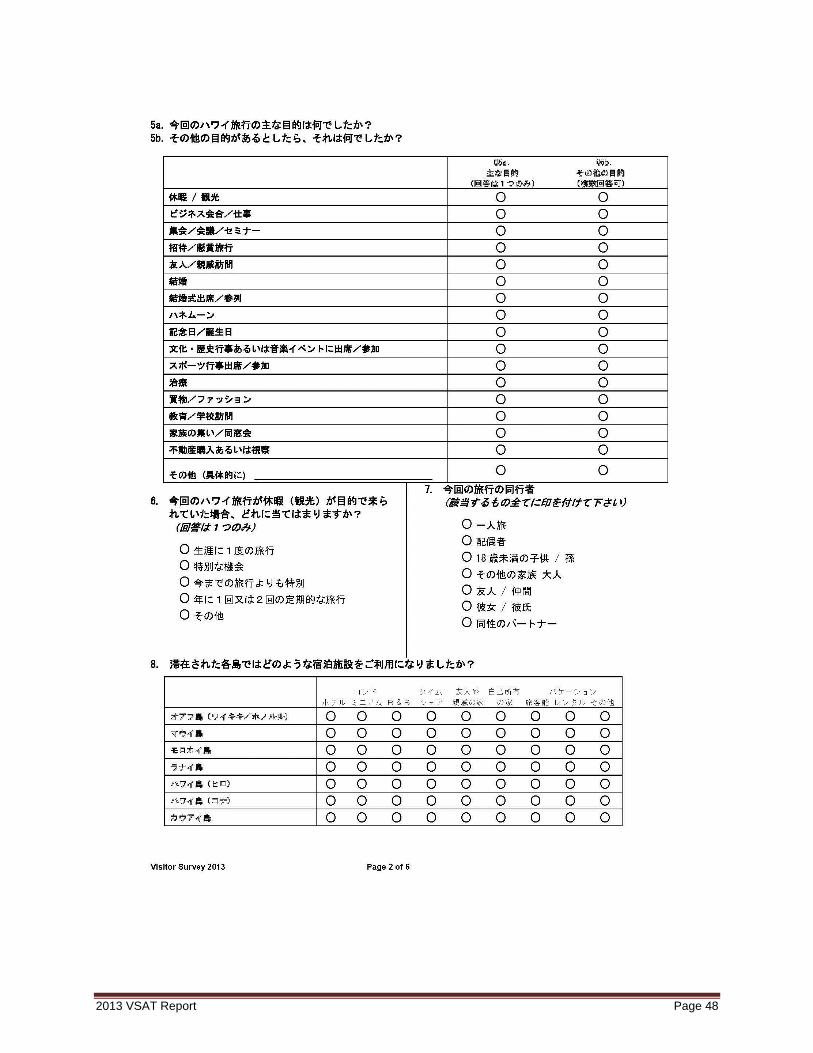
2013 VSAT Report Page 48
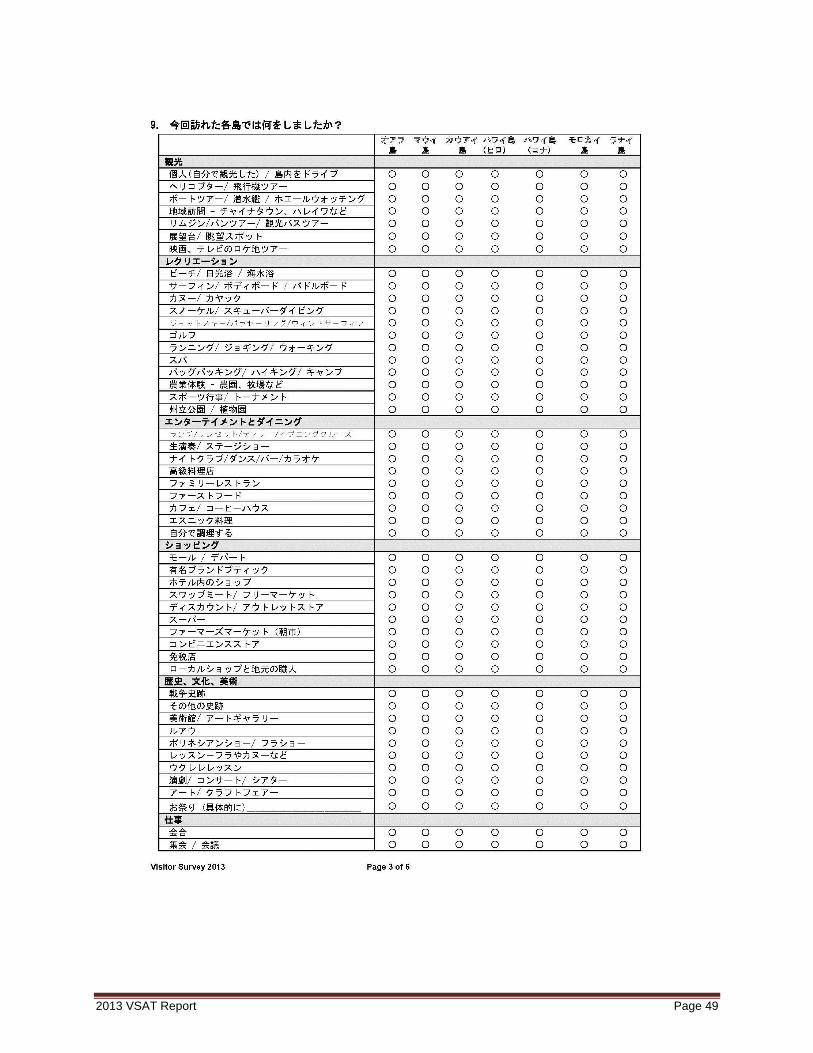
2013 VSAT Report Page 49
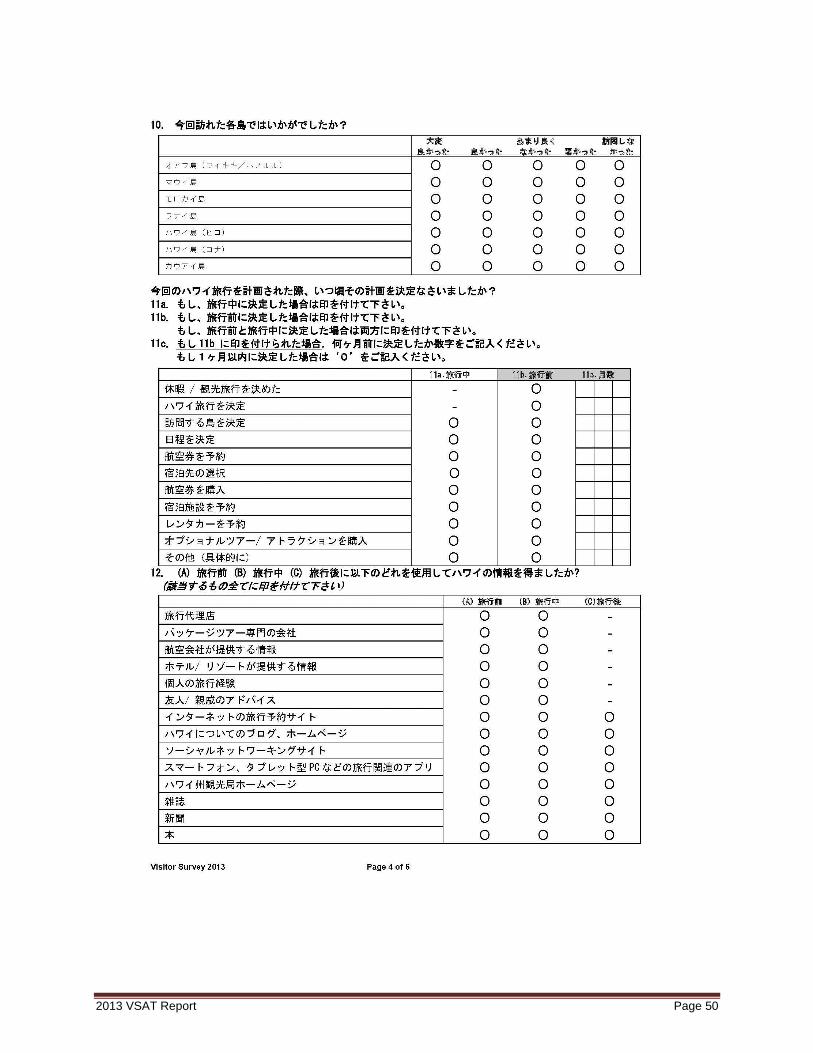
2013 VSAT Report Page 50

2013 VSAT Report Page 51
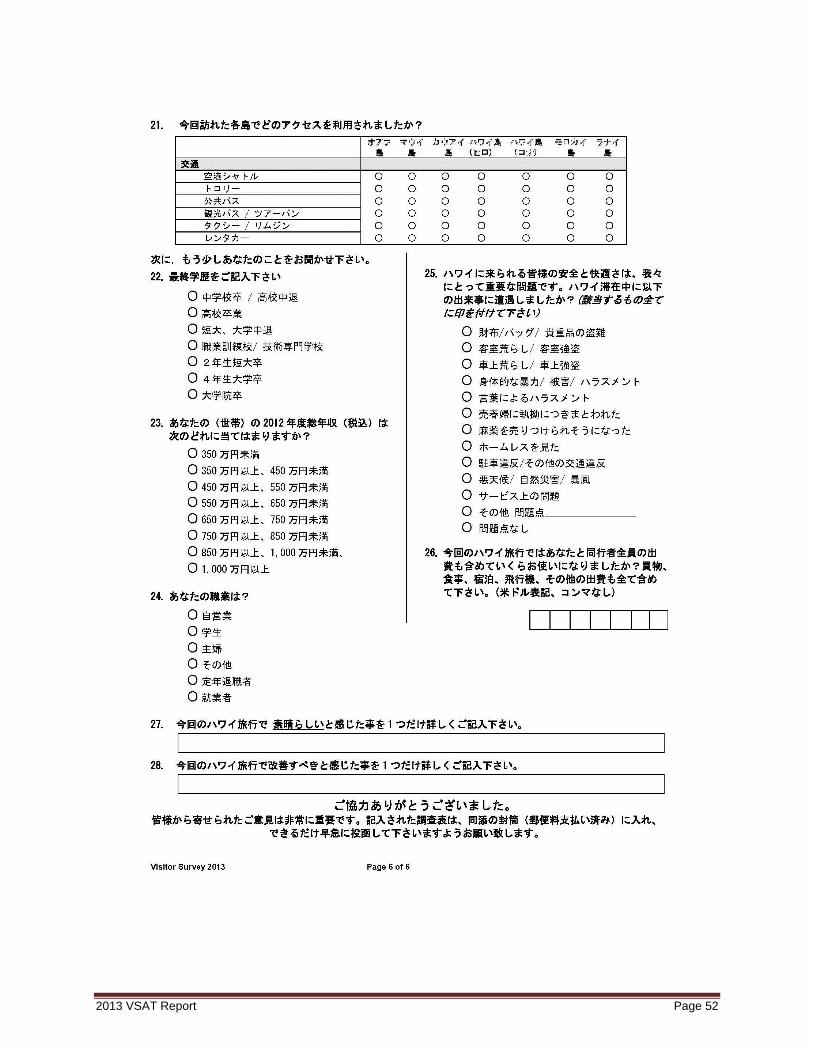
2013 VSAT Report Page 52

1801 Kalākaua AvenueHonolulu, Hawai‘i 96815
hawaiitourismauthority.org