visible signatures of hypersonic reentry - ida/media/corporate/files/publications/ida... · visible...
TRANSCRIPT
Visible Signatures of Hypersonic Reentry
Jeremy TeichmanLeon Hirsch
I N S T I T U T E F O R D E F E N S E A N A L Y S E S
INSTITUTE FOR DEFENSE ANALYSES4850 Mark Center Drive
Alexandria, Virginia 22311-1882
February 2013Approved for public release;
distribution is unlimited.IDA Document NS D-4792
Log: H 13-000192

About This PublicationThis work was conducted under IDA’s independent research program(C2165). The views, opinions, and findings should not be construed asrepresenting the official position of either the Department of Defense.
Copyright Notice© 2013 Institute for Defense Analyses4850 Mark Center Drive, Alexandria, Virginia 22311-1882 • (703) 845-2000.
I N S T I T U T E F O R D E F E N S E A N A L Y S E S
IDA Document NS D-4792
Visible Signatures of Hypersonic Reentry
Jeremy TeichmanLeon Hirsch
1
Visible Signatures of Hypersonic Reentry
J. Teichman1 and L. Hirsch2 Institute for Defense Analyses, Alexandria, VA 22311
Aerothermal heating of hypersonic reentry bodies can generate significant radiation of
visible light. Here, we investigate the conditions for ground-level visibility and what we term
noticeability of that radiated light to the unaided human eye. We consider radiated visible
light, transmission to ground level as a function of relative observer position, sky
background contrast, human contrast perception limits, and psychophysical considerations
for attention capture. Considering both pure ballistic trajectories and lifting-body
trajectories, we show some examples where we calculate the spatial and temporal viewing
zones for both detectability and noticeability. In some cases, these viewing zones extend a
significant distance from the impact location and/or include the impact location for a
potentially significant period of time before impact.
Nomenclature
V = reentry body velocity [m/s]
ρ = ambient air density [kg/m3]
ρ0 = sea-level air density [kg/m3]
φ = luminous power [lumens]
Js = volumetric luminous intensity at stagnation point [candelas/m3]
RN = radius of curvature of reentry body nose [m]
T = stagnation temperature [K]
T∞ = ambient air temperature [K]
M = Mach number [dimensionless]
γ = ratio of specific heats [dimensionless]
1 Research Staff Member, Science & Technology Division, 4850 Mark Center Drive. 2 Research Staff Member, Science & Technology Division, 4850 Mark Center Drive.
2
q˝ = black body radiant flux [W/m2]
E = illuminance (incident visible light flux) [lumens/m2]
D = distance between reentry body and observer [m]
I0 = luminous intensity per unit solid angle in the direction of the observer [candelas (cd)]
α = attenuation coefficient/extinction of visible light in air [m-1] αo = attenuation coefficient/extinction of visible light in air at sea level [m-1] H = scale height of the atmosphere [m] m = air mass traversed along line of sight from observer to reentry body [kg] m0 = total air mass along a vertical line from sea level to space [kg] θ = viewing elevation angle from horizon [radians] RE = radius of earth [m] z = altitude of reentry body [m] L = apparent luminance [nits = candelas/m2] Ω = solid angle subtended by the light source [steradians (sr)] Ωmin = minimum resolvable solid angle [steradians] C = contrast [dimensionless] Lo = background luminance [nits] L/D = lift-to-drag ratio [dimensionless]
I. Introduction
Numerous videos of space shuttle and ballistic missile atmospheric reentry, freely available on the Internet,
clearly demonstrate the bright optical signature presented by a hypersonic reentry body from great distances over
extended periods of time. This work explores whether, when, and where a reentry body will exhibit optical
signatures visible to the unaided human eye during reentry. Radiant emissions from hot gases in a shock layer that
forms around the leading edge of a reentry body during its hypersonic flight through the atmosphere can generate an
optical signature. We calculate variation of the signature with viewing location and time. The analysis further
explores whether such signatures will be “noticeable,” a term explored herein. The paper divides the analysis into
radiant emissions, optical transmission and attenuation, limits of human perception, and “noticeability.”
3
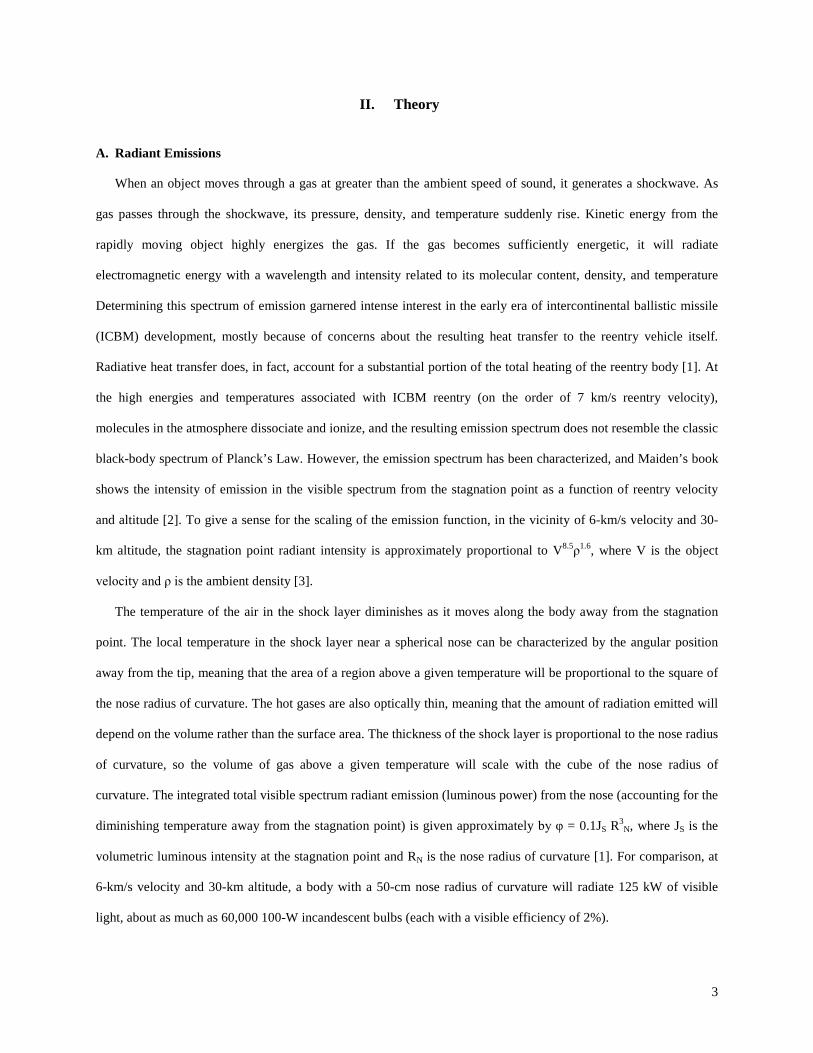
II. Theory
A. Radiant Emissions
When an object moves through a gas at greater than the ambient speed of sound, it generates a shockwave. As
gas passes through the shockwave, its pressure, density, and temperature suddenly rise. Kinetic energy from the
rapidly moving object highly energizes the gas. If the gas becomes sufficiently energetic, it will radiate
electromagnetic energy with a wavelength and intensity related to its molecular content, density, and temperature
Determining this spectrum of emission garnered intense interest in the early era of intercontinental ballistic missile
(ICBM) development, mostly because of concerns about the resulting heat transfer to the reentry vehicle itself.
Radiative heat transfer does, in fact, account for a substantial portion of the total heating of the reentry body [1]. At
the high energies and temperatures associated with ICBM reentry (on the order of 7 km/s reentry velocity),
molecules in the atmosphere dissociate and ionize, and the resulting emission spectrum does not resemble the classic
black-body spectrum of Planck’s Law. However, the emission spectrum has been characterized, and Maiden’s book
shows the intensity of emission in the visible spectrum from the stagnation point as a function of reentry velocity
and altitude [2]. To give a sense for the scaling of the emission function, in the vicinity of 6-km/s velocity and 30-
km altitude, the stagnation point radiant intensity is approximately proportional to V8.5ρ1.6, where V is the object
velocity and ρ is the ambient density [3].
The temperature of the air in the shock layer diminishes as it moves along the body away from the stagnation
point. The local temperature in the shock layer near a spherical nose can be characterized by the angular position
away from the tip, meaning that the area of a region above a given temperature will be proportional to the square of
the nose radius of curvature. The hot gases are also optically thin, meaning that the amount of radiation emitted will
depend on the volume rather than the surface area. The thickness of the shock layer is proportional to the nose radius
of curvature, so the volume of gas above a given temperature will scale with the cube of the nose radius of
curvature. The integrated total visible spectrum radiant emission (luminous power) from the nose (accounting for the
diminishing temperature away from the stagnation point) is given approximately by φ = 0.1JS R3N, where JS is the
volumetric luminous intensity at the stagnation point and RN is the nose radius of curvature [1]. For comparison, at
6-km/s velocity and 30-km altitude, a body with a 50-cm nose radius of curvature will radiate 125 kW of visible
light, about as much as 60,000 100-W incandescent bulbs (each with a visible efficiency of 2%).
4
Although the hot gases around the nose of a reentry body do not radiate as a black body, the black-body scaling
gives a sense that one might expect strong velocity dependence. For an ideal gas with a constant specific heat (not
the case at the high temperatures present in the case of interest), the stagnation temperature is proportional to the
velocity squared [4],
𝑇 = 𝑇∞�2𝛾𝑀2−(𝛾−1)��(γ−1)M2+2�
𝑀2(𝛾+1)2 𝑀≫1�⎯� 𝑇∞
2𝛾(𝛾−1)(𝛾+1)2
𝑀2 ∝ 𝑉2, (1)
where T is the absolute stagnation temperature, T∞ is the absolute ambient temperature, γ is the ratio of specific
heats, and M is the Mach number. Black-body radiation flux, q˝, described by the Stefan-Boltzmann law, q˝ = σT4,
together with the aforementioned temperature-velocity scaling, indicates that q˝ is proportional to V8.
The stagnation temperature of a real reentry body will be lower than the calorically perfect ideal gas stagnation
temperature described above because, in a real gas, specific heat rises with temperature as nontranslational modes
absorb energy. At very high energies, the radiation will also arise from transitions of specific molecular and ionic
species present in the optically thin gas, whereas a black body produces a material-independent spectrum and
behaves as an opaque surface emitter.
Ablative cooling of the reentry body may introduce smoke, soot, or other particulates into the shock layer, and
these materials have the potential to render the shock layer optically thick and its radiation more like that of a black
body. At the same 30-km altitude and 6-km/s velocity used previously as a reference point, the stagnation
temperature is 14400 K (for a calorically imperfect but thermally perfect gas, calculated in accordance with [4]). For
a spherical nose, the maximum temperature resides at the stagnation point in the front and decreases towards the
nose edge. Assuming the temperature decreases by 75% at the nose edge, the temperature in this region would be
10800K [1]. The Stefan-Boltzmann Law predicts a total black-body radiant power of 600 MW, of which 30% is in
the 340–540 nm band (in accordance with Planck’s law) (e.g. [5]) or 180 MW versus the 125 kW predicted for the
untainted hot air—a difference of 3 orders of magnitude.
B. Optical Transmission and Attenuation
Given the luminous power of the reentry body calculated using the methods of Section II.A, we next address
how much of that power reaches an observer on the ground. The light radiated from the reentry body spreads, which
5
reduces its flux in proportion to the distance squared, and attenuates exponentially through scattering and absorption
in the atmosphere according to Lambert’s Law [5]. The combined effect of these two principles is known as Allard’s
Law [6],
𝐸 = 𝐼0𝐷2𝑒−𝛼𝐷, (2)
where E is the illuminance (incident visible light flux) at the observer, D is the distance separating the reentry body
and observer, I0 is the luminous intensity (the luminous power per solid angle in the direction of the observer) of the
reentry body, and α is the attenuation coefficient. To evaluate the light reaching an observer, illuminance (at the
observer) must be calculated. We assume that the luminous intensity is distributed omnidirectionally, so that Io =
φ/(4π), where φ is the luminous power.
The attenuation coefficient at 550 nm (green light in approximately the perception-weighted center of the visible
spectrum) is α0 = 2.0 × 10⁻⁵ m-1 at sea level [7]. Attenuation effectively acts per unit air mass traversed, so the
attenuation along a path through the atmosphere is based on the distance at sea level required to traverse an
equivalent mass of air to that along the true path. Allard’s law can be expressed in terms of sea-level equivalent
atmosphere traversed:
𝐸 = 𝐼0𝐷2𝑒−𝛼0
𝑚𝑚0
𝐻, (3)
where m is the air mass traversed by the line of sight between the observer and the reentry body, m0 is the total air
mass in the atmosphere along a vertical column from sea level to space, and H is the scale-height of the atmosphere
over which density decreases by a factor of e (approximately 6,700 m). The amount of air in an infinitely tall
column in an exponential atmosphere (An exponential atmosphere is described by 𝜌 = 𝜌0𝑒𝑧 𝐻⁄ , where 𝜌 is the
density, 𝜌0 is the density at sea level, and z is the altitude.) is equal to that in a sea-level path of length equal to the
scale-height �∫ 𝜌𝑑𝑥∞0 = 𝜌0𝐻�. When viewing through the atmosphere, the viewing elevation angle, θ, has a
6
pronounced effect. The air mass traversed looking out beyond the atmosphere at the horizon is 38 times that looking
at zenith [8]. For an exponential atmosphere, a good approximation, even near the horizon, is
𝑚𝑚0
= �𝜋𝑅𝐸2𝐻
𝑒𝑅𝐸 sin2 𝜃
2𝐻 �erf�𝑧2+2𝑧𝑅𝐸+𝑅𝐸2 sin2 𝜃
2𝐻𝑅𝐸 − erf �𝑅𝐸 sin 𝜃
√2𝐻� (4)
where RE is the radius of the earth and z is the altitude of the object.
Equation (3) permits calculation of how much illuminance, or total visible light flux, would be incident on a
ground observer. The brightness of the reentry body to the observer (i.e., the concentration of the apparent origin of
the illuminance) is given by the illuminance per solid angle subtended by the reentry body from the perspective of
the observer. In other words, a very bright but small source can provide as much illumination as a dim but very large
source. For a resolved object without attenuation, luminance is invariant with distance because the illuminance and
the solid angle subtended both diminish with the inverse square of the distance. This principle is easily observed on
a long stretch of a city street that has traffic lights visible for multiple blocks ahead. Lights further and further ahead
appear smaller and smaller, but the brightness of the lights appears undiminished. However, if a source is
sufficiently distant that it appears as a point source (really, the minimum resolvable size), the illuminance still drops
as the inverse distance squared, but the apparent size remains constant, which causes the apparent luminance to drop
with the inverse distance squared. Thus, apparent luminance is given by
𝐿 = 𝐸max(Ω,Ωmin )
, (5)
where Ω is the solid angle subtended by the light source from the perspective of the observer, and Ωmin is the
minimum resolvable solid angle. Absolute luminance would be based only on the true solid angle subtended.
C. Limits of Human Perception
The most basic determinant of whether an object is discernible by the unaided human eye is its contrast with the
background. Contrast, C, is defined as the excess brightness of the object relative to the background luminance, L0:
7
𝐶 = 𝐿−𝐿0𝐿0
. (6)
An object brighter than the background presents positive contrast, and an object darker than the background
presents negative contrast. An object cannot have negative luminance, so contrast ranges from negative one to
infinity. Path luminance (the scattering of ambient light to the observer along the viewing path) diminishes observed
contrast. Path luminance, considered primarily during daytime, depends on sun elevation angle, viewing elevation
angle, and viewing azimuth angle relative to the sun. Path luminance exponentially approaches background
luminance in the same fashion that Lambert’s law describes attenuation of object luminance [9].
The absolute value of contrast determines visibility, so negative and positive contrasts of the same magnitude
contribute equally to visibility [10]. The size of an object (angle subtended) also contributes to its visibility, with
larger objects being more visible. Below a critical angular size, objects appear as point sources, and size does not
contribute directly to visibility. However, the absolute contrast (as opposed to apparent contrast) requirement
continues to vary because the apparent luminance diverges from the absolute luminance [11]. In this regime of
apparent point sources, the threshold represents a constant minimally perceptible point source illuminance.
The third variable contributing to human visibility thresholds is ambient light level. The retina—the detector in
the human eye—contains two types of light sensors: rods and cones. The rods, which are far more sensitive than the
cones (rods can detect a single photon), are principally used for vision in dim lighting. The cones are used for bright
environments. The rods and the cones are distributed differently over the retina, and neither is distributed
homogeneously. Cone-based bright-light sensitivity is principally central vision, whereas rod-based dim-light vision
is highly peripheral. Because the eye adapts to the ambient light level and the dominant modes of vision vary with
the adaptation to the light level, the human thresholds for discerning objects also depend on the ambient light
adaptation level. Greater contrast is required at lower ambient light levels. While the human eye could discern a
contrast of 0.4 in daylight, it could not discern a contrast below 710 in starlight. The critical angular size below
which objects appear as point sources also grows with lower ambient light levels, ranging, for example, from 0.2
mrad in daylight to 2 mrad in starlight. Blackwell quantified the threshold contrast level as a function of object size
and ambient light level [11].
8
D. Noticeability
Blackwell based his results for contrast thresholds on experiments conducted to discover the bare minimum
required for 50% probability of discernment of an object in a known position and with a long observation period
[11]. In this study, we are concerned not just with visibility, but also with what might be termed “noticeability.” The
question is not what might be barely discerned with careful study of a prespecified location but rather what a casual
observer would notice without cueing or foreknowledge and without necessarily looking in exactly the right place at
the right time.
Many studies have been conducted on what is termed “attention capture,” (i.e., what people will notice).
Relevant here, in particular, are two terms: “reflexive” attention capture, meaning that the subject’s attention is
involuntarily drawn, and “explicit” attention capture, meaning that the subject is aware that his/her attention has
been captured. (There is also implicit or subconscious attention capture in which a subject is distracted from a
primary task by the appearance or presence of the target object even though his/her focus does not shift to it.) The
results have shown significant variation depending upon the task in which subjects were engaged, state of mind of
the subjects, dynamics of the target object (moving versus stationary), colors, uniformity or pattern of the
background, presence of other objects competing for attention, distance of the target object from the center of
fixation (where the subject was looking), expectations of the subject regarding the appearance or presence of the
object, and so forth. In other words, the variables are too numerous to extrapolate a single generic explicit reflexive
attention capture threshold [12].
Instead of deriving a theoretical threshold, we use an analogous situation to provide a meaningful metric for the
evaluation of noticeability. The Federal Aviation Administration (FAA) has established regulations for the
installation of obstruction lighting on tall structures to alert pilots of their presence and avoid collisions. In other
words, the FAA has established a standard for a particular type of explicit reflexive attention capture device to
ensure that pilots, unaware of the presence or location of such a beacon in advance, notice and attend to beacons
within their fields of view. For example, for white non-strobe lights, the FAA mandates obstruction lights of
100,000 candela luminous intensity to provide daytime visibility (noticeability) at 4.3 km on a day with 4.8-km
meteorological visibility3 [13]. From Allard’s Law, the illuminance under these conditions is 3.6 × 10⁻⁴ lumens/m2.
3 Standardized visibility distance is calculated from the atmospheric attenuation coefficient (α). For daytime conditions, α = 3/visibility. For nighttime conditions, α = -ln(visibility/4.79 × 105 m)/visibility [17]. Another possibility is the Koschmieder Equation, α = 3.912/visibility, which fits better with the data in the FAA bulletin [9].
9
For the hazy conditions that give rise to this visibility level, we presume the background brightness to be equivalent
to an overcast sky, approximately 300 cd/m2 [14]. The critical visual angle at that adaptation brightness is
approximately 0.2 mrad (3 × 10⁻⁸ sr) [11], so at 4.3-km distance, any source smaller than 90 cm would appear as a
point source. For a source falling into that regime, the apparent brightness of the obstruction lighting (in addition to
the superimposed background and path luminance) would be 12,000 cd/m2, and the contrast would be 39 compared
to a threshold of 0.37 for a ratio of approximately 100. The same can be done for the nighttime requirements to yield
a contrast ratio of 200–400, depending on the method of inference of the attenuation coefficient from reported
visibility. In both cases, the FAA lighting requirement is on the order of a few hundred times the minimum contrast
threshold for detectability. For this study, we take the 400x threshold contrast level as the standard for high
noticeability.
III. Results
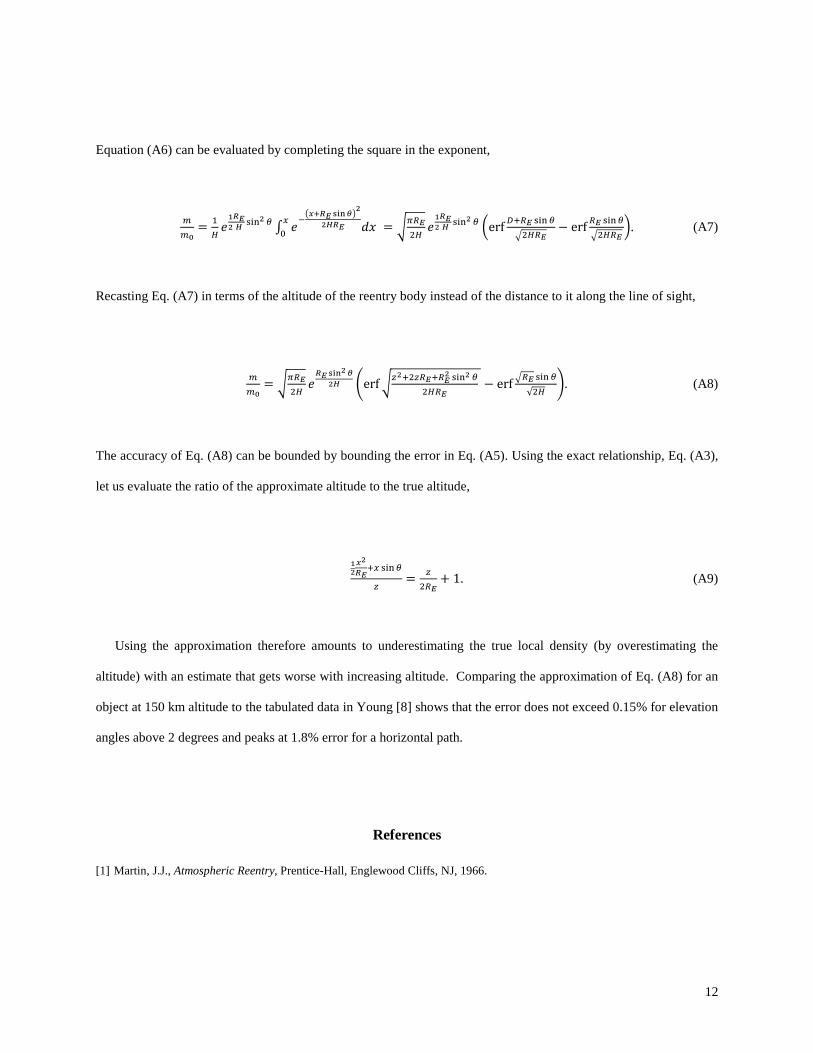
In Fig. 1, we show four manners of characterizing the visual signature of a reentry body at an instant in time. For
this example, we use a reentry body with a nose/leading-edge radius of curvature of 0.5 m, a velocity of 7 km/s, and
an altitude of 50 km. Figure 1a (top left) shows the preferred metric, which will be used in what follows. Our
preferred metric is the contrast level normalized to the threshold contrast level. A value of 1 indicates marginal
detectability, and a value of 400 indicates noticeability equivalent to FAA standards for obstruction lights. Both of
these levels are indicated on the plot. The value of the metric is then plotted as a function of the ground distance of
an observer from nadir below the reentry body. Curves are shown for four different ambient light adaptation levels:
dark cloudless (moonless) night (labeled ‘Star’), full moon night (labeled ‘Moon’), zenith brightness at sunset
(labeled ‘Twilight’), and zenith brightness at 10:30 A.M (labeled ‘Day’).4
Figure 1a shows that the given reentry body would be noticeable at night at distances of nearly 500 km from
nadir, even on a full moon night; however, during the day, it would be detectable but not noticeable to the 400x
threshold standard, even from directly below. Figure 1b shows the raw, unnormalized contrast level. Figure 1c
shows the amount of light cast by the reentry body on the ground in the form of illuminance or flux of visible light
power. Figure 1d shows astronomical apparent magnitude (V-band), which is a measure astronomers use to rate the
visibility of celestial bodies. Apparent magnitude measures relative illuminance and is really designed for point
4 Representing a sun elevation angle of 60°, corresponding to 10:30 A.M. in Washington, D.C., on July 21, 2009.
10
sources. The scale is logarithmic (with lower magnitude meaning brighter) and five steps in magnitude
corresponding to a factor of 100 in illuminance [15]. The full moon has an average magnitude of -12.7, and Venus
has an average magnitude of -4.4 [16]. For those familiar with magnitudes, Fig. 1d allows ready comparison of
reentry body appearance with known celestial objects. Venus, for instance, is highly visible at night but only
marginally visible during the day. Only the threshold-normalized contrast ratio from Fig. 1a will be used in what
follows.
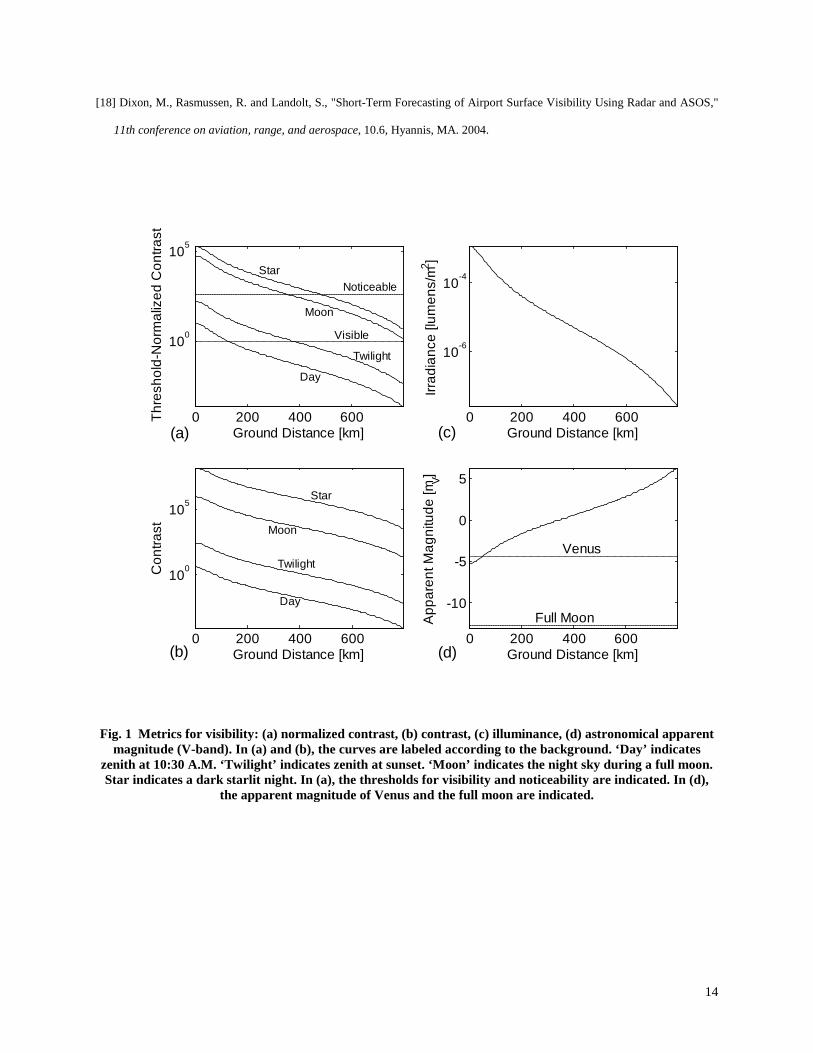
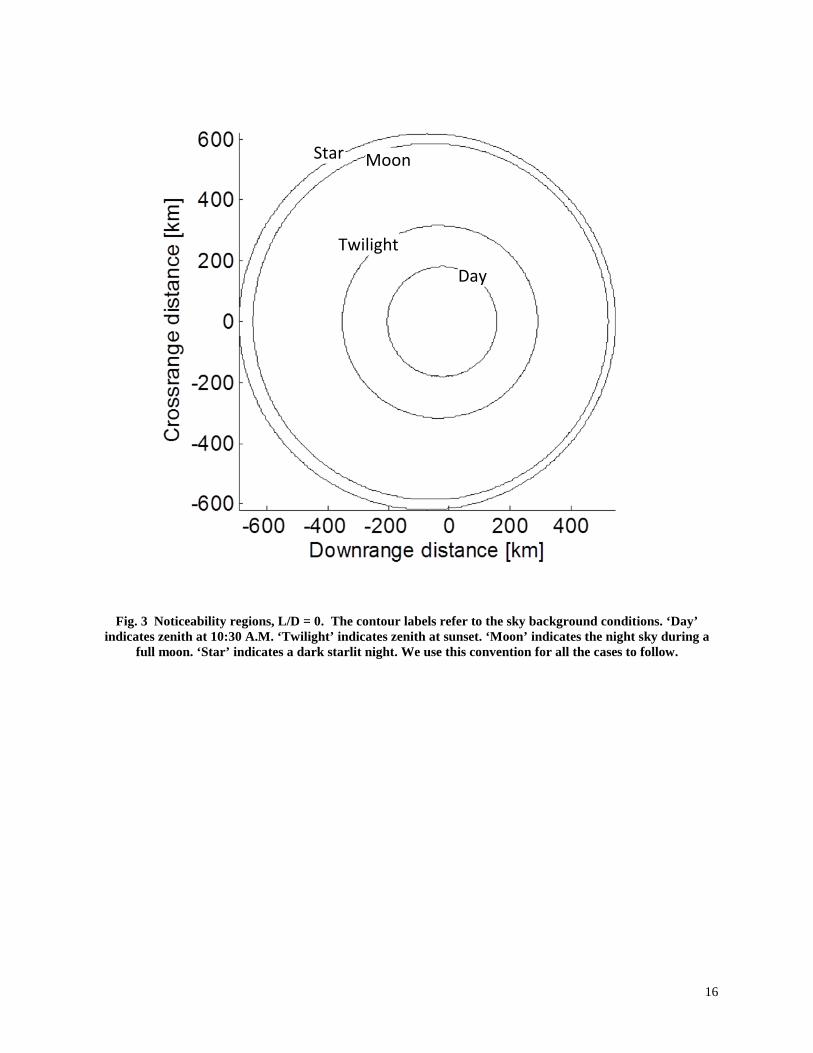
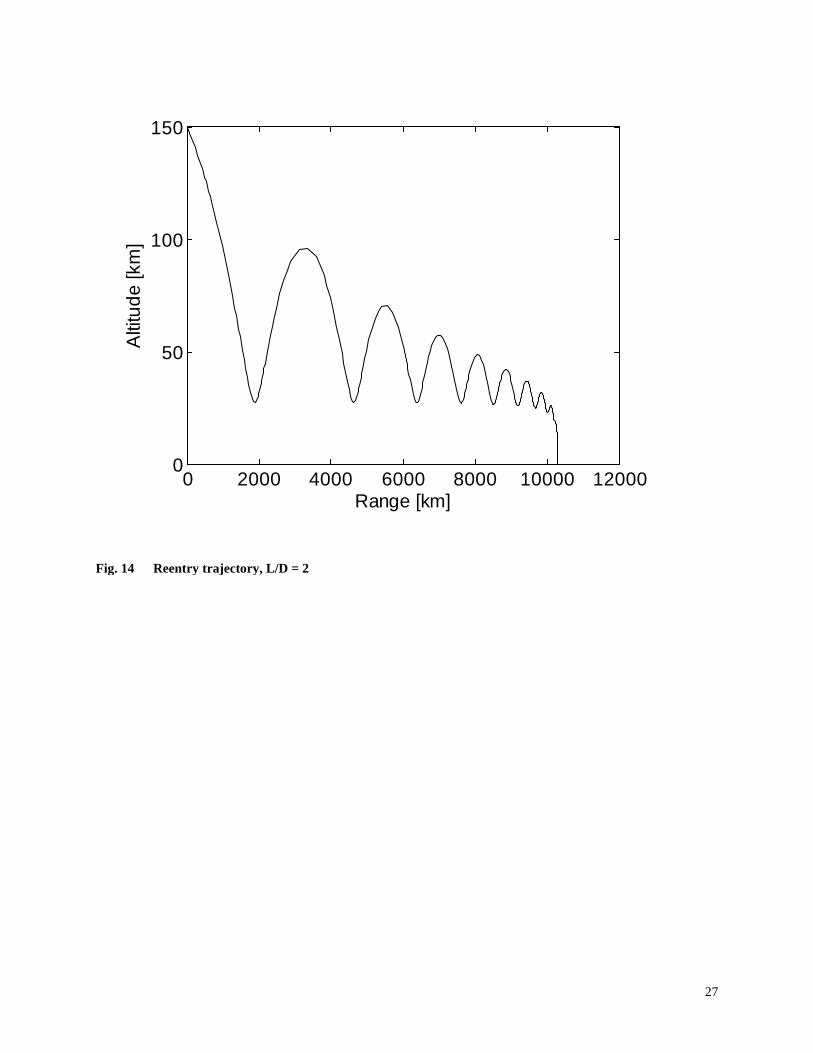
We now consider four cases of reentry bodies, varying their lift-to-drag ratios L/D and their initial flight path
angles. For each case, the reentry body, with a nose radius of curvature of 0.5 m, a drag coefficient of 0.3, a
diameter of 1 m, and a mass of 1000 kg, begins at an altitude of 150 km with a velocity of 7 km/s. For the first case,
we consider a purely ballistic trajectory with L/D = 0 and an initial flight path angle of -26°. For the following three
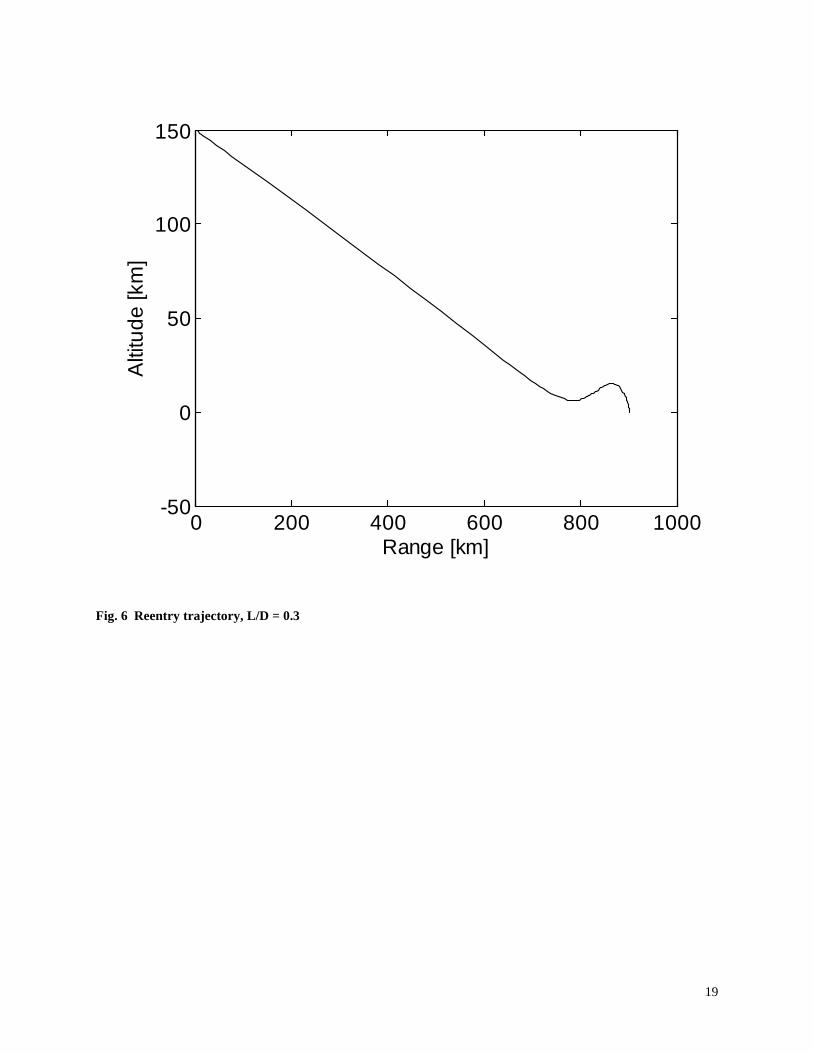
cases, we consider L/D = 0.3 with an initial flight path angle of -10°, L/D = 0.5 with an initial flight path angle of -
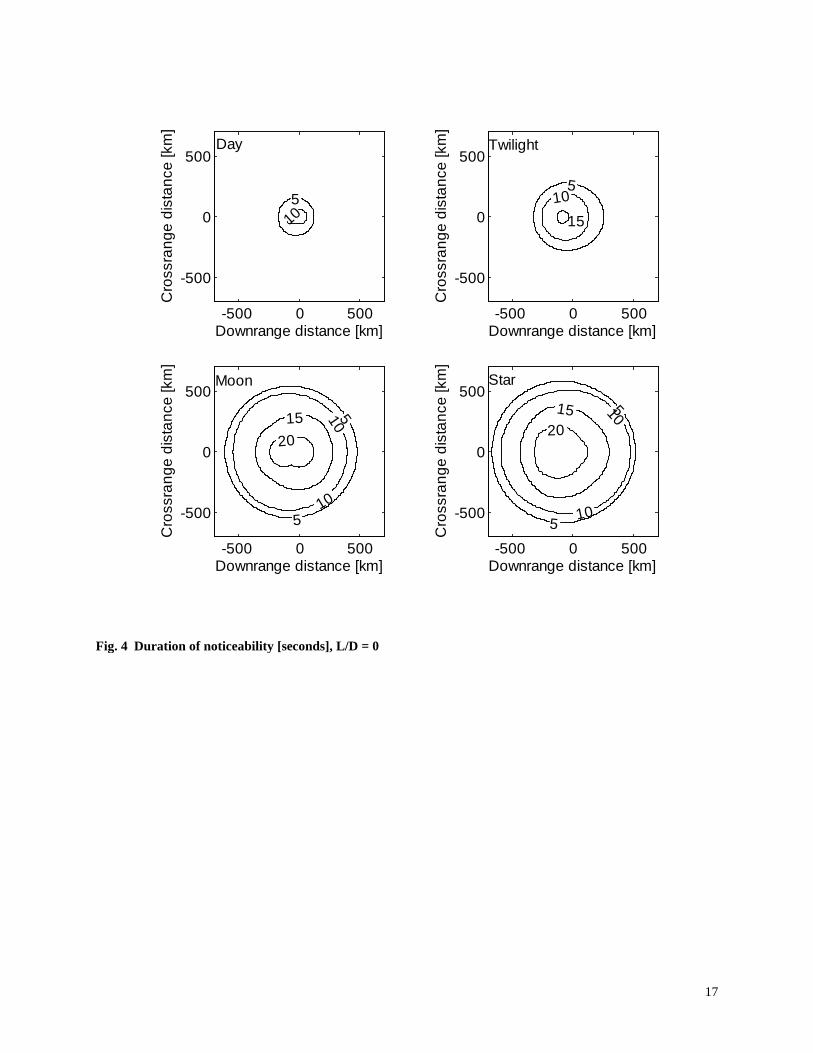
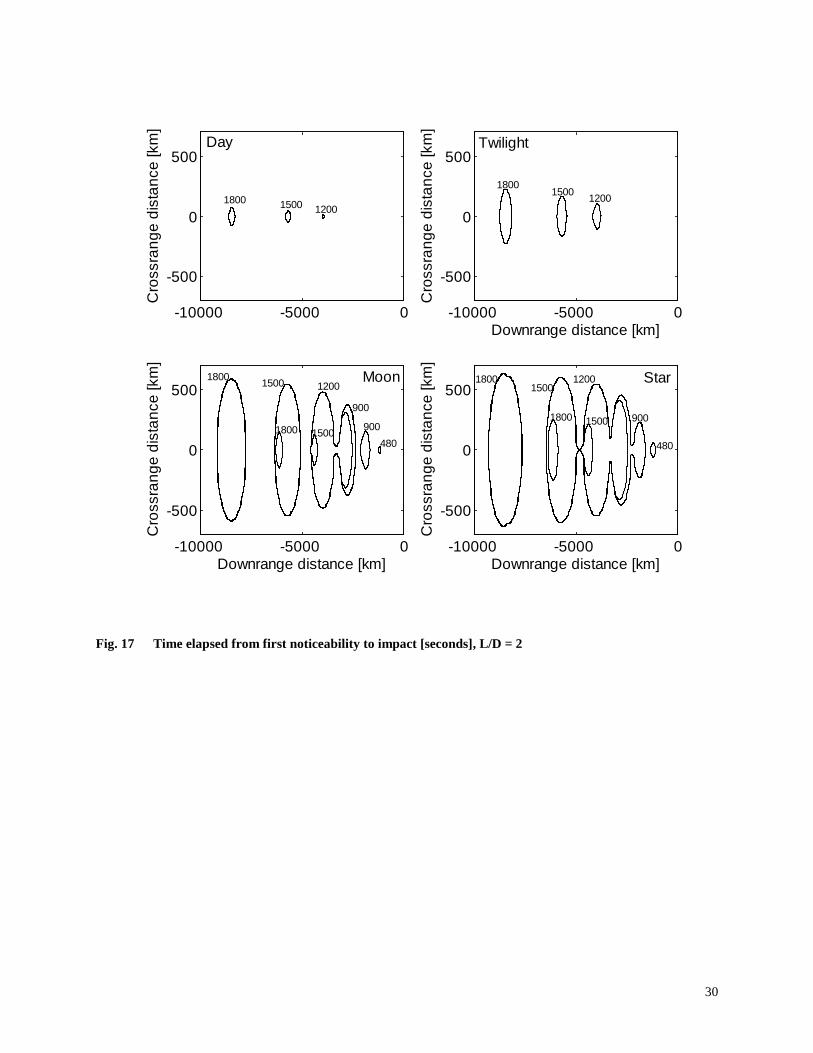
5°, and L/D = 2 with an initial flight path angle of -2°. In Figs. 2 to 17 we show trajectories, noticeability regions
and durations, and elapsed time from first noticeability to impact.
IV. Conclusion
For a given reentry body, methods in this paper allow calculation of noticeability and visibility regions with a
reasonably simple criterion for assessing noticeability by analogy to FAA lighting visibility requirements. For many
conditions, particularly at night, reentry bodies may be noticeable for hundreds of kilometers around the impact
point for periods of time ranging from tens of seconds to minutes before impact. Purely ballistic reentry bodies of
the scale in the examples shown would be noticeable for hundreds of kilometers at night over regions including the
impact point but for less than a minute prior to impact. Strongly lifting reentry bodies could be visible thousands of
kilometers and tens of minutes in advance of the impact site as they skip off the denser atmosphere, but they would
slow sufficiently with successive skips that, by the time they come over the impact point’s horizon, they would no
longer be noticeable.
Appendix
A derivation of the air mass approximation is given here. The law of cosines relates viewing elevation angle,
range, and altitude. For any point along the line of sight,
11
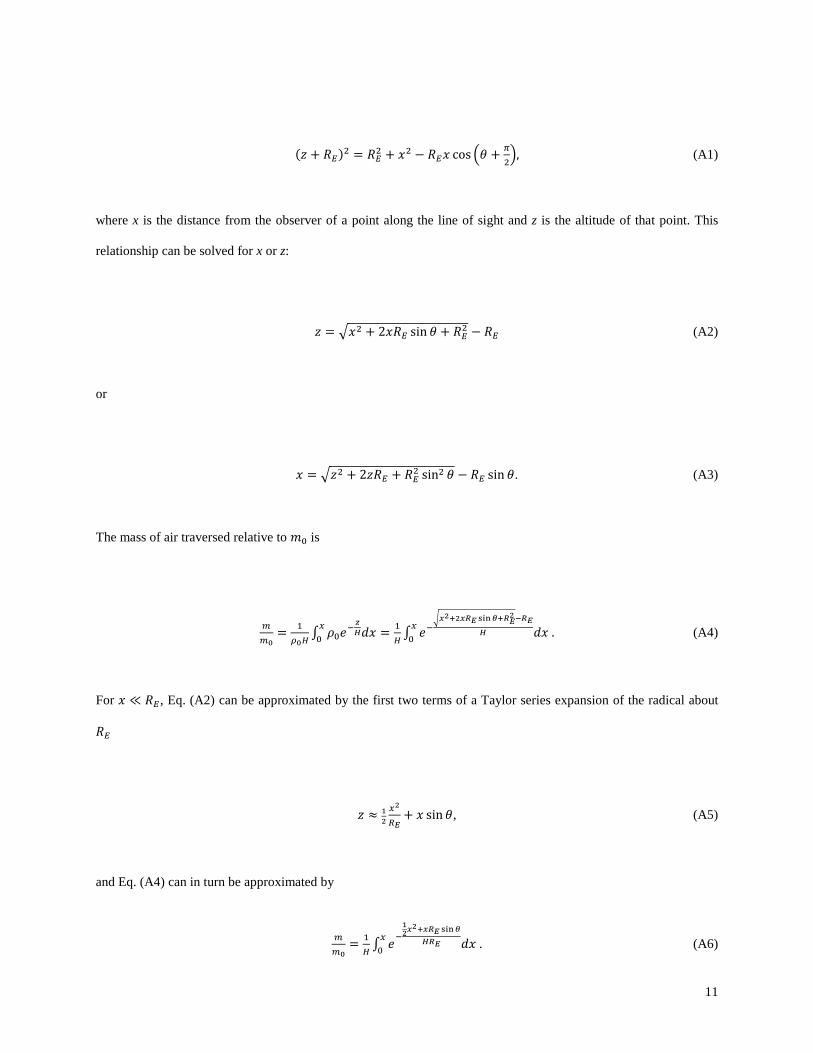
(𝑧 + 𝑅𝐸)2 = 𝑅𝐸2 + 𝑥2 − 𝑅𝐸𝑥 cos �𝜃 + 𝜋2�, (A1)
where x is the distance from the observer of a point along the line of sight and z is the altitude of that point. This
relationship can be solved for x or z:
𝑧 = �𝑥2 + 2𝑥𝑅𝐸 sin 𝜃 + 𝑅𝐸2 − 𝑅𝐸 (A2)
or
𝑥 = �𝑧2 + 2𝑧𝑅𝐸 + 𝑅𝐸2 sin2 𝜃 − 𝑅𝐸 sin 𝜃. (A3)
The mass of air traversed relative to 𝑚0 is
𝑚𝑚0
= 1𝜌0𝐻
∫ 𝜌0𝑒−𝑧𝐻𝑑𝑥𝑥
0 = 1𝐻 ∫ 𝑒−
�𝑥2+2𝑥𝑅𝐸 sin𝜃+𝑅𝐸2−𝑅𝐸
𝐻 𝑑𝑥 𝑥0 . (A4)
For 𝑥 ≪ 𝑅𝐸, Eq. (A2) can be approximated by the first two terms of a Taylor series expansion of the radical about
𝑅𝐸
𝑧 ≈ 12𝑥2
𝑅𝐸+ 𝑥 sin𝜃, (A5)
and Eq. (A4) can in turn be approximated by
𝑚𝑚0
= 1𝐻 ∫ 𝑒−
12𝑥2+𝑥𝑅𝐸 sin𝜃
𝐻𝑅𝐸 𝑑𝑥 𝑥0 . (A6)
12
Equation (A6) can be evaluated by completing the square in the exponent,
𝑚𝑚0
= 1𝐻𝑒12𝑅𝐸𝐻 sin2 𝜃 ∫ 𝑒−
�𝑥+𝑅𝐸 sin𝜃�2
2𝐻𝑅𝐸 𝑑𝑥 𝑥0 = �𝜋𝑅𝐸
2𝐻𝑒12𝑅𝐸𝐻 sin2 𝜃 �erf 𝐷+𝑅𝐸 sin 𝜃
�2𝐻𝑅𝐸− erf 𝑅𝐸 sin𝜃
�2𝐻𝑅𝐸�. (A7)
Recasting Eq. (A7) in terms of the altitude of the reentry body instead of the distance to it along the line of sight,
𝑚𝑚0
= �𝜋𝑅𝐸2𝐻
𝑒𝑅𝐸 sin2 𝜃
2𝐻 �erf�𝑧2+2𝑧𝑅𝐸+𝑅𝐸2 sin2 𝜃
2𝐻𝑅𝐸 − erf �𝑅𝐸 sin 𝜃
√2𝐻�. (A8)
The accuracy of Eq. (A8) can be bounded by bounding the error in Eq. (A5). Using the exact relationship, Eq. (A3),
let us evaluate the ratio of the approximate altitude to the true altitude,
12𝑥2𝑅𝐸
+𝑥 sin𝜃
𝑧= 𝑧
2𝑅𝐸+ 1. (A9)
Using the approximation therefore amounts to underestimating the true local density (by overestimating the
altitude) with an estimate that gets worse with increasing altitude. Comparing the approximation of Eq. (A8) for an
object at 150 km altitude to the tabulated data in Young [8] shows that the error does not exceed 0.15% for elevation
angles above 2 degrees and peaks at 1.8% error for a horizontal path.
References
[1] Martin, J.J., Atmospheric Reentry, Prentice-Hall, Englewood Cliffs, NJ, 1966.

13
[2] Maiden, C. J., "Aerophysical Studies at Hypersonic Velocities in Free Flight Ranges," Advances in Aeronautical Sciences:
Proceedings of the second International Congress in the Aeronautical Sciences, Vol. 4, Pergamon Press, Oxford, 1962, pp.
675-699.
[3] Hidalgo, H. and Detra, R. W., "Generalized Heat Transfer Formulas and Graphs for Nose Cone Reentry into the
Atmosphere," Journal of the American Rocket Society, Vol. 31, No. 3, 1961, p. 318.
[4] Ames Research Staff, “Equations, Tables, and Charts for Compressible Flow,” National Advisory Committee for Aeronautics
Report 1135, 1953.
[5] Mills, A. F., Heat and Mass Transfer, Richard D. Irwin, Inc., Boston, 1995, p. 547.
[6] Brown, E. B., Modern Optics, Reinhold Publishing Corp., New York, 1965.
[7] Miller, J. L. and Friedman, E., Photonics rules of thumb: optics, electro-optics, fiber optics, and lasers, McGraw-Hill, New
York, 1996.
[8] Scolnik, R. and Dunkelman, L., "Solar Spectral Irradiance and Vertical Atmospheric Attenuation in the Visible and
Ultraviolet," Journal of the Optical Society of America, Vol. 49, No. 4, 1959, pp. 356-367.
[9] Young, A. T. and Kasten, F., "Revised optical air mass tables and approximation formula," Applied Optics, Vol. 28, No. 22,
1989, pp. 4735-4738.
[10] Koschmieder, H., “The theory of horizontal visual range,” NASA TT F-14,930, June 1973, translated from "Theorie der
horizontalen Sichtweite," Beitrage zur physik der freien Atmosphäre, Vol. 12, 1924, pp. 33-55.
[11] Gordon, J., "Visibility: Optical Properties of Objects and Backgrounds," Applied Optics, Vol. 3, No. 5, 1964, pp. 556-562.
[12] Blackwell, H. R., "Contrast Thresholds of the Human Eye," Journal of the Optical Society of America, Vol. 36, No. 11,
1946, pp. 624-643.
[13] Most, S. B. and Simons, D. J., "Attention Capture, Orienting, and Awareness," Attraction, Distraction, and Action: Multiple
Perspectives on Attentional Capture, edited by C. L. Folk and B. S. Gibson, Advances in Psychology Vol. 133, Elsevier
Science B.V., Amsterdam, 2001, pp. 151-173.
[14] U.S. Department of Transportation, Federal Aviation Administration, "Obstruction Marking and Lighting," Advisory
Circular AC 70/7460-1K, February 2007, Appendix 2.
[15] Crawford, D. L., "Photometry: Terminology and Units in the Lighting and Astronomical Sciences," The Observatory, Vol.
117, 1997, pp. 14-18.
[16] Zombeck, M., Handbook of Space Astronomy and Astrophysics, Cambridge University Press, Cambridge, UK, 1990.
[17] Ridpath, I. (ed.), Norton’s 2000.0 Star Atlas and Reference Handbook, 18th ed., Longman Scientific and Technical, Essex,
1989.
14
[18] Dixon, M., Rasmussen, R. and Landolt, S., "Short-Term Forecasting of Airport Surface Visibility Using Radar and ASOS,"
11th conference on aviation, range, and aerospace, 10.6, Hyannis, MA. 2004.
0 200 400 600
10-6
10-4
Ground Distance [km]Irr
adia
nce
[lum
ens/
m2 ]
0 200 400 600
-10
-5
0
5
Ground Distance [km]
App
aren
t Mag
nitu
de [m
V]
0 200 400 600
100
105
Ground Distance [km]
Con
trast
0 200 400 600
100
105
Ground Distance [km]
Thre
shol
d-N
orm
aliz
ed C
ontra
st
(a)
Noticeable
Day
Full Moon
VenusTwilight
Moon
Star
Visible
Moon
Star
Twilight
(d)(b)
(c)
Day
Fig. 1 Metrics for visibility: (a) normalized contrast, (b) contrast, (c) illuminance, (d) astronomical apparent magnitude (V-band). In (a) and (b), the curves are labeled according to the background. ‘Day’ indicates
zenith at 10:30 A.M. ‘Twilight’ indicates zenith at sunset. ‘Moon’ indicates the night sky during a full moon. Star indicates a dark starlit night. In (a), the thresholds for visibility and noticeability are indicated. In (d),
the apparent magnitude of Venus and the full moon are indicated.
15
Fig. 2 Reentry trajectory, L/D=0 (pure ballistic)
0 50 100 150 200 250 300 0
50
100
150
Range [km]
Alti
tude
[km
]
16
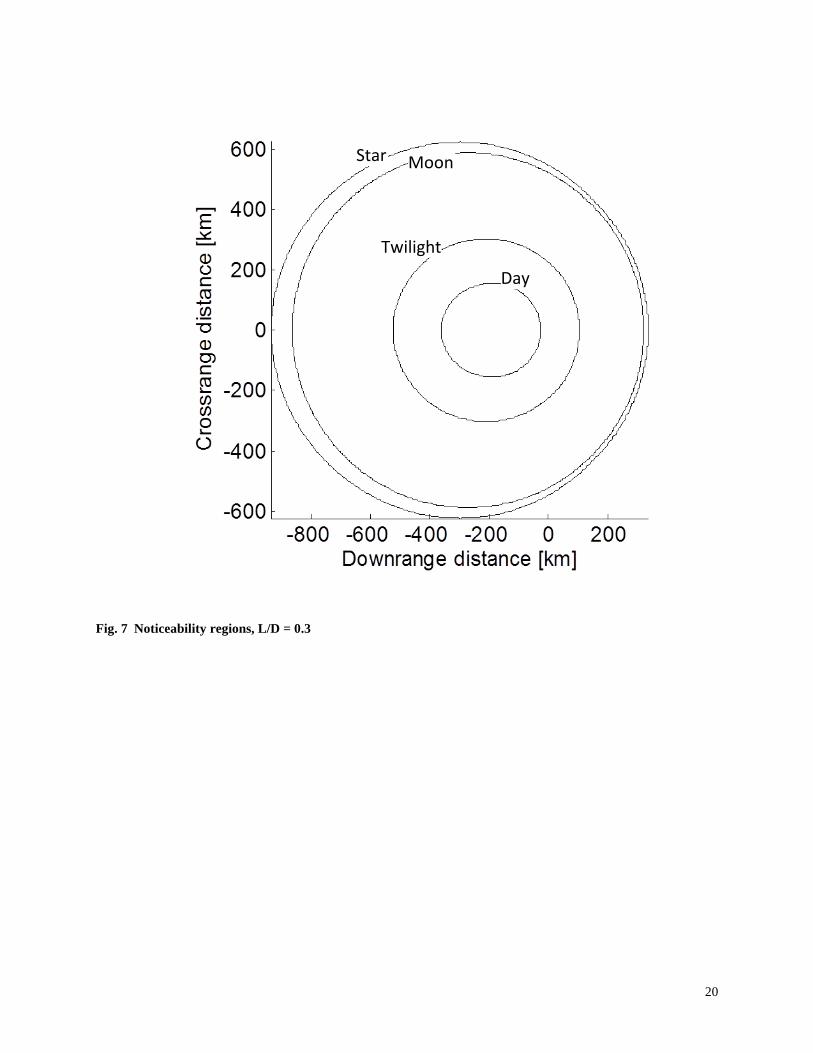
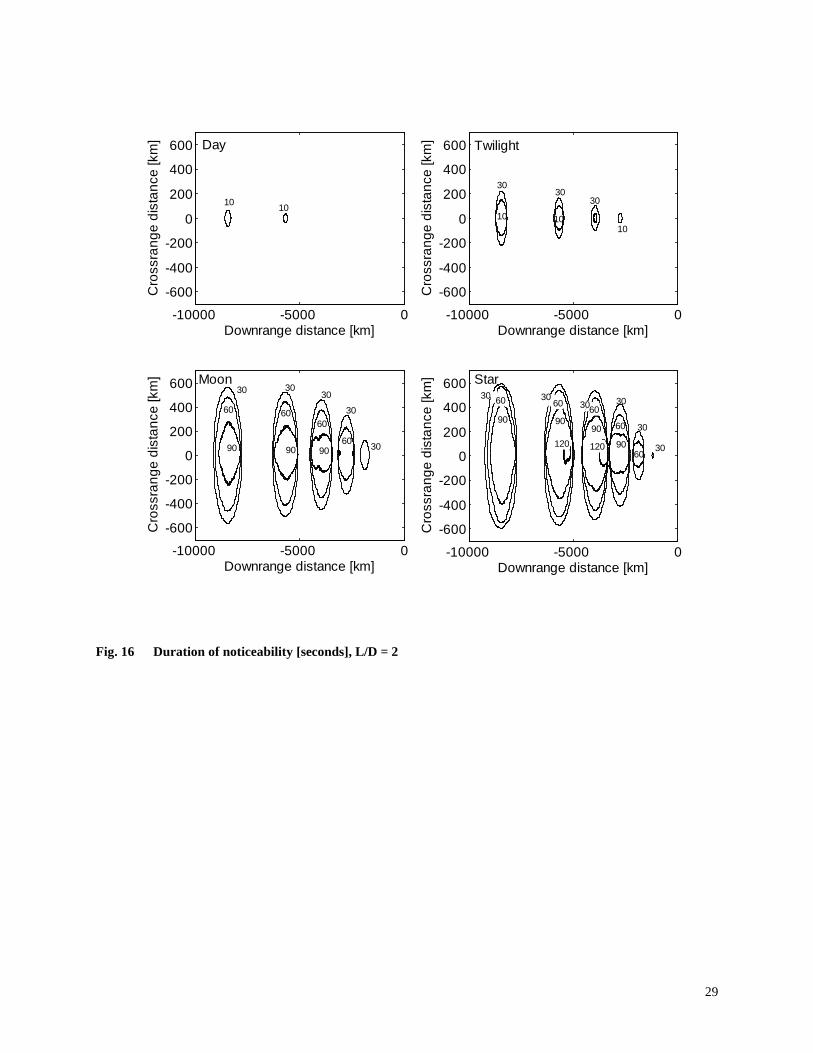
Fig. 3 Noticeability regions, L/D = 0. The contour labels refer to the sky background conditions. ‘Day’ indicates zenith at 10:30 A.M. ‘Twilight’ indicates zenith at sunset. ‘Moon’ indicates the night sky during a
full moon. ‘Star’ indicates a dark starlit night. We use this convention for all the cases to follow.
Day
Twilight
Moon Star
17
510
Downrange distance [km]
Cro
ssra
nge
dist
ance
[km
]
-500 0 500
-500
0
500
510
Downrange distance [km]
Cro
ssra
nge
dist
ance
[km
]
-500 0 500
-500
0
500
5
5
101015
20
Downrange distance [km]
Cro
ssra
nge
dist
ance
[km
]
-500 0 500
-500
0
500
5
5
10
101520
Downrange distance [km]
Cro
ssra
nge
dist
ance
[km
]
-500 0 500
-500
0
500
Day
StarMoon
Twilight
15
Fig. 4 Duration of noticeability [seconds], L/D = 0

18
5
Downrange distance [km]
Cro
ssra
nge
dist
ance
[km
]
-500 0 500
-500
0
500
510
Downrange distance [km]
Cro
ssra
nge
dist
ance
[km
]
-500 0 500
-500
0
500
10
1015
20
Downrange distance [km]
Cro
ssra
nge
dist
ance
[km
]
-500 0 500
-500
0
500
10
10
15
1520
Downrange distance [km]
Cro
ssra
nge
dist
ance
[km
]
-500 0 500
-500
0
500
Twilight
Moon Star
Day
10
Fig. 5 Time elapsed from first noticeability to impact [seconds], L/D = 0
19
0 200 400 600 800 1000-50
0
50
100
150
Range [km]
Alti
tude
[km
]
Fig. 6 Reentry trajectory, L/D = 0.3
20
Fig. 7 Noticeability regions, L/D = 0.3
Day
Twilight
Moon Star
21
520
Downrange distance [km]
Cro
ssra
nge
dist
ance
[km
]
-1000 -500 0 500
-500
0
500
52030
Downrange distance [km]
Cro
ssra
nge
dist
ance
[km
]
-1000 -500 0 500
-500
0
500
5
5
20
2030
Downrange distance [km]
Cro
ssra
nge
dist
ance
[km
]
-1000 -500 0 500
-500
0
500
5
5
20
20
30
Downrange distance [km]
Cro
ssra
nge
dist
ance
[km
]
-1000 -500 0 500
-500
0
500StarMoon
Day Twilight
Fig. 8 Duration of noticeability [seconds], L/D = 0.3

22
120
Downrange distance [km]
Cro
ssra
nge
dist
ance
[km
]
-1000 -500 0 500
-500
0
500
120
Downrange distance [km]
Cro
ssra
nge
dist
ance
[km
]
-1000 -500 0 500
-500
0
500
120
120
120180
Downrange distance [km]
Cro
ssra
nge
dist
ance
[km
]
-1000 -500 0 500
-500
0
500
120
120
120
180
180
Downrange distance [km]
Cro
ssra
nge
dist
ance
[km
]
-1000 -500 0 500
-500
0
500
Fig. 9 Time elapsed from first noticeability to impact [seconds], L/D = 0.3
23
0 500 1000 1500 2000 25000
50
100
150
Range [km]
Alti
tude
[km
]
Fig. 10 Reentry trajectory, L/D = 0.5
24
Fig. 11 Noticeability regions, L/D = 0.5
Day
Twilight
Moon Star
25
20
Downrange distance [km]
Cro
ssra
nge
dist
ance
[km
]
-2000 -1000 0-1000
-500
0
500
1000
5
5
30
Downrange distance [km]
Cro
ssra
nge
dist
ance
[km
]
-2000 -1000 0-1000
-500
0
500
1000
202020
20
60
60
90
Downrange distance [km]
Cro
ssra
nge
dist
ance
[km
]
-2000 -1000 0-1000
-500
0
500
1000
3030 30
30 60
60
90
90
Downrange distance [km]
Cro
ssra
nge
dist
ance
[km
]
-2000 -1000 0-1000
-500
0
500
1000
TwilightDay
Moon Star
Fig. 12 Duration of noticeability [seconds], L/D = 0.5

26
360
Downrange distance [km]
Cro
ssra
nge
dist
ance
[km
]
-2000 -1000 0-1000
-500
0
500
1000
360
Downrange distance [km]
Cro
ssra
nge
dist
ance
[km
]
-2000 -1000 0-1000
-500
0
500
1000
180
180
180
180
Downrange distance [km]
Cro
ssra
nge
dist
ance
[km
]
-2000 -1000 0-1000
-500
0
500
1000
180
180
180
360 360
360
Downrange distance [km]
Cro
ssra
nge
dist
ance
[km
]
-2000 -1000 0-1000
-500
0
500
1000
TwilightDay
Moon Star
360
360
360
360
360
360
360
Fig. 13 Time elapsed from first noticeability to impact [seconds], L/D = 0.5
27
0 2000 4000 6000 8000 10000 120000
50
100
150
Range [km]
Alti
tude
[km
]
Fig. 14 Reentry trajectory, L/D = 2

28
Fig. 15 Noticeability regions, L/D = 2
Day
Twilight
Moon
Star
29
Downrange distance [km]
Cro
ssra
nge
dist
ance
[km
]
-10000 -5000 0
-600
-400
-200
0
200
400
600
Downrange distance [km]
Cro
ssra
nge
dist
ance
[km
]
-10000 -5000 0
-600
-400
-200
0
200
400
600
Downrange distance [km]
Cro
ssra
nge
dist
ance
[km
]
-10000 -5000 0
-600
-400
-200
0
200
400
600
Downrange distance [km]
Cro
ssra
nge
dist
ance
[km
]
-10000 -5000 0
-600
-400
-200
0
200
400
600
Day Twilight
Star
10 1010
3030
30
1010
90 90 90
30
60
60
6060
30
30
3030
3060
90
30
309090 90 60
120120
3060
6030
3060
Moon
Fig. 16 Duration of noticeability [seconds], L/D = 2
30
Cro
ssra
nge
dist
ance
[km
]
-10000 -5000 0
-500
0
500
Downrange distance [km]
Cro
ssra
nge
dist
ance
[km
]
-10000 -5000 0
-500
0
500
Downrange distance [km]
Cro
ssra
nge
dist
ance
[km
]
-10000 -5000 0
-500
0
500
Downrange distance [km]
Cro
ssra
nge
dist
ance
[km
]
-10000 -5000 0
-500
0
500
Day Twilight
Moon Star1200
18001500
12001800 1500
1800
900
4801500
1800 1500
480
900900
180012001500
18001500 1200
Fig. 17 Time elapsed from first noticeability to impact [seconds], L/D = 2

REPORT DOCUMENTATION PAGE Form Approved
OMB No. 0704-0188 Public reporting burden for this collection of information is estimated to average 1 hour per response, including the time for reviewing instructions, searching existing data sources, gathering and maintaining the data needed, and completing and reviewing this collection of information. Send comments regarding this burden estimate or any other aspect of this collection of information, including suggestions for reducing this burden to Department of Defense, Washington Headquarters Services, Directorate for Information Operations and Reports (0704-0188), 1215 Jefferson Davis Highway, Suite 1204, Arlington, VA 22202-4302. Respondents should be aware that notwithstanding any other provision of law, no person shall be subject to any penalty for failing to comply with a collection of information if it does not display a currently valid OMB control number. PLEASE DO NOT RETURN YOUR FORM TO THE ABOVE ADDRESS.
1. REPORT DATEFebruary 2013
2. REPORT TYPEFinal
3. DATES COVERED (From–To)June 2012 – February 2013
4. TITLE AND SUBTITLE
Visible Signatures of Hypersonic Reentry
5a. CONTRACT NUMBER W91WAW-09-C-0003
5b. GRANT NUMBER
5c. PROGRAM ELEMENT NUMBER
6. AUTHOR(S)
Jeremy Teichman Leon Hirsch
5d. PROJECT NUMBER
5e. TASK NUMBER CRP 2165
5f. WORK UNIT NUMBER
7. PERFORMING ORGANIZATION NAME(S) AND ADDRESS(ES)
Institute for Defense Analyses 4850 Mark Center Drive Alexandria, VA 22311-1882
8. PERFORMING ORGANIZATION REPORTNUMBER
IDA Document NS D-4792 Log: H13-000192
9. SPONSORING/MONITORING AGENCY NAME(S) ANDADDRESS(ES)
Institute for Defense Analyses 4850 Mark Center Drive Alexandria, VA 22311-1882
10. SPONSOR/MONITOR’S ACRONYM(S)
11. SPONSOR/MONITOR’S REPORTNUMBER(S)
12. DISTRIBUTION/AVAILABILITY STATEMENT
Approved for public release; distribution is unlimited. (13 March 2013)
13. SUPPLEMENTARY NOTES
14. ABSTRACT
Aerothermal heating of hypersonic reentry bodies can generate significant radiation of visible light. Here, we investigate the conditions for ground-level visibility and what we term noticeability of that radiated light to the unaided human eye. We consider radiated visible light, transmission to ground level as a function of relative observer position, sky background contrast, human contrast perception limits, and psychophysical considerations for attention capture. Considering both pure ballistic trajectories and lifting-body trajectories, we show some examples where we calculate the spatial and temporal viewing zones for both detectability and noticeability. In some cases, these viewing zones extend a significant distance from the impact location and/or include the impact location for a potentially significant period of time before impact.
15. SUBJECT TERMS
16. SECURITY CLASSIFICATION OF: 17. LIMITATIONOF ABSTRACT
SAR
18. NUMBEROF PAGES
34
19a. NAME OF RESPONSIBLE PERSON Mr. Philip Major
a. REPORTUncl.
b. ABSTRACTUncl.
c. THIS PAGEUncl.
19b. TELEPHONE NUMBER (include area code) 703-845-2201
Standard Form 298 (Rev. 8-98) Prescribed by ANSI Std. Z39.18