virtual porous carbons: what they are and what they can be used for
TRANSCRIPT

This article was downloaded by: [University of Saskatchewan Library]On: 16 April 2013, At: 23:03Publisher: Taylor & FrancisInforma Ltd Registered in England and Wales Registered Number: 1072954 Registered office: Mortimer House,37-41 Mortimer Street, London W1T 3JH, UK
Molecular SimulationPublication details, including instructions for authors and subscription information:http://www.tandfonline.com/loi/gmos20
Virtual porous carbons: what they are and what theycan be used forM. J. Biggs a & A. Buts aa Institute for Materials and Processes, University of Edinburgh, King's Buildings, MayfieldRoad, Edinburgh, EH9 3JL, Scotland, UKVersion of record first published: 31 Jan 2007.
To cite this article: M. J. Biggs & A. Buts (2006): Virtual porous carbons: what they are and what they can be used for,Molecular Simulation, 32:7, 579-593
To link to this article: http://dx.doi.org/10.1080/08927020600836242
PLEASE SCROLL DOWN FOR ARTICLE
Full terms and conditions of use: http://www.tandfonline.com/page/terms-and-conditions
This article may be used for research, teaching, and private study purposes. Any substantial or systematicreproduction, redistribution, reselling, loan, sub-licensing, systematic supply, or distribution in any form toanyone is expressly forbidden.
The publisher does not give any warranty express or implied or make any representation that the contentswill be complete or accurate or up to date. The accuracy of any instructions, formulae, and drug doses shouldbe independently verified with primary sources. The publisher shall not be liable for any loss, actions, claims,proceedings, demand, or costs or damages whatsoever or howsoever caused arising directly or indirectly inconnection with or arising out of the use of this material.
Virtual porous carbons: what they are and what theycan be used for
M. J. BIGGS* and A. BUTS
Institute for Materials and Processes, University of Edinburgh, King’s Buildings, Mayfield Road, Edinburgh EH9 3JL, Scotland, UK
(Received December 2005; in final form March 2006)
We use the term “virtual porous carbon” (VPC) to describe computer-based molecular models of nanoporous carbons that gobeyond the ubiquitous slit pore model and seek to engage with the geometric, topological and chemical heterogeneity thatcharacterises almost every form of nanoporous carbon. A small number of these models have been developed and used sincethe early 1990s. These models and their use are reviewed. Included are three more detailed examples of the use of our VPCmodel. The first is concerned with the study of solid-like adsorbate in nanoporous carbons, the second with the absoluteassessment of multi-isotherm based methods for determining the fractal dimension, and the final one is concerned with thefundamental study of diffusion in nanoporous carbons.
Keywords: Adsorption; Anomalous diffusion; Elevated freezing; Nanoporous solids; Microporous carbons
1. Introduction
We use the term ‘virtual porous carbon’ (VPC) to describe
computer-based molecular models of nanoporous carbons
that go beyond the ubiquitous slit pore model and seek to
engage with the geometric, topological and chemical
heterogeneity that characterises almost every form of
nanoporous carbon. We differentiate these from the many
other complex models that have been proposed for
nanoporous carbons since the early 20th century [1,2] by
requiring them to be computer-based and, thus, open to
further analysis or use in molecular simulations.
VPC models first started to appear in the early 1990s.
Since that time, a number of other models have been
advanced and used. Whilst such use has lead to increasing
recognition by the community of the various roles VPC
models can play, there are some who still argue their
complexity makes them of limited use. In light of this and
the fact that there is now a reasonable number of reports
available in the literature on such models and their use, it
is timely to undertake a review and look forward to the
future.
A brief overview of molecular models of nanoporous
carbons will first be undertaken so as to provide the
context for the VPC model developments. The various
VPC models will then be briefly reviewed. This will be
followed by an overview of their usage to date along with
more detailed consideration of three examples drawn from
our own work. We conclude with a discussion of future
challenges both with regards further development of VPC
models as well as their application.
2. Background
As recent reviews [1,2] demonstrate, the history of
modelling what we now term nanoporous carbons is a long
one starting with the work of Debye and Scherrer [3] in the
early 20th century. Many of these models have, of course,
never been used directly in the molecular simulation
context, but rather as a basis for understanding these solids
and phenomena associated with them.
The first molecular simulation studies relating to
nanoporous carbons [4,5] were based on the slit pore
model, which was itself first proposed by Emmett [6] in
1948 and subsequently confirmed quantitatively as an
appropriate model for carbons by others in the mid-1970s
[7,8]. In its most basic form, this model is defined by two
parallel semi-infinite blocks of graphite whose separation
is equal to the pore width. A nanoporous carbon is
typically described in terms of a collection of such pores
of varying width whose intersections are unimportant.
The slit pore model has been the workhorse of the field
since its introduction and is still used regularly (see, for
Molecular Simulation
ISSN 0892-7022 print/ISSN 1029-0435 online q 2006 Taylor & Francis
http://www.tandf.co.uk/journals
DOI: 10.1080/08927020600836242
*Corresponding author. Email: [email protected]
Molecular Simulation, Vol. 32, No. 7, 15 June 2006, 579–593
Dow
nloa
ded
by [
Uni
vers
ity o
f Sa
skat
chew
an L
ibra
ry]
at 2
3:03
16
Apr
il 20
13

example, Refs. [9,10] for recent reviews). It is, however,
widely recognised that its omission of the many
complexities of nanoporous carbons leads to significant
errors and limits its usefulness. For example, experimental
evidence suggests that the walls of carbon micropores are
just a few graphene layers thick [11,12], which have been
shown to yield significantly different adsorption behaviour
compared to pores with thick walls [12,13]. Experimental
evidence also suggests that the pore extents are of the
same order as the pore width, leading to significant
additional accessible surface area and energetic hetero-
geneity from graphene edge sites [14,15]. These sites
additionally play an important role in diffusion processes
[16–18], as does pore system topology (i.e. pore
connectivity, loops and deadend pores) [19]. Pore system
topology is also an important source of isotherm hysteresis
[20]. Nooks and crannies arising from surface defects can
trap molecules [17] and thus be a source of experimentally
observed irreversible adsorption [21]. Finally, heteroatoms
such as nitrogen, sulphur and oxygen are all likely to cause
disruption of pore surfaces [22] and are active sites for
polar molecules such as water [23–25].
The slit pore model, despite its inherent shortcomings, is
here to stay because of its relative simplicity, compara-
tively low computational cost, and its indispensable role in
the day to day characterisation of carbons where
substantially more complex models are unlikely to play a
significant part for the foreseeable future. It is for reasons
such as these that many workers have endeavoured to
address the shortcomings of the model whilst still retaining
the same basic framework. Some have recently incorpor-
ated pore wall thickness distributions within the context of
pore size distribution determination [12], for example.
Several workers have included chemical heterogeneity by
adding active sites of various types to the pore surfaces
[23–25]. Others have used non-rectangular cross-sections
[26]. Single pore junctions formed by the intersection of
slit pores have been used to investigate what effect these
may have on adsorption and transport behaviour [17].
A variety of workers have used etched pore surfaces
[27,28]. Finally, Seaton and co-workers [27] have
attempted to include the effect of pore system topology
by combining the slit pore model with networks.
Whilst these models address to a greater or lesser extent
various shortcomings associated with the basic slit pore
model, there is still a significant gap between the model
and reality. This fact is the motivation for the development
of more complex models that seek to bring us closer to
reality. By doing this, we gain several capabilities, which
will be demonstrated with examples in the latter part of
this paper. Before doing this, however, we briefly review
the various VPC models that have been proposed to date.
3. Overview of existing VPC models
Attempts to address the various deficiencies of the slit pore
model in a more unified manner—i.e. in a single model
framework—were long prevented by the computational
challenges arising from the complexity of carbons and the
length scales that must be spanned to capture everything
from the individual atoms through to the pore system
topology. Such challenges were, at least in part, solved by
the arrival of the parallel supercomputer in the early 1990s
and, more recently, commodity high speed CPUs and large
memory chips. There are now several models which go
well beyond the ubiquitous slit pore model and seek to
engage with the various complexities of real carbons,
although the level of engagement inevitably varies across
the models and, in all cases, is still far from complete.
These models are briefly reviewed here.
The first model that could be reasonably termed a VPC
was that of Biggs and Agarwal [29], which was motivated
by understanding arising from transmission electron
microscopy (TEM) studies [30]. These studies suggest
that carbons are hierarchical in nature, where polyaro-
matic molecules combine to form basic structural units
(BSUs) that in turn aggregate to form regions of local
molecular orientation (LMO) which finally assemble to
create the mesoporous structure typical of nanoporous
carbons [2]. The dimensions of the BSUs and regions of
LMO, the average inter-layer distance within the BSUs
and the mis-orientation of the BSUs with the regions of
LMO can all be determined experimentally [30–33].
Large uniform BSUs and regions of LMO are associated
with more ordered, less or even non-porous, carbons.
Smaller BSUs and regions of LMO accompanied by
greater intra- and inter-LMO disorder are, on the other
hand, typical of nanoporous carbons. If the BSUs are
sufficiently small in such carbons (i.e. 1–2 layers each of
less than ten rings), then greater curvature will arise from
the increased number of five and seven-membered rings
formed between mismatched BSUs.
The VPC models of Biggs and co-workers are
constructed from databases of so-called basic building
elements (BBEs). The precise definition of the BBEs has
varied over the years. The earliest variant [29] used a
relatively small database of 26 different BBEs based on
crystallites of five small (4 £ 5 rings) graphene layers. The
BBEs, which are modelled atomistically, were differ-
entiated by the removal of those carbon atoms that would
have overlapped when adjacent to any of the other 25
BBEs. The BBEs were randomly assembled on a cubic
lattice to yield solids with a particular porosity. By
allowing large volumes to be simulated with relative ease
(e.g. 100 £ 100 £ 100 nm3), it was possible to capture not
only a variety of different pore shapes and surfaces, but
also a very wide range of pore sizes and pore system
topology effects in a single framework. Improvements in
computer power and memory sizes in recent years have
removed any real constraints on the nature of the BBEs
and, therefore, databases of graphene layers, heterocyclic
polyaromatic molecules and functional groups are now
used. A variety of methods have been used to assemble
these into VPC models. In much of the recent work, which
will be discussed in more detail below, an algorithm [34]
M. J. Biggs and A. Buts580
Dow
nloa
ded
by [
Uni
vers
ity o
f Sa
skat
chew
an L
ibra
ry]
at 2
3:03
16
Apr
il 20
13

is used to build fully atomistic models that possess a
particular average BSU inter-layer spacings, pore wall
thicknesses, BSU mis-orientation and porosity.
Another early VPC model was that of Segarra and Glandt
[35], which was once again motivated by understanding
from TEM studies. The BBE for this model is a circular
platelet consisting of a finite number of circular graphene
layers with polar edges. These platelets are akin to the BSU.
The interaction between the platelets and any interstitial
fluid was modelled with a potential function obtained from
integration of the solid–fluid pair interaction over the
platelet volume and edges (i.e. the atomic detail of the
platelets was smeared out). The VPC consisted of an
isotropic assembly of non-overlapping randomly orien-
tated and placed platelets obtained by a MC process. The
VPC model is defined by four parameters—the platelet
radius and thickness, which may be both distributed
although this was not done in Ref. [35], the overall density
of the carbon and the polarity of the platelet edges, all of
which can, once again, be measured experimentally.
The late 1990s saw the deployment of a number of
algorithms that build models that match, within certain
limits, specific atomic-level experimental data. The first such
model was that of Foley and co-workers [36], who used the
SIGNATURE algorithm [37] to construct through a
stochastic process candidate structures with a specific
number of carbon and hydrogen atoms by joining together
fragments drawn from a library of polyaromatic molecules
(they infact describe them as graphene sheets of m £ n
hexagons, but both their figure 6 as well as the existence of
hydrogen atoms suggest they are in fact better described as
polyaromatic). The candidate structures yielded by the
SIGNATURE algorithm often contained unsaturated carbon
atoms. Bonds between unsaturated atom pairs from different
fragments were, therefore, systematically formed—it is
through this process that five and seven-membered rings
were formed, and hence local curvature in the structure was
brought about. Using a classical potential model, the
structure was finally relaxed by a local optimiser.
The SIGNATURE-based approach of Foley and co-
workers was not able to produce any model when the H/C
ratio fell below ,20%, which are typical of many
nanoporous carbons. In an attempt to model such carbons,
these workers used the PDFFIT algorithm [38] to determine
structures that matched the pair distribution function (PDF)
obtained from neutron scattering [39]. This algorithm
minimises the difference between the PDF of the model and
the experimental PDF by a deterministic minimisation least-
squares fitting process operating on the unit cell constants,
atom positions, atomic site occupancies and effective
thermal factors for a single unit cell of graphite under
periodic boundary conditions. Contrary to the SIGNA-
TURE-based approach of Acharya et al. [36], PDFFIT was
more successful at modelling carbons prepared at higher
temperatures because their PDFs contain significant detail
arising from their more ordered structure.
Thomson and Gubbins [40] used a stochastic process to
build model carbons that match the experimental PDF
of the target carbon. In this method, a solid of required
density is built in a fixed volume under periodic boundary
conditions. This is done by randomly placing polyaro-
matic plates of variable shape and distributed size into the
volume, roughly aligned in the same direction but with
random tilts about their in-plane axes. Each polyaromatic
plate is formed from an initial hexagonal ring by
adding/deleting hexagonal rings to/from the edge so as
to achieve the target solid density and plate size
distribution, which is specified by a desired Gaussian
mean and standard deviation. Once formed, this initial
solid is then subject to a so-called reverse Monte Carlo
(r-MC) process in which the polyaromatic plates undergo
the following three MC moves until the PDF (or the
related structure factor) of the model solid matches its
experimental counterpart: (1) translation and re-orien-
tation; (2) ring creation/deletion from the plate boundaries
and (3) occasional plate deletion/addition to counteract the
effect that ring creation/deletion has on the overall solid
density. The attempted MC moves were only accepted if
they lead to a reduction in the difference between the
model and experimental PDF or structure factor. More
recently Gubbins and co-workers [41] have extended the
model to randomly incorporate lactone groups at the plate
edges so as to enable the fundamental study of systems
where polar groups are important (e.g. water adsorption).
The approach of Thomson and Gubbins [40] has also been
recently used to define the microporous structure of a
carbon aerogel model defined by a random assembly of
partially overlapping microporous beads [42].
The major problem associated with building models by
forcing them to match specific experimental data is their
lack of uniqueness—there are potentially many models
that will satisfy the experimental data. The classic
example of this is the wide spread use of the porosity to
build solids where it is obvious that there is an infinite
number of ways in which the porosity may be configured,
many leading to profoundly different adsorption and
transport behaviour. Addressing this lack of uniqueness
has characterised much of the most recent work in VPC
model development. In principle this can be done by
bringing to bear extra discriminating information. The
extra information may come in three different guises. The
first is to apply constraints that capture various
experimental observations or physics. An example of
this approach is seen in the latest models from Gubbins
and co-workers [43] and in the recent work of Zetterstrom
et al. [44] who both impose constraints that allow the
CZCZC bond angles to take on values distributed around
1208 to maintain the strong sp2 character of nanoporous
carbons yet allow the formation of five and seven-
membered rings which, on the basis of experimental
observations, are now thought to exist in carbons. A
variety of other constraints have also been imposed
including the imposition of specific mean coordination
numbers on the carbon atoms commensurate with the
chemistry of the target solid [43], and exclusion of certain
CZC separations [44]. An alternative approach is to use
Virtual porous carbons (VPCs) 581
Dow
nloa
ded
by [
Uni
vers
ity o
f Sa
skat
chew
an L
ibra
ry]
at 2
3:03
16
Apr
il 20
13

additional experimental data as part of the objective
function—this approach has not been practised in its most
general from (e.g. fitting spectra from multiple experi-
mental methods) but Zetterstrom et al. [44] have used
Raman spectra data to establish a better starting structure
for the reverse MC process compared to the completely
random structures used by others. The final choice is to
bring to bear some further physics or chemistry—this is
done by Peterson et al. [45] who use an environment-
dependent potential function in conjunction with the
experimental PDFs and static structure factor.
All the approaches reviewed so far are so-called
reconstruction methods—they seek to build structures that
match experimental characteristics of existing carbons.
The alternative is the mimetic approach, where the model
is built by mimicking the process used to manufacture the
solid. This approach has the advantage that it will, at least
in principle, lead to a unique model. The complexity of
nanoporous carbons and the processes involved in their
production mean, however, that such an approach is very
far from trivial. It is, therefore, not surprising that little
work has been done in this direction. Relevant quantum
[46] and classical [47] molecular simulations of
carbonization have both been reported, but none have
been concerned with building VPC models for nanoporous
carbons. One group has, however, recently published a MC
based mimetic approach for the production of nanoporous
carbon from polyfurfuryl alcohol (PFA) precursors [48].
The reconstruction methods may be broadly divided into
two groups. The first group [29,34,35] aims to build
structures that satisfy meanfield experimental quantities
such as porosity, density, average inter-layer spacing and so
on. As they build molecular models from super-molecular
and mesoscale-level data, this approach can be reasonably
termed “top-down reconstruction”. These top-down recon-
struction methods are computationally inexpensive, thus
allowing large volumes and mesoscale structure to be
modelled rapidly and with relative ease. The second group of
reconstruction methods [36,39,40,43–45] build molecular
models by engaging directly with the atomic characteristics
of the target solid in the form of, for example, the PDF. This
direct engagement with the atomic details, or “bottom-up
reconstruction”, means the correct detailed atomic structure
is likely to be captured provided sufficient information is
included. This gain comes at the price of much higher
computational expense which limits the volumes that can be
reasonably modelled, at least currently.
As we will show in the following section, the models
obtained from top-down reconstruction can be used in a
variety of very useful ways that inform fundamental
understanding and potentially advance practise. They do,
however, suffer from the problem that they are unlikely to
capture accurately the detailed microstructure of real
carbons and, therefore, they will be of limited use in some
applications such as, for example, the design of processes
that follow the manufacture of the carbons (e.g. catalyst
impregnation). In such cases, the bottom-up reconstruction
methods will come to the fore, but many improvements
in these models are still necessary. For example, the
models cannot currently capture mesoscale structure
except, possibly, in special cases (e.g. carbon aerogels
perhaps). For this to happen, multiscale modelling
approaches must be developed, further improvements in
the experimental data must come (e.g. high resolution and
longer-range PDFs), more mesoscale experimental data
must be used (e.g. that from SANS and analysis of TEM
images), and multiple data must be exploited.
4. What can VPC models be used for
4.1 Overview
VPC models can be used in four different ways: structural
elucidation, fundamental study, assessment of simpler
models and design. Examples of the first three may be
found in the literature. A brief review of this literature
follows here along with three, more detailed, examples
drawn from our own work.
The activity of structural elucidation of carbon structure
is as old as the first X-ray experiments on carbons [2].
A large range of models for carbons have been proposed
since this time. Whilst some of these are remarkably
similar despite their development being independent, many
are also fundamentally very different. Computer-aided
structural elucidation offers the chance to address this
situation by allowing more data to be used when building
the models and by speeding the search for possible
structures. Whilst arguably all VPC models derived by the
bottom-up reconstruction or mimetic approaches may be
viewed as attempts at structural elucidation, just a few
studies were specifically concerned with this issue. Foley
and co-workers were interested in elucidating how the
structure of a char derived from PFA changed with
pyrolysis temperature. They used two approaches. The
first, which exploited the H/C ratio (see above) [36], lead to
structures whose order increased as the pyrolysis
temperature decreased, counter to most experimental
evidence including their own (viz. compare figure 15 in
Ref. [36] with figure 2 in Ref. [39]). By using PDFs rather
than the chemistry, Foley and co-workers in their second
approach [39] obtained more satisfactory results, indicat-
ing that the use of the PDF is preferential, although it was
also noted that PDFs are not sufficient for highly disordered
carbons. Peterson et al. [45] used additional data and an
environment-dependent potential function in their struc-
tural elucidation studies to overcome this problem.
Both the groups of Biggs and Gubbins have used VPC
models extensively for the fundamental study of adsorption
within carbons, and revealed phenomena that cannot be
obtained by the slit pore model. For example, Thomson and
Gubbins [40] found evidence for capillary condensation in
pores of ,14.5 A which the slit pore model would not
predict—Biggs et al. [34] found similar behaviour and
proposed the concept of pore space convexity to explain this
phenomena. In studying the adsorption of water in a VPC
model containing lactone groups, Brennan et al. [41] showed
M. J. Biggs and A. Buts582
Dow
nloa
ded
by [
Uni
vers
ity o
f Sa
skat
chew
an L
ibra
ry]
at 2
3:03
16
Apr
il 20
13

how small amounts of water adsorption on these groups may
block pores leading to significant reductions in accessible
porosity, a phenomena that is often seen in practise. As will
be outlined below in more detail, Biggs et al. [34] found that
adsorbate densities of atomic or spherical molecular fluids
can significantly exceed those of the bulk liquid and
approach those of the bulk random solid despite the
disruptive effects of complex pore structures. A similar
finding was recently reported by Pikunic et al. [49] using
their VPC model.
Whilst it has received less attention, VPC models have
also been used in the fundamental study of mass transport in
carbon nanopore spaces. The first such studies were those of
Biggs and Agarwal [29,50], who considered the mass
transport of atomic and diatomic gases within complex
carbon pore spaces using equilibrium molecular
dynamics—they showed that transport of gases in carbons
is sub-diffusive when the porosity approaches the percola-
tion threshold, which is itself a function not only of the solid,
but also the fluid and temperature. As we will see below, this
work has been more recently extended to higher pressures
using equilibrium and non-equilibrium molecular dynamic
methods. Pikunic and Gubbins [51] also recently reported on
a study of diffusion of fluids as a function of loading in their
VPC model using equilibrium molecular dynamics. They
observed a maximum in the self-diffusion coefficient with
loading and obtained diffusivities over an order of magnitude
smaller than those obtained from a slit pore model with the
same mean pore size.
Simple models such as the slit pore model still have a
real role to play despite the development of the more
complex VPC models reviewed here. Perhaps one of the
areas where simple models will long be used into the future
is characterisation of carbons. This continued use of simple
models means it is important to assess them and determine
where they are likely to fail. Motivated by this, Biggs and
co-workers have used their VPC models to extensively
assess both carbon characterisation methods [52,53] and,
more recently, pore network models for diffusion [53].
4.2 More detailed examples
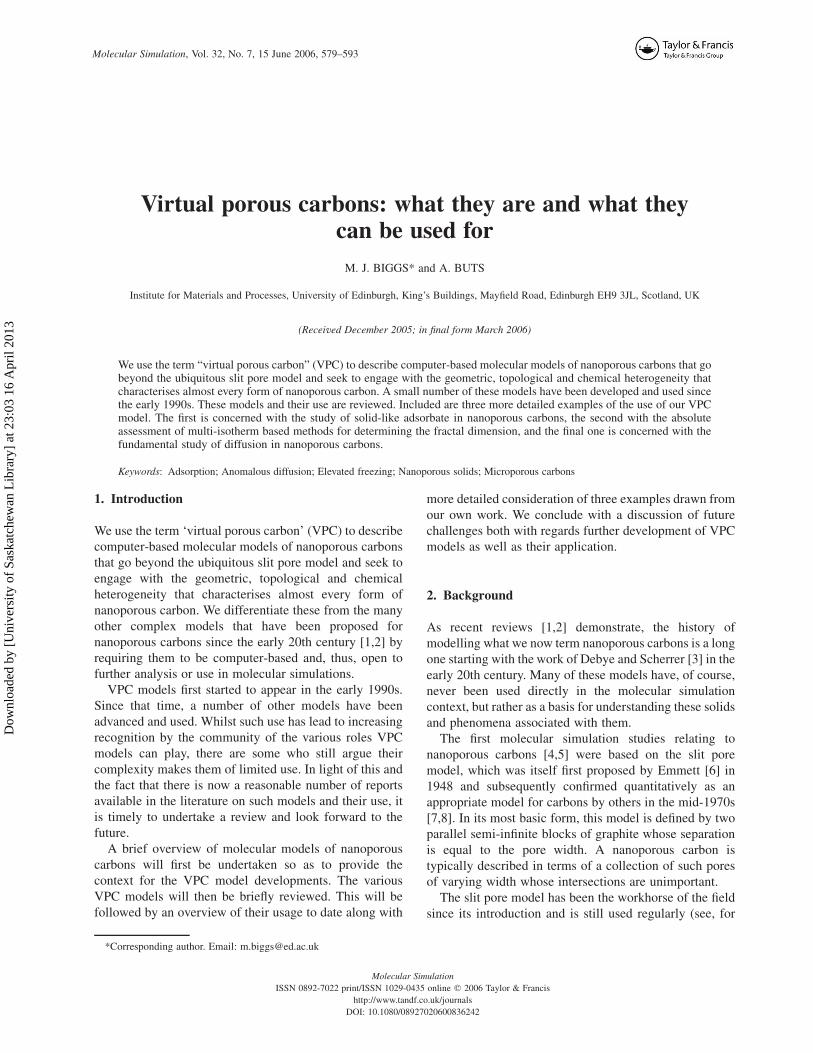
4.2.1 Model and simulation details. We have worked
with nearly 40 different VPC models in our recent studies.
We restrict attention here to just two of these models,
which are shown in figure 1 along with their cavity size
distributions as measured by MC integration with hard
spheres. Both models were generated following the
procedure given in Biggs et al. [34]. The first, termed 1P
(this code is consistent with all other publications), is built
using small BSUs of m ¼ 1 2 3 parallel evenly spaced
graphene domains of size 9.82 £ 12.76 A2 arranged
randomly in such a way as to achieve a desired porosity
and average d002. The second model, 1P(15,15) is derived
from the first by simply randomly tilting the BSUs up to
^158 about the xa and xb0 axes to create a porosity in
which no pores are parallel-sided slits and where opposing
pore walls can be of differing character (e.g. an armchair
surface may in part be opposed by a basal surface). The
complex microporosity of both solids effectively decou-
ples the rigid link between pore size and energy that exists
in simpler models [34]. Whilst these models have not been
built to match the characteristics of any specific carbon,
previous work [34] has demonstrated that these and
similar models can produce a wide range of isotherm
shapes and heat of adsorption loading dependencies that
match those observed experimentally.
The fluids were all modelled by a spherical Lennard-Jones
(LJ) molecule. Both the fluid–fluid and fluid–solid atom
interactions were modelled with a truncated and shifted
pair potential [54]
fðrÞ ¼fLJðrÞ2 fLJðrcÞ for r , rc
0 for r $ rc
(ð1Þ
with
fLJðrÞ ¼ 41ijsij
r
� �12
2sij
r
� �6� �
ð2Þ
where r is the distance between the pair of interacting
centres, rc is the cut-off radius, and 1ij and sij are the LJ
energy and length parameters respectively for interaction
between species i and j.
The carbon interaction parameters 1C ¼ 28kb K and
sC ¼ 3.4 A [55] were used. The interaction parameters for
the fluids are given below for each example. Fluid–solid
interaction parameters were derived using the Lorentz-
Berthelot combining rules [54].
Adsorption was simulated by the cavity biased grand
canonical Monte Carlo (GCMC) method of Mezei [56].
Points on the adsorption and desorption isotherms are
generated in this method by changing the chemical
potential, which is related to the bulk phase pressure by
standard thermodynamic relations acting on a suitable
equation of state for the bulk fluid, details of which also
follow below for the various fluids considered. The
simulation for each point on the adsorption and desorption
isotherms was started using the final state of the previous
point, with the first point of the adsorption and desorption
isotherms starting from an empty pore structure and the
last point of the associated adsorption isotherm respect-
ively. Each point was determined using 50 £ 103
equilibration steps per molecule, where a step is one
attempted move and one attempted insertion/deletion,
followed by at least max(106, 50 £ 103 steps per molecule,
ten insertions/deletions per molecule) production steps;
the first of these applies at low loadings, the second at
moderate loadings and the last at high loadings where
insertion and deletion are difficult. In the case of suspected
phase transitions and other special cases, up to fifty times
this number of production steps were used.
Diffusion was simulated using canonical equilibrium
molecular dynamics (EMD) [57]. The number of
molecules corresponding to the desired bulk pressure
were initially inserted using GCMC. Once equilibrated,
Virtual porous carbons (VPCs) 583
Dow
nloa
ded
by [
Uni
vers
ity o
f Sa
skat
chew
an L
ibra
ry]
at 2
3:03
16
Apr
il 20
13
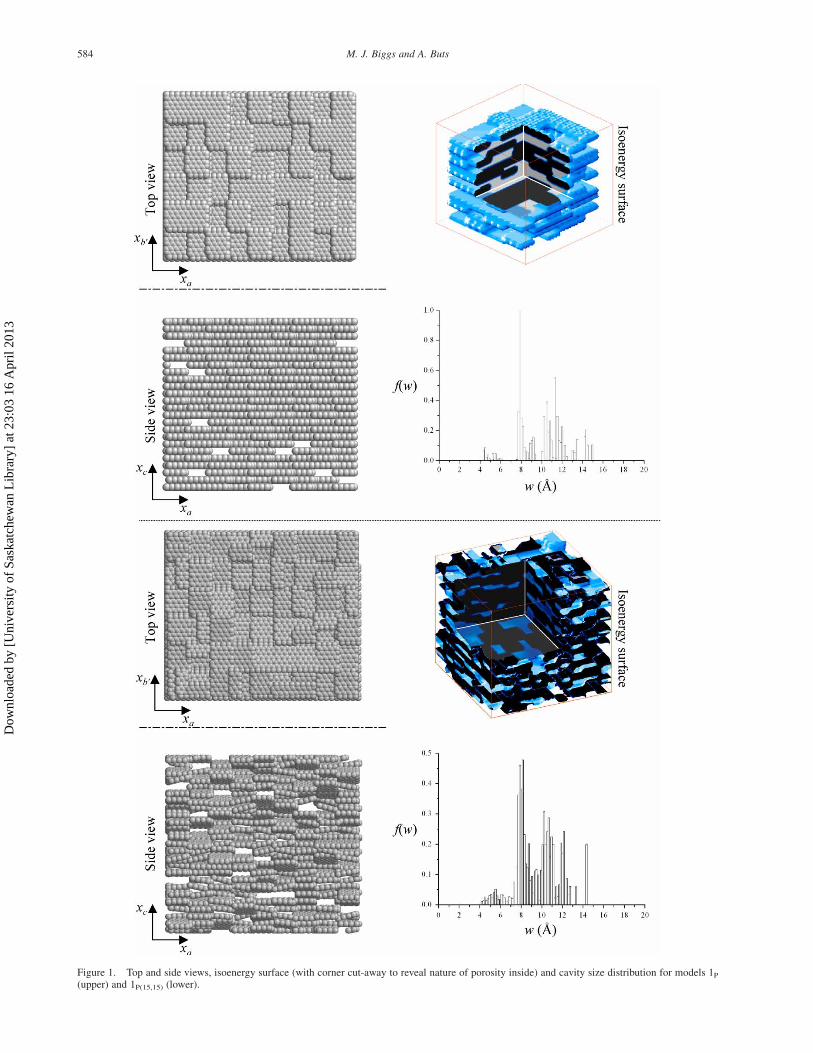
Figure 1. Top and side views, isoenergy surface (with corner cut-away to reveal nature of porosity inside) and cavity size distribution for models 1P
(upper) and 1P(15,15) (lower).
M. J. Biggs and A. Buts584
Dow
nloa
ded
by [
Uni
vers
ity o
f Sa
skat
chew
an L
ibra
ry]
at 2
3:03
16
Apr
il 20
13

the molecules were allocated random velocities from a
Maxwellian distribution with a mean appropriate to the
desired temperature. The net velocity of the ensemble was
set to zero and the ensemble temperature re-set to the
desired value by direct rescaling of the molecule
velocities. 50 £ 103 timesteps were used for equilibration
followed by a further 100 £ 103 timesteps for production.
The timestep size in all cases was set at Dt * ¼ 0:01, where
t ¼ t *sf
ffiffiffiffiffiffiffiffiffiffiffiffimf =1f
pis the reduced time [54].
4.2.2 Fundamental study of adsorption in carbons. The
use of the slit pore model both before and following the
take-up of molecular simulation has greatly improved our
understanding of adsorption in porous carbon—the idea
that there is an optimal pore “width” that maximises the
storage of a gas on carbon is one good example of
improved understanding. The model, however, imposes a
symmetry that is unlikely to exist in most (any?) real
carbons. This symmetry has several implications, but the
one of particular interest here is the structural order that
this symmetry places on the adsorbate and the consequent
phase behaviour, especially so-called elevated freezing in
carbons, where the adsorbed fluid is believed to freeze at
temperatures well above that of the bulk freezing point
[58]. This freezing phenomena has been well studied using
the slit pore model (see Biggs et al. [34] for a recent brief
review). Whilst there is some experimental evidence that
supports some of the results obtained from the slit pore
studies [58,59], there is the question of what happens if the
pore symmetry is broken as one would expect in a real
carbon—how significant is elevated freezing in this case?
We undertook a study of this by carrying out an extensive
study of adsorption of N2 at 77 K on our VPC models. The
N2 interaction model parameters 1N2¼ 95.2kb J and
sN2¼ 3.75 A [60] were used with the bulk phase equation
of state of Smit [61]. An overview of this work and some
more recent results are given here whilst the reader is
referred to Biggs et al. [34] for more fuller details.
The predicted N2 densities at saturation in the solids P1
and P1(15,15) substantially exceeded that of the bulk liquid
state and in fact approached that of a random close
packing of spheres. These densities clearly suggest the
adsorbate is unlikely to be entirely liquid-like, and may
well be solid-like in places, especially if size exclusion
effects are accounted for [62]. Further investigation was
undertaken by consideration of the singlet distribution
function (SDF) (i.e. the local density distribution)
throughout the pore space to reveal solid-like adsorbate
did indeed exist in these solids despite the temperature
being well above the bulk freezing point, figure 2. The
figure for model 1P(15,15) shows that solid-like adsorbate
can even be found in solids where parallel-sided slit pore
geometry is virtually non-existent.
Inspection of the SDF throughout the filling process
shows that solid-like regions exist even well below
saturation (e.g. points A on figure 3). The point B in this
figure shows a region where the adsorbate undergoes a
freezing-melting-refreezing process as the pressure
increases. It appears as if this is caused by the need for
locally-frozen regions to re-arrange themselves as the
space around them fills. These local phase transitions were
observed to be reversible with pressure.
4.2.3 Absolute assessment of characterisation
methods. Characterisation of the porosity of carbons is
essential to their design and utilisation. Although
adsorption is by far the most widely used means of
providing such characterisation, it is not without its
problems [63]; these may be broadly described in terms of
correctness, consistency (i.e. is the parameter purely
related to what it purports to represent or does it “include”
more), and meaningfulness (e.g. what does “surface area”
mean in a microporous solid) [52]. Much effort has been
directed towards addressing these concerns using relative
assessment in which data obtained from two or more
methods for a solid are compared [64,65]. This approach is
rarely satisfying for a variety of reasons including,
amongst others, the difficulty faced in understanding any
observed differences [52].
An alternative to relative assessment is to use a solid
whose characteristics are exactly known and for which the
interstitial fluid behaviour can be probed in detail. Whilst
such an absolute assessment process is (perhaps)
experimentally feasible for solids such as zeolites, it is
clearly not for ill-defined solids like carbons, which are
most in need of assessment. We have, therefore, developed
and applied a molecular simulation based methodology
for the absolute assessment of adsorption-based charac-
terisation methods, which is illustrated in figure 4. Briefly,
GCMC simulation is used to determine the sorption
isotherms for a model fluid in a VPC for which measures
of the characteristics are known exactly. The sorption
isotherms are then submitted to the method to be assessed
and estimates obtained. These estimates are compared
with the corresponding exactly known measures and
conclusions are drawn regarding the correctness (closed
loop in figure 4) and, if appropriate, meaningfulness and
consistency of the methods for the particular model
system. Reasons for lack of correctness can be identified
and assessment of meaningfulness and consistency can be
made by probing the adsorption process at the molecular
level; such analysis can be used to suggest improvements
to the characterisation method (feedback loop in figure 4)
or an entirely new method that can in turn be assessed.
We have applied the absolute assessment methodology
illustrated in figure 4 to a wide range of characterisation
methods including the comparison and SPE methods [52],
methods based on the Langmuir and BET models [66] and
the Polanyi-Dubinin isotherms [67], and methods for
determining the pore size distribution [53,68], connectivity
[53,68], adsorption energies [69] and fractal dimension
[53,70]—an example from the last study is presented here.
The actual fractal dimension and the range of fractility
against which the adsorption-based methods are compared
are determined using the so-called box-counting method,
Virtual porous carbons (VPCs) 585
Dow
nloa
ded
by [
Uni
vers
ity o
f Sa
skat
chew
an L
ibra
ry]
at 2
3:03
16
Apr
il 20
13

which exploits the basic definition of a fractal [71]
Nb / L2Db ð3Þ
where, in the current context, Nb(L) is the number of cubes
of size L in a cubic tessellation that intersect the pore
surface when it is superimposed on the porous solid, and
Db is box-counting dimension, which is in general equal to
the fractal dimension. The range of fractility, wl # wf #
wu, is defined by the bounds of the linear region of the
logNb vs. log(1/L) plot where the slope, which is equal to
Db, falls between 2 and 3. Application of the box counting
Figure 2. Three xa–xc planes ,1.875 A (i.e. ,0.5 sf) apart through the SDF for model 1P (left) and model 1P(15,15) (right) at saturation. A log colourscale has been used to facilitate presentation of solid-like and fluid densities in a single plot. The solid atoms within ^1.875 A of the plane are shown inred and the inaccessible regions of each plane are shaded to demonstrate that all the accessible volume is occupied (note that many of the unfilled spacesin one plane are matched by highly-localised adsorbate in adjacent planes). The circled regions indicate liquid-like (A), well-localised high density (B)and solid-like (C) adsorbate (after Biggs et al. [34]).
M. J. Biggs and A. Buts586
Dow
nloa
ded
by [
Uni
vers
ity o
f Sa
skat
chew
an L
ibra
ry]
at 2
3:03
16
Apr
il 20
13

approach to model 1P leads to the fractal dimension and
range of fractility given at the top of table 1. The fractal
dimension indicates that the surface thoroughly explores
3D space at a local level, whilst the range of fractility
corresponds to the size of the nitrogen molecule at the
lower end and somewhat below the maximum pore size at
the upper end.
A wide range of different adsorption-based methods
have been proposed for the determination of the fractal
dimension D. The earliest involves exploiting the
Figure 3. A plane (xc ¼ 74.06 A) through the SDF of model 1P for a number of loadings: (a) P/P0 ¼ 2.0 £ 1025; (b) P/P0 ¼ 1.4 £ 1024; (c)P/P0 ¼ 9.0 £ 1024; (d) P/P0 ¼ 5.9 £ 1023; (e) P/P0 ¼ 4.0 £ 1022; (f) P/P0 ¼ 1.0 £ 1021. A log colour scale has been used to facilitate presentationof solid-like and fluid densities in a single plot. The solid atoms within ^1.875 A of the plane are shown in red. See text for discussion pertaining to thecircled regions.
Virtual porous carbons (VPCs) 587
Dow
nloa
ded
by [
Uni
vers
ity o
f Sa
skat
chew
an L
ibra
ry]
at 2
3:03
16
Apr
il 20
13
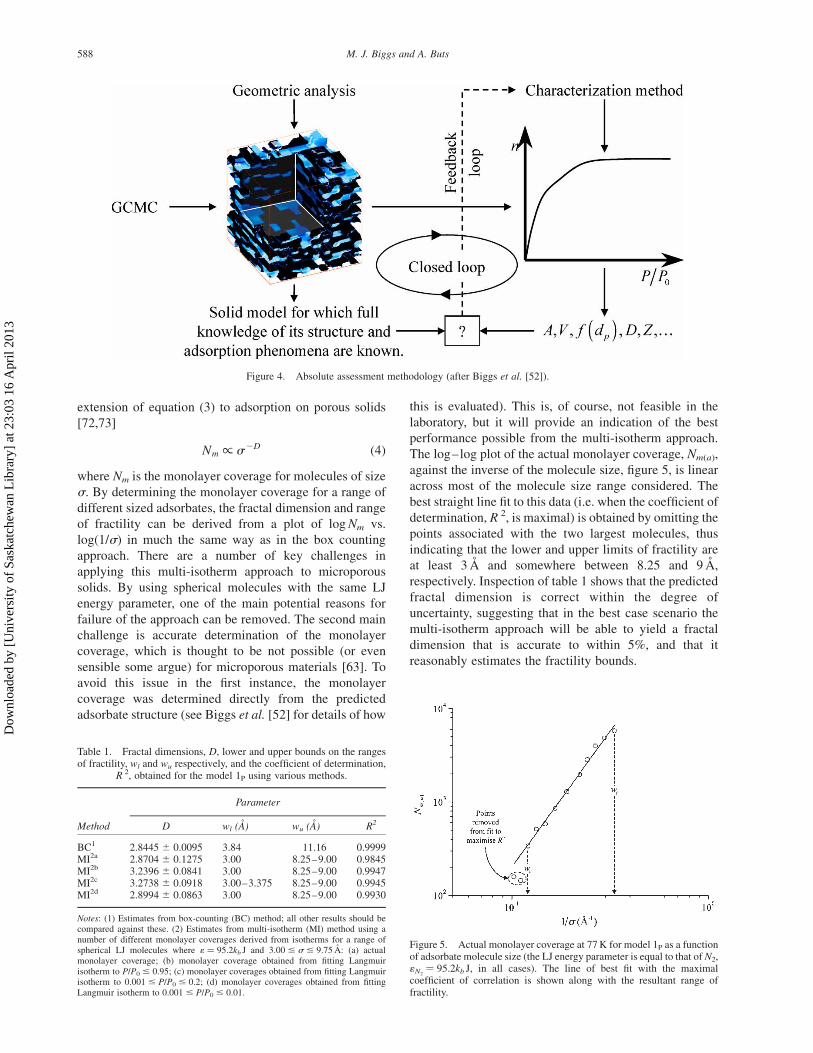
extension of equation (3) to adsorption on porous solids
[72,73]
Nm / s2D ð4Þ
where Nm is the monolayer coverage for molecules of size
s. By determining the monolayer coverage for a range of
different sized adsorbates, the fractal dimension and range
of fractility can be derived from a plot of logNm vs.
log(1/s) in much the same way as in the box counting
approach. There are a number of key challenges in
applying this multi-isotherm approach to microporous
solids. By using spherical molecules with the same LJ
energy parameter, one of the main potential reasons for
failure of the approach can be removed. The second main
challenge is accurate determination of the monolayer
coverage, which is thought to be not possible (or even
sensible some argue) for microporous materials [63]. To
avoid this issue in the first instance, the monolayer
coverage was determined directly from the predicted
adsorbate structure (see Biggs et al. [52] for details of how
this is evaluated). This is, of course, not feasible in the
laboratory, but it will provide an indication of the best
performance possible from the multi-isotherm approach.
The log–log plot of the actual monolayer coverage, Nm(a),
against the inverse of the molecule size, figure 5, is linear
across most of the molecule size range considered. The
best straight line fit to this data (i.e. when the coefficient of
determination, R 2, is maximal) is obtained by omitting the
points associated with the two largest molecules, thus
indicating that the lower and upper limits of fractility are
at least 3 A and somewhere between 8.25 and 9 A,
respectively. Inspection of table 1 shows that the predicted
fractal dimension is correct within the degree of
uncertainty, suggesting that in the best case scenario the
multi-isotherm approach will be able to yield a fractal
dimension that is accurate to within 5%, and that it
reasonably estimates the fractility bounds.
Table 1. Fractal dimensions, D, lower and upper bounds on the rangesof fractility, wl and wu respectively, and the coefficient of determination,
R 2, obtained for the model 1P using various methods.
Parameter
Method D wl (A) wu (A) R2
BC1 2.8445 ^ 0.0095 3.84 11.16 0.9999MI2a 2.8704 ^ 0.1275 3.00 8.25–9.00 0.9845MI2b 3.2396 ^ 0.0841 3.00 8.25–9.00 0.9947MI2c 3.2738 ^ 0.0918 3.00–3.375 8.25–9.00 0.9945MI2d 2.8994 ^ 0.0863 3.00 8.25–9.00 0.9930
Notes: (1) Estimates from box-counting (BC) method; all other results should becompared against these. (2) Estimates from multi-isotherm (MI) method using anumber of different monolayer coverages derived from isotherms for a range ofspherical LJ molecules where 1 ¼ 95.2kb J and 3.00 # s # 9.75 A: (a) actualmonolayer coverage; (b) monolayer coverage obtained from fitting Langmuirisotherm to P/P0 # 0.95; (c) monolayer coverages obtained from fitting Langmuirisotherm to 0.001 # P/P0 # 0.2; (d) monolayer coverages obtained from fittingLangmuir isotherm to 0.001 # P/P0 # 0.01.
Figure 4. Absolute assessment methodology (after Biggs et al. [52]).
Figure 5. Actual monolayer coverage at 77 K for model 1P as a functionof adsorbate molecule size (the LJ energy parameter is equal to that of N2,1N2
¼ 95.2kb J, in all cases). The line of best fit with the maximalcoefficient of correlation is shown along with the resultant range offractility.
M. J. Biggs and A. Buts588
Dow
nloa
ded
by [
Uni
vers
ity o
f Sa
skat
chew
an L
ibra
ry]
at 2
3:03
16
Apr
il 20
13
Practical application of the multi-isotherm approach
requires use of the BET or Langmuir isotherms to
determine the monolayer coverages. Whilst this is not
recommended for microporous solids [63], it is still widely
practised. In such cases, one of the main problems is over
what pressure range should the BET or Langmuir
isotherms be applied to determine the monolayer cover-
age. To assess this in the case of the Langmuir isotherm
(see [66] for fuller analysis of these isotherms), we
considered the: (1) entire pressure range, (2)
0.001 # P/P0 # 0.2, where the upper limit was always
above the knee and (3) 0.001 # P/P0 # 0.01. The last of
these pressure ranges yielded the most accurate monolayer
coverages and fractal dimension, table 1. The less accurate
monolayer predictions obtained from the other two
pressure ranges in this instance lead to nonsensical fractal
dimensions, table 1. These results suggest that the correct
fractal dimension can be determined by the multi-isotherm
approach provided the pressure range for determining the
monolayer coverage is correctly identified.
4.2.4 Fundamental study of diffusion in carbons. We
have recently extended our earlier diffusion work [29,50]
to consider the effect of pressure. By way of example, we
present here some results obtained for diffusion of
methane (sCH4¼ 3.7327 A and 1CH4
¼ 149.92kb J) [74] in
models 1P and 1P(15,15) from 1 to 40 bar.
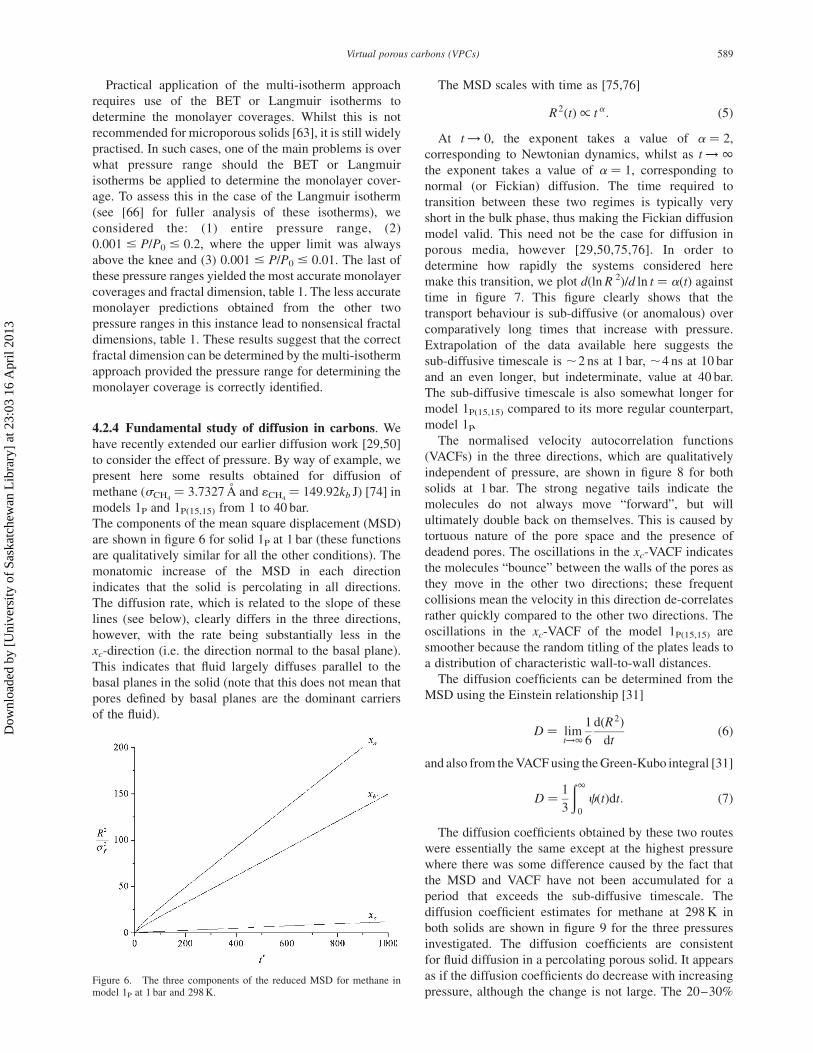
The components of the mean square displacement (MSD)
are shown in figure 6 for solid 1P at 1 bar (these functions
are qualitatively similar for all the other conditions). The
monatomic increase of the MSD in each direction
indicates that the solid is percolating in all directions.
The diffusion rate, which is related to the slope of these
lines (see below), clearly differs in the three directions,
however, with the rate being substantially less in the
xc-direction (i.e. the direction normal to the basal plane).
This indicates that fluid largely diffuses parallel to the
basal planes in the solid (note that this does not mean that
pores defined by basal planes are the dominant carriers
of the fluid).
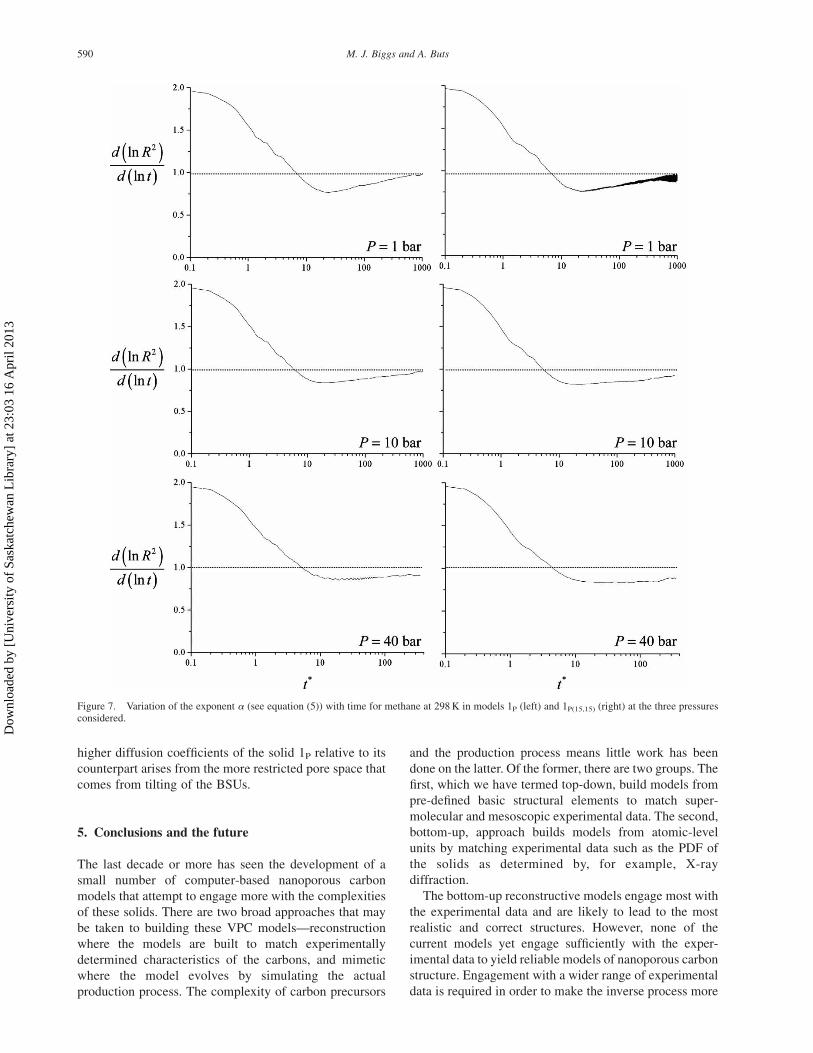
The MSD scales with time as [75,76]
R2ðtÞ / ta: ð5Þ
At t ! 0, the exponent takes a value of a ¼ 2,
corresponding to Newtonian dynamics, whilst as t ! 1
the exponent takes a value of a ¼ 1, corresponding to
normal (or Fickian) diffusion. The time required to
transition between these two regimes is typically very
short in the bulk phase, thus making the Fickian diffusion
model valid. This need not be the case for diffusion in
porous media, however [29,50,75,76]. In order to
determine how rapidly the systems considered here
make this transition, we plot d(lnR 2)/d ln t ¼ a(t) against
time in figure 7. This figure clearly shows that the
transport behaviour is sub-diffusive (or anomalous) over
comparatively long times that increase with pressure.
Extrapolation of the data available here suggests the
sub-diffusive timescale is ,2 ns at 1 bar, ,4 ns at 10 bar
and an even longer, but indeterminate, value at 40 bar.
The sub-diffusive timescale is also somewhat longer for
model 1P(15,15) compared to its more regular counterpart,
model 1P.
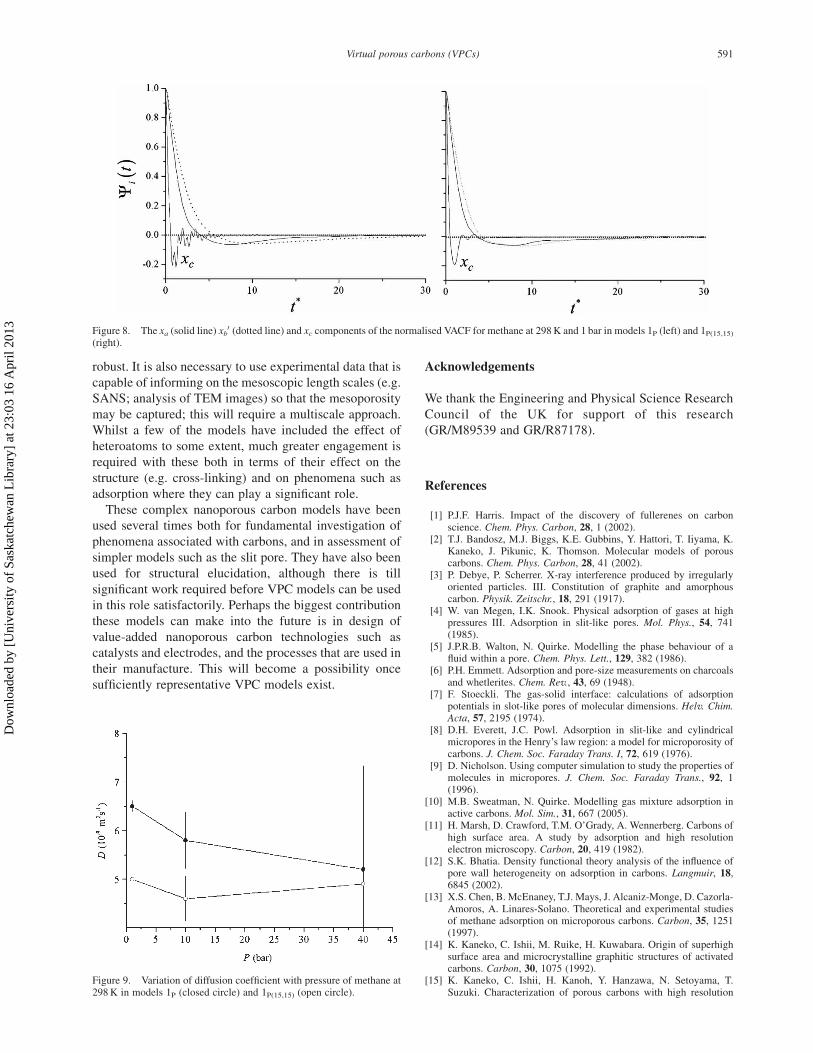
The normalised velocity autocorrelation functions
(VACFs) in the three directions, which are qualitatively
independent of pressure, are shown in figure 8 for both
solids at 1 bar. The strong negative tails indicate the
molecules do not always move “forward”, but will
ultimately double back on themselves. This is caused by
tortuous nature of the pore space and the presence of
deadend pores. The oscillations in the xc-VACF indicates
the molecules “bounce” between the walls of the pores as
they move in the other two directions; these frequent
collisions mean the velocity in this direction de-correlates
rather quickly compared to the other two directions. The
oscillations in the xc-VACF of the model 1P(15,15) are
smoother because the random titling of the plates leads to
a distribution of characteristic wall-to-wall distances.
The diffusion coefficients can be determined from the
MSD using the Einstein relationship [31]
D ¼ limt!1
1
6
dðR2Þ
dtð6Þ
and also from the VACF using the Green-Kubo integral [31]
D ¼1
3
ð10
cðtÞdt: ð7Þ
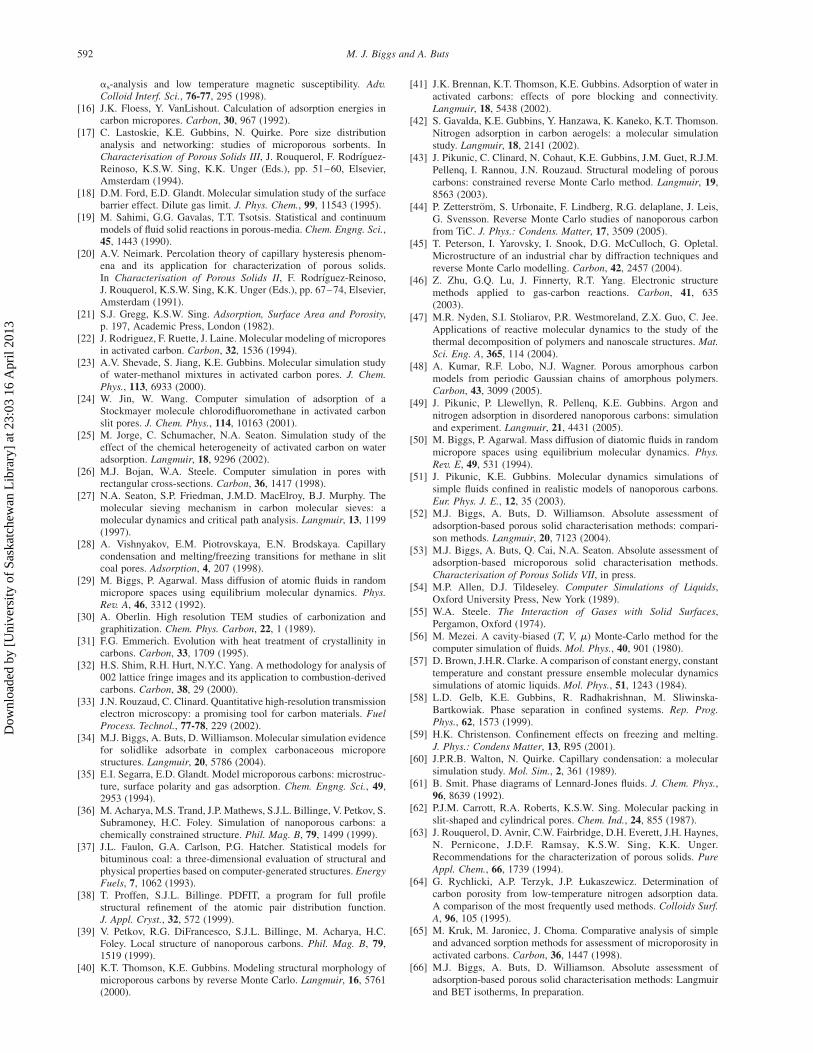
The diffusion coefficients obtained by these two routes
were essentially the same except at the highest pressure
where there was some difference caused by the fact that
the MSD and VACF have not been accumulated for a
period that exceeds the sub-diffusive timescale. The
diffusion coefficient estimates for methane at 298 K in
both solids are shown in figure 9 for the three pressures
investigated. The diffusion coefficients are consistent
for fluid diffusion in a percolating porous solid. It appears
as if the diffusion coefficients do decrease with increasing
pressure, although the change is not large. The 20–30%Figure 6. The three components of the reduced MSD for methane inmodel 1P at 1 bar and 298 K.
Virtual porous carbons (VPCs) 589
Dow
nloa
ded
by [
Uni
vers
ity o
f Sa
skat
chew
an L
ibra
ry]
at 2
3:03
16
Apr
il 20
13
higher diffusion coefficients of the solid 1P relative to its
counterpart arises from the more restricted pore space that
comes from tilting of the BSUs.
5. Conclusions and the future
The last decade or more has seen the development of a
small number of computer-based nanoporous carbon
models that attempt to engage more with the complexities
of these solids. There are two broad approaches that may
be taken to building these VPC models—reconstruction
where the models are built to match experimentally
determined characteristics of the carbons, and mimetic
where the model evolves by simulating the actual
production process. The complexity of carbon precursors
and the production process means little work has been
done on the latter. Of the former, there are two groups. The
first, which we have termed top-down, build models from
pre-defined basic structural elements to match super-
molecular and mesoscopic experimental data. The second,
bottom-up, approach builds models from atomic-level
units by matching experimental data such as the PDF of
the solids as determined by, for example, X-ray
diffraction.
The bottom-up reconstructive models engage most with
the experimental data and are likely to lead to the most
realistic and correct structures. However, none of the
current models yet engage sufficiently with the exper-
imental data to yield reliable models of nanoporous carbon
structure. Engagement with a wider range of experimental
data is required in order to make the inverse process more
Figure 7. Variation of the exponent a (see equation (5)) with time for methane at 298 K in models 1P (left) and 1P(15,15) (right) at the three pressuresconsidered.
M. J. Biggs and A. Buts590
Dow
nloa
ded
by [
Uni
vers
ity o
f Sa
skat
chew
an L
ibra
ry]
at 2
3:03
16
Apr
il 20
13
robust. It is also necessary to use experimental data that is
capable of informing on the mesoscopic length scales (e.g.
SANS; analysis of TEM images) so that the mesoporosity
may be captured; this will require a multiscale approach.
Whilst a few of the models have included the effect of
heteroatoms to some extent, much greater engagement is
required with these both in terms of their effect on the
structure (e.g. cross-linking) and on phenomena such as
adsorption where they can play a significant role.
These complex nanoporous carbon models have been
used several times both for fundamental investigation of
phenomena associated with carbons, and in assessment of
simpler models such as the slit pore. They have also been
used for structural elucidation, although there is till
significant work required before VPC models can be used
in this role satisfactorily. Perhaps the biggest contribution
these models can make into the future is in design of
value-added nanoporous carbon technologies such as
catalysts and electrodes, and the processes that are used in
their manufacture. This will become a possibility once
sufficiently representative VPC models exist.
Acknowledgements
We thank the Engineering and Physical Science Research
Council of the UK for support of this research
(GR/M89539 and GR/R87178).
References
[1] P.J.F. Harris. Impact of the discovery of fullerenes on carbonscience. Chem. Phys. Carbon, 28, 1 (2002).
[2] T.J. Bandosz, M.J. Biggs, K.E. Gubbins, Y. Hattori, T. Iiyama, K.Kaneko, J. Pikunic, K. Thomson. Molecular models of porouscarbons. Chem. Phys. Carbon, 28, 41 (2002).
[3] P. Debye, P. Scherrer. X-ray interference produced by irregularlyoriented particles. III. Constitution of graphite and amorphouscarbon. Physik. Zeitschr., 18, 291 (1917).
[4] W. van Megen, I.K. Snook. Physical adsorption of gases at highpressures III. Adsorption in slit-like pores. Mol. Phys., 54, 741(1985).
[5] J.P.R.B. Walton, N. Quirke. Modelling the phase behaviour of afluid within a pore. Chem. Phys. Lett., 129, 382 (1986).
[6] P.H. Emmett. Adsorption and pore-size measurements on charcoalsand whetlerites. Chem. Rev., 43, 69 (1948).
[7] F. Stoeckli. The gas-solid interface: calculations of adsorptionpotentials in slot-like pores of molecular dimensions. Helv. Chim.Acta, 57, 2195 (1974).
[8] D.H. Everett, J.C. Powl. Adsorption in slit-like and cylindricalmicropores in the Henry’s law region: a model for microporosity ofcarbons. J. Chem. Soc. Faraday Trans. I, 72, 619 (1976).
[9] D. Nicholson. Using computer simulation to study the properties ofmolecules in micropores. J. Chem. Soc. Faraday Trans., 92, 1(1996).
[10] M.B. Sweatman, N. Quirke. Modelling gas mixture adsorption inactive carbons. Mol. Sim., 31, 667 (2005).
[11] H. Marsh, D. Crawford, T.M. O’Grady, A. Wennerberg. Carbons ofhigh surface area. A study by adsorption and high resolutionelectron microscopy. Carbon, 20, 419 (1982).
[12] S.K. Bhatia. Density functional theory analysis of the influence ofpore wall heterogeneity on adsorption in carbons. Langmuir, 18,6845 (2002).
[13] X.S. Chen, B. McEnaney, T.J. Mays, J. Alcaniz-Monge, D. Cazorla-Amoros, A. Linares-Solano. Theoretical and experimental studiesof methane adsorption on microporous carbons. Carbon, 35, 1251(1997).
[14] K. Kaneko, C. Ishii, M. Ruike, H. Kuwabara. Origin of superhighsurface area and microcrystalline graphitic structures of activatedcarbons. Carbon, 30, 1075 (1992).
[15] K. Kaneko, C. Ishii, H. Kanoh, Y. Hanzawa, N. Setoyama, T.Suzuki. Characterization of porous carbons with high resolution
Figure 8. The xa (solid line) xb0 (dotted line) and xc components of the normalised VACF for methane at 298 K and 1 bar in models 1P (left) and 1P(15,15)
(right).
Figure 9. Variation of diffusion coefficient with pressure of methane at298 K in models 1P (closed circle) and 1P(15,15) (open circle).
Virtual porous carbons (VPCs) 591
Dow
nloa
ded
by [
Uni
vers
ity o
f Sa
skat
chew
an L
ibra
ry]
at 2
3:03
16
Apr
il 20
13
as-analysis and low temperature magnetic susceptibility. Adv.Colloid Interf. Sci., 76-77, 295 (1998).
[16] J.K. Floess, Y. VanLishout. Calculation of adsorption energies incarbon micropores. Carbon, 30, 967 (1992).
[17] C. Lastoskie, K.E. Gubbins, N. Quirke. Pore size distributionanalysis and networking: studies of microporous sorbents. InCharacterisation of Porous Solids III, J. Rouquerol, F. Rodrıguez-Reinoso, K.S.W. Sing, K.K. Unger (Eds.), pp. 51–60, Elsevier,Amsterdam (1994).
[18] D.M. Ford, E.D. Glandt. Molecular simulation study of the surfacebarrier effect. Dilute gas limit. J. Phys. Chem., 99, 11543 (1995).
[19] M. Sahimi, G.G. Gavalas, T.T. Tsotsis. Statistical and continuummodels of fluid solid reactions in porous-media. Chem. Engng. Sci.,45, 1443 (1990).
[20] A.V. Neimark. Percolation theory of capillary hysteresis phenom-ena and its application for characterization of porous solids.In Characterisation of Porous Solids II, F. Rodrıguez-Reinoso,J. Rouquerol, K.S.W. Sing, K.K. Unger (Eds.), pp. 67–74, Elsevier,Amsterdam (1991).
[21] S.J. Gregg, K.S.W. Sing. Adsorption, Surface Area and Porosity,p. 197, Academic Press, London (1982).
[22] J. Rodriguez, F. Ruette, J. Laine. Molecular modeling of microporesin activated carbon. Carbon, 32, 1536 (1994).
[23] A.V. Shevade, S. Jiang, K.E. Gubbins. Molecular simulation studyof water-methanol mixtures in activated carbon pores. J. Chem.Phys., 113, 6933 (2000).
[24] W. Jin, W. Wang. Computer simulation of adsorption of aStockmayer molecule chlorodifluoromethane in activated carbonslit pores. J. Chem. Phys., 114, 10163 (2001).
[25] M. Jorge, C. Schumacher, N.A. Seaton. Simulation study of theeffect of the chemical heterogeneity of activated carbon on wateradsorption. Langmuir, 18, 9296 (2002).
[26] M.J. Bojan, W.A. Steele. Computer simulation in pores withrectangular cross-sections. Carbon, 36, 1417 (1998).
[27] N.A. Seaton, S.P. Friedman, J.M.D. MacElroy, B.J. Murphy. Themolecular sieving mechanism in carbon molecular sieves: amolecular dynamics and critical path analysis. Langmuir, 13, 1199(1997).
[28] A. Vishnyakov, E.M. Piotrovskaya, E.N. Brodskaya. Capillarycondensation and melting/freezing transitions for methane in slitcoal pores. Adsorption, 4, 207 (1998).
[29] M. Biggs, P. Agarwal. Mass diffusion of atomic fluids in randommicropore spaces using equilibrium molecular dynamics. Phys.Rev. A, 46, 3312 (1992).
[30] A. Oberlin. High resolution TEM studies of carbonization andgraphitization. Chem. Phys. Carbon, 22, 1 (1989).
[31] F.G. Emmerich. Evolution with heat treatment of crystallinity incarbons. Carbon, 33, 1709 (1995).
[32] H.S. Shim, R.H. Hurt, N.Y.C. Yang. A methodology for analysis of002 lattice fringe images and its application to combustion-derivedcarbons. Carbon, 38, 29 (2000).
[33] J.N. Rouzaud, C. Clinard. Quantitative high-resolution transmissionelectron microscopy: a promising tool for carbon materials. FuelProcess. Technol., 77-78, 229 (2002).
[34] M.J. Biggs, A. Buts, D. Williamson. Molecular simulation evidencefor solidlike adsorbate in complex carbonaceous microporestructures. Langmuir, 20, 5786 (2004).
[35] E.I. Segarra, E.D. Glandt. Model microporous carbons: microstruc-ture, surface polarity and gas adsorption. Chem. Engng. Sci., 49,2953 (1994).
[36] M. Acharya, M.S. Trand, J.P. Mathews, S.J.L. Billinge, V. Petkov, S.Subramoney, H.C. Foley. Simulation of nanoporous carbons: achemically constrained structure. Phil. Mag. B, 79, 1499 (1999).
[37] J.L. Faulon, G.A. Carlson, P.G. Hatcher. Statistical models forbituminous coal: a three-dimensional evaluation of structural andphysical properties based on computer-generated structures. EnergyFuels, 7, 1062 (1993).
[38] T. Proffen, S.J.L. Billinge. PDFIT, a program for full profilestructural refinement of the atomic pair distribution function.J. Appl. Cryst., 32, 572 (1999).
[39] V. Petkov, R.G. DiFrancesco, S.J.L. Billinge, M. Acharya, H.C.Foley. Local structure of nanoporous carbons. Phil. Mag. B, 79,1519 (1999).
[40] K.T. Thomson, K.E. Gubbins. Modeling structural morphology ofmicroporous carbons by reverse Monte Carlo. Langmuir, 16, 5761(2000).
[41] J.K. Brennan, K.T. Thomson, K.E. Gubbins. Adsorption of water inactivated carbons: effects of pore blocking and connectivity.Langmuir, 18, 5438 (2002).
[42] S. Gavalda, K.E. Gubbins, Y. Hanzawa, K. Kaneko, K.T. Thomson.Nitrogen adsorption in carbon aerogels: a molecular simulationstudy. Langmuir, 18, 2141 (2002).
[43] J. Pikunic, C. Clinard, N. Cohaut, K.E. Gubbins, J.M. Guet, R.J.M.Pellenq, I. Rannou, J.N. Rouzaud. Structural modeling of porouscarbons: constrained reverse Monte Carlo method. Langmuir, 19,8563 (2003).
[44] P. Zetterstrom, S. Urbonaite, F. Lindberg, R.G. delaplane, J. Leis,G. Svensson. Reverse Monte Carlo studies of nanoporous carbonfrom TiC. J. Phys.: Condens. Matter, 17, 3509 (2005).
[45] T. Peterson, I. Yarovsky, I. Snook, D.G. McCulloch, G. Opletal.Microstructure of an industrial char by diffraction techniques andreverse Monte Carlo modelling. Carbon, 42, 2457 (2004).
[46] Z. Zhu, G.Q. Lu, J. Finnerty, R.T. Yang. Electronic structuremethods applied to gas-carbon reactions. Carbon, 41, 635(2003).
[47] M.R. Nyden, S.I. Stoliarov, P.R. Westmoreland, Z.X. Guo, C. Jee.Applications of reactive molecular dynamics to the study of thethermal decomposition of polymers and nanoscale structures. Mat.Sci. Eng. A, 365, 114 (2004).
[48] A. Kumar, R.F. Lobo, N.J. Wagner. Porous amorphous carbonmodels from periodic Gaussian chains of amorphous polymers.Carbon, 43, 3099 (2005).
[49] J. Pikunic, P. Llewellyn, R. Pellenq, K.E. Gubbins. Argon andnitrogen adsorption in disordered nanoporous carbons: simulationand experiment. Langmuir, 21, 4431 (2005).
[50] M. Biggs, P. Agarwal. Mass diffusion of diatomic fluids in randommicropore spaces using equilibrium molecular dynamics. Phys.Rev. E, 49, 531 (1994).
[51] J. Pikunic, K.E. Gubbins. Molecular dynamics simulations ofsimple fluids confined in realistic models of nanoporous carbons.Eur. Phys. J. E., 12, 35 (2003).
[52] M.J. Biggs, A. Buts, D. Williamson. Absolute assessment ofadsorption-based porous solid characterisation methods: compari-son methods. Langmuir, 20, 7123 (2004).
[53] M.J. Biggs, A. Buts, Q. Cai, N.A. Seaton. Absolute assessment ofadsorption-based microporous solid characterisation methods.Characterisation of Porous Solids VII, in press.
[54] M.P. Allen, D.J. Tildeseley. Computer Simulations of Liquids,Oxford University Press, New York (1989).
[55] W.A. Steele. The Interaction of Gases with Solid Surfaces,Pergamon, Oxford (1974).
[56] M. Mezei. A cavity-biased (T, V, m) Monte-Carlo method for thecomputer simulation of fluids. Mol. Phys., 40, 901 (1980).
[57] D. Brown, J.H.R. Clarke. A comparison of constant energy, constanttemperature and constant pressure ensemble molecular dynamicssimulations of atomic liquids. Mol. Phys., 51, 1243 (1984).
[58] L.D. Gelb, K.E. Gubbins, R. Radhakrishnan, M. Sliwinska-Bartkowiak. Phase separation in confined systems. Rep. Prog.Phys., 62, 1573 (1999).
[59] H.K. Christenson. Confinement effects on freezing and melting.J. Phys.: Condens Matter, 13, R95 (2001).
[60] J.P.R.B. Walton, N. Quirke. Capillary condensation: a molecularsimulation study. Mol. Sim., 2, 361 (1989).
[61] B. Smit. Phase diagrams of Lennard-Jones fluids. J. Chem. Phys.,96, 8639 (1992).
[62] P.J.M. Carrott, R.A. Roberts, K.S.W. Sing. Molecular packing inslit-shaped and cylindrical pores. Chem. Ind., 24, 855 (1987).
[63] J. Rouquerol, D. Avnir, C.W. Fairbridge, D.H. Everett, J.H. Haynes,N. Pernicone, J.D.F. Ramsay, K.S.W. Sing, K.K. Unger.Recommendations for the characterization of porous solids. PureAppl. Chem., 66, 1739 (1994).
[64] G. Rychlicki, A.P. Terzyk, J.P. Łukaszewicz. Determination ofcarbon porosity from low-temperature nitrogen adsorption data.A comparison of the most frequently used methods. Colloids Surf.A, 96, 105 (1995).
[65] M. Kruk, M. Jaroniec, J. Choma. Comparative analysis of simpleand advanced sorption methods for assessment of microporosity inactivated carbons. Carbon, 36, 1447 (1998).
[66] M.J. Biggs, A. Buts, D. Williamson. Absolute assessment ofadsorption-based porous solid characterisation methods: Langmuirand BET isotherms, In preparation.
M. J. Biggs and A. Buts592
Dow
nloa
ded
by [
Uni
vers
ity o
f Sa
skat
chew
an L
ibra
ry]
at 2
3:03
16
Apr
il 20
13
[67] M.J. Biggs, A. Buts, D. Williamson. Absolute assessment ofadsorption-based porous solid characterisation methods: Polanyi-Dubinin isotherms, In preparation.
[68] Q. Cai, A. Buts, N.A. Seaton, M.J. Biggs. Evaluation of aCharacterization method for determining the pore size distributionand pore network connectivity. (Submitted).
[69] M.J. Biggs, A. Buts, D. Williamson. Absolute assessment ofadsorption-based porous solid characterisation methods: adsorptionenergetics, In preparation.
[70] M.J. Biggs, A. Buts, D. Williamson. Absolute assessment ofadsorption-based porous solid characterisation methods: fractaldimension, In preparation.
[71] B.B. Mandelbrot. The Fractal Geometry of Nature, Freeman,San Francisco (1982).
[72] P. Pfeifer, D. Avnir. Chemistry in noninteger dimensions betweentwo and three. I. Fractal theory of heterogeneous surfaces. J. Chem.Phys., 79, 3558 (1983).
[73] D. Avnir, D. Farin, P. Pfeifer. Chemistry in noninteger dimensionsbetween two and three. II. Fractal surfaces of adsorbents. J. Chem.Phys., 79, 3566 (1983).
[74] M.V. Lopez-Ramon, J. Jagiełło, T.J. Bandosz, N.A. Seaton.Determination of the pore size distribution and networkconnectivity in microporous solids by adsorption measurementsand Monte Carlo simulation. Langmuir, 13, 4445 (1997).
[75] Y. Gefen, A. Aharony, S. Alexander. Anomalous diffusion onpercolating clusters. Phys. Rev. Lett., 50, 77 (1983).
[76] R. Muralidhar, D. Ramkrishna, H. Nakanishi, D. Jacobs. Anomalousdiffusion: a dynamic perspective. Physica A, 167, 539 (1990).
Virtual porous carbons (VPCs) 593
Dow
nloa
ded
by [
Uni
vers
ity o
f Sa
skat
chew
an L
ibra
ry]
at 2
3:03
16
Apr
il 20
13