virtual genetic coding and time series analysis for alternative splicing prediction in c. elegans
TRANSCRIPT

Virtual genetic coding and time series analysis foralternative splicing prediction in C. elegans
Michele Ceccarelli *, Antonio Maratea
Research Centre on Software Technologies, University of Sannio, via Traiano 1, 82100 Benevento, Italy
Received 21 November 2007; received in revised form 22 August 2008; accepted 22 August 2008
Artificial Intelligence in Medicine (2009) 45, 109—115
http://www.intl.elsevierhealth.com/journals/aiim
KEYWORDSAlternative splicing;Virtual genetic code;Autoregressive model;Support vectormachine
Summary
Motivation: Prediction of alternative splicing has been traditionally based on thestudy of expressed sequences, helped by homology considerations and the analysis oflocal discriminative features. More recently, machine learning algorithms have beendeveloped that try avoid or reduce the use of a priori information, with partialsuccess.Objective and method: With the aim of developing a fully automatic procedure ofrecognition of alternative splicing events based only on the genomic sequence, wefirst introduce a virtual genetic coding scheme to numerically modeling the informa-tion content of sequences in an effective way, then we use time series analysis toextract a fixed-length set of features from each sequence and finally we adopt asupervised learning method, namely the support vector machine, to predict alter-native splicing events.Results: On the base of real C. elegans data, we show that it is possible within thispurely numeric framework to obtain results better than the state of the art, withoutany explicit modeling of homology or positions in the splice site, nor any use of otherlocal features.Conclusion: The virtual genetic coding together with time series analysis allows us tointroduce an effective and powerful sequence coding scheme, that may be useful invarious areas of genomics and transcriptomics.# 2008 Elsevier B.V. All rights reserved.
1. Introduction
Alternative splicing is one of the key mechanisms ofpost-transcriptional modification [1]. Through it, a
* Corresponding author. Tel.: +39 0824 305548;fax: +39 0824 23013.
E-mail addresses: [email protected] (M. Ceccarelli),[email protected] (A. Maratea).
0933-3657/$ — see front matter # 2008 Elsevier B.V. All rights resedoi:10.1016/j.artmed.2008.08.013
single gene can give rise to a number of differentproducts rearranging its coding regions and splicingout its non-coding regions in many alternative con-figurations. The coding regions of a gene are calledexons and the non-coding regions are called introns.Alternative splicing (AS) happens when exons havemany different possible configurations and henceone gene can produce more than one single product(protein).
rved.
110 M. Ceccarelli, A. Maratea
An extreme known case of AS is the gene DSCAMof Drosophila, that it is known to produce more than38,000 different proteins. It is estimated that half ofthe human genes are alternatively spliced and thispercentage does not varymuch among other animals[2].
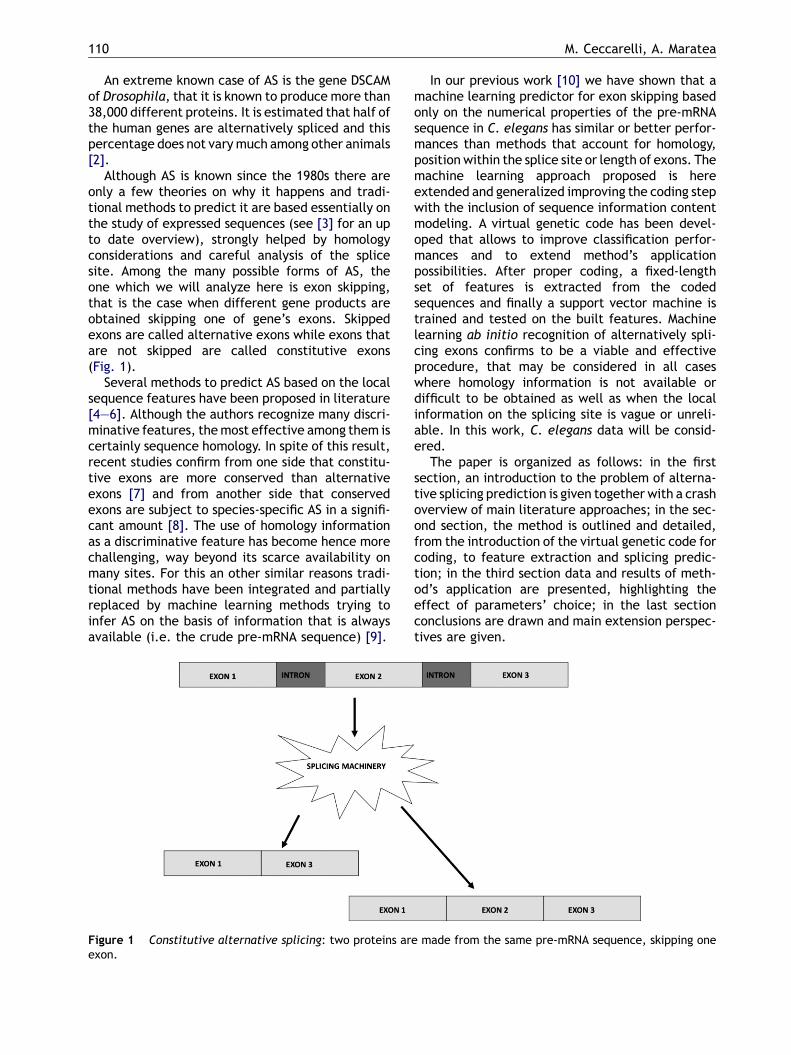
Although AS is known since the 1980s there areonly a few theories on why it happens and tradi-tional methods to predict it are based essentially onthe study of expressed sequences (see [3] for an upto date overview), strongly helped by homologyconsiderations and careful analysis of the splicesite. Among the many possible forms of AS, theone which we will analyze here is exon skipping,that is the case when different gene products areobtained skipping one of gene’s exons. Skippedexons are called alternative exons while exons thatare not skipped are called constitutive exons(Fig. 1).
Several methods to predict AS based on the localsequence features have been proposed in literature[4—6]. Although the authors recognize many discri-minative features, themost effective among them iscertainly sequence homology. In spite of this result,recent studies confirm from one side that constitu-tive exons are more conserved than alternativeexons [7] and from another side that conservedexons are subject to species-specific AS in a signifi-cant amount [8]. The use of homology informationas a discriminative feature has become hence morechallenging, way beyond its scarce availability onmany sites. For this an other similar reasons tradi-tional methods have been integrated and partiallyreplaced by machine learning methods trying toinfer AS on the basis of information that is alwaysavailable (i.e. the crude pre-mRNA sequence) [9].
Figure 1 Constitutive alternative splicing: two proteins arexon.
In our previous work [10] we have shown that amachine learning predictor for exon skipping basedonly on the numerical properties of the pre-mRNAsequence in C. elegans has similar or better perfor-mances than methods that account for homology,position within the splice site or length of exons. Themachine learning approach proposed is hereextended and generalized improving the coding stepwith the inclusion of sequence information contentmodeling. A virtual genetic code has been devel-oped that allows to improve classification perfor-mances and to extend method’s applicationpossibilities. After proper coding, a fixed-lengthset of features is extracted from the codedsequences and finally a support vector machine istrained and tested on the built features. Machinelearning ab initio recognition of alternatively spli-cing exons confirms to be a viable and effectiveprocedure, that may be considered in all caseswhere homology information is not available ordifficult to be obtained as well as when the localinformation on the splicing site is vague or unreli-able. In this work, C. elegans data will be consid-ered.
The paper is organized as follows: in the firstsection, an introduction to the problem of alterna-tive splicing prediction is given together with a crashoverview of main literature approaches; in the sec-ond section, the method is outlined and detailed,from the introduction of the virtual genetic code forcoding, to feature extraction and splicing predic-tion; in the third section data and results of meth-od’s application are presented, highlighting theeffect of parameters’ choice; in the last sectionconclusions are drawn and main extension perspec-tives are given.
e made from the same pre-mRNA sequence, skipping one

Virtual genetic coding and time series analysis for alternative splicing prediction in C. elegans 111
2. Proposed method
The whole process can be resumed in three steps:
� c
oding of each exonic or intronic sequence; � f eature extraction from coded sequences; � tFigure 2 The common classification scheme of thegenetic code. The four main rows indicate the first basein the codon, the four main columns indicate the secondbase and the rightmost column indicates the third base.The gray regions represent ‘‘family codons’’, where theencoded amino acid is independent of the third position.Since there are 20 different amino acids and 43 = 64possible codons the genetic code is redundant.
Figure 3 The virtual genetic code. The four main rowsindicate the first base in the codon, the four main columnsindicate the second base and the rightmost column indi-cates the third base. There are no ‘‘synonyms’’ coding.
raining a classifier on the features’ vector pre-viously obtained.
as explained in the next sections.
2.1. Exon coding
With respect to the paper [10], coding has beenimproved in two ways. A first improvement is theadoption of a codon based coding instead of a singlenucleotide based coding. This new coding scheme isactually equivalent to defining a ‘‘virtual geneticcode’’, a numerical table such that each codon cor-responds to a different code. A second improvementis the adoption of a sliding window of width three toreplace each nucleotide with the numerical code(from the virtual genetic code table) correspondingto the codon centered on that nucleotide. Numericalcodes filling the virtual genetic code matrix arecomputed on the base of the Shannon informationcontent of nucleotide letters in data sequences.
If we indicate as Ni i = {1,. . ., 4} the four bases{ACGT}, following Shannon information theory theinformation content of each triplet can be writtenas in the following equation:
IðNi;N j;NkÞ ¼ �logð p
�ðNi;Nj;NkÞÞ; i; j; k2f1; . . . ; 4g(1)
where log are base 2, I is the information contentand p() is the probability. The virtual genetic code ishence a table of size 16 � 4 built with the informa-tion content corresponding to each possible tripletof nucleotides. Probability is estimated by relativefrequency of occurrence of each triplet in the data(computed with respect to both splicing and non-splicing groups) (Figs. 2 and 3).
Ifwe indicatewithSagenericnucleotide sequenceandwith Si its generic element of place i, the genericelement of place i of the coded sequence C is:
Ci ¼ IðSi�1; Si; Siþ1Þ (2)
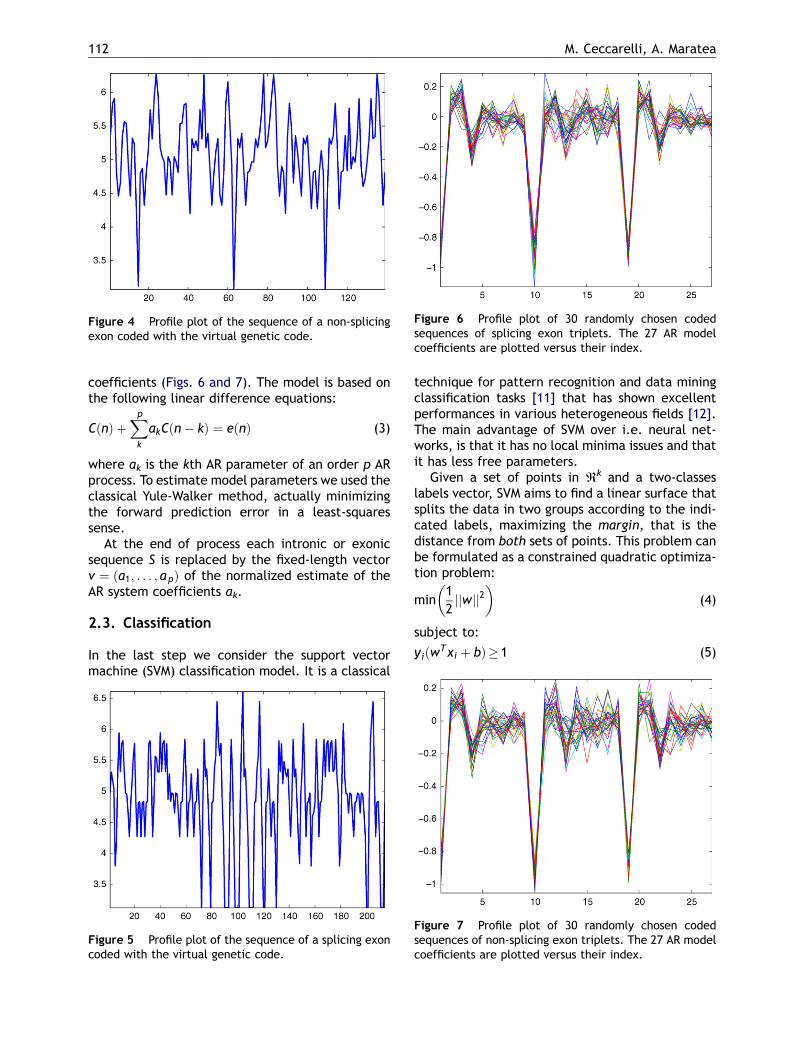
a profile plot of the central exon once it has beencoded following this scheme for both the alternativeand constitutive case can be seen in Figs. 5 and 4,respectively.
2.2. Feature extraction
Once data are coded (see Section 3), the first pro-blem to cope with is the different length of the
various sequences. As can be seen from Figs. 5 and 4,coded signals are strongly periodic and this factcandidates auto regressive (AR) models as naturaldescriptors of the dynamic of the phenomenonunder study. Following this line, we estimate anAR model on the data and we choose its coefficientsas features. In this approach, each observed codedexonic or intronic sequence C is assumed to be theoutput of an order p AR model driven by a whitenoise process e(n), that is the value in position n isassumed to be equal to a weighted sum of the pprevious values plus a white noise term. As an ARmodel has a fixed-length set of p coefficients, eachsequence is replaced by a fixed-length vector of p
112 M. Ceccarelli, A. Maratea
Figure 4 Profile plot of the sequence of a non-splicingexon coded with the virtual genetic code.
Figure 6 Profile plot of 30 randomly chosen codedsequences of splicing exon triplets. The 27 AR modelcoefficients are plotted versus their index.
coefficients (Figs. 6 and 7). The model is based onthe following linear difference equations:
CðnÞ þXpk
akCðn� kÞ ¼ eðnÞ (3)
where ak is the kth AR parameter of an order p ARprocess. To estimate model parameters we used theclassical Yule-Walker method, actually minimizingthe forward prediction error in a least-squaressense.
At the end of process each intronic or exonicsequence S is replaced by the fixed-length vectorv ¼ ða1; . . . ; apÞ of the normalized estimate of theAR system coefficients ak.
2.3. Classification
In the last step we consider the support vectormachine (SVM) classification model. It is a classical
Figure 5 Profile plot of the sequence of a splicing exoncoded with the virtual genetic code.
technique for pattern recognition and data miningclassification tasks [11] that has shown excellentperformances in various heterogeneous fields [12].The main advantage of SVM over i.e. neural net-works, is that it has no local minima issues and thatit has less free parameters.
Given a set of points in Rk and a two-classes
labels vector, SVM aims to find a linear surface thatsplits the data in two groups according to the indi-cated labels, maximizing the margin, that is thedistance from both sets of points. This problem canbe formulated as a constrained quadratic optimiza-tion problem:
min1
2jjwjj2
� �(4)
subject to:
yiðwTxi þ bÞ� 1 (5)
Figure 7 Profile plot of 30 randomly chosen codedsequences of non-splicing exon triplets. The 27 AR modelcoefficients are plotted versus their index.

Virtual genetic coding and time series analysis for alternative splicing prediction in C. elegans 113
where yi 2 {�1, 1} are classes’ labels, w is thenormal to the hyperplane and 2=jjwjj is the margin.
If the data are not linearly separable in Rk, they
can be projected nonlinearly in a Hilbert spacewhere the classification can be performed linearly,maintaining the method almost unchanged. If welook at the optimization’s problem solution, we seethat data appear only in the form of dot productsxi�xj and that even data transformed through afunction F:Rk 7! G (where G is a space of dimensionh � k) appear in the form of dot productsF(xi)�F(xj). As a consequence, it is possible to sub-stitute whatever dot product function K(xi,xj) = F(xi)�F(xj) in formulae and to compute thesolution without even knowing the form of functionF. Such a dot product function is called a kernel andthere is an active field of research in the choice ofthe most suitable kernel for a given problem [13].
In this work we used a Gaussian kernel:
Kðxi; x jÞ ¼ expð�gjjxi � x jjj2Þg> 0 (6)
Its choice was derived mainly form the followinggeneral practical considerations [14,15]:
� t
T
s
0011122333
he radial basis function (RBF) SVM has infinitecapacity and hence Gaussian RBF SVM of suffi-ciently small width can classify an arbitrarily largenumber of training points correctly;
� t
he RBF kernel includes as a special case the linearkernel;� t
he RBF kernel behaves like the sigmoid kernel forcertain parameters’ values;� t
he RBF kernel has less hyper-parameters than thepolynomial kernel;� t
he RBF kernel has less numerical difficulties thanother kernels.3. Experiments and results
The labeled dataset used to test our method is thesame of [9]. It is a collection of 487 exons for whichEST show evidence of alternative splicing and 2531
able 1 AUC values corresponding to each tested value of
\p 2 3 4 5
.2 0.6579 0.6324 0.5989 0.6837
.6 0.7184 0.6051 0.6275 0.7202
.0 0.7061 0.6677 0.6735 0.7412
.4 0.5762 0.6823 0.6931 0.7593
.8 0.7098 0.7404 0.7551 0.7831
.2 0.7002 0.7207 0.8009 0.8337
.6 0.7004 0.7476 0.8043 0.8319
.0 0.7191 0.7462 0.8127 0.8544
.4 0.7629 0.7356 0.8262 0.8751
.8 0.7339 0.7589 0.8258 0.8832
exons for which there is no evidence of alternativesplicing, for a total of 3018 labeled examples. Alldata regard C. elegans and were obtained from theWormbase, dbEST and UniGene [9].
The data matrix obtained after coding and afterthe AR model parameters’ estimate is filled row byrow by contiguous exon triplets. Rows labeled as‘‘AS’’ have the central exon alternatively spliced,while rows labeled as ‘‘not AS’’ have the centralexon constitutively spliced. The matrix has 3p col-umns, as for each exon there are p AR model coeffi-cients. After the random division in testing andtraining sets (see below), we train the SVM classifierwith the labeled matrix. Performances were eval-uated in terms of the average area under curve(AUC) index of ROC curves. As the adopted datasetis biased towards non-splicing sequences, we gen-erated a new dataset of alternative splicing exonsresampling 5 times the original one of 487 alter-native splicing sequences and adding a very smallGaussian perturbation (s = 2.5�4). Therefore thefinal dataset contains 4966 samples.
Once chosen the RBF kernel, there are two coreparameters to tune: the width of the Gaussianfunction s and the order of the AR model p.
Tuning has been performed on a single split of thefull dataset in two parts, using k-fold cross-validationwith k = 5. One training set of 4/5 of data has beenrandomly extracted and a series of parameters’values has been tested with k-fold cross-validation[17]. In k-fold cross-validation data are split in ksubgroups and in turn k � 1 of them are used topredict the kth group values. Then average perfor-mance on all k groups is used to assign a predictivepower to themethod tested. The advantage of cross-validation is its robustness to outliers and overfitting.
For each couple of parameters’ values we exe-cuted an SVM prediction and computed the averageperformance through cross-validation. The perfor-mances relative to each couple of parameters’ valuescan be thought of filling a matrix P (Table 1) in whicheach dimension represents a parameter.
parameters
6 7 8 9
0.7231 0.7405 0.6880 0.74280.7196 0.7834 0.8073 0.84850.7969 0.8395 0.8853 0.89060.8172 0.8556 0.9065 0.92660.8370 0.8855 0.9263 0.94310.8695 0.9039 0.9281 0.95610.8909 0.9263 0.9498 0.94820.9090 0.9200 0.9450 0.96220.9096 0.9388 0.9508 0.94380.9156 0.9412 0.9444 0.9625
114 M. Ceccarelli, A. Maratea
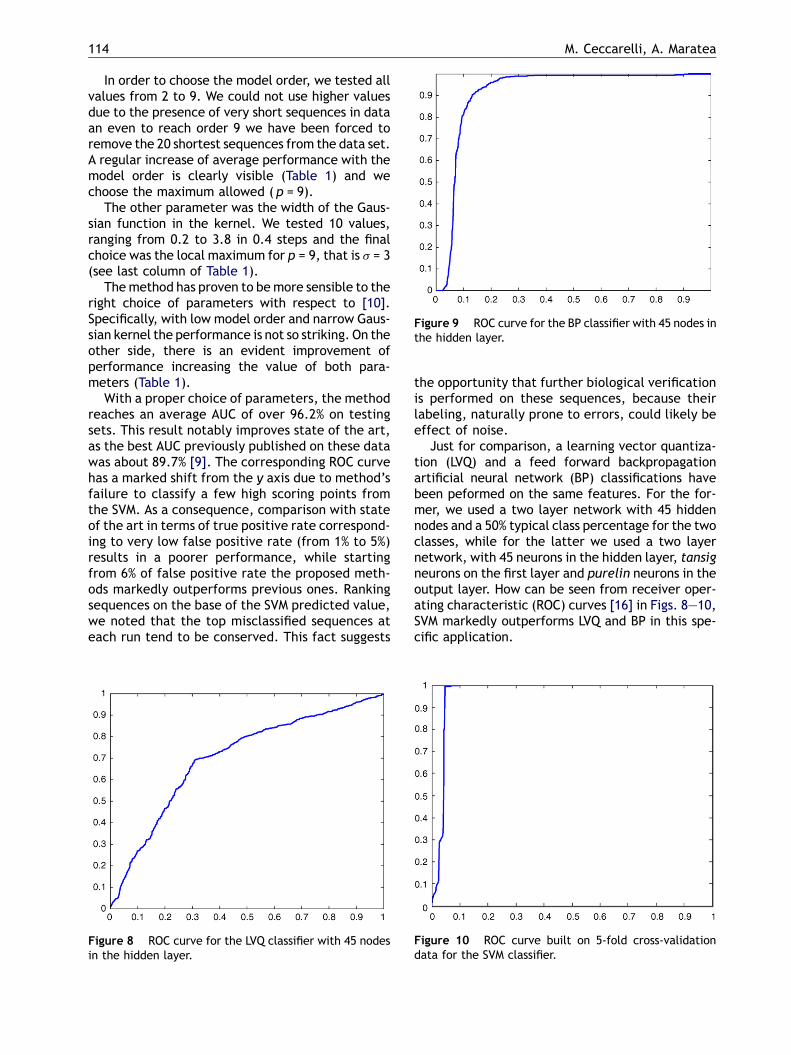
Figure 9 ROC curve for the BP classifier with 45 nodes inthe hidden layer.
In order to choose the model order, we tested allvalues from 2 to 9. We could not use higher valuesdue to the presence of very short sequences in dataan even to reach order 9 we have been forced toremove the 20 shortest sequences from the data set.A regular increase of average performance with themodel order is clearly visible (Table 1) and wechoose the maximum allowed ( p = 9).
The other parameter was the width of the Gaus-sian function in the kernel. We tested 10 values,ranging from 0.2 to 3.8 in 0.4 steps and the finalchoice was the local maximum for p = 9, that is s = 3(see last column of Table 1).
Themethod has proven to bemore sensible to theright choice of parameters with respect to [10].Specifically, with low model order and narrow Gaus-sian kernel the performance is not so striking. On theother side, there is an evident improvement ofperformance increasing the value of both para-meters (Table 1).
With a proper choice of parameters, the methodreaches an average AUC of over 96.2% on testingsets. This result notably improves state of the art,as the best AUC previously published on these datawas about 89.7% [9]. The corresponding ROC curvehas a marked shift from the y axis due to method’sfailure to classify a few high scoring points fromthe SVM. As a consequence, comparison with stateof the art in terms of true positive rate correspond-ing to very low false positive rate (from 1% to 5%)results in a poorer performance, while startingfrom 6% of false positive rate the proposed meth-ods markedly outperforms previous ones. Rankingsequences on the base of the SVM predicted value,we noted that the top misclassified sequences ateach run tend to be conserved. This fact suggests
Figure 8 ROC curve for the LVQ classifier with 45 nodesin the hidden layer.
the opportunity that further biological verificationis performed on these sequences, because theirlabeling, naturally prone to errors, could likely beeffect of noise.
Just for comparison, a learning vector quantiza-tion (LVQ) and a feed forward backpropagationartificial neural network (BP) classifications havebeen peformed on the same features. For the for-mer, we used a two layer network with 45 hiddennodes and a 50% typical class percentage for the twoclasses, while for the latter we used a two layernetwork, with 45 neurons in the hidden layer, tansigneurons on the first layer and purelin neurons in theoutput layer. How can be seen from receiver oper-ating characteristic (ROC) curves [16] in Figs. 8—10,SVM markedly outperforms LVQ and BP in this spe-cific application.
Figure 10 ROC curve built on 5-fold cross-validationdata for the SVM classifier.

Virtual genetic coding and time series analysis for alternative splicing prediction in C. elegans 115
4. Conclusions
We have shown that using the virtual genetic code inthe coding step of the ab initio alternative splicingprediction procedure allows to clearly improve clas-sification performances and to extend method’sapplication possibilities. Machine learning recogni-tion of alternatively splicing exons confirms to be aviable and effective procedure, that may be consid-ered in all cases where homology information is notavailable or difficult to obtain as well as when thelocal information on the splicing site are vague orunreliable. The proposed procedure reaches an AUCof over 96% on tested C. elegans data and does notaccount for homology, position within the splice siteor length of exons. A few top ranked sequences fromthe SVM are misclassified at each run and we believethese should be biologically verified, as suggested bythe overall prediction accuracy. The virtual geneticcode based on Shannon information content has pro-ven to be an effective coding scheme and should beconsidered as an attractive option whenever anumerical translation of a biological sequence isneeded, also in other areas of genomics and tran-scriptomics. Finally, although more data and morework are needed to validate further this result, theneed for a deeper understanding of the splicingmachinery emerges, in order to use biological knowl-edge in a more effective way in transparent models.Future work is in studying other organisms and intrying to predict more complex form of AS.
References
[1] Watson J, Baker T, Bell S, Gann A, Levine M, Losick R.Molecular biology of the gene (international edition), 5thedition, Amsterdam: Addison-Wesley; 2004.
[2] Brett D, Pospisil H, Valrcel J, Reich J, Bork P. Alternativesplicing and genome complexity. Nature Genetics 2001;30:29—30.
[3] Bonizzoni P, Rizzi R, Pesole G. Computational methods foralternative splicing prediction. Briefings in Functional Geno-mics and Proteomics 2006;5(1):46—51.
[4] Dror G, Sorek R, Shamir R. Accurate identification of alter-natively spliced exons using support vector machine. Bioin-formatics 2004;21:897—901.
[5] Hiller M, Backofen R, Heymann S, Busch A, Glaeber TM,Freytag JC. Efficient prediction of alternative splice formsusing protein domain homology. In Silico Biology 2004;4:195—208.
[6] Sorek R, Ast G. Intronic sequences flanking alternativelyspliced exons are conserved between human and mouse.Genome Research 2003;13:1631—7.
[7] Malko DBB, Makeev VJJ, Mironov AAA, Gelfand MSS. Evolu-tion of exon—intron structure and alternative splicing infruit flies andmalarial mosquito genomes. Genome Research2006;6:505—9.
[8] Pan Q, Bakowski MA, Morris Q, Zhang W, Frey BJ, Hughes TR,et al. Alternative splicing of conserved exons is frequentlyspecies-specific in human and mouse. Trends in Genetics2005;21(2):73—8.
[9] Raetsch G, Sonnenburg S, Schoelkopf B. RASE: recognition ofalternatively spliced exons in C. elegans. Bioinformatics2005;21(Suppl. 1):i369—77.
[10] Ceccarelli M, Maratea A. An alternative splicing predictorin C. elegans based on time series analysis. In: Masulli F,Mitra S, Pasi G, editors. Applications of fuzzy sets theory.Proceedings of the 7th international workshop on fuzzylogic and applications (WILF2007), vol. 4578 of lecturenotes in computer science. Berlin: Springer; 2007 . p.588—95.
[11] Vapnik V. The nature of statistical learning theory. New York:Springer-Verlag; 1995.
[12] Scholkopf B, Sung K, Burges C, Girosi F, Niyogi P, Poggio T,et al. Comparing support vector machines with Gaussiankernels to Radial Basis Function Classifiers. IEEE Transactionson Signal Processing 1997;45(11):2758—65.
[13] Cristianini N, Taylor JS. Kernel methods for pattern analysis.Cambridge: Cambridge University Press; 2004.
[14] Keerthi SS, Lin CJ. Asymptotic behaviors of support vectormachines with Gaussian Kernel. Neural Computation2003;15(7): 1667—89.
[15] Verri A, Pontil M. Properties of support vector machines.Neural Computation 1998;10(4):955—74.
[16] Egan JP. Signal detection theory and ROC analysis. New York:Academic Press; 1975.
[17] Stone M. Cross-validation: a review. Mathematics Operationsand Statistics 1978;9:127—40.