views you can use: data visualization | lsc technology initiative grant conference 2015
TRANSCRIPT
Views You Can Use - Making Data
Visualization Accessible With Tools
Available Now
TIG 2015 - San Antonio
Introductions
Joan Kleinberg - Northwest Justice Project ([email protected])
Kristin Verrill - Atlanta Legal Aid Society ([email protected])
Christina Sanabria - Legal Services Corporation ([email protected])
Jeff Hogue - Legal Server ([email protected])
JOAN - NJP
Goals of project
- Incorporate business intelligence into routine
operation
- Identify need for strategic advocacy
Yes business intelligence is relevant
to legal services..
BI helps us understand:
● Who and where our clients are
● What problems clients bring to us
● What levels of service we provide
● Who is doing what work
And whether these are in line with strategic goals.
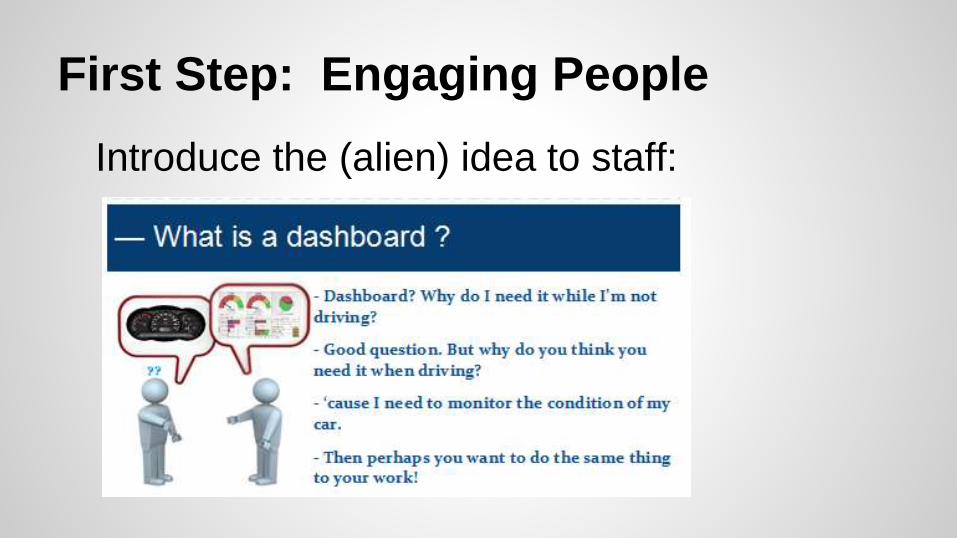
First Step: Engaging People
Introduce the (alien) idea to staff:
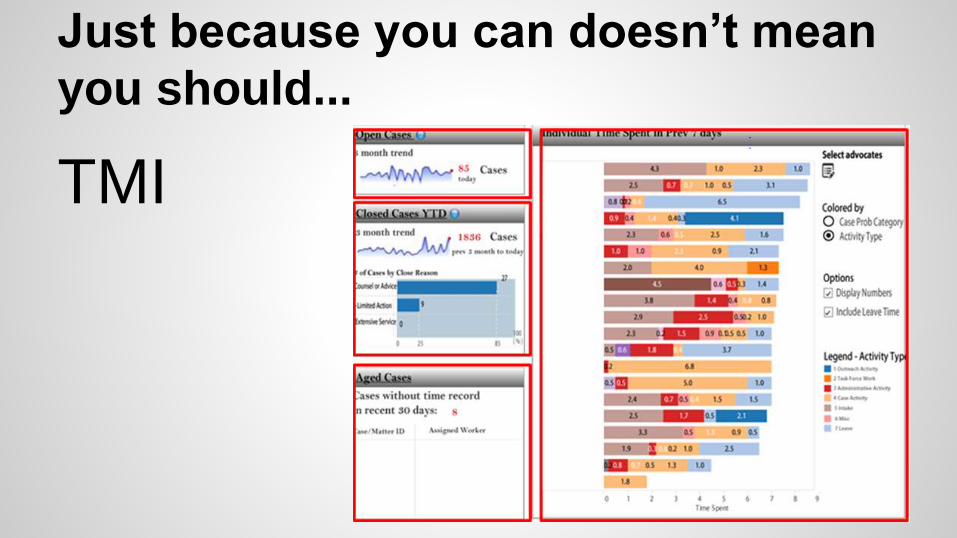
Just because you can doesn’t mean
you should...
TMI
Data Visualizations -
● At-a-glance views of data
● Communicate quickly and clearly
● Show key performance indicators (data that
is important to you)
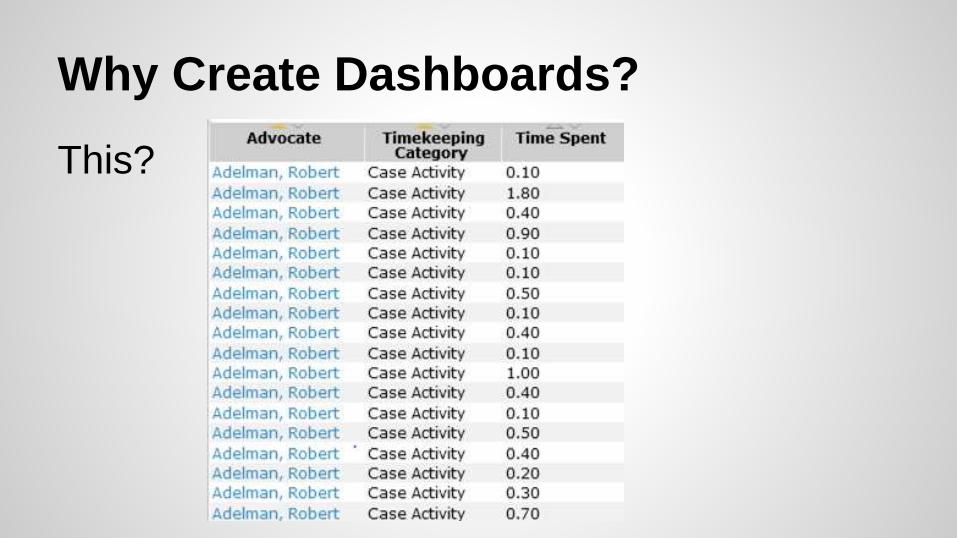
Why Create Dashboards?
This?
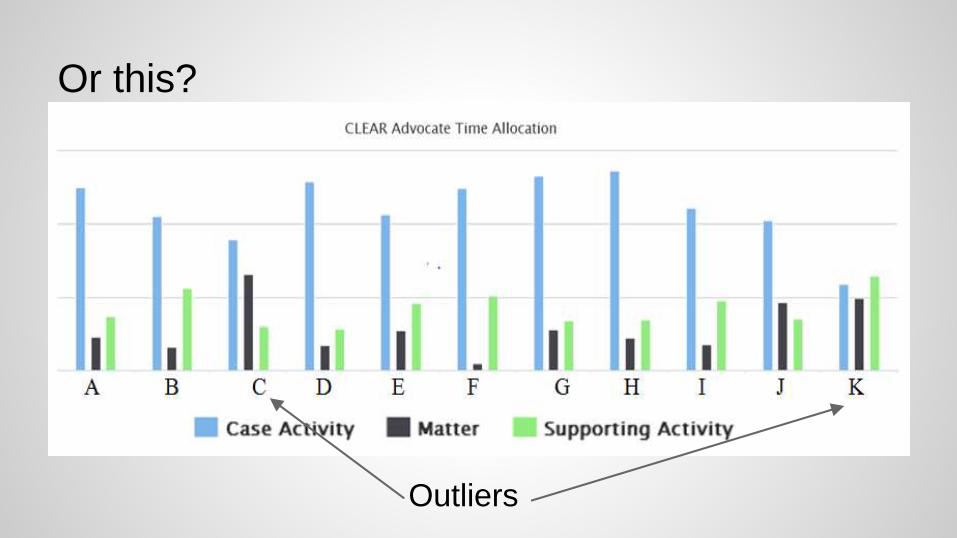
Or this?
Outliers
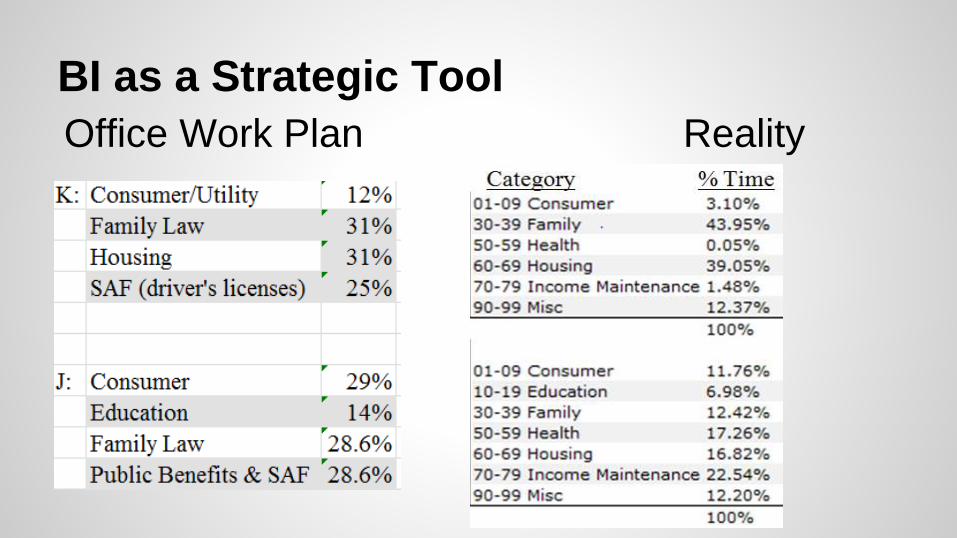
BI as a Strategic Tool
Office Work Plan Reality
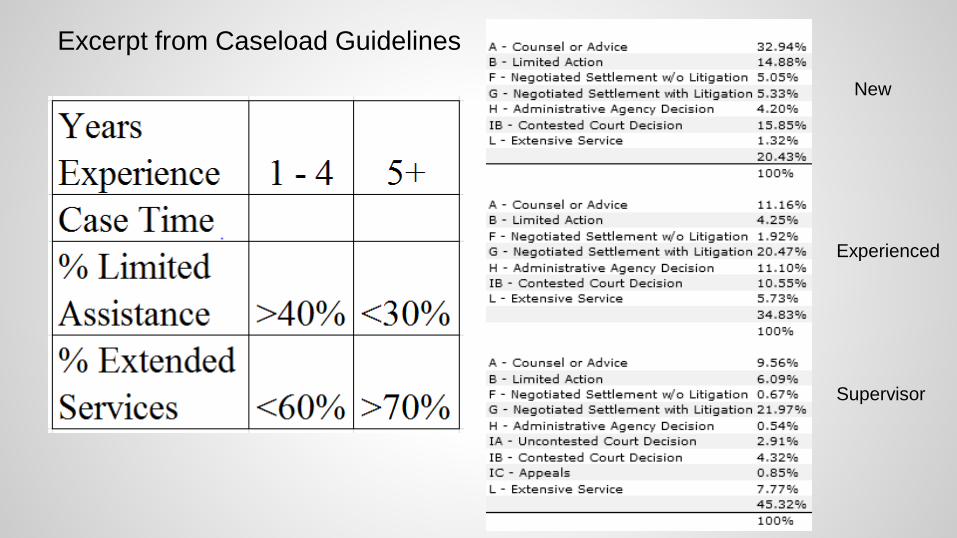
Excerpt from Caseload Guidelines
New
Experienced
Supervisor
Trials and Tribulations
● Engaging staff
● Staff understanding of appropriate
dashboard contents
Triumphs
● Creating tools useful to staff
● Supporting strategic objectives
Atlanta Legal Aid Society’s Data Visualization Project
Kristin Verrill
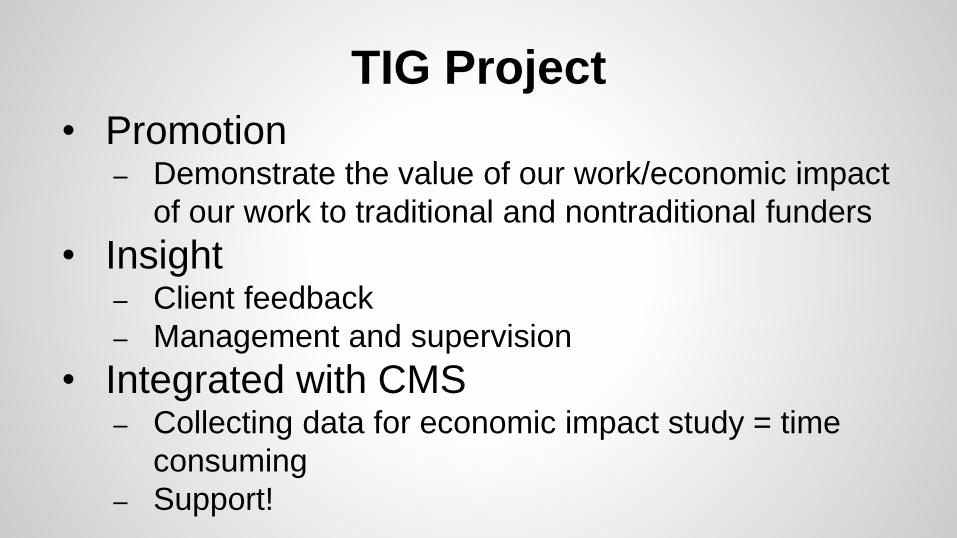
• Promotion– Demonstrate the value of our work/economic impact
of our work to traditional and nontraditional funders
• Insight– Client feedback
– Management and supervision
• Integrated with CMS– Collecting data for economic impact study = time
consuming
– Support!
TIG Project
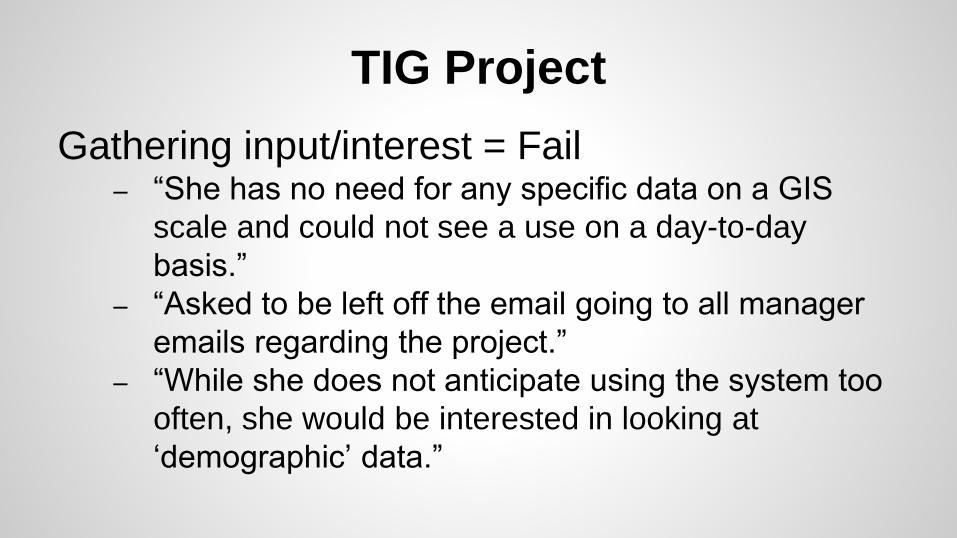
Gathering input/interest = Fail– “She has no need for any specific data on a GIS
scale and could not see a use on a day-to-day
basis.”
– “Asked to be left off the email going to all manager
emails regarding the project.”
– “While she does not anticipate using the system too
often, she would be interested in looking at
‘demographic’ data.”
TIG Project
Sometimes….
But, stay tuned!

Goal 1: Promotion
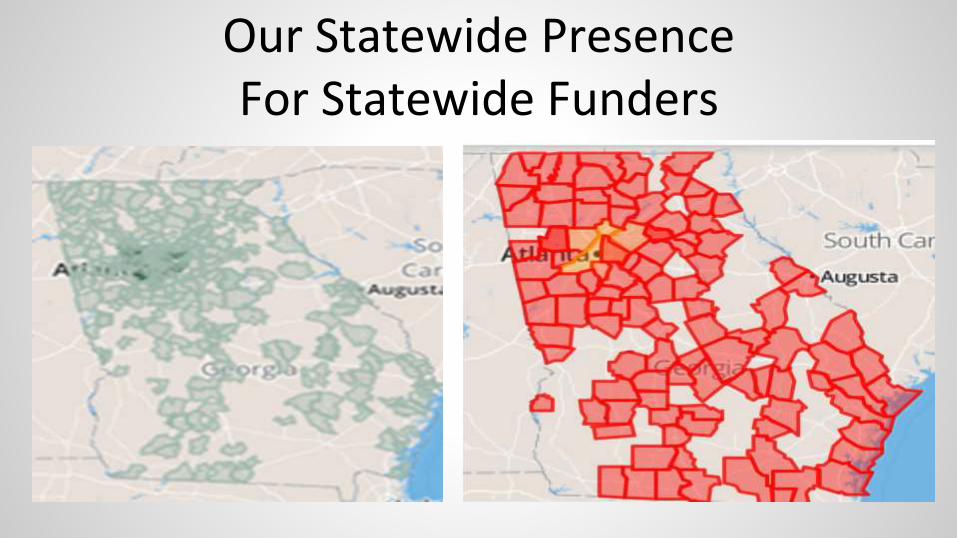
Our Statewide Presence For Statewide Funders
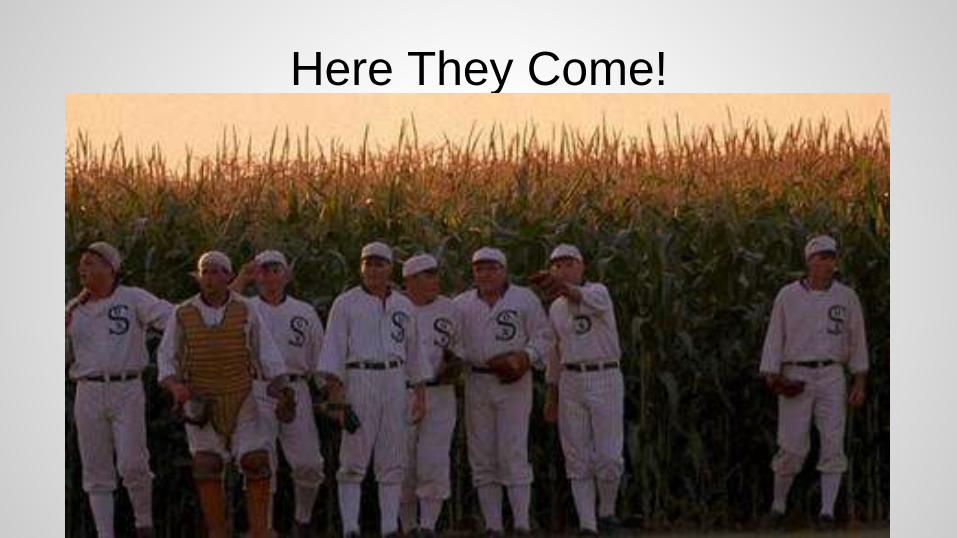
Here They Come!
Don’t show up empty handed
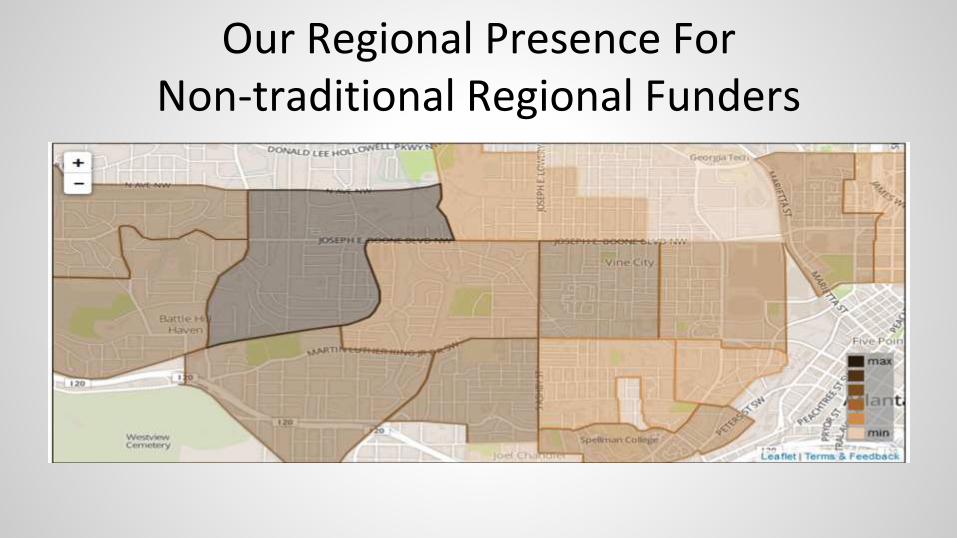
Our Regional Presence ForNon-traditional Regional Funders
Data Viz Hand-Outs
● CMS connection =
data viz on the fly
● Help solidify new
relationships
● Demonstrate ability
to address funder’s
area of interest
Goal 2: Insight
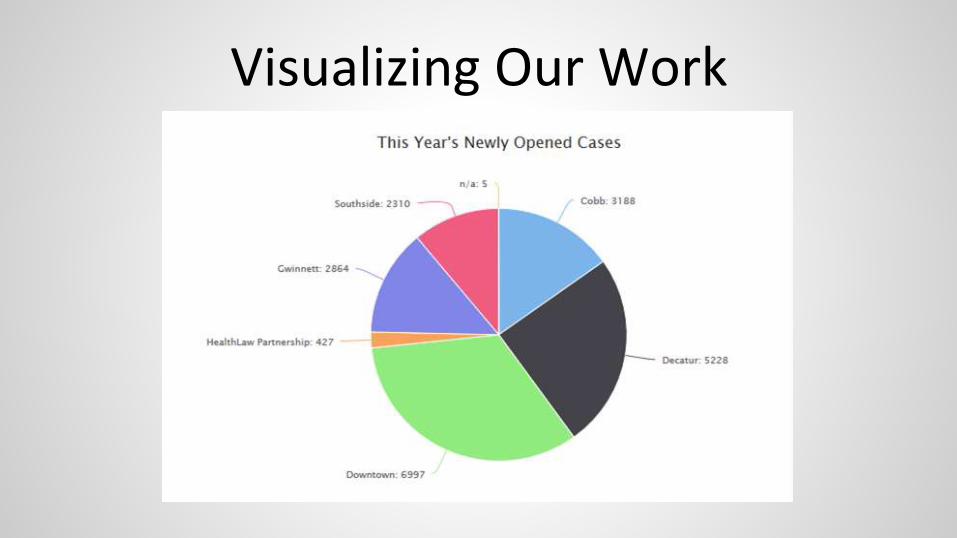
Visualizing Our Work
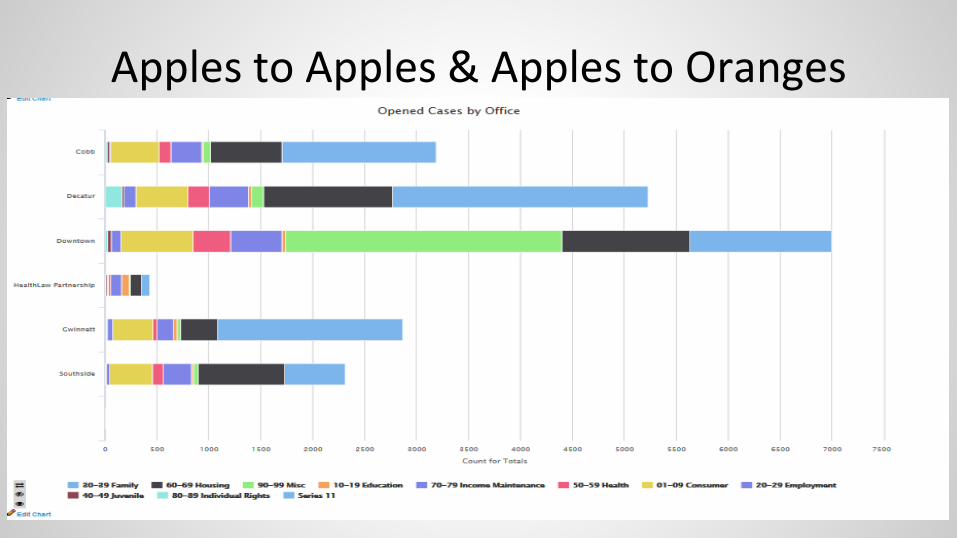
Apples to Apples & Apples to Oranges
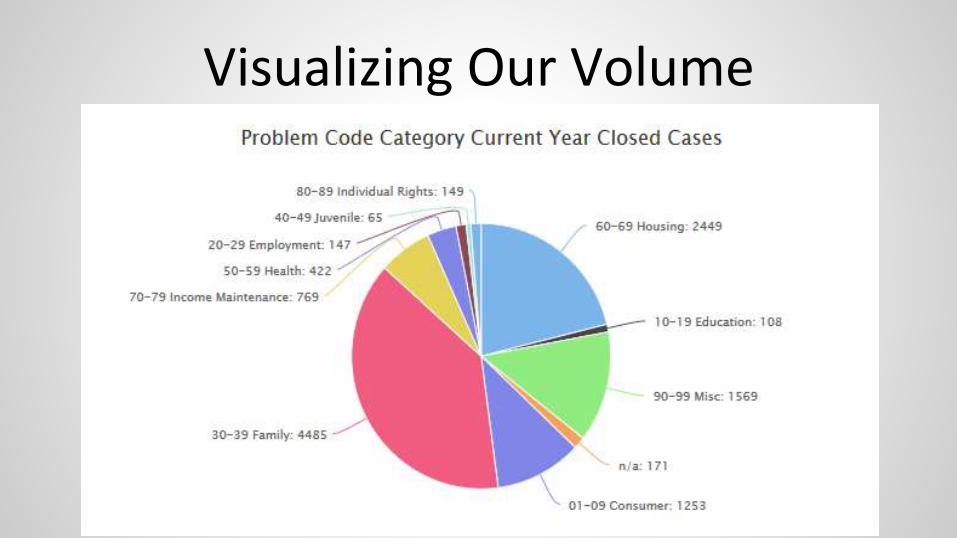
Visualizing Our Volume
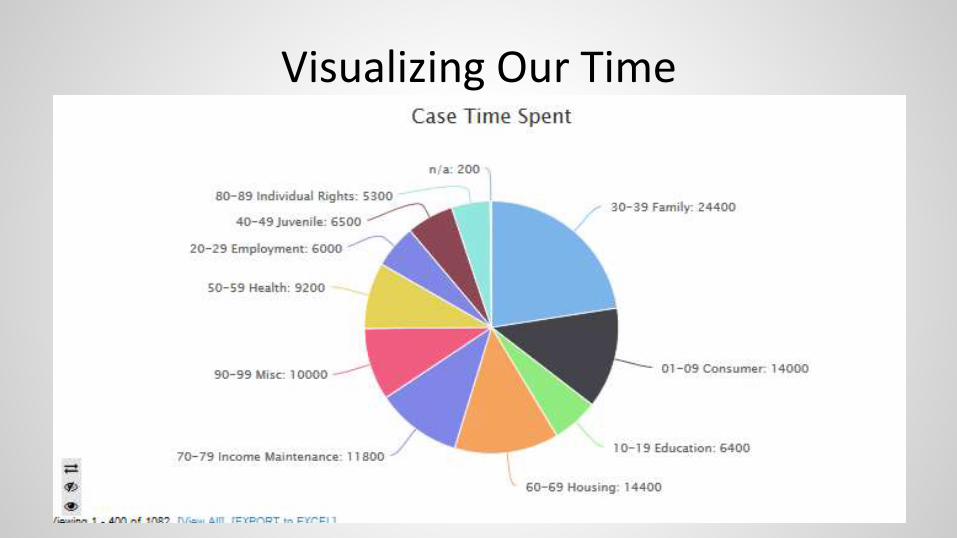
Visualizing Our Time
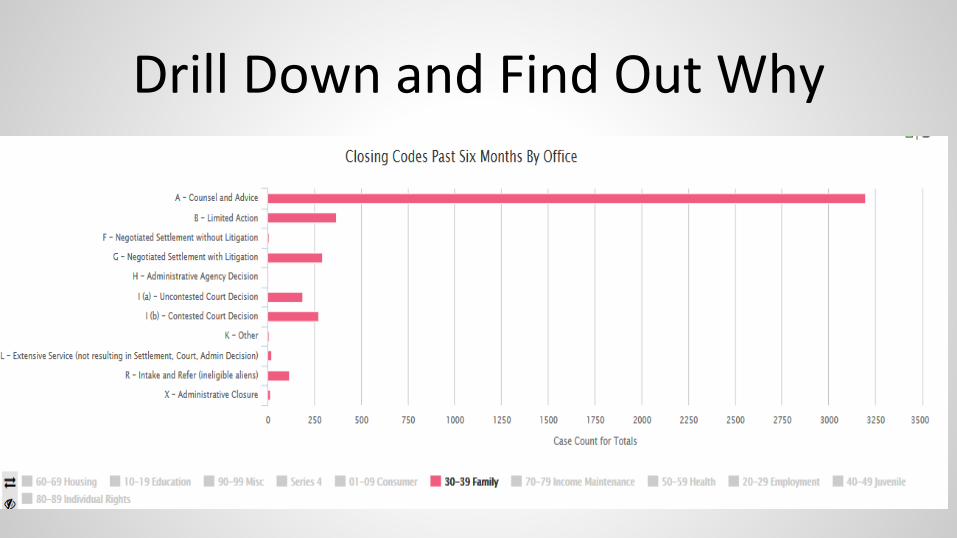
Drill Down and Find Out Why
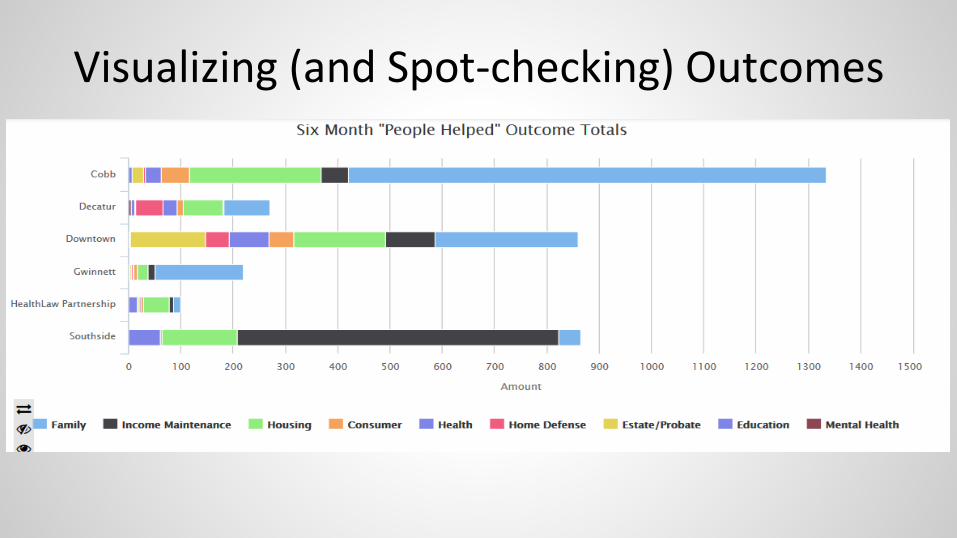
Visualizing (and Spot-checking) Outcomes
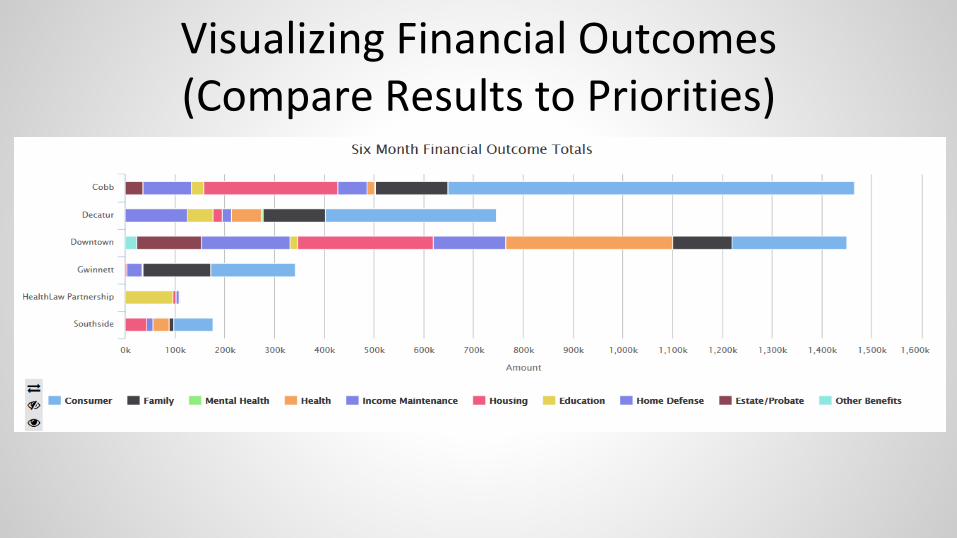
Visualizing Financial Outcomes(Compare Results to Priorities)
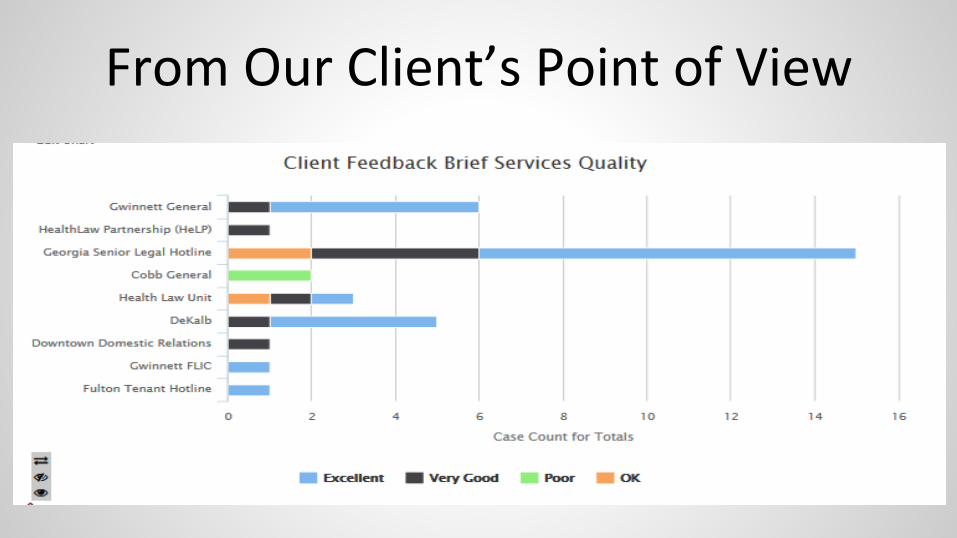
From Our Client’s Point of View
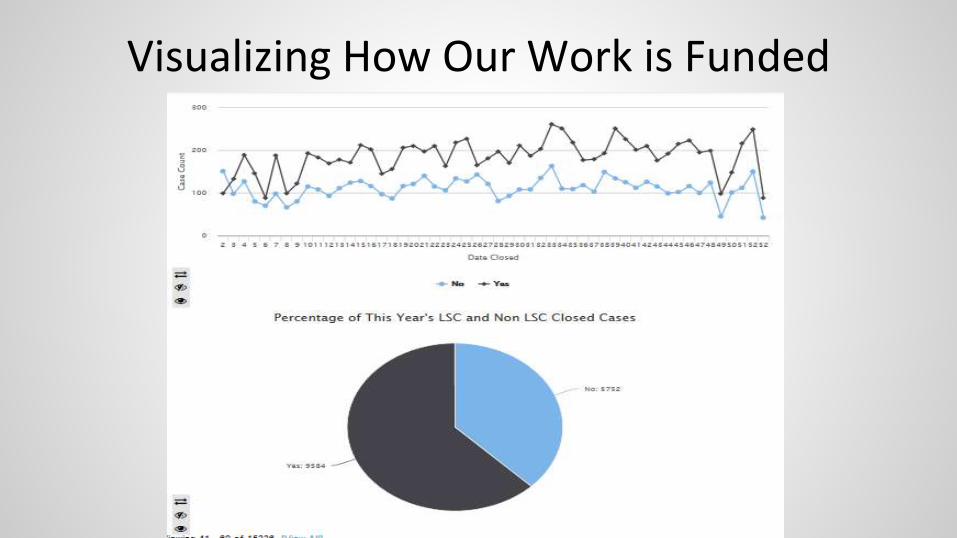
Visualizing How Our Work is Funded
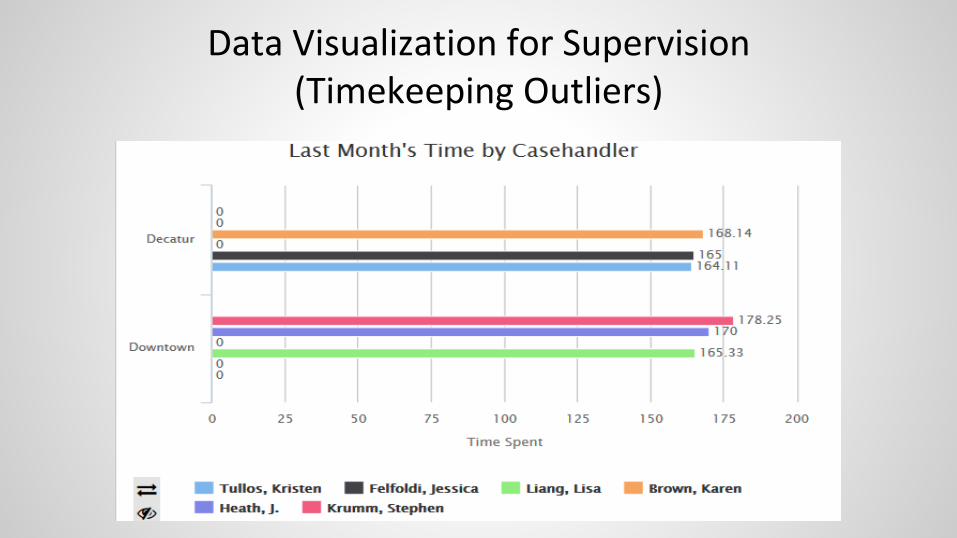
Data Visualization for Supervision(Timekeeping Outliers)
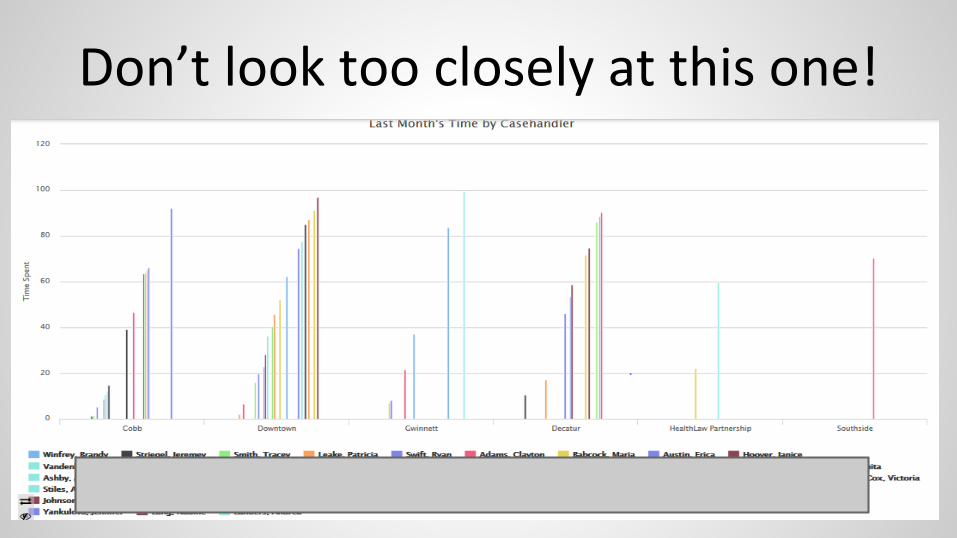
Don’t look too closely at this one!
Goal 3: CMS Integration Gravy
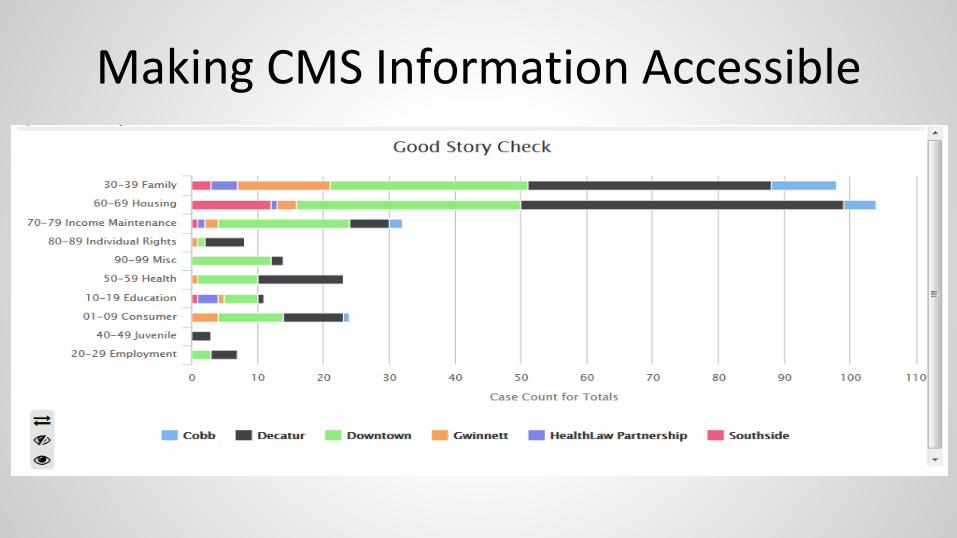
Making CMS Information Accessible
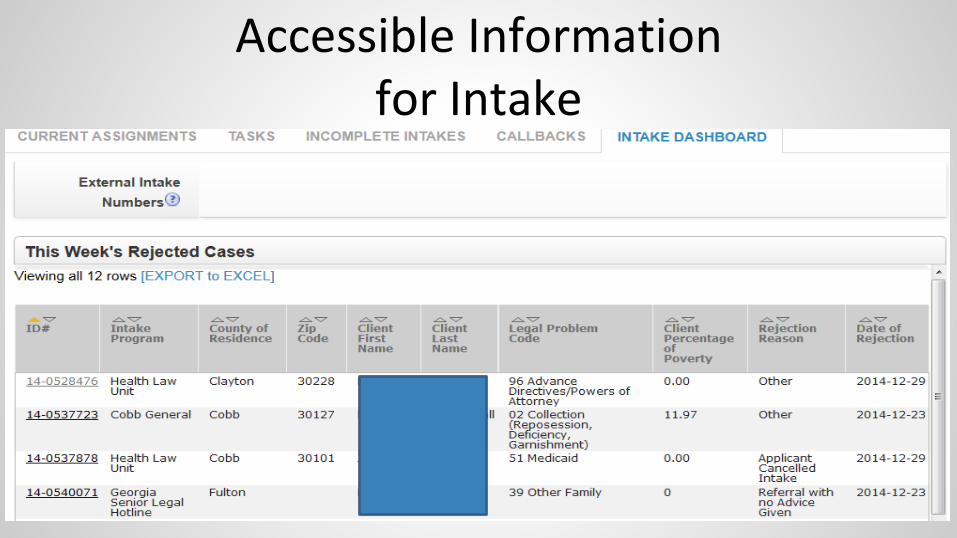
Accessible Informationfor Intake
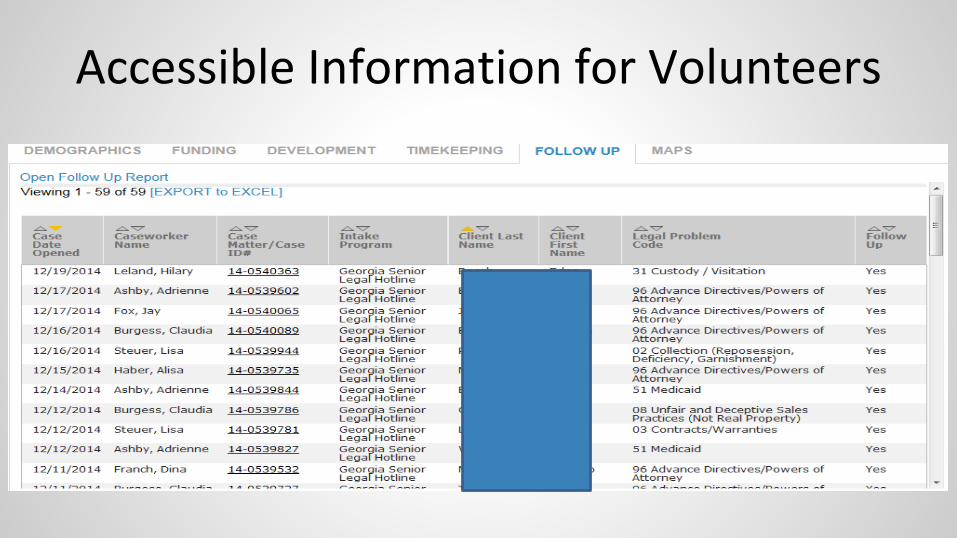
Accessible Information for Volunteers
Some Data Viz Efforts by LSC
Christina Sanabria
● LSC By the Numbers
● The “Data Portal”
● GIS mapping
LSC’s Data Visualization Initiatives
LSC By the Numbers
● Formerly “The Fact Book”
● Since 1979
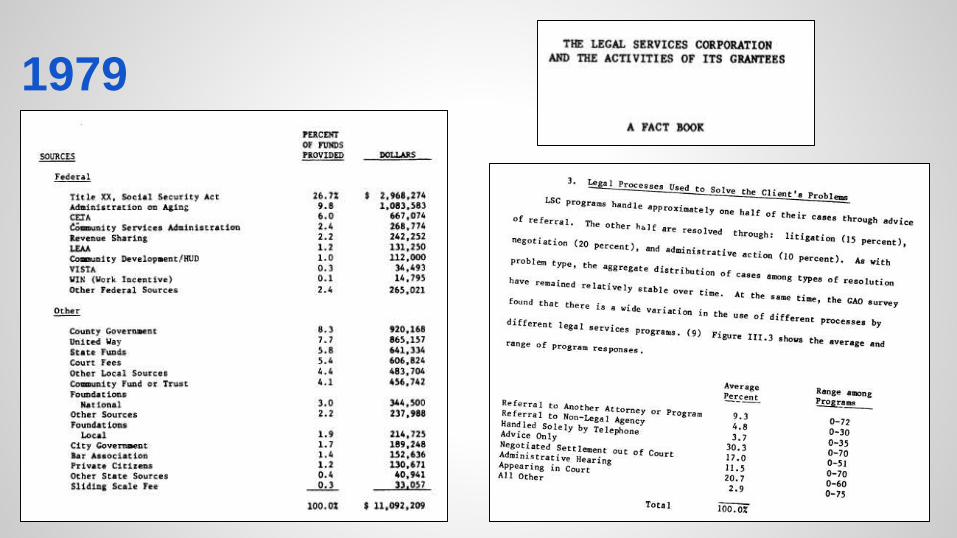
1979
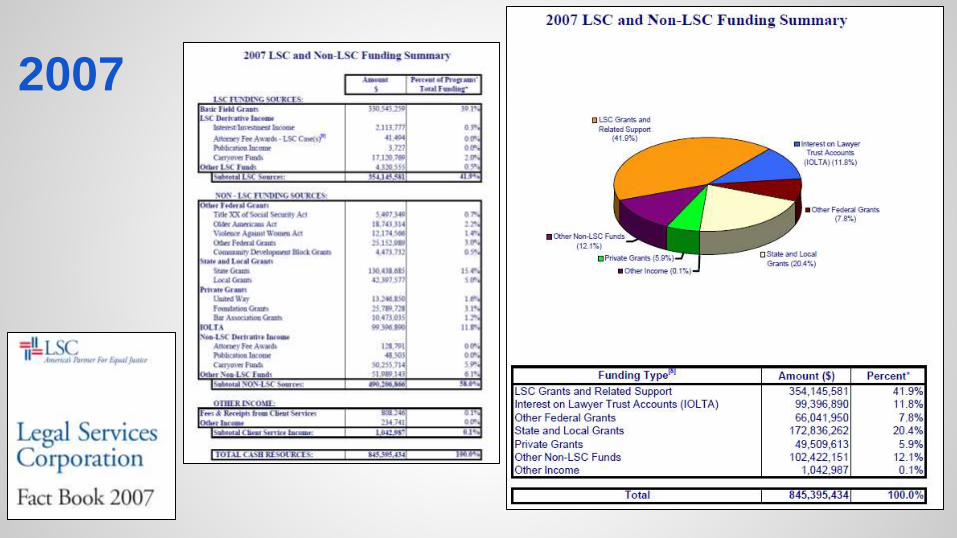
2007
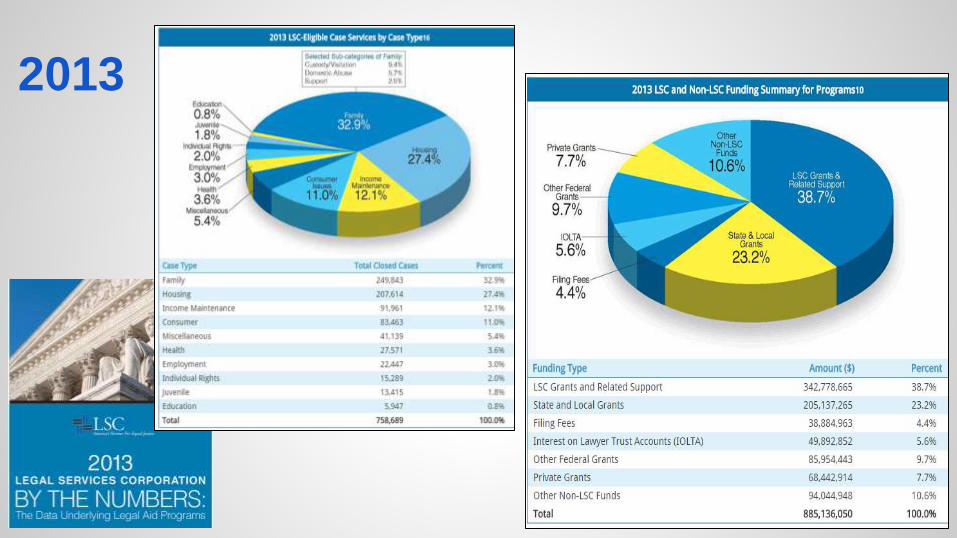
2013
LSC By the Numbers
● “Makeover” started in 2012
● Take info that’s already available, make it
more accessible and readable
LSC By the Numbers
● Positive feedback - “It’s great you’re doing
this now!”
● Led to corrections in data
● Recognition of multiple audiences
● Being asked about by Congressional
committee staff
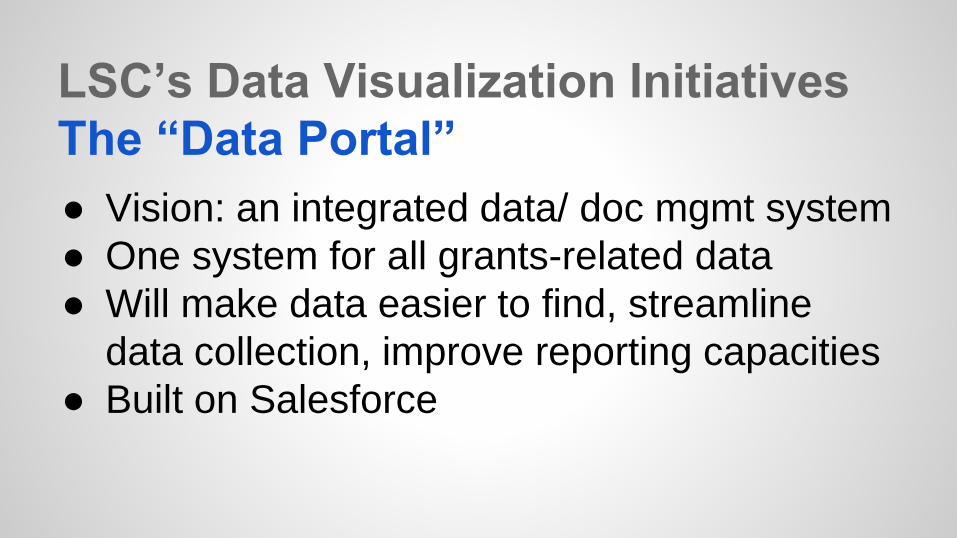
LSC’s Data Visualization Initiatives
The “Data Portal”
● Vision: an integrated data/ doc mgmt system
● One system for all grants-related data
● Will make data easier to find, streamline
data collection, improve reporting capacities
● Built on Salesforce
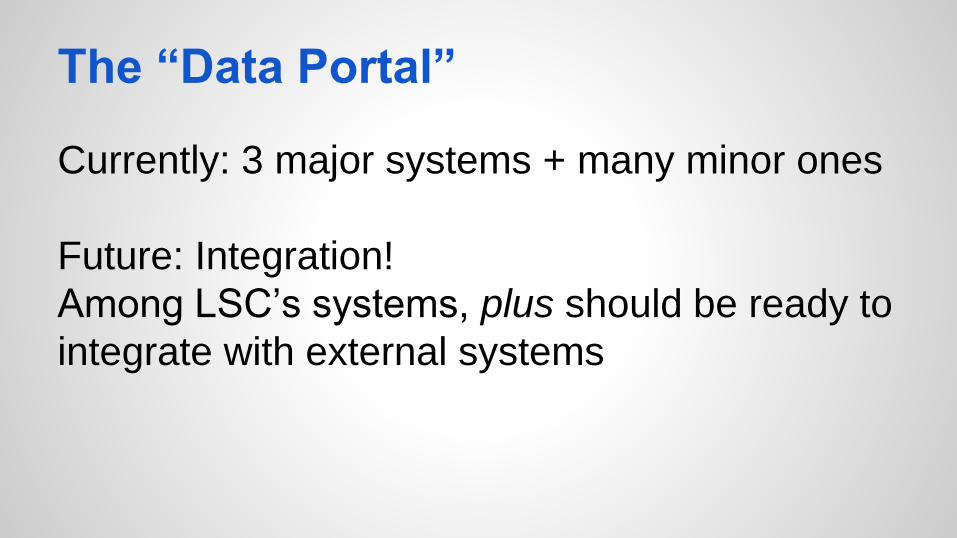
The “Data Portal”
Currently: 3 major systems + many minor ones
Future: Integration!
Among LSC’s systems, plus should be ready to
integrate with external systems
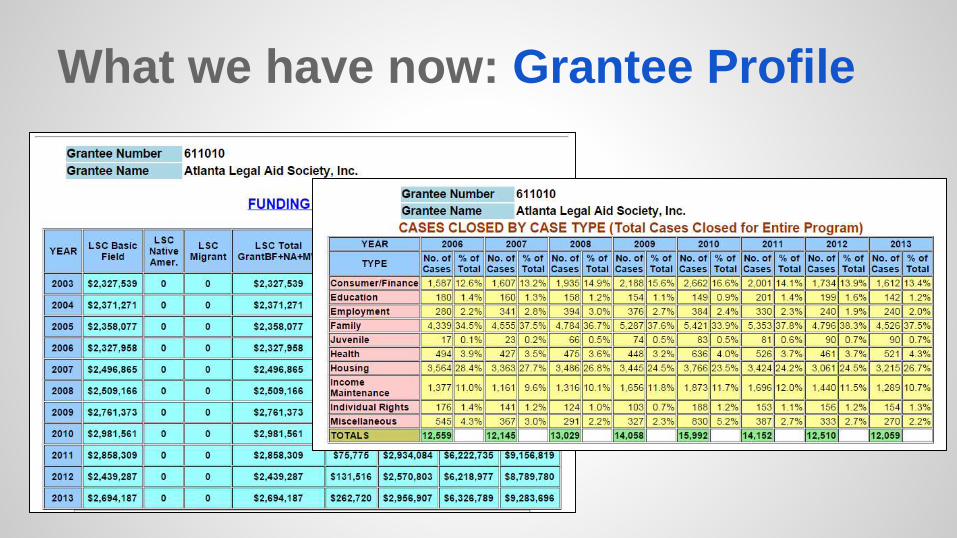
What we have now: Grantee Profile
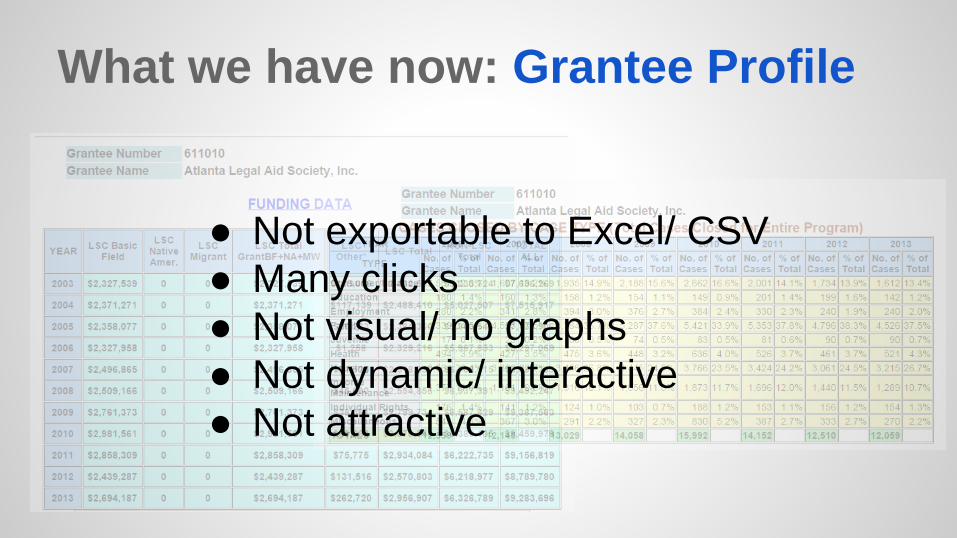
What we have now: Grantee Profile
● Not exportable to Excel/ CSV
● Many clicks
● Not visual/ no graphs
● Not dynamic/ interactive
● Not attractive
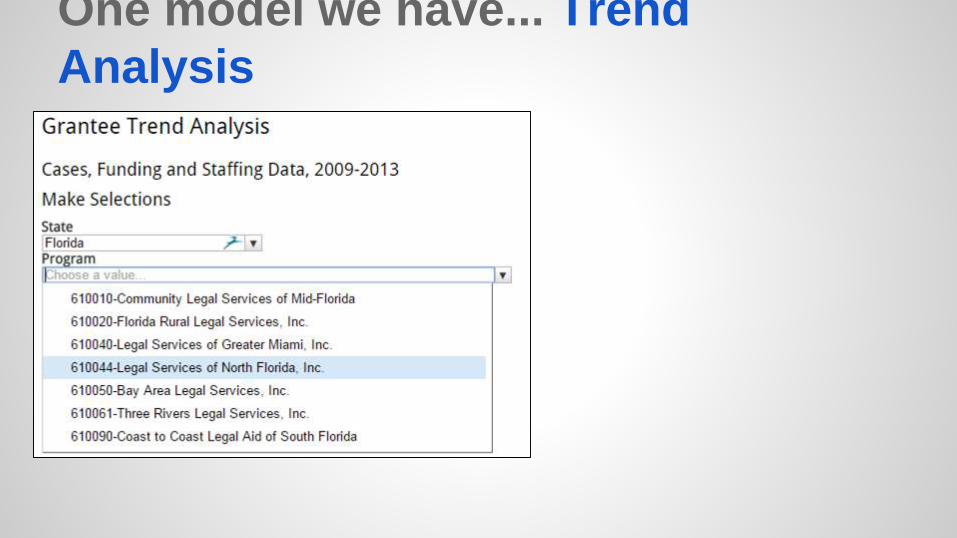
One model we have... Trend
Analysis
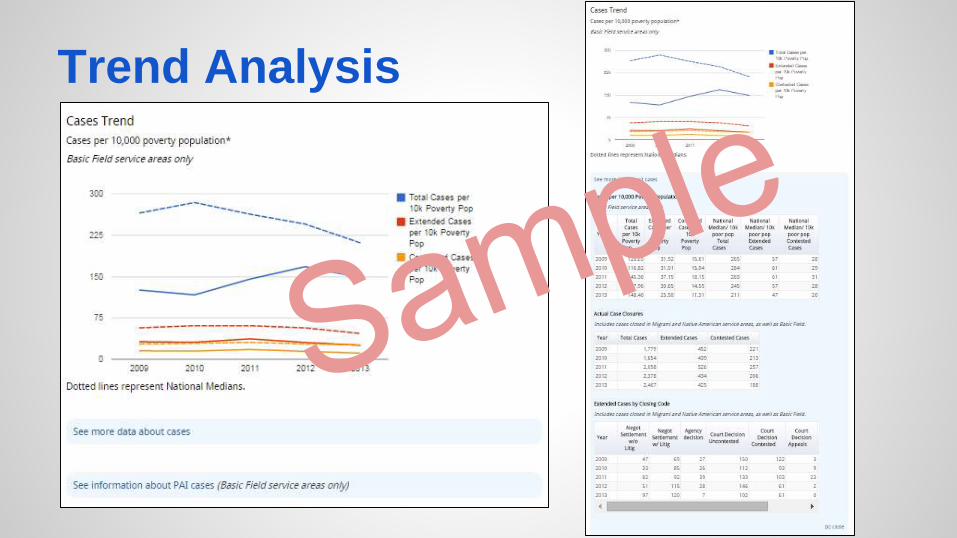
Trend Analysis
Trend Analysis
● Built on javascript
● Slow to load :(○ currently available on our LSC intraweb for staff
○ used in meetings, screenshots used in reports
○ we hope to eventually make it public to grantees/ the
public
● Being used as a model/ guidepost
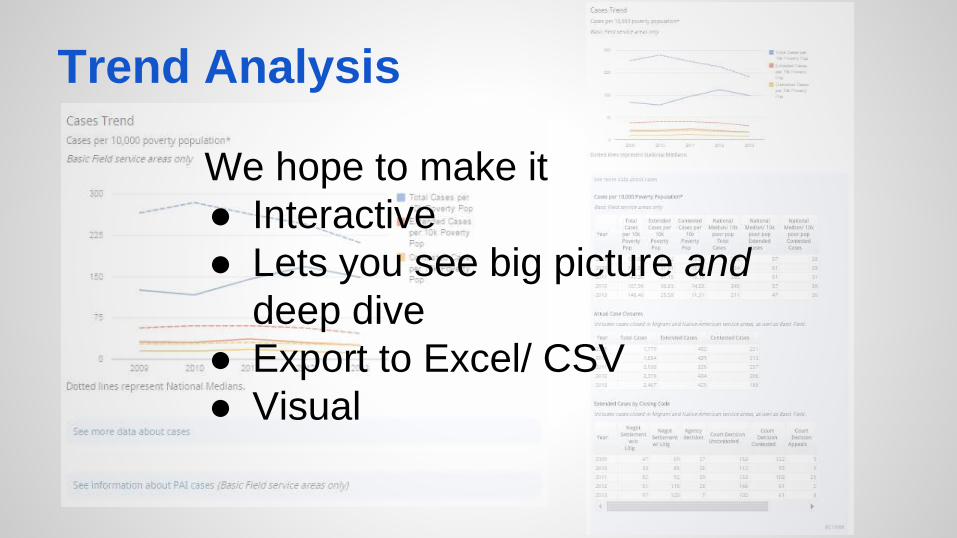
Trend Analysis
We hope to make it
● Interactive
● Lets you see big picture and
deep dive
● Export to Excel/ CSV
● Visual
The “Data Portal”
When?
● Functional beta for internal use - summer ’15
● Replace LSC Grants grants management
system in 2016
LSC’s Data Visualization Initiatives
GIS Mapping
● Since 2011
● Using QGIS (free open-source software)
● Maps created in advance of each Program
Quality Visit (PQV)○ Demographic data from ACS/Census
○ Case data provided by grantees
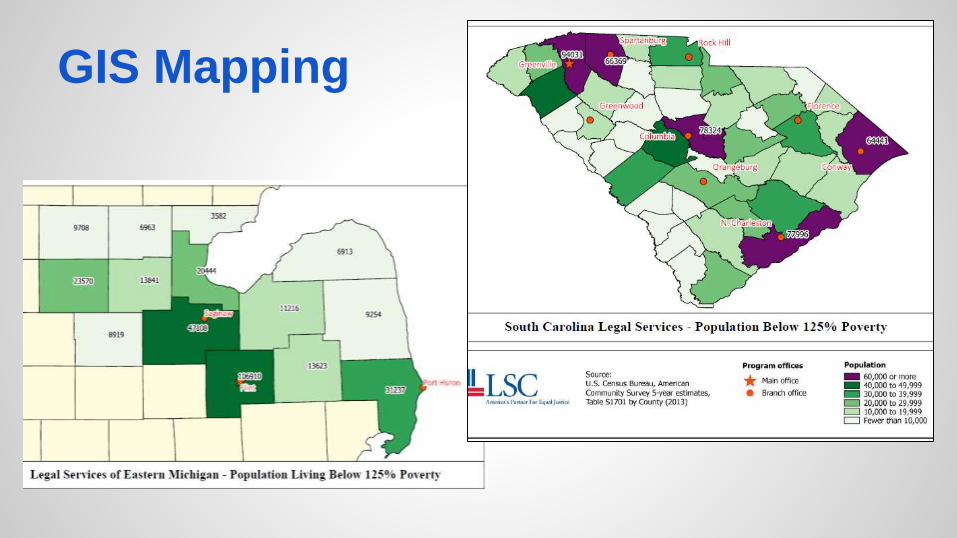
GIS Mapping
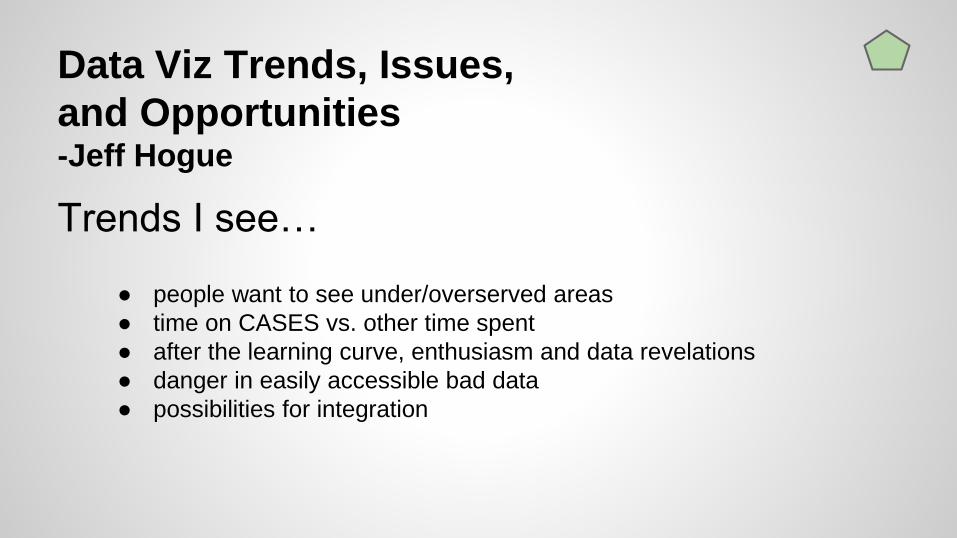
Data Viz Trends, Issues,
and Opportunities -Jeff Hogue
Trends I see…
● people want to see under/overserved areas
● time on CASES vs. other time spent
● after the learning curve, enthusiasm and data revelations
● danger in easily accessible bad data
● possibilities for integration
Data Privacy
Personally Identifiable
Information (PII)
Personally Identifiable Information
leaks may lead to required
disclosure and other
consequences.
PII may include:"any information about an individual
maintained by an agency, including (1) any
information that can be used to distinguish
or trace an individual‘s identity, such as
name, social security number, date and
place of birth, mother‘s maiden name, or
biometric records; and (2) any other
information that is linked or linkable to an
individual, such as medical, educational,
financial, and employment information.
Don’t even include PII in the source
report that contains your data unless
needed for the report.
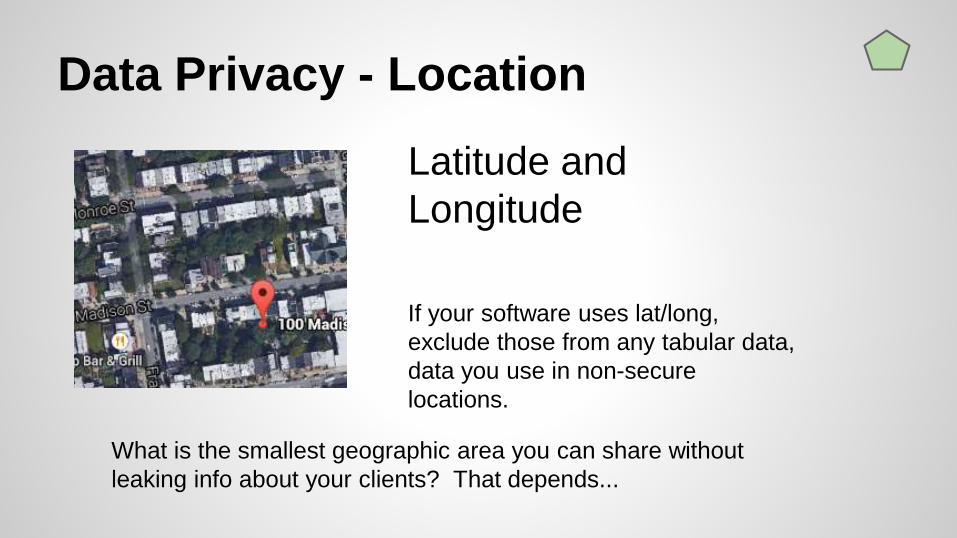
Data Privacy - Location
Latitude and
Longitude
If your software uses lat/long,
exclude those from any tabular data,
data you use in non-secure
locations.
What is the smallest geographic area you can share without
leaking info about your clients? That depends...
Aggregation Opportunities
● Aggregation can tell a story
about service delivery for a
whole state/region
● Aggregated data could reveal
real-time trends in client
needs
● Possible drivers:
IOLTAs,
Forward thinking funders
Protecting program and client
interests in data
● Security and privacy
● Info you’d rather not share
with funders/others
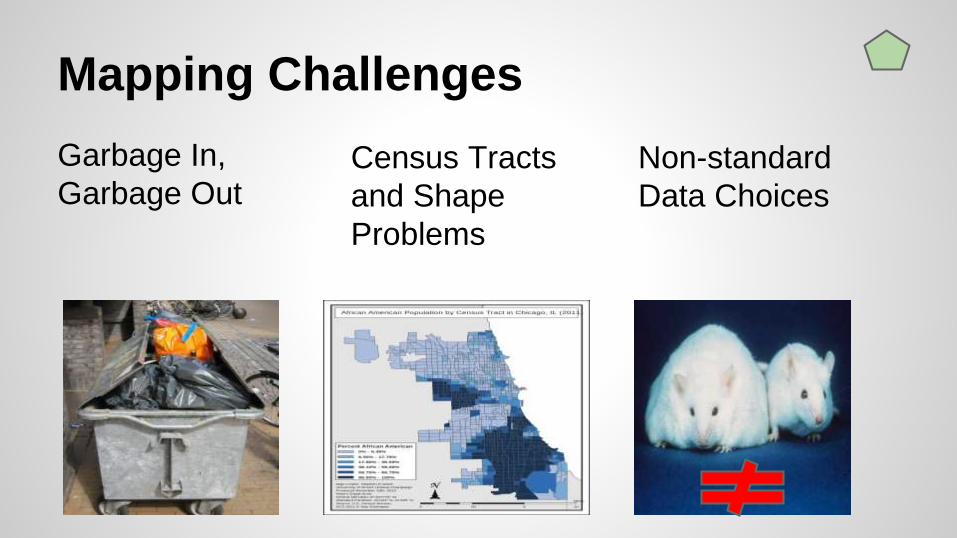
Mapping Challenges
Garbage In,
Garbage OutCensus Tracts
and Shape
Problems
Non-standard
Data Choices
CMS and outside the CMS
Advantage of Inside CMS data viz:
● security
● convenience
● real-time
Outside CMS advantages:
● purpose-built for prettiness
● interactivity with public data sources
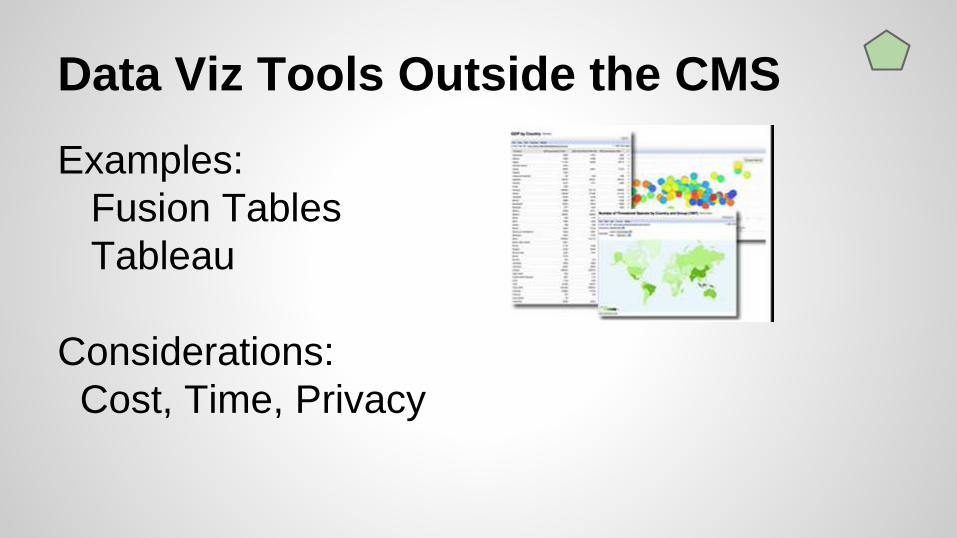
Data Viz Tools Outside the CMS
Examples:
Fusion Tables
Tableau
Considerations:
Cost, Time, Privacy
Questions?
Contact Info
Joan Kleinberg - Northwest Justice Project ([email protected])
Kristin Verrill - Atlanta Legal Aid Society ([email protected])
Christina Sanabria - Legal Services Corporation ([email protected])
Jeff Hogue - Legal Server ([email protected])