video analysis of motorcycle and rider dynamics...
TRANSCRIPT
AbstractThis paper investigates the dynamics of four motorcycle crashes that occurred on or near a curve (Edwards Corner) on a section of the Mulholland Highway called “The Snake.” This section of highway is located in the Santa Monica Mountains of California. All four accidents were captured on video and they each involved a high-side fall of the motorcycle and rider. This article reports a technical description and analysis of these videos in which the motion of the motorcycles and riders is quantified. To aid in the analysis, the authors mapped Edwards Corner using both a Sokkia total station and a Faro laser scanner. This mapping data enabled analysis of the videos to determine the initial speed of the motorcycles, to identify where in the curve particular rider actions occurred, to quantify the motion of the motorcycles and riders, and to characterize the roadway radius and superelevation throughout the curve. For each crash video, this paper reports quantitative data from the crash along with a qualitative description of the rider’s actions.
IntroductionThis paper investigates the dynamics of four motorcycle crashes that occurred on or near a curve called Edwards Corner that is on a section of the Mulholland Highway called “The Snake” [1,2,3]. This section of highway is located in the Santa Monica Mountains of California, about 30 miles northwest of Hollywood. All four accidents were captured on video and they each involved a high-side fall of the motorcycle and rider. The videos of these crashes were captured by Ken Snyder, a photographer who captures video at Edwards Corner and posts footage of crashes on his YouTube channel under the name RNickeymouse. Ken Snyder provided the raw video for 3 of the 4 crashes analyzed in this article.
This article reports analysis of the videos of these four high-side crashes. This analysis quantified the motion of the motorcycles and riders. To aid in the analysis, the authors mapped Edwards Corner using both a Sokkia total station and a Faro laser scanner. This mapping data enabled analysis of the videos to determine the initial speed of the motorcycles, to identify where in the curve particular rider actions occurred, to quantify the motion of the motorcycles and riders, and to characterize the roadway radius and superelevation throughout the curve. For each crash video, this paper reports quantitative data from the crash along with a qualitative description of the rider’s actions.
High-side falls typically occur during acceleration or braking. The sequence of events that lead to these falls begins when the longitudinal force at the rear tire, from either acceleration or braking, consumes enough of the available longitudinal traction to leave insufficient traction available for maintaining lateral stability. This can occur during cornering, when the motorcycle needs lateral traction to continue around the curve. It can also occur during straight-line braking if the rider brakes with sufficient force to lock the rear wheel. In either instance, the rear wheel begins sliding laterally, the motorcycle develops a yaw rotation, and the motorcycle and rider begin to lean away from the direction of travel. If the rider releases the throttle or rear brake while this is occurring, then the longitudinal force at the rear wheel will decrease rapidly and result in a sudden increase in the available lateral traction. This sudden spike in lateral force at the rear tire can lead to the motorcycle and rider rolling to the opposite direction of the initial lean. The rider is then often projected upward and thrown ahead of the motorcycle [4,5].
Video Analysis of Motorcycle and Rider Dynamics During High-Side Falls
2017-01-1413
Published 03/28/2017
Nathan A. Rose, Neal Carter, David Pentecost, and Alireza HashemianKineticorp LLC
CITATION: Rose, N., Carter, N., Pentecost, D., and Hashemian, A., "Video Analysis of Motorcycle and Rider Dynamics During High-Side Falls," SAE Technical Paper 2017-01-1413, 2017, doi:10.4271/2017-01-1413.
Copyright © 2017 SAE International
Downloaded from SAE International by Neal Carter, Tuesday, February 21, 2017
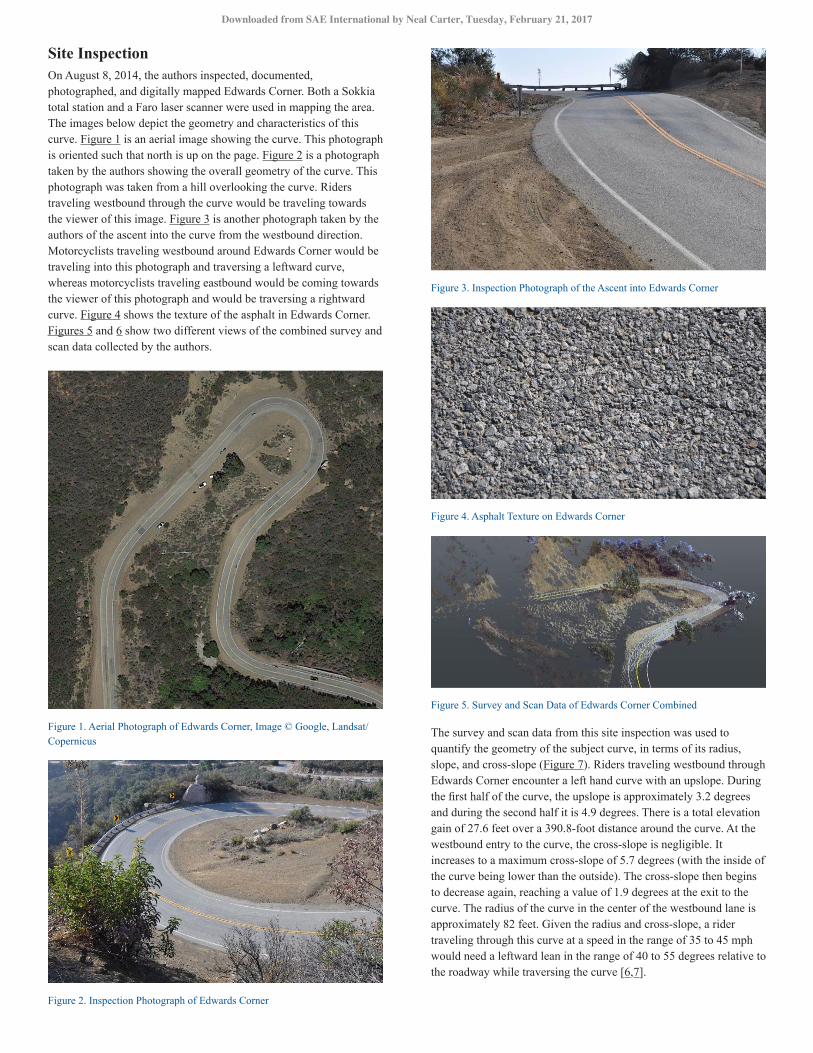
Site InspectionOn August 8, 2014, the authors inspected, documented, photographed, and digitally mapped Edwards Corner. Both a Sokkia total station and a Faro laser scanner were used in mapping the area. The images below depict the geometry and characteristics of this curve. Figure 1 is an aerial image showing the curve. This photograph is oriented such that north is up on the page. Figure 2 is a photograph taken by the authors showing the overall geometry of the curve. This photograph was taken from a hill overlooking the curve. Riders traveling westbound through the curve would be traveling towards the viewer of this image. Figure 3 is another photograph taken by the authors of the ascent into the curve from the westbound direction. Motorcyclists traveling westbound around Edwards Corner would be traveling into this photograph and traversing a leftward curve, whereas motorcyclists traveling eastbound would be coming towards the viewer of this photograph and would be traversing a rightward curve. Figure 4 shows the texture of the asphalt in Edwards Corner. Figures 5 and 6 show two different views of the combined survey and scan data collected by the authors.
Figure 1. Aerial Photograph of Edwards Corner, Image © Google, Landsat/Copernicus
Figure 2. Inspection Photograph of Edwards Corner
Figure 3. Inspection Photograph of the Ascent into Edwards Corner
Figure 4. Asphalt Texture on Edwards Corner
Figure 5. Survey and Scan Data of Edwards Corner Combined
The survey and scan data from this site inspection was used to quantify the geometry of the subject curve, in terms of its radius, slope, and cross-slope (Figure 7). Riders traveling westbound through Edwards Corner encounter a left hand curve with an upslope. During the first half of the curve, the upslope is approximately 3.2 degrees and during the second half it is 4.9 degrees. There is a total elevation gain of 27.6 feet over a 390.8-foot distance around the curve. At the westbound entry to the curve, the cross-slope is negligible. It increases to a maximum cross-slope of 5.7 degrees (with the inside of the curve being lower than the outside). The cross-slope then begins to decrease again, reaching a value of 1.9 degrees at the exit to the curve. The radius of the curve in the center of the westbound lane is approximately 82 feet. Given the radius and cross-slope, a rider traveling through this curve at a speed in the range of 35 to 45 mph would need a leftward lean in the range of 40 to 55 degrees relative to the roadway while traversing the curve [6,7].
Downloaded from SAE International by Neal Carter, Tuesday, February 21, 2017
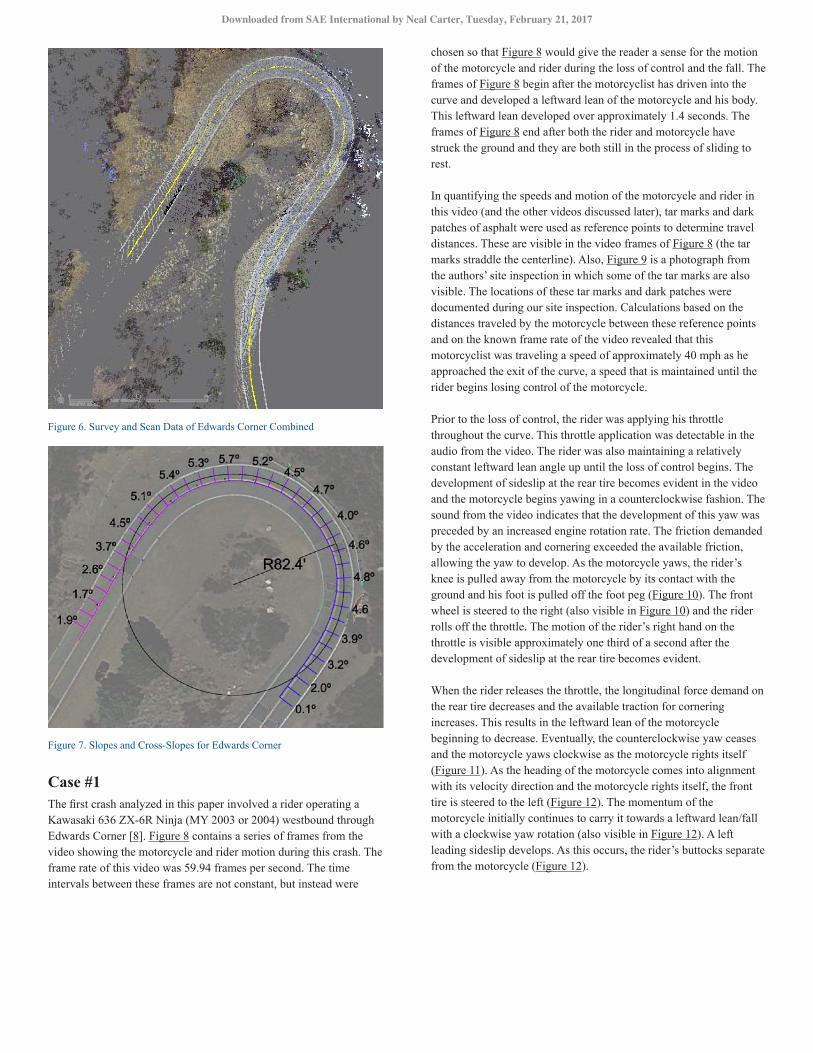
Figure 6. Survey and Scan Data of Edwards Corner Combined
Figure 7. Slopes and Cross-Slopes for Edwards Corner
Case #1The first crash analyzed in this paper involved a rider operating a Kawasaki 636 ZX-6R Ninja (MY 2003 or 2004) westbound through Edwards Corner [8]. Figure 8 contains a series of frames from the video showing the motorcycle and rider motion during this crash. The frame rate of this video was 59.94 frames per second. The time intervals between these frames are not constant, but instead were
chosen so that Figure 8 would give the reader a sense for the motion of the motorcycle and rider during the loss of control and the fall. The frames of Figure 8 begin after the motorcyclist has driven into the curve and developed a leftward lean of the motorcycle and his body. This leftward lean developed over approximately 1.4 seconds. The frames of Figure 8 end after both the rider and motorcycle have struck the ground and they are both still in the process of sliding to rest.
In quantifying the speeds and motion of the motorcycle and rider in this video (and the other videos discussed later), tar marks and dark patches of asphalt were used as reference points to determine travel distances. These are visible in the video frames of Figure 8 (the tar marks straddle the centerline). Also, Figure 9 is a photograph from the authors’ site inspection in which some of the tar marks are also visible. The locations of these tar marks and dark patches were documented during our site inspection. Calculations based on the distances traveled by the motorcycle between these reference points and on the known frame rate of the video revealed that this motorcyclist was traveling a speed of approximately 40 mph as he approached the exit of the curve, a speed that is maintained until the rider begins losing control of the motorcycle.
Prior to the loss of control, the rider was applying his throttle throughout the curve. This throttle application was detectable in the audio from the video. The rider was also maintaining a relatively constant leftward lean angle up until the loss of control begins. The development of sideslip at the rear tire becomes evident in the video and the motorcycle begins yawing in a counterclockwise fashion. The sound from the video indicates that the development of this yaw was preceded by an increased engine rotation rate. The friction demanded by the acceleration and cornering exceeded the available friction, allowing the yaw to develop. As the motorcycle yaws, the rider’s knee is pulled away from the motorcycle by its contact with the ground and his foot is pulled off the foot peg (Figure 10). The front wheel is steered to the right (also visible in Figure 10) and the rider rolls off the throttle. The motion of the rider’s right hand on the throttle is visible approximately one third of a second after the development of sideslip at the rear tire becomes evident.
When the rider releases the throttle, the longitudinal force demand on the rear tire decreases and the available traction for cornering increases. This results in the leftward lean of the motorcycle beginning to decrease. Eventually, the counterclockwise yaw ceases and the motorcycle yaws clockwise as the motorcycle rights itself (Figure 11). As the heading of the motorcycle comes into alignment with its velocity direction and the motorcycle rights itself, the front tire is steered to the left (Figure 12). The momentum of the motorcycle initially continues to carry it towards a leftward lean/fall with a clockwise yaw rotation (also visible in Figure 12). A left leading sideslip develops. As this occurs, the rider’s buttocks separate from the motorcycle (Figure 12).
Downloaded from SAE International by Neal Carter, Tuesday, February 21, 2017
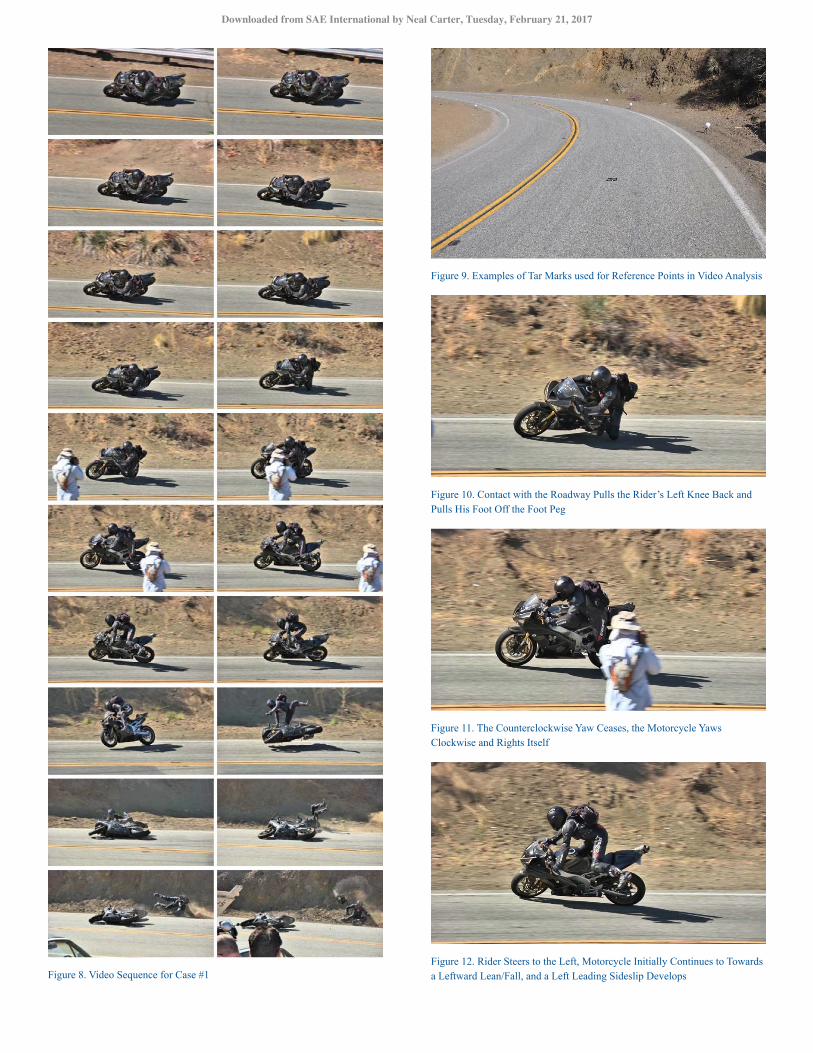
Figure 8. Video Sequence for Case #1
Figure 9. Examples of Tar Marks used for Reference Points in Video Analysis
Figure 10. Contact with the Roadway Pulls the Rider’s Left Knee Back and Pulls His Foot Off the Foot Peg
Figure 11. The Counterclockwise Yaw Ceases, the Motorcycle Yaws Clockwise and Rights Itself
Figure 12. Rider Steers to the Left, Motorcycle Initially Continues to Towards a Leftward Lean/Fall, and a Left Leading Sideslip Develops
Downloaded from SAE International by Neal Carter, Tuesday, February 21, 2017
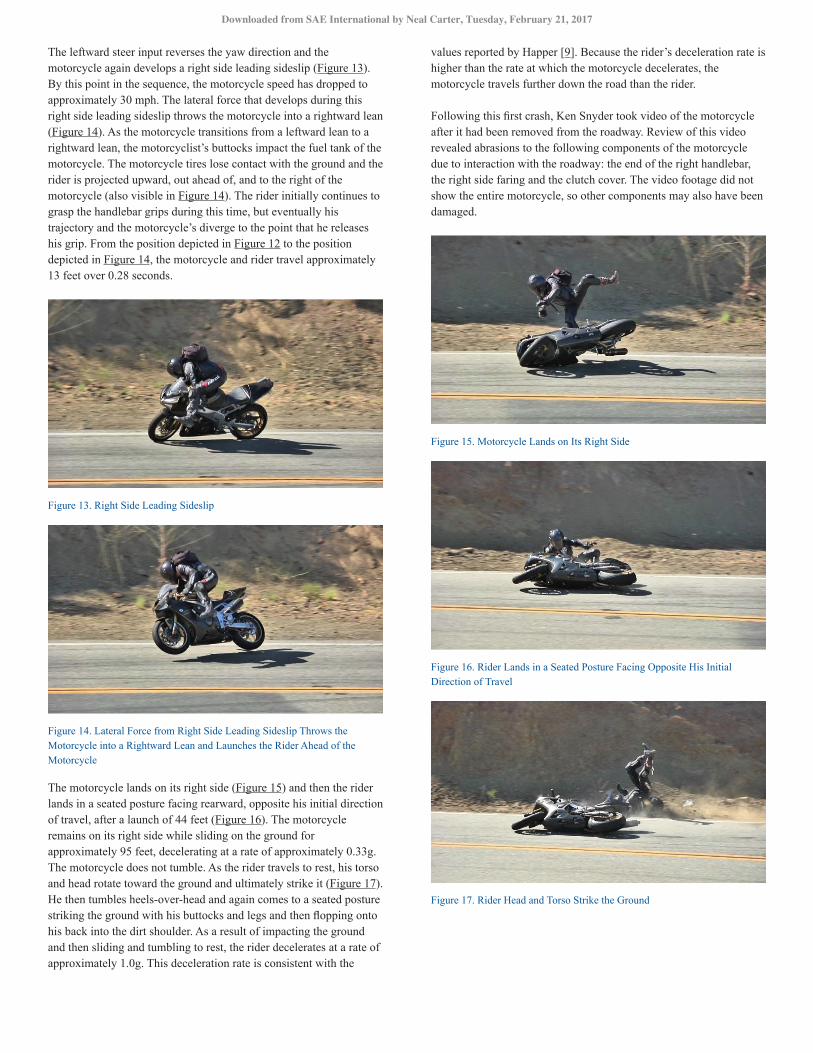
The leftward steer input reverses the yaw direction and the motorcycle again develops a right side leading sideslip (Figure 13). By this point in the sequence, the motorcycle speed has dropped to approximately 30 mph. The lateral force that develops during this right side leading sideslip throws the motorcycle into a rightward lean (Figure 14). As the motorcycle transitions from a leftward lean to a rightward lean, the motorcyclist’s buttocks impact the fuel tank of the motorcycle. The motorcycle tires lose contact with the ground and the rider is projected upward, out ahead of, and to the right of the motorcycle (also visible in Figure 14). The rider initially continues to grasp the handlebar grips during this time, but eventually his trajectory and the motorcycle’s diverge to the point that he releases his grip. From the position depicted in Figure 12 to the position depicted in Figure 14, the motorcycle and rider travel approximately 13 feet over 0.28 seconds.
Figure 13. Right Side Leading Sideslip
Figure 14. Lateral Force from Right Side Leading Sideslip Throws the Motorcycle into a Rightward Lean and Launches the Rider Ahead of the Motorcycle
The motorcycle lands on its right side (Figure 15) and then the rider lands in a seated posture facing rearward, opposite his initial direction of travel, after a launch of 44 feet (Figure 16). The motorcycle remains on its right side while sliding on the ground for approximately 95 feet, decelerating at a rate of approximately 0.33g. The motorcycle does not tumble. As the rider travels to rest, his torso and head rotate toward the ground and ultimately strike it (Figure 17). He then tumbles heels-over-head and again comes to a seated posture striking the ground with his buttocks and legs and then flopping onto his back into the dirt shoulder. As a result of impacting the ground and then sliding and tumbling to rest, the rider decelerates at a rate of approximately 1.0g. This deceleration rate is consistent with the
values reported by Happer [9]. Because the rider’s deceleration rate is higher than the rate at which the motorcycle decelerates, the motorcycle travels further down the road than the rider.
Following this first crash, Ken Snyder took video of the motorcycle after it had been removed from the roadway. Review of this video revealed abrasions to the following components of the motorcycle due to interaction with the roadway: the end of the right handlebar, the right side faring and the clutch cover. The video footage did not show the entire motorcycle, so other components may also have been damaged.
Figure 15. Motorcycle Lands on Its Right Side
Figure 16. Rider Lands in a Seated Posture Facing Opposite His Initial Direction of Travel
Figure 17. Rider Head and Torso Strike the Ground
Downloaded from SAE International by Neal Carter, Tuesday, February 21, 2017
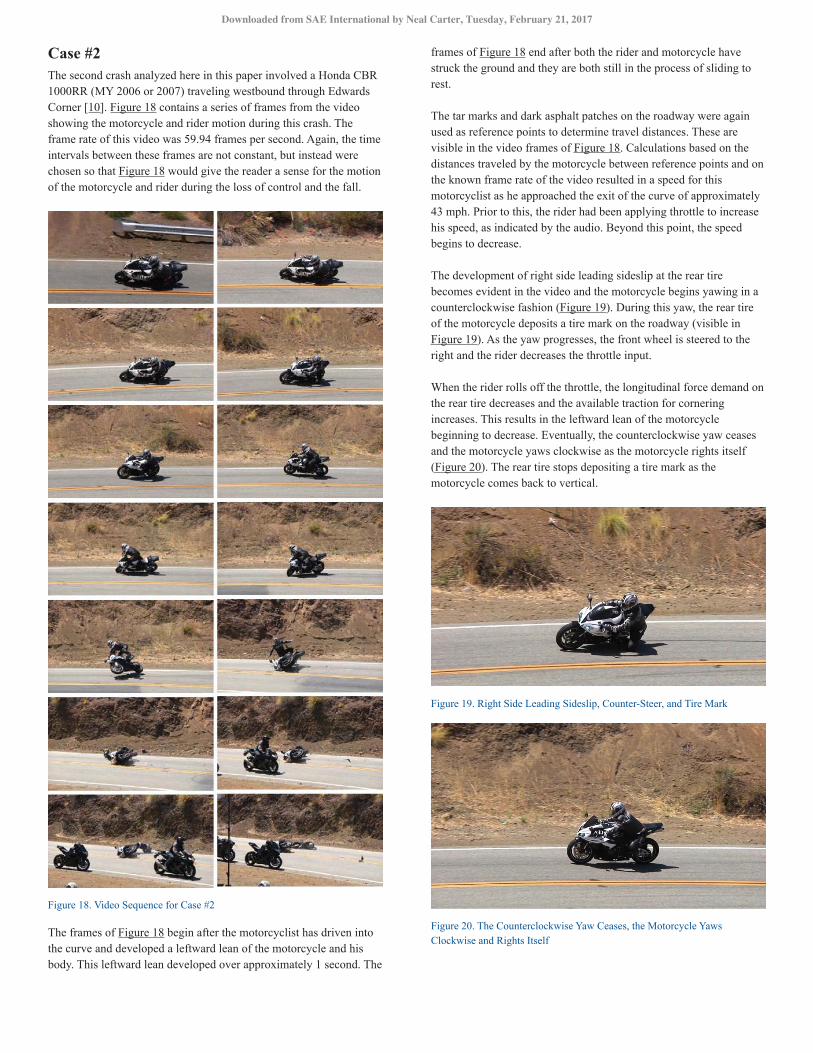
Case #2The second crash analyzed here in this paper involved a Honda CBR 1000RR (MY 2006 or 2007) traveling westbound through Edwards Corner [10]. Figure 18 contains a series of frames from the video showing the motorcycle and rider motion during this crash. The frame rate of this video was 59.94 frames per second. Again, the time intervals between these frames are not constant, but instead were chosen so that Figure 18 would give the reader a sense for the motion of the motorcycle and rider during the loss of control and the fall.
Figure 18. Video Sequence for Case #2
The frames of Figure 18 begin after the motorcyclist has driven into the curve and developed a leftward lean of the motorcycle and his body. This leftward lean developed over approximately 1 second. The
frames of Figure 18 end after both the rider and motorcycle have struck the ground and they are both still in the process of sliding to rest.
The tar marks and dark asphalt patches on the roadway were again used as reference points to determine travel distances. These are visible in the video frames of Figure 18. Calculations based on the distances traveled by the motorcycle between reference points and on the known frame rate of the video resulted in a speed for this motorcyclist as he approached the exit of the curve of approximately 43 mph. Prior to this, the rider had been applying throttle to increase his speed, as indicated by the audio. Beyond this point, the speed begins to decrease.
The development of right side leading sideslip at the rear tire becomes evident in the video and the motorcycle begins yawing in a counterclockwise fashion (Figure 19). During this yaw, the rear tire of the motorcycle deposits a tire mark on the roadway (visible in Figure 19). As the yaw progresses, the front wheel is steered to the right and the rider decreases the throttle input.
When the rider rolls off the throttle, the longitudinal force demand on the rear tire decreases and the available traction for cornering increases. This results in the leftward lean of the motorcycle beginning to decrease. Eventually, the counterclockwise yaw ceases and the motorcycle yaws clockwise as the motorcycle rights itself (Figure 20). The rear tire stops depositing a tire mark as the motorcycle comes back to vertical.
Figure 19. Right Side Leading Sideslip, Counter-Steer, and Tire Mark
Figure 20. The Counterclockwise Yaw Ceases, the Motorcycle Yaws Clockwise and Rights Itself
Downloaded from SAE International by Neal Carter, Tuesday, February 21, 2017
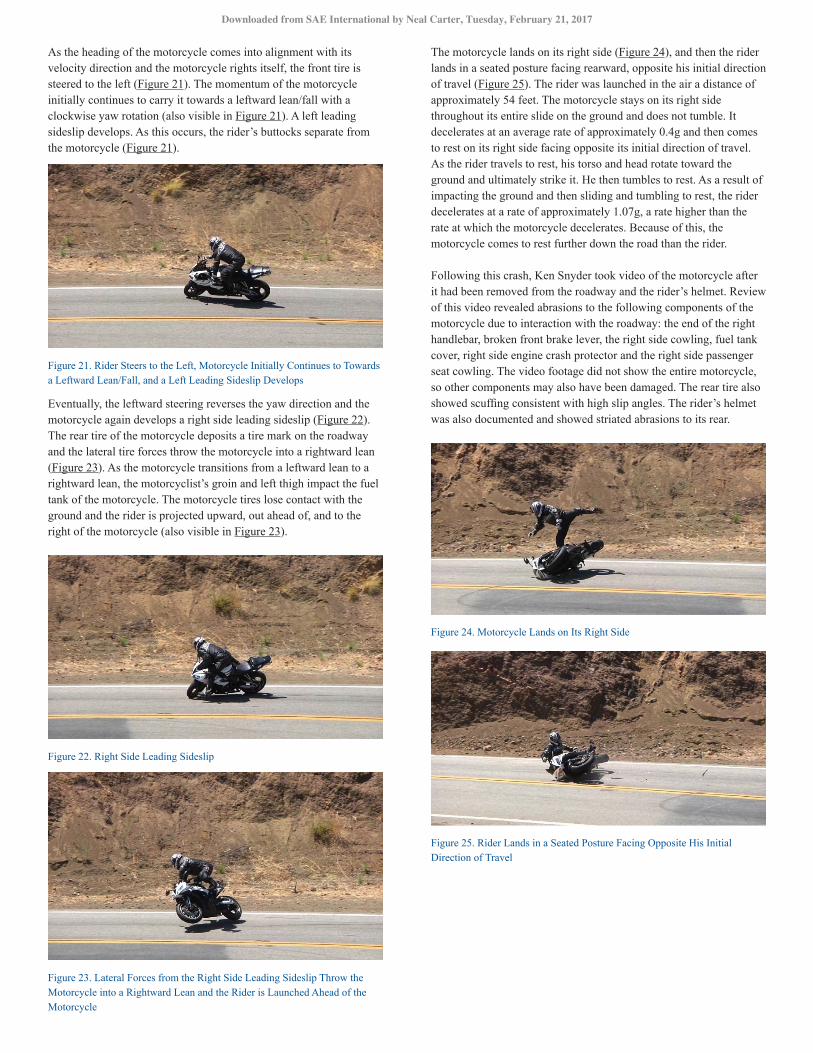
As the heading of the motorcycle comes into alignment with its velocity direction and the motorcycle rights itself, the front tire is steered to the left (Figure 21). The momentum of the motorcycle initially continues to carry it towards a leftward lean/fall with a clockwise yaw rotation (also visible in Figure 21). A left leading sideslip develops. As this occurs, the rider’s buttocks separate from the motorcycle (Figure 21).
Figure 21. Rider Steers to the Left, Motorcycle Initially Continues to Towards a Leftward Lean/Fall, and a Left Leading Sideslip Develops
Eventually, the leftward steering reverses the yaw direction and the motorcycle again develops a right side leading sideslip (Figure 22). The rear tire of the motorcycle deposits a tire mark on the roadway and the lateral tire forces throw the motorcycle into a rightward lean (Figure 23). As the motorcycle transitions from a leftward lean to a rightward lean, the motorcyclist’s groin and left thigh impact the fuel tank of the motorcycle. The motorcycle tires lose contact with the ground and the rider is projected upward, out ahead of, and to the right of the motorcycle (also visible in Figure 23).
Figure 22. Right Side Leading Sideslip
Figure 23. Lateral Forces from the Right Side Leading Sideslip Throw the Motorcycle into a Rightward Lean and the Rider is Launched Ahead of the Motorcycle
The motorcycle lands on its right side (Figure 24), and then the rider lands in a seated posture facing rearward, opposite his initial direction of travel (Figure 25). The rider was launched in the air a distance of approximately 54 feet. The motorcycle stays on its right side throughout its entire slide on the ground and does not tumble. It decelerates at an average rate of approximately 0.4g and then comes to rest on its right side facing opposite its initial direction of travel. As the rider travels to rest, his torso and head rotate toward the ground and ultimately strike it. He then tumbles to rest. As a result of impacting the ground and then sliding and tumbling to rest, the rider decelerates at a rate of approximately 1.07g, a rate higher than the rate at which the motorcycle decelerates. Because of this, the motorcycle comes to rest further down the road than the rider.
Following this crash, Ken Snyder took video of the motorcycle after it had been removed from the roadway and the rider’s helmet. Review of this video revealed abrasions to the following components of the motorcycle due to interaction with the roadway: the end of the right handlebar, broken front brake lever, the right side cowling, fuel tank cover, right side engine crash protector and the right side passenger seat cowling. The video footage did not show the entire motorcycle, so other components may also have been damaged. The rear tire also showed scuffing consistent with high slip angles. The rider’s helmet was also documented and showed striated abrasions to its rear.
Figure 24. Motorcycle Lands on Its Right Side
Figure 25. Rider Lands in a Seated Posture Facing Opposite His Initial Direction of Travel
Downloaded from SAE International by Neal Carter, Tuesday, February 21, 2017
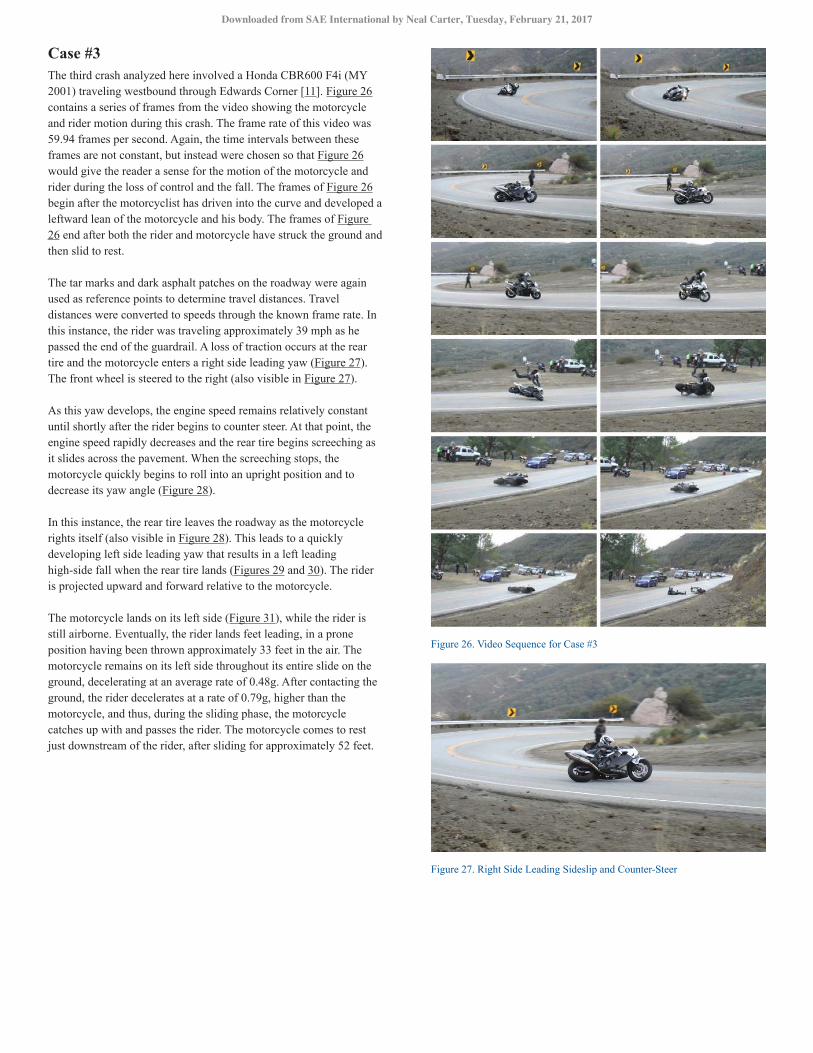
Case #3The third crash analyzed here involved a Honda CBR600 F4i (MY 2001) traveling westbound through Edwards Corner [11]. Figure 26 contains a series of frames from the video showing the motorcycle and rider motion during this crash. The frame rate of this video was 59.94 frames per second. Again, the time intervals between these frames are not constant, but instead were chosen so that Figure 26 would give the reader a sense for the motion of the motorcycle and rider during the loss of control and the fall. The frames of Figure 26 begin after the motorcyclist has driven into the curve and developed a leftward lean of the motorcycle and his body. The frames of Figure 26 end after both the rider and motorcycle have struck the ground and then slid to rest.
The tar marks and dark asphalt patches on the roadway were again used as reference points to determine travel distances. Travel distances were converted to speeds through the known frame rate. In this instance, the rider was traveling approximately 39 mph as he passed the end of the guardrail. A loss of traction occurs at the rear tire and the motorcycle enters a right side leading yaw (Figure 27). The front wheel is steered to the right (also visible in Figure 27).
As this yaw develops, the engine speed remains relatively constant until shortly after the rider begins to counter steer. At that point, the engine speed rapidly decreases and the rear tire begins screeching as it slides across the pavement. When the screeching stops, the motorcycle quickly begins to roll into an upright position and to decrease its yaw angle (Figure 28).
In this instance, the rear tire leaves the roadway as the motorcycle rights itself (also visible in Figure 28). This leads to a quickly developing left side leading yaw that results in a left leading high-side fall when the rear tire lands (Figures 29 and 30). The rider is projected upward and forward relative to the motorcycle.
The motorcycle lands on its left side (Figure 31), while the rider is still airborne. Eventually, the rider lands feet leading, in a prone position having been thrown approximately 33 feet in the air. The motorcycle remains on its left side throughout its entire slide on the ground, decelerating at an average rate of 0.48g. After contacting the ground, the rider decelerates at a rate of 0.79g, higher than the motorcycle, and thus, during the sliding phase, the motorcycle catches up with and passes the rider. The motorcycle comes to rest just downstream of the rider, after sliding for approximately 52 feet.
Figure 26. Video Sequence for Case #3
Figure 27. Right Side Leading Sideslip and Counter-Steer
Downloaded from SAE International by Neal Carter, Tuesday, February 21, 2017
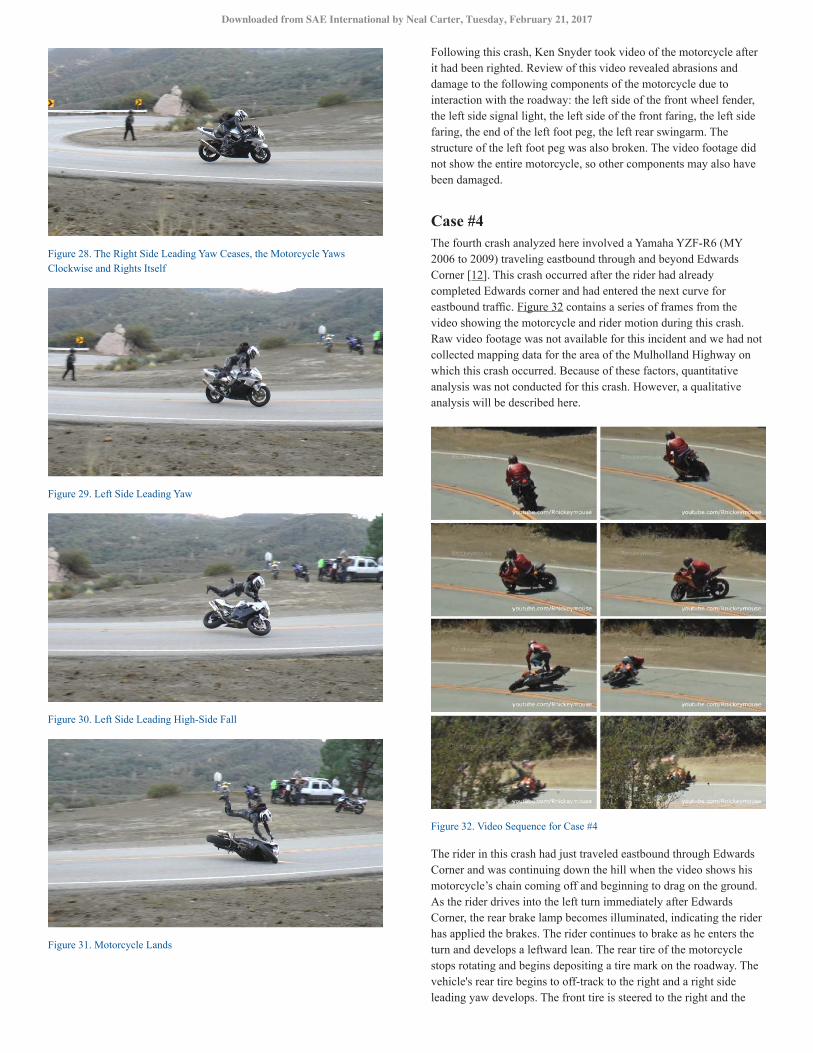
Figure 28. The Right Side Leading Yaw Ceases, the Motorcycle Yaws Clockwise and Rights Itself
Figure 29. Left Side Leading Yaw
Figure 30. Left Side Leading High-Side Fall
Figure 31. Motorcycle Lands
Following this crash, Ken Snyder took video of the motorcycle after it had been righted. Review of this video revealed abrasions and damage to the following components of the motorcycle due to interaction with the roadway: the left side of the front wheel fender, the left side signal light, the left side of the front faring, the left side faring, the end of the left foot peg, the left rear swingarm. The structure of the left foot peg was also broken. The video footage did not show the entire motorcycle, so other components may also have been damaged.
Case #4The fourth crash analyzed here involved a Yamaha YZF-R6 (MY 2006 to 2009) traveling eastbound through and beyond Edwards Corner [12]. This crash occurred after the rider had already completed Edwards corner and had entered the next curve for eastbound traffic. Figure 32 contains a series of frames from the video showing the motorcycle and rider motion during this crash. Raw video footage was not available for this incident and we had not collected mapping data for the area of the Mulholland Highway on which this crash occurred. Because of these factors, quantitative analysis was not conducted for this crash. However, a qualitative analysis will be described here.
Figure 32. Video Sequence for Case #4
The rider in this crash had just traveled eastbound through Edwards Corner and was continuing down the hill when the video shows his motorcycle’s chain coming off and beginning to drag on the ground. As the rider drives into the left turn immediately after Edwards Corner, the rear brake lamp becomes illuminated, indicating the rider has applied the brakes. The rider continues to brake as he enters the turn and develops a leftward lean. The rear tire of the motorcycle stops rotating and begins depositing a tire mark on the roadway. The vehicle's rear tire begins to off-track to the right and a right side leading yaw develops. The front tire is steered to the right and the
Downloaded from SAE International by Neal Carter, Tuesday, February 21, 2017
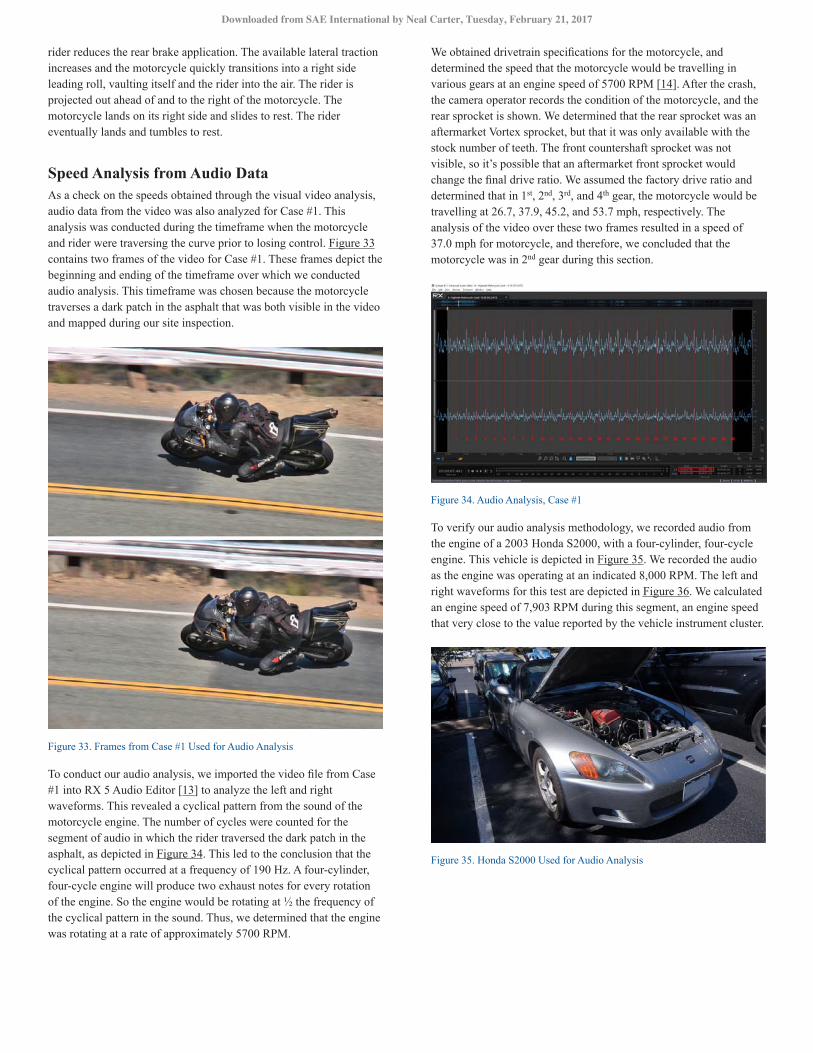
rider reduces the rear brake application. The available lateral traction increases and the motorcycle quickly transitions into a right side leading roll, vaulting itself and the rider into the air. The rider is projected out ahead of and to the right of the motorcycle. The motorcycle lands on its right side and slides to rest. The rider eventually lands and tumbles to rest.
Speed Analysis from Audio DataAs a check on the speeds obtained through the visual video analysis, audio data from the video was also analyzed for Case #1. This analysis was conducted during the timeframe when the motorcycle and rider were traversing the curve prior to losing control. Figure 33 contains two frames of the video for Case #1. These frames depict the beginning and ending of the timeframe over which we conducted audio analysis. This timeframe was chosen because the motorcycle traverses a dark patch in the asphalt that was both visible in the video and mapped during our site inspection.
Figure 33. Frames from Case #1 Used for Audio Analysis
To conduct our audio analysis, we imported the video file from Case #1 into RX 5 Audio Editor [13] to analyze the left and right waveforms. This revealed a cyclical pattern from the sound of the motorcycle engine. The number of cycles were counted for the segment of audio in which the rider traversed the dark patch in the asphalt, as depicted in Figure 34. This led to the conclusion that the cyclical pattern occurred at a frequency of 190 Hz. A four-cylinder, four-cycle engine will produce two exhaust notes for every rotation of the engine. So the engine would be rotating at ½ the frequency of the cyclical pattern in the sound. Thus, we determined that the engine was rotating at a rate of approximately 5700 RPM.
We obtained drivetrain specifications for the motorcycle, and determined the speed that the motorcycle would be travelling in various gears at an engine speed of 5700 RPM [14]. After the crash, the camera operator records the condition of the motorcycle, and the rear sprocket is shown. We determined that the rear sprocket was an aftermarket Vortex sprocket, but that it was only available with the stock number of teeth. The front countershaft sprocket was not visible, so it’s possible that an aftermarket front sprocket would change the final drive ratio. We assumed the factory drive ratio and determined that in 1st, 2nd, 3rd, and 4th gear, the motorcycle would be travelling at 26.7, 37.9, 45.2, and 53.7 mph, respectively. The analysis of the video over these two frames resulted in a speed of 37.0 mph for motorcycle, and therefore, we concluded that the motorcycle was in 2nd gear during this section.
Figure 34. Audio Analysis, Case #1
To verify our audio analysis methodology, we recorded audio from the engine of a 2003 Honda S2000, with a four-cylinder, four-cycle engine. This vehicle is depicted in Figure 35. We recorded the audio as the engine was operating at an indicated 8,000 RPM. The left and right waveforms for this test are depicted in Figure 36. We calculated an engine speed of 7,903 RPM during this segment, an engine speed that very close to the value reported by the vehicle instrument cluster.
Figure 35. Honda S2000 Used for Audio Analysis
Downloaded from SAE International by Neal Carter, Tuesday, February 21, 2017
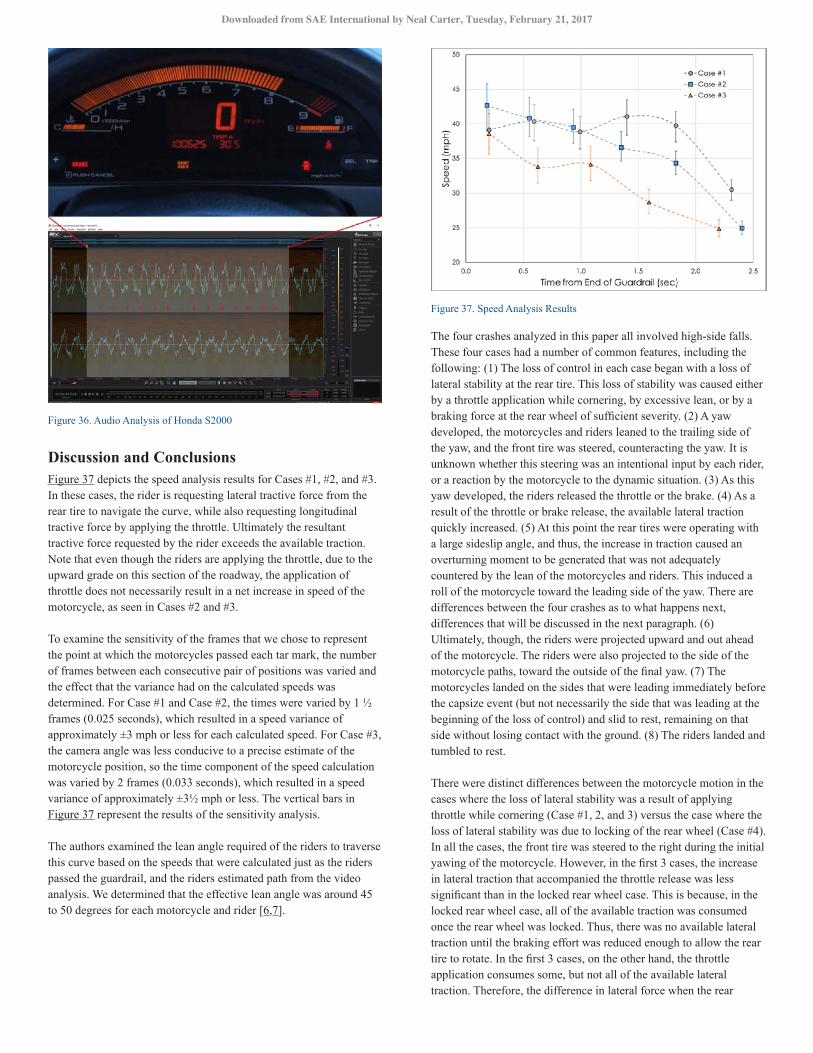
Figure 36. Audio Analysis of Honda S2000
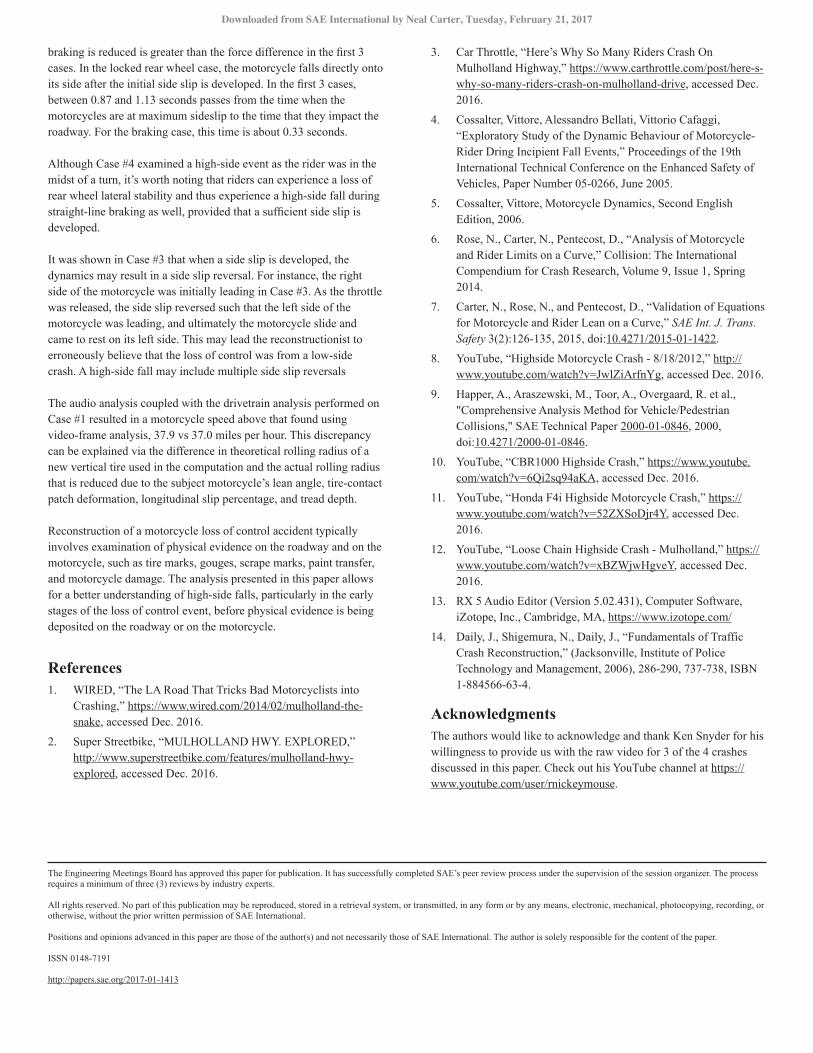
Discussion and ConclusionsFigure 37 depicts the speed analysis results for Cases #1, #2, and #3. In these cases, the rider is requesting lateral tractive force from the rear tire to navigate the curve, while also requesting longitudinal tractive force by applying the throttle. Ultimately the resultant tractive force requested by the rider exceeds the available traction. Note that even though the riders are applying the throttle, due to the upward grade on this section of the roadway, the application of throttle does not necessarily result in a net increase in speed of the motorcycle, as seen in Cases #2 and #3.
To examine the sensitivity of the frames that we chose to represent the point at which the motorcycles passed each tar mark, the number of frames between each consecutive pair of positions was varied and the effect that the variance had on the calculated speeds was determined. For Case #1 and Case #2, the times were varied by 1 ½ frames (0.025 seconds), which resulted in a speed variance of approximately ±3 mph or less for each calculated speed. For Case #3, the camera angle was less conducive to a precise estimate of the motorcycle position, so the time component of the speed calculation was varied by 2 frames (0.033 seconds), which resulted in a speed variance of approximately ±3½ mph or less. The vertical bars in Figure 37 represent the results of the sensitivity analysis.
The authors examined the lean angle required of the riders to traverse this curve based on the speeds that were calculated just as the riders passed the guardrail, and the riders estimated path from the video analysis. We determined that the effective lean angle was around 45 to 50 degrees for each motorcycle and rider [6,7].
Figure 37. Speed Analysis Results
The four crashes analyzed in this paper all involved high-side falls. These four cases had a number of common features, including the following: (1) The loss of control in each case began with a loss of lateral stability at the rear tire. This loss of stability was caused either by a throttle application while cornering, by excessive lean, or by a braking force at the rear wheel of sufficient severity. (2) A yaw developed, the motorcycles and riders leaned to the trailing side of the yaw, and the front tire was steered, counteracting the yaw. It is unknown whether this steering was an intentional input by each rider, or a reaction by the motorcycle to the dynamic situation. (3) As this yaw developed, the riders released the throttle or the brake. (4) As a result of the throttle or brake release, the available lateral traction quickly increased. (5) At this point the rear tires were operating with a large sideslip angle, and thus, the increase in traction caused an overturning moment to be generated that was not adequately countered by the lean of the motorcycles and riders. This induced a roll of the motorcycle toward the leading side of the yaw. There are differences between the four crashes as to what happens next, differences that will be discussed in the next paragraph. (6) Ultimately, though, the riders were projected upward and out ahead of the motorcycle. The riders were also projected to the side of the motorcycle paths, toward the outside of the final yaw. (7) The motorcycles landed on the sides that were leading immediately before the capsize event (but not necessarily the side that was leading at the beginning of the loss of control) and slid to rest, remaining on that side without losing contact with the ground. (8) The riders landed and tumbled to rest.
There were distinct differences between the motorcycle motion in the cases where the loss of lateral stability was a result of applying throttle while cornering (Case #1, 2, and 3) versus the case where the loss of lateral stability was due to locking of the rear wheel (Case #4). In all the cases, the front tire was steered to the right during the initial yawing of the motorcycle. However, in the first 3 cases, the increase in lateral traction that accompanied the throttle release was less significant than in the locked rear wheel case. This is because, in the locked rear wheel case, all of the available traction was consumed once the rear wheel was locked. Thus, there was no available lateral traction until the braking effort was reduced enough to allow the rear tire to rotate. In the first 3 cases, on the other hand, the throttle application consumes some, but not all of the available lateral traction. Therefore, the difference in lateral force when the rear
Downloaded from SAE International by Neal Carter, Tuesday, February 21, 2017
braking is reduced is greater than the force difference in the first 3 cases. In the locked rear wheel case, the motorcycle falls directly onto its side after the initial side slip is developed. In the first 3 cases, between 0.87 and 1.13 seconds passes from the time when the motorcycles are at maximum sideslip to the time that they impact the roadway. For the braking case, this time is about 0.33 seconds.
Although Case #4 examined a high-side event as the rider was in the midst of a turn, it’s worth noting that riders can experience a loss of rear wheel lateral stability and thus experience a high-side fall during straight-line braking as well, provided that a sufficient side slip is developed.
It was shown in Case #3 that when a side slip is developed, the dynamics may result in a side slip reversal. For instance, the right side of the motorcycle was initially leading in Case #3. As the throttle was released, the side slip reversed such that the left side of the motorcycle was leading, and ultimately the motorcycle slide and came to rest on its left side. This may lead the reconstructionist to erroneously believe that the loss of control was from a low-side crash. A high-side fall may include multiple side slip reversals
The audio analysis coupled with the drivetrain analysis performed on Case #1 resulted in a motorcycle speed above that found using video-frame analysis, 37.9 vs 37.0 miles per hour. This discrepancy can be explained via the difference in theoretical rolling radius of a new vertical tire used in the computation and the actual rolling radius that is reduced due to the subject motorcycle’s lean angle, tire-contact patch deformation, longitudinal slip percentage, and tread depth.
Reconstruction of a motorcycle loss of control accident typically involves examination of physical evidence on the roadway and on the motorcycle, such as tire marks, gouges, scrape marks, paint transfer, and motorcycle damage. The analysis presented in this paper allows for a better understanding of high-side falls, particularly in the early stages of the loss of control event, before physical evidence is being deposited on the roadway or on the motorcycle.
References1. WIRED, “The LA Road That Tricks Bad Motorcyclists into
Crashing,” https://www.wired.com/2014/02/mulholland-the-snake, accessed Dec. 2016.
2. Super Streetbike, “MULHOLLAND HWY. EXPLORED,” http://www.superstreetbike.com/features/mulholland-hwy-explored, accessed Dec. 2016.
3. Car Throttle, “Here’s Why So Many Riders Crash On Mulholland Highway,” https://www.carthrottle.com/post/here-s-why-so-many-riders-crash-on-mulholland-drive, accessed Dec. 2016.
4. Cossalter, Vittore, Alessandro Bellati, Vittorio Cafaggi, “Exploratory Study of the Dynamic Behaviour of Motorcycle-Rider Dring Incipient Fall Events,” Proceedings of the 19th International Technical Conference on the Enhanced Safety of Vehicles, Paper Number 05-0266, June 2005.
5. Cossalter, Vittore, Motorcycle Dynamics, Second English Edition, 2006.
6. Rose, N., Carter, N., Pentecost, D., “Analysis of Motorcycle and Rider Limits on a Curve,” Collision: The International Compendium for Crash Research, Volume 9, Issue 1, Spring 2014.
7. Carter, N., Rose, N., and Pentecost, D., “Validation of Equations for Motorcycle and Rider Lean on a Curve,” SAE Int. J. Trans. Safety 3(2):126-135, 2015, doi:10.4271/2015-01-1422.
8. YouTube, “Highside Motorcycle Crash - 8/18/2012,” http://www.youtube.com/watch?v=JwlZiArfnYg, accessed Dec. 2016.
9. Happer, A., Araszewski, M., Toor, A., Overgaard, R. et al., "Comprehensive Analysis Method for Vehicle/Pedestrian Collisions," SAE Technical Paper 2000-01-0846, 2000, doi:10.4271/2000-01-0846.
10. YouTube, “CBR1000 Highside Crash,” https://www.youtube.com/watch?v=6Qi2sq94aKA, accessed Dec. 2016.
11. YouTube, “Honda F4i Highside Motorcycle Crash,” https://www.youtube.com/watch?v=52ZXSoDjr4Y, accessed Dec. 2016.
12. YouTube, “Loose Chain Highside Crash - Mulholland,” https://www.youtube.com/watch?v=xBZWjwHgveY, accessed Dec. 2016.
13. RX 5 Audio Editor (Version 5.02.431), Computer Software, iZotope, Inc., Cambridge, MA, https://www.izotope.com/
14. Daily, J., Shigemura, N., Daily, J., “Fundamentals of Traffic Crash Reconstruction,” (Jacksonville, Institute of Police Technology and Management, 2006), 286-290, 737-738, ISBN 1-884566-63-4.
AcknowledgmentsThe authors would like to acknowledge and thank Ken Snyder for his willingness to provide us with the raw video for 3 of the 4 crashes discussed in this paper. Check out his YouTube channel at https://www.youtube.com/user/rnickeymouse.
The Engineering Meetings Board has approved this paper for publication. It has successfully completed SAE’s peer review process under the supervision of the session organizer. The process requires a minimum of three (3) reviews by industry experts.
All rights reserved. No part of this publication may be reproduced, stored in a retrieval system, or transmitted, in any form or by any means, electronic, mechanical, photocopying, recording, or otherwise, without the prior written permission of SAE International.
Positions and opinions advanced in this paper are those of the author(s) and not necessarily those of SAE International. The author is solely responsible for the content of the paper.
ISSN 0148-7191
http://papers.sae.org/2017-01-1413
Downloaded from SAE International by Neal Carter, Tuesday, February 21, 2017