victorian startup ecosystem mapping - launchvic.org · ecosystem apping victoria 5 why did we...
TRANSCRIPT

Victorian Startup Ecosystem Mapping Report

2Ecosystem Mapping Victoria
ContentsForeword 3
Executive Summary 4
State of Victoria’s ecosystem 7
Profile of firms in Victoria 15
Capital 25
People 29
External environment and support 37
Geography 42
Acknowledgments 44

3Ecosystem Mapping Victoria
LaunchVic ForewordLaunchVic is delighted to present the 2018 Victorian Ecosystem Mapping Report, delivered in partnership with dandolopartners, as part of our ongoing commitment to support Victoria’s thriving startup ecosystem.
Now in its second year, 2018’s report draws on data collected from over 2,700 Victorian startups and scaleups and provides the strongest view of the opportunities and challenges facing the state’s startup sector.
The significant momentum demonstrated by Victoria’s startup ecosystem shows that our thriving entrepreneurial economy is continuing to mature in extraordinary ways.
Furthermore, one in five startups are focused on health and wellbeing, strengthening Melbourne’s reputation as a leading HealthTech startup hub in the Asia Pacific region. The investment landscape is also improving, although there is still work to be done to ensure that access to capital does not limit the growth of both early stage startups and the wider ecosystem.
Diversity and inclusion metrics also demonstrate progress, with one in three founders being female – a 3% improvement from 2017. Two percent of founders identify as Aboriginal and Torres Strait Islanders – a welcome overrepresentation when you consider that only 1% of Victorians identify as indigenous. However, there is more opportunity to drive diversity within startup teams and increase inclusion across underrepresented groups – including people living in outer metropolitan and regional areas, the LGBQTIA+ community and people living with a disability.
We hope these findings will help continue to shape the next year of startup growth in the state. The 2018 Victorian Ecosystem Mapping Report is a great resource for policy makers and startup community leaders who play an important role in championing the strengths of the Victorian startup community, both locally and internationally. The data represented here will also be useful to stakeholders wanting to better understand the entrepreneurial landscape in Victoria.
Thank you to our partners who actively promoted the survey, and to the many hundreds of startups that took an interest in this work. They are, after all, the ones driving our thriving startup economy, cementing its position as a leading destination for startup success and contributing to Victoria’s current and future prosperity.
Dr Kate Cornick CEO LaunchVic

4Ecosystem Mapping Victoria
Executive Summary

5Ecosystem Mapping Victoria
WHY DID WE DEVELOP THIS REPORT?This report provides a comprehensive and up-to-date view of Victoria’s startup ecosystem. Building on the very first Mapping Victoria’s Startup Ecosystem report released in 2017, this report examines Victoria’s startup ecosystem in more detail than any previous research. It explores the drivers of Victoria’s startup ecosystem growth and measures the strengths of different elements of the ecosystem.
In developing this report, we have drawn on data collected on over 2,770 Victorian startups and scaleups – including 1,615 firms that kindly completed our survey over the last two years. The data we collected through this work provides a valuable resource for advocates of the Victorian startup community and founders looking for the right support to grow their business. It is also a critical tool for policy makers who play an important role in championing the strengths of Victoria’s startup community both locally and internationally.
WHAT DID WE FIND?Startups and high growth firms develop in ecosystems – which include, but are not limited to, networks of people, organisations, institutions, expertise and capital – that interact to create and grow new businesses. For the purposes of this report, we have focused on four areas of a thriving startup ecosystem – firms, capital, people and the external environment – and their impact on Victoria’s startup ecosystem.

6Ecosystem Mapping Victoria
KEY INSIGHTS
Victoria’s startup ecosystem is generating significant momentum but has a lower density of startups and scaleups compared to other cities: Over 2,770 active startups and scaleups across different stages of development Startup and scaleup density is lower in Melbourne compared to other cities Six unicorns with a combined market capitalisation of over $32b and a track record of big exits,
with three acquisitions valued at over $100m each in the last year alone
Victoria has a sophisticated and diverse sectoral mix, with Health having the largest representation at 13%.
The majority of Victoria’s startups and scaleups are using innovation to penetrate large, global markets: 62% of firms are pursuing market strategies focused on value adding products and services rather than
trying to compete on price 57% of firms are exporting their products and services with Data & Analytics, Enterprise & Corporate
Services and Sports & Recreation having the highest share of exporting firms 58% of firms are incorporating disruptive technologies into their products with Mobile Internet, Big Data
Analytics and Automation being the most common technologies being adopted As firms grow, they become increasingly challenged with finding customers, undertaking marketing & branding and recruiting quality talent
A strong supply of venture capital is fueling scaleups, however the investor landscape for startups needs to be grown to secure commensurate growth: In the past 5 years, $1.73b has been invested in Victorian startups and scaleups across 766 deals and
504 unique companies The dollar amount invested by Early Stage VC and Later Stage VC has been growing, driven by a
succession of large capital raises
Angel investments take longer to raise than other capital types, at an average of 5.7 monthsThere has been strong growth in the number of Accelerator / Incubator deals but the number Seed / Angel deals has dipped after peaking in 2014
Victoria has experienced founders with a background in industries related to their startup: Victoria is demonstrating signs of serial entrepreneurship, with nearly 1 in 5 founders having worked at
a startup with > $20m valuation 28% of founders are female, up from 25% in 2017 with Design, Consumer Goods, Education and Media
& Entertainment having achieved relatively equal gender representation for founders Few sectors have achieved relatively equal gender representation for founders with key sectors
including fintech, sportstech and energy tech having some of the worst performance In most sectors, less than 50% of firms have a known diversity and inclusion policy.
The amount of support available to Victorian startups and scaleups is increasing: Victoria now has 29 accelerator programs, with nearly 60% of programs focusing on a specific vertical
or sector Melbourne is now the coworking space capital of Australia, accounting for nearly half the total volume
of coworking sites across Australia
The popularity of meetup groups is growing, with Victoria’s largest meetup groups having grown their membership by 22% over the past 12 months

7Ecosystem Mapping Victoria
State of Victoria’s ecosystemVictoria’s startup ecosystem is generating significant momentum by building on a track record of proven successes.

8Ecosystem Mapping Victoria
0ExitedLater stageGrowth stageEarly stageSeed stage
No.
of fi
rms
187
674
1327
42
540
2,771 startups and scaleups
Includes active firms that have gone public
or been acquired
$100 – $1b101+
$10 – $100m31 – 100
$1 – $10m6 – 30
$0 – $1m1 – 5
RevenueFTE:
Each firm has been assigned a stage of development based on their current revenue and staff size (whichever is greatest):
PIPELINE OF FIRMSVictoria’s startup ecosystem is demonstrating significant momentum. Since 2010, the number of firms operating in Victoria has been growing at a rate of 23 percent per annum, outpacing the average among comparably sized ecosystems.1
Our mapping of the startup ecosystem has uncovered 2,770 startups and scale-ups operating in Victoria, and we expect that the total number of active firms is even higher than this. Based on the rate Victoria’s ecosystem is growing, we estimate there could be as many as 2,900 to 3,200 firms.2
As a sign of ecosystem maturity, Victoria’s firms are distributed across a range of stages of development. Victoria has a significant number of early stage startups with future growth potential, as well as a large body of pre- and post-exit scale-ups that are tackling large international markets.
Victoria has over 2,770 active startups and scale-ups across different stages of development
1 Startup Genome. ‘Melbourne Startup Ecosystem Report: Leading Australia into a New Economic Future’. 2018. 2 We have less information on firms established in 2018. Assuming that the number of firms established in 2018 is consistent with previous years, the
total number of firms currently operating in Victoria is likely to be 5-15% higher than the 2,771 firms we identified (i.e. a total of 2,900 – 3,200 currently operating firms).

9Ecosystem Mapping Victoria
3 Public company valuations are based on reported ASX market capitalisation as at 5 September 2018. Aconex valuation is based on the value of its acquisition by Oracle. Envato valuation is based on a 2016 smartcompany.com.au estimate.
TRACK RECORD OF UNICORNS AND EXITS
UnicornsVictoria has a track record of transforming firms into billion-dollar companies. There are now six unicorns in Victoria, each valued at more than $1 billion.
Victoria’s unicorns have a combined market capitalisation of over $32b³
Unicorn Valuation
REA Group $11.89b
Seek $7.91b
Carsales.com $3.78b
MYOB $1.74b
Aconex $1.6b
Envato $1b+*
* Envato's current valuation is unknown, although previous analysis that it could be valued at $6b (smartcompany.com.au, 2016)

10Ecosystem Mapping Victoria
$20m – $50m+
2015Founded
IPOExit Type
HealthSector
2006Founded
M&AExit Type
AgricultureSector
2000Founded
M&AExit Type
EducationSector
Developer of radiopharmaceutical diagnostic and therapeutic products.
Developer and distributer of dairy and dairy free products.
Provider of adaptive training and compliance learning contents.
$50mExit size
November 2017Exit date
$38mExit size
November 2017Exit date
$26mExit size
December 2017Exit date
ASX: Exchange Bubs Australia: Acquirer CallidusCloud: Acquirer
$100m+
2000Founded
M&AExit Type
EnterpriseSector
2014Founded
M&AExit Type
MediaSector
2006Founded
M&AExit Type
EnergySector
Online collaboration software for the construction, engineering and facilities
management industries.
Provider of wagering services intended to be a trusted, socially-responsible
wagering operator.Online retailer of electricity.
$1.6bExit size
March 2018Exit date
$198mExit size
February 2018Exit date
$120mExit size
May 2017Exit date
Oracle: Acquirer Stars Group: Acquirer Amaysim Australia: Acquirer
EXITS
Victoria also has a track record of generating big exits. In the last year alone, our mapping has uncovered three acquisitions valued at over $100m each – including the $1.6b sale of Aconex to Oracle. These acquisitions build on a growing number of recent $100m+ exits including Kogan, RedBubble TouchCorp and Spinifex Pharma.
Victoria has had a range of high-profile exits in the last year

11Ecosystem Mapping Victoria
SECTORAL MIX
Firms by sectorVictoria has a sophisticated and diverse sectoral mix with strong specialisations in Health, Media & Entertain-ment, Enterprise and Commerce.
Victoria’s largest sectors are Health, Media & Entertainment, Enterprise and Commerce
0%
13% 11% 10% 10% 8% 7% 7% 6% 5% 4% 4% 1% 4% 3% 5%3%
20% 40% 60% 80% 100%
HealthMedia &
Entertainment Enterprise Commerce Education
Consumer Goods and
Manufacturing
Energy
Financial Services
Social Enterprise
Data & Analytics
Transport, Logistics
and Travel
Transport, Logistics
and Travel
Sports & Recreation
Food & Fibre and
Consumption
Professional Services
Design
4 We were unable to identify social enterprise firms established in 2010. However, the CAGR between 2011 and 2018 for Social Enterprise was 51%.
12Ecosystem Mapping Victoria
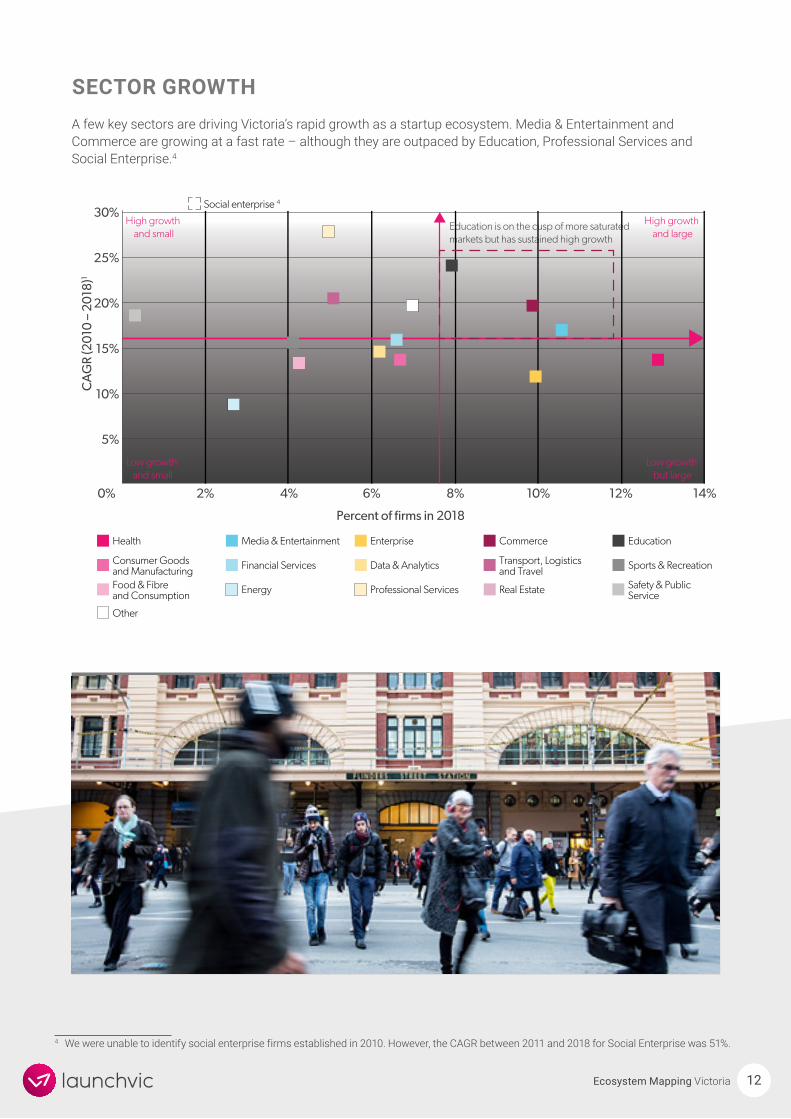
SECTOR GROWTHA few key sectors are driving Victoria’s rapid growth as a startup ecosystem. Media & Entertainment and Commerce are growing at a fast rate – although they are outpaced by Education, Professional Services and Social Enterprise.4
Education is on the cusp of more saturated markets but has sustained high growth
Social enterprise 4
0% 2% 4% 6% 8% 10% 12% 14%
5%
10%
15%
20%
25%
30%
Percent of firms in 2018
Low growth and small
High growth and small
High growth and large
Low growth but large
CA
GR
(201
0 –
2018
)1
Health
Other
Media & Entertainment Enterprise Commerce Education
Consumer Goods and Manufacturing Financial Services Data & Analytics Transport, Logistics
and Travel Sports & Recreation
Food & Fibre and Consumption Energy Professional Services Real Estate Safety & Public
Service

13Ecosystem Mapping Victoria
5 This figure was 3% in the 2017 Victorian Startup Ecosystem Mapping.
0%
10%
20%
30%
40%
31+11 – 306 –102 – 50 – 1
21.1%
40.5%
18.2%
10.7% 9.5%
Perc
enta
ge o
f firm
s
Number of FTEs
EMPLOYMENTOur mapping of the startup ecosystem has uncovered more large firms than previously identified. We now know that 10% of firms employ 31 or more full-time equivalent employees (FTEs).5 However, the largest share of firms continues to be those with 2 – 5 FTEs.
10% of firms have 31 or more FTEs
The firms we have analysed as part of this mapping are employing a total of around 26,200 FTEs. Given that we have not been able to gather employment data from every firm in Victoria, we expect that the total number of people employed by startups and scale-ups in Victoria is substantially higher than this.
REVENUEThe largest share of firms have annual revenues under $100k. A small share of firms (1.4%) have annual revenues of over $10 million.
Most firms have annual revenues under $100k
0%
10%
20%
30%
40%
$10m - $100m $100m+$1m - $10m$100k - $1m$1 - $100k$0
21.5%
37.9%
27.3%
11.9%
1.2% 0.2%
Perc
enta
ge o
f firm
s
Annual revenue

14Ecosystem Mapping Victoria
6 See the Life-cycle Model Explanation section in the 2017 Global Startup Ecosystem Report
To achieve further success, Victoria needs to continue to grow its startup and scale-up density
STARTUP AND SCALE-UP DENSITY
While Victoria is demonstrating significant momentum, it still has room to improve. From a global perspective, Victoria performs poorly in terms of startup and scale-up density. Victoria’s major city, Melbourne, has a lower density of startups and scale-ups compared to a number of similarly sized cities around the world.
Continuing to grow new firms is critical to improving Melbourne – and Victoria’s – ecosystem. Ecosystem per-formance is a function of ecosystem size. An ecosystem’s ability to create high-growth firms and exits rises as its overall size increases. Larger startup ecosystems produce more fast-growing startups and a higher rate of exits – and as a consequence, more jobs and economic growth.6
To catch up with its closest comparators, Victoria needs to increase its density of startups and scale-ups by nearly 50%. Achieving this level of growth would likely place Victoria in the top twenty ecosystems globally and position it as a leading centre of startup activity in the Asia Pacific.
Melbourne has a lower density of startup and scale-ups compared to other cities
SydneyPopulation: 5.1 million
Startups: 743 per million people
MelbournePopulation: 4.9 million
Startups: 508 per million people
SingaporePopulation: 5.6 million
Startups: 992 per million people
StockholmPopulation: 2.2 million
Startups: 1,234 per million people
AmsterdamPopulation: 2.4 million
Startups: 1,201 per million people
Tel AvivPopulation: 3.9 million
Startups: 669 per million people
BerlinPopulation:
6 millionStartups: 724 per
million peopleBoston
Population: 4.6 million
Startups: 1,068 per million people
SeattlePopulation: 3.7 million
Startups: 1,435 per million people
TorontoPopulation: 5.9 million
Startups: 1,288 per million people

15Ecosystem Mapping Victoria
Profile of firms in VictoriaThe majority of Victoria’s startups and scale-ups are using innovation to tackle large, global markets.
16Ecosystem Mapping Victoria
MARKET STRATEGIES
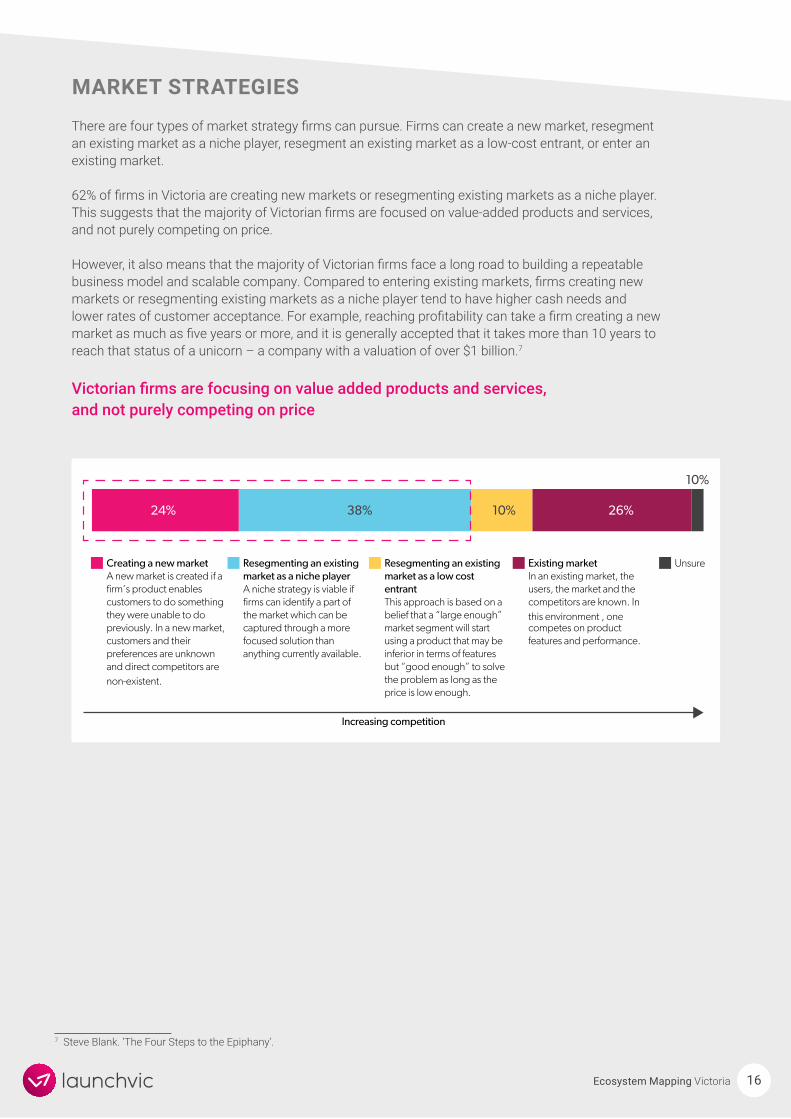
There are four types of market strategy firms can pursue. Firms can create a new market, resegment an existing market as a niche player, resegment an existing market as a low-cost entrant, or enter an existing market.
62% of firms in Victoria are creating new markets or resegmenting existing markets as a niche player. This suggests that the majority of Victorian firms are focused on value-added products and services, and not purely competing on price.
However, it also means that the majority of Victorian firms face a long road to building a repeatable business model and scalable company. Compared to entering existing markets, firms creating new markets or resegmenting existing markets as a niche player tend to have higher cash needs and lower rates of customer acceptance. For example, reaching profitability can take a firm creating a new market as much as five years or more, and it is generally accepted that it takes more than 10 years to reach that status of a unicorn – a company with a valuation of over $1 billion.7
Victorian firms are focusing on value added products and services, and not purely competing on price
7 Steve Blank. ‘The Four Steps to the Epiphany’.
Increasing competition
24% 26%38%
10%
10%
Creating a new marketA new market is created if a firm’s product enables customers to do something they were unable to do previously. In a new market, customers and their preferences are unknown and direct competitors are non-existent.
Resegmenting an existing market as a niche playerA niche strategy is viable if firms can identify a part of the market which can be captured through a more focused solution than anything currently available.
Resegmenting an existing market as a low cost entrantThis approach is based on a belief that a “large enough” market segment will start using a product that may be inferior in terms of features but “good enough” to solve the problem as long as the price is low enough.
Existing marketIn an existing market, the users, the market and the competitors are known. In this environment , one competes on product features and performance.
Unsure

17Ecosystem Mapping Victoria
EXPORTINGBuilding export markets – and building export-ready firms to take advantage of those export opportu-nities – lies at the heart of Victoria’s future prosperity. Research shows that typically our export compa-nies are our most dynamic and productive businesses.
The majority of Victorian firms are already thinking global, with 57% of firms exporting outside Aus-tralia. This is critical to Victoria’s success as a startup ecosystem. A domestic market of 24.1 million people means that firms in Victoria – and Australia – depend on access to global markets to grow and scale.
Exporting by sectorVictoria’s share of exporting firms varies by sector. Data & Analytics, Enterprise & Corporate Services and Sports & Recreation have the highest share of exporting firms. Energy, Social Enterprise and Food & Fibre have a comparatively lower share of exporting firms.
Data & Analytics, Enterprise & Corporate Services and Sports & Recreation have the largest share of exporting firms8
8 We have excluded firms categorised as ‘other’, consisting of professional services, design and real estate.
Data & Analytics Sports & Recreation Commerce
Transport, logistics and travel
Enterprise & corporate services
Consumer goods and manufacturing
Media & Entertainment Financial services Education Health
Safety & Public service Energy Social enterprise Food and fibre
69.2%64.8%
69.1%
62.5% 61.6% 61.7%57.1% 54.5% 54.1% 51.9%
45.5%41.7% 40%
33.3%
0
10%
20%
30%
40%
50%
60%
70%
80%
Perc
enta
ge o
f firm
s ex
por
ting
out
sid
e A
ustr
alia

18Ecosystem Mapping Victoria
EXPORT MARKETS TARGETED BY VICTORIAN FIRMSThe largest overseas markets targeted by exporting firms are the US and UK, followed by New Zealand, China and India. Firms targeting the US, UK and China are more likely to pursue a new market strategy compared to firms targeting New Zealand and India.
The largest overseas markets targeted by exporting firms are the US and UK, followed by New Zealand and China
Lower priority markets Higher priority markets
India#5
40%
10%
50%
UK#2
24% 28%
34%14%
US#1
27% 24%
39%10%
NZ#3
18% 18%
49%
15%
China#4
31%
15% 31%
23%
Creating a new market
Resegmenting an existing market as a niche player
Resegmenting an existing market as a low cost entrant
Entering an existing market

19Ecosystem Mapping Victoria
DISRUPTIVE TECHNOLOGIES58% of Victorian firms are incorporating disruptive technologies into their products and services. The largest share of technologies firms have already reached mainstream adoption, for example, Big Data and Automation of Knowledge Work.
A smaller share of firms are focusing on technologies that are in an early adoption phase, such as Augmented / Virtual Reality, Blockchain and Robotics. It is important to monitor how firms’ uptake of these technologies grows over time.
As these technologies move closer to mainstream adoption, they are likely become increasingly important to Victoria’s ability to compete in a technologically disruptive global landscape.
KeyMobile Internet
Automation of knowledge work
Internet of Things
Robotics
Autos and near-autonomous vehicles
Genomics
Energy storage
3D printing
Advanced materials
Renewable energy
Artificial intelligence
Big data analytics
Augmented / virtual reality
Blockchain
�
�
�
��
�
�
�
�
��
Years until technology reaches mainstream
Perc
enta
ge o
f firm
s
0% -
15%
0 5 – 8 9 – 12
15%
- 30
%31
% -
45%
�
�
�
�
� ��
�
�
��
NB. No disruptive technology is anticipated to reach maturity in 1– 4 years

20Ecosystem Mapping Victoria
One of the priorities for Victoria now is to support its innovative and global-focused firms to be high-growth
HIGH-GROWTH FIRMS
Victoria has a number of up-and-coming firms that have the potential to drive the next wave of big exits. Victoria’s fastest growing firms are expanding rapidly, with some having grown their employees by up to 50% in the past six months.

21Ecosystem Mapping Victoria
2009Founded
Series BStage
MediaSector
2013Founded
Series AStage
FintechSector
2010Founded
Series AStage
MeditechSector
Provider of an online video platform designed to connect brands with
content production teams.
Provider of working capital to small and medium sized businesses.
Developer of suprachoroidal positioned retinal devices to restore vision.
2013Founded
Series AStage
EducationSector
2013Founded
AngelStage
CommerceSector
Provider of an online workforce training platform designed to make sales
associates experts.Provider of an online shopping platform.
Early Stage
2010Founded
Series DStage
EnterpriseSector
2015Founded
Series BStage
FintechSector
2010Founded
Series AStage
CommerceSector
People analytics platform offering data-driven insights on employee
engagement and company culture.
Provider of cross-border payments and foreign exchange platform.
Provider of e-commerce services for hospitality businesses.
(Xplor)
2016Founded
Series BStage
EducationSector
2009Founded
Series AStage
EnterpriseSector
2013Founded
Series AStage
FintechSector
Provider of childcare management app to help parents interact with their
children in real-time.
Software enabling enterprise clients to coordinate the rosters for hundreds
of employees.
Developer of an online payments gateway to accept, manage and
distribute online payments.
Growth Stage
Victoria is home to a number of fast-growing startups and scale-ups, and our mapping has identified the following:

22Ecosystem Mapping Victoria
CHARACTERISTICS OF HIGH-GROWTH FIRMSThe firms that are growing the fastest are distinct from most other firms. They tend to be led by older and more experience founders, know more about their market and are more likely to be using disruptive technologies.
High growth firms (compared with all firms):
Are older on average: High growth firms are 4.5 years old on average (3.8 years for all firms).
Are more likely to have diversity and inclusion policies: 52% of high growth firms have diversity and inclusion policies (41% for all firms).
Know the Australian market: No high growth firms report being unsure about how many direct competitors they had in Australia (compared with 7% of all firms).
Have a higher proportion of firms in education: 15% of high growth firms are in the education sector (only 8% of all firms operate within this sector).
Have a higher proportion of firms using disruptive technologies: 72% of high growth firms offer products or services with at least one disruptive technology (compared with 60% of all firms).
Founders of high growth firms (compared with all founders):
Are 4 years older on average: Average age for founders of high growth firms is 41 (37 for all founders).
Have founded more startups previously: High growth founders have on average founded 2 startups previously (average of 1.1 previous startups for all founders).
Are more likely to have a lot of sector experience: 80% of high growth founders have more than 6 years sector or industry experience (60% for all founders).
�
�
�
�
Victoria’s high-growth firms differ from other firms

23Ecosystem Mapping Victoria
CHALLENGES TO ACHIEVING HIGHER GROWTHFirms have identified a range of challenges they face in achieving higher growth. Earlier stage firms identify raising capital as their largest challenge. As firms grow, they become increasingly challenged with finding customers, undertaking marketing / branding and recruiting quality talent.
Firms at the product development stage also identify raising capital as their largest challenge
19.4%
Raising capital
Product development / R&D
Finding customers
Finding quality talent
Business model viability
Compensating employees
Managing cash flow
Scaling up to meet demand
Marketing / branding
A suitable working environment / facility
0 10%
Challenges To Achieving Higher Growth – Idea Stage
20% 30% 40% 50% 60%
Challenges 50% or more firms face
A suitable working environment / facility 17.9%
Marketing / branding 19.4%
Scaling up to meet demand 19.4%
Managing cash flow 19.4%
Compensating employees 20.9%
Business model viability 28.4%
Finding quality talent 32.8%
Finding customers 32.8%
Product development / R&D 50.7%
Raising capital 55.2%
55.2%
50.7%
32.8%
28.4%
20.9%
19.4%
17.9%
32.8%
19.4%
Raising capital
Marketing / branding
Finding quality talent
Finding customers
Product development / R&D
Product / market fit
Compensating employees
Engaging with corporates
Business model viability
Scaling up to meet demand
0 10%
Challenges To Achieving Higher Growth – Product Stage
20% 30% 40% 50% 60%
Challenges 50% or more firms faceCHALLENGES TO ACHIEVING HIGHER
GROWTH - PRODUCT STAGE
Scaling up to meet demand 18.2%
Business model viability 19.9%
Engaging with corporates 20.4%
Compensating employees 22.1%
Product / market fit 28.2%
Product development / R&D 34.8%
Finding customers 38.1%
Finding quality talent 40.9%
Marketing / branding 45.3%
Raising capital 52.5%
52.5%
45.3%
40.9%
38.1%
34.8%
28.2%
22.1%
20.4%
19.9%
18.2%
Firms at the idea stage identify raising capital and developing their product as their largest challenges

24Ecosystem Mapping Victoria
Firms at the sales and expansion stage face a more varied set of challenges – most commonly finding customers, undertaking marketing / branding and finding quality talent
Finding customers
Marketing / branding
Finding quality talent
Scaling up to meet demand
Raising capital
Managing cash flow
Product development / R&D
Compensating employees
Strategy / planning
Engaging with corporates
0 10%
Challenges To Achieving Higher Growth - Sales and Expansion Stage
20% 30% 40% 50% 60%
42.4%
38.2%
37.7%
34.1%
33.5%
26.9%
22.2%
20.8%
18.0%
16.6%

25Ecosystem Mapping Victoria
CapitalA strong supply of venture capital is fueling scaleups, however the investor landscape for startups needs to be grown to secure commensurate growth.

26Ecosystem Mapping Victoria
INVESTMENT ACTIVITYIn the past 5 years, $1.73 billion has been invested in Victorian startups and scale-ups across 766 deals in 504 unique companies. The dollar amount invested by Early Stage VC and Later Stage VC has been growing. This has been driven by a succession of large capital raises including Judo Capital, Airwallex and Culture Amp.
Seed stage investment shows less growth. The number of Seed deals has dipped after peaking in 2014.
Venture Capital is growing strong while Angel investors retreat
INVESTMENT ACTIVITY
In the past 5 years, $1.73 billion has been invested in Victorian startups and scale-ups across 766 deals in 504 unique companies. The dollar amount invested by Early Stage VC and Later Stage VC has been growing. This has been driven by a succes-sion of large capital raises including Judo Capital, Airwallex and Culture Amp.
Seed stage investment shows more mixed signs of performance. While there has been strong growth in the number of Accelerator / Incubator deals, the number of Seed / Angel deals has dipped after peaking in 2014.
Venture Capital is growing strong while Angel investors retreat
Capital raising stages
250
250
350
200
150
100
50
0
$ in
vest
ed (m
illio
n, A
UD
)D
eal c
ount
2013 2014 2015 2016 2017 2018
2013 2014 2015 2016 2017 2018
70
60
50
40
30
20
10
0
Major raises include:Company
Sumo
Round
Angel
Amount ($)
$7.41m
Date
June 2017
Company Round Amount ($) Date
IRExchange
CertaTherapeutics
Early VC
Early VC
$38.33m
$24.35m
Oct 2017
Jun 2018
Judo Capital
Airwallex
Culture Amp
Spinifex Pharmaceuticals
Later VC
Series B
Series D
Series C
$136.38m
$103.9m
$51.95m
48.0m
Aug 2018
Jul 2018
Jul 2018
Apr 2018
Early Stage Growth & Later StageSeed Stage

9 Valuations based on reported ASX market capitalisation as at 5 September 2018,10 Median amount raised over the last 5 years. Information is sourced from Pitchbook Data.
Most firms are able to raise capital... ...Although there appear to be challenges withraising Angel investment
Oversubscribed
Raised as much as needed
Currently in the process of raising
Raised but didn't raise enough
Tried to raise but failed
Firms that raised as much or more than needed
Firms that didn’t raise enough or failed to raise
Firms that raised as much or more than needed
Firms that didn’t raise enough or failed to raise
18%
56%
6%
18%3%
Angel Venture Capital Private Equity
40%
75% 13% 13%
39% 21%
27Ecosystem Mapping Victoria
MEDIAN CAPITAL RAISES
The median amount seed firms raise is $53k from Accelerators / Incubators and $869k from Angel investors. Firms raising Venture Capital receive a median of $3.03m from Early Stage VC and $11.29m from Later Stage VC.
Median amounts of capital vary by investor type9
EASE OF RAISING CAPITAL
73% of firms report that they are able to raise as much or more capital than they require. 20% of firms report failing to raise capital or not being able to raise enough. The firms that fail to raise capital or are unable to raise enough are typically seeking to raise an Angel round.
Investment type Median amount raised ($AUD)10
Accelerator / Incubator $0.05mAngel $0.87m
Early Stage VC $3.03mLater Stage VC $11.29m

28Ecosystem Mapping Victoria
EFFORT IT TAKES TO RAISE CAPITALRaising capital is a lengthy and effort-intensive process. Firms typically take five to six months to raise capital and engage with 10 to 20 different investors. It takes longer to raise Angel compared to other capital types, at an average of 5.7 months.
Raising capital can take nearly half a year and involve conversations with multiple investors
Angel Venture Capital Private Equity
Average no. of conversations Average time (months)
0
5
10
15
20
25 5.8
5.6
5.4
5.2
5
4.8
4.6
Ave
rage
no.
of c
onve
rsat
ions
Ave
rage
tim
e (m
onth
s)

29Ecosystem Mapping Victoria
PeopleVictoria has experienced founders with a background in industries related to their startup.

30Ecosystem Mapping Victoria
EXPERIENCE OF FOUNDERSAround half of founders have previously started a business. Founders with previous experience starting a business are more likely to be leading a successful firm, measured in terms of its current size.
Founders with previous experience starting companies are more likely to be successful
SERIAL ENTREPRENEURSHIPVictoria is demonstrating signs of serial entrepreneurship. 18% of founders in Victoria have previously worked at a firm that reached a valuation of $20 million or higher.
Nearly 1 in 5 founders have worked at a startup with >$20m valuation
Percent Average FTEs
% o
f fou
nder
s
Ave
rage
FTE
s of
cur
rent
firm
No. of firms previously founded
0%0 1 2 3 4 5
5
10
15
20
25
30
35
6 7+
5%
10%
15%
20%
25%
30%
35%
40%
45%
50%
Yes No
82%
18%

31Ecosystem Mapping Victoria
INDUSTRY EXPERIENCEIndustry experience appears to be a major driver of founders establishing new firms. On average, founders with more industry experience have founded more startups than founders with less industry experience
People with more experience working in industry are more likely to found a startup
Years of sector experience
Tota
l pre
viou
s st
artu
ps
crea
ted
Ave
rage
sta
rtup
s fo
und
ed
0None Less than
1 year2 years 3 – 5
years6 – 10 years
11 – 20 years
21+ years
0.2
0.4
0.6
0.8
1
1.2
1.4
1.6
1.8
50
100
150
200
250
300
350
400
Total startups founded Average no. startups founded
32Ecosystem Mapping Victoria
There is room to improve the diversity of both startup founders and their teams.
FOUNDER DEMOGRAPHICS
Fast facts on founders
Gender of founders
Age of founders
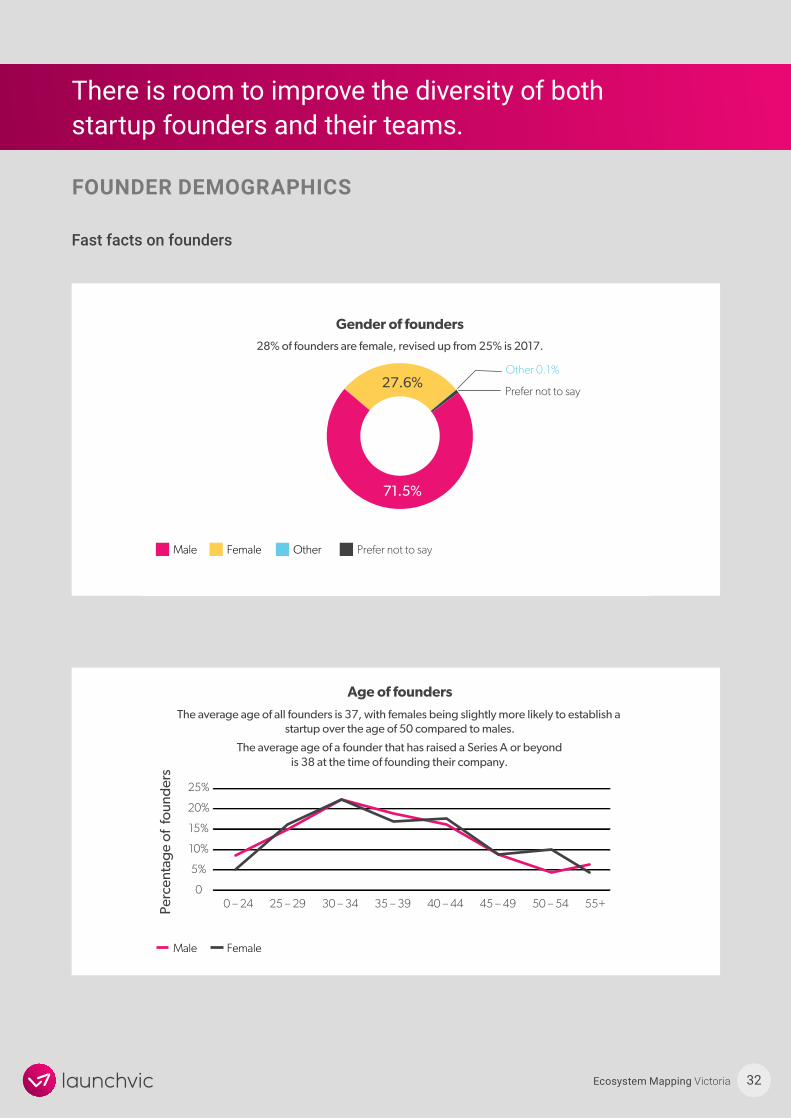
28% of founders are female, revised up from 25% is 2017.
The average age of all founders is 37, with females being slightly more likely to establish a startup over the age of 50 compared to males.
The average age of a founder that has rasied a Series A or beyond is 38 at the time offounding there company.
Male Other Prefer not to sayFemale
Male Female
Other 0.1%
Prefer not to say
71.5%
27.6%
10%
5%
00 – 24 25 – 29 30 – 34 35 – 39 40 – 44 45 – 49 50 – 54 55+
15%
20%
25%
Perc
enta
ge o
f fo
und
ers
Gender of founders
Age of founders
28% of founders are female, revised up from 25% is 2017.
The average age of all founders is 37, with females being slightly more likely to establish a startup over the age of 50 compared to males.
The average age of a founder that has raised a Series A or beyond is 38 at the time of founding their company.
Male Other Prefer not to sayFemale
Male Female
Other 0.1%
Prefer not to say
71.5%
27.6%
10%
5%
00 – 24 25 – 29 30 – 34 35 – 39 40 – 44 45 – 49 50 – 54 55+
15%
20%
25%
Perc
enta
ge o
f fo
und
ers
33Ecosystem Mapping Victoria
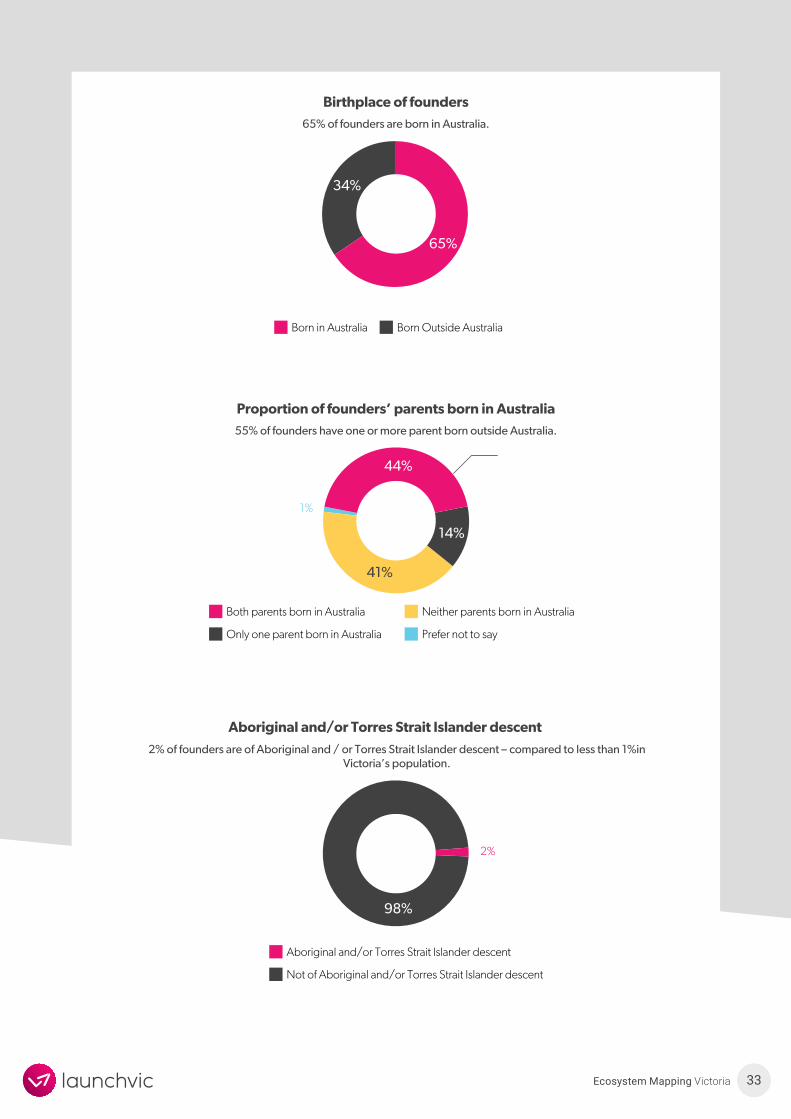
Birthplace of founders65% of founders are born in Australia.
Born in Australia Born Outside Australia
Proportion of founders’ parents born in Australia55% of founders have one or more parent born outside Australia.
Both parents born in Australia
Only one parent born in Australia
Neither parents born in Australia
Prefer not to say
1%
65%
34%
44%
41%
14%
Aboriginal and/or Torres Strait Islander descent
Not of Aboriginal and/or Torres Strait Islander descent
2%
Aboriginal and/or Torres Strait Islander descent
2% of founders are of Aboriginal and / or Torres Strait Islander descent – compared to less than 1%in Victoria’s population.
98%

34Ecosystem Mapping Victoria
GENDER REPRESENTATION OF FOUNDERS BY SECTORDesign, Consumer Goods, Education and Media & Entertainment have achieved relatively equal gender representation for founders. However, there is room to improve the level of gender representation in other sectors.
Few sectors have achieved relatively equal gender representation for founders
Design
Social enterp
rise
Education
Media
and Enterta
inment
Health
Food & Fibre
and consu
mption
Professi
onal se
rvices
Consumer g
oods and m
anufac
turing
Real Esta
teCommerce
Transp
ort, lo
gistics a
nd trave
l
Enterpris
e & corp
orate se
rvices
Sports &
Recreati
onFinan
cial Servi
cesData
& A
nalytic
s
Energy
Safety
& Public se
rvice
48% 43% 42% 36% 33% 31% 30% 30% 27% 24% 20% 18% 15% 12% 11% 0% 0%
52% 57% 58% 64% 67% 69% 70% 70% 73% 76% 80% 82% 85% 88% 89% 100% 100%
Male Female
Perc
enta
ge o
f fo
und
ers
GENDER REPRESENTATION OF FOUNDERS BY SECTOR
Male Female Design 52% 48% Social enterprise 57% 43% Education 58% 42% Media & Entertainment 64% 36% Health 67% 33% Food & Fibre and consumption 69% 31% Professional services 70% 30% Consumer goods and manufacturing 70% 30% Real Estate 73% 27% Commerce 76% 24% Transport, logistics and travel 80% 20% Enterprise & corporate services 82% 18% Sports & Recreation 85% 15% Financial Services 88% 12% Data & Analytics 89% 11% Energy 100% 0% Safety & Public service 100% 0% z

35Ecosystem Mapping Victoria
DIVERSITY AND INCLUSIONVery few firms have diversity in terms of staff who identify as LGBQTIA+, Aboriginal and/or Torres Strait Islanders, or having a disability. There is better representation of females and culturally and linguistically diverse staff – although still significant room for growth.
Perc
ent o
f firm
sPe
rcen
t of fi
rms
Relatively diverse areas:Staff who identify as culturally or linguistically diverse or female
0% 1% – 25%0
20%
40%
60%
70%
100%
26% – 49%
Areas of poor diversity:Staff who identify as LGBQTIA+, Aboriginal and/or Torres
Strait Islanders, or having a disability
84% of firms have no staff who identify as Aboriginal and /or Torres Strait Islander
68% of firms have no staff who identify as having a disability
56% of firms have no staff who identify as LGBQTIA+
50% 51% – 75% 76% – 99% 100%
LGBQTIA+
FemaleCulturally or linguistically diverse
Indigenous or Torres Strait Islander Having a disability
0% 1% – 25%0
10%
15%
5%
20%
25%
30%
35%
26% – 49% 50% 51% – 75% 76% – 99% 100%
Perc
ent o
f firm
sPe
rcen
t of fi
rms
Areas of poor diversity:Staff who identify as LGBQTIA+, Aboriginal and/ or Torres
Strait Islanders, or having a disability
Relatively diverse areas:Staff who identify as culturally or linguistically diverse or female
0% 1% – 25%0
20%
40%
60%
70%
100%
26% – 49%
84% of firms have no staff who identify as Aboriginal and/ or Torres Strait Islander
68% of firms have no staff who identify as having a disability
56% of firms have no staff who identify as LGBQTIA+
50% 51% – 75% 76% – 99% 100%
LGBQTIA+
FemaleCulturally or linguistically diverse
Indigenous or Torres Strait Islander Having a disability
0% 1% – 25%0
10%
15%
5%
20%
25%
30%
35%
26% – 49% 50% 51% – 75% 76% – 99% 100%

36Ecosystem Mapping Victoria
DIVERSITY AND INCLUSION POLICIESIn most sectors, less than 50% of firms have a known diversity and inclusion policy. The exceptions are Design, Education, Data & Analytics, Media & Entertainment and Enterprise & Corporate Services.
Firms in most sectors do not have a known diversity and inclusion policy
Design
Education
Data &
Analy
tics
Media
and Enterta
inment
Enterpris
e & corp
orate se
rvices
Real Esta
te
Safety
& Public se
rvice
Financial
Services
Commerce
Health
Consumer g
oods and m
anufac
turing
Energy
Sports &
Recreati
on
Food & Fibre
and consu
mption
Transp
ort, lo
gistics a
nd trave
l
10%
20%
30%
40%
50%
60%
70%
80%
90%
100%
0
Note: No firms in Professional Services and Social Enterprise responded to this question.Yes No Unsure
DIVERSITY AND INCLUSION POLICIES BY SECTOR Yes No Unsure Design 68% 18% 14% Education 49% 35% 15% Data & Analytics 49% 35% 16% Media & Entertainment 48% 38% 14% Enterprise & corporate services 47% 47% 7% Real Estate 46% 54% 0% Safety & Public service 44% 33% 22% Financial Services 43% 54% 4% Commerce 40% 47% 13% Health 38% 48% 14% Consumer goods and manufacturing 38% 49% 14% Energy 35% 59% 6% Sports & Recreation 33% 56% 11% Food & Fibre and consumption 29% 50% 21% Transport, logistics and travel 19% 59% 22%
Note: No firms in Professional Services and Social Enterprise responded to this question.
Around 50% or more firms have known diversity and inclusion policy.

37Ecosystem Mapping Victoria
External environment and supportVictoria’s external environment is growing from a strong base, with investment from LaunchVic and the private sector increasing the supply of external support available to firms.

38Ecosystem Mapping Victoria
ACCELERATORSThe number of specialist accelerator programs has proliferated. Victoria now has 29 accelerator programs, with nearly 60% of programs focusing on a specific vertical or sector. Health claims the most dedicated programs, followed by Food & Fibre and Cyber, Data & IoT.
Over two thirds of programs focus on a specific vertical or sector
General University Health Food & Fibre Cyber, Data & IoT
Social EnterpriseSportstech Creative Energy Enterprise
6 6 5 3 3 2 1 1 1 1
Number of accelerators by sector

11 Knight Frank Research. Culture Clash: Flexible Workspace, Coworking & The Future. August 2017. 12 Startup Genome. Melbourne Startup Ecosystem Report. 2018.
39Ecosystem Mapping Victoria
Distribution of coworking spaces in Australia (sqm)1
Perth Adelaide Melbourne
SydneyCanberra Brisbane
4%
49%
0.3 %5% 38%
4%
COWORKING SPACESOver the past three years, the availability of coworking spaces in Melbourne has grown 960 per cent.11
Melbourne is now the coworking space capital of Australia, claiming over 170 coworking spaces12 and accounting for nearly half the total volume of coworking sites across Australia.
Melbourne now claims the largest share of coworking spaces in Australia
Accessed during the past 12 months Did not access during the past 12 months
59%
41%
2 in 5 firms have accessed a coworking space during the past 12 months

40Ecosystem Mapping Victoria
MEETUP GROUPS
The popularity of meetup groups is growing, with 35% of firms having accessed a meetup group during the past 12 months.Victoria’s largest meetup groups have grown their membership base by 22% over the past 12 months. Startup Victoria continues to be the largest meetup group in terms of membership.
1 in 3 firms access meetup groups
Accessed during the past 12 months
Did not access during the past 12 months
65%
35%
1. Startup Victoria
2. The Entrepreneur Club
3. Melbourne Silicon Beach
4. Entrepreneurship and Innovation Hub
5. Melbourne Startup Founder 101
6. Disruptive Startups Melbourne
7. Startup Grind Melbourne
8. Melbourne FinTech Startups
9. Melbourne Entrepreneurship
10. Startup HealthTech
Number of members in 2018
11,546
11,291
9,968
6,798
5,283
5,245
3,908
3,018
3,016
2,717
Year Established
2010
2010
2011
2014
2014
2013
2010
2014
2012
2013
Startup Victoria is the largest meetup group, with over 11,500 members

41Ecosystem Mapping Victoria
PROFESSIONAL SUPPORT
Firms are accessing a range of professional support, with over half of all firms drawing on advice from Mentors & Advisors and Lawyers.
Mentors and advisors are the most common form of support firms draw on
53.9%50.2%
46.5%
24.5% 22.2%17.9%
14.1%
Mentors and advisors 53.9%Legal advice 50.2%Financial advisors / accountants
46.5%Business consultants 24.5%Universities / research institute partners
22.2%Professional development training
17.9%Local government 14.1%
Mentors and advisors
Legal advice Financial advisors /
accountants
Business consultants
Universities / research
institute partners
Professional development
training
Local government
Perc
ent o
f firm
s

42Ecosystem Mapping Victoria
Geography93% of firms are based in the Greater Melbourne Region, with 7% of firms based in regional Victoria.

43Ecosystem Mapping Victoria
20% of firms in the Greater Melbourne Region are in the CBD. The remaining 80% of firms are predominantly distributed across Melbourne’s inner city and south eastern suburbs.
Coworking spaces and firms are clustered together in Melbourne’s CBD and inner suburbs
Location of coworking spaces and firms in Melbourne
Top 10 firm locations1. Melbourne CBD2. Richmond3. South Melbourne4. St Kilda Rd5. Collingwood6. Prahran7. St Kilda8. South Yarra9. Docklands10. Southbank
Top 10 coworking space locations1. Melbourne2. Collingwood3. Richmond4. St Kilda5. Southbank6. South Melbourne7. Prahran8. Docklands9. Carlton10. Fitzroy
Startup density Coworking space density
Low High
Victoria
New South Wales
Australian Capital Territory
GEOGRAPHY93% of firms are based in the Greater Melbourne Region, with 7% of firms based in regional Victoria.
The majority of Victorian firms are based in the Greater Melbourne Region

44Ecosystem Mapping Victoria
AcknowledgementsWe would like to extend our sincere thanks to the many contributors to this report, including:
James Demetriou, Australian Sports Tech Network
Judy Anderson and Mei Chan, Startup Victoria
Alan Tsen, Stone & Chalk
City of Melbourne
Jeffrey Bourne, Rocket Seeder
Dr Krystal Evans, BioMelbourne Network
Trevor Townsend, Startupbootcamp Energy Australia
Buzz Palmer, The Actuator
Thank You to Victoria’s startup community, including those that completed the survey as well as those that helped raise
awareness of this important project.

45Ecosystem Mapping Victoria