vicenda summit 201407 lin
TRANSCRIPT

Creating Value Through Demand StrategyDanie Schoeman

The Uncertainty Of Things
© 2014 Danie Schoeman & Company.
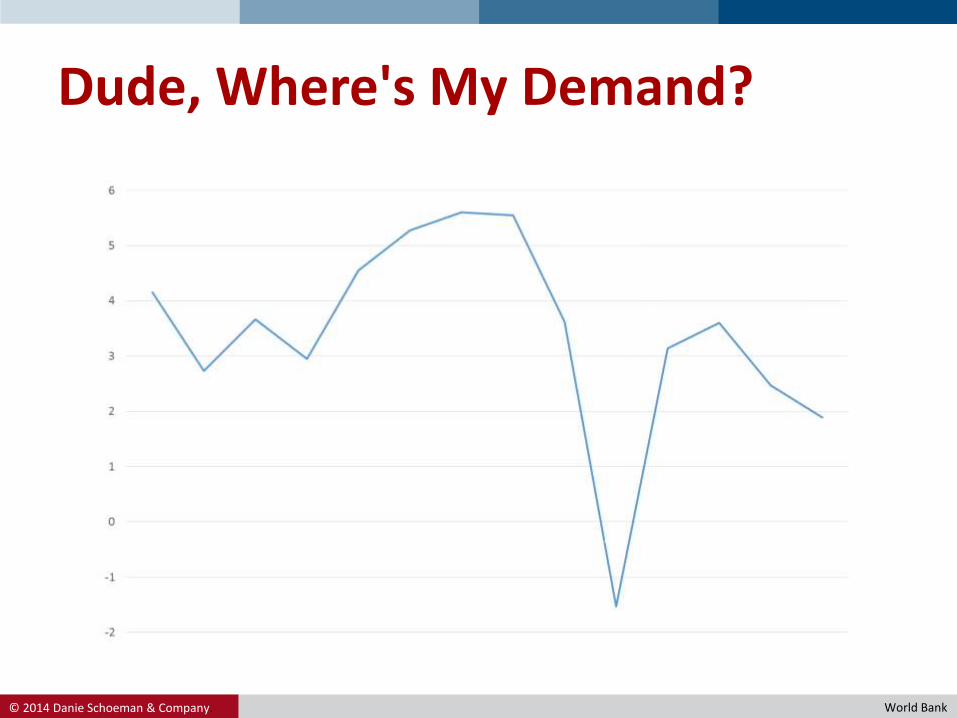
Dude, Where's My Demand?
World Bank
© 2014 Danie Schoeman & Company.
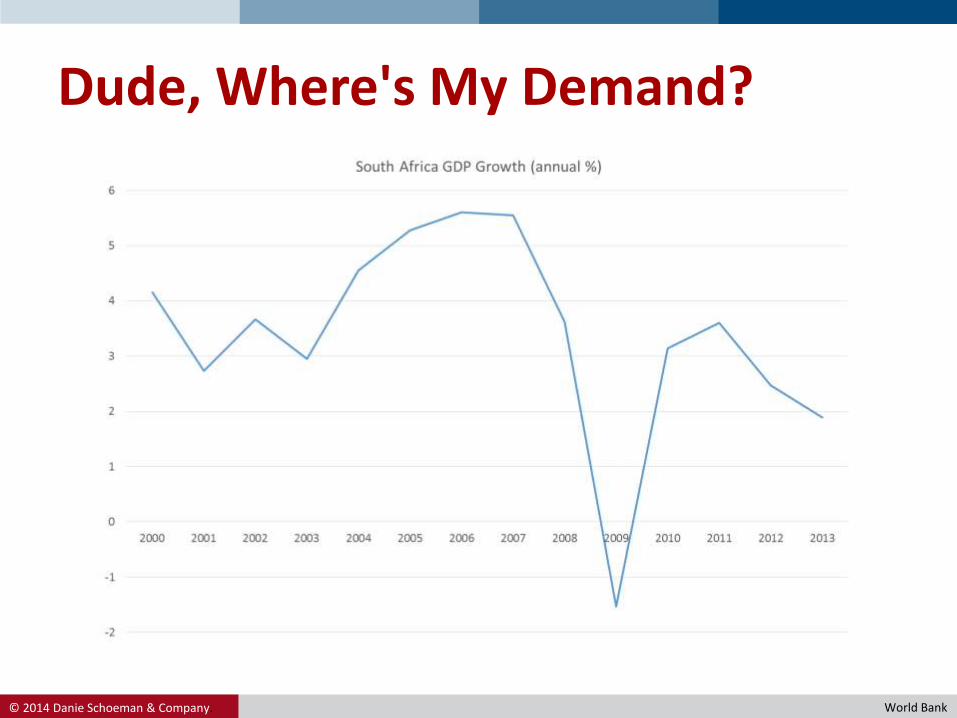
Dude, Where's My Demand?
World Bank
© 2014 Danie Schoeman & Company.
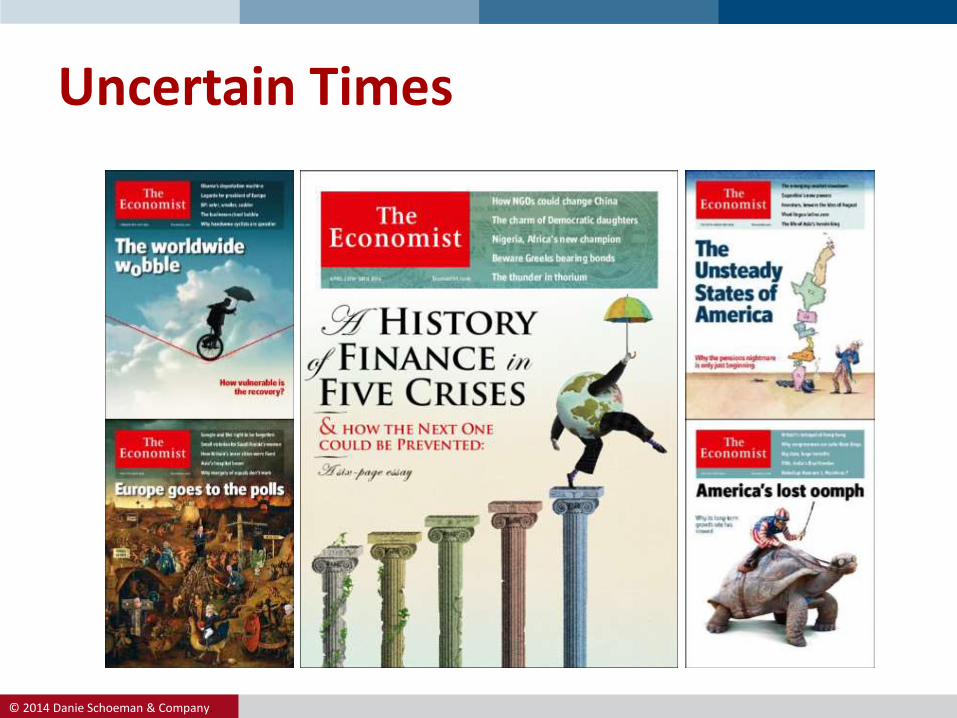
Uncertain Times
© 2014 Danie Schoeman & Company.
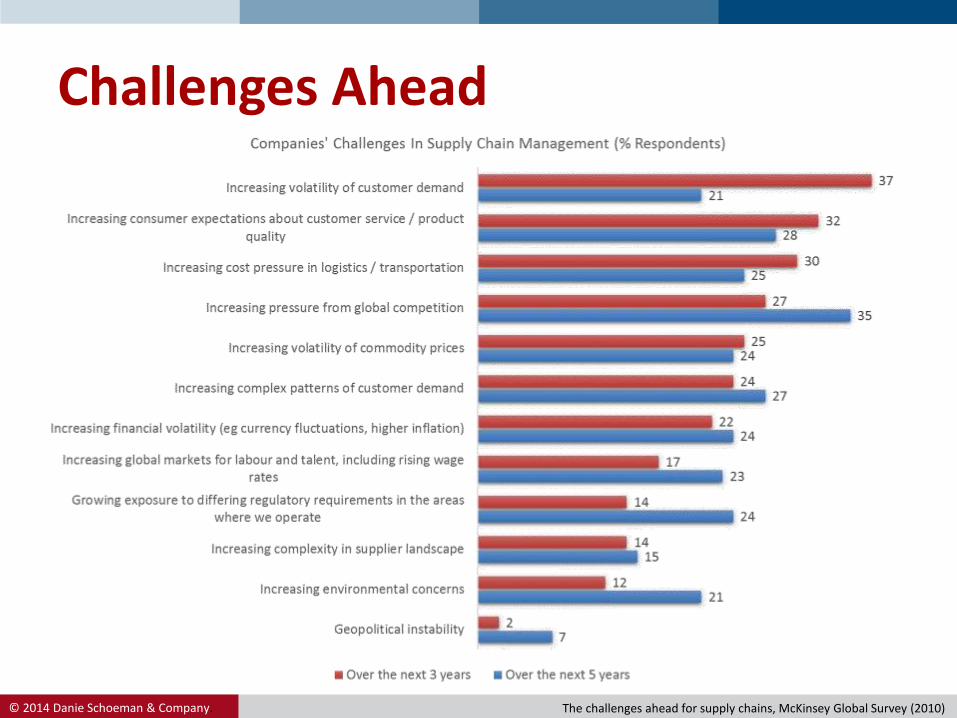
Challenges Ahead
The challenges ahead for supply chains, McKinsey Global Survey (2010)
© 2014 Danie Schoeman & Company.
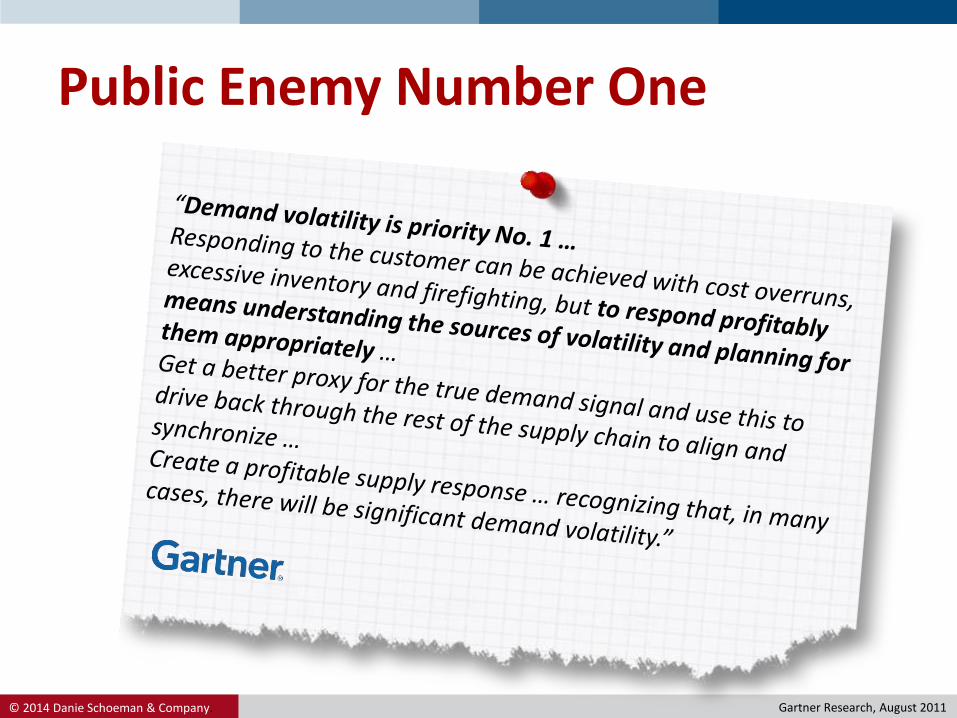
Public Enemy Number One
Gartner Research, August 2011
© 2014 Danie Schoeman & Company.
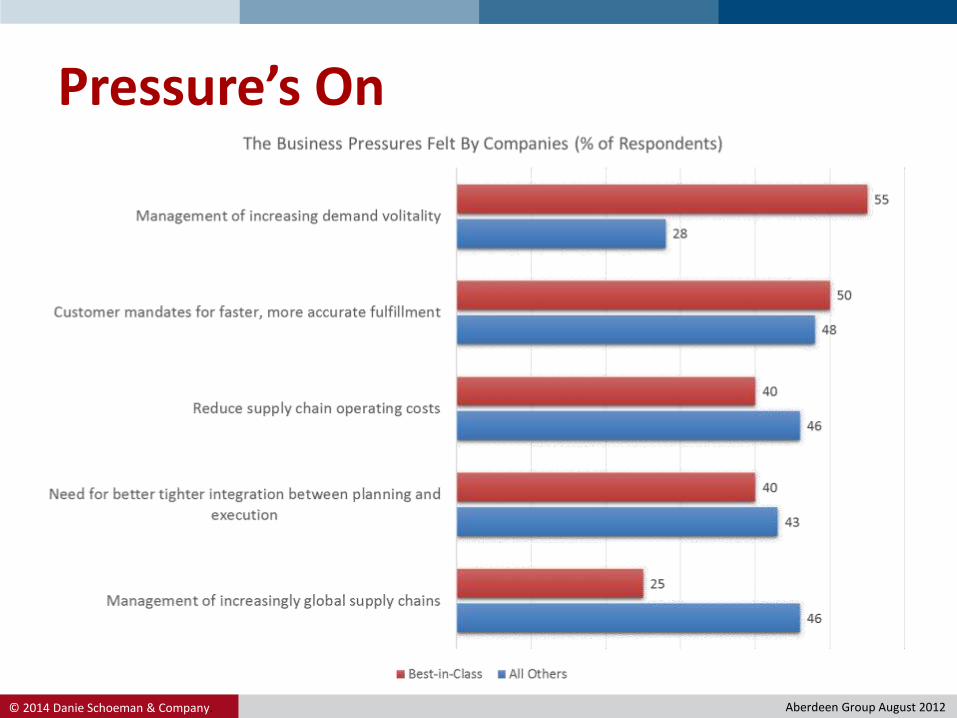
Pressure’s On
Aberdeen Group August 2012

On Value Creation

© 2014 Danie Schoeman & Company.
Creating Value
• Value that a company creates is measured as Market Value Added (MVA). MVA is the difference between the current market value of a firm, the resulting value of management's actions and investments, and the capital contributed by investors.
• The basic formula is:
𝑀𝑉𝐴 = 𝑉 − 𝐾0where:– V is the market value of the firm, including the value
of the firm's equity and debt– K0 is the capital invested in the firm
© 2014 Danie Schoeman & Company.
Making An Economic Profit
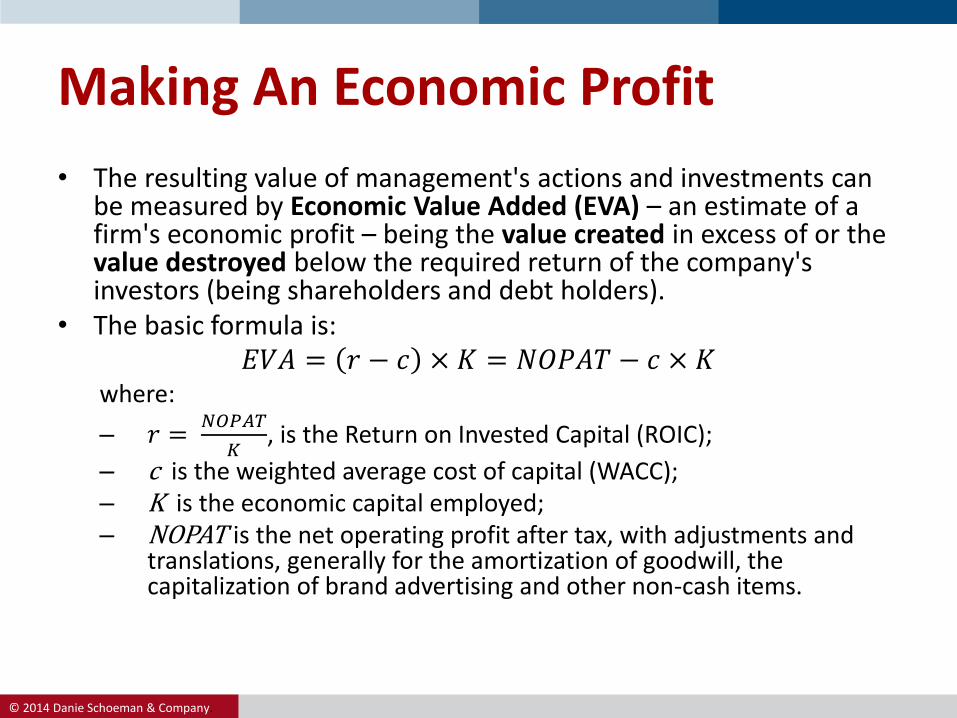
• The resulting value of management's actions and investments can be measured by Economic Value Added (EVA) – an estimate of a firm's economic profit – being the value created in excess of or the value destroyed below the required return of the company's investors (being shareholders and debt holders).
• The basic formula is:𝐸𝑉𝐴 = 𝑟 − 𝑐 × 𝐾 = 𝑁𝑂𝑃𝐴𝑇 − 𝑐 × 𝐾
where:
– 𝑟 =𝑁𝑂𝑃𝐴𝑇
𝐾, is the Return on Invested Capital (ROIC);
– c is the weighted average cost of capital (WACC);– K is the economic capital employed;– NOPAT is the net operating profit after tax, with adjustments and
translations, generally for the amortization of goodwill, the capitalization of brand advertising and other non-cash items.
© 2014 Danie Schoeman & Company.
A Series Of Actions & Investments
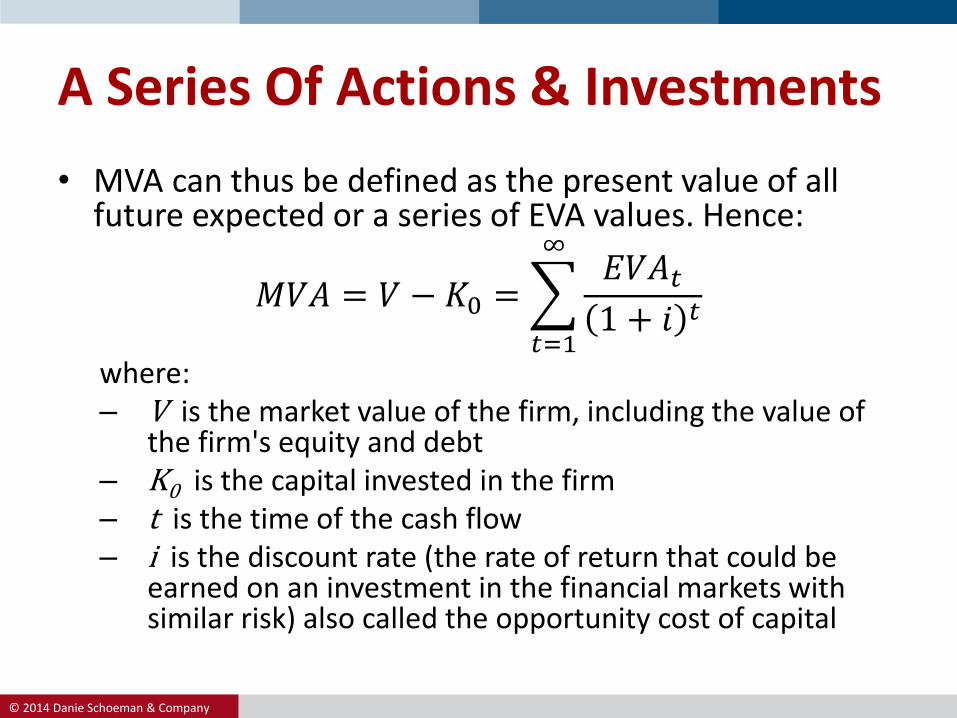
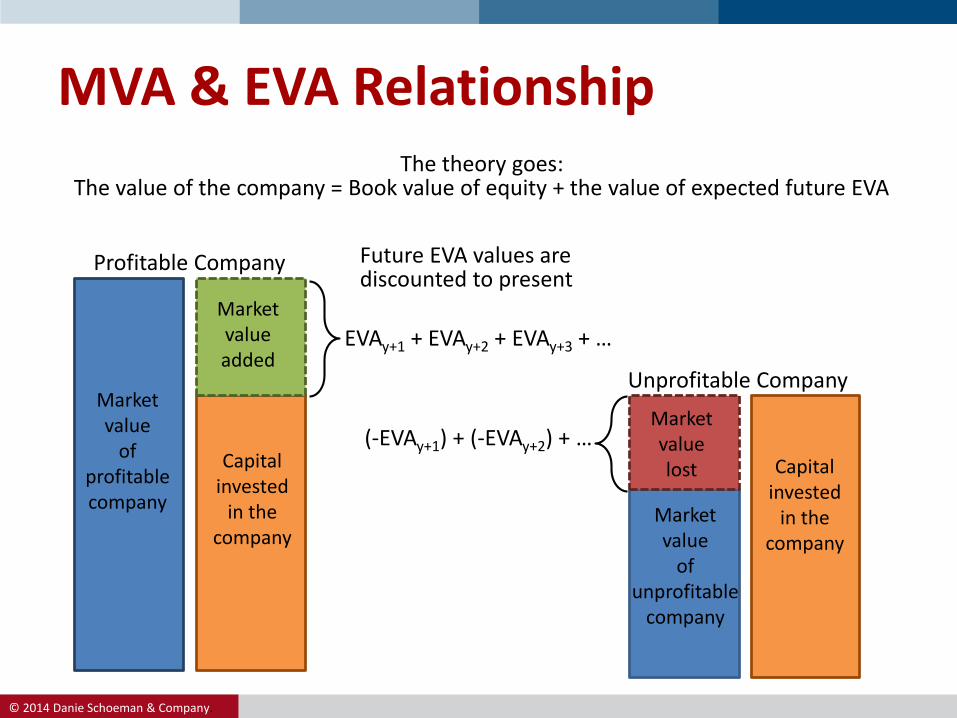
• MVA can thus be defined as the present value of all future expected or a series of EVA values. Hence:
𝑀𝑉𝐴 = 𝑉 − 𝐾0 =
𝑡=1
∞𝐸𝑉𝐴𝑡1 + 𝑖 𝑡
where:– V is the market value of the firm, including the value of
the firm's equity and debt– K0 is the capital invested in the firm– t is the time of the cash flow– i is the discount rate (the rate of return that could be
earned on an investment in the financial markets with similar risk) also called the opportunity cost of capital
© 2014 Danie Schoeman & Company.
MVA & EVA Relationship
Future EVA values arediscounted to present
Profitable Company
Unprofitable Company
The theory goes:The value of the company = Book value of equity + the value of expected future EVA
EVAy+1 + EVAy+2 + EVAy+3 + …
(-EVAy+1) + (-EVAy+2) + …
Marketvalue
ofprofitablecompany
Capitalinvested
in thecompany
Marketvalueadded
Capitalinvested
in thecompany
Marketvaluelost
Marketvalue
ofunprofitable
company
© 2014 Danie Schoeman & Company.
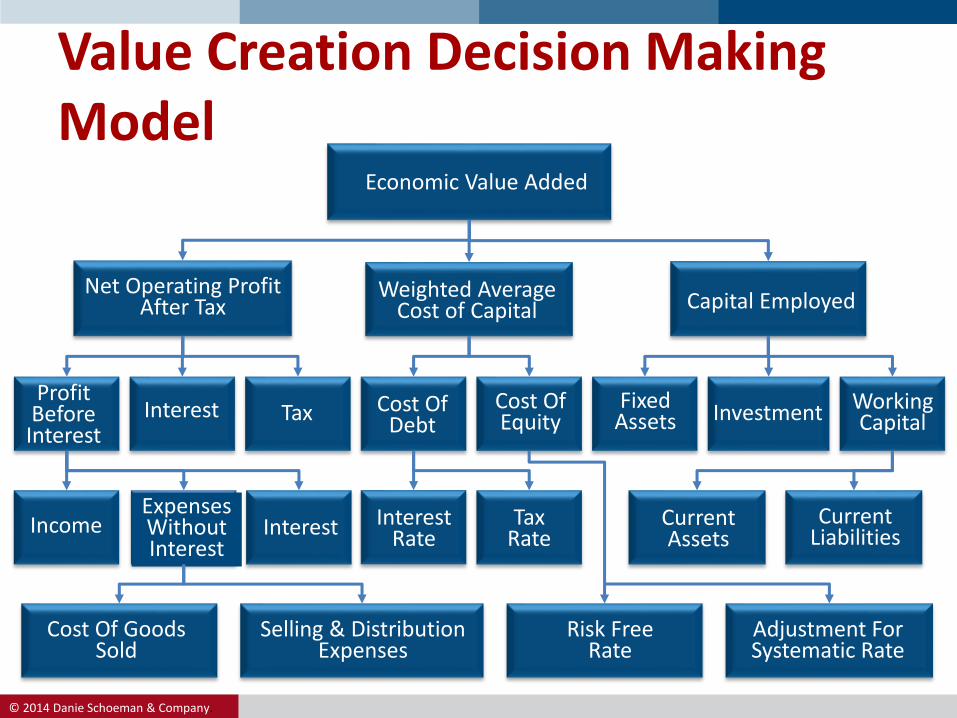
Value Creation Decision Making Model
Economic Value Added
Net Operating ProfitAfter Tax
Weighted AverageCost of Capital Capital Employed
ProfitBefore
Interest
Cost OfDebt
FixedAssets
Adjustment ForSystematic Rate
Interest Tax Cost OfEquity
Risk FreeRate
CurrentAssets
Cost Of GoodsSold
ExpensesWithoutInterest
Income
WorkingCapital
Interest InterestRate
TaxRate
CurrentLiabilities
Selling & DistributionExpenses
Investment
© 2014 Danie Schoeman & Company.
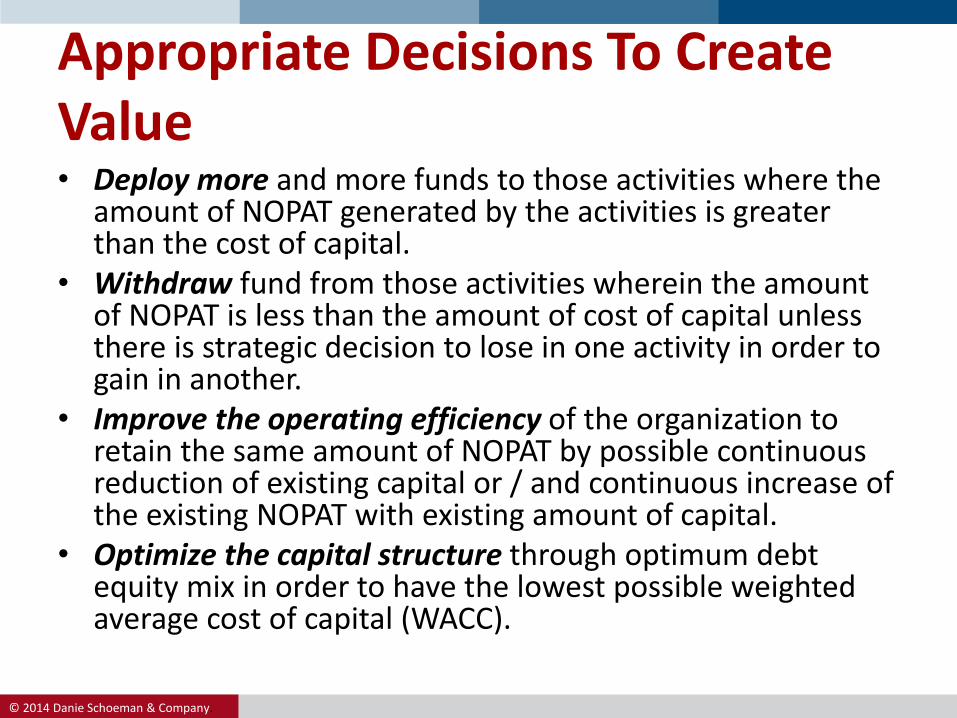
Appropriate Decisions To Create Value • Deploy more and more funds to those activities where the
amount of NOPAT generated by the activities is greater than the cost of capital.
• Withdraw fund from those activities wherein the amount of NOPAT is less than the amount of cost of capital unless there is strategic decision to lose in one activity in order to gain in another.
• Improve the operating efficiency of the organization to retain the same amount of NOPAT by possible continuous reduction of existing capital or / and continuous increase of the existing NOPAT with existing amount of capital.
• Optimize the capital structure through optimum debt equity mix in order to have the lowest possible weighted average cost of capital (WACC).

In The C-Suite
© 2014 Danie Schoeman & Company.
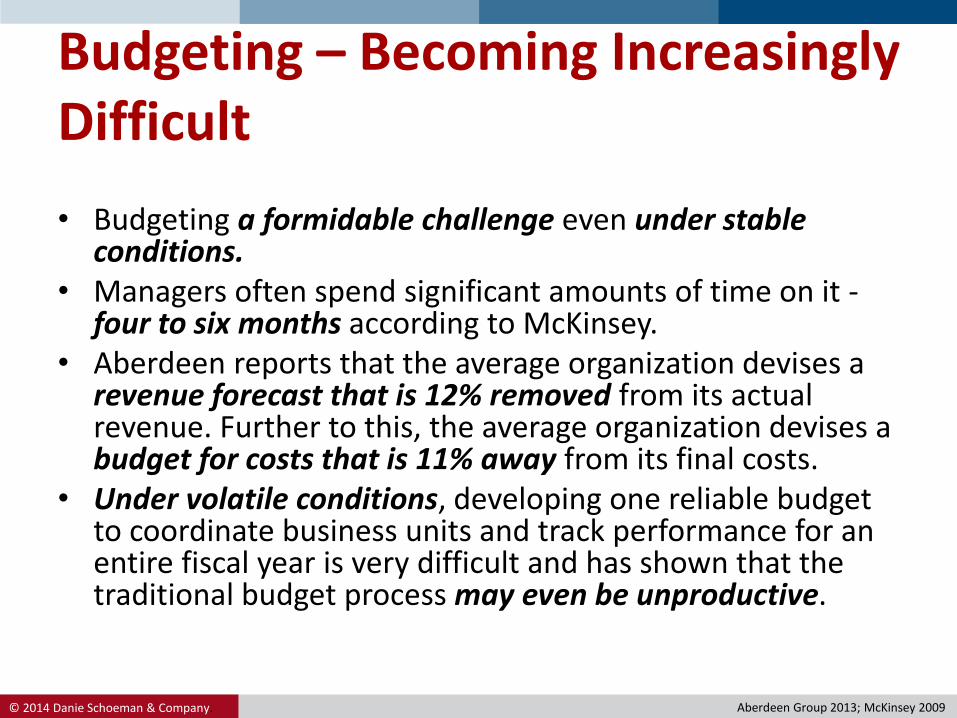
Budgeting – Becoming Increasingly Difficult
• Budgeting a formidable challenge even under stable conditions.
• Managers often spend significant amounts of time on it -four to six months according to McKinsey.
• Aberdeen reports that the average organization devises a revenue forecast that is 12% removed from its actual revenue. Further to this, the average organization devises a budget for costs that is 11% away from its final costs.
• Under volatile conditions, developing one reliable budget to coordinate business units and track performance for an entire fiscal year is very difficult and has shown that the traditional budget process may even be unproductive.
Aberdeen Group 2013; McKinsey 2009
© 2014 Danie Schoeman & Company.
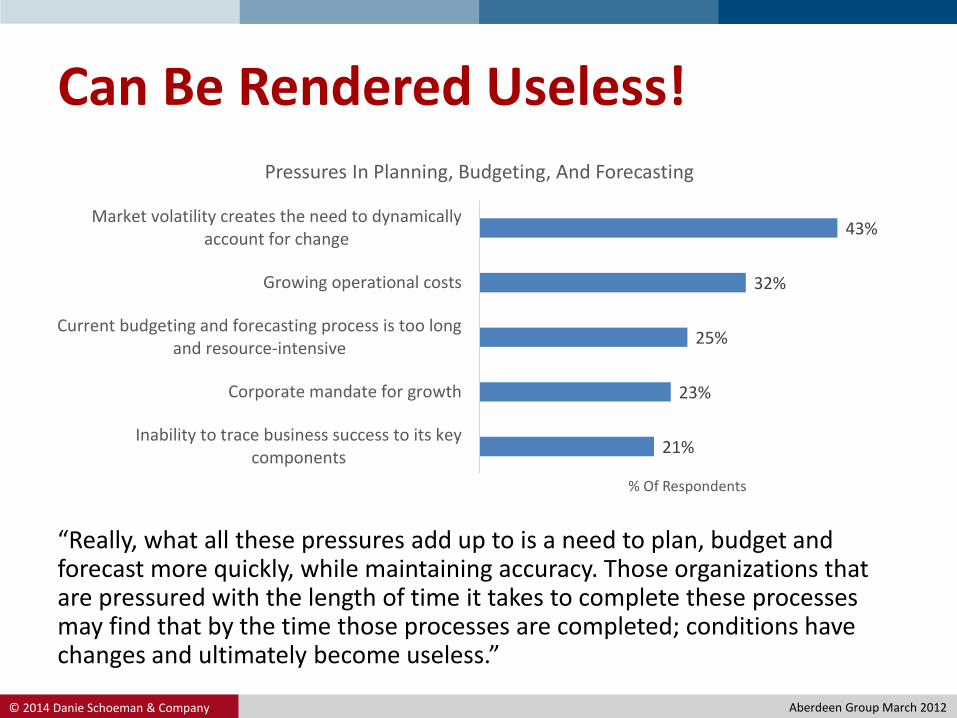
21%
23%
25%
32%
43%
Inability to trace business success to its keycomponents
Corporate mandate for growth
Current budgeting and forecasting process is too longand resource-intensive
Growing operational costs
Market volatility creates the need to dynamicallyaccount for change
% Of Respondents
Pressures In Planning, Budgeting, And Forecasting
Can Be Rendered Useless!
“Really, what all these pressures add up to is a need to plan, budget and forecast more quickly, while maintaining accuracy. Those organizations that are pressured with the length of time it takes to complete these processes may find that by the time those processes are completed; conditions have changes and ultimately become useless.”
Aberdeen Group March 2012
© 2014 Danie Schoeman & Company.
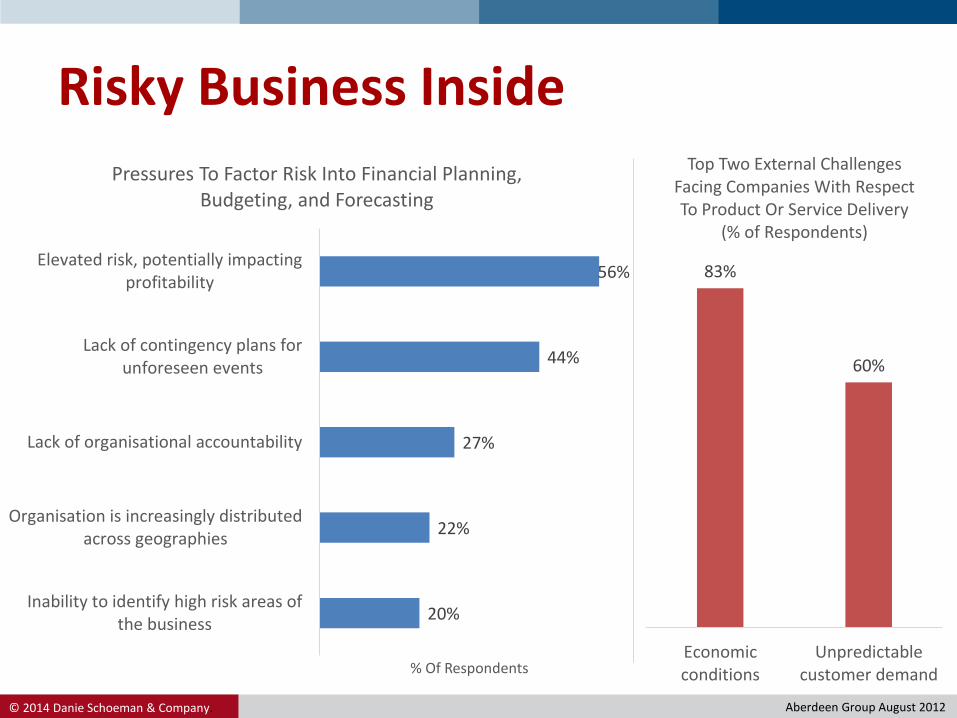
20%
22%
27%
44%
56%
Inability to identify high risk areas ofthe business
Organisation is increasingly distributedacross geographies
Lack of organisational accountability
Lack of contingency plans forunforeseen events
Elevated risk, potentially impactingprofitability
% Of Respondents
Pressures To Factor Risk Into Financial Planning, Budgeting, and Forecasting
83%
60%
Economicconditions
Unpredictablecustomer demand
Top Two External Challenges Facing Companies With Respect To Product Or Service Delivery
(% of Respondents)
Risky Business Inside
Aberdeen Group August 2012
© 2014 Danie Schoeman & Company.
Leading Methodologies
• In historical budgeting, organizations create budgets and forecasts based on the variances between prior budgets and actuals,
• Zero-based budgeting assumes that there has been no history, and no presumptions on future performance, This approach is used, typicallYt in conjunction with external services to establish a baseline commonly associated with industry norms and performance expectations.
• Performance-based budgets are driven by expected changes to the business for which performance metrics have been established. These can include new initiatives that will produce additional results, or can be related to expected growth in resources - for example, the addition of significant new sales resources or product lines.
• Using a driver-based budgeting process will involve the selection of one or more basic drivers of the business upon which the budget is based, For example, for a hospital, the budget may be largely driven by the insurance reimbursement rates that the government mandates. As the rates fluctuate, the budget for staff, supplies, and facility costs must be adjusted accordingly. These budgets can also be influenced by controlled changes in internal factors.
Aberdeen Group January 2013
© 2014 Danie Schoeman & Company.
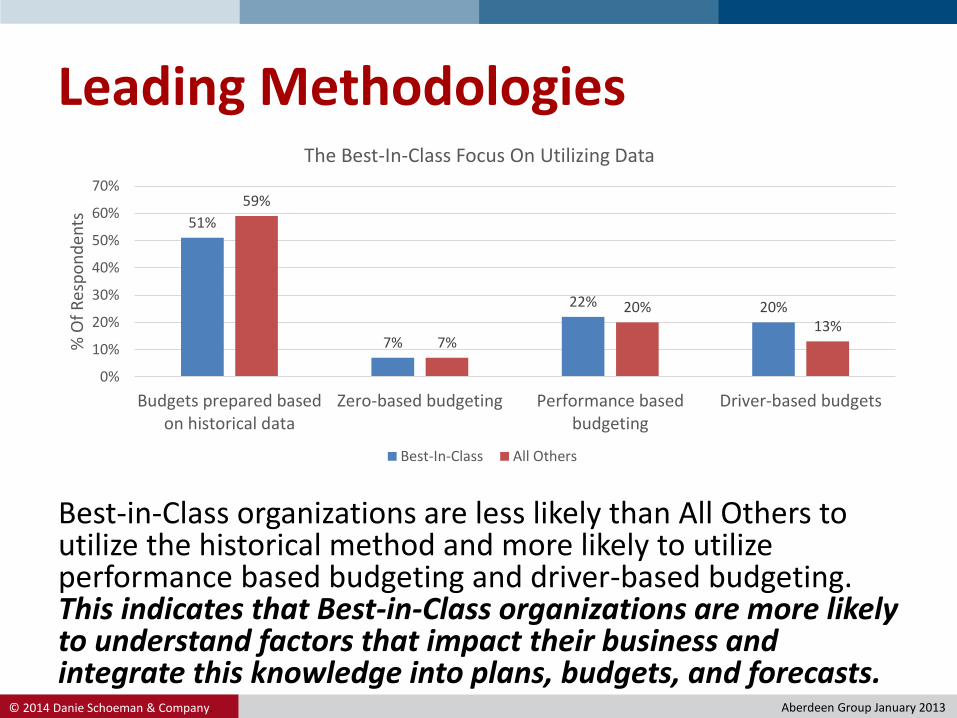
Leading Methodologies
Best-in-Class organizations are less likely than All Others to utilize the historical method and more likely to utilize performance based budgeting and driver-based budgeting. This indicates that Best-in-Class organizations are more likely to understand factors that impact their business and integrate this knowledge into plans, budgets, and forecasts.
51%
7%
22% 20%
59%
7%
20%13%
0%
10%
20%
30%
40%
50%
60%
70%
Budgets prepared basedon historical data
Zero-based budgeting Performance basedbudgeting
Driver-based budgets
% O
f R
esp
on
den
ts
The Best-In-Class Focus On Utilizing Data
Best-In-Class All Others
Aberdeen Group January 2013
© 2014 Danie Schoeman & Company.
Just In-Time Budgeting
• McKinsey – “A volatile economy makes traditional budgets obsolete before they’re even completed”.
• Suggested new approaches:
– Scenario planning with trigger events
– Zero-based budgeting
– Rolling forecasts
– Quarterly budgeting
McKinsey 2009
“A volatile economy makes traditional budgets obsolete before they’re even completed” -
McKinsey
© 2014 Danie Schoeman & Company.
Getting It
24%
27%
27%
30%
Elevated risk, potentially impacting profitability
Need to better integrate information fromunstructured data into corporate objectives
Need to better assess risk / reward dynamics beforeundertaking initiatives
Too many decisions are based on incomplete orinaccurate data
% Of Respondents
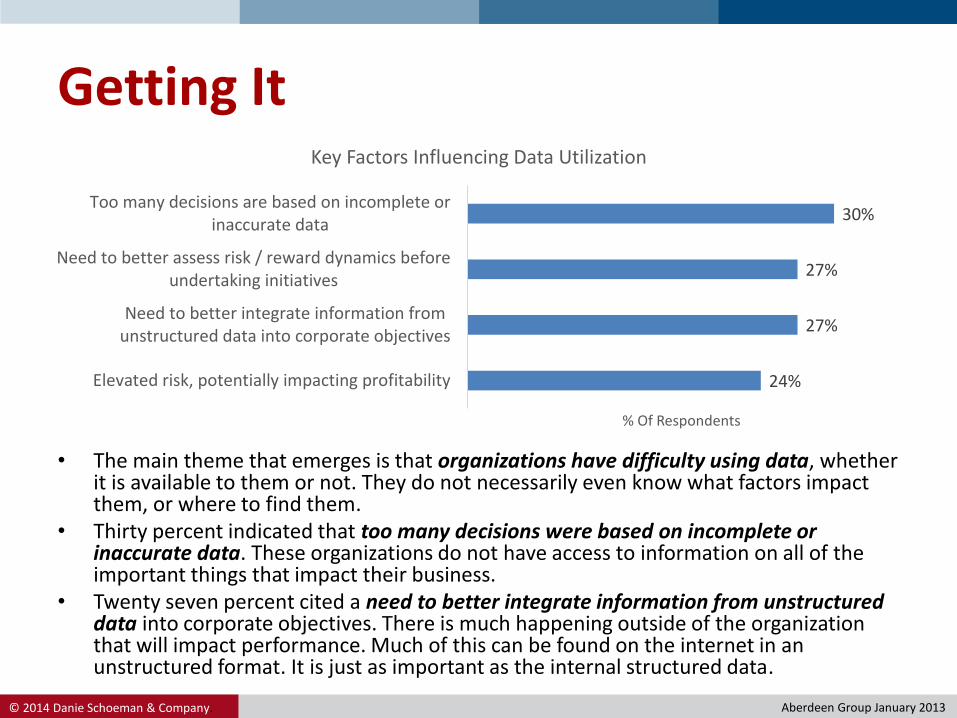
Key Factors Influencing Data Utilization
• The main theme that emerges is that organizations have difficulty using data, whether it is available to them or not. They do not necessarily even know what factors impact them, or where to find them.
• Thirty percent indicated that too many decisions were based on incomplete or inaccurate data. These organizations do not have access to information on all of the important things that impact their business.
• Twenty seven percent cited a need to better integrate information from unstructured data into corporate objectives. There is much happening outside of the organization that will impact performance. Much of this can be found on the internet in an unstructured format. It is just as important as the internal structured data.
Aberdeen Group January 2013
© 2014 Danie Schoeman & Company.
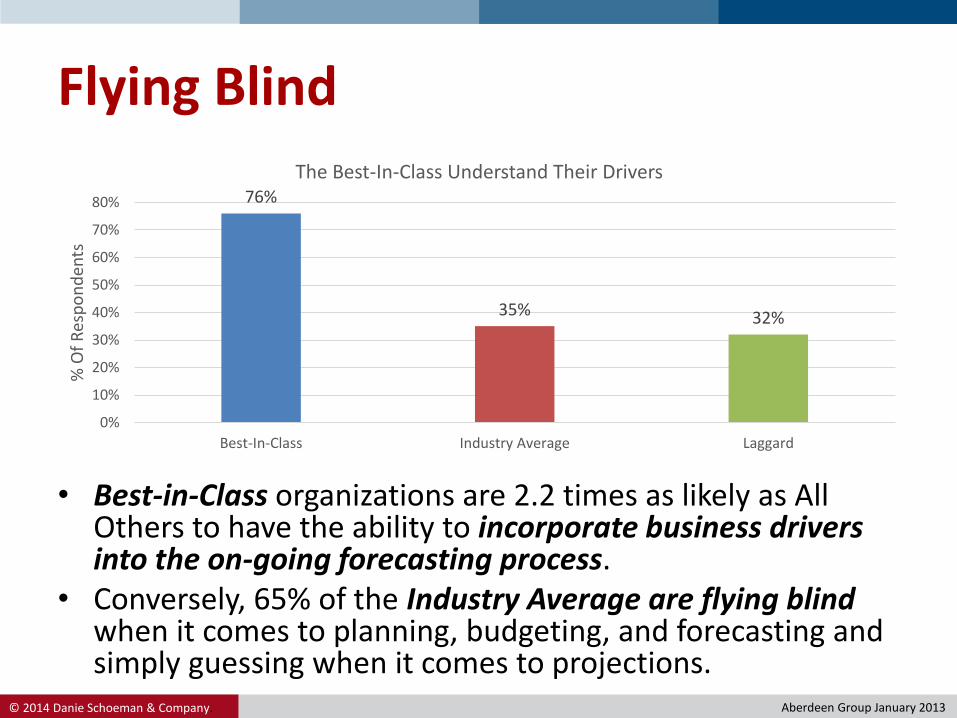
Flying Blind
• Best-in-Class organizations are 2.2 times as likely as All Others to have the ability to incorporate business drivers into the on-going forecasting process.
• Conversely, 65% of the Industry Average are flying blind when it comes to planning, budgeting, and forecasting and simply guessing when it comes to projections.
76%
35% 32%
0%
10%
20%
30%
40%
50%
60%
70%
80%
Best-In-Class Industry Average Laggard
% O
f R
esp
on
den
ts
The Best-In-Class Understand Their Drivers
Aberdeen Group January 2013
© 2014 Danie Schoeman & Company.
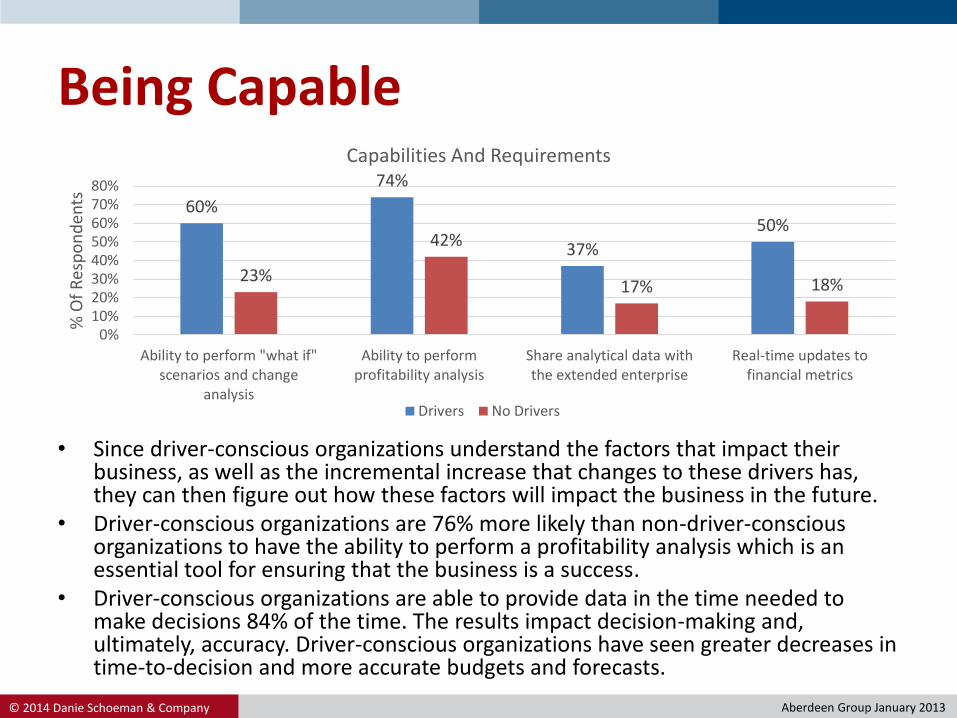
Being Capable
• Since driver-conscious organizations understand the factors that impact their business, as well as the incremental increase that changes to these drivers has, they can then figure out how these factors will impact the business in the future.
• Driver-conscious organizations are 76% more likely than non-driver-conscious organizations to have the ability to perform a profitability analysis which is an essential tool for ensuring that the business is a success.
• Driver-conscious organizations are able to provide data in the time needed to make decisions 84% of the time. The results impact decision-making and, ultimately, accuracy. Driver-conscious organizations have seen greater decreases in time-to-decision and more accurate budgets and forecasts.
60%
74%
37%
50%
23%
42%
17% 18%
0%10%20%30%40%50%60%70%80%
Ability to perform "what if"scenarios and change
analysis
Ability to performprofitability analysis
Share analytical data withthe extended enterprise
Real-time updates tofinancial metrics
% O
f R
esp
on
den
ts
Capabilities And Requirements
Drivers No Drivers
Aberdeen Group January 2013

Using Business Drivers
© 2014 Danie Schoeman & Company.
19
60
-01
19
63
-06
19
66
-11
19
70
-04
19
73
-09
19
77
-02
19
80
-07
19
83
-12
19
87
-05
19
90
-10
19
94
-03
19
97
-08
20
01
-01
20
04
-06
20
07
-11
20
11
-04
Bu
sin
ess
Ou
tpu
t
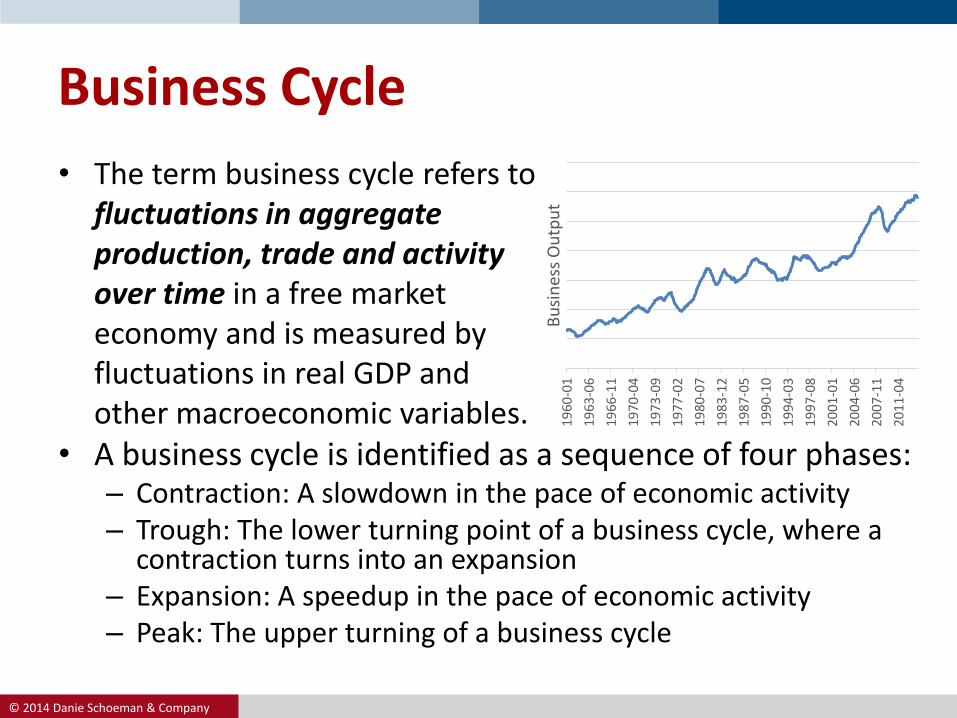
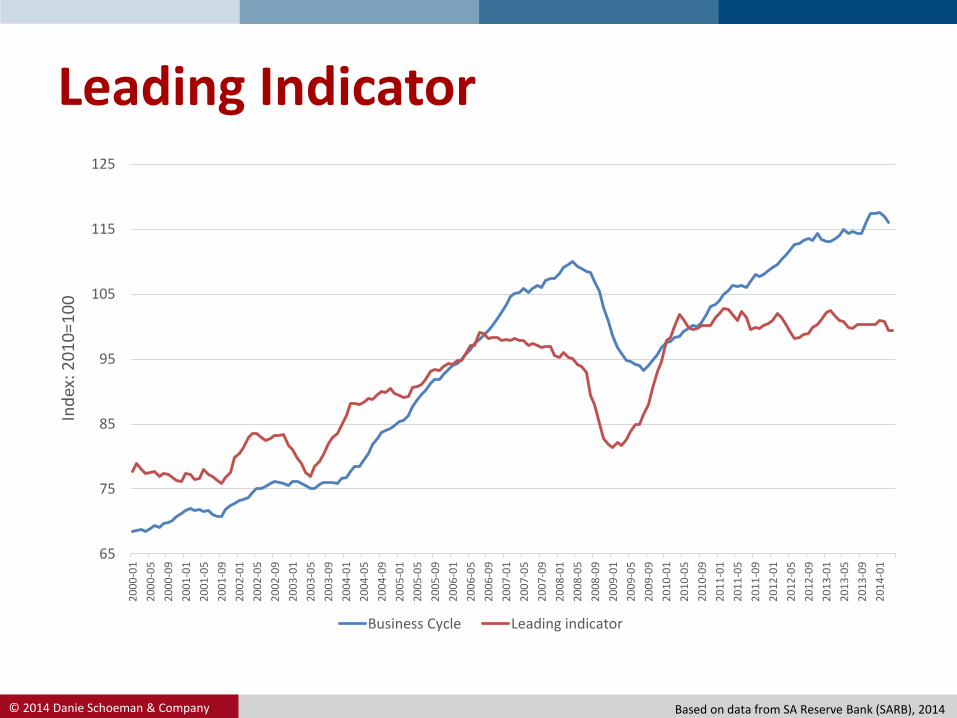
• The term business cycle refers to fluctuations in aggregate production, trade and activity over time in a free market economy and is measured by fluctuations in real GDP and other macroeconomic variables.
Business Cycle
• A business cycle is identified as a sequence of four phases:– Contraction: A slowdown in the pace of economic activity – Trough: The lower turning point of a business cycle, where a
contraction turns into an expansion– Expansion: A speedup in the pace of economic activity– Peak: The upper turning of a business cycle
© 2014 Danie Schoeman & Company.
Economic Indicators
• An economic indicator is an economic statistic which indicate how well the economy is doing and how well the economy is going to do in the future.
• Economic indicators are typically used by investors to make investment strategy decisions.
• An economic indicators has a timing and directional relationship with the business cycle.
© 2014 Danie Schoeman & Company.
Directional Relationship
• Procyclical indicators move in the same direction as the general economy: they increase when the economy is doing well; decrease when it is doing badly.
• Countercyclical indicators move in the opposite direction to the general economy. The unemployment rate is countercyclic: it rises when the economy is deteriorating.
• Acyclical indicators are those with little or no correlation to the business cycle: they may rise or fall when the general economy is doing well, and may rise or fall when it is not doing well.
© 2014 Danie Schoeman & Company.
Timing Relationship
• Leading indicators are indicators that usually change before the economy as a whole changes. They are therefore useful as short-term predictors of the economy.
• Lagging indicators are indicators that usually change after the economy as a whole does. Typically the lag is a few quarters of a year.
• Coincident indicators change at approximately the same time as the whole economy, thereby providing information about the current state of the economy.
© 2014 Danie Schoeman & Company.
Leading Indicator
65
75
85
95
105
115
125
20
00
-01
20
00
-05
20
00
-09
20
01
-01
20
01
-05
20
01
-09
20
02
-01
20
02
-05
20
02
-09
20
03
-01
20
03
-05
20
03
-09
20
04
-01
20
04
-05
20
04
-09
20
05
-01
20
05
-05
20
05
-09
20
06
-01
20
06
-05
20
06
-09
20
07
-01
20
07
-05
20
07
-09
20
08
-01
20
08
-05
20
08
-09
20
09
-01
20
09
-05
20
09
-09
20
10
-01
20
10
-05
20
10
-09
20
11
-01
20
11
-05
20
11
-09
20
12
-01
20
12
-05
20
12
-09
20
13
-01
20
13
-05
20
13
-09
20
14
-01
Ind
ex: 2
01
0=1
00
Business Cycle Leading indicator
Based on data from SA Reserve Bank (SARB), 2014
© 2014 Danie Schoeman & Company.
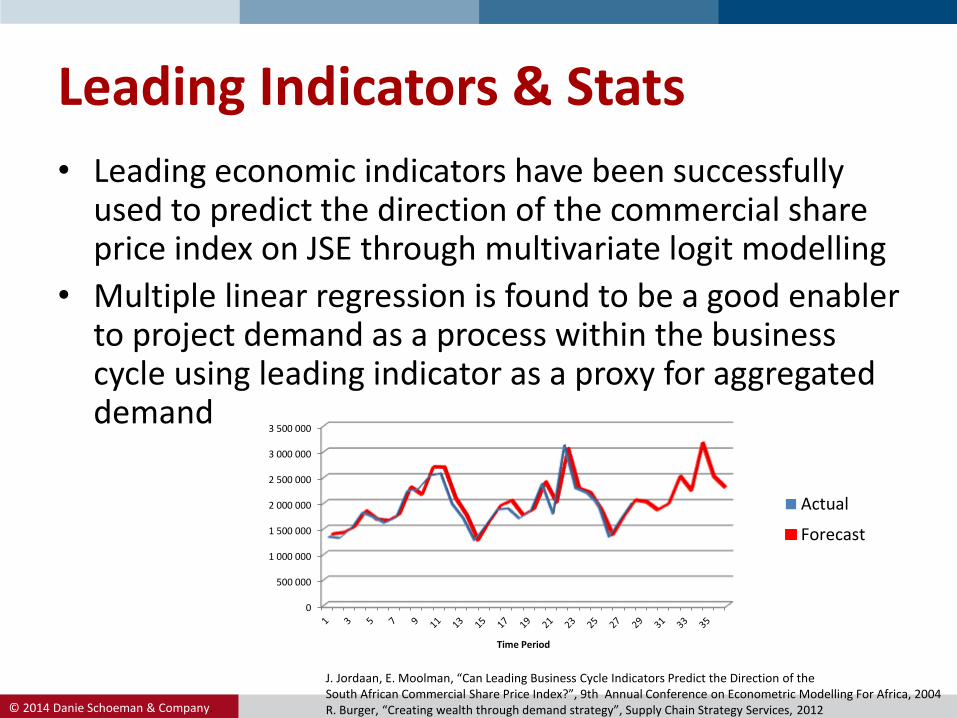
Leading Indicators & Stats
• Leading economic indicators have been successfully used to predict the direction of the commercial share price index on JSE through multivariate logit modelling
• Multiple linear regression is found to be a good enabler to project demand as a process within the business cycle using leading indicator as a proxy for aggregated demand
J. Jordaan, E. Moolman, “Can Leading Business Cycle Indicators Predict the Direction of theSouth African Commercial Share Price Index?”, 9th Annual Conference on Econometric Modelling For Africa, 2004R. Burger, “Creating wealth through demand strategy”, Supply Chain Strategy Services, 2012
0
500 000
1 000 000
1 500 000
2 000 000
2 500 000
3 000 000
3 500 000
Time Period
Actual
Forecast
© 2014 Danie Schoeman & Company.
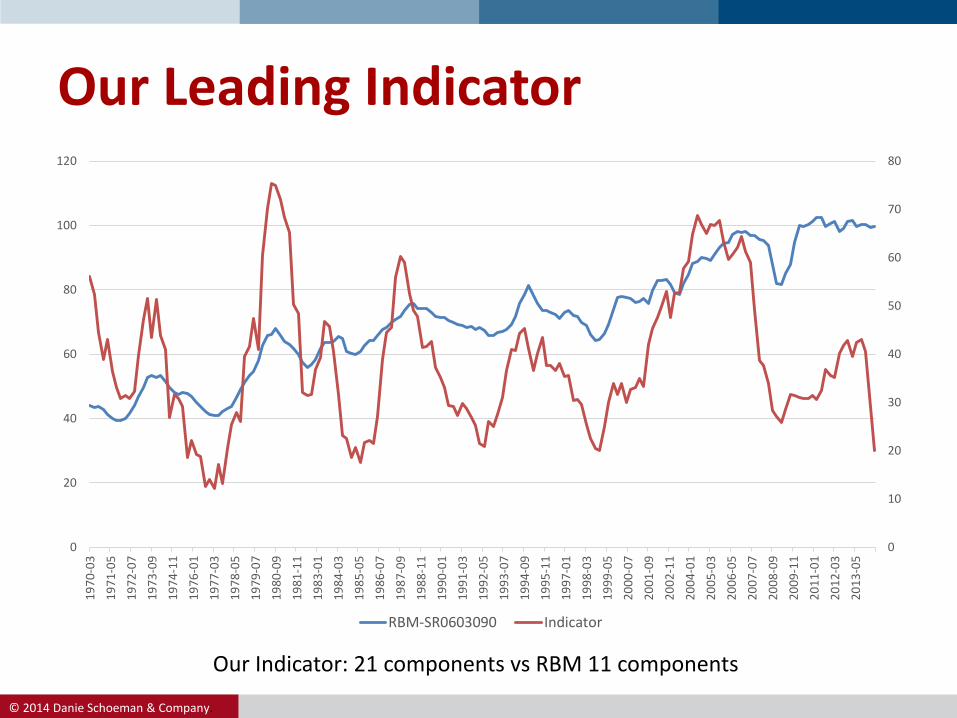
Our Leading Indicator
Our Indicator: 21 components vs RBM 11 components
0
10
20
30
40
50
60
70
80
0
20
40
60
80
100
120
19
70
-03
19
71
-05
19
72
-07
19
73
-09
19
74
-11
19
76
-01
19
77
-03
19
78
-05
19
79
-07
19
80
-09
19
81
-11
19
83
-01
19
84
-03
19
85
-05
19
86
-07
19
87
-09
19
88
-11
19
90
-01
19
91
-03
19
92
-05
19
93
-07
19
94
-09
19
95
-11
19
97
-01
19
98
-03
19
99
-05
20
00
-07
20
01
-09
20
02
-11
20
04
-01
20
05
-03
20
06
-05
20
07
-07
20
08
-09
20
09
-11
20
11
-01
20
12
-03
20
13
-05
RBM-SR0603090 Indicator
© 2014 Danie Schoeman & Company.
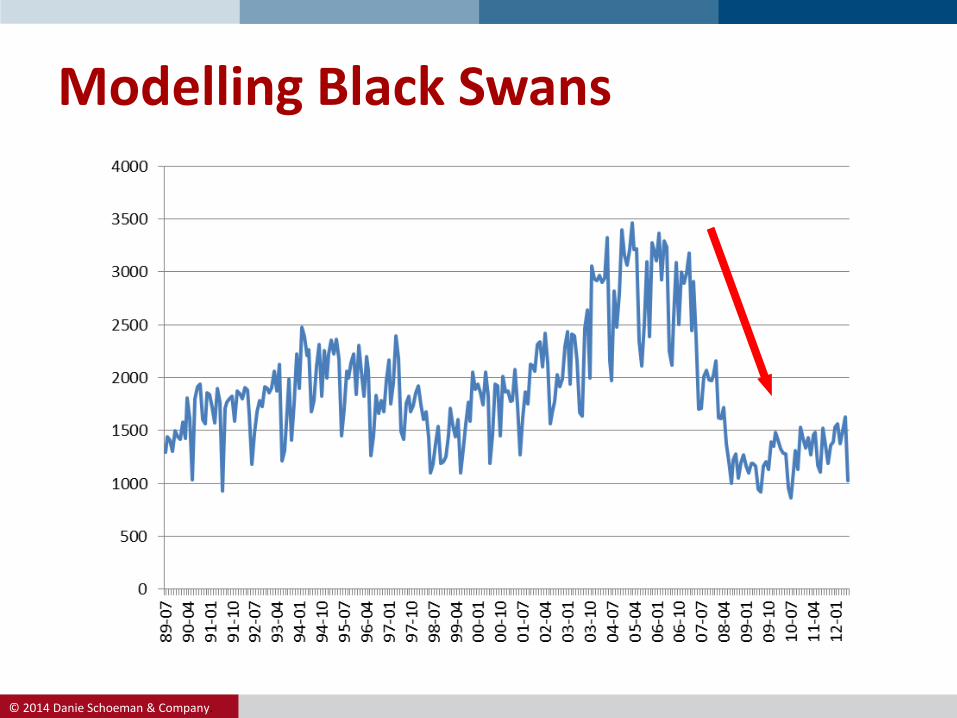
Modelling Black Swans
© 2014 Danie Schoeman & Company.
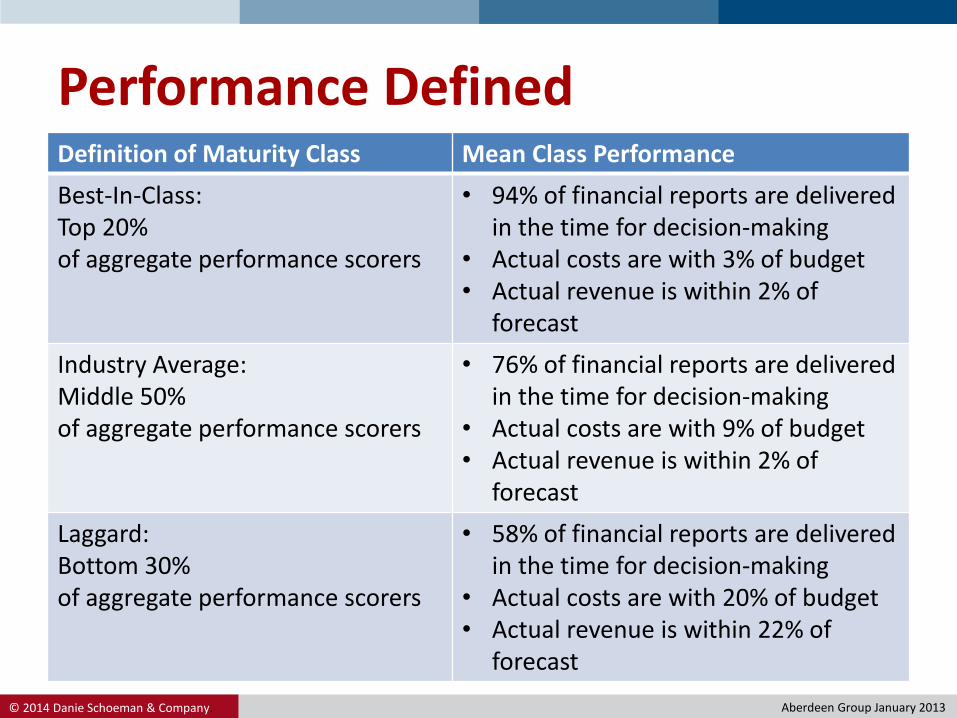
Performance DefinedDefinition of Maturity Class Mean Class Performance
Best-In-Class: Top 20% of aggregate performance scorers
• 94% of financial reports are delivered in the time for decision-making
• Actual costs are with 3% of budget• Actual revenue is within 2% of
forecast
Industry Average:Middle 50%of aggregate performance scorers
• 76% of financial reports are delivered in the time for decision-making
• Actual costs are with 9% of budget• Actual revenue is within 2% of
forecast
Laggard:Bottom 30%of aggregate performance scorers
• 58% of financial reports are delivered in the time for decision-making
• Actual costs are with 20% of budget• Actual revenue is within 22% of
forecast
Aberdeen Group January 2013
© 2014 Danie Schoeman & Company.
Benefits
• The ability to quickly and accurately reforecast in today’s volatile market place.
• The ability to do “what-if scenarios” and change analysis allows a company to consider the potential of certain events, even black swans, and what the resulting effect will be on the business.
• Ability to receive periodic alerts on changes in the business cycle.
• Reduce the overall supply chain’s bull whip by sharing alerts and information across the extended enterprise
• Following Best-In-Class practice gives a margin advantage of 5% over the Industry Average to 13% advantage over the Laggards.

© 2014 Danie Schoeman & Company.
© 2014 Danie Schoeman & Company.
Disclaimer
This document has been prepared by Danie Schoeman and Companyto provide background information on the subjects mentioned herein,the forecasts, opinions and expectations are entirely those of DanieSchoeman and Company. This presentation was prepared with theutmost due care and consideration for accuracy and factualinformation; the forecasts, opinions and expectations are deemed tobe fair and reasonable. However there can be no assurance thatfuture results or events will be consistent with any such forecasts,opinions and expectations. Therefore the authors will not incur anyliability for any loss arising from any use of this presentation or itscontents or otherwise arising in connection herewith. Neither will thesources of information or any other related parties be held responsiblefor any form of action that is taken as a result of the proliferation ofthis document.