vibration measurement systems and ... vibration measurement systems and guidelines for centrifugal...
TRANSCRIPT
Bob Shannon, PE Manager - Design Engineering
Howden Buffalo, Inc.
VIBRATION MEASUREMENT SYSTEMS AND GUIDELINES FOR
CENTRIFUGAL FANS - A FIELD PERSPECTIVE
AMCA International Engineering Conference Las Vegas, NV, USA 2 – 4 March 2008
ENGINEERING PAPER5247-08
1
Vibration Measurement Systems and Guidelines for Centrifugal Fans - A Field Perspective
Robert A. Shannon, PE
Design Engineering Manager Howden Buffalo Inc.
ABSTRACT This paper presents an overview and discussion on vibration measurement systems, transducer types, advantages and disadvantages, and usage guidelines for centrifugal fan applications. The emphasis is on vibration measurement systems from a field perspective considering transducer types and configurations, vibration transmissibility, and typical diagnostic considerations used to quantify vibration severity and fan mechanical condition. INTRODUCTION Regarding the current industrial specifications and codes prescribed for vibration measurement and qualifications for rotating equipment, specifically centrifugal fans, much discussion has ensued as to the most effective and optimal vibration measurement systems for confident and accurate measurement, assessment, and mechanical diagnosis. Comparatively speaking, centrifugal fans typically operate at lower rotative speeds than their rotating equipment counterparts, such as industrial steam and gas turbines and centrifugal compressors. Centrifugal fans, however, represent a classification of rotating equipment that embody unique mechanical designs, operating applications, and engineering features which are susceptible to a wide variety of vibration problems in the field. VIBRATION THRESHOLDS When a fan vibration monitoring and analysis program uses overall vibration readings for periodic measurements, it is important to identify what normal levels of vibration are and what levels indicate significant problems or impending failure (thresholds). It is a fact that the vast majority of centrifugal fans, and other classifications of rotating machinery have generally similar overall vibration levels that indicate their mechanical condition. Unfortunately, it is also true that there are so many exceptions to the general rule and so many variables affecting how failure develops that is it not possible to provide a single set of limits that apply to all machines. There are six possible sources of information concerning acceptable and unacceptable vibration levels for particular fans and applications. These are:
• Fan Manufacturer’s specifications • Bearing clearance limitations
2
• Industry standards
• General vibration severity guidelines
• Comparison of similar fan applications
• Long-term observation
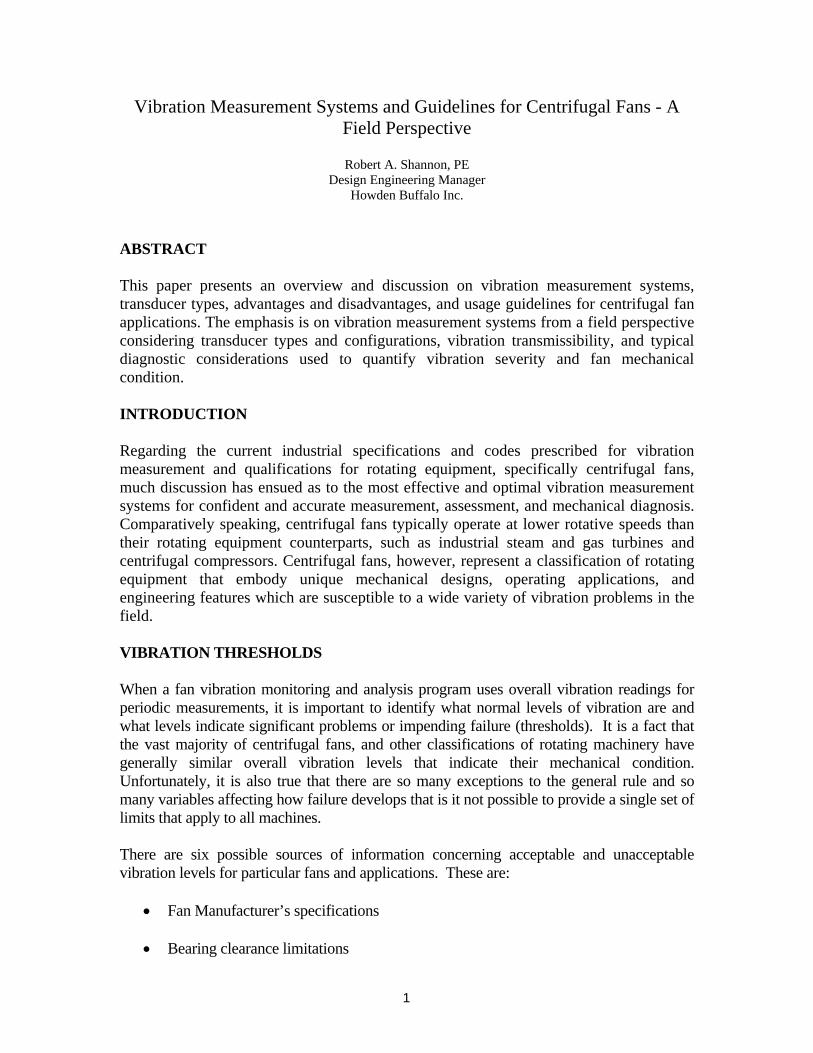
Manufacturer's vibration specifications are an excellent source of information, but are not always available. Industry standards generally apply to types of similar machines or components and are less specific than manufacturer's data. General vibration severity guidelines are the broadest and most general reference, but they provide a valid starting point if nothing more specific is available. A typical set of general vibration severity guidelines is shown in Figure 1.
VIBRATION VELOCITY
(Inches/Second Peak)
0 - .005 In/Sec EXTREMELY SMOOTH
.005 - .01 In/Sec VERY SMOOTH
.01 - .02 In/Sec SMOOTH
.02 - .04 In/Sec VERY GOOD
.04 - .08 In/Sec GOOD
.08 - .16 In/Sec FAIR
.16 - .32 In/Sec SLIGHTLY ROUGH
.32 - .64 In/Sec ROUGH
Above .64 In/Sec VERY ROUGH
Figure 1. Vibration Severity Guidelines Comparing vibration levels of several identical fans provides a very good indication of normal vibration levels. Long-term observation of the performance of each fan is the best basis for establishing acceptable and unacceptable vibration levels. No matter what method is used initially to establish these thresholds, experience and observation will ultimately determine the most accurate and useful threshold levels.
3
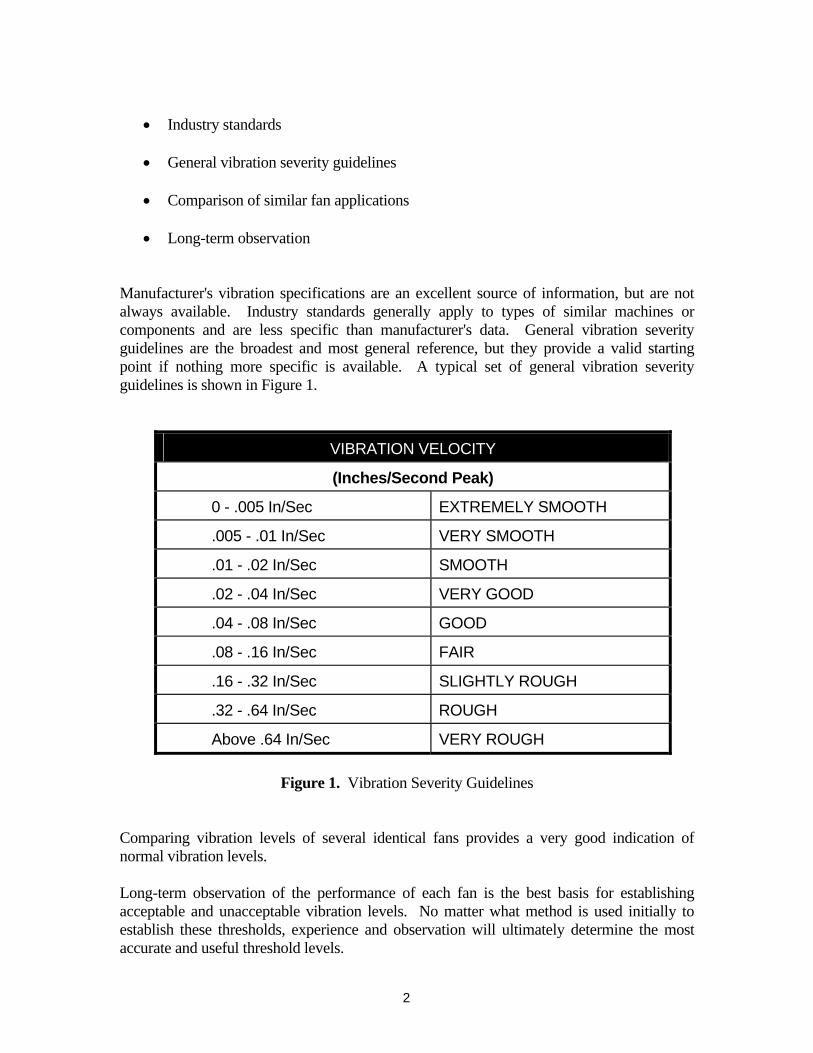
Once normal operation vibration levels are established, the next question is How high should the alarm levels be set? As a general and practical rule-of-thumb, a vibration level of twice the nominal established level, or that which exceeds 40-45% of the allowable diametral bearing clearance (sleeve bearings) should be considered the warning threshold for further investigation and problem diagnosis. Depending on the manufacturer, operation conditions, bearing clearances, and mechanical configuration, two to three times the normal level might be considered the threshold for immediate shutdown to avoid severe damage. While the preceding discussion has covered overall vibration levels, the same approach can be applied to vibrations at specific frequencies. If manufacturer’s specifications or other initial guidance are not available, there are general vibration severity charts that include frequency. Examples are shown in Figures 2 and 3. Some include converted vibration measurements between displacement, velocity, and acceleration for specific frequency ranges and severity classifications. Here again, experience and observation are the ultimate indicators of the best values to use.
Figure 2. Vibration Severity Chart [DLI]
4
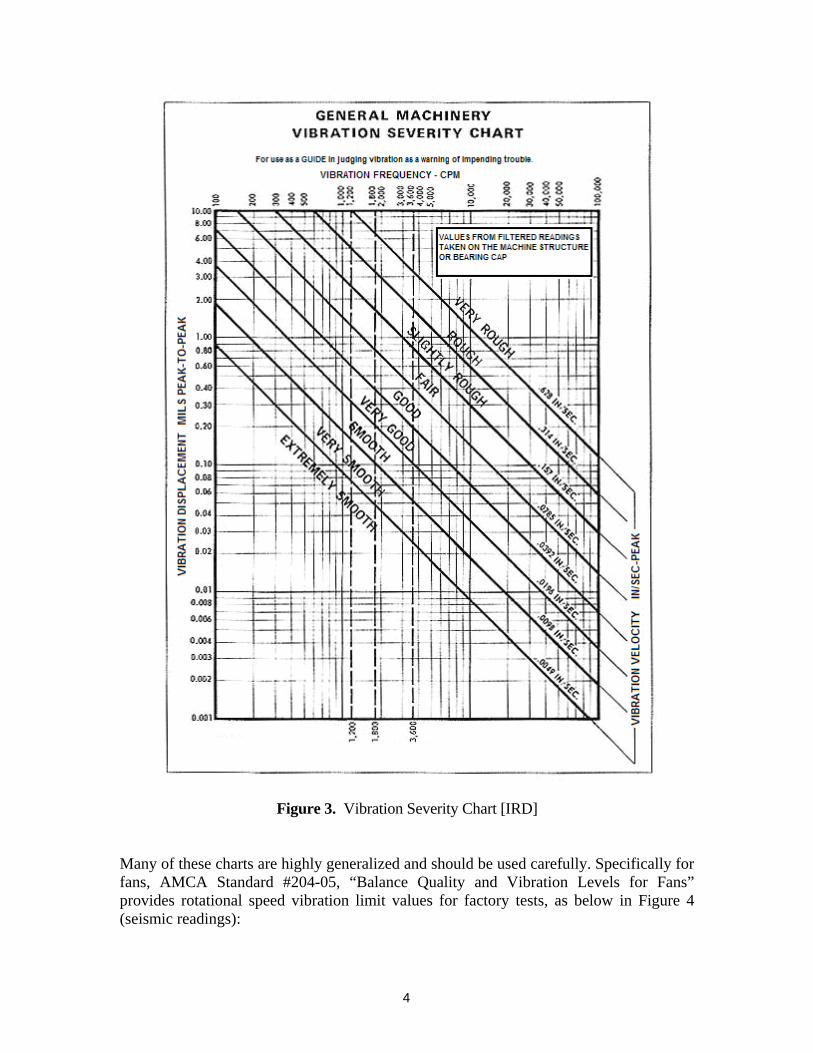
Figure 3. Vibration Severity Chart [IRD] Many of these charts are highly generalized and should be used carefully. Specifically for fans, AMCA Standard #204-05, “Balance Quality and Vibration Levels for Fans” provides rotational speed vibration limit values for factory tests, as below in Figure 4 (seismic readings):
5
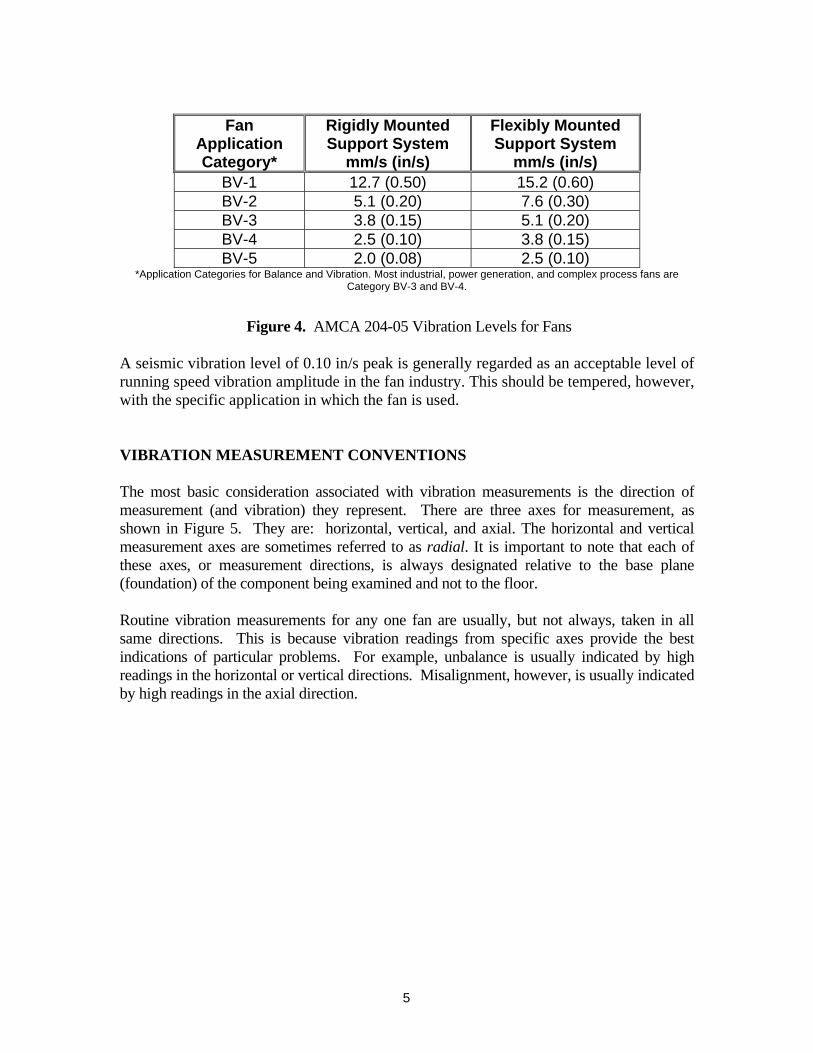
Fan
Application Category*
Rigidly Mounted Support System
mm/s (in/s)
Flexibly Mounted Support System
mm/s (in/s) BV-1 12.7 (0.50) 15.2 (0.60) BV-2 5.1 (0.20) 7.6 (0.30) BV-3 3.8 (0.15) 5.1 (0.20) BV-4 2.5 (0.10) 3.8 (0.15) BV-5 2.0 (0.08) 2.5 (0.10)
*Application Categories for Balance and Vibration. Most industrial, power generation, and complex process fans are Category BV-3 and BV-4.
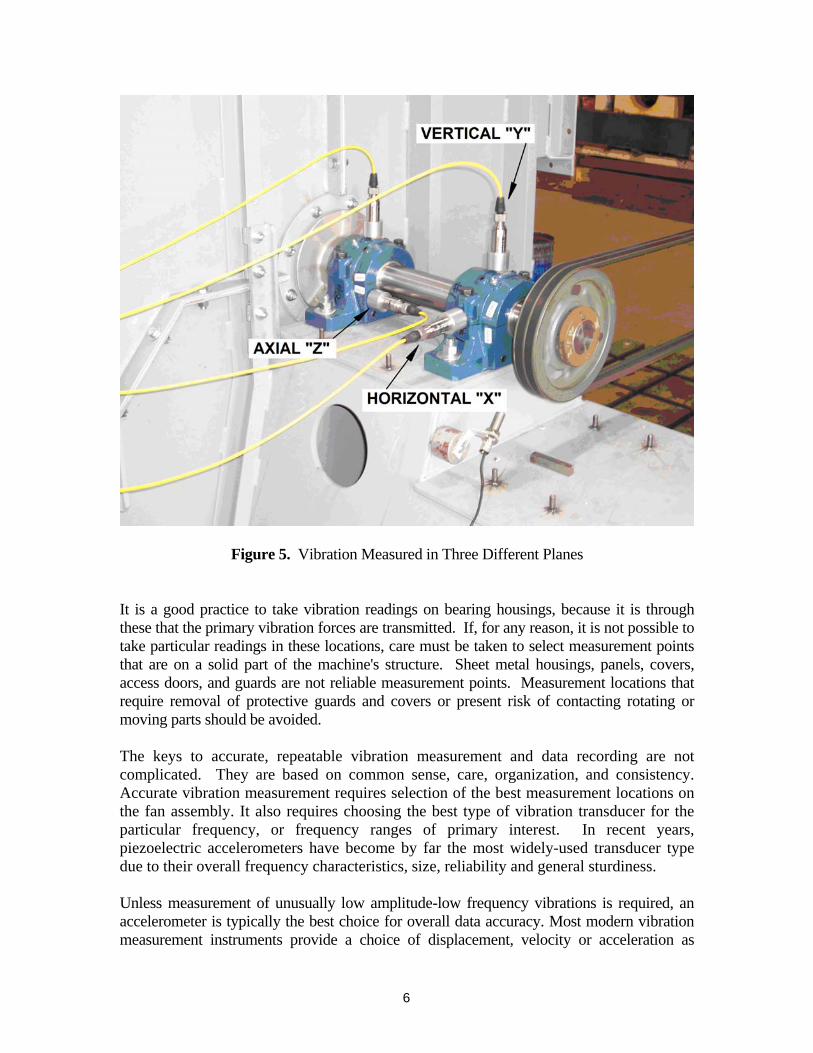
Figure 4. AMCA 204-05 Vibration Levels for Fans A seismic vibration level of 0.10 in/s peak is generally regarded as an acceptable level of running speed vibration amplitude in the fan industry. This should be tempered, however, with the specific application in which the fan is used. VIBRATION MEASUREMENT CONVENTIONS The most basic consideration associated with vibration measurements is the direction of measurement (and vibration) they represent. There are three axes for measurement, as shown in Figure 5. They are: horizontal, vertical, and axial. The horizontal and vertical measurement axes are sometimes referred to as radial. It is important to note that each of these axes, or measurement directions, is always designated relative to the base plane (foundation) of the component being examined and not to the floor. Routine vibration measurements for any one fan are usually, but not always, taken in all same directions. This is because vibration readings from specific axes provide the best indications of particular problems. For example, unbalance is usually indicated by high readings in the horizontal or vertical directions. Misalignment, however, is usually indicated by high readings in the axial direction.
6
Figure 5. Vibration Measured in Three Different Planes It is a good practice to take vibration readings on bearing housings, because it is through these that the primary vibration forces are transmitted. If, for any reason, it is not possible to take particular readings in these locations, care must be taken to select measurement points that are on a solid part of the machine's structure. Sheet metal housings, panels, covers, access doors, and guards are not reliable measurement points. Measurement locations that require removal of protective guards and covers or present risk of contacting rotating or moving parts should be avoided. The keys to accurate, repeatable vibration measurement and data recording are not complicated. They are based on common sense, care, organization, and consistency. Accurate vibration measurement requires selection of the best measurement locations on the fan assembly. It also requires choosing the best type of vibration transducer for the particular frequency, or frequency ranges of primary interest. In recent years, piezoelectric accelerometers have become by far the most widely-used transducer type due to their overall frequency characteristics, size, reliability and general sturdiness. Unless measurement of unusually low amplitude-low frequency vibrations is required, an accelerometer is typically the best choice for overall data accuracy. Most modern vibration measurement instruments provide a choice of displacement, velocity or acceleration as
7
vibration measurement parameters, independent of the type of transducer being used. It is desirable, for accuracy, to use the parameter that gives the best (flattest) response across the frequency range of interest. It turns out that, in general, velocity is the best choice as the parameter for machine vibration measurement. The most common exception to this rule is use of acceleration at higher frequencies to detect problems with specific components such as roller bearings. How the vibration transducer is applied to the measurement point is another critical aspect of vibration measurement accuracy. The more firmly the transducer is coupled to the machine the better its response will be. Figure 6 gives an example of the frequency limitations associated with various transducer mounting methods for a particular accelerometer. From a practical standpoint, the best attachment method--a threaded stud--is not often used because setting up and using it can be expensive and time-consuming. When using magnetic or hand-held (without probe) mountings the mounting surface should be flat and smooth, with a light coating of silicone grease at the contact area to ensure accuracy.
Accelerometer Upper Frequency Unit
Threaded Stud, or Bolted On 600,000 CPM
Magnetic Holder 120,000 CPM
Hand-held without Probe 90,000 CPM
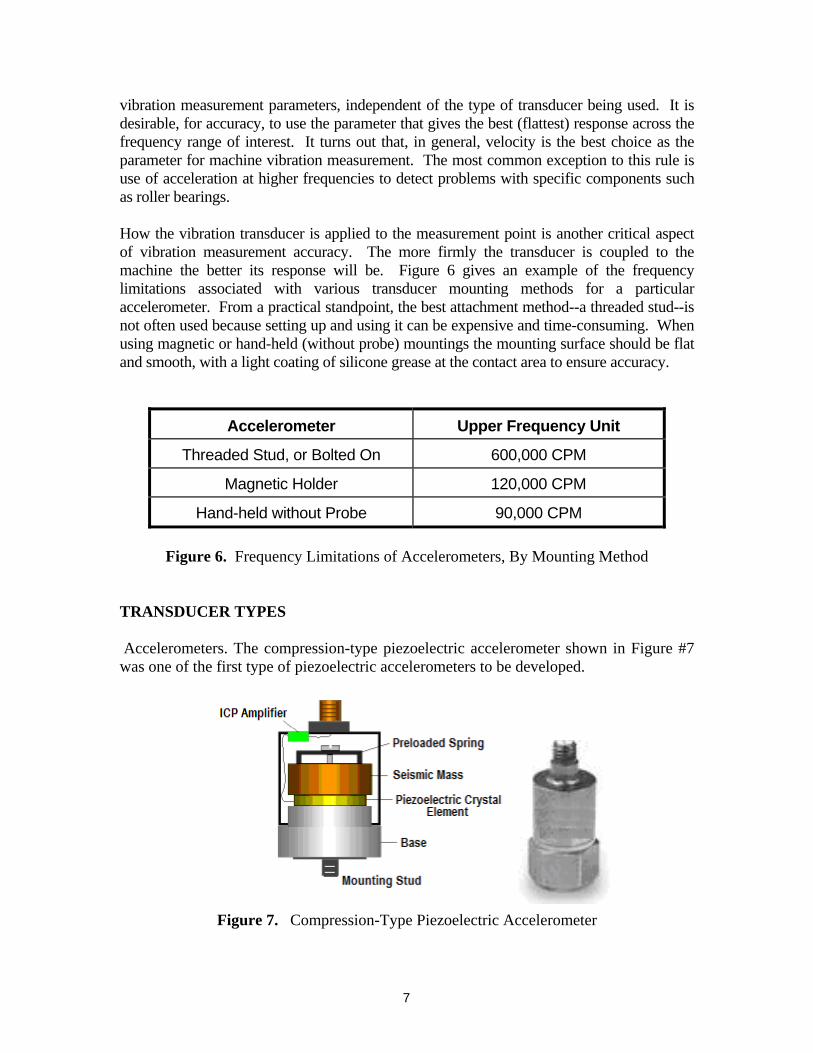
Figure 6. Frequency Limitations of Accelerometers, By Mounting Method TRANSDUCER TYPES Accelerometers. The compression-type piezoelectric accelerometer shown in Figure #7 was one of the first type of piezoelectric accelerometers to be developed.
Figure 7. Compression-Type Piezoelectric Accelerometer
8
There are also other designs for accelerometers. Shear-type accelerometers have an active piezoelectric crystal oriented to deform in a shear plane, and are often preferred for higher sensitivity acceleration measurements where significant base distortion is anticipated from large thermal transients or where they are mounted on flexible structures. The piezoelectric accelerometer has been widely considered the standard vibration transducer for machine vibration measurement. The configuration of the piezoelectric crystal and seismic mass depend on the transducer frequency range output desired. The seismic mass is clamped to the base by an axial bolt bearing down on a circular spring. The piezoelectric (crystal) element is squeezed between the mass and the base. When a piezoelectric material experiences a force, it generates an electric charge between its surfaces. There are many such materials, with quartz being one of the most commonly used. Synthetic ceramic piezo materials have recently been developed for applications at high temperatures. If the temperature of a piezo material is increased to its curie temperature, the piezoelectric property is lost and the transducer will be defective and not repairable. When the accelerometer is displaced in primary measurement direction axis, the force required to move the seismic mass is born by the active piezoelectric element. Per Newton's second law, this force is proportional to the acceleration of the mass. The force on the crystal produces the output signal, which is therefore proportional to the acceleration of the transducer. Because of the linear response of the piezoelectric crystal, accelerometers have a very large dynamic range. The smallest acceleration levels they can sense are determined only by the electrical noise of the electronics, and the highest levels are limited only by the destruction of the piezoelectric element itself. Accelerometers are thus favored for their superior performance. The piezoelectric accelerometer is constructed to be quite stable over long periods of time, and will maintain its calibration if it is not abused. Accelerometers can be damaged by excessive temperatures and shock loading. To insure that the internal crystal is not cracked or damaged, accelerometers should be calibrated annually when used in service with temporary or portable data acquisition systems. A small crack will cause the sensitivity to be reduced and also will greatly affect the resonance, and thus the frequency response. Accelerometers that have damaged crystals cannot generally be repaired or refurbished. The frequency range of the accelerometer is very wide, extending from very low frequencies in some units to several tens of kilohertz. The high-frequency response is limited by the resonance of the seismic mass coupled to the springiness of the piezo element. This resonance produces a very high peak in the response at the natural frequency of the transducer, and this is usually somewhere near 30 kHz for commonly used accelerometers. A rule of thumb is that an accelerometer is usable up to about 1/3 of its natural frequency. Data above this frequency will be accentuated by the resonant
9
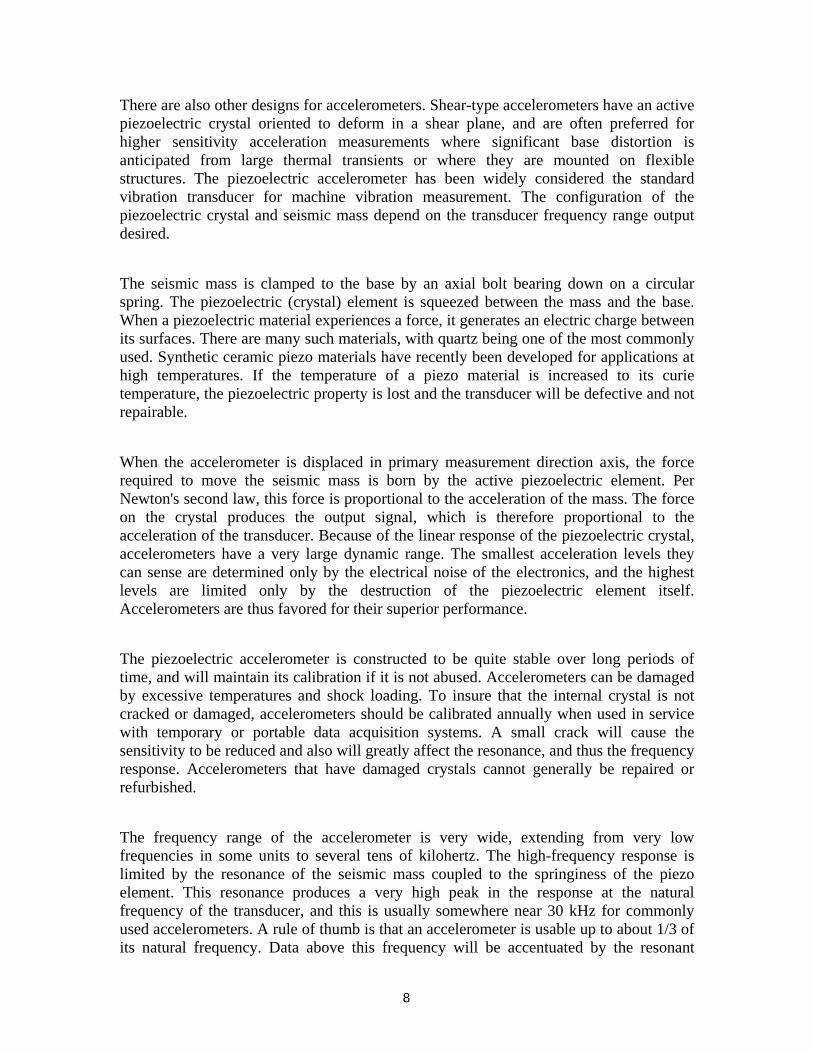
response, but may be used if the effect is taken into consideration. The typical frequency response of a piezoelectric accelerometer is shown in Figure 8.
Figure 8. Typical Accelerometer Frequency Response Curve
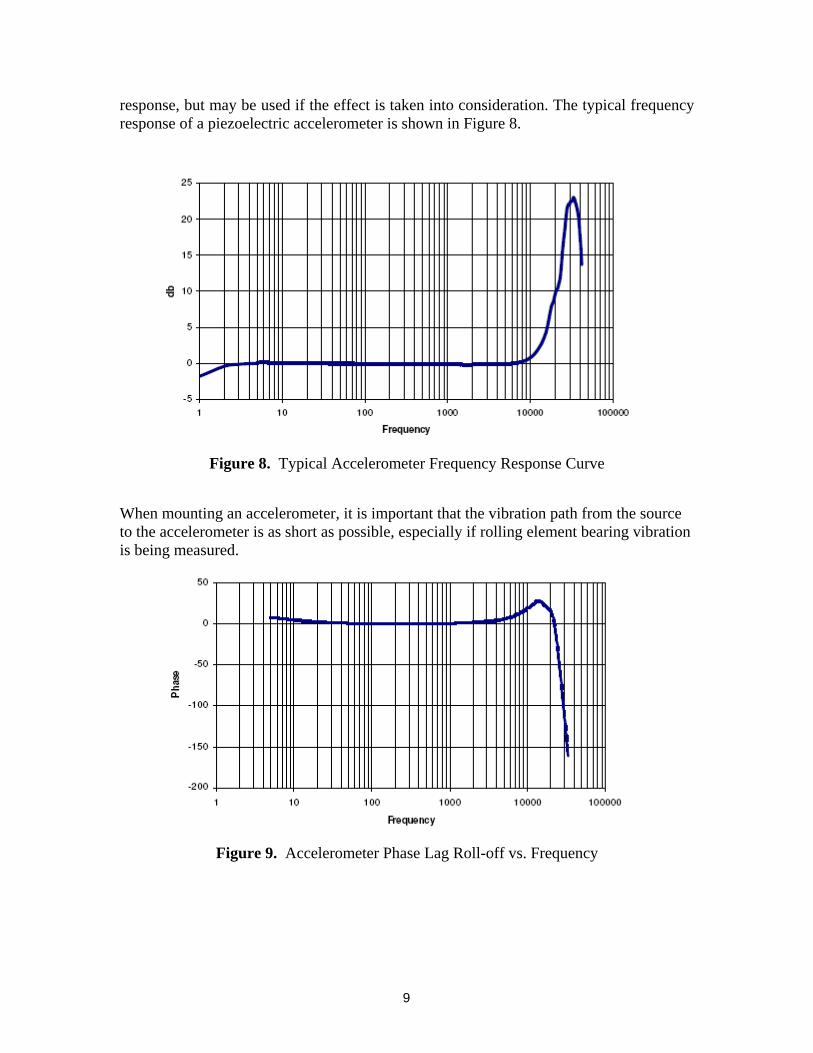
When mounting an accelerometer, it is important that the vibration path from the source to the accelerometer is as short as possible, especially if rolling element bearing vibration is being measured.
Figure 9. Accelerometer Phase Lag Roll-off vs. Frequency
10
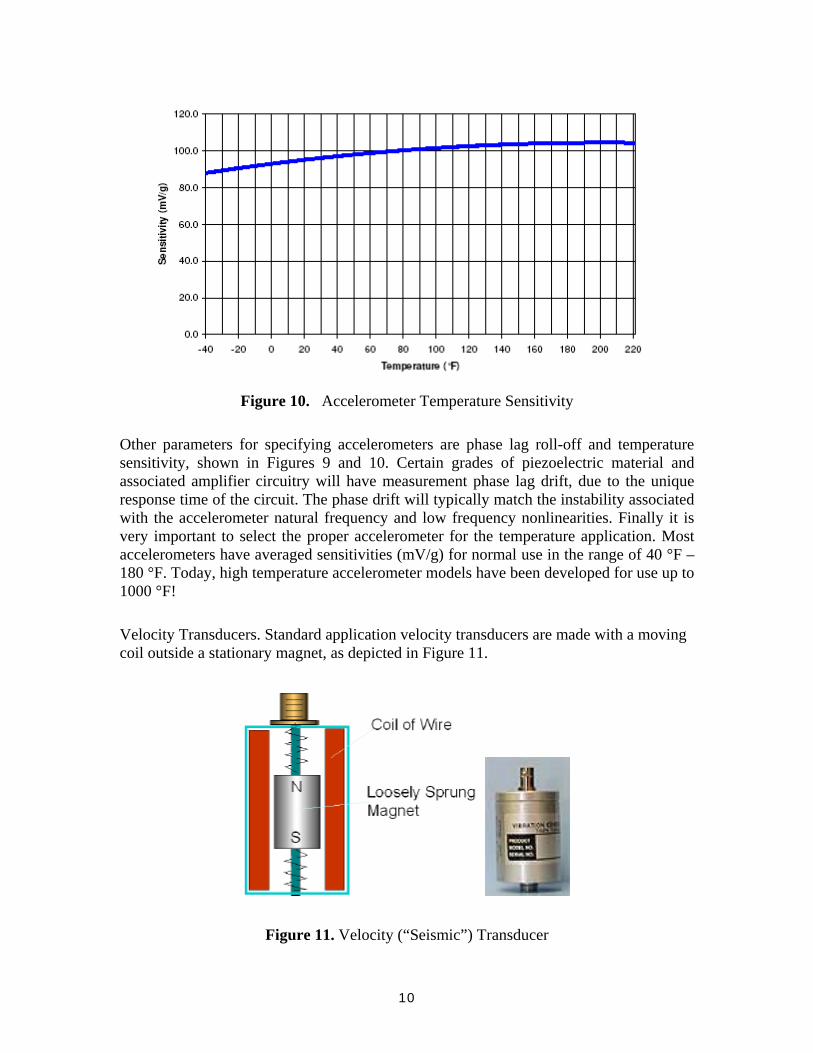
Figure 10. Accelerometer Temperature Sensitivity
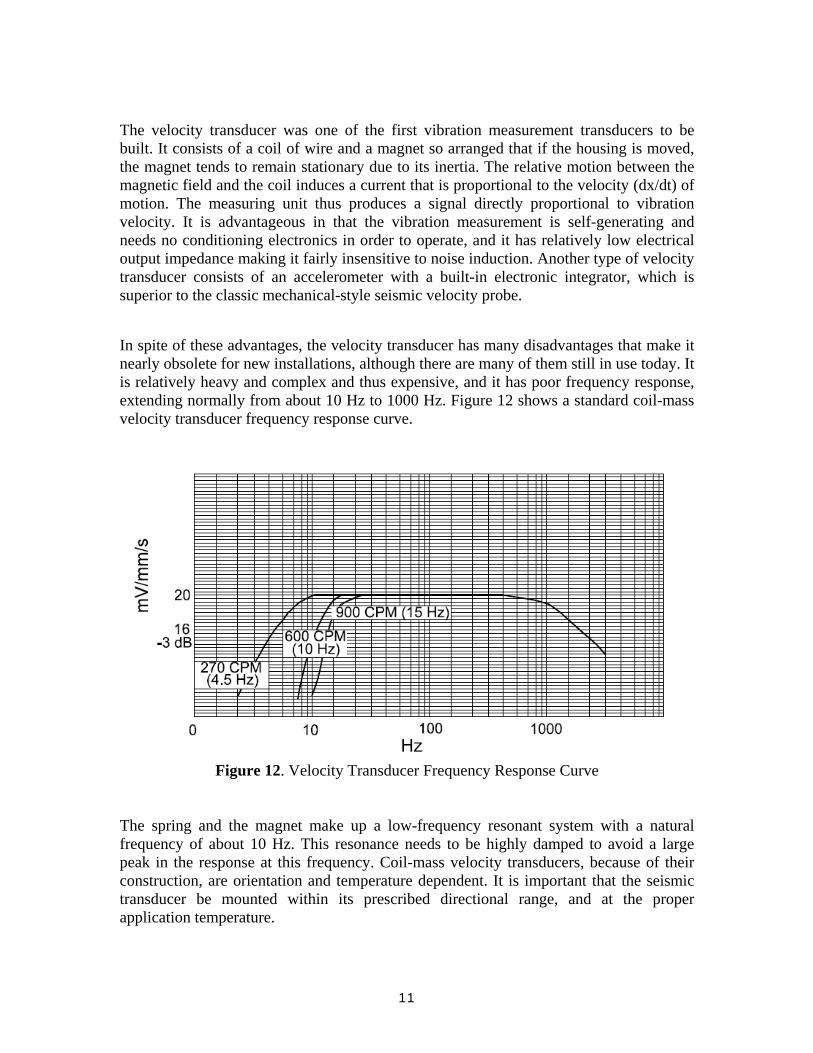
Other parameters for specifying accelerometers are phase lag roll-off and temperature sensitivity, shown in Figures 9 and 10. Certain grades of piezoelectric material and associated amplifier circuitry will have measurement phase lag drift, due to the unique response time of the circuit. The phase drift will typically match the instability associated with the accelerometer natural frequency and low frequency nonlinearities. Finally it is very important to select the proper accelerometer for the temperature application. Most accelerometers have averaged sensitivities (mV/g) for normal use in the range of 40 °F – 180 °F. Today, high temperature accelerometer models have been developed for use up to 1000 °F! Velocity Transducers. Standard application velocity transducers are made with a moving coil outside a stationary magnet, as depicted in Figure 11.
Figure 11. Velocity (“Seismic”) Transducer
11
The velocity transducer was one of the first vibration measurement transducers to be built. It consists of a coil of wire and a magnet so arranged that if the housing is moved, the magnet tends to remain stationary due to its inertia. The relative motion between the magnetic field and the coil induces a current that is proportional to the velocity (dx/dt) of motion. The measuring unit thus produces a signal directly proportional to vibration velocity. It is advantageous in that the vibration measurement is self-generating and needs no conditioning electronics in order to operate, and it has relatively low electrical output impedance making it fairly insensitive to noise induction. Another type of velocity transducer consists of an accelerometer with a built-in electronic integrator, which is superior to the classic mechanical-style seismic velocity probe. In spite of these advantages, the velocity transducer has many disadvantages that make it nearly obsolete for new installations, although there are many of them still in use today. It is relatively heavy and complex and thus expensive, and it has poor frequency response, extending normally from about 10 Hz to 1000 Hz. Figure 12 shows a standard coil-mass velocity transducer frequency response curve.
Figure 12. Velocity Transducer Frequency Response Curve
The spring and the magnet make up a low-frequency resonant system with a natural frequency of about 10 Hz. This resonance needs to be highly damped to avoid a large peak in the response at this frequency. Coil-mass velocity transducers, because of their construction, are orientation and temperature dependent. It is important that the seismic transducer be mounted within its prescribed directional range, and at the proper application temperature.
12
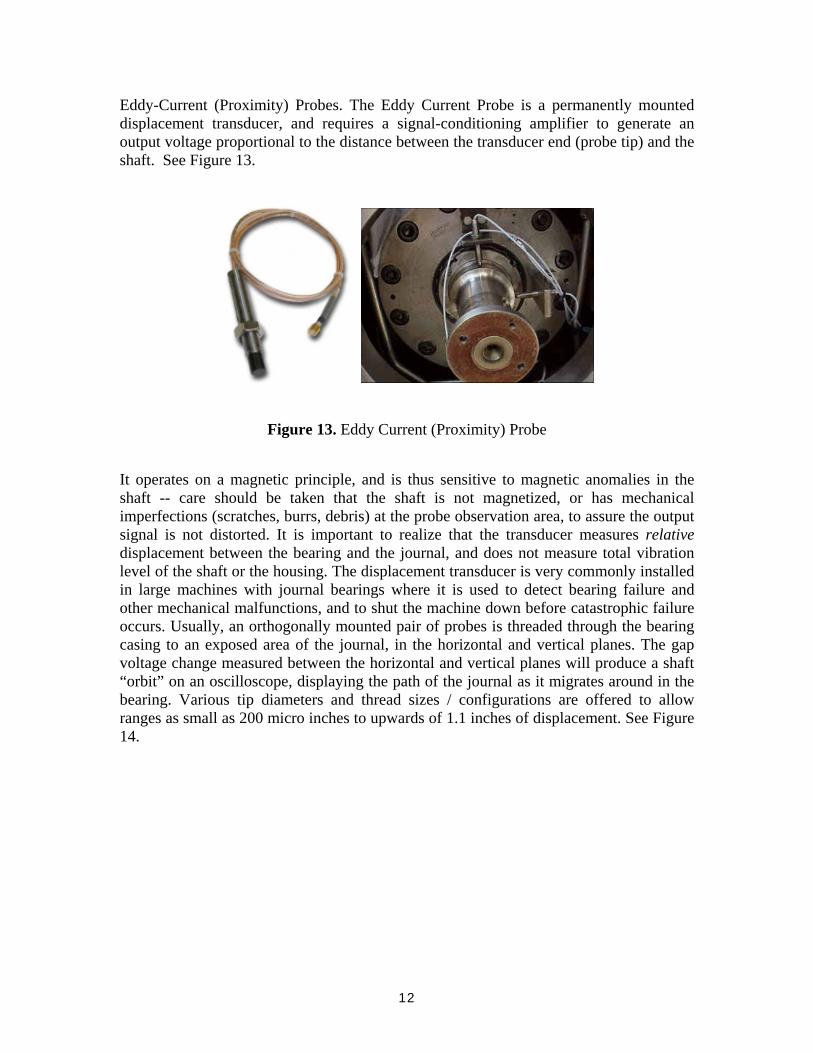
Eddy-Current (Proximity) Probes. The Eddy Current Probe is a permanently mounted displacement transducer, and requires a signal-conditioning amplifier to generate an output voltage proportional to the distance between the transducer end (probe tip) and the shaft. See Figure 13.
Figure 13. Eddy Current (Proximity) Probe It operates on a magnetic principle, and is thus sensitive to magnetic anomalies in the shaft -- care should be taken that the shaft is not magnetized, or has mechanical imperfections (scratches, burrs, debris) at the probe observation area, to assure the output signal is not distorted. It is important to realize that the transducer measures relative displacement between the bearing and the journal, and does not measure total vibration level of the shaft or the housing. The displacement transducer is very commonly installed in large machines with journal bearings where it is used to detect bearing failure and other mechanical malfunctions, and to shut the machine down before catastrophic failure occurs. Usually, an orthogonally mounted pair of probes is threaded through the bearing casing to an exposed area of the journal, in the horizontal and vertical planes. The gap voltage change measured between the horizontal and vertical planes will produce a shaft “orbit” on an oscilloscope, displaying the path of the journal as it migrates around in the bearing. Various tip diameters and thread sizes / configurations are offered to allow ranges as small as 200 micro inches to upwards of 1.1 inches of displacement. See Figure 14.
13
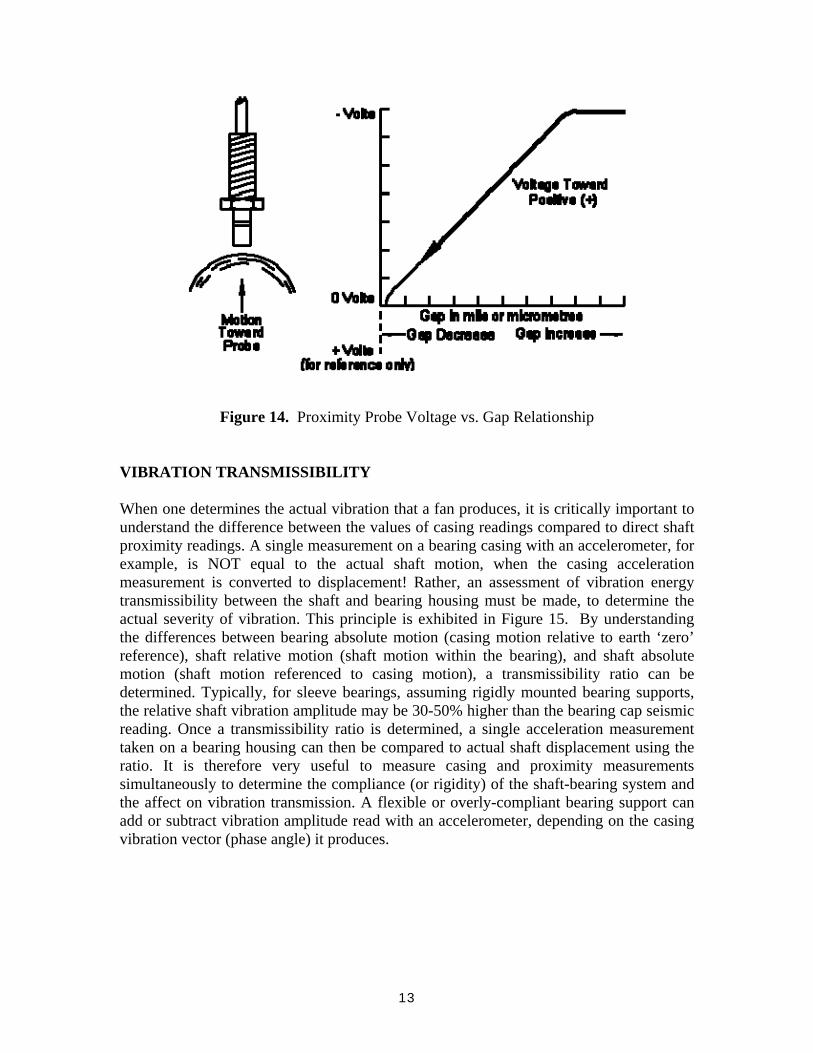
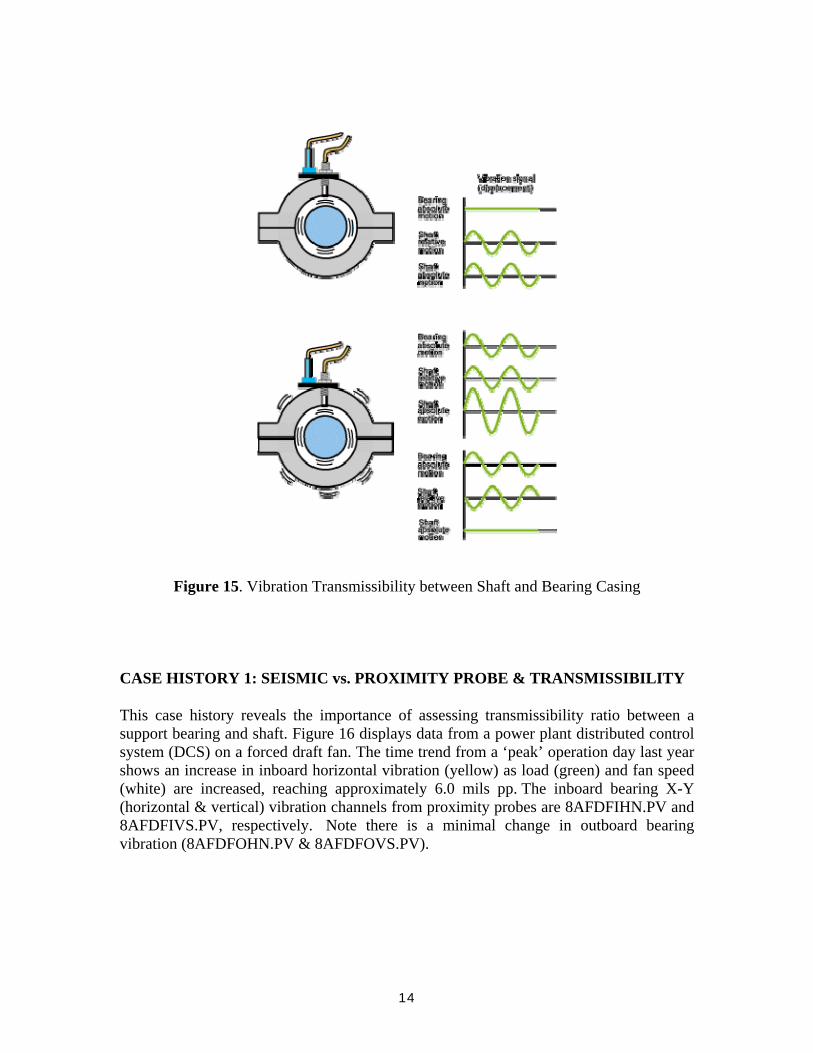
Figure 14. Proximity Probe Voltage vs. Gap Relationship VIBRATION TRANSMISSIBILITY When one determines the actual vibration that a fan produces, it is critically important to understand the difference between the values of casing readings compared to direct shaft proximity readings. A single measurement on a bearing casing with an accelerometer, for example, is NOT equal to the actual shaft motion, when the casing acceleration measurement is converted to displacement! Rather, an assessment of vibration energy transmissibility between the shaft and bearing housing must be made, to determine the actual severity of vibration. This principle is exhibited in Figure 15. By understanding the differences between bearing absolute motion (casing motion relative to earth ‘zero’ reference), shaft relative motion (shaft motion within the bearing), and shaft absolute motion (shaft motion referenced to casing motion), a transmissibility ratio can be determined. Typically, for sleeve bearings, assuming rigidly mounted bearing supports, the relative shaft vibration amplitude may be 30-50% higher than the bearing cap seismic reading. Once a transmissibility ratio is determined, a single acceleration measurement taken on a bearing housing can then be compared to actual shaft displacement using the ratio. It is therefore very useful to measure casing and proximity measurements simultaneously to determine the compliance (or rigidity) of the shaft-bearing system and the affect on vibration transmission. A flexible or overly-compliant bearing support can add or subtract vibration amplitude read with an accelerometer, depending on the casing vibration vector (phase angle) it produces.
14
Figure 15. Vibration Transmissibility between Shaft and Bearing Casing CASE HISTORY 1: SEISMIC vs. PROXIMITY PROBE & TRANSMISSIBILITY
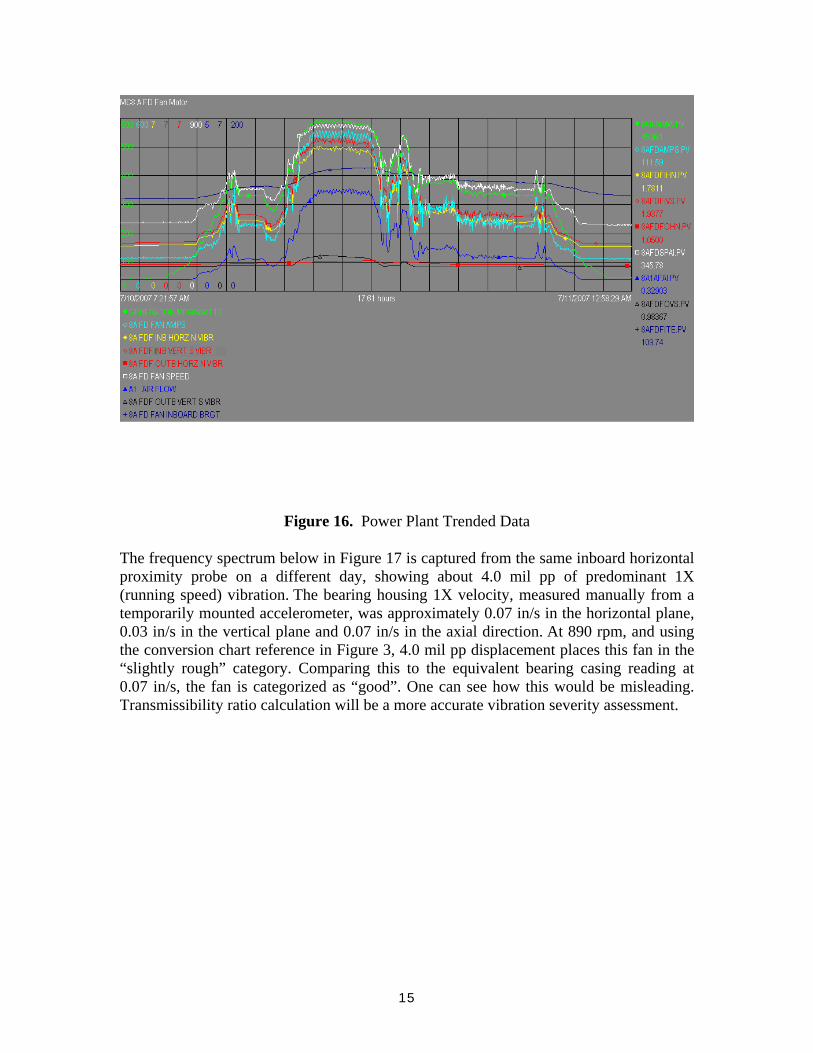
This case history reveals the importance of assessing transmissibility ratio between a support bearing and shaft. Figure 16 displays data from a power plant distributed control system (DCS) on a forced draft fan. The time trend from a ‘peak’ operation day last year shows an increase in inboard horizontal vibration (yellow) as load (green) and fan speed (white) are increased, reaching approximately 6.0 mils pp. The inboard bearing X-Y (horizontal & vertical) vibration channels from proximity probes are 8AFDFIHN.PV and 8AFDFIVS.PV, respectively. Note there is a minimal change in outboard bearing vibration (8AFDFOHN.PV & 8AFDFOVS.PV).
15
Figure 16. Power Plant Trended Data
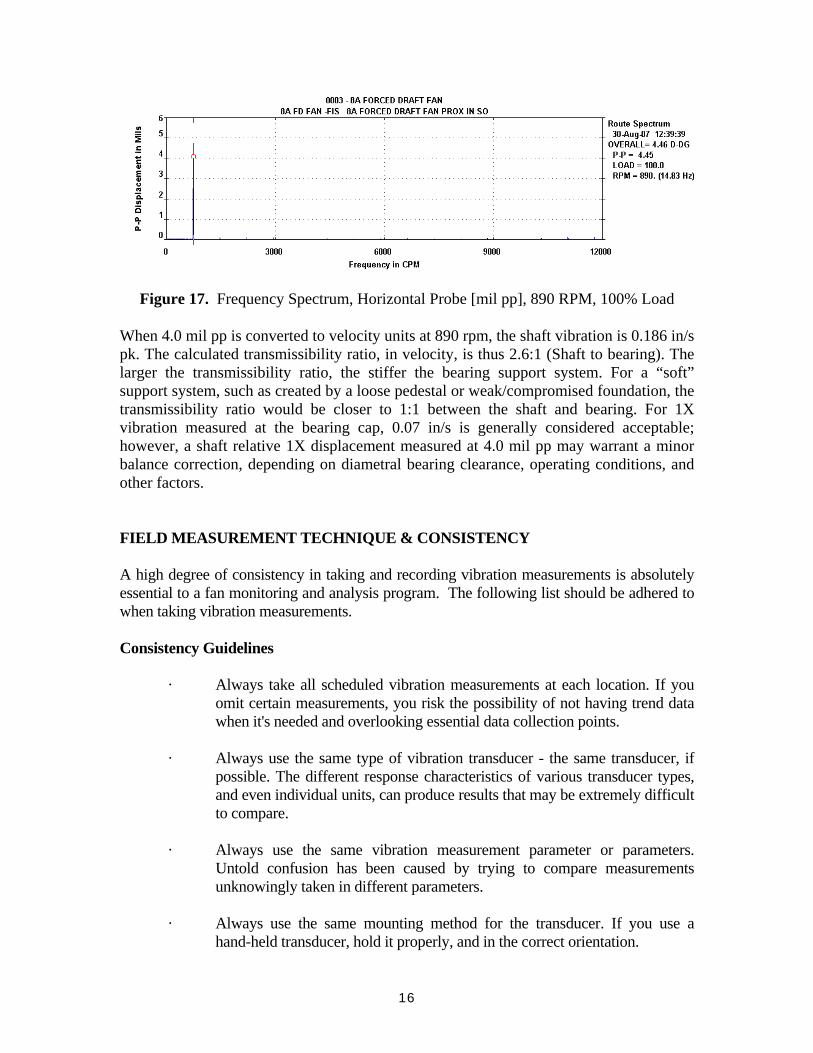
The frequency spectrum below in Figure 17 is captured from the same inboard horizontal proximity probe on a different day, showing about 4.0 mil pp of predominant 1X (running speed) vibration. The bearing housing 1X velocity, measured manually from a temporarily mounted accelerometer, was approximately 0.07 in/s in the horizontal plane, 0.03 in/s in the vertical plane and 0.07 in/s in the axial direction. At 890 rpm, and using the conversion chart reference in Figure 3, 4.0 mil pp displacement places this fan in the “slightly rough” category. Comparing this to the equivalent bearing casing reading at 0.07 in/s, the fan is categorized as “good”. One can see how this would be misleading. Transmissibility ratio calculation will be a more accurate vibration severity assessment.
16
Figure 17. Frequency Spectrum, Horizontal Probe [mil pp], 890 RPM, 100% Load
When 4.0 mil pp is converted to velocity units at 890 rpm, the shaft vibration is 0.186 in/s pk. The calculated transmissibility ratio, in velocity, is thus 2.6:1 (Shaft to bearing). The larger the transmissibility ratio, the stiffer the bearing support system. For a “soft” support system, such as created by a loose pedestal or weak/compromised foundation, the transmissibility ratio would be closer to 1:1 between the shaft and bearing. For 1X vibration measured at the bearing cap, 0.07 in/s is generally considered acceptable; however, a shaft relative 1X displacement measured at 4.0 mil pp may warrant a minor balance correction, depending on diametral bearing clearance, operating conditions, and other factors.
FIELD MEASUREMENT TECHNIQUE & CONSISTENCY A high degree of consistency in taking and recording vibration measurements is absolutely essential to a fan monitoring and analysis program. The following list should be adhered to when taking vibration measurements. Consistency Guidelines · Always take all scheduled vibration measurements at each location. If you
omit certain measurements, you risk the possibility of not having trend data when it's needed and overlooking essential data collection points.
· Always use the same type of vibration transducer - the same transducer, if
possible. The different response characteristics of various transducer types, and even individual units, can produce results that may be extremely difficult to compare.
· Always use the same vibration measurement parameter or parameters.
Untold confusion has been caused by trying to compare measurements unknowingly taken in different parameters.
· Always use the same mounting method for the transducer. If you use a
hand-held transducer, hold it properly, and in the correct orientation.
17
· Always take vibration measurements at exactly the same point on the fan
machine train. If a fixed mount, such as a stud, is not used, the measurement point should be marked with paint or a specially- identified marker.
· Always take vibration measurement under the same machine operating
conditions. Again, if this is not done, it may be difficult, if not impossible, to compare the results.
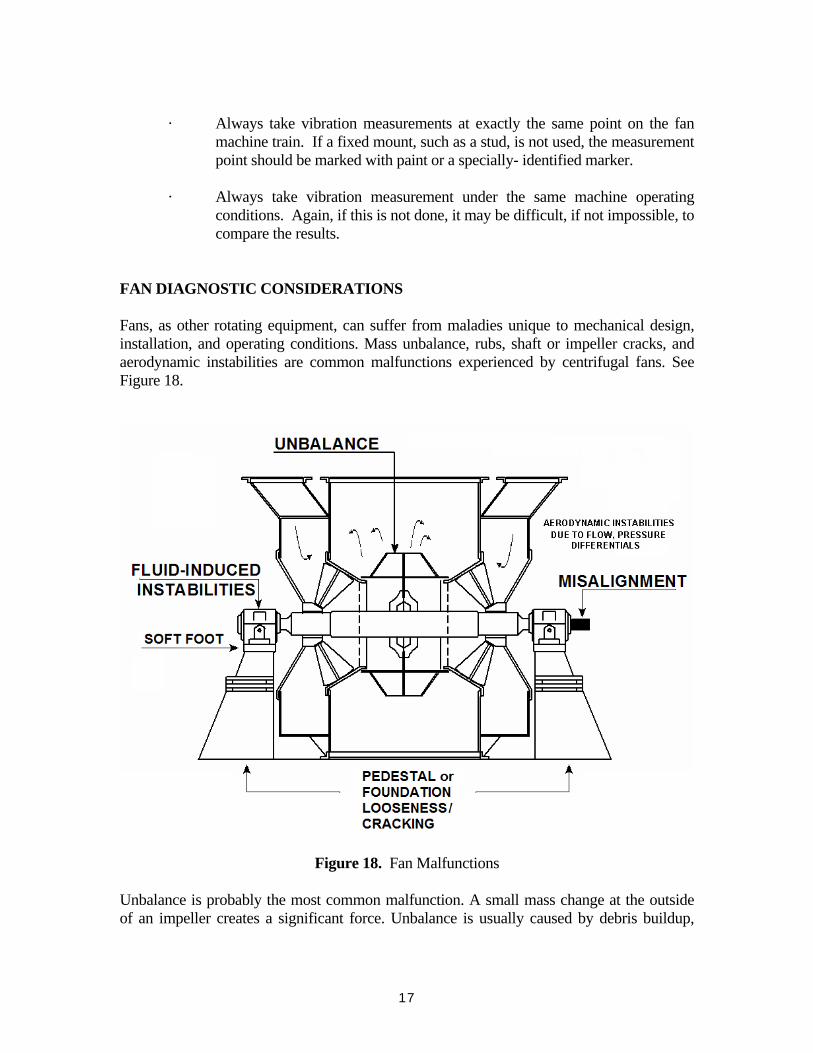
FAN DIAGNOSTIC CONSIDERATIONS Fans, as other rotating equipment, can suffer from maladies unique to mechanical design, installation, and operating conditions. Mass unbalance, rubs, shaft or impeller cracks, and aerodynamic instabilities are common malfunctions experienced by centrifugal fans. See Figure 18.
Figure 18. Fan Malfunctions Unbalance is probably the most common malfunction. A small mass change at the outside of an impeller creates a significant force. Unbalance is usually caused by debris buildup,
18
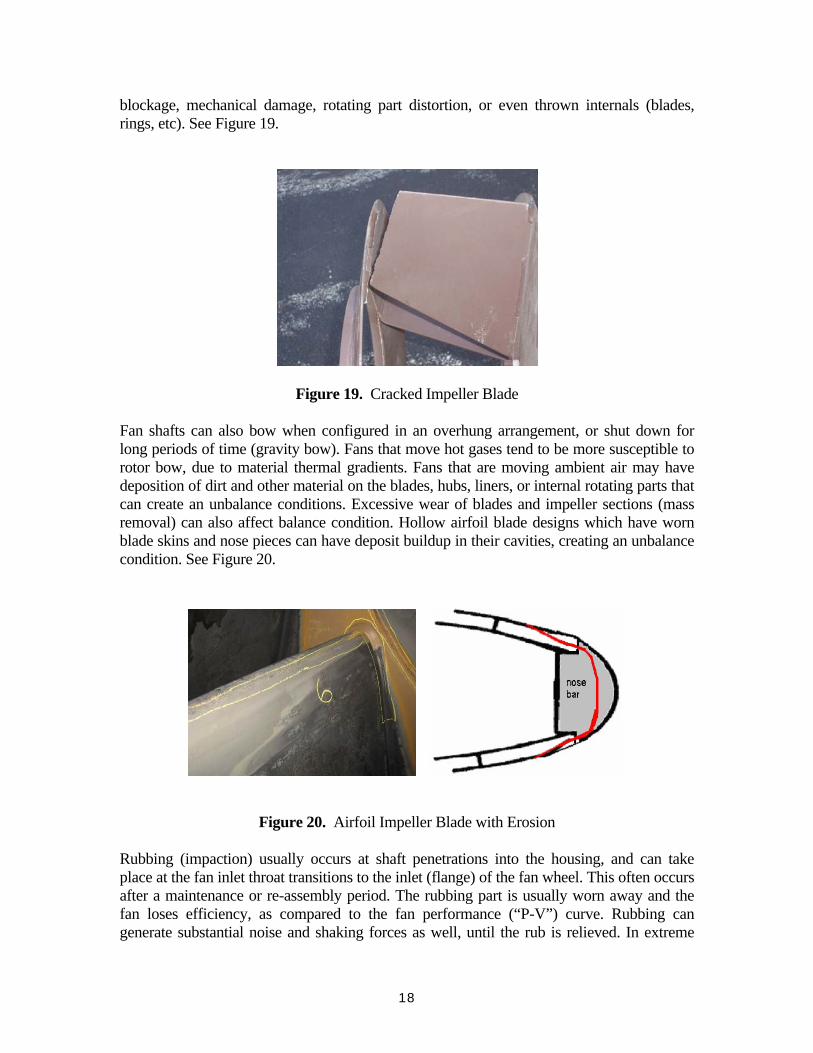
blockage, mechanical damage, rotating part distortion, or even thrown internals (blades, rings, etc). See Figure 19.
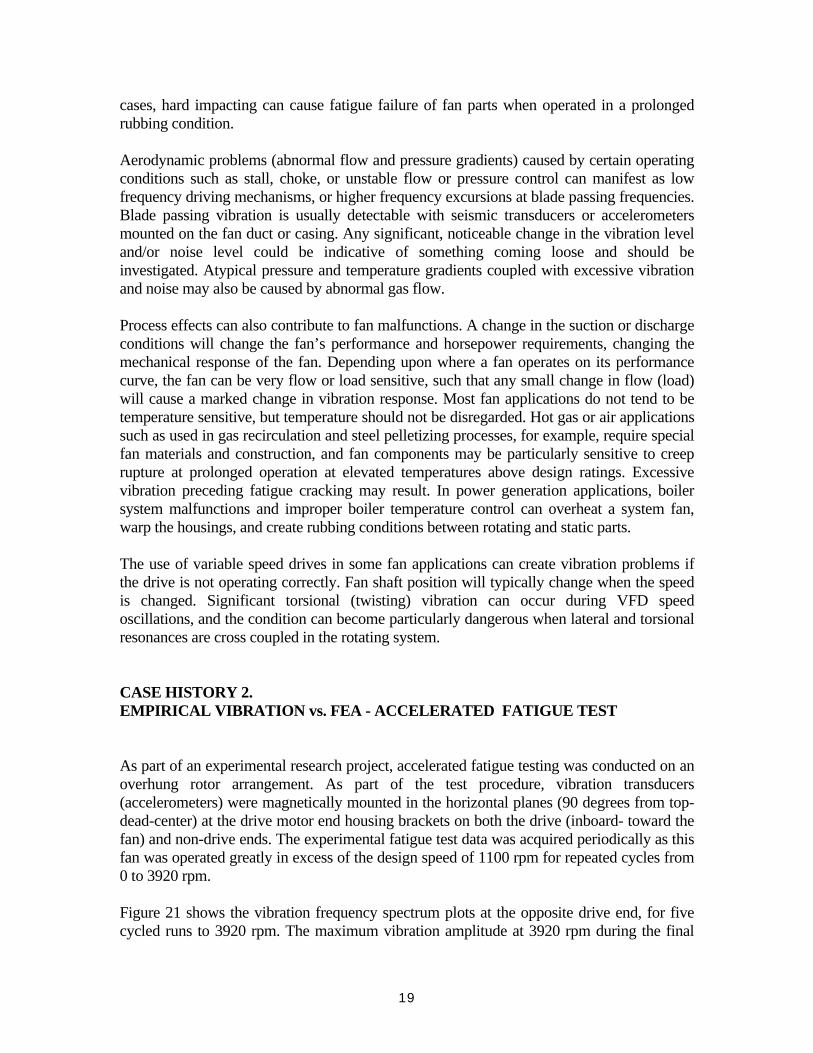
Figure 19. Cracked Impeller Blade Fan shafts can also bow when configured in an overhung arrangement, or shut down for long periods of time (gravity bow). Fans that move hot gases tend to be more susceptible to rotor bow, due to material thermal gradients. Fans that are moving ambient air may have deposition of dirt and other material on the blades, hubs, liners, or internal rotating parts that can create an unbalance conditions. Excessive wear of blades and impeller sections (mass removal) can also affect balance condition. Hollow airfoil blade designs which have worn blade skins and nose pieces can have deposit buildup in their cavities, creating an unbalance condition. See Figure 20.
Figure 20. Airfoil Impeller Blade with Erosion Rubbing (impaction) usually occurs at shaft penetrations into the housing, and can take place at the fan inlet throat transitions to the inlet (flange) of the fan wheel. This often occurs after a maintenance or re-assembly period. The rubbing part is usually worn away and the fan loses efficiency, as compared to the fan performance (“P-V”) curve. Rubbing can generate substantial noise and shaking forces as well, until the rub is relieved. In extreme
19
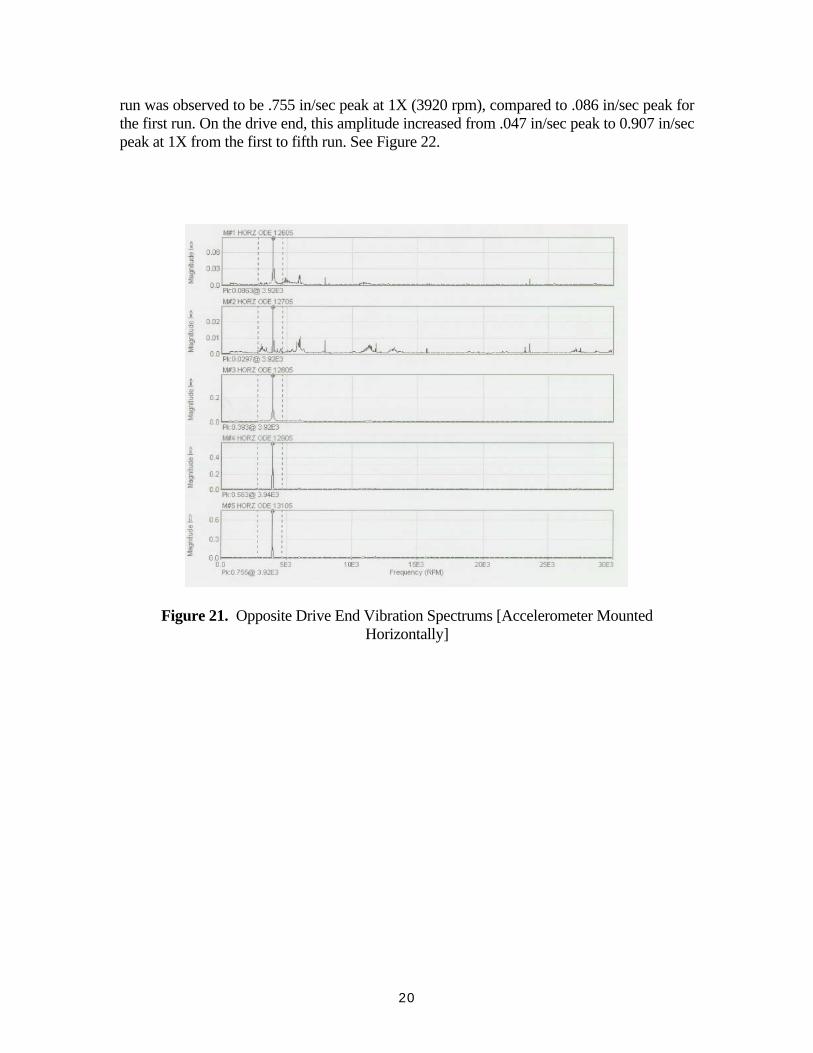
cases, hard impacting can cause fatigue failure of fan parts when operated in a prolonged rubbing condition. Aerodynamic problems (abnormal flow and pressure gradients) caused by certain operating conditions such as stall, choke, or unstable flow or pressure control can manifest as low frequency driving mechanisms, or higher frequency excursions at blade passing frequencies. Blade passing vibration is usually detectable with seismic transducers or accelerometers mounted on the fan duct or casing. Any significant, noticeable change in the vibration level and/or noise level could be indicative of something coming loose and should be investigated. Atypical pressure and temperature gradients coupled with excessive vibration and noise may also be caused by abnormal gas flow. Process effects can also contribute to fan malfunctions. A change in the suction or discharge conditions will change the fan’s performance and horsepower requirements, changing the mechanical response of the fan. Depending upon where a fan operates on its performance curve, the fan can be very flow or load sensitive, such that any small change in flow (load) will cause a marked change in vibration response. Most fan applications do not tend to be temperature sensitive, but temperature should not be disregarded. Hot gas or air applications such as used in gas recirculation and steel pelletizing processes, for example, require special fan materials and construction, and fan components may be particularly sensitive to creep rupture at prolonged operation at elevated temperatures above design ratings. Excessive vibration preceding fatigue cracking may result. In power generation applications, boiler system malfunctions and improper boiler temperature control can overheat a system fan, warp the housings, and create rubbing conditions between rotating and static parts. The use of variable speed drives in some fan applications can create vibration problems if the drive is not operating correctly. Fan shaft position will typically change when the speed is changed. Significant torsional (twisting) vibration can occur during VFD speed oscillations, and the condition can become particularly dangerous when lateral and torsional resonances are cross coupled in the rotating system. CASE HISTORY 2. EMPIRICAL VIBRATION vs. FEA - ACCELERATED FATIGUE TEST As part of an experimental research project, accelerated fatigue testing was conducted on an overhung rotor arrangement. As part of the test procedure, vibration transducers (accelerometers) were magnetically mounted in the horizontal planes (90 degrees from top-dead-center) at the drive motor end housing brackets on both the drive (inboard- toward the fan) and non-drive ends. The experimental fatigue test data was acquired periodically as this fan was operated greatly in excess of the design speed of 1100 rpm for repeated cycles from 0 to 3920 rpm. Figure 21 shows the vibration frequency spectrum plots at the opposite drive end, for five cycled runs to 3920 rpm. The maximum vibration amplitude at 3920 rpm during the final
20
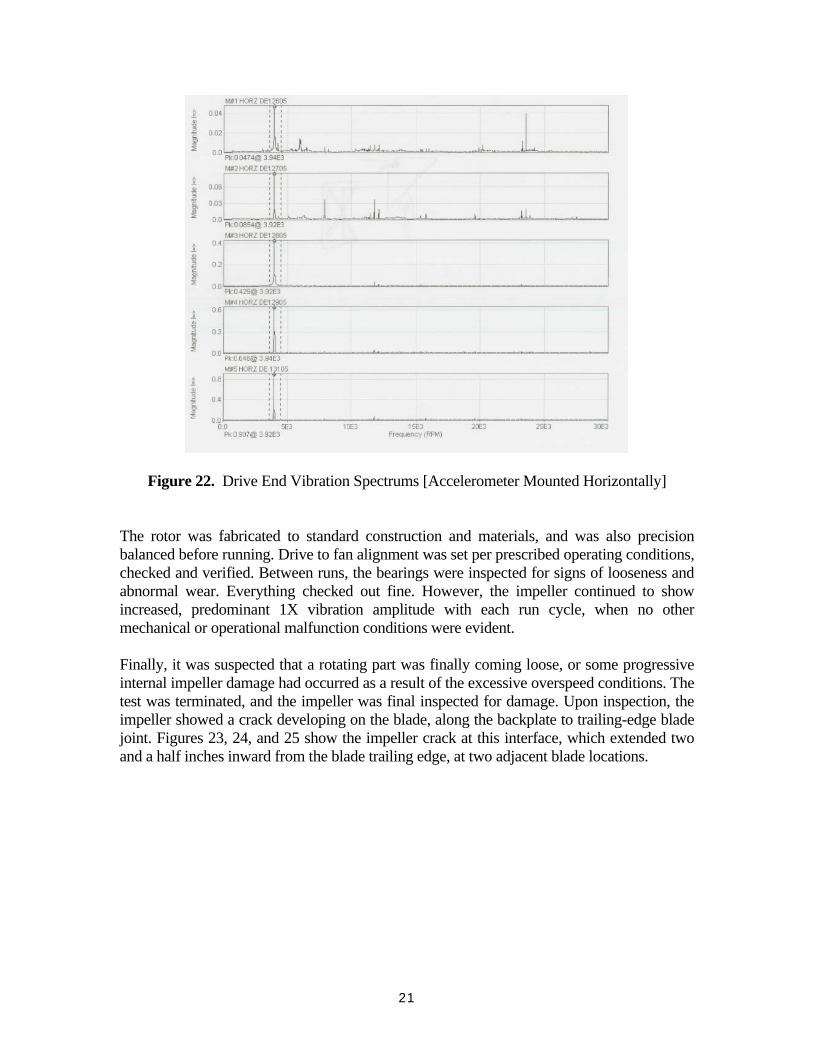
run was observed to be .755 in/sec peak at 1X (3920 rpm), compared to .086 in/sec peak for the first run. On the drive end, this amplitude increased from .047 in/sec peak to 0.907 in/sec peak at 1X from the first to fifth run. See Figure 22.
Figure 21. Opposite Drive End Vibration Spectrums [Accelerometer Mounted Horizontally]
21
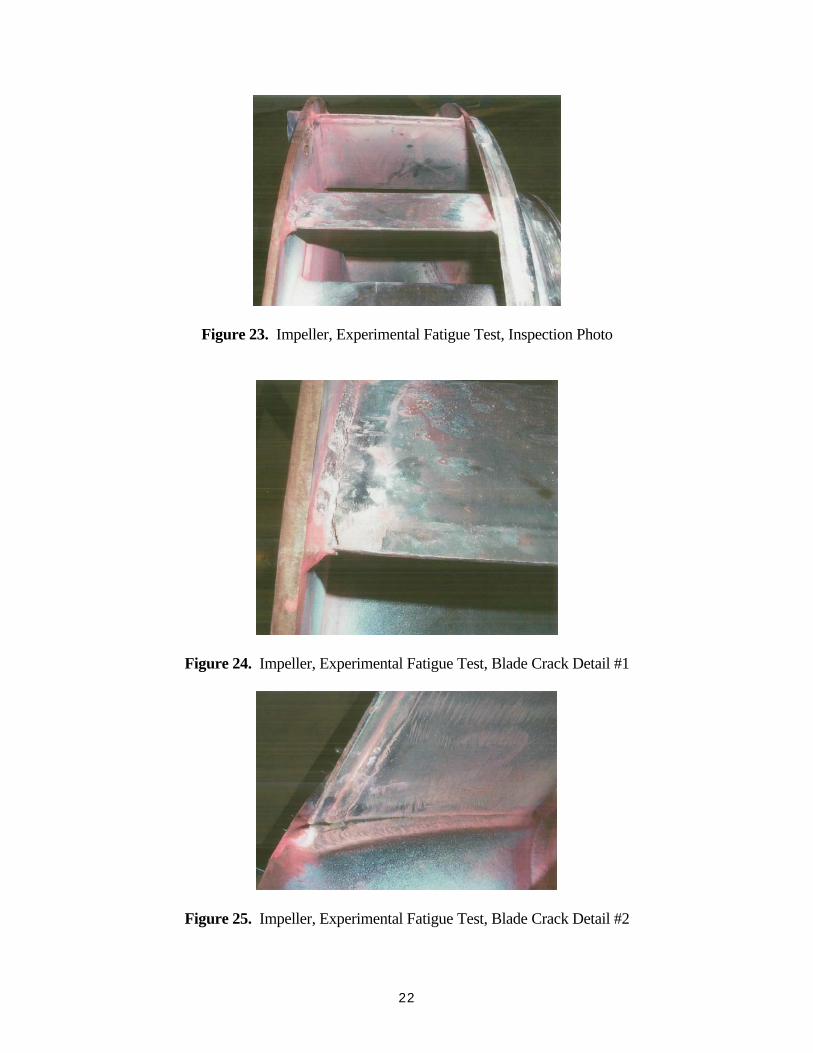
Figure 22. Drive End Vibration Spectrums [Accelerometer Mounted Horizontally] The rotor was fabricated to standard construction and materials, and was also precision balanced before running. Drive to fan alignment was set per prescribed operating conditions, checked and verified. Between runs, the bearings were inspected for signs of looseness and abnormal wear. Everything checked out fine. However, the impeller continued to show increased, predominant 1X vibration amplitude with each run cycle, when no other mechanical or operational malfunction conditions were evident. Finally, it was suspected that a rotating part was finally coming loose, or some progressive internal impeller damage had occurred as a result of the excessive overspeed conditions. The test was terminated, and the impeller was final inspected for damage. Upon inspection, the impeller showed a crack developing on the blade, along the backplate to trailing-edge blade joint. Figures 23, 24, and 25 show the impeller crack at this interface, which extended two and a half inches inward from the blade trailing edge, at two adjacent blade locations.
22
Figure 23. Impeller, Experimental Fatigue Test, Inspection Photo
Figure 24. Impeller, Experimental Fatigue Test, Blade Crack Detail #1
Figure 25. Impeller, Experimental Fatigue Test, Blade Crack Detail #2
23
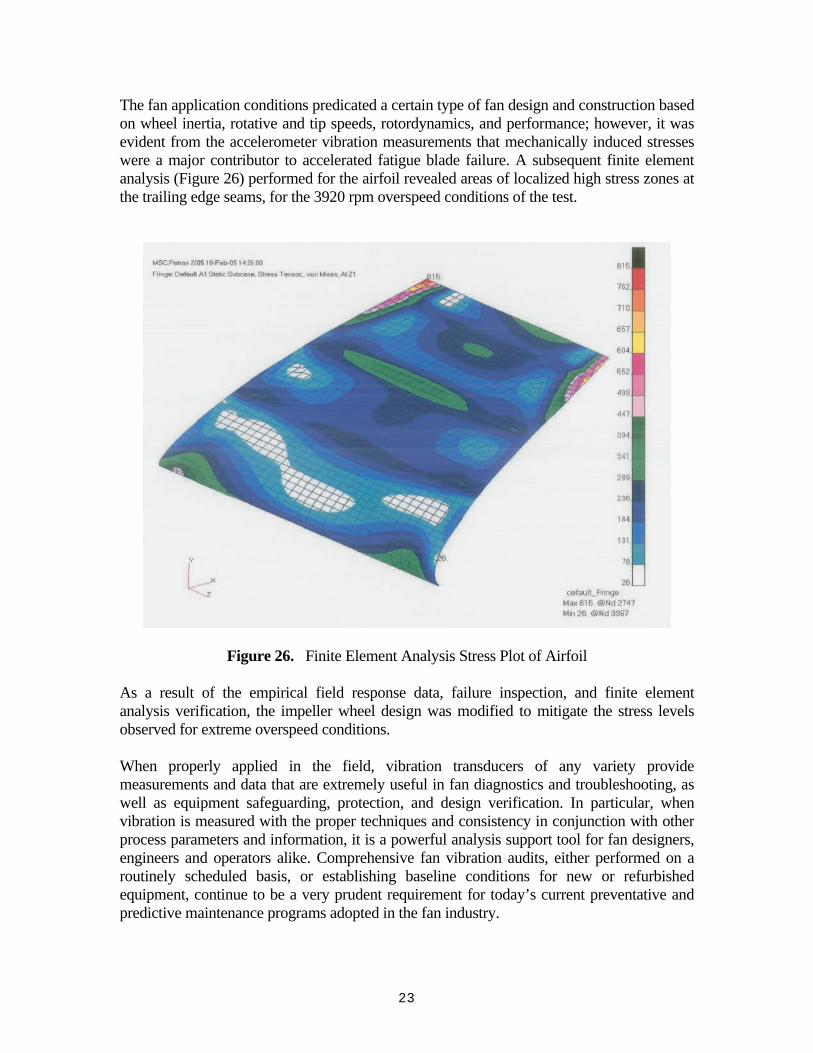
The fan application conditions predicated a certain type of fan design and construction based on wheel inertia, rotative and tip speeds, rotordynamics, and performance; however, it was evident from the accelerometer vibration measurements that mechanically induced stresses were a major contributor to accelerated fatigue blade failure. A subsequent finite element analysis (Figure 26) performed for the airfoil revealed areas of localized high stress zones at the trailing edge seams, for the 3920 rpm overspeed conditions of the test.
Figure 26. Finite Element Analysis Stress Plot of Airfoil
As a result of the empirical field response data, failure inspection, and finite element analysis verification, the impeller wheel design was modified to mitigate the stress levels observed for extreme overspeed conditions. When properly applied in the field, vibration transducers of any variety provide measurements and data that are extremely useful in fan diagnostics and troubleshooting, as well as equipment safeguarding, protection, and design verification. In particular, when vibration is measured with the proper techniques and consistency in conjunction with other process parameters and information, it is a powerful analysis support tool for fan designers, engineers and operators alike. Comprehensive fan vibration audits, either performed on a routinely scheduled basis, or establishing baseline conditions for new or refurbished equipment, continue to be a very prudent requirement for today’s current preventative and predictive maintenance programs adopted in the fan industry.