very broadband seismic background noise analysis of permanent good vaulted seismic stations
TRANSCRIPT

ORIGINAL ARTICLE
Very broadband seismic background noise analysisof permanent good vaulted seismic stations
Abd el-aziz Khairy Abd el-aal
Received: 12 November 2011 /Accepted: 14 May 2012 /Published online: 29 May 2012# Springer Science+Business Media B.V. 2012
Abstract This paper describes the results of a prelim-inary study conducted to analyze seismic backgroundnoise at sites of recently deployed very broadbandstations of the Egyptian National Seismological Net-work (ENSN). The main purpose of the study is toassess the effects of permanent seismic vault construc-tion and also to establish characteristics and origin ofseismic noise at those sites. Another goal of this studyis to determine the time needed for noise at those sitesto stabilize. The power spectral densities of back-ground noise at short period band (SP), very broad-band (VBB), and ultra long period band (ULP) foreach component of each broadband seismometerdeployed in the different investigated sites are calcu-lated. A MATLAB code has been developed thatmanages data processing and data analysis and com-pares the results with the high-noise model (NHNM)and low-noise model (NLNM) of Peterson (1993).Based on the obtained analysis, the noise stabilityand the efficiency of each station to record regionaland teleseismic events are measured. The results ofthis study could be used in the future to evaluatestation quality, to improve those processes that requirebackground noise values, such as automatic associa-tion, and to improve the estimation of station andnetwork detection and location thresholds.
Keywords Background noise . Power spectral densityand high-noise model . Egyptian NationalSeismological Network
1 Introduction
The ambient background noise levels from the recentlydeployed very broadband stations of the Egyptian Na-tional Seismological Network experiment (stationsSWA, SLM, FRF, HRG, ADB, KOT, and NKL) areexamined here to investigate factors that influencenoise levels. The main causes of seismic noise are carenatural or ambient disturbances such as wind, seawaves, traffic, industrial machinery, etc. The mostcommon source of short-period seismic noise is cultur-al noise at or near the surface of the Earth. This noiseoriginates primarily from the coupling of traffic andmachinery energy into the earth. Cultural noise prop-agates mainly as high-frequency surface waves (>1–10 Hz, 1–0.1 s) that attenuate within several kilometersin distance and depth. For this reason, cultural noisewill generally be significantly reduced in boreholes,deep caves, and tunnels. Cultural noise shows verystrong diurnal variations and has characteristic fre-quencies depending on the source of the disturbance.Another source of noise with a strong diurnal compo-nent is from thermal instabilities. Heating during theday and cooling at night can cause ground fluctuationsthat induce tilt and long-period noise.
Recently, several Japanese studies indicate the ori-gin and intimate nature and composition of a noise
J Seismol (2013) 17:223–237DOI 10.1007/s10950-012-9308-5
A. K. Abd el-aal (*)Seismology Department, National Research Institute ofAstronomy and Geophysics,Helwan, Cairo, Egypte-mail: [email protected]

wavefield (Kamura 1997; Seo et al. 1996; Seo 1997).They stated that at long periods (i.e., below 0.3 to0.5 Hz), noise is caused by ocean waves at long dis-tances, at intermediate periods (i.e., 0.3–0.5 and 1 Hz),they are mainly generated by both close coastal seawaves and wind, and finally, beyond 1 Hz, they arelinked to human activity. These studies tell us some-thing about the origin of microseisms, but do not tellus much about its composition. Friedrich et al. (1998)identify consistent Love and Rayleigh waves in thelong-period range noise (6–18 s). Some additionalinformation about noise composition are gainedfrom the results of Webb (1998), Zhang et al.(2009), and also from Chouet et al. (1998) whoanalyzed the volcanic tremor and found a verysignificant proportion of surface waves in the totalnoise power.
Several authors indicated that principal naturalnoise sources include microseisms, diurnal temper-ature, other atmospheric conditions (Zürn andWidmer 1995; Beauduin et al. 1996), flow andwaves associated with regional rivers and lakes,and wind. Principal cultural sources of noise aregenerally transportation corridors (roads, railways,pipelines, etc.). At high frequencies (above0.3 Hz), the seismic noise field is commonly dom-inated by cultural or wind-generated noise (e.g.,Rodgers et al. 1987; Given 1990; Gurrola et al. 1990;Given and Fels 1993; Peterson 1993; Withers et al.1996; Young et al. 1996; Vila 1998; Uhrhammer2000), with wind noise being the predominant high-frequency noise source at remote sites (e.g., Withers etal. 1996). At frequencies below 0.3 Hz, the strongestsources of noise are surface waves generated frominteractions between the ocean and the seafloor:microseisms in the period band 3–25 s, earth'shum at longer periods. At periods longer than1,000 s, atmospheric loading and disturbances be-come dominant (Rhie and Romanowicz 2004;Romanowicz et al. 1998, 2003). More informationabout background noise types, sources, and noisespectral analysis can be found in my previouspublication (e.g., Abd el-aal 2010a, b, c, 2011).
Knowing the source of non-earthquake back-ground noise at a given site can help in networkdesign and provide insights into the physical phe-nomena responsible for the noise. Determining thesource of seismic noise generally relies on ampli-tude measurements.
2 Purpose of study
This study has several purposes. One of them is topresent a catalog of seismic background noise spectraobtained from recently deployed very broadband stationsof the Egyptian National Seismological Network. An-other purpose is to study the nature and sources ofseismic noise at sites of recently installed very broadbandstations. The third purpose is to measure the noise sta-bility and the efficiency of station to record regional andteleseismic events. The result of this study could be usedin the future to evaluate station quality, to improve thoseprocesses that require background noise values, such asautomatic event association, and to improve the estima-tion of station and network detection and location thresh-olds. The interval period of this experiment is a completeyear of continuous recording. The noise data were pro-cessed to determine both seasonal as well as diurnalvariations of noise levels. Moreover, this study couldbe considered as the first step to develop new seismicnoise models in North Africa, Middle East, and Arabworld regions, not included in Peterson (1993).
3 Network stations
The Egyptian National Seismic Network now includes64 seismic stations (7 very broadband stations + 10broadband stations + 1 borehole station + 46 short-period stations) distributed across Egypt and alsoincludes one main data analysis center at Helwan Cityand five subcenters at Burg El–Arab, Hurghada,Mersa Alam, Aswan, and Kharga City (Fig. 1). TheHelwan data center receives seismic data by telemetryfrom the nearby stations and from some of the moredistant stations via satellite communications. The sen-sors used in Egyptian National Seismological Network(ENSN) are L4C, SS1, STS, and Trillium seismome-ters. The digital data are extracted online using Apolloand Naqs servers (Nanometrics manufacturer, Can-ada). The seismic data analysis softwares DAN, AT-LAS, and HYDRA programs are used for seismicanalysis processes. The received data are analyzed tocalculate earthquake parameters (e.g., hypocenter,magnitude, depth, and moment tensor). Since 1996,the National Research Institute of Astronomy andGeophysics has installed strong motion instruments(model IDS-3602A-16 Bit-Digital Accelerographs) atdifferent sites distributed all over Egypt (Fig. 1). The
224 J Seismol (2013) 17:223–237

distribution of the seismic stations has been chosen tocover the known seismogenetic areas as thoroughly aspossible. This distribution includes some regions thathave experienced historical earthquakes, althoughthere is no evidence of activity during the instrumentalperiod (e.g., SWA station in Fig. 2).
In the last 4 years, the Seismology Council at TheEgyptian National Seismic Network decided to develop,reinstall, and replace some short-period and one-component stations by very broadband stations as partof a long-term plan to upgrade all the seismic stations ofENSN to very broadband. Between 2008 and 2010,seven very broadband stations were thus reinstalled andreplaced (Fig. 2). Table 1 illustrates locations, sensortype, and communication of these stations. Modern dig-ital seismograph stations, such as those equipped with,e.g., STS2 or Trillium 240 seismometers, are character-ized by a flat response over a wide range of periods(broadband and very broadband) and provide mostlycomplete information on the nature of ground motion.
The Taurus seismograph which has been deployedat the ENSN broadband sites is a compact, self-contained digitizer and data logger that combines
exceptional performance with versatility and low pow-er consumption. The Taurus can be used either as astand-alone time series data logger or as a componentin a data acquisition network. Time series data arestreamed in Nanometrics NP format and can beextracted in MiniSEED (Ahern et al. 1994), Seisan,or ASCII format; more details about the technicalcharacteristics of Taurus can be looked up on theNanometrics website (http://www.nanometrics.ca).
Trillium 240 is a three-component, force–balancevery broadband seismometer suitable for portable andfixed applications. It operates over a wide temperaturerange with automatic centering and has very low powerconsumption. The extended response at higher frequen-cies makes it ideal for local and regional networks aswell as volcano hazard monitoring and aftershock stud-ies. Trillium 240 is a symmetric triaxial very broadbandinstrument that has a flat response to ground velocitybetween 240 s and 200 Hz and has a low self-noise,below the new low-noise model of Peterson (1993) andMcNamara and Buland (2004), between 100 s and10 Hz. The manufacturer specifications of operatingtemperatures are between −20 and +50°C. The power
Fig. 1 Location map ofENSN and Egyptian StrongMotion Network. The loca-tion of main center andsubcenters are also plotted
J Seismol (2013) 17:223–237 225

consumption at low-seismic noise conditions and withthe well-leveled instrument is about 650 mW. The Tril-lium, with a ±1° tilt tolerance, is fairly sensitive tovarying temperature but was designed to be insensitiveto atmospheric variations.
4 Vault construction
This section describes the specific conditions to beconsidered during the construction of very broadband
seismic vaults. A vault for seismic data acquisition andtransmission equipments should satisfy the followinggeneral requirements:
& Provides adequate environmental conditions forthe equipment
& Ensures the proper mechanical contact of seismicsensors with bedrock
& Ensures a suitable electric ground for sensitiveelectronic equipment
& Provides sufficient space for easy access and main-tenance of the instruments
Fig. 2 Topographic mapshows recently deployedvery broadband stations ofENSN. Seven very broad-band stations named SWA,SLM, KOT, NKL, FRF,HRG, and ADB are includ-ed in this study. Color scaleshows relative elevations
Table 1 Stations' parameters
Station Number of components Communication Digitizer type Sensor type Latitude (°) Longitude (°) Altitude (m)
FRF 3 Satellite TRIDENT Trillium 240 27.1484 28.3104 0135
HRG 3 Satellite TRIDENT Trillium 240 27.0517 33.6080 0400
KOT 3 Satellite TRIDENT STS2 29.9275 31.8291 0507
ADB 3 Satellite TRIDENT Trillium 240 25.3405 34.5021 0295
NKL 3 Satellite TRIDENT Trillium 240 29.9293 33.9804 0455
SLM 3 Satellite TRIDENT Trillium 240 31.4916 25.2122 0107
SWA 3 Satellite TRIDENT Trillium 240 29.2433 25.4556 0065
226 J Seismol (2013) 17:223–237

A seismic vault (2×2×7 m) is constructed for thevery broadband (VBB) sensor of ENSN. The walls aremade of 25-cm thick concrete blocks, with steel mesh.This adequate vault for seismic equipment fulfills thefollowing:
& Prevents large temperature fluctuations in theequipment due to day/night temperature differen-ces or because of weather changes
& Prevents large temperature fluctuations in the con-struction elements of the vault, resulting in seis-mometer tilt
& Ensures adequate lightning protection& Mitigates electromagnetic interference& Prevents water, dust, and dirt from entering the
shelter& Prevents small animals from entering the shelter
Temperature changes with time, particularly diurnalchanges, are much more important than the high or lowaverage temperature itself. Many broadband seismom-eters require mass centering if the temperature "slips"more than a few degree Celsius, although their operatingrange is much wider. Even temperature changes cancause problems with mechanical and electronic driftswhich may seriously deteriorate the quality of seismicdata at very low frequencies (Uhrhammer et al. 1998). Ingeneral, thermal drifts should be kept acceptably smallby thermal insulation of the vault. Maximum ±5°Cshort-term temperature changes can be considered atarget for passive short-period seismometers and force-feedback active accelerometers. To fully exploit thelow-frequency characteristics of a typical 30-s periodbroadband seismometer, the temperature must be keptconstant within less than 1°C.
The thermal insulation was carried out at recentlydeployed very broadband stations in three places: 1—above the seismic pier, 2—at the upper end of basechamber, and 3—at the upper end of the middle cham-ber inserting a layer of ADVEFOAM with thickness of5, 15, and 15 cm, respectively. Special measures arerequired to prevent thermal deformation and tilt of theseismic pier in a vault to allow the study of extremelylow-frequency signals with BB seismometers. Homoge-neity of the seismic pier and surrounding soil as well asengineering details of vault design is very important.Uhrhammer et al. (1998) recommend the physical sep-aration of the seismometer pier and the vault walls. Thisseparation assures that minute changes in the dimen-sions of the vault walls due to temperature change do not
tilt the seismic pier. That separation was taken intoconsideration in all the constructed vaults at recentlydeployed very broadband stations of ENSN.
Water entering seismic vaults is probably the mostcommon cause of station failure. The most effectiveway to prevent water damage is vault drainage. Whenpossible, we use a hard plastic tube of about 3 cm indiameter, such as used for water pipelines. If drainageis impossible, as is often the case for deep vaults (as inour case), water tightness of the vault is of the utmostimportance. Our new vaults (walls and seismic pier)are made of concrete of a very good, uniform quality.Seawater cement and water-resistant chemicals (suchas ADDICUR M used as external painting) andADDICRETE DM2 were added to the mix to helpkeep it watertight. The vault should have a waterdrainage ditch around the flat central pier on whichthe sensors are installed. The upper rim of the vaultmust be at least 30 cm above the ground. Wherepossible, the surrounding terrain should descend radi-ally from the top of the vault.
At first glance, the issue of small animals may seemamusing. However, animals frequently use seismicvaults as dwellings. We have seen some very strange"seismic" records caused by ants, grasshoppers, liz-ards, and mice. Worse, such animals can cause severedamage to cables and other plastic parts of the equip-ments. In our new vaults, fabric or thermal vaultcovers have been installed to prevent animals fromentering the vault from above. Additional animal pro-tection is achieved by using plastic tubes for cables, inaddition to drainage. Insecticides are used to driveaway ants and other insects from the vault.
A good contact between seismic sensors and bedrockis a basic requirement. Soil and/or weathered rock layersbetween the sensor and the bedrock will modify seismicamplitudes and waveforms. A definition of "good" bed-rock is necessary. Unfortunately, the definition is fairlyvague, especially because some recent studies show thateven a site with apparently hard, but cracked, rock maystill have significant amplification compared to truesolid bedrock. As a rule of thumb, good bedrock is rockhard enough to prevent any manual digging. If seismicprofiles are available, P-wave velocities should behigher than 2 km/s. All the above-mentioned criteriaare taken into consideration when choosing the bedrockin our new vaults (Fig. 3).
The enclosure which includes the digitizer andtransmitter is mounted in the middle chamber in the
J Seismol (2013) 17:223–237 227

VBB vault. In some stations, it was mounted in aseparately constructed room with dimensions of 1 min width, 2–3 m in length, and 1.5 m in height. Thisroom is located 5 m away from the vault and isconnected to the vault by a 2-in. plastic tube buriedbelow the surface (Fig. 3). This tube permits the sen-sor cables to pass through. The room is connected alsoto the transmitting tower located 1 m away.
5 Noise power spectral density estimation
The power spectral densities of background noise foreach component of each very broadband seismometerdeployed are calculated and then compared them withthe high-noise and low-noise model of Peterson
(1993). All segments from day and night local timewindows were included in the calculation withoutparsing out earthquakes. The power spectral densities(PSDs) of noise are calculated for each component ateach station by extracting 15 min for short period bandprocessing, 2 h for very broadband period band pro-cessing, and 96 h for ultra long period band, duringone complete year of continuous recording of seismicnoise data. In general, the SP, VBB, and ultra longperiod (ULP) signals are recorded continuously. Thedata acquisition system records three orthogonal com-ponents (vertical, north, and east).
Each of the seven newly deployed sites contains aTrillium 240s broadband seismometer with Nanomet-rics data acquisition systems continually sampling at100 samples per second with the exception of station
Fig. 3 a Photo taken during vault construction. b Photo of theconstructed transmission room and vault. c The transmissionroom contains transmitter and digitizer in some stations. d The
transmission tower which contains transmitter antenna and GPSantenna and satellite dish to send data to the main center andsubcenters
228 J Seismol (2013) 17:223–237

KOT which has an STS2 seismometer with the samesampling rate. Raw data were decimated to decreasesampling rate from 100 samples per second to 0.03and 0.5 samples per second in the ultra long periodand very broadband period bands, respectively. Theresponse curves and calibration sheets of seismometerswere taken into consideration during processing steps. AMATLAB code is designed to search 1 year of contin-uous recording for a quiet 96-h time window at eachstation. Preliminary determinations of epicentersreported by Egyptian National Seismological Networkwere referred to in selecting each data window to avoidearthquake signals according to (1) no earthquakes withMb≥6.0 reported in the preceding 96 h; (2) no earth-quakes with Mb≥5.0 reported with Δ≤50° in the pre-ceding 96 h; (3) no earthquakes with Mb≥4.0 reportedforΔ≤20° in the preceding 96 h; (4) and no earthquakeswithMb≥3.0 reported forΔ≤10° in the preceding 96 h.
All prospective data windows were visually inspected toensure that obvious signals from local microearthquakesor other obvious cultural contaminants (e.g., miningexplosions) were excluded. An identical selection pro-cedure was performed for data recorded at all the sta-tions. In some cases where there is no 96-h time windowwithout event, 2-h and 15-min time windows for shortperiod band and very broadband have been only takenfor further processing.
The noise spectrum is divided into three periodbands: ultra long period, 63–300,000 s; very broadbandperiod, 3–1,300 s; and short period, 0.02–11 s. Afterdeconvolving the instrument response, the power spec-tra are estimated by time averaging over modified perio-dograms (Welch 1967) inMATLAB. Each segment wasdivided into eight sections with 50 % overlap and thenFourier transformed. To properly compare the estimatedPSD calculation with the United States Geological
Fig. 4 The computed PSDs at SWA and SLM stations at shortperiods (SP), very broadband (VBB), and ultra long periods(ULP). Vertical component is pink, north component is green,
and east component is black. Peterson's (1993) low- and high-noise models are in blue and red, respectively
J Seismol (2013) 17:223–237 229

Survey (USGS) noise models, the data sets have beenrun through the algorithm Peterson used to calculate theUSGS noise models (Peterson 1993) and comparedPSDs. Generally, it is found that the algorithms pro-duced the same PSDs at the same frequencies.
6 Results and discussion
The PSDs for all stations for SP, VBB, and ULP bandsseparately calculated from 15-min, 2-h, and 96-h datawindows during 1 year of continuous recording ofdata in 2009 are shown in Figs. 4, 5, 6, and 7. Thethree components are shown individually along withPeterson's (1993) low- and high-noise models. Thefigures display the short period, very broadband, andultra long period background noise PSDs over theentire experiment time at SWA, SLM, KOT, NKL,
FRF, HRG, and ADB stations. However, the mean ormedian of PSDs has not been taken for each station todistinguish between season's PSD variability by not-ing the upper and lower limits of PSDs for each stationand to construct upper and lower noise models foreach station in future work. Data from ADB stationare insufficient especially at ultra long periods as thestation joined the network in September 2009, only3 months before the end of experiment. Data transferthrough satellite communication from some stations tothe main data center sometimes encountered technicalproblems and failure in certain days and months. Incomparing the overall PSD levels of each componentof each station with the USGS high- and low-noisemodels (Peterson 1993) in particular, at high frequen-cies, noise levels at all stations fell within the boundsof the noise models, with all components at similarPSD levels in the frequency band 1.0 to 50.0 Hz.
Fig. 5 PSDs at NKL and KOT stations at short periods (SP),very broadband (VBB), and ultra long periods (ULP). Verticalcomponent is pink, north component is green, and east
component is black. Peterson's (1993) low- and high-noisemodels are in blue and red, respectively
230 J Seismol (2013) 17:223–237

Fig. 6 HRG and FRF stations PSDs at short period (SP), very broadband (VBB), and ultra long periods (ULP). Vertical component ispink, north component is green, and east component is black. Peterson's (1993) low- and high-noise models are plotted also
Fig. 7 The estimated PSDs at ADB station at short periods(SP), very broadband (VBB), and ultra long periods (ULP) fromSeptember to December 2009. Vertical component is pink, north
component is green, and east component is black. Peterson's(1993) low- and high-noise models are in blue and red,respectively
J Seismol (2013) 17:223–237 231

At VBB and ULP bands at most stations, typicalhorizontal noise levels are certainly higher than thevertical noise levels. The results reveal a large amountof variability in the PSD levels at all stations. Thegreatest variability can be observed at long periods inmost stations. The least amount of variation can beobserved in the 0.01–1.0 Hz frequency range, whichcontains the microseismic frequencies. Due to goodvault design, very good thermal insulation, culturaleffects contribute the most to the variability at thehigher frequencies. The sites most isolated from suchactivity show up well in short-period ranges and thePSDs fell within the bounds of the noise models for allcomponents and closer to the low-noise model(NLNM) than high-noise model (NHNM).
Tilt, pressure, and wind are sources of noise atlong periods that can quickly raise the noise of thehorizontal components in very broadband data asseen in the figures. Ocean waves create the micro-seism noise that peaks at 2.0 s with a secondarypeak between 8.0 s especially in SLM station.From reading the results, increased understandingand mitigation of local tilt effects in VBB vault
offer the possibility of significantly improving thelong-period noise environment.
7 Seasonal noise spectra comparison
One can distinguish several kinds of noise by observ-ing seasonal and diurnal variations. The natural noisecan be distinguished from cultural noise by observingday and night patterns. On the other hand, the naturalnoise sources which include microseisms, diurnal tem-perature, and other atmospheric conditions can bedistinguished by observing seasonal pattern.
The long-period noise sources from tilt, tempera-ture, and pressure make horizontal components noisierthan the vertical components. Another goal of thisstudy is to examine the difference in noise level duringannual sessions and determine the time required be-fore noise stabilized after deployment in a permanentvault. Such information is useful in making decisionsregarding site stability versus multiple site locations.The PSDs for the horizontal and vertical component ofeach station after deployment were plotted at periods
Fig. 8 PSDs plotted versus time at periods of 3, 100, 983, and83,886 s for Z, N, and E components at SWA and SLM stations.Vertical component is pink, north component is green, while
east component is black in color. The USGS low- and high-noise models are plotted in blue and red colors, respectively
232 J Seismol (2013) 17:223–237
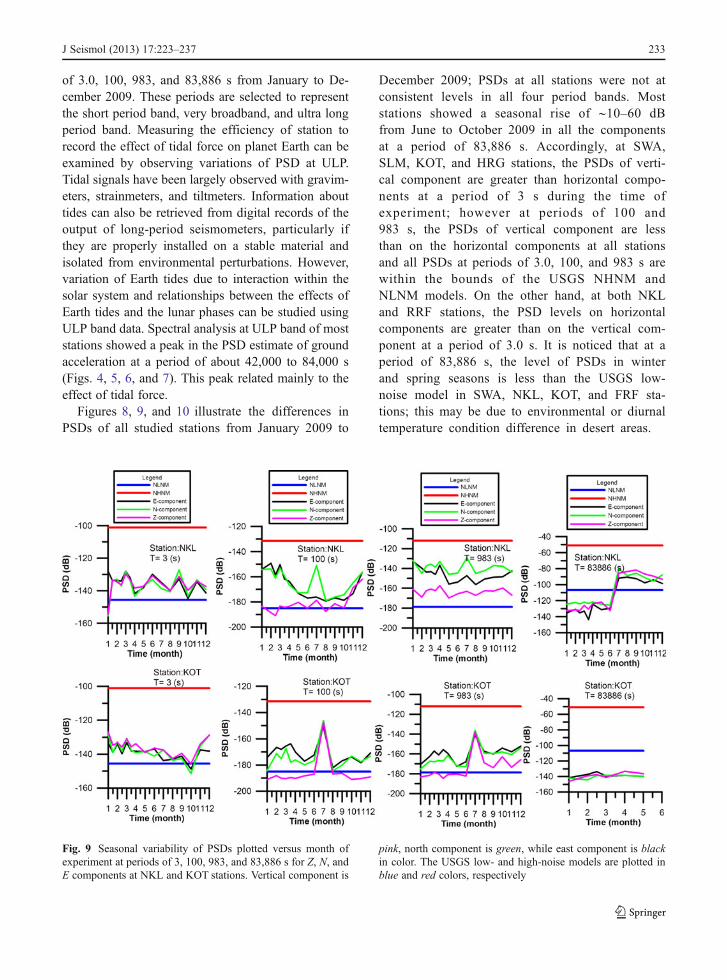
of 3.0, 100, 983, and 83,886 s from January to De-cember 2009. These periods are selected to representthe short period band, very broadband, and ultra longperiod band. Measuring the efficiency of station torecord the effect of tidal force on planet Earth can beexamined by observing variations of PSD at ULP.Tidal signals have been largely observed with gravim-eters, strainmeters, and tiltmeters. Information abouttides can also be retrieved from digital records of theoutput of long-period seismometers, particularly ifthey are properly installed on a stable material andisolated from environmental perturbations. However,variation of Earth tides due to interaction within thesolar system and relationships between the effects ofEarth tides and the lunar phases can be studied usingULP band data. Spectral analysis at ULP band of moststations showed a peak in the PSD estimate of groundacceleration at a period of about 42,000 to 84,000 s(Figs. 4, 5, 6, and 7). This peak related mainly to theeffect of tidal force.
Figures 8, 9, and 10 illustrate the differences inPSDs of all studied stations from January 2009 to
December 2009; PSDs at all stations were not atconsistent levels in all four period bands. Moststations showed a seasonal rise of ∼10–60 dBfrom June to October 2009 in all the componentsat a period of 83,886 s. Accordingly, at SWA,SLM, KOT, and HRG stations, the PSDs of verti-cal component are greater than horizontal compo-nents at a period of 3 s during the time ofexperiment; however at periods of 100 and983 s, the PSDs of vertical component are lessthan on the horizontal components at all stationsand all PSDs at periods of 3.0, 100, and 983 s arewithin the bounds of the USGS NHNM andNLNM models. On the other hand, at both NKLand RRF stations, the PSD levels on horizontalcomponents are greater than on the vertical com-ponent at a period of 3.0 s. It is noticed that at aperiod of 83,886 s, the level of PSDs in winterand spring seasons is less than the USGS low-noise model in SWA, NKL, KOT, and FRF sta-tions; this may be due to environmental or diurnaltemperature condition difference in desert areas.
Fig. 9 Seasonal variability of PSDs plotted versus month ofexperiment at periods of 3, 100, 983, and 83,886 s for Z, N, andE components at NKL and KOT stations. Vertical component is
pink, north component is green, while east component is blackin color. The USGS low- and high-noise models are plotted inblue and red colors, respectively
J Seismol (2013) 17:223–237 233

8 Overlay of spectrum
In Figs. 11 and 12, a test was made to measure thesymmetrical continuity of spectra at all bands withspectral overlay for the three-time windows of dataat SP, VBB, and ULP at each station. To examinecontinuity and excessive overlap and also to ex-clude the effects of the digital anti-aliasing filter,the SP spectra are plotted up to 11 s, the VBBspectra are plotted in the band from 3 to 1,300 s,and the ULP spectra are plotted beginning at aperiod of 63 s. A good agreement between thethree bands has been found. In order to establisha new noise model for each station and to identifythe upper and lower limit of PSD, no smoothingprocedures have been applied during the process-ing of the single frequency bands. This results in astrong PSD variance at the transition periods ofthe three analyzed bands, especially at 63 s, thestarting period of the ULP band.
9 Conclusion
An analysis of the seismic background noise recordedby recently deployed very broadband stations belongingto Egyptian National Seismological Network was per-formed. The analysis of seismic background noise, toassess the effects of permanent seismic vault construc-tion, was performed at seven very broadband stations ofthe ENSN for the period of January to December 2009.The results of evaluating ambient seismic noise levels,at the stations based on the power spectral densitymethods used to generate the NHNM and NLNM ofPeterson (1993), are presented. This is useful becauseseismic stations exhibit considerable variations in noiselevels as a function of time of day, season, and locationand installation type. This type of information is notreadily obtained when only minimum noise levels areanalyzed. The results of this work of background noiseanalysis are useful for characterizing the performance ofrecently constructed stations, for detecting operational
Fig. 10 HRG and FRF stations PSDs plotted versus time ofexperiment at periods of 3, 100, 983, and 83,886 s for Z, N, andE components. Vertical component is pink, north component is
green, while east component is black in color. The USGS low-and high-noise models are plotted in blue and red colors,respectively
234 J Seismol (2013) 17:223–237

problems, and should be relevant to the future sitting ofbroadband seismic stations in Egypt.
Results show a high degree of variability in noiselevels from station to station. This is due probably to
Fig. 11 An overlay of SP, VBB, and ULP spectra for 15-s, 2-h, and 96-h time windows at SWA, SLM, NKL, and KOT stations
Fig. 12 An overlay of SP, VBB, and ULP spectra for the same time windows as shown in Fig. 12 at HRG and FRF stations
J Seismol (2013) 17:223–237 235

the variability in site conditions. It is noticed that noiselevels were considerably lower for SWA, SLM, KOT,and NKL stations than for other stations. In particular,in the ultra long periods in winter and spring seasons,they fall down below the NLNM of Peterson (1993).However, at VBB and ULP bands, the horizontalcomponents were noisier than the vertical componentfor all stations, whereas the vertical component wasnoisier at some stations at SP band. There appears tobe a very long period day time noise source on thevertical component at all stations, which we do notattribute to wind or tilt because the horizontal compo-nents were unaffected.
In general, the PSD estimates show moderate noiselevels at all stations falling within the high and lowbounds of Peterson (1993). According to the obtainedresults, it is concluded that the most likely prospect forsignificantly improving the very broadband noise envi-ronment in permanently broadband deployments belowabout 0.01 Hz lies in a more detailed understanding ofthe local long-period noise environment. This is espe-cially notable for horizontal components, where keydetails include improved understanding of how slab tilteffects are related to thermal, atmospheric pressure, andground effects interacting with vault design and near-surface site geology. Depending upon these results, theSeismology Council at Egyptian National Seismologi-cal Network took decision to replace and upgrade someof the short-period stations of ENSN to very broadbandwith the same vault design as used in this study.
Acknowledgments The author is grateful to the National Re-search Institute of Astronomy and Geophysics, Egyptian NationalSeismological Network, Egypt for the provision of seismic data aswell as all other facilities required for this research. Thanks are dueto Hamid Nofel (Egyptian National Seismological Network) forkindly offering some power spectral density analysis codes andvaluable advice while working on this research. Grateful thanks toBarbara Romanowicz (Seismological Laboratory, University ofCalifornia, Berkeley, USA) who helped improve and edit themanuscript. The author appreciates comments and revisions fromthe reviewers, which improved the manuscript. The author is alsograteful to editor of Journal of Seismology who gave me a chanceto improve the manuscript.
References
Abd el-aal AK (2010a) Eliminating upper harmonic noise invibroseis data via numerical simulation. Geophys J Int181:1499–1509. doi:10.1111/j.1365-246X.2010.04594.x
Abd el-aal AK (2010b) Modeling of seismic hazard at thenortheastern part of greater Cairo metropolitan area. EgyptJ Geophys Eng 7:75–90. doi:10.1088/1742-2132/7/1/007
Abd el-aaL AK (2010c) Ground motion prediction from nearestseismogenic zones in and around Greater Cairo Area,Egypt. Nat Hazards Earth Syst Sci 10:1495–1511.doi:10.5194/nhess-10-1495-2010
Abd el-aal AK (2011) Harmonic by harmonic removal techniquefor improving vibroseis data quality. Geophys Prospect 2011(59):279–294. doi:10.1111/j.13652478.2010.00918.x
Ahern TK, Buland R, Halbert S (1994) SEED format version2.3 reference manual. IRIS, Washington
Beauduin P, Lognonne P, Montagner J, Cacho S, Karczewski J,Morand M (1996) The effects of atmospheric pressurechanges on seismic signals, or how to improve the qualityof a station. Bull Seism Soc Am 86:1760–1799
Chouet B, De Luca G, Milana G, Dawson P, Martini M, ScarpaR (1998) Shallow velocity structure of Stromboli Volcano,Italy, derived from small-aperture array measurements ofstrombolian tremor. Bull Seism Soc Am 88–3:653–666
Friedrich A, Krüger F, Klinge K (1998) Ocean generated micro-seismic noise located with the Gräfenberg. J Seismol 2:47–64
Given HK (1990) Variations in broadband seismic noise at IRIS/IDA stations in the USSR with implications for eventdetection. Bull Seism Soc Am 80:2072–2088
Given HK, Fels F (1993) Site characteristics and ambientground noise at IRIS IDA stations AAK (Ala-Archa, Kyr-gyzstan) and LY (Talaya, Russia). Bull Seism Soc Am83:945–953
Gurrola H, Minster JB, Given H, Vernon F, Berger J, Aster R(1990) Analysis of high frequency seismic noise in thewestern United States and eastern Kazakhstan. Bull SeismSoc Am 80:951–970
Kamura K (1997) On microtremors observed in Tokyo Bayarea. Japanese document, in Japanese with English ab-stract, pp. 47–53
McNamara DE, Buland RP (2004) Ambient noise levels in thecontinental United States. Bull Seism Soc Am 94:1517–1527
Peterson J (1993) Observations and modelling of seismic back-ground noise. U.S. Geological Survey, open-file report, pp.93–322
Rhie A, Romanowicz B (2004) Excitations of the Earth's inces-sant free oscillation by atmosphere/ocean/solid earth cou-pling. Nature 431:552–556
Rodgers PW, Taylor SR, Nakanishi KK (1987) System and sitenoise in the regional seismic test network from 0.1 to20 Hz. Bull Seism Soc Am 77:663–678
Romanowicz B, Stakes D, Montagner JP, Tarits P, UhrhammerR, Begnaud M, Stutzmann E, Pasyanos M, Karczewski JF,Etchemendy S (1998) MOISE: a pilot experiment towardslong term seafloor geophysical observatories. Earth PlanetsSpace 50:927–937
Romanowicz B, Stakes D, Uhrhammer R, Mcgill P, NeuhauserD, Ramirez T, Dolenc D (2003) The MOBB experiment: aprototype permanent offshore ocean bottom broadbandstation, Eos. Trans Am Geophys Un 84:325–332
Seo K (1997) Comparison of measured microtremors with dam-age distribution. JICA Research and Development Projecton Earthquake Disaster Prevention, pp. 306–320
Seo K, Haile M, Kurita K, Yamazaki K, Nakamaru A (1996)Study of site effects in Kobe area using microtremors. Xth
236 J Seismol (2013) 17:223–237

World Conf. Earthq. Engng., Acapulco, 1656, ElsevierScience Ltd
Uhrhammer RA (2000) Background noise PSD analysis ofUSNSN broadband data for 1998. Berkeley SeismologicalLaboratory report, pp. 22
Uhrhammer RA, Karavas W, Romanowicz B (1998) Broadbandseismic station installation guidelines. Seism Res Lett69:15–26
Vila J (1998) The broadband seismic station CAD (Tunel delCadi, eastern Pyrenees): site characteristics and back-ground noise. Bull Seism Soc Am 88:297–303
Webb SC (1998) Broadband seismology and noise under theocean. Rev Geophys 36(1):105–142
Welch P (1967) The use of fast Fourier transform for theestimation of power spectra: a method based on time
averaging over short, modified periodograms. IEEE Trans.Audio Electroacoustics AU15, pp 70–73
Withers MM, Aster RC, Young CJ, Chael EP (1996) High frequen-cy analysis of seismic background noise as a function of windspeed and shallow depth. Bull Seism Soc Am 86:1507–1515
Young CJ, Chael EP, Withers MM, Aster RC (1996) A compar-ison of high frequency (>1 Hz) surface and subsurfacenoise environment at three sites in the United States. BullSeism Soc Am 86:1516–1528
Zhang J, Gerstoff P, Shearer PM (2009) High frequency P-waveseismic noise driven by ocean winds. Geophys Res Lett 36:L09302. doi:10.1029/2009/GL037761
Zürn W, Widmer R (1995) On noise-reduction in vertical seis-mic records below 2 mHz using local barometric-pressure.Geophys Res Lett 22:3537–3540
J Seismol (2013) 17:223–237 237