ventura county employees’ retirement...
TRANSCRIPT

VENTURA COUNTY EMPLOYEES’ RETIREMENT ASSOCIATION
BOARD OF RETIREMENT
BUSINESS MEETING
April 20, 2015
AGENDA
PLACE: Ventura County Employees' Retirement Association Second Floor Boardroom 1190 South Victoria Avenue Ventura, CA 93003
TIME: 9:00 a.m.
ITEM:
I. CALL TO ORDER Master Page No.
II. APPROVAL OF AGENDA 1 – 3
III. APPROVAL OF MINUTES
A. Disability Meeting of April 6, 2015. 4 – 13
IV. CONSENT AGENDA
A. Approve Regular and Deferred Retirements and SurvivorsContinuances for the Month of March 2015
14 – 15
B. Receive and File Report of Checks Disbursed in March 2015 16 – 24
C. Receive and File Statement of Fiduciary Net Position, Statement of Changes in Fiduciary Net Position, Schedule of Investment Management Fees, and Investments and Cash Equivalents for the Period Ending February 28, 2015
25 – 30
D. Receive and File Budget Summary for FY 2014-15 Month Ending March 31, 2015
31
MASTER PAGE NO. 1

BOARD OF RETIREMENT APRIL 20, 2015 AGENDA BUSINESS MEETING PAGE 2
V. ACTUARIAL INFORMATION
A. Actuarial Experience Study and Review of Economic Assumptions Paul Angelo, FSA and John Monroe, ASA of Segal Consulting
32 – 69
1. Analysis of Actuarial Experience During the Period ofJuly 1, 2011 through June 30, 2014
70 – 134
2. Review of Economic Actuarial Assumptions for theJune 30, 2015 Actuarial Valuation
135 – 160
VI. REVIEW AND RECOMMENDATIONS REGARDING INTERESTCREDITING POLICY
A. Staff Letter 161 – 162
B. Draft Interest Crediting Policy RECOMMENDED ACTION: Approve.
163 – 168
VII. INVESTMENT MANAGER PRESENTATIONS
A. Receive Annual Investment Presentation, Sprucegrove Investment Management, Craig Maerrigan, President, Brad Haughey, Vice President, and Mark Shevitz, Principal Fair Haven Partners (30 Minutes)
169 – 201
VIII. INVESTMENT INFORMATION
A. NEPC – Allan Martin, Partner, and Dan LeBeau, Consultant.
1. Receive Currency Hedging Implementation Presentation, Parametric Engineered Portfolio Solutions, Justin Henne, Managing Director.
202 – 226
2. Private Equity Program Review & 2015 StrategicInvestment PlanRECOMMENDED ACTION: Approve.
227 – 267
3. Preliminary Performance Report Month Ending March31, 2015RECOMMENDED ACTION: Receive and file.
268 – 274
MASTER PAGE NO. 2

BOARD OF RETIREMENT APRIL 20, 2015 AGENDA BUSINESS MEETING PAGE 3
VIII. INVESTMENT INFORMATION (continued)
B. Consideration of Quiet Period Per Trustee Communications Policy
1. Staff Letter 275
2. Trustee Communications Policy 276 – 280
IX. NEW BUSINESS
A. Recommendation to Approve Trustee Goulet’s Attendance at Nossaman LLP Public Pensions & Investments Fiduciaries Forum, September 24 – 25, 2015, San Francisco, CA.
281 – 282
B. Recommendation to Approve Ms. Nemiroff’s Attendance at the NAPPA Legal Education Conference, June 23 – 26, 2015, Austin, TX.
283 – 299
C. Ventura County Employees’ Retirement Information System (VCERIS) Pension Administration Project
1. VCERIS Project Monthly Status ReportRECOMMENDED ACTION: Receive and file.
300
X. INFORMATIONAL
A. Letter from Chair Towner to Assembly Member Das Williams for AB 1291
301
B. Invitation to Walter Scott Global Investment Management Lecture Series.
302
XI. PUBLIC COMMENT
XII. STAFF COMMENT
XIII. BOARD MEMBER COMMENT
XIV. ADJOURNMENT
MASTER PAGE NO. 3

VENTURA COUNTY EMPLOYEES’ RETIREMENT ASSOCIATION
BOARD OF RETIREMENT
DISABILITY MEETING
April 6, 2015
MINUTES DIRECTORS PRESENT:
Tracy Towner, Chair, Alternate Safety Employee Member William W. Wilson, Vice Chair, Public Member Steven Hintz, Treasurer-Tax Collector Peter C. Foy, Public Member Joseph Henderson, Public Member Mike Sedell, Public Member Deanna McCormick, General Employee Member Craig Winter, General Employee Member Chris Johnston, Safety Employee Member Arthur E. Goulet, Retiree Member Will Hoag, Alternate Retiree Member
DIRECTORS ABSENT:
None.
STAFF PRESENT:
Linda Webb, Retirement Administrator Henry Solis, Chief Financial Officer Lori Nemiroff, Assistant County Counsel Julie Stallings, Chief Operations Officer Vickie Williams, Retirement Benefits Manager Donna Edwards, Retirement Benefits Specialist Stephanie Caiazza, Program Assistant
PLACE: Ventura County Employees' Retirement Association Second Floor Boardroom 1190 South Victoria Avenue Ventura, CA 93003
TIME: 9:00 a.m.
MASTER PAGE NO. 4

BOARD OF RETIREMENT APRIL 6, 2015 MINUTES DISABILITY MEETING PAGE 2 ITEM:
I. CALL TO ORDER Chair Towner called the Disability Meeting of April 6, 2015, to order at 9:00 a.m.
II. APPROVAL OF AGENDA MOTION: Approve the Agenda. Moved by Johnston, seconded by Henderson. Vote: Motion carried Yes: Goulet, Foy, Johnston, Sedell, Winter, Hintz, Henderson, McCormick, Wilson No: -
III. APPROVAL OF MINUTES
A. Business Meeting of March 16, 2015. The following motion was made: MOTION: Approve. Moved by Henderson, seconded by Johnston. Vote: Motion carried Yes: Goulet, Foy, Johnston, Sedell, Winter, Hintz, Henderson, McCormick, Wilson No: -
B. Special Meeting of March 30, 2015. Ms. Webb offered two corrections to the March 30, 2015 minutes under “New Business Item III.A.2. AB 1291 with Proposed Amendments”. Ms. Webb recommended correcting the motion by replacing “co-sponsorship” with “formal approval”, and removing the phrase “before submission to legislative counsel”. The following motion was made: MOTION: Approve the minutes as amended.
MASTER PAGE NO. 5

BOARD OF RETIREMENT APRIL 6, 2015 MINUTES DISABILITY MEETING PAGE 3 Moved by Goulet, seconded by Henderson.
Vote: Motion carried Yes: Goulet, Foy, Johnston, Sedell, Winter, Hintz, Henderson, McCormick, Wilson No: -
IV. RECEIVE AND FILE PENDING DISABILITY APPLICATION STATUS REPORT MOTION: Approve. Moved by Wilson, seconded by Henderson. Vote: Motion carried Yes: Goulet, Foy, Johnston, Sedell, Winter, Hintz, Henderson, McCormick, Wilson No: -
V. APPLICATIONS FOR DISABILITY RETIREMENT
A. Application for Service Connected Disability Retirement, Robert Ameche; Case No. 12-034.
1. Application for Service Connected Disability Retirement and Supporting Documentation.
2. Hearing Notice Served on March 16, 2015.
Paul Hilbun and Stephen D. Roberson, Attorney at Law, were present on behalf of County of Ventura Risk Management. Michael Treger, Attorney at Law, was present on behalf of the applicant. Both parties declined to make a statement. Trustee Goulet requested the name of the author of one of the documents within the medical record, as it was not listed in the report. After clarification from Risk Management, the following motion was made: MOTION: Grant the applicant, Robert Ameche, a service connected disability retirement. Moved by Johnston, seconded by McCormick.
MASTER PAGE NO. 6
BOARD OF RETIREMENT APRIL 6, 2015 MINUTES DISABILITY MEETING PAGE 4
Vote: Motion carried Yes: Goulet, Foy, Johnston, Sedell, Winter, Hintz, Henderson, McCormick, Wilson No: - The parties agreed to waive preparations of Findings of Fact and Conclusions of Law.
B. Application for Service Connected Disability Retirement, Lawrence House; Case No. 13-029.
1. Application for Service Connected Disability Retirement and Supporting Documentation.
2. Hearing Notice Served on March 24, 2015. Paul Hilbun and Stephen D. Roberson, Attorney at Law, were present on behalf of County of Ventura Risk Management. David G. Schumaker, Attorney at Law, was present on behalf of the applicant. Both parties declined to make a statement. After discussion by the Board and Risk Management, the following motion was made: MOTION: Grant the applicant, Lawrence House, a service connected disability retirement. Moved by Hintz, seconded by Johnston. Vote: Motion carried Yes: Foy, Johnston, Sedell, Winter, Hintz, Henderson, McCormick, Wilson No: - Abstain: Goulet Trustee Goulet stated that he abstained from the vote on this application because he found the report from Risk Management to be deficient. The parties agreed to waive preparations of Findings of Fact and Conclusions of Law.
C. Application for Service Connected Disability Retirement, Thomas Law; Case No. 12-043.
MASTER PAGE NO. 7
BOARD OF RETIREMENT APRIL 6, 2015 MINUTES DISABILITY MEETING PAGE 5 1. Application for Service Connected Disability Retirement and
Supporting Documentation.
2. Hearing Notice Served on March 26, 2015. Paul Hilbun and Derek Straatsma, Attorney at Law, were present on behalf of County of Ventura Risk Management. Michael Treger, Attorney at Law, was present on behalf of the applicant. Both parties declined to make a statement. The following motion was made: MOTION: Grant the applicant, Thomas Law, a service connected disability retirement. Moved by Johnston, seconded by Henderson. Vote: Motion carried Yes: Goulet, Foy, Johnston, Sedell, Winter, Hintz, Henderson,
McCormick, Wilson No: - The parties agreed to waive preparations of Findings of Fact and Conclusions of Law.
D. Application for Service Connected Disability Retirement, Jeffrey Norcott; Case No. 12-038.
1. Application for Service Connected Disability Retirement and Supporting Documentation.
2. Hearing Notice Served on March 16, 2015. Paul Hilbun and John I. Gilman, Attorney at Law, were present on behalf of County of Ventura Risk Management. Michael Treger, Attorney at Law, was present on behalf of the applicant. Mr. Treger requested that the Board adopt the Hearing Officer’s recommendation. Risk Management declined to make a statement. Trustee Goulet commented that reports stating that no reasonable accommodation could be found should include a written statement from the employee’s department to support that claim. After discussion by the Board and Risk Management, the following
MASTER PAGE NO. 8

BOARD OF RETIREMENT APRIL 6, 2015 MINUTES DISABILITY MEETING PAGE 6
motion was made: MOTION: Grant the applicant, Jeffrey Norcott, a service connected disability retirement. Moved by Goulet, seconded by Johnston. Vote: Motion carried Yes: Goulet, Foy, Johnston, Sedell, Winter, Hintz, Henderson,
McCormick, Wilson No: - The parties agreed to waive preparations of Findings of Fact and Conclusions of Law.
E. Application for Service Connected Disability Retirement, William Ackerman; Case No. 12-035.
1. Summary of Evidence, Findings of Fact, Conclusions of Law and Recommendation, Submitted by Hearing Officer Louis M. Zigman, Dated February 12, 2015.
2. Hearing Notice Served on March 16, 2015. Paul Hilbun and John I. Gilman, Attorney at Law, were present on behalf of County of Ventura Risk Management. Michael Treger, Attorney at Law, was present on behalf of the applicant. Mr. Treger requested that the Board adopt the Hearing Officer’s recommendation. Mr. Gilman stated that Risk Management had no objection. After discussion by the Board, the following motion was made: MOTION: Adopt the Hearing Officer’s recommendation and grant the applicant, William Ackerman, a service connected disability retirement. Moved by Johnston, seconded by McCormick. Vote: Motion carried Yes: Goulet, Foy, Johnston, Sedell, Winter, Hintz, Henderson,
McCormick, Wilson No: -
MASTER PAGE NO. 9

BOARD OF RETIREMENT APRIL 6, 2015 MINUTES DISABILITY MEETING PAGE 7 VI. OLD BUSINESS
A. AB 1291 Report and Update from Chair, and Consideration of Approval to
Submit Proposed Amendment to Legislative Counsel.
1. AB 1291 with Proposed Amendments Chair Towner stated that the Ventura County Board of Supervisors did not take a formal position on the legislation. After discussion by the Board, the following motion was made: MOTION: Approve proposed changes to AB 1291 and approve expenses related to the Chair traveling to Sacramento to attend hearings or meetings as necessary to carry out the VCERA Board’s interest in passage of the bill. Moved by Wilson, seconded by Foy. Vote: Motion carried Yes: Foy, Johnston, Sedell, Winter, Hintz, Henderson, McCormick, Wilson No: - Abstain: Goulet
B. Distribution of SACRS Board of Directors Final Voting Slate 2015-16
1. Staff Letter
2. SACRS Board of Directors Elections 2015-16 – Final Ballot The following motion was made: MOTION: Approve San Joaquin CERA and Sacramento CERS proposed 2015-16 slate. Moved by Wilson. Motion failed for lack of a second. After discussion by the Board, the following motion was made: MOTION: Approve SACRS Nominating Committee recommended 2015-16 slate. Moved by McCormick, seconded by Johnston.
MASTER PAGE NO. 10
BOARD OF RETIREMENT APRIL 6, 2015 MINUTES DISABILITY MEETING PAGE 8
Vote: Motion carried Yes: Goulet, Foy, Johnston, Sedell, Winter, Hintz, Henderson,
McCormick, Wilson No: -
VII. CLOSED SESSION
A. CONFERENCE WITH LEGAL COUNSEL – EXISTING LITIGATION (Gov. Code section 54956.9) PURSUANT TO GOVERNMENT CODE SECTION 54956.9, SUBDIVISION (d)(1): NAME OF CASE: LANQUIST ET AL. v. VENTURA COUNTY EMPLOYEES’ RETIREMENT ASSOCIATION; 2d Civil No. B251179 (Super. Ct. No. 56-2011-404515-CU-WM-VTA )
VIII. NEW BUSINESS
A. Appointment of Chief Investment Officer Chair Towner announced that Mr. Dan Gallagher accepted the position of Chief Investment Officer, subject to confirmation by the Board of Retirement and final negotiation of salary and benefits. Staff distributed a revised version of the letter outlining the benefits of the position with the following corrections: the Cafeteria Plan was corrected to the 2015 rate of $297 per pay period; the Auto Allowance was removed because it was not applicable; and the CEBS Certification pay was corrected to 3.5% of base salary. After discussion by the Board, the following motion was made: MOTION: Confirm the appointment of Mr. Gallagher to the position of Chief Investment Officer; approve a base salary at a bi-weekly rate of $5,576.92 ($145,000 annually) with revised listed benefits; and approve the scheduling of an employee performance evaluation on Mr. Gallagher’s 6th, 12th, and 24th month anniversary dates, at which times the Board will consider granting merit based increases. Moved by Goulet, seconded by Henderson. Vote: Motion carried Yes: Goulet, Foy, Johnston, Sedell, Winter, Hintz, Henderson, McCormick,
Wilson No: -
B. 26th Annual Southern California Public Retirement Seminar Report, Submitted by Trustee McCormick
MASTER PAGE NO. 11
BOARD OF RETIREMENT APRIL 6, 2015 MINUTES DISABILITY MEETING PAGE 9
The following motion was made: MOTION: Receive and file. Moved by Goulet, seconded by Hintz. Vote: Motion carried Yes: Goulet, Foy, Johnston, Sedell, Winter, Hintz, Henderson, McCormick,
Wilson No: -
IX. INFORMATIONAL
A. SACRS Spring Conference Agenda; May 12 – 15, 2015; Anaheim, CA.
B. CALAPRS Principles of Pension Management for Trustees 2015; August 25
– 28, 2015; Pepperdine University in Malibu, CA.
C. GMO Roundtable Discussion; April 22, 2015; Beverly Hills, CA.
D. Opal Financial Group Annual Investment Trends Summit; September 28-
30, 2015; Santa Barbara, CA.
E. PIMCO 2015 Alternatives Investor Day; April 29-30, 2015; Newport Beach,
CA.
F. Letter from SACRS Affiliate Chair Michael Bowman.
G. Letter to SACRS System Trustees Regarding SACRS Affiliate Committee.
X. PUBLIC COMMENT
None.
XI. STAFF COMMENT Ms. Webb requested that the Board submit any suggestions that they may have for improvements to the VCERA website. These recommendations will be incorporated into a future proposal.
XII. BOARD MEMBER COMMENT Chair Towner informed the Board that the Business Meeting of April 20, 2015 will likely be a long meeting.
MASTER PAGE NO. 12

BOARD OF RETIREMENT APRIL 6, 2015 MINUTES DISABILITY MEETING PAGE 10 XIII.
ADJOURNMENT Upon completion of all other items on the agenda, the Board adjourned into Closed Session at 9:42 a.m. Upon returning to open session, Chair Towner announced that the Board had taken no reportable action. The meeting was adjourned at 11:00 a.m. Respectfully submitted,
___________________________________________ LINDA WEBB, Retirement Administrator Approved, ___________________________________ TRACY TOWNER, Chairman
MASTER PAGE NO. 13

DATE OF TOTAL OTHER EFFECTIVEFIRST NAME LAST NAME G/S MEMBERSHIP SERVICE SERVICE DEPARTMENT DATE
Milton B. Bagley G 7/21/1991 23.00 Health Care Agency 02/21/15
Philip Bohan G 3/9/1997 18.90 A=0.70510 Human Services Agency 02/14/15B=0.2351
Charlotte Carbone G 12/20/1981 33.10 Health Care Agency 02/28/15Sarah L. Craig G 7/17/1997 2.50 C=33.3205 Public Works Agency 02/16/15
(deferred)
Connie A. De La Rosa G 11/20/2005 18.70 A=10.82650 Human Services Agency 03/05/15Teresa Del Castillo G 3/17/1991 23.90 Human Services Agency 02/04/15Sylvia Escalante G 12/4/1994 26.00 A=5.6791 Superior Courts 02/28/15
B=0.1134Jon M. Gatewood G 2/25/1996 19.00 General Services Agency 02/27/15Ines V. Gonzalez G 4/1/1990 14.40 C=10.525 Resource Management Agency 12/31/14
(deferred)
Nancy J. Gray G 12/12/1976 38.00 Health Care Agency 02/14/15Robert A. Hartley G 2/16/1992 22.60 Resource Management Agency 02/14/15Daniel D. Jordan G 6/29/1986 24.90 B=0.09210 Health Care Agency 02/28/15
C=5.66670D=0.34700
Lauretta A. Kail G 8/11/1996 17.60 B=0.1150 Health Care Agency 02/11/15(deferred)
Brent L. Kerr S 08/29/1982 32.50 Sheriff's Department 02/14/15Margaret Kimbell-Drewry G 02/26/1995 20.00 CEO 02/28/15David King S 10/14/1990 3.00 Sheriff's Department 10/01/06
(deferred)
Maria L. Landeros G 07/22/2001 12.50 Health Care Agency 01/30/15Alice L. Lopez G 08/19/1979 22.80 Superior Courts 12/27/14
(deferred)
Faith L. Lugo G 02/05/89 27.20 A=1.2719 Human Services Agency 02/13/205Nancy J. Mahon G 08/02/10 10.00 A=5.4415 Health Care Agency 02/28/15Gladys V. Mena G 12/05/04 10.20 Human Serivces Agency 02/13/15John E. Miller S 07/08/84 30.60 Sheriff's Department 02/28/15Denise Mindoro S 04/13/10 6.03 Fire Protection 02/12/15
(non-member, deferred)
Alicia Pascua G 3/5/1989 26.60 B=0.69590 Human Services Agency 02/14/15Gilberto Puno G 5/4/1997 17.80 Human Services Agency 02/28/15Marta G. Rea G 5/27/1990 24.60 Human Serivces Agency 02/28/15Ronna L. Robledo S 12/29/1985 28.60 Probabtion Agency 02/12/15Raymond Rodriguez G 9/29/2002 5.40 Board of Supervisors 02/27/15
(deferred)
Kelly Shirk G 03/09/1986 29.30 B=0.4334 CEO 03/07/15Charles Singer G 10/01/1989 23.80 General Services Agency 02/23/15Star Soto G 12/09/1990 24.10 Library Services Agency 01/31/15Gary L. Stallings G 11/20/1983 31.30 B=0.11340 Sheriff's Department 02/01/15Linda Torres G 05/11/1980 34.70 Human Services Agency 02/21/15Ernesto G. Vasquez G 11/29/1976 40.20 D=1.9797 General Services Agency 02/07/15
Maneet Bhatti G 05/13/2012 2.80 C=6.3490 Human Services Agency 02/27/2015Jessica Carson G 10/08/2006 7.51 Health Care Agency 02/21/2015Dana Chavolla G 12/16/2002 9.29 Health Care Agency 02/14/2015Kenneth Hamilton G 01/27/2008 7.07 Public Defender 02/19/2015Rebecca Nelson G 05/21/1995 20.01 Public Defender 03/10/2015Joshua K. Scott G 09/07/2008 6.48 Assessor 03/03/2015Kirk M. Seitz G 10/18/2009 5.31 Health Care Agency 02/19/2015Mary K. Stanistreet G 12/16/2002 7.04 Health Care Agency 02/26/2015
SURVIVORS' CONTINUANCES:
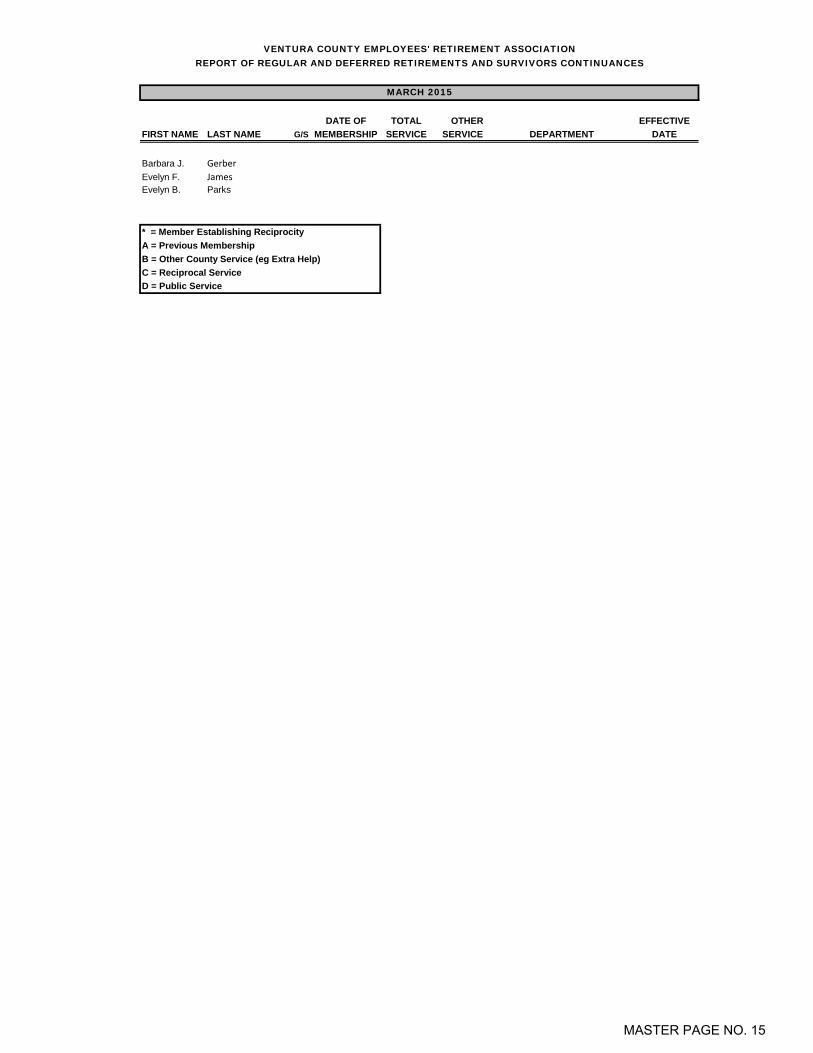
VENTURA COUNTY EMPLOYEES' RETIREMENT ASSOCIATIONREPORT OF REGULAR AND DEFERRED RETIREMENTS AND SURVIVORS CONTINUANCES
MARCH 2015
REGULAR RETIREMENTS:
DEFERRED RETIREMENTS:
MASTER PAGE NO. 14
DATE OF TOTAL OTHER EFFECTIVEFIRST NAME LAST NAME G/S MEMBERSHIP SERVICE SERVICE DEPARTMENT DATE
VENTURA COUNTY EMPLOYEES' RETIREMENT ASSOCIATIONREPORT OF REGULAR AND DEFERRED RETIREMENTS AND SURVIVORS CONTINUANCES
MARCH 2015
Barbara J. GerberEvelyn F. JamesEvelyn B. Parks
* = Member Establishing ReciprocityA = Previous MembershipB = Other County Service (eg Extra Help)C = Reciprocal ServiceD = Public Service
MASTER PAGE NO. 15

Closed Invoice Discount AmountDocRefCheck Check InvoiceCheck
Nbr Type DateVendor IDVendor Name Nbr Type Date Taken PaidNumberTo Post
Date:Time:User:
Thursday, April 02, 201510:30AM101602
Page:Report:Company:
1 of 903630.rptVCERA
Ventura County Retirement AssnCheck Register - Standard
Period: 09-15 As of: 4/2/2015
Period
Company: VCERAAcct / Sub: 1002 00
F3729B1 -5,365.90 0.00DEATH BENEFIT 2/18/2015VCKEVIN SHEPHARD
3/5/2015 VO09-15024825 01969109-15
Check Total -5,365.90 - Missing024880024826
F3729B1 5,365.90 0.00DEATH BENEFIT 2/18/2015CKKEVIN SHEPHARD
3/5/2015 VO024881 01969109-15
121118 27,213.26 0.00REFUND CONTRIB 3/5/2015CKDAVID B. SELMAN
3/5/2015 VO024882 01974609-15
121818 7,039.58 0.00REFUND CONTRIB 3/5/2015CKJOSIE SALINAS
3/5/2015 VO024883 01974709-15
124014R 428.11 0.00ROLLOVER 3/5/2015CKCHARLES SCHWAB & CO., INC.
3/5/2015 VO024884 01974809-15
124217 649.96 0.00REFUND CONTRIB 3/5/2015CKEFRAIN SANDOVAL
3/5/2015 VO024885 01974909-15
124542 1,214.77 0.00REFUND CONTRIB 3/5/2015CKAMY L. LANSTRA
3/5/2015 VO024886 01975009-15
124583 701.47 0.00REFUND CONTRIB 3/5/2015CKKIMBERLY A. KAGY
3/5/2015 VO024887 01975109-15
F0921B1 2,262.48 0.00DEATH BENEFIT 3/5/2015CKSTEPHEN D. JAMES
3/5/2015 VO024888 01975209-15
F0921B2 2,092.79 0.00DEATH BENEFIT 3/5/2015CKREGAN D. JAMES
3/5/2015 VO024889 01975309-15
F1145S 3,685.91 0.00DEATH BENEFIT 3/5/2015CKDONALD E. ASHLEY
3/5/2015 VO024890 01975409-15
F1420B1 2,030.13 0.00DEATH BENEFIT 3/5/2015CKMIKIO MUKAE
3/5/2015 VO024891 01975509-15
MASTER PAGE NO. 16

Closed Invoice Discount AmountDocRefCheck Check InvoiceCheck
Nbr Type DateVendor IDVendor Name Nbr Type Date Taken PaidNumberTo Post
Date:Time:User:
Thursday, April 02, 201510:30AM101602
Page:Report:Company:
2 of 903630.rptVCERA
Ventura County Retirement AssnCheck Register - Standard
Period: 09-15 As of: 4/2/2015
Period
F1420B2 1,877.88 0.00DEATH BENEFIT 3/5/2015CKHISAKO M. MUKAE
3/5/2015 VO024892 01975609-15
F1446S 2,769.49 0.00DEATH BENEFIT 3/5/2015CKDOROTHY J. NICHOLS
3/5/2015 VO024893 01975709-15
F2795B1 2,041.38 0.00DEATH BENEFIT 3/5/2015CKVIRGINIA CRETAL
3/5/2015 VO024894 01975809-15
F6775B1 118.01 0.00DEATH BENEFIT 3/5/2015CKVIRGINIA CRETAL
3/5/2015 VO024895 01975909-15
102661VCLORI NEMIROFF
3/5/2015 09-15024896 09-15
990002VCARTHUR E. GOULET
3/5/2015 09-15024897 09-15
BLACKROCKVCBLACKROCK INSTL TRUST CO, N.A.
3/5/2015 09-15024898 09-15
CPSVCCOOPERATIVE PERSONNEL SERVICES
3/5/2015 09-15024899 09-15
SPRUCEVCSPRUCEGROVE INVESTMENT MGMT
3/5/2015 09-15024900 09-15
102661 1,048.15 0.00TRAVEL REIMB 3/5/2015CKLORI NEMIROFF
3/5/2015 VO024901 01976009-15
990002 329.05 0.00TRAVEL REIMB 3/5/2015CKARTHUR E. GOULET
3/5/2015 VO024902 01976109-15
BLACKROCK 177,289.43 0.00INVESTMENT FEES 3/5/2015CKBLACKROCK INSTL TRUST CO, N.A.
3/5/2015 VO024903 01976209-15
CPS 5,862.57 0.00ADMIN EXP 3/5/2015CKCOOPERATIVE PERSONNEL SERVICES
3/5/2015 VO024904 01976309-15
SPRUCE 57,067.91 0.00INVESTMENT FEES 3/5/2015CKSPRUCEGROVE INVESTMENT MGMT
3/5/2015 VO024905 01976409-15
MASTER PAGE NO. 17
Closed Invoice Discount AmountDocRefCheck Check InvoiceCheck
Nbr Type DateVendor IDVendor Name Nbr Type Date Taken PaidNumberTo Post
Date:Time:User:
Thursday, April 02, 201510:30AM101602
Page:Report:Company:
3 of 903630.rptVCERA
Ventura County Retirement AssnCheck Register - Standard
Period: 09-15 As of: 4/2/2015
Period
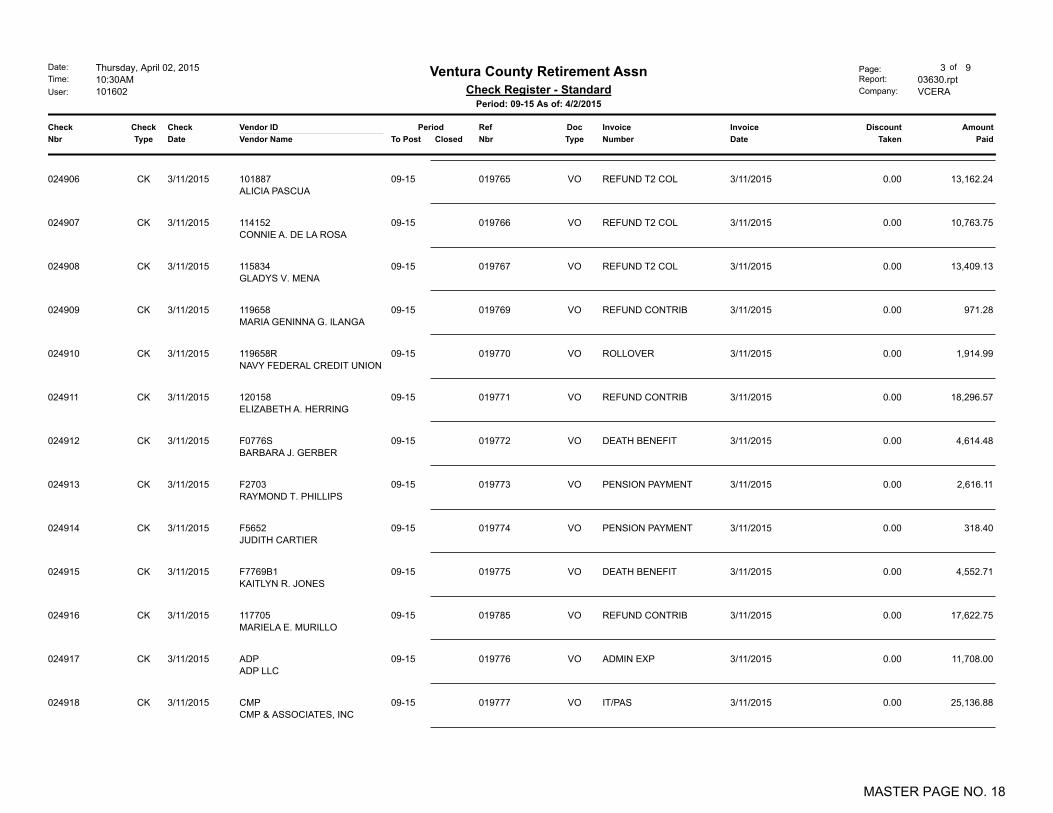
101887 13,162.24 0.00REFUND T2 COL 3/11/2015CKALICIA PASCUA
3/11/2015 VO024906 01976509-15
114152 10,763.75 0.00REFUND T2 COL 3/11/2015CKCONNIE A. DE LA ROSA
3/11/2015 VO024907 01976609-15
115834 13,409.13 0.00REFUND T2 COL 3/11/2015CKGLADYS V. MENA
3/11/2015 VO024908 01976709-15
119658 971.28 0.00REFUND CONTRIB 3/11/2015CKMARIA GENINNA G. ILANGA
3/11/2015 VO024909 01976909-15
119658R 1,914.99 0.00ROLLOVER 3/11/2015CKNAVY FEDERAL CREDIT UNION
3/11/2015 VO024910 01977009-15
120158 18,296.57 0.00REFUND CONTRIB 3/11/2015CKELIZABETH A. HERRING
3/11/2015 VO024911 01977109-15
F0776S 4,614.48 0.00DEATH BENEFIT 3/11/2015CKBARBARA J. GERBER
3/11/2015 VO024912 01977209-15
F2703 2,616.11 0.00PENSION PAYMENT 3/11/2015CKRAYMOND T. PHILLIPS
3/11/2015 VO024913 01977309-15
F5652 318.40 0.00PENSION PAYMENT 3/11/2015CKJUDITH CARTIER
3/11/2015 VO024914 01977409-15
F7769B1 4,552.71 0.00DEATH BENEFIT 3/11/2015CKKAITLYN R. JONES
3/11/2015 VO024915 01977509-15
117705 17,622.75 0.00REFUND CONTRIB 3/11/2015CKMARIELA E. MURILLO
3/11/2015 VO024916 01978509-15
ADP 11,708.00 0.00ADMIN EXP 3/11/2015CKADP LLC
3/11/2015 VO024917 01977609-15
CMP 25,136.88 0.00IT/PAS 3/11/2015CKCMP & ASSOCIATES, INC
3/11/2015 VO024918 01977709-15
MASTER PAGE NO. 18

Closed Invoice Discount AmountDocRefCheck Check InvoiceCheck
Nbr Type DateVendor IDVendor Name Nbr Type Date Taken PaidNumberTo Post
Date:Time:User:
Thursday, April 02, 201510:30AM101602
Page:Report:Company:
4 of 903630.rptVCERA
Ventura County Retirement AssnCheck Register - Standard
Period: 09-15 As of: 4/2/2015
Period
CORPORATE 1,528.55 0.00ADMIN EXP 3/11/2015CKSTAPLES ADVANTAGE
3/11/2015 VO024919 01977809-15
FOLEY 11,867.50 0.00LEGAL FEES 3/11/2015CKFOLEY AND LARDNER LLP
3/11/2015 VO024920 01977909-15
HARRIS 119.50 0.00ADMIN EXP 3/11/2015CKHARRIS WATER CONDITIONING INC
3/11/2015 VO024921 01978009-15
IF 4,695.00 0.00CONF SEM & TRAV 3/11/2015CKINTERNATIONAL FOUNDATION
3/11/2015 VO024922 01978109-15
LINEA 68,947.50 0.00IT/PAS 3/11/2015CKLINEA SOLUTIONS
3/11/2015 VO024923 01978209-15
VOLT 3,226.23 0.00ADMIN EXP/PAS 3/11/2015CKVOLT
3/11/2015 VO024924 01978309-15
VSG 19,500.00 0.00PAS 3/11/2015CKVSG HOSTING, INC
3/11/2015 VO024925 01978409-15
102267 17,658.93 0.00REFUND T2 COL 3/18/2015CKMARTA G. REA
3/18/2015 VO024926 01978609-15
102628 17,837.03 0.00REFUND T2 COL 3/18/2015CKMILTON G. BAGLEY
3/18/2015 VO024927 01978709-15
102753 23,672.04 0.00REFUND T2 COL 3/18/2015CKROBERT A. HARTLEY
3/18/2015 VO024928 01978809-15
103798 6,773.19 0.00REFUND T2 COL 3/18/2015CKJON M. GATEWOOD
3/18/2015 VO024929 01978909-15
107747 178.14 0.00REFUND CONTRIB 3/18/2015CKCHRISTOPHER J. GILLESPIE
3/18/2015 VO024930 01979009-15
119976 13,012.31 0.00REFUND CONTRIB 3/18/2015CKMONIQUE A. QUALLS
3/18/2015 VO024931 01979109-15
119997 19,110.35 0.00REFUND CONTRIB 3/18/2015CKYVONNE SEGURA
3/18/2015 VO024932 01979209-15
MASTER PAGE NO. 19

Closed Invoice Discount AmountDocRefCheck Check InvoiceCheck
Nbr Type DateVendor IDVendor Name Nbr Type Date Taken PaidNumberTo Post
Date:Time:User:
Thursday, April 02, 201510:30AM101602
Page:Report:Company:
5 of 903630.rptVCERA
Ventura County Retirement AssnCheck Register - Standard
Period: 09-15 As of: 4/2/2015
Period
121012 20,595.65 0.00REFUND CONTRIB 3/18/2015CKJANEY L. DUNN
3/18/2015 VO024933 01979309-15
122037R 682.13 0.00ROLLOVER 3/18/2015CKKNIGHTS OF COLUMBUS
3/18/2015 VO024934 01979409-15
F0129B1 4,464.75 0.00DEATH BENEFIT 3/18/2015CKAMRHINE 1985 FAMILY TRUST OF 09/25/85
3/18/2015 VO024935 01979509-15
F1015S 3,829.74 0.00DEATH BENEFIT 3/18/2015CKEVELYN F. JAMES
3/18/2015 VO024936 01979609-15
F1509S 2,607.42 0.00DEATH BENEFIT 3/18/2015CKEVELYN B. PARKS
3/18/2015 VO024937 01979709-15
F2795B2 2,206.89 0.00DEATH BENEFIT 3/18/2015CKELAINE D. KINGSLEY
3/18/2015 VO024938 01979809-15
F3216 351.70 0.00PENSION PAYMENT 3/18/2015CKCONNIE L. RICHARDSON
3/18/2015 VO024939 01979909-15
F6443B2 1,291.44 0.00DEATH BENEFIT 3/18/2015CKSALVADOR ESTRELLA JR.
3/18/2015 VO024940 01980009-15
F6775B2 118.00 0.00DEATH BENEFIT 3/18/2015CKELAINE D. KINGSLEY
3/18/2015 VO024941 01980109-15
XXX3404B1 27,755.51 0.00DEATH BENEFIT 3/18/2015CKWILFRED R. DOTTS
3/18/2015 VO024942 01980209-15
124709 1,000.00 0.00TRAVEL REIMB 3/18/2015CKLINDA WEBB
3/18/2015 VO024943 01980309-15
990007 374.20 0.00TRAVEL REIMB 3/18/2015CKDEANNA MCCORMICK
3/18/2015 VO024944 01980409-15
ACCESS 331.34 0.00ADMIN EXP 3/26/2015CKACCESS INFORMATION MANAGEMENT
3/26/2015 VO024945 01980509-15
MASTER PAGE NO. 20

Closed Invoice Discount AmountDocRefCheck Check InvoiceCheck
Nbr Type DateVendor IDVendor Name Nbr Type Date Taken PaidNumberTo Post
Date:Time:User:
Thursday, April 02, 201510:30AM101602
Page:Report:Company:
6 of 903630.rptVCERA
Ventura County Retirement AssnCheck Register - Standard
Period: 09-15 As of: 4/2/2015
Period
AT&T 289.05 0.00IT 3/26/2015CKAT & T MOBILITY
3/26/2015 VO024946 01980609-15
BOFA 1,727.13 0.00ADMIN EX/PAS/IT 3/26/2015CKBUSINESS CARD
3/26/2015 VO024947 01980709-15
COMPUWAVE 655.45 0.00IT 3/26/2015CKCOMPUWAVE
3/26/2015 VO024948 01980809-15
CORPORATE 558.96 0.00ADMIN EXP 3/26/2015CKSTAPLES ADVANTAGE
3/26/2015 VO024949 01980909-15
MEGAPATH 603.63 0.00IT/PAS 3/26/2015CKGLOBAL CAPACITY
3/26/2015 VO024950 01981009-15
MF 16,558.14 0.00ADMIN EXP 3/26/2015CKM.F. DAILY CORPORATION
3/26/2015 VO024951 01981109-15
NEPC 70,750.00 0.00INVESTMENT FEES 3/26/2015CKNEPC, LLC
3/26/2015 VO024952 01981209-15
RETJOURNAL 195.00 0.00ADMIN EXP 3/26/2015CKTHE PUBLIC RETIREMENT JOURNAL
3/26/2015 VO024953 01981309-15
S&L ADV 2,500.00 0.00ADMIN EXP 3/26/2015CKSCHOTT & LITES ADVOCATES
3/26/2015 VO024954 01981409-15
SEGAL 22,365.00 0.00ACTUARY FEES 3/26/2015CKSEGAL CONSULTING
3/26/2015 VO024955 01981509-15
SHRED-IT 130.40 0.00ADMIN EXP 3/26/2015CKSHRED-IT USA
3/26/2015 VO024956 01981609-15
SMARTBEAR 1,482.30 0.00PAS 3/26/2015CKSMARTBEAR SOFTWARE, INC
3/26/2015 VO024957 01981709-15
STAR 283.03 0.00ADMIN EXP 3/26/2015CKVENTURA COUNTY STAR
3/26/2015 VO024958 01981809-15
STATE 8,049.86 0.00INVESTMENT FEES 3/26/2015CKSTATE STREET BANK AND TRUST
3/26/2015 VO024959 01981909-15
MASTER PAGE NO. 21

Closed Invoice Discount AmountDocRefCheck Check InvoiceCheck
Nbr Type DateVendor IDVendor Name Nbr Type Date Taken PaidNumberTo Post
Date:Time:User:
Thursday, April 02, 201510:30AM101602
Page:Report:Company:
7 of 903630.rptVCERA
Ventura County Retirement AssnCheck Register - Standard
Period: 09-15 As of: 4/2/2015
Period
TWC 481.97 0.00IT 3/26/2015CKTIME WARNER CABLE
3/26/2015 VO024960 01982009-15
VOLT 2,724.84 0.00ADMIN EXP/PAS 3/26/2015CKVOLT
3/26/2015 VO024961 01982109-15
CA SDU 1,052.47 0.00CRT ORDERED PMT 3/27/2015CKCALIFORNIA STATE
3/27/2015 VO024962 01982209-15
CALPERS 18,263.04 0.00INSURANCE 3/27/2015CKCALPERS LONG-TERM
3/27/2015 VO024963 01982309-15
CHILD21 171.74 0.00CRT ORDERED PMT 3/27/2015CKOREGON DEPT OF JUSTICE
3/27/2015 VO024964 01982409-15
CHILD5 511.00 0.00CRT ORDERED PMT 3/27/2015CKSTATE DISBURSEMENT UNIT (SDU)
3/27/2015 VO024965 01982509-15
CHILD9 260.00 0.00CRT ORDERED PMT 3/27/2015CKSHERIDA SEGALL
3/27/2015 VO024966 01982609-15
CVMP 587,982.30 0.00INSURANCE 3/27/2015CKCOUNTY OF VENTURA
3/27/2015 VO024967 01982709-15
FTBCA3 137.26 0.00GARNISHMENT 3/27/2015CKFRANCHISE TAX BOARD
3/27/2015 VO024968 01982809-15
IRS6 321.00 0.00GARNISHMENT 3/27/2015CKINTERNAL REVENUE SERVICE
3/27/2015 VO024969 01982909-15
IRS7 500.00 0.00GARNISHMENT 3/27/2015CKINTERNAL REVENUE SERVICE
3/27/2015 VO024970 01983009-15
REAVC 4,278.00 0.00DUES 3/27/2015CKRETIRED EMPLOYEES' ASSOCIATION
3/27/2015 VO024971 01983109-15
SEIU 303.50 0.00DUES 3/27/2015CKSEIU LOCAL 721
3/27/2015 VO024972 01983209-15
MASTER PAGE NO. 22
Closed Invoice Discount AmountDocRefCheck Check InvoiceCheck
Nbr Type DateVendor IDVendor Name Nbr Type Date Taken PaidNumberTo Post
Date:Time:User:
Thursday, April 02, 201510:30AM101602
Page:Report:Company:
8 of 903630.rptVCERA
Ventura County Retirement AssnCheck Register - Standard
Period: 09-15 As of: 4/2/2015
Period
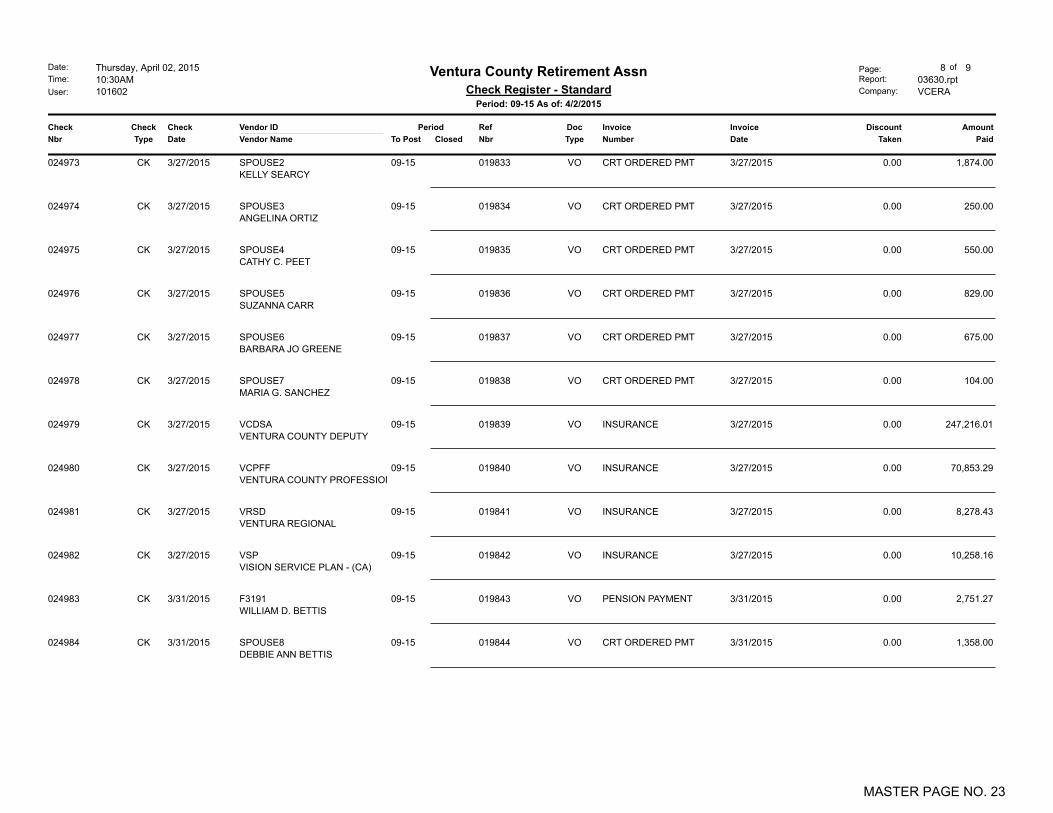
SPOUSE2 1,874.00 0.00CRT ORDERED PMT 3/27/2015CKKELLY SEARCY
3/27/2015 VO024973 01983309-15
SPOUSE3 250.00 0.00CRT ORDERED PMT 3/27/2015CKANGELINA ORTIZ
3/27/2015 VO024974 01983409-15
SPOUSE4 550.00 0.00CRT ORDERED PMT 3/27/2015CKCATHY C. PEET
3/27/2015 VO024975 01983509-15
SPOUSE5 829.00 0.00CRT ORDERED PMT 3/27/2015CKSUZANNA CARR
3/27/2015 VO024976 01983609-15
SPOUSE6 675.00 0.00CRT ORDERED PMT 3/27/2015CKBARBARA JO GREENE
3/27/2015 VO024977 01983709-15
SPOUSE7 104.00 0.00CRT ORDERED PMT 3/27/2015CKMARIA G. SANCHEZ
3/27/2015 VO024978 01983809-15
VCDSA 247,216.01 0.00INSURANCE 3/27/2015CKVENTURA COUNTY DEPUTY
3/27/2015 VO024979 01983909-15
VCPFF 70,853.29 0.00INSURANCE 3/27/2015CKVENTURA COUNTY PROFESSIONAL
3/27/2015 VO024980 01984009-15
VRSD 8,278.43 0.00INSURANCE 3/27/2015CKVENTURA REGIONAL
3/27/2015 VO024981 01984109-15
VSP 10,258.16 0.00INSURANCE 3/27/2015CKVISION SERVICE PLAN - (CA)
3/27/2015 VO024982 01984209-15
F3191 2,751.27 0.00PENSION PAYMENT 3/31/2015CKWILLIAM D. BETTIS
3/31/2015 VO024983 01984309-15
SPOUSE8 1,358.00 0.00CRT ORDERED PMT 3/31/2015CKDEBBIE ANN BETTIS
3/31/2015 VO024984 01984409-15
MASTER PAGE NO. 23

Closed Invoice Discount AmountDocRefCheck Check InvoiceCheck
Nbr Type DateVendor IDVendor Name Nbr Type Date Taken PaidNumberTo Post
Date:Time:User:
Thursday, April 02, 201510:30AM101602
Page:Report:Company:
9 of 903630.rptVCERA
Ventura County Retirement AssnCheck Register - Standard
Period: 09-15 As of: 4/2/2015
Period
Check Count: 105 Acct Sub Total: 1,782,676.89
Amount PaidCountCheck Type
1,788,042.7999Regular
0.000Hand
-5,365.906Void
0.000Stub
Zero 0.000Mask 0 0.00Total: 105 1,782,676.89
Electronic Payment 0 0.00
Company Total 1,782,676.89Company Disc Total 0.00
MASTER PAGE NO. 24
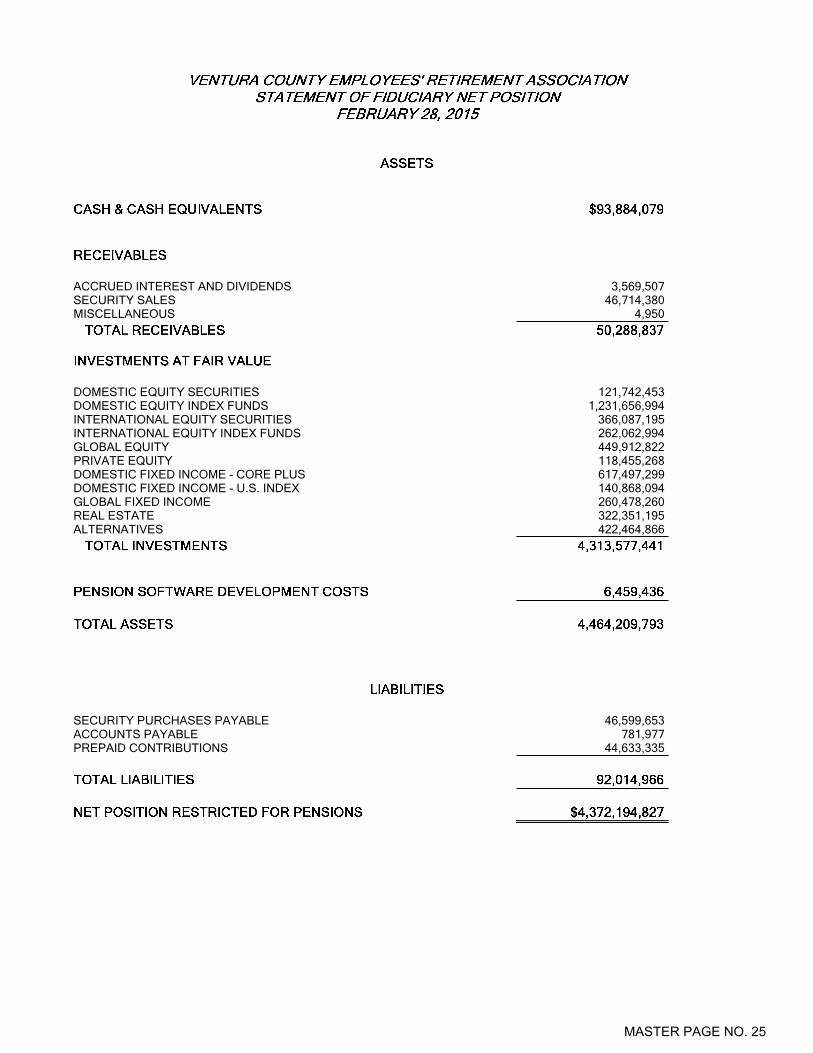
ACCRUED INTEREST AND DIVIDENDS 3,569,507SECURITY SALES 46,714,380MISCELLANEOUS 4,950
DOMESTIC EQUITY SECURITIES 121,742,453DOMESTIC EQUITY INDEX FUNDS 1,231,656,994INTERNATIONAL EQUITY SECURITIES 366,087,195INTERNATIONAL EQUITY INDEX FUNDS 262,062,994GLOBAL EQUITY 449,912,822PRIVATE EQUITY 118,455,268DOMESTIC FIXED INCOME - CORE PLUS 617,497,299DOMESTIC FIXED INCOME - U.S. INDEX 140,868,094GLOBAL FIXED INCOME 260,478,260REAL ESTATE 322,351,195ALTERNATIVES 422,464,866
SECURITY PURCHASES PAYABLE 46,599,653ACCOUNTS PAYABLE 781,977PREPAID CONTRIBUTIONS 44,633,335
MASTER PAGE NO. 25
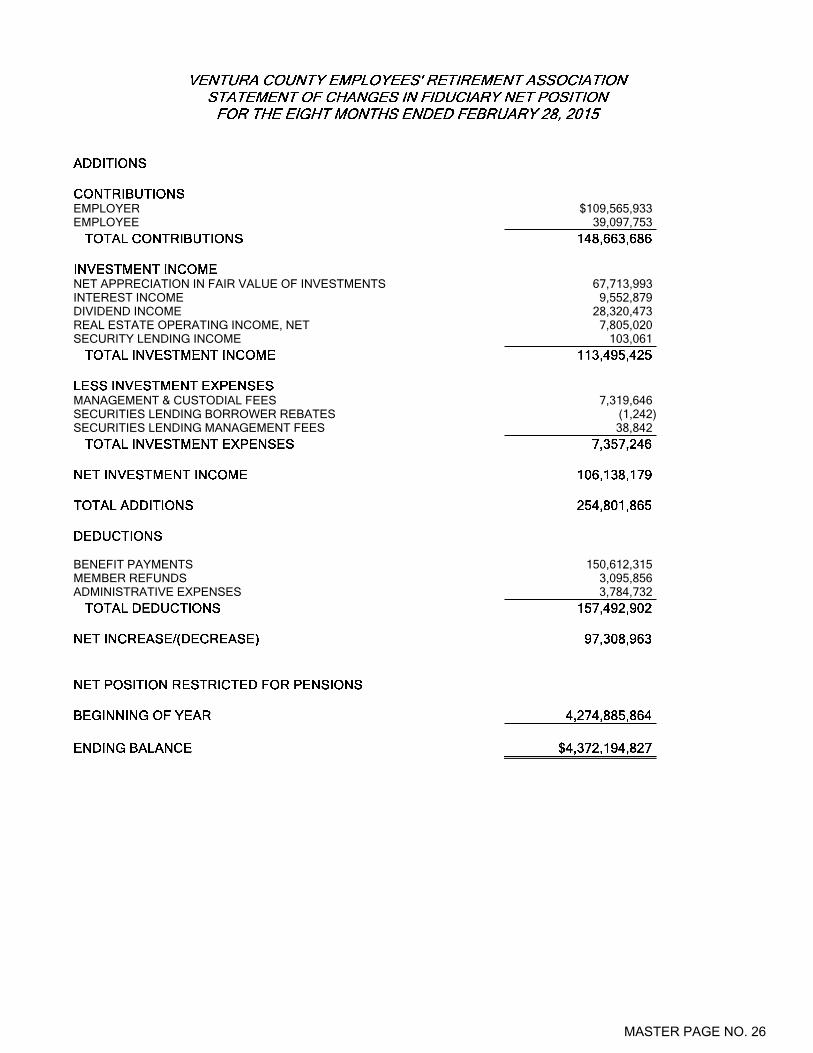
EMPLOYER $109,565,933EMPLOYEE 39,097,753
NET APPRECIATION IN FAIR VALUE OF INVESTMENTS 67,713,993INTEREST INCOME 9,552,879DIVIDEND INCOME 28,320,473REAL ESTATE OPERATING INCOME, NET 7,805,020SECURITY LENDING INCOME 103,061
MANAGEMENT & CUSTODIAL FEES 7,319,646SECURITIES LENDING BORROWER REBATES (1,242)SECURITIES LENDING MANAGEMENT FEES 38,842
BENEFIT PAYMENTS 150,612,315MEMBER REFUNDS 3,095,856ADMINISTRATIVE EXPENSES 3,784,732
MASTER PAGE NO. 26

BLACKROCK - US EQUITY $123,220BLACKROCK - EXTENDED EQUITY 9,071WESTERN ASSET INDEX PLUS 126,755
BLACKROCK - ACWIXUS 130,440SPRUCEGROVE 351,055HEXAVEST 185,830WALTER SCOTT 412,189
GRANTHAM MAYO VAN OTTERLOO (GMO) 793,616BLACKROCK - GLOBAL INDEX 44,853
ADAMS STREET 821,608HARBOURVEST 183,456PANTHEON 75,000
BLACKROCK - US DEBT INDEX 47,558LOOMIS, SAYLES AND COMPANY 142,503REAMS ASSET MANAGEMENT 358,124WESTERN ASSET MANAGEMENT 247,911
LOOMIS, SAYLES AND COMPANY 142,414LOOMIS ALPHA 84,438PIMCO 213,961
PRUDENTIAL REAL ESTATE ADVISORS 396,586RREEF 69,094UBS REALTY 982,634
BRIDGEWATER 547,561TORTOISE 467,608
MASTER PAGE NO. 27

BORROWERS REBATE (1,242)MANAGEMENT FEES 38,842
INVESTMENT CONSULTANT 138,826INVESTMENT CUSTODIAN 169,424
MASTER PAGE NO. 28
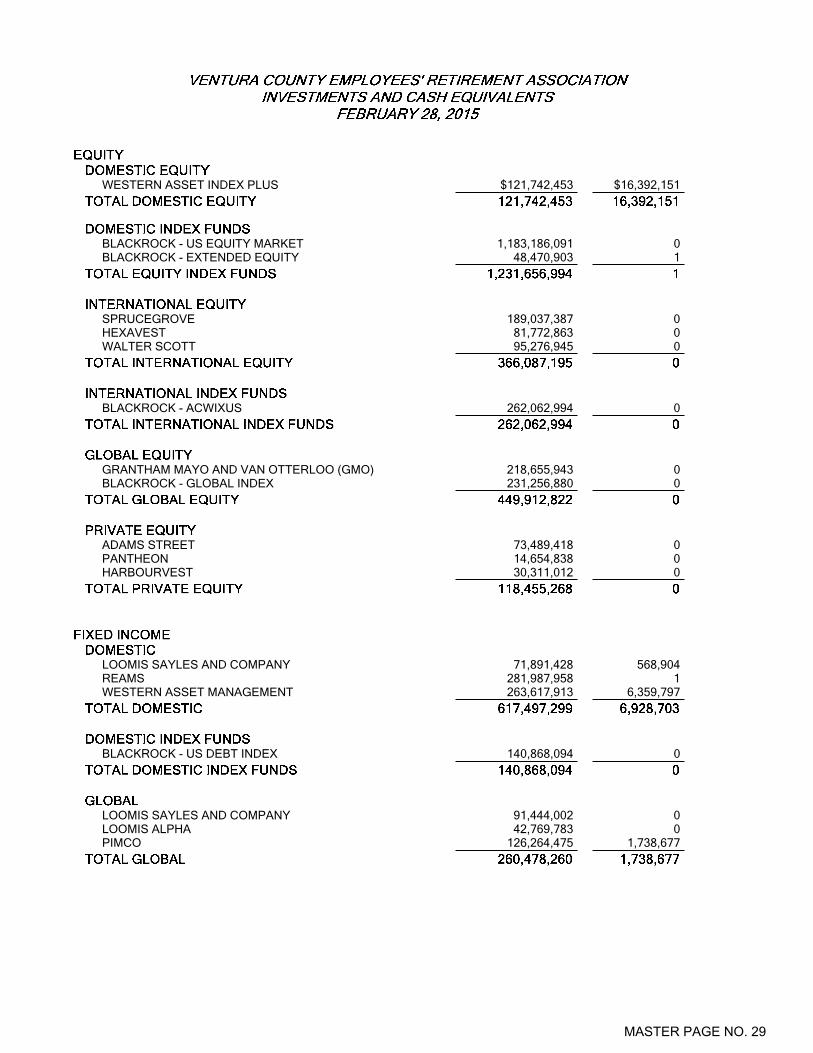
WESTERN ASSET INDEX PLUS $121,742,453 $16,392,151
BLACKROCK - US EQUITY MARKET 1,183,186,091 0BLACKROCK - EXTENDED EQUITY 48,470,903 1
SPRUCEGROVE 189,037,387 0HEXAVEST 81,772,863 0WALTER SCOTT 95,276,945 0
BLACKROCK - ACWIXUS 262,062,994 0
GRANTHAM MAYO AND VAN OTTERLOO (GMO) 218,655,943 0BLACKROCK - GLOBAL INDEX 231,256,880 0
ADAMS STREET 73,489,418 0PANTHEON 14,654,838 0HARBOURVEST 30,311,012 0
LOOMIS SAYLES AND COMPANY 71,891,428 568,904REAMS 281,987,958 1WESTERN ASSET MANAGEMENT 263,617,913 6,359,797
BLACKROCK - US DEBT INDEX 140,868,094 0
LOOMIS SAYLES AND COMPANY 91,444,002 0LOOMIS ALPHA 42,769,783 0PIMCO 126,264,475 1,738,677
MASTER PAGE NO. 29

PRUDENTIAL REAL ESTATE 107,886,266 0RREEF 6,240,585 0UBS REALTY 208,224,343 0
BRIDGEWATER 282,096,525 0TORTOISE (MLP's) 140,368,341 5,815,767
MASTER PAGE NO. 30
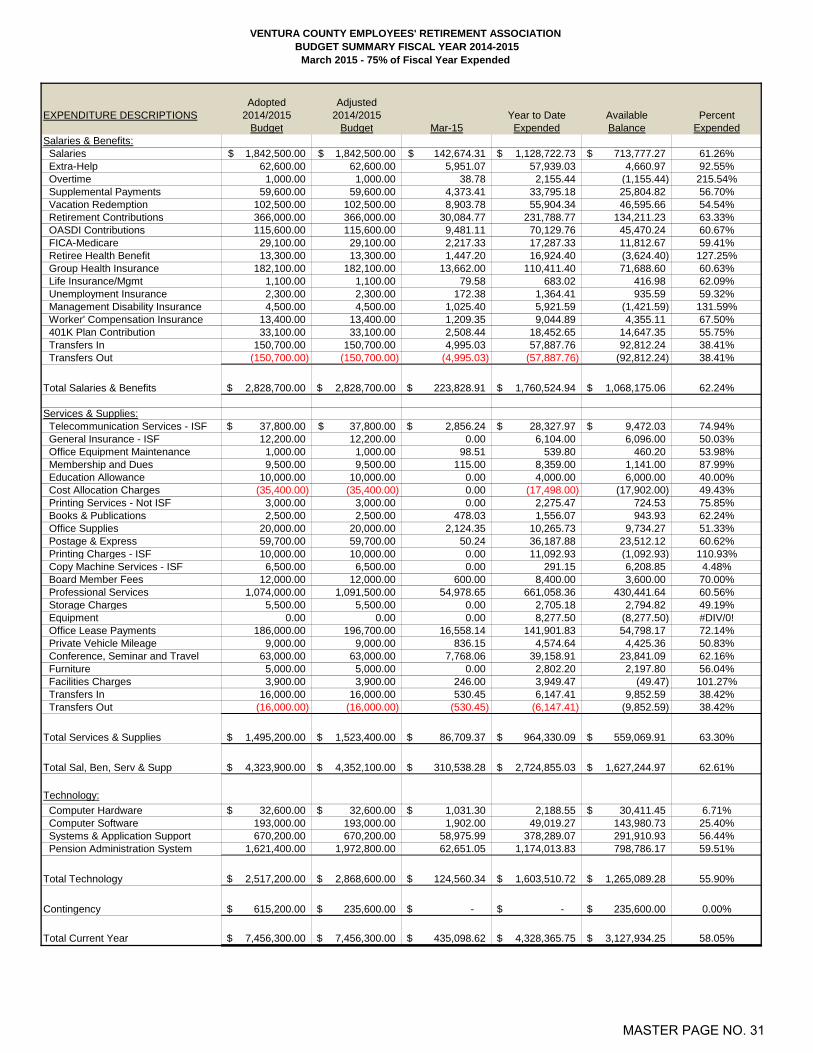
VENTURA COUNTY EMPLOYEES' RETIREMENT ASSOCIATION BUDGET SUMMARY FISCAL YEAR 2014-2015
March 2015 - 75% of Fiscal Year Expended
Adopted AdjustedEXPENDITURE DESCRIPTIONS 2014/2015 2014/2015 Year to Date Available Percent
Budget Budget Mar-15 Expended Balance ExpendedSalaries & Benefits: Salaries 1,842,500.00$ 1,842,500.00$ 142,674.31$ 1,128,722.73$ 713,777.27$ 61.26% Extra-Help 62,600.00 62,600.00 5,951.07 57,939.03 4,660.97 92.55% Overtime 1,000.00 1,000.00 38.78 2,155.44 (1,155.44) 215.54% Supplemental Payments 59,600.00 59,600.00 4,373.41 33,795.18 25,804.82 56.70% Vacation Redemption 102,500.00 102,500.00 8,903.78 55,904.34 46,595.66 54.54% Retirement Contributions 366,000.00 366,000.00 30,084.77 231,788.77 134,211.23 63.33% OASDI Contributions 115,600.00 115,600.00 9,481.11 70,129.76 45,470.24 60.67% FICA-Medicare 29,100.00 29,100.00 2,217.33 17,287.33 11,812.67 59.41% Retiree Health Benefit 13,300.00 13,300.00 1,447.20 16,924.40 (3,624.40) 127.25% Group Health Insurance 182,100.00 182,100.00 13,662.00 110,411.40 71,688.60 60.63% Life Insurance/Mgmt 1,100.00 1,100.00 79.58 683.02 416.98 62.09% Unemployment Insurance 2,300.00 2,300.00 172.38 1,364.41 935.59 59.32% Management Disability Insurance 4,500.00 4,500.00 1,025.40 5,921.59 (1,421.59) 131.59% Worker' Compensation Insurance 13,400.00 13,400.00 1,209.35 9,044.89 4,355.11 67.50% 401K Plan Contribution 33,100.00 33,100.00 2,508.44 18,452.65 14,647.35 55.75% Transfers In 150,700.00 150,700.00 4,995.03 57,887.76 92,812.24 38.41% Transfers Out (150,700.00) (150,700.00) (4,995.03) (57,887.76) (92,812.24) 38.41%
Total Salaries & Benefits 2,828,700.00$ 2,828,700.00$ 223,828.91$ 1,760,524.94$ 1,068,175.06$ 62.24%
Services & Supplies: Telecommunication Services - ISF 37,800.00$ 37,800.00$ 2,856.24$ 28,327.97$ 9,472.03$ 74.94% General Insurance - ISF 12,200.00 12,200.00 0.00 6,104.00 6,096.00 50.03% Office Equipment Maintenance 1,000.00 1,000.00 98.51 539.80 460.20 53.98% Membership and Dues 9,500.00 9,500.00 115.00 8,359.00 1,141.00 87.99% Education Allowance 10,000.00 10,000.00 0.00 4,000.00 6,000.00 40.00% Cost Allocation Charges (35,400.00) (35,400.00) 0.00 (17,498.00) (17,902.00) 49.43% Printing Services - Not ISF 3,000.00 3,000.00 0.00 2,275.47 724.53 75.85% Books & Publications 2,500.00 2,500.00 478.03 1,556.07 943.93 62.24% Office Supplies 20,000.00 20,000.00 2,124.35 10,265.73 9,734.27 51.33% Postage & Express 59,700.00 59,700.00 50.24 36,187.88 23,512.12 60.62% Printing Charges - ISF 10,000.00 10,000.00 0.00 11,092.93 (1,092.93) 110.93% Copy Machine Services - ISF 6,500.00 6,500.00 0.00 291.15 6,208.85 4.48% Board Member Fees 12,000.00 12,000.00 600.00 8,400.00 3,600.00 70.00% Professional Services 1,074,000.00 1,091,500.00 54,978.65 661,058.36 430,441.64 60.56% Storage Charges 5,500.00 5,500.00 0.00 2,705.18 2,794.82 49.19% Equipment 0.00 0.00 0.00 8,277.50 (8,277.50) #DIV/0! Office Lease Payments 186,000.00 196,700.00 16,558.14 141,901.83 54,798.17 72.14% Private Vehicle Mileage 9,000.00 9,000.00 836.15 4,574.64 4,425.36 50.83% Conference, Seminar and Travel 63,000.00 63,000.00 7,768.06 39,158.91 23,841.09 62.16% Furniture 5,000.00 5,000.00 0.00 2,802.20 2,197.80 56.04% Facilities Charges 3,900.00 3,900.00 246.00 3,949.47 (49.47) 101.27% Transfers In 16,000.00 16,000.00 530.45 6,147.41 9,852.59 38.42% Transfers Out (16,000.00) (16,000.00) (530.45) (6,147.41) (9,852.59) 38.42%
Total Services & Supplies 1,495,200.00$ 1,523,400.00$ 86,709.37$ 964,330.09$ 559,069.91$ 63.30%
Total Sal, Ben, Serv & Supp 4,323,900.00$ 4,352,100.00$ 310,538.28$ 2,724,855.03$ 1,627,244.97$ 62.61%
Technology: Computer Hardware 32,600.00$ 32,600.00$ 1,031.30$ 2,188.55 30,411.45$ 6.71% Computer Software 193,000.00 193,000.00 1,902.00 49,019.27 143,980.73 25.40% Systems & Application Support 670,200.00 670,200.00 58,975.99 378,289.07 291,910.93 56.44% Pension Administration System 1,621,400.00 1,972,800.00 62,651.05 1,174,013.83 798,786.17 59.51%
Total Technology 2,517,200.00$ 2,868,600.00$ 124,560.34$ 1,603,510.72$ 1,265,089.28$ 55.90%
Contingency 615,200.00$ 235,600.00$ -$ -$ 235,600.00$ 0.00%
Total Current Year 7,456,300.00$ 7,456,300.00$ 435,098.62$ 4,328,365.75$ 3,127,934.25$ 58.05%
MASTER PAGE NO. 31

Copyright © 2015 by The Segal Group, Inc. All rights reserved.
Actuarial Experience Study
April 20, 2015
Ventura County Employees’ Retirement Association
Paul Angelo, FSA
John Monroe, ASA
Segal Consulting, San Francisco
5361434v1MASTER PAGE NO. 32
2
Actuarial assumptions – two kinds• Demographic
– When benefits will be payable– Amount of benefits
• Economic – How assets grow– How salaries increase
Actuarial Assumptions
MASTER PAGE NO. 33

3
Rates of “decrement”•Termination, mortality, disability, retirement•Termination
– Withdrawal– Deferred vested
•Mortality:– Before and after retirement– Service connected or not– Service, disability, beneficiary
Percent married Member/spouse age differenceReciprocityAssumptions can be distinct for General and Safety
Demographic Assumptions
MASTER PAGE NO. 34
4
Inflation - component, plus COLAInvestment return•Real returnSalary increases•Real wage increases (“across the board”)•Merit and promotion (included with demographic
assumptions)In-Service Redemptions: also “demographic”
Economic Assumptions
MASTER PAGE NO. 35
5
Objective, long term Recent experience of future expectations•Demographic: recent experience•Economic: not necessarily! Client specific or not Consistency among assumptions Desired pattern of cost incidence•Good assumptions produce level cost•Beware “results based” assumptions!
Selection of Actuarial Assumptions
MASTER PAGE NO. 36
6
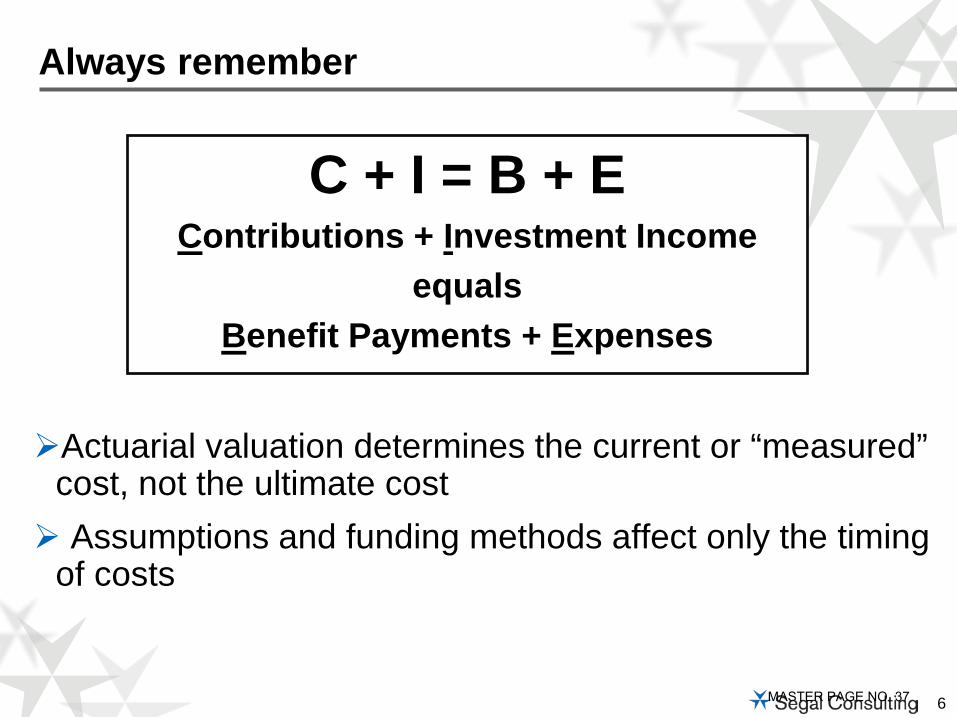
Actuarial valuation determines the current or “measured” cost, not the ultimate cost Assumptions and funding methods affect only the timing
of costs
Always remember
C + I = B + EContributions + Investment Income
equalsBenefit Payments + Expenses
MASTER PAGE NO. 37
7
To determine rates for each assumption we count the “decrements” and “exposures” for that event•Exposures = Number of employees who could have
terminated, retired, etc.•Decrements = Number of employees who actually
terminated, retired, etc.•This gives the “actual” decrement rates during the periodCompare to the “current” assumed rates (or to expected
number of decrements based on those current rates)Develop “proposed” new assumption based on both
“current” assumption and recent “actual” experience•Weight the “actual” based on “credibility”
Setting Demographic Assumptions
MASTER PAGE NO. 38

8
Setting Demographic Assumption – Retirement Rates
Retirement Rates from Experience Study
0%
5%
10%
15%
20%
25%
30%
35%
40%
45%
50%
55%
50 51 52 53 54 55 56 57 58 59 60 61 62 63 64 65 66 67 68 69
Age
Chart 1 Retirement Rates – Non-PEPRA General Members
Current Actual Proposed
MASTER PAGE NO. 39

9
Retirement rates:• Slightly later retirements for both General and SafetyTermination rates:•Change from service/age based to service based
– Decrease termination rates for both General and Safety•Maintain current assumption that member will choose a refund or
deferred benefit based on which option is more valuableDisability incidence:•Decreased for both General and SafetyIn-Service Redemptions:•Decreased the assumptions for both non-PEPRA General Tier 1
and non-PEPRA Safety
Recommendations - Demographic
MASTER PAGE NO. 40
10
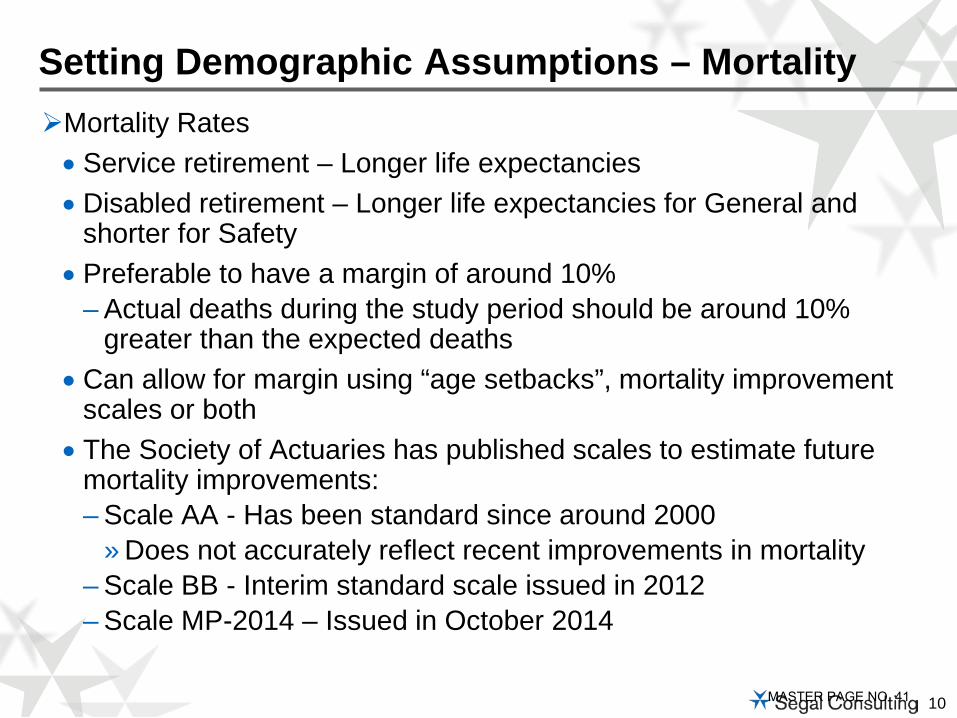
Mortality Rates• Service retirement – Longer life expectancies • Disabled retirement – Longer life expectancies for General and
shorter for Safety• Preferable to have a margin of around 10%
– Actual deaths during the study period should be around 10% greater than the expected deaths
• Can allow for margin using “age setbacks”, mortality improvement scales or both
• The Society of Actuaries has published scales to estimate future mortality improvements:– Scale AA - Has been standard since around 2000
» Does not accurately reflect recent improvements in mortality– Scale BB - Interim standard scale issued in 2012– Scale MP-2014 – Issued in October 2014
Setting Demographic Assumptions – Mortality
MASTER PAGE NO. 41
11
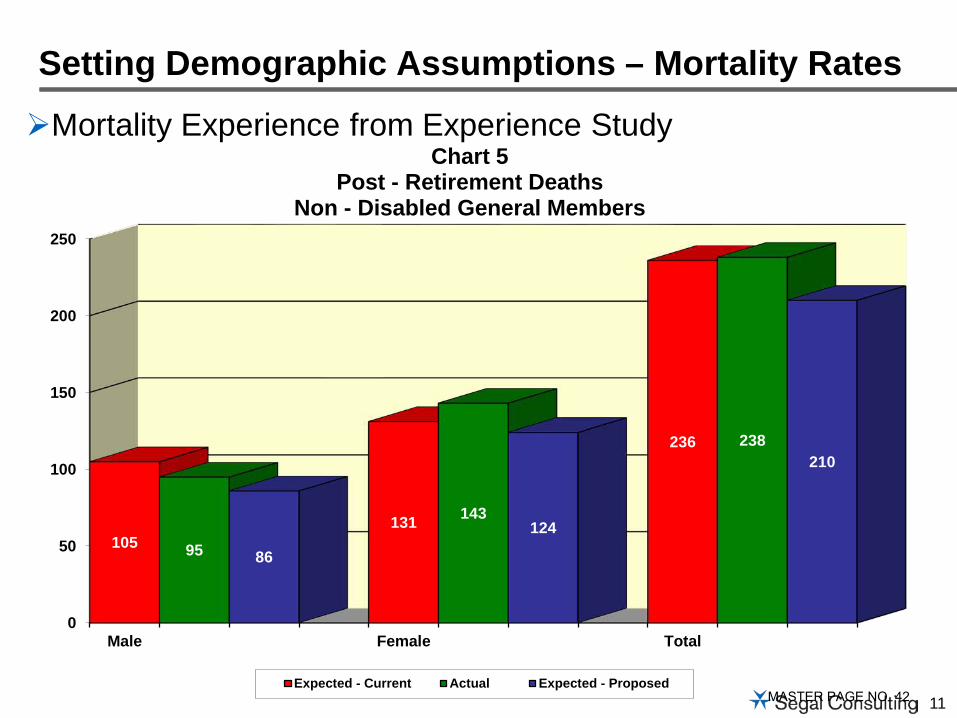
Setting Demographic Assumptions – Mortality Rates
Mortality Experience from Experience Study
0
50
100
150
200
250
Male Female Total
105131
236
95
143
238
86
124
210
Chart 5Post - Retirement Deaths
Non - Disabled General Members
Expected - Current Actual Expected - ProposedMASTER PAGE NO. 42

12
Two ways to use mortality improvement scales to project future mortality improvements: Static or GenerationalStatic projection to a future year - reflect mortality at a future date, not
as of today• Recommend use of static mortality projection to achieve
approximately 10% margin for future mortality improvement– RP-2000 with Scale BB projection to 2035
Future studies might include a recommendation for generational mortality• Each future year has its own mortality table that reflects the
forecasted improvements at every age– Younger participants have more future mortality improvement built
in than for older participantsCalPERS has adopted a static projection
Setting Demographic Assumptions – Mortality
MASTER PAGE NO. 43

13
Price Inflation (CPI):• Investment Return, Salary Increases, COLA
Salary Increases• “Across the board” increases (wage inflation)
– Includes price inflation plus real wage growth• Promotional & Merit: based on experience
– Really is a “demographic” assumption
Investment Return (Investment Earnings)•Components include price inflation, real return, expenses
(administrative and/or investment)•Generally based on passive returns
Economic Assumptions
MASTER PAGE NO. 44

14
Last full review was for 6/30/2012• Price inflation (CPI): 3.25%•Wage inflation: 4.00%
– So real wage growth is 0.75% • Investment return: 7.75%
– So net real return is 4.50%
Current Economic Assumptions
MASTER PAGE NO. 45

15
Price inflation (CPI)•Decrease from 3.25% to 3.00%
Salary increases•Decrease price inflation from 3.25% to 3.00%•Reduce the real wage growth from 0.75% to 0.50%• Total wage inflation reduced from 4.00% to 3.50%•Merit and promotional: slight increases to rates overall •Net impact is a reduction in assumed future salary increases
Investment return: Decrease from 7.75% to 7.50%•Change from net of administrative expenses to gross
Explicit Administrative Expenses• 0.7% of payroll allocated between the employer and member
Economic Assumptions - Recommended
MASTER PAGE NO. 46

16
Economic Assumptions - Recommended
6/30/2012 Val’n RecommendedReturn Pay Return Pay
Price Inflation 3.25% 3.25% 3.00% 3.00%
Real Wages n/a 0.75% n/a 0.50%
Merit(16+ years)
n/a 0.50% n/a 0.50%
Net Real Return 4.50% n/a 4.50%* n/a
Total 7.75% 4.50% 7.50% 4.00%
* Recommended return is gross of administrative expense
MASTER PAGE NO. 47
17
Historical Consumer Price Index•Median 15-year moving average = 3.4%•Median 30-year moving average = 4.1%
15-year averages have been declining due to recent low inflation NASRA Survey• Median inflation assumption is 3.00%
Social Security Forecast = 2.7% Recommend reducing from 3.25% to 3.00%
Price Inflation (CPI)
MASTER PAGE NO. 48
18
Three components Price inflation: decrease from 3.25% to 3.00% Real increases: decrease from 0.75% to 0.50%•Department of Labor: Annual State and Local Government real
productivity increase: 0.5% - 0.7% over 10 - 20 years
Promotional & Merit: from experience study• Based on years of service•General: Currently 5.00% (0-1 years) to 0.50% (9+ years)
– Overall minor increase at most years of service• Safety: Currently 8.50% (0-1 years) to 0.50% (16+ years)
– Overall minor increase at most years of service
Net reduction in assumed future salary increases
Salary Increase Assumption - Recommended
MASTER PAGE NO. 49

19
Active member payroll based on wage inflation Includes price inflation and real wage increases• Price inflation: reduce from 3.25% to 3.00%• Real increases: decrease from 0.75% to 0.50%• Total is reduced from 4.00% to 3.50%
Used to project total payroll for UAAL amortization
Payroll Growth Assumption
MASTER PAGE NO. 50
20
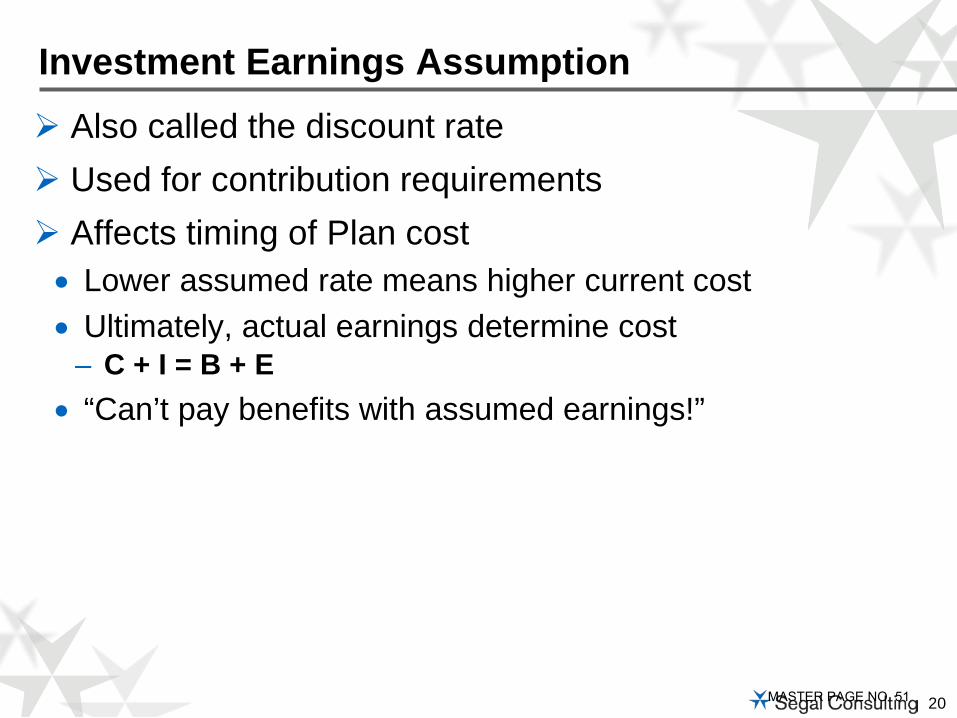
Also called the discount rate Used for contribution requirements Affects timing of Plan cost• Lower assumed rate means higher current cost• Ultimately, actual earnings determine cost
– C + I = B + E• “Can’t pay benefits with assumed earnings!”
Investment Earnings Assumption
MASTER PAGE NO. 51

21
Four components• Inflation: consistent with salary increase assumption•Real returns by asset class
– Weighted by asset allocation•Reduced by assumed expenses
– Currently both investment and administrative– Recommend reflecting only investment expenses,
with separate assumption for administrative expenses•Reduced by “risk adjustment”
– Margin for adverse deviation– Expressed as confidence level above 50%
Setting the Earnings Assumption
MASTER PAGE NO. 52
22
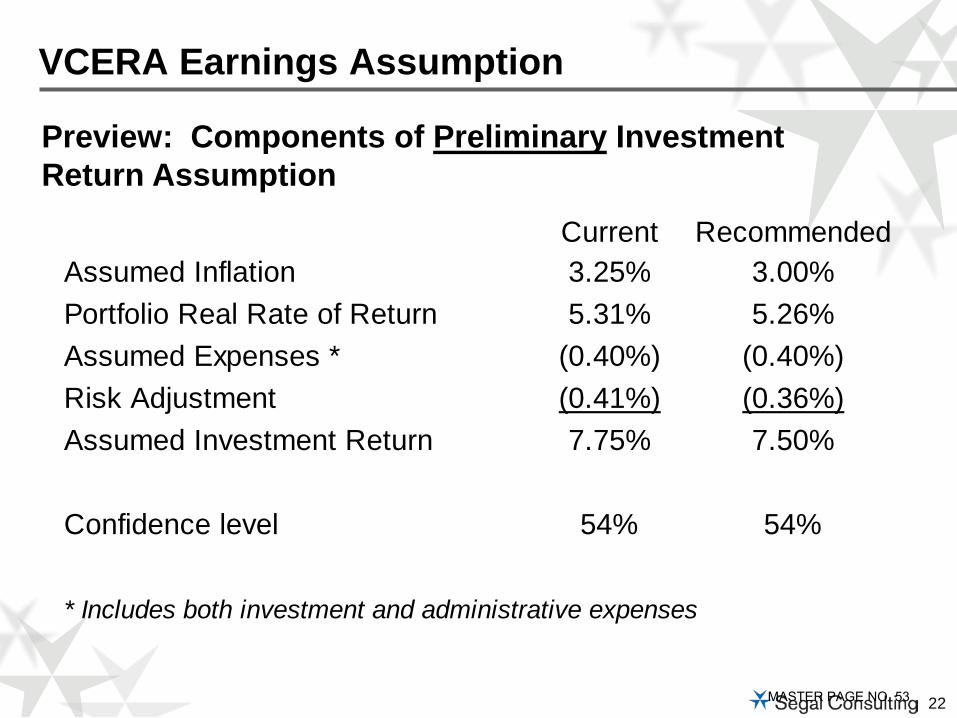
VCERA Earnings Assumption
Current RecommendedAssumed Inflation 3.25% 3.00%Portfolio Real Rate of Return 5.31% 5.26%Assumed Expenses * (0.40%) (0.40%)Risk Adjustment (0.41%) (0.36%)Assumed Investment Return 7.75% 7.50%
Confidence level 54% 54%
* Includes both investment and administrative expenses
Preview: Components of Preliminary Investment Return Assumption
MASTER PAGE NO. 53
23
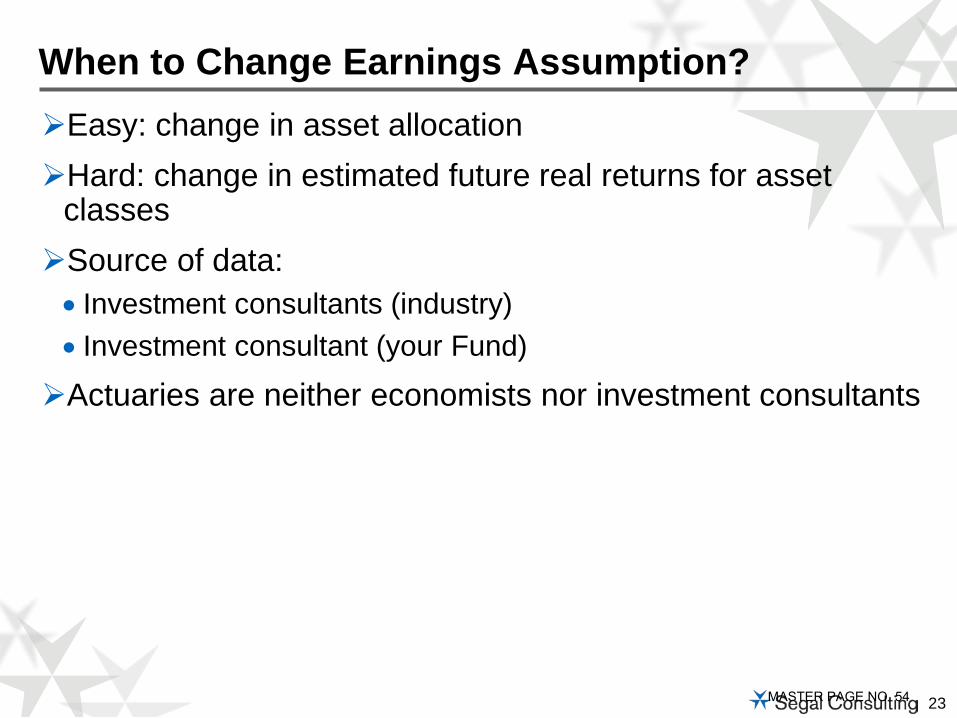
Easy: change in asset allocationHard: change in estimated future real returns for asset
classesSource of data:• Investment consultants (industry)• Investment consultant (your Fund)
Actuaries are neither economists nor investment consultants
When to Change Earnings Assumption?
MASTER PAGE NO. 54

24
Segal uses an average of 9 investment advisory firms retained by Segal public clients•Used results from NEPC for asset categories unique to VCERADecrease in real return is due to a combination of:• Changes in the target asset allocation (+0.38%)• Changes in real return assumptions in survey (-0.33%)
Real Returns by Asset Class
MASTER PAGE NO. 55

25
VCERA Real Rate of Return
Asset Class Target Real WeightedAllocation Return Return*
Large Cap U.S. Equity 27.74% 5.90% 1.64%Small Cap U.S. Equity 3.41% 6.60% 0.23%Developed Int'l Equity 14.73% 6.95% 1.02%Emerging Market Equity 3.12% 8.44% 0.26%U.S. Core Fixed Income 14.00% 0.71% 0.10%Real Estate 7.00% 4.65% 0.33%Private Debt/Credit Strategies 5.00% 6.01% 0.30%Absolute Return (Risk Parity) 16.00% 4.13% 0.66%Real Assets (MLPs) 4.00% 6.51% 0.26%Private Equity 5.00% 9.25% 0.46%Total 100.00% 5.26%
* Results may not add due to rounding
MASTER PAGE NO. 56

26
Administrative and Investment Expenses
Administrative and Investment Expenses as a Percentage of Actuarial Value of Assets
(All dollars in 000’s)
FYE
Actuarial Value of Assets
Administrative Expenses
Investment Expenses
Administrative %
Investment % Total %
2010 $3,134,978 $4,081 $6,256 0.13% 0.20% 0.33%
2011 3,236,217 4,387 7,404 0.14 0.23 0.36
2012 3,411,149 3,505 9,103 0.10 0.27 0.37
2013 3,633,626 3,944 9,901 0.11 0.27 0.38
2014 3,964,814 4,045 12,877 0.10 0.32 0.43 Average 0.12% 0.26% 0.37%
Based on this experience, we have maintained the future expense component at 0.40% for investment andadministrative expenses.
MASTER PAGE NO. 57
27
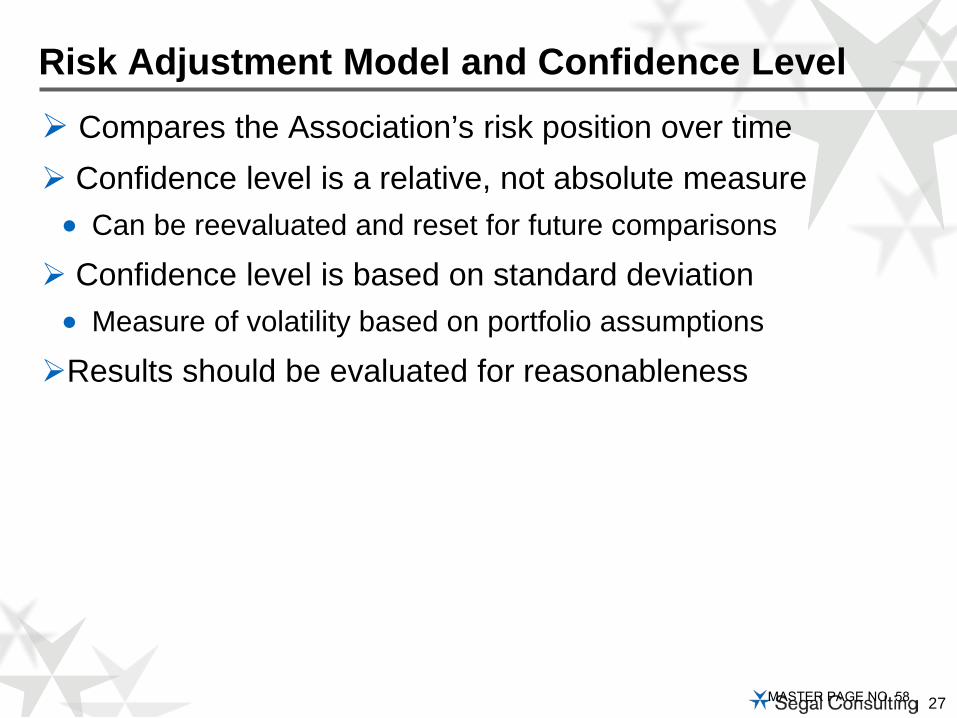
Compares the Association’s risk position over time Confidence level is a relative, not absolute measure• Can be reevaluated and reset for future comparisons
Confidence level is based on standard deviation• Measure of volatility based on portfolio assumptions
Results should be evaluated for reasonableness
Risk Adjustment Model and Confidence Level
MASTER PAGE NO. 58

28
Most useful for comparing risk position over time• 6/30/2009: 8.00% assumption gave 57% confidence • 6/30/2012: 7.75% assumption gave 54% confidence• 6/30/2015: 7.50% recommendation still gives confidence level of
54%• Maintaining 7.75% assumption would give 51% confidence
» Inflation decrease from 3.25% to 3.00%» Portfolio real return down from 5.31% to 5.26%
Risk Adjustment Model and Confidence Level
MASTER PAGE NO. 59

29
VCERA Earnings Assumption
Current RecommendedAssumed Inflation 3.25% 3.00%Portfolio Real Rate of Return 5.31% 5.26%Assumed Expenses * (0.40%) (0.40%)Risk Adjustment (0.41%) (0.36%)Assumed Investment Return 7.75% 7.50%
Confidence level 54% 54%
* Includes both investment and administrative expenses
Components of Preliminary Investment Return Assumption
MASTER PAGE NO. 60

30
Comparison with other systems•Median is 7.90% but trending down nationwide•California public systems – most at 7.25% to 7.50%•Orange CERS, Contra Costa CERA, Fresno CERA,
Mendocino CERA and San Mateo CERA recently adopted 7.25%
Earnings Assumption - 2015
MASTER PAGE NO. 61

31
For funding, current investment return assumption is net of both investment and administrative expensesFor financial reporting, GASB 67 and 68 require this
assumption to be gross of administrative expenseAdvantages to using same assumption for funding and for
financial reporting• Take advantage of consistency between new GASB rules and
current funding practices– Entry Age cost method– Discount rate based on expected investment return
•Consistency of liability and normal cost measures– The only difference is in how changes in liability are recognized
Developing an Investment Return Assumption for use in GASB 67 and 68 Financial Reporting
MASTER PAGE NO. 62

32
Complication associated with eliminating administrative expenses from this assumptionAdministrative expense funded implicitly by employer and
employees•Difficult to precisely reproduce current implicit cost sharing
Allocate explicit load to employer/employees based on portion of contributions paid by each• Employee NC, Employer NC, Employer UAAL payment
Current implicit method may “overcharge” for admin expenses•0.12% of assets not the same as a 0.12% change in
investment return assumption– 0.12% of assets is about $5 million annually or 0.7% of payroll– 0.12% change in return assumption increases contributions by
about $7 million annually or 1.1% of payroll
Developing an Investment Return Assumption for use in GASB 67 and 68 Financial Reporting
MASTER PAGE NO. 63
33
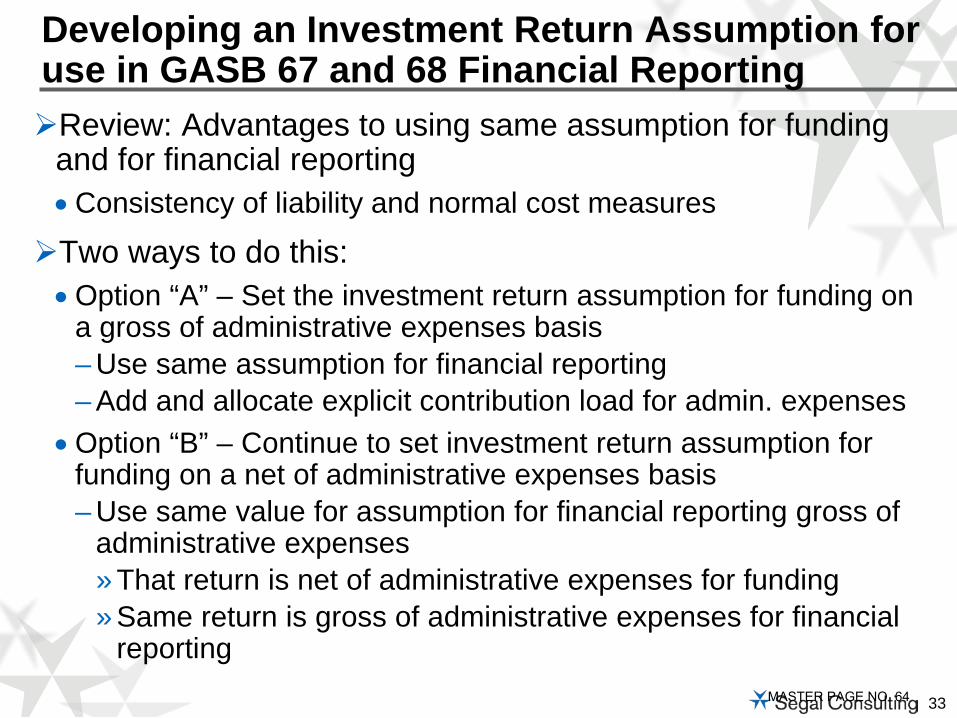
Review: Advantages to using same assumption for funding and for financial reporting•Consistency of liability and normal cost measures
Two ways to do this: •Option “A” – Set the investment return assumption for funding on
a gross of administrative expenses basis– Use same assumption for financial reporting– Add and allocate explicit contribution load for admin. expenses
•Option “B” – Continue to set investment return assumption for funding on a net of administrative expenses basis – Use same value for assumption for financial reporting gross of
administrative expenses» That return is net of administrative expenses for funding» Same return is gross of administrative expenses for financial
reporting
Developing an Investment Return Assumption for use in GASB 67 and 68 Financial Reporting
MASTER PAGE NO. 64
34
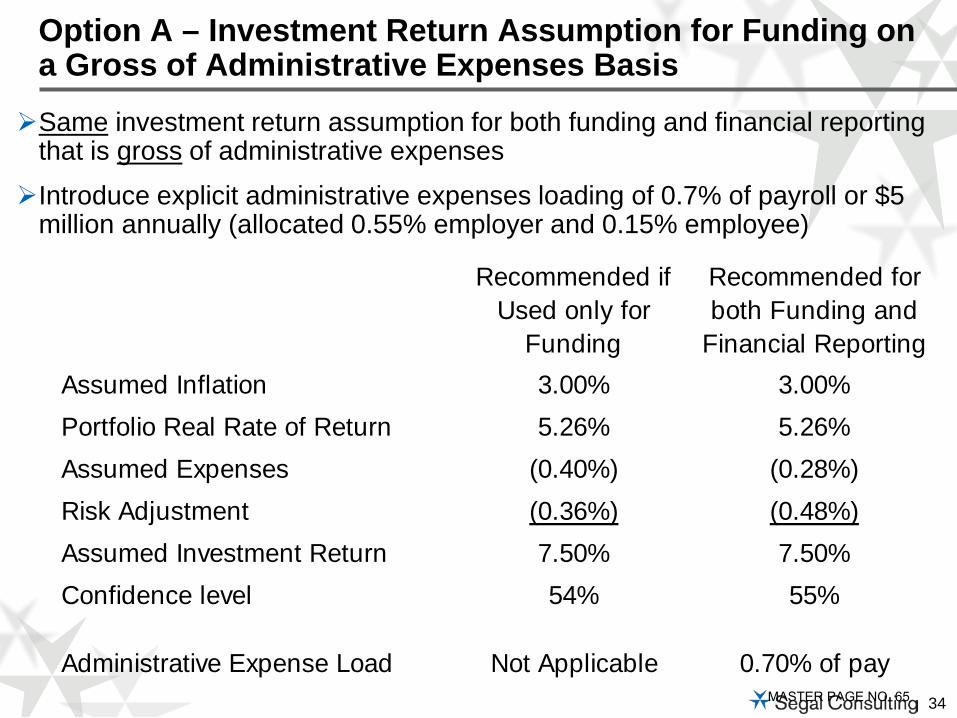
Same investment return assumption for both funding and financial reporting that is gross of administrative expenses
Introduce explicit administrative expenses loading of 0.7% of payroll or $5 million annually (allocated 0.55% employer and 0.15% employee)
Option A – Investment Return Assumption for Funding on a Gross of Administrative Expenses Basis
Recommended if Used only for
Funding
Recommended for both Funding and
Financial ReportingAssumed Inflation 3.00% 3.00%Portfolio Real Rate of Return 5.26% 5.26%Assumed Expenses (0.40%) (0.28%)Risk Adjustment (0.36%) (0.48%)Assumed Investment Return 7.50% 7.50%Confidence level 54% 55%
Administrative Expense Load Not Applicable 0.70% of payMASTER PAGE NO. 65
35
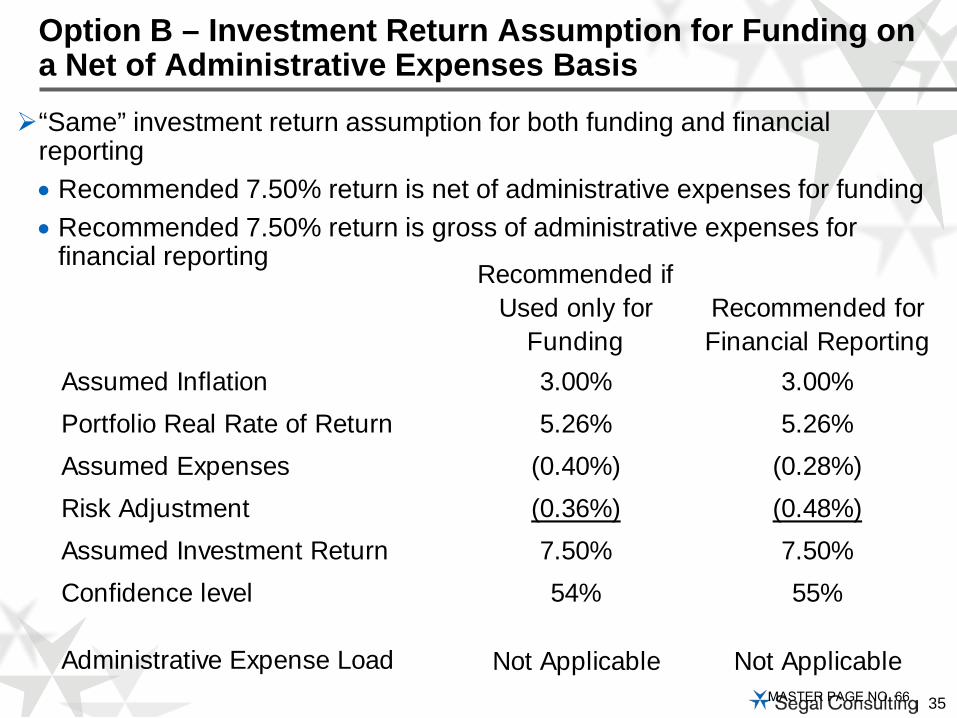
“Same” investment return assumption for both funding and financial reporting• Recommended 7.50% return is net of administrative expenses for funding• Recommended 7.50% return is gross of administrative expenses for
financial reporting
Option B – Investment Return Assumption for Funding on a Net of Administrative Expenses Basis
Recommended if Used only for
FundingRecommended for Financial Reporting
Assumed Inflation 3.00% 3.00%Portfolio Real Rate of Return 5.26% 5.26%Assumed Expenses (0.40%) (0.28%)Risk Adjustment (0.36%) (0.48%)Assumed Investment Return 7.50% 7.50%Confidence level 54% 55%
Administrative Expense Load Not Applicable Not ApplicableMASTER PAGE NO. 66

36
Modeled as of June 30, 2014 for illustrationIncrease in Actuarial Accrued Liability ($224 million)Total increase in average employer rate (3.45% of payroll)• Increase in average employer Normal Cost (0.20% of pay)• Increase in average employer UAAL rate (2.70% of pay)• Portion of explicit administrative expense allocated to employer
(0.55% of payroll)• Primarily due to updating the mortality table, changing investment
return assumption and introducing explicit administrative expenseIncrease in average member rate (0.20% of payroll)• Includes explicit administrative expense allocated to member
(0.15% of payroll)Results are before 50/50 Normal sharing for non-PEPRA tiers• 50/50 sharing shifts 0.07% of the cost impact from employer to
member
Anticipated Impact on Valuation Results
MASTER PAGE NO. 67

37
Investment return assumption is based on the asset allocation• Asset allocation results from a balance of risk and return,
reflecting a plan’s tolerance for risk
Asset allocation is NOT based on the earnings assumption!• Earnings assumption is NOT a target, benchmark, hurdle or goal
that the allocation seeks to achieve•Do not set asset allocation to “chase” your current earnings
assumption
Asset Allocation and Earnings Assumption
MASTER PAGE NO. 68
38
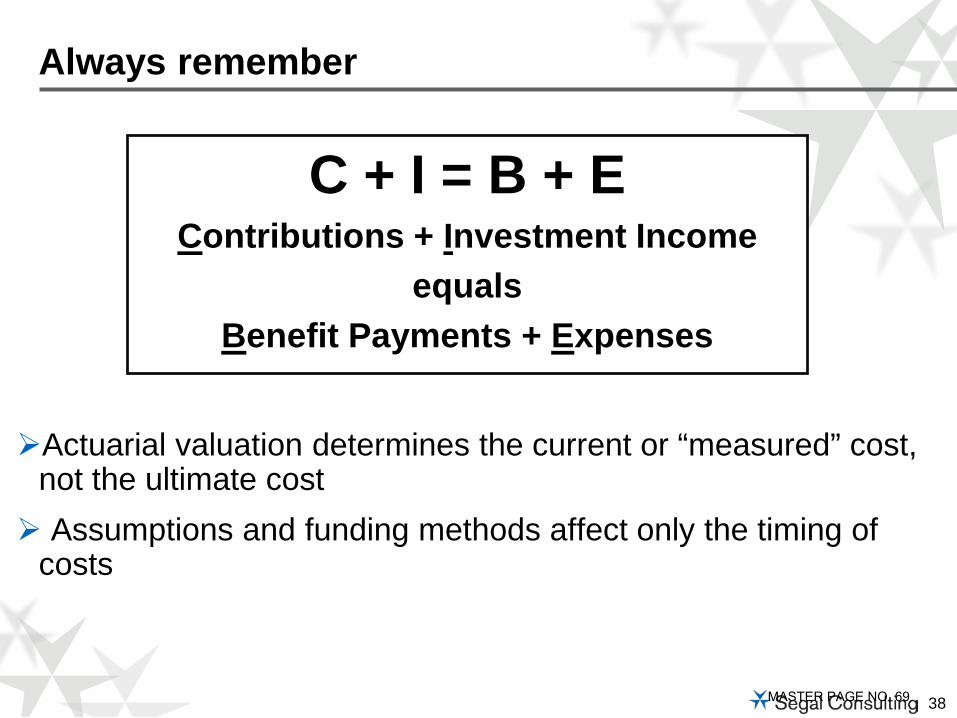
Actuarial valuation determines the current or “measured” cost, not the ultimate cost Assumptions and funding methods affect only the timing of
costs
Always remember
C + I = B + EContributions + Investment Income
equalsBenefit Payments + Expenses
MASTER PAGE NO. 69
100 Montgomery Street, Suite 500 San Francisco, CA 94104
Ventura County Employees’ Retirement Association
ACTUARIAL EXPERIENCE STUDY Analysis of Actuarial Experience
During the Period July 1, 2011 through June 30, 2014
COPYRIGHT © 2015 ALL RIGHTS RESERVED MARCH 2015
MASTER PAGE NO. 70
100 Montgomery Street Suite 500 San Francisco, CA 94104-4308 T 415.263.8200 www.segalco.com
Benefits, Compensation and HR Consulting. Member of The Segal Group. Offices throughout the United States and Canada
April 14, 2015 Board of Retirement Ventura County Employees’ Retirement Association 1190 South Victoria Avenue, Suite 200 Ventura, CA 93003-6572 Re: Review of Non-economic Actuarial Assumptions
for the June 30, 2015 Actuarial Valuation
Dear Members of the Board:
We are pleased to submit this report of our review of the actuarial experience of the Ventura County Employees’ Retirement Association. This study utilizes the census data of the last four actuarial valuations to review plan experience during the period from July 1, 2011 through June 30, 2014. The study develops the proposed actuarial assumptions to be used in future actuarial valuations starting with the June 30, 2015 actuarial valuation.
Please note that we have also reviewed the economic assumptions. The economic actuarial assumption recommendations for the June 30, 2015 valuation are provided in a separate report.
We are members of the American Academy of Actuaries and we meet the Qualification Standards of the American Academy of Actuaries to render the actuarial opinion herein.
We look forward to reviewing this report with you and answering any questions you may have. Sincerely, Paul Angelo, FSA, MAAA, FCA, EA Senior Vice President and Actuary
John W. Monroe, ASA, MAAA, EA Vice President and Actuary
AW/bqb
MASTER PAGE NO. 71
TABLE OF CONTENTS Page
I. INTRODUCTION, SUMMARY, AND RECOMMENDATIONS ........................................1
II. BACKGROUND AND METHODOLOGY ...........................................................................4
III. ACTUARIAL ASSUMPTIONS .............................................................................................5
A. ECONOMIC ASSUMPTIONS .........................................................................................5
B. RETIREMENT RATES ....................................................................................................5
C. MORTALITY RATES - HEALTHY .............................................................................15
D. MORTALITY RATES - DISABLED ............................................................................23
E. TERMINATION RATES ................................................................................................28
F. DISABILITY INCIDENCE RATES ..............................................................................36
G. PROMOTIONAL AND MERIT SALARY INCREASES ...........................................41
H. IN-SERVICE REDEMPTIONS .....................................................................................47
I. AVERAGE ENTRY AGE (FOR MEMBER CONTRIBUTIONS) ............................48
IV. COST IMPACT OF ASSUMPTION CHANGES ..............................................................49
APPENDIX A. CURRENT ACTUARIAL ASSUMPTIONS ..................................................51
APPENDIX B. PROPOSED ACTUARIAL ASSUMPTIONS ................................................57
MASTER PAGE NO. 72

-1-
I. INTRODUCTION, SUMMARY, AND RECOMMENDATIONS
To project the cost and liabilities of the pension plan, assumptions are made about all future events that
could affect the amount and timing of the benefits to be paid and the assets to be accumulated. Each year
actual experience is compared against the projected experience, and to the extent there are differences, the
future contribution requirement is adjusted.
If assumptions are modified, contribution requirements are adjusted to take into account a change in the
projected experience in all future years. There is a great difference in both philosophy and cost impact
between recognizing the actuarial deviations as they occur annually and changing the actuarial
assumptions. Taking into account one year’s gains or losses without making a change in the assumptions
means that that year’s experience is treated as temporary and that, over the long run, experience will
return to what was originally assumed. Changing assumptions reflects a basic change in thinking about
the future, and it has a much greater effect on the current contribution requirements than recognizing
gains or losses as they occur.
The use of realistic actuarial assumptions is important in maintaining adequate funding, while paying the
promised benefit amounts to participants already retired and to those near retirement. The actuarial
assumptions used do not determine the “actual cost” of the plan. The actual cost is determined solely by
the benefits and administrative expenses paid out, offset by investment income received. However, it is
desirable to estimate as closely as possible what the actual cost will be so as to permit an orderly method
for setting aside contributions today to provide benefits in the future, and to maintain equity among
generations of participants and taxpayers.
This study was undertaken in order to review the demographic actuarial assumptions and to compare the
actual experience with that expected under the current assumptions during the three-year experience
period from July 1, 2011 through June 30, 2014. The study was performed in accordance with Actuarial
Standard of Practice (ASOP) No. 35, “Selection of Demographic and Other Non-economic Assumptions
for Measuring Pension Obligations” and ASOP No. 27 “Selection of Economic Assumptions for
Measuring Pension Obligations.” These Standards of Practice put forth guidelines for the selection of the
various actuarial assumptions utilized in a pension plan actuarial valuation. Based on the study’s results
and expected future experience, we are recommending various changes in the current actuarial
assumptions.
The economic assumptions are currently reviewed every three years at the same time as the non-economic
assumptions. See the “Review of Economic Actuarial Assumptions for the June 30, 2015 Actuarial
Valuation” that is provided in a separate report.
MASTER PAGE NO. 73

-2-
In this report we are recommending changes in the assumptions for retirement from active employment,
percent married at retirement, average entry age for active members, average retirement age for deferred
vested members, percent of members assumed to go on to work for a reciprocal system, reciprocal salary
increases, pre-retirement mortality, healthy life post-retirement mortality, disabled life post-retirement
mortality, turnover, disability (ordinary and duty), promotional and merit salary increases, and in-service
redemptions.
Our recommendations for the major actuarial assumption categories are as follows:
Retirement Rates – The probability of retirement at each age at which participants are eligible to
retire.
Recommendation: Adjust the current retirement rates to those developed in Section III(B).
Both General and Safety members are assumed to retire at slightly later ages.
Mortality Rates – The probability of dying at each age. Mortality rates are used to project life
expectancies.
Recommendation: Decrease pre- and post-retirement mortality rates for non-disabled General
and Safety members as developed in Section III(C). Increase mortality rates for disabled Safety
members and decrease mortality rates for disabled General members as developed in Section
III(D).
Termination Rates – The probability of leaving employment at each age and receiving either a
refund of contributions or a deferred vested retirement benefit.
Recommendation: Change the termination rates for both General and Safety members to those
developed in Section III(E). Overall, the termination rates have been decreased. In addition,
maintain the assumption that a member will choose between a refund of contributions and a
deferred vested benefit based on which option is more valuable.
Disability Incidence Rates – The probability of becoming disabled at each age.
Recommendation: Decrease the current disability rates for General and Safety members to
those developed in Section III(F).
Individual Salary Increases – Increases in the salary of a member between the date of the
valuation to the date of separation from active service.
Recommendation: Change the promotional and merit increases to those developed in Section
III(G). In general, future promotional and merit salary increases are slightly higher under the
new assumptions. Overall, salary increase are slightly lower for both General and Safety
members due to the lower price inflation assumption (as recommended in our separate review
of economic assumptions).
Ref: Pg. 36
Ref: Pg. 15 Pg. 23
Ref: Pg. 28
Ref: Pg. 5
Ref: Pg. 41
MASTER PAGE NO. 74
-3-
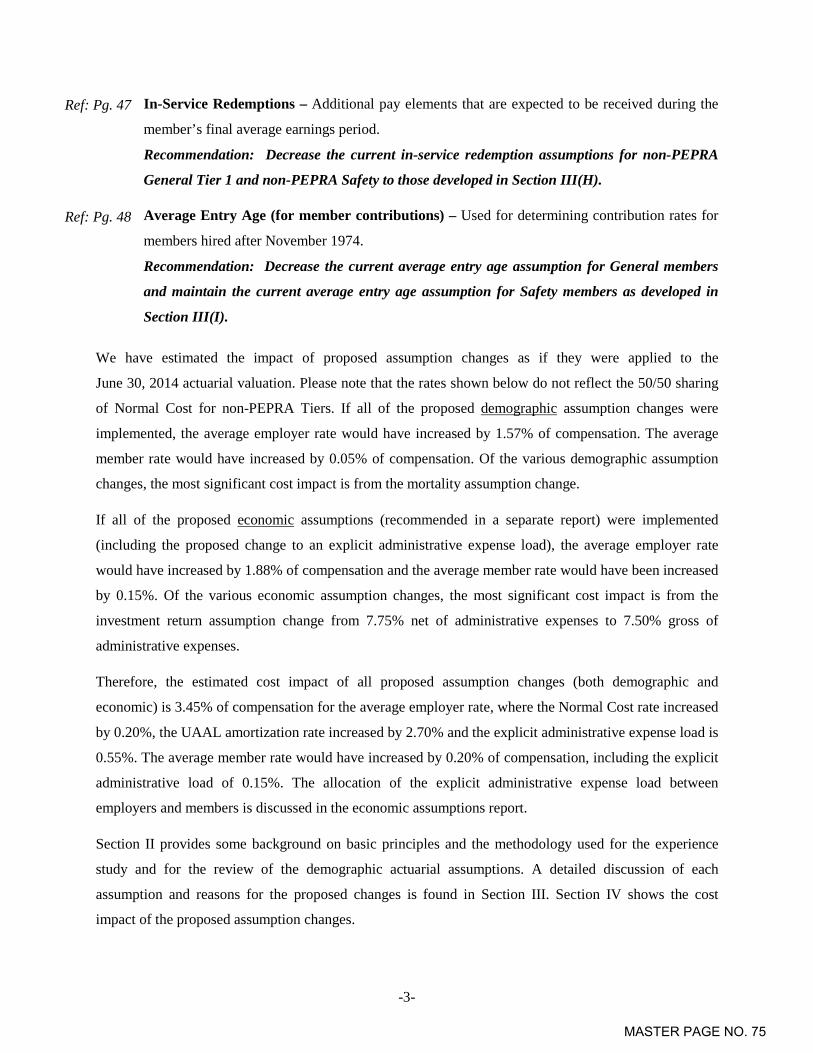
In-Service Redemptions – Additional pay elements that are expected to be received during the
member’s final average earnings period.
Recommendation: Decrease the current in-service redemption assumptions for non-PEPRA
General Tier 1 and non-PEPRA Safety to those developed in Section III(H).
Average Entry Age (for member contributions) – Used for determining contribution rates for
members hired after November 1974.
Recommendation: Decrease the current average entry age assumption for General members
and maintain the current average entry age assumption for Safety members as developed in
Section III(I).
We have estimated the impact of proposed assumption changes as if they were applied to the
June 30, 2014 actuarial valuation. Please note that the rates shown below do not reflect the 50/50 sharing
of Normal Cost for non-PEPRA Tiers. If all of the proposed demographic assumption changes were
implemented, the average employer rate would have increased by 1.57% of compensation. The average
member rate would have increased by 0.05% of compensation. Of the various demographic assumption
changes, the most significant cost impact is from the mortality assumption change.
If all of the proposed economic assumptions (recommended in a separate report) were implemented
(including the proposed change to an explicit administrative expense load), the average employer rate
would have increased by 1.88% of compensation and the average member rate would have been increased
by 0.15%. Of the various economic assumption changes, the most significant cost impact is from the
investment return assumption change from 7.75% net of administrative expenses to 7.50% gross of
administrative expenses.
Therefore, the estimated cost impact of all proposed assumption changes (both demographic and
economic) is 3.45% of compensation for the average employer rate, where the Normal Cost rate increased
by 0.20%, the UAAL amortization rate increased by 2.70% and the explicit administrative expense load is
0.55%. The average member rate would have increased by 0.20% of compensation, including the explicit
administrative load of 0.15%. The allocation of the explicit administrative expense load between
employers and members is discussed in the economic assumptions report.
Section II provides some background on basic principles and the methodology used for the experience
study and for the review of the demographic actuarial assumptions. A detailed discussion of each
assumption and reasons for the proposed changes is found in Section III. Section IV shows the cost
impact of the proposed assumption changes.
Ref: Pg. 47
Ref: Pg. 48
MASTER PAGE NO. 75
-4-
II. BACKGROUND AND METHODOLOGY
In this report, we analyzed the “demographic” or “non-economic” assumptions only. Our analysis of the
“economic” assumptions for the June 30, 2015 valuation is provided in a separate report. Demographic
assumptions include the probabilities of certain events occurring in the population of members, referred to
as “decrements,” e.g., termination from service, disability retirement, service retirement, and death after
retirement. We also review the individual salary increases net of inflation (i.e., the promotional and merit
assumptions) in this report.
Demographic Assumptions
In order to determine the probability of an event occurring, we examine the “decrements” and
“exposures” of that event. For example, taking termination from service, we compare the number of
employees who actually terminate in a certain age and/or service category (i.e., the number of
“decrements”) with those “who could have terminated” (i.e., the number of “exposures”). For example, if
there were 500 active employees in the 20-24 age group at the beginning of the year and 50 of them
terminate during the year, we would say the probability of termination in that age group is 50 ÷ 500 or
10%.
The reliability of the resulting probability is highly dependent on both the number of decrements and the
number of exposures. For example, if there are only a few people in a high age category at the beginning
of the year (number of exposures), we would not lend as much credibility to the probability of termination
developed for that age category, especially if it is out of line with the pattern shown for the other age
groups. Similarly, if we are considering the death decrement, there may be a large number of exposures
in, say, the age 20-24 category, but very few decrements (actual deaths); therefore, we would not be able
to rely heavily on the probability developed for that category.
One reason we use several years of experience for such a study is to have more exposures and
decrements, and therefore more statistical reliability. Another reason for using several years of data is to
smooth out fluctuations that may occur from one year to the next. However, we also calculate the rates on
a year-to-year basis to check for any trend that may be developing in the later years.
MASTER PAGE NO. 76

-5-
III. ACTUARIAL ASSUMPTIONS
A. ECONOMIC ASSUMPTIONS
The economic assumptions are currently reviewed every three years at the same time as the non-economic
assumptions. See the separate reported titled “Review of Economic Actuarial Assumptions for the
June 30, 2015 Actuarial Valuation”.
B. RETIREMENT RATES
The age at which a member retires from service (i.e., who did not retire on a disability pension) will affect
both the amount of the benefits that will be paid to that member as well as the period over which funding
must take place.
The table on the following page shows the observed service retirement rates for non-PEPRA General
members based on the actual experience over the past three years. The observed service retirement rates
were determined by comparing those members who actually retired from service to those eligible to retire
from service. This same methodology is followed throughout this report and was described in Section II.
Also shown are the current assumed rates and the rates we propose:
MASTER PAGE NO. 77

-6-
Non-PEPRA General Tiers
Age Current Rate of
Retirement Actual Rate of
Retirement Proposed Rate of
Retirement Under 50 0.00% 66.67% 0.00%
50 3.00 2.46 2.50 51 3.00 1.93 2.50 52 4.00 1.94 3.00 53 4.00 3.49 3.50 54 6.00 3.38 4.00 55 6.00 4.02 4.50 56 7.00 3.17 5.00 57 8.00 4.44 6.00 58 10.00 6.34 8.00 59 10.00 6.21 8.00 60 14.00 10.06 12.00 61 18.00 11.76 15.00 62 22.00 23.77 22.00 63 20.00 18.33 20.00 64 25.00 19.14 22.00 65 35.00 27.97 30.00 66 35.00 34.58 35.00 67 35.00 23.44 35.00 68 25.00 51.06 35.00 69 20.00 29.41 20.00 70 20.00 27.27 20.00 71 20.00 14.71 20.00 72 20.00 13.64 20.00 73 20.00 7.14 20.00 74 40.00 0.00 30.00
75 & Over 100.00 16.00 100.00
As shown above, we are recommending decreases in most of the retirement rates for non-PEPRA General
members.
Chart 1 that follows later in this section compares actual experience with the current and proposed rates of
retirement for non-PEPRA General members.
MASTER PAGE NO. 78
-7-
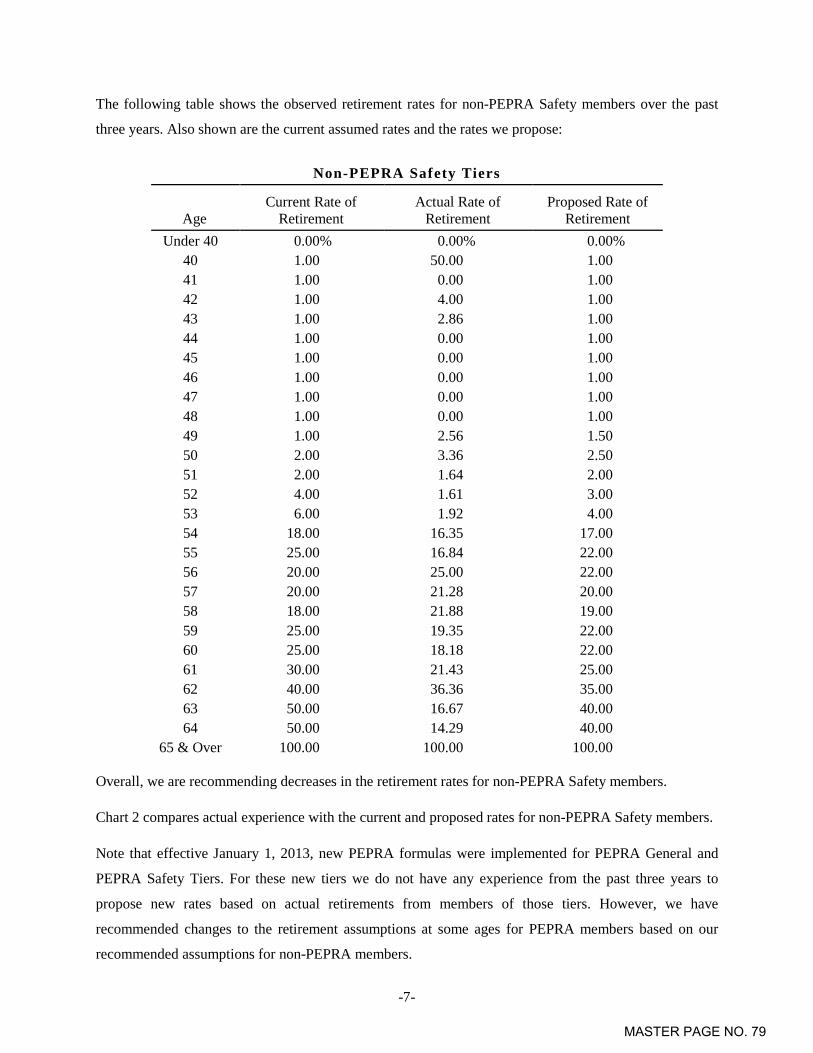
The following table shows the observed retirement rates for non-PEPRA Safety members over the past
three years. Also shown are the current assumed rates and the rates we propose:
Non-PEPRA Safety Tiers
Age Current Rate of
Retirement Actual Rate of
Retirement Proposed Rate of
Retirement Under 40 0.00% 0.00% 0.00%
40 1.00 50.00 1.00 41 1.00 0.00 1.00 42 1.00 4.00 1.00 43 1.00 2.86 1.00 44 1.00 0.00 1.00 45 1.00 0.00 1.00 46 1.00 0.00 1.00 47 1.00 0.00 1.00 48 1.00 0.00 1.00 49 1.00 2.56 1.50 50 2.00 3.36 2.50 51 2.00 1.64 2.00 52 4.00 1.61 3.00 53 6.00 1.92 4.00 54 18.00 16.35 17.00 55 25.00 16.84 22.00 56 20.00 25.00 22.00 57 20.00 21.28 20.00 58 18.00 21.88 19.00 59 25.00 19.35 22.00 60 25.00 18.18 22.00 61 30.00 21.43 25.00 62 40.00 36.36 35.00 63 50.00 16.67 40.00 64 50.00 14.29 40.00
65 & Over 100.00 100.00 100.00
Overall, we are recommending decreases in the retirement rates for non-PEPRA Safety members.
Chart 2 compares actual experience with the current and proposed rates for non-PEPRA Safety members.
Note that effective January 1, 2013, new PEPRA formulas were implemented for PEPRA General and
PEPRA Safety Tiers. For these new tiers we do not have any experience from the past three years to
propose new rates based on actual retirements from members of those tiers. However, we have
recommended changes to the retirement assumptions at some ages for PEPRA members based on our
recommended assumptions for non-PEPRA members.
MASTER PAGE NO. 79

-8-
The following are the current and proposed rates of retirement for PEPRA General and Safety members:
General and Safety PEPRA Tiers
Age Current
General PEPRA Tiers Proposed
General PEPRA Tiers Current
Safety PEPRA Tiers Proposed
Safety PEPRA Tiers 50 0.00% 0.00% 4.00% 5.00% 51 0.00 0.00 2.00 2.00 52 2.00 2.00 5.00 4.00 53 2.00 2.00 8.00 6.00 54 3.00 2.50 18.00 16.00 55 5.00 4.00 20.00 20.00 56 5.00 4.50 20.00 20.00 57 6.00 5.00 18.00 18.00 58 7.00 6.00 18.00 18.00 59 8.00 7.00 30.00 25.00 60 10.00 9.00 30.00 25.00 61 12.50 11.00 30.00 25.00 62 20.00 20.00 50.00 40.00 63 20.00 20.00 50.00 40.00 64 20.00 18.00 50.00 40.00 65 25.00 20.00 100.00 100.00 66 30.00 30.00 100.00 100.00 67 30.00 30.00 100.00 100.00 68 30.00 30.00 100.00 100.00 69 30.00 30.00 100.00 100.00 70 50.00 50.00 100.00 100.00 71 50.00 50.00 100.00 100.00 72 50.00 50.00 100.00 100.00 73 50.00 50.00 100.00 100.00 74 50.00 50.00 100.00 100.00
75 & Over 100.00 100.00 100.00 100.00
Chart 3 compares the current rates with the proposed rates of retirement for PEPRA General members.
Chart 4 compares the current rates with the proposed rates of retirement for PEPRA Safety members.
MASTER PAGE NO. 80
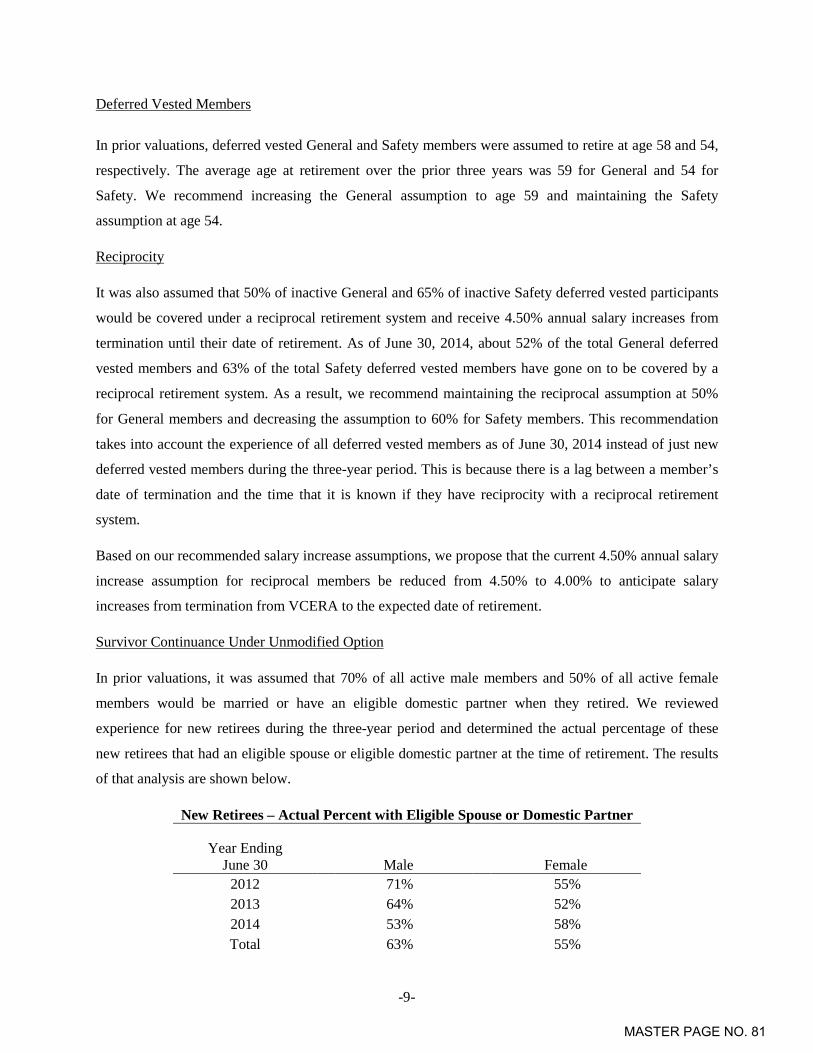
-9-
Deferred Vested Members
In prior valuations, deferred vested General and Safety members were assumed to retire at age 58 and 54,
respectively. The average age at retirement over the prior three years was 59 for General and 54 for
Safety. We recommend increasing the General assumption to age 59 and maintaining the Safety
assumption at age 54.
Reciprocity
It was also assumed that 50% of inactive General and 65% of inactive Safety deferred vested participants
would be covered under a reciprocal retirement system and receive 4.50% annual salary increases from
termination until their date of retirement. As of June 30, 2014, about 52% of the total General deferred
vested members and 63% of the total Safety deferred vested members have gone on to be covered by a
reciprocal retirement system. As a result, we recommend maintaining the reciprocal assumption at 50%
for General members and decreasing the assumption to 60% for Safety members. This recommendation
takes into account the experience of all deferred vested members as of June 30, 2014 instead of just new
deferred vested members during the three-year period. This is because there is a lag between a member’s
date of termination and the time that it is known if they have reciprocity with a reciprocal retirement
system.
Based on our recommended salary increase assumptions, we propose that the current 4.50% annual salary
increase assumption for reciprocal members be reduced from 4.50% to 4.00% to anticipate salary
increases from termination from VCERA to the expected date of retirement.
Survivor Continuance Under Unmodified Option
In prior valuations, it was assumed that 70% of all active male members and 50% of all active female
members would be married or have an eligible domestic partner when they retired. We reviewed
experience for new retirees during the three-year period and determined the actual percentage of these
new retirees that had an eligible spouse or eligible domestic partner at the time of retirement. The results
of that analysis are shown below.
New Retirees – Actual Percent with Eligible Spouse or Domestic Partner
Year Ending June 30
Male
Female
2012 71% 55% 2013 64% 52% 2014 53% 58% Total 63% 55%
MASTER PAGE NO. 81

-10-
According to experience of members who retired during the last three years, about 63% of all male
members and 55% of all female members were married or had a domestic partner at retirement. However,
we note that the 2014 percentage for males of 53% appears to be unusually low. We recommend
maintaining the assumption at 70% for male members and increasing the assumption to 55% for female
members.
Since the value of the survivor’s benefit is dependent on the survivor’s age and sex, we must also have
assumptions for the age and sex of the survivor. Based on the experience during the three-year period and
studies done for other retirement systems, we believe that it is reasonable to continue to assume a three-
year age difference for the survivors age as compared to the member’s age.
Since the majority of survivors are expected to be of the opposite sex, even with the inclusion of domestic
partners, we will continue to assume that the survivor’s sex is the opposite of the member.
The proposed assumption for the age of the survivor and recommended assumption are shown below.
These assumptions will continue to be monitored in future experience studies.
Survivor Ages – Current Assumptions
Survivor’s Age as Compared to Member’s Age
Beneficiary Sex Current
Assumption Recommended
Assumption
Male 3 years older No change
Female 3 years younger No change
MASTER PAGE NO. 82

-11-
Cha
rt 1
R
etire
men
t Rat
es -
Non
-PEP
RA
Gen
eral
Mem
bers
0%5%10%
15%
20%
25%
30%
35%
40%
45%
50%
55%
5051
5253
5455
5657
5859
6061
6263
6465
6667
6869
7071
7273
74
Age
Cur
rent
Actu
alPr
opos
ed
MASTER PAGE NO. 83

-12-
Cha
rt 2
R
etire
men
t Rat
es -
Non
-PEP
RA
Safe
ty M
embe
rs
0%5%10%
15%
20%
25%
30%
35%
40%
45%
50%
4041
4243
4445
4647
4849
5051
5253
5455
5657
5859
6061
6263
64
Age
Cur
rent
Actu
alPr
opos
ed
MASTER PAGE NO. 84

-13-
0%5%10%
15%
20%
25%
30%
35%
40%
45%
50%
5253
5455
5657
5859
6061
6263
6465
6667
6869
7071
7273
74
Age
Cha
rt 3
R
etire
men
t Rat
es -
PEPR
A G
ener
al M
embe
rs
Cur
rent
Prop
osed
MASTER PAGE NO. 85

-14-
0%5%10%
15%
20%
25%
30%
35%
40%
45%
50%
5051
5253
5455
5657
5859
6061
6263
64Ag
e
Cha
rt 4
R
etire
men
t Rat
es -
PEPR
A Sa
fety
Mem
bers
Cur
rent
Prop
osed
MASTER PAGE NO. 86

-15-
C. MORTALITY RATES - HEALTHY
The “healthy” mortality rates project what proportion of members will die before retirement as well as the
life expectancy of a member who retires from service (i.e., who did not retire on a disability pension). The
table currently being used for both General and Safety post-service retirement mortality rates is the RP-
2000 Combined Healthy Mortality Table (separate tables for males and females) projected with Scale AA
to 2025 with ages set back one year. Beneficiaries are assumed to have the same mortality of a General
member of the opposite sex who has taken a service (non-disability) retirement.
Recent changes to ASOP 35 have increased the actuary’s responsibility to reflect and to disclose an
allowance for future mortality improvement in this assumption. Ways to reflect anticipated future
mortality improvement include:
Age adjustments – A standard table is used without projection but with age adjustments (“set back”
or “set forward”) chosen as to forecast fewer deaths than the current experience level, thus
implicitly allowing for future mortality improvement.
Projection to a future year – The same mortality table is used for future years, but that table is
intended to be reflective of mortality at some particular future year, not as of the current year.
Generational mortality – Each future year has its own mortality table that reflects the forecasted
improvements. In effect, this means that younger participants have more future mortality
improvement built in than older participants do.
Historically, we have used age adjustments, but in the previous study we also included a projection to a
future year when setting mortality assumptions for VCERA. In particular, the RP-2000 Combined
Healthy Mortality Table was projected to the year 2025 and then we applied an age adjustment similar to
the one described in the first bullet so that actual deaths would be at least 10% greater than those
assumed.
Pre-Retirement Mortality
The number of deaths among active and deferred vested members is not large enough to provide a
statistically credible basis for a specific pre-retirement mortality analysis. Therefore, we continue to
propose that pre-retirement mortality follow the same tables used for post-retirement mortality. In
addition, based on experience from the last three years of 23 total deaths, none were due to service
connected (duty) causes. For that reason, we recommend maintaining the current assumption that all pre-
retirement deaths are assumed to be ordinary (non-duty) based on recent data.
MASTER PAGE NO. 87
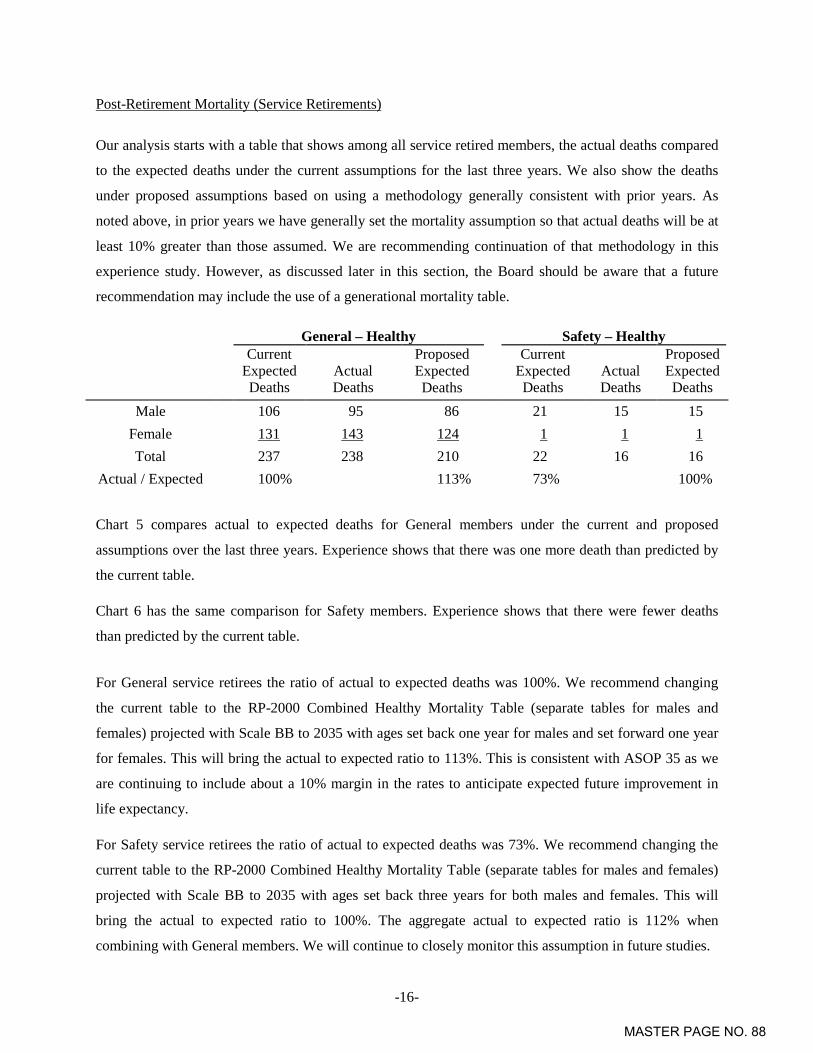
-16-
Post-Retirement Mortality (Service Retirements)
Our analysis starts with a table that shows among all service retired members, the actual deaths compared
to the expected deaths under the current assumptions for the last three years. We also show the deaths
under proposed assumptions based on using a methodology generally consistent with prior years. As
noted above, in prior years we have generally set the mortality assumption so that actual deaths will be at
least 10% greater than those assumed. We are recommending continuation of that methodology in this
experience study. However, as discussed later in this section, the Board should be aware that a future
recommendation may include the use of a generational mortality table.
General – Healthy Safety – Healthy
Current Expected Deaths
Actual Deaths
Proposed Expected Deaths
Current Expected Deaths
Actual Deaths
Proposed Expected Deaths
Male 106 95 86 21 15 15 Female 131 143 124 1 1 1 Total 237 238 210 22 16 16
Actual / Expected 100% 113% 73% 100%
Chart 5 compares actual to expected deaths for General members under the current and proposed
assumptions over the last three years. Experience shows that there was one more death than predicted by
the current table.
Chart 6 has the same comparison for Safety members. Experience shows that there were fewer deaths
than predicted by the current table.
For General service retirees the ratio of actual to expected deaths was 100%. We recommend changing
the current table to the RP-2000 Combined Healthy Mortality Table (separate tables for males and
females) projected with Scale BB to 2035 with ages set back one year for males and set forward one year
for females. This will bring the actual to expected ratio to 113%. This is consistent with ASOP 35 as we
are continuing to include about a 10% margin in the rates to anticipate expected future improvement in
life expectancy.
For Safety service retirees the ratio of actual to expected deaths was 73%. We recommend changing the
current table to the RP-2000 Combined Healthy Mortality Table (separate tables for males and females)
projected with Scale BB to 2035 with ages set back three years for both males and females. This will
bring the actual to expected ratio to 100%. The aggregate actual to expected ratio is 112% when
combining with General members. We will continue to closely monitor this assumption in future studies.
MASTER PAGE NO. 88

-17-
Chart 7 shows the life expectancies (i.e., expected future lifetime) under the current and the proposed
tables for General members.
Chart 8 shows the same information for Safety members.
As mentioned earlier, we want to make the Board aware that a future recommendation might be for the
use of a generational mortality table. While the use of generational mortality tables is under considerable
discussion as an emerging practice within the actuarial profession, to date it is still uncommon for public
sector retirement plans to actually use a generational mortality table. However, we anticipate that actuarial
practice will continue to move in this direction, for reasons we will now discuss.
A generational mortality table provides dynamic projections of mortality experience for each cohort of
retirees. For example, the mortality rate for someone who is 65 next year will be slightly less than for
someone who is 65 this year. In general, using generational mortality anticipates increases in the cost of
the Plan over time as participants’ life expectancies are projected to increase. This is in contrast to
updating a static mortality assumption with each experience study as we have proposed in this and prior
experience studies.
Using generational mortality rather than static mortality incorporates a more explicit assumption for
future mortality improvement. Accordingly, the goal is to start with a mortality table that closely matches
the current experience (without a margin for future mortality improvement), and then reflect mortality
improvement by projecting lower mortality rates in future years. That is why, for an illustrative
generational mortality table that we developed for the Plan, the current actual to expected ratio shown in
the tables below is only around 100%. In future years these ratios would remain around 100%, as long as
actual mortality improved at the same rates as anticipated in the generational mortality tables.
General – Healthy Safety – Healthy
Expected Deaths
Actual Deaths
Proposed Expected Deaths*
Expected Deaths
Actual Deaths
Proposed Expected Deaths**
Male 106 95 93 21 15 16 Female 131 143 143 1 1 1 Total 237 238 236 22 16 17
Actual / Expected 100% 101% 73% 94%
* For illustration purposes only and shown for the RP-2000 Combined Healthy Mortality Table projected to 2013 (middle year of the experience study period) with Scale BB, with age set back three years for males and no age set back for females.
** For illustration purposes only and shown for the RP-2000 Combined Healthy Mortality Table projected to 2013 (middle year of the experience study period) with Scale BB, with ages set back five years for males and females.
MASTER PAGE NO. 89

-18-
Note that using generational mortality increases current liabilities and costs more than using static
mortality but should result in fewer changes (and cost increases) in later years. For example, the
generational mortality table developed above would increase the total (employer and member)
contribution rate by about 1.5% of compensation more than the updated static table that we are
recommending.1
Note that there are currently unresolved issues regarding how generational mortality tables would be used
in determining member contribution rates, optional forms of payments and reserve values. These issues
would need to be addressed for VCERA before using a generational mortality table.
Mortality Table for Member Contributions
We recommend that the mortality table used for determining contributions for General members be
changed from RP-2000 Combined Healthy Mortality Table projected with Scale AA to 2025 set back one
year weighted 35% male and 65% female to the RP-2000 Combined Healthy Mortality Table projected
with Scale BB to 2035 set back one year for males and set forward one year for females weighted one-
third male and two-third female. This is based on the proposed valuation mortality table for General
members and the actual sex distribution of General members.
For Safety members, we recommend the mortality table be changed from the RP-2000 Combined Healthy
Mortality Table projected with Scale AA to 2025 set back one year weighted 80% male and 20% female
to the RP-2000 Combined Healthy Mortality Table projected with Scale BB to 2035 set back three years
weighted 80% male and 20% female. This is based on the proposed valuation mortality table for Safety
members and the actual sex distribution of Safety members.
1 These cost increases reflect the hypothetical adoption of generational mortality for both healthy and disabled retirees.
MASTER PAGE NO. 90

-19-
106
9586
131
143
124
237
238
210
050100
150
200
250
Mal
eFe
mal
eTo
tal
Cha
rt 5
Post
- R
etire
men
t Dea
ths
Non
- D
isab
led
Gen
eral
Mem
bers
Expe
cted
- C
urre
ntAc
tual
Ex
pect
ed -
Prop
osed
MASTER PAGE NO. 91
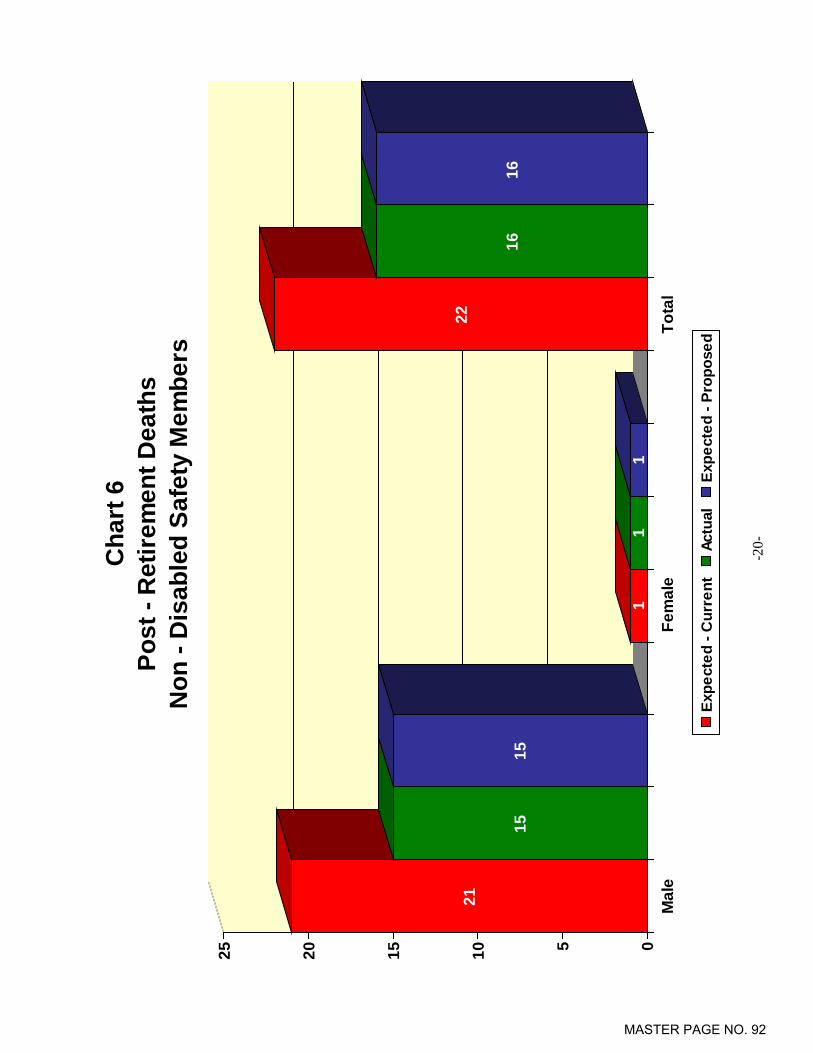
-20-
21
1515
11
1
22
1616
0510152025
Mal
eFe
mal
eTo
tal
Cha
rt 6
Post
- R
etire
men
t Dea
ths
Non
- D
isab
led
Safe
ty M
embe
rs
Expe
cted
- C
urre
ntAc
tual
Expe
cted
- Pr
opos
ed
MASTER PAGE NO. 92

-21-
Cha
rt 7
Li
fe E
xpec
tanc
ies
Non
- D
isab
led
Gen
eral
Mem
bers
010203040506070
20-2
425
-29
30-3
435
-39
40-4
445
-49
50-5
455
-59
60-6
465
-69
70-7
475
-79
80-8
485
-89
90-9
495
-99
Age
Cur
rent
(Mal
e)Pr
opos
ed (M
ale)
Cur
rent
(Fem
ale)
Prop
osed
(Fem
ale)
MASTER PAGE NO. 93
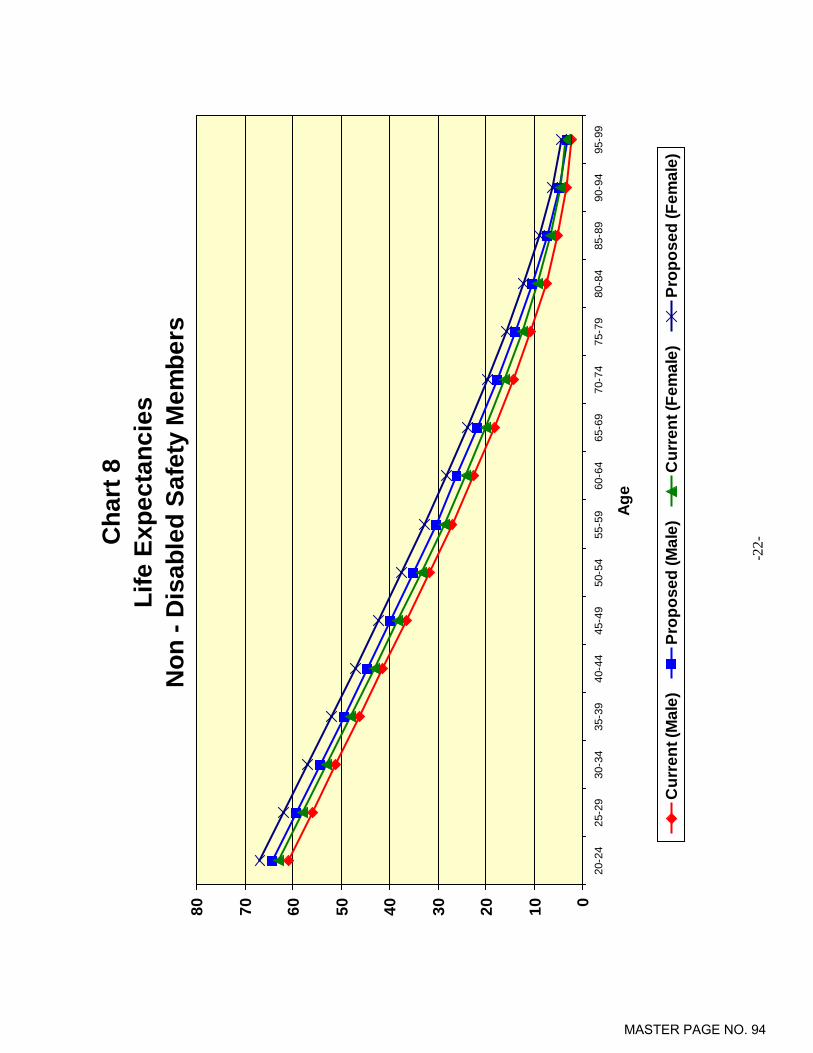
-22-
Cha
rt 8
Li
fe E
xpec
tanc
ies
Non
- D
isab
led
Safe
ty M
embe
rs
01020304050607080
20-2
425
-29
30-3
435
-39
40-4
445
-49
50-5
455
-59
60-6
465
-69
70-7
475
-79
80-8
485
-89
90-9
495
-99
Age
Cur
rent
(Mal
e)Pr
opos
ed (M
ale)
Cur
rent
(Fem
ale)
Prop
osed
(Fem
ale)
MASTER PAGE NO. 94
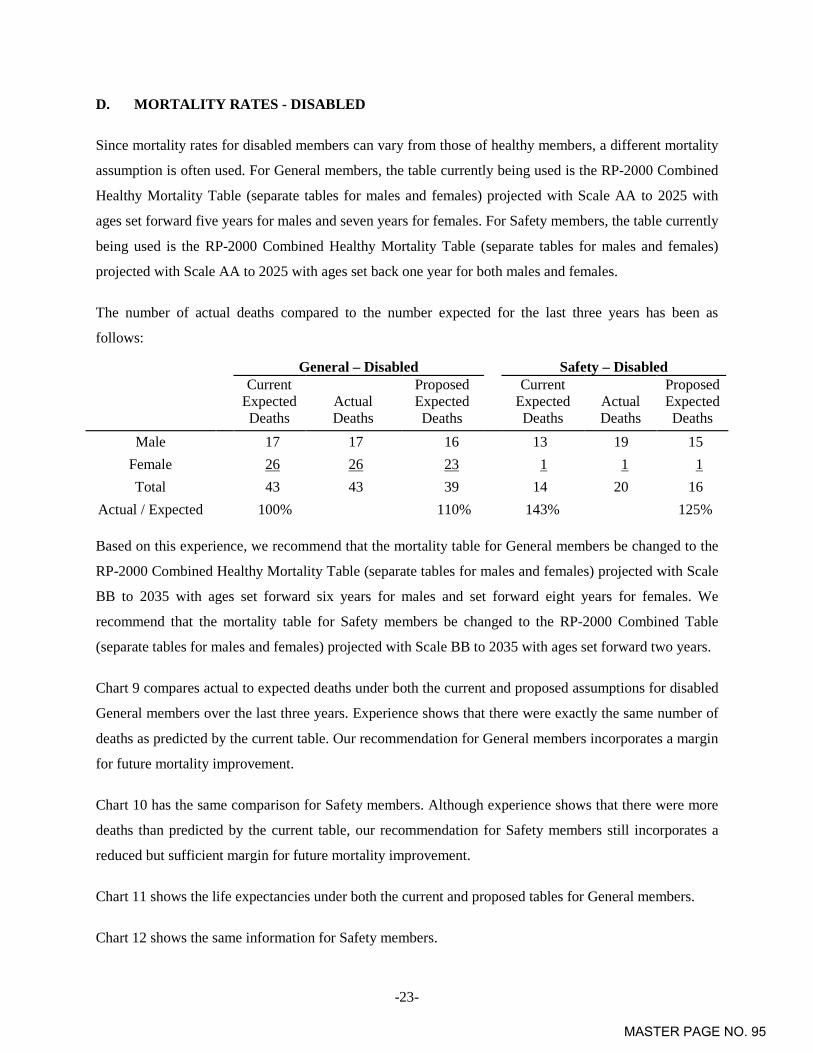
-23-
D. MORTALITY RATES - DISABLED
Since mortality rates for disabled members can vary from those of healthy members, a different mortality
assumption is often used. For General members, the table currently being used is the RP-2000 Combined
Healthy Mortality Table (separate tables for males and females) projected with Scale AA to 2025 with
ages set forward five years for males and seven years for females. For Safety members, the table currently
being used is the RP-2000 Combined Healthy Mortality Table (separate tables for males and females)
projected with Scale AA to 2025 with ages set back one year for both males and females.
The number of actual deaths compared to the number expected for the last three years has been as
follows:
General – Disabled Safety – Disabled
Current Expected Deaths
Actual Deaths
Proposed Expected Deaths
Current Expected Deaths
Actual Deaths
Proposed Expected Deaths
Male 17 17 16 13 19 15 Female 26 26 23 1 1 1 Total 43 43 39 14 20 16
Actual / Expected 100% 110% 143% 125%
Based on this experience, we recommend that the mortality table for General members be changed to the
RP-2000 Combined Healthy Mortality Table (separate tables for males and females) projected with Scale
BB to 2035 with ages set forward six years for males and set forward eight years for females. We
recommend that the mortality table for Safety members be changed to the RP-2000 Combined Table
(separate tables for males and females) projected with Scale BB to 2035 with ages set forward two years.
Chart 9 compares actual to expected deaths under both the current and proposed assumptions for disabled
General members over the last three years. Experience shows that there were exactly the same number of
deaths as predicted by the current table. Our recommendation for General members incorporates a margin
for future mortality improvement.
Chart 10 has the same comparison for Safety members. Although experience shows that there were more
deaths than predicted by the current table, our recommendation for Safety members still incorporates a
reduced but sufficient margin for future mortality improvement.
Chart 11 shows the life expectancies under both the current and proposed tables for General members.
Chart 12 shows the same information for Safety members.
MASTER PAGE NO. 95
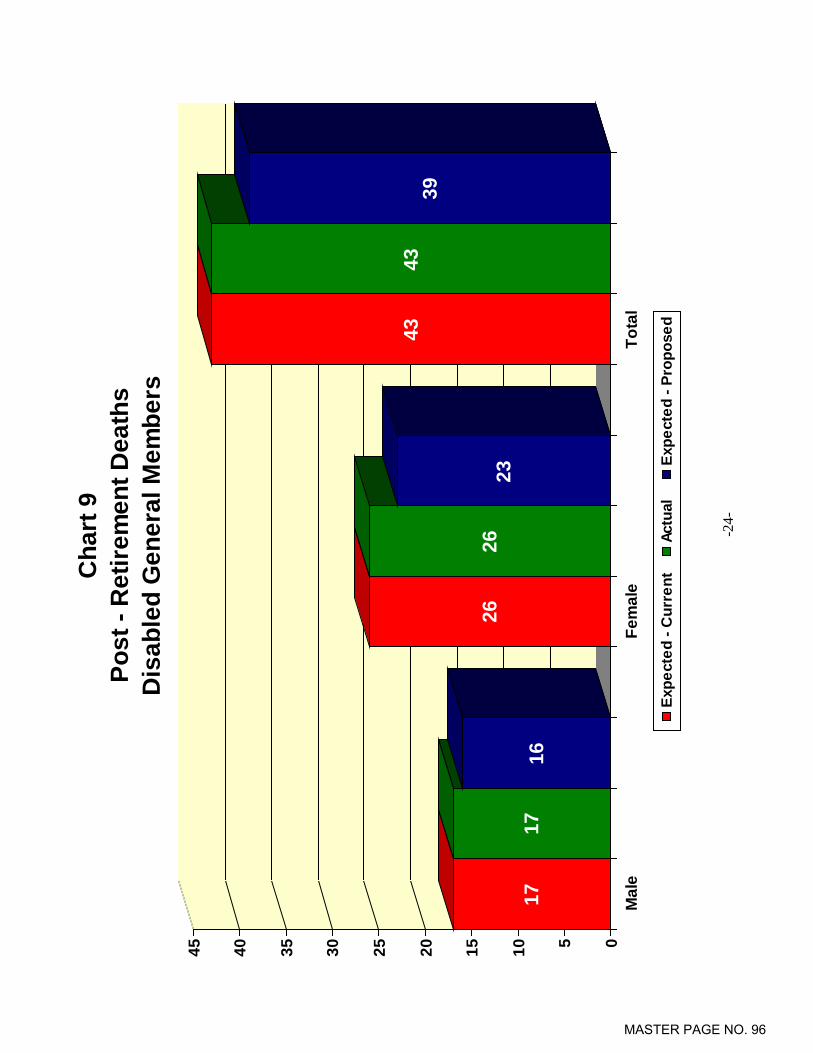
-24-
1717
16
2626
23
4343
39
051015202530354045
Mal
eFe
mal
eTo
tal
Cha
rt 9
Post
- R
etire
men
t Dea
ths
Dis
able
d G
ener
al M
embe
rs
Expe
cted
- C
urre
ntAc
tual
Ex
pect
ed -
Prop
osed
MASTER PAGE NO. 96

-25-
13
19
15
11
1
14
20
16
02468101214161820
Mal
eFe
mal
eTo
tal
Cha
rt 1
0Po
st -
Ret
irem
ent D
eath
sD
isab
led
Safe
ty M
embe
rs
Expe
cted
- C
urre
ntAc
tual
Ex
pect
ed -
Prop
osed
MASTER PAGE NO. 97

-26-
Cha
rt 1
1
Li
fe E
xpec
tanc
ies
Dis
able
d G
ener
al M
embe
rs
0102030405060
20-2
425
-29
30-3
435
-39
40-4
445
-49
50-5
455
-59
60-6
465
-69
70-7
475
-79
80-8
485
-89
90-9
495
-99
Age
Cur
rent
(Mal
e)Pr
opos
ed (M
ale)
Cur
rent
(Fem
ale)
Prop
osed
(Fem
ale)
MASTER PAGE NO. 98

-27-
Cha
rt 1
2
Li
fe E
xpec
tanc
ies
Dis
able
d Sa
fety
Mem
bers
010203040506070
20-2
425
-29
30-3
435
-39
40-4
445
-49
50-5
455
-59
60-6
465
-69
70-7
475
-79
80-8
485
-89
90-9
495
-99
Age
Cur
rent
(Mal
e)Pr
opos
ed (M
ale)
Cur
rent
(Fem
ale)
Prop
osed
(Fem
ale)
MASTER PAGE NO. 99

-28-
E. TERMINATION RATES
Termination rates include all terminations for reasons other than death, disability, or retirement. Under the
current assumptions there is an overall incidence of termination assumed, combined with an assumption
that a member will choose between a refund of contributions and a deferred vested benefit based on
which option is more valuable. With this study, we continue to recommend that this same assumption
structure be used.
Currently, the assumed termination rates are a function of a member’s age for members with five or more
years of service. Our experience review analyzed terminations both as a function of age and as a function
of years of service. Our review found that while termination rates correlate with both years of service and
age, we believe there is a stronger correlation with years of service. This is consistent with our experience
from other systems.
As a result of this review, we recommend that the termination rate assumption be structured solely as a
function of years of service.
The termination experience over the last three years for General and Safety members is shown by years of
service in the following tables. Please note that we have excluded any members that were eligible for
retirement. We also show the current and proposed assumptions.
MASTER PAGE NO. 100
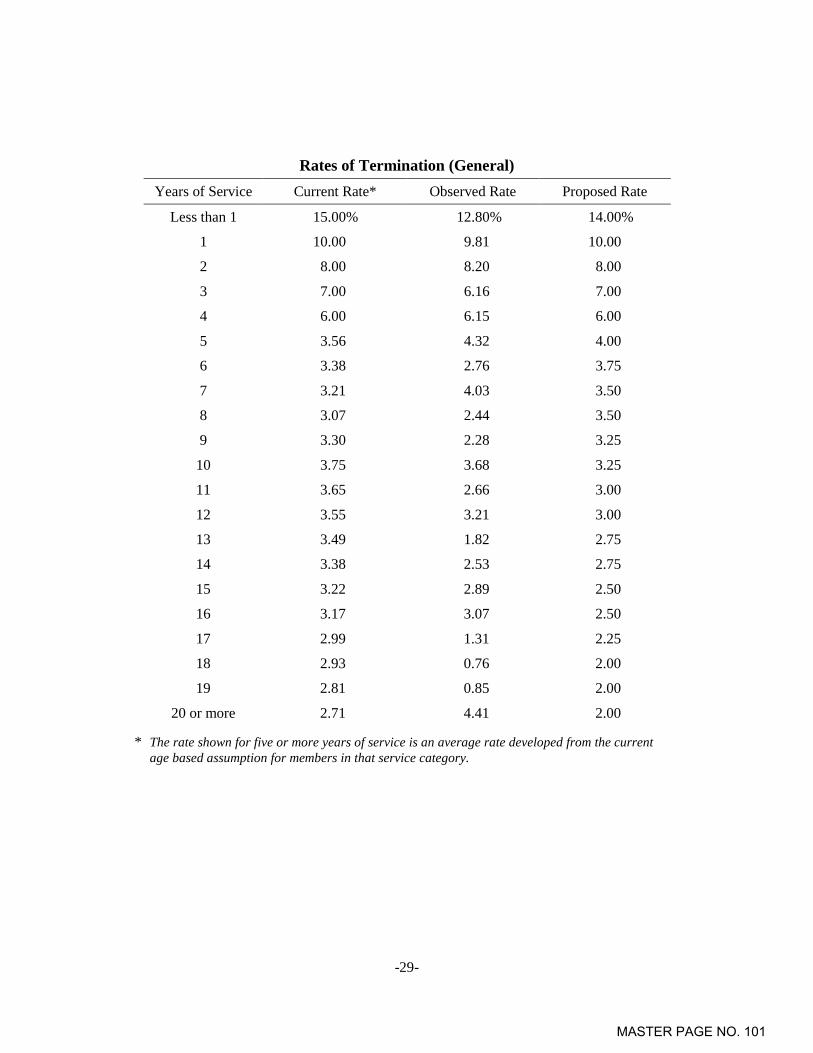
-29-
Rates of Termination (General) Years of Service Current Rate* Observed Rate Proposed Rate
Less than 1 15.00% 12.80% 14.00%
1 10.00 9.81 10.00
2 8.00 8.20 8.00
3 7.00 6.16 7.00
4 6.00 6.15 6.00
5 3.56 4.32 4.00
6 3.38 2.76 3.75
7 3.21 4.03 3.50
8 3.07 2.44 3.50
9 3.30 2.28 3.25
10 3.75 3.68 3.25
11 3.65 2.66 3.00
12 3.55 3.21 3.00
13 3.49 1.82 2.75
14 3.38 2.53 2.75
15 3.22 2.89 2.50
16 3.17 3.07 2.50
17 2.99 1.31 2.25
18 2.93 0.76 2.00
19 2.81 0.85 2.00
20 or more 2.71 4.41 2.00
* The rate shown for five or more years of service is an average rate developed from the current age based assumption for members in that service category.
MASTER PAGE NO. 101

-30-
Rates of Termination (Safety) Years of Service Current Rate* Observed Rate Proposed Rate
Less than 1 12.00% 3.42% 10.00%
1 6.00 6.90 6.00
2 5.50 4.83 5.50
3 5.00 4.92 5.00
4 4.00 3.56 4.00
5 2.79 2.61 2.75
6 2.62 1.98 2.50
7 2.48 1.32 2.00
8 2.08 1.47 1.80
9 1.98 0.79 1.60
10 1.81 0.59 1.40
11 1.67 0.61 1.20
12 1.54 0.88 1.00
13 1.42 1.10 0.95
14 1.27 0.61 0.90
15 1.21 0.00 0.85
16 1.11 0.69 0.80
17 1.01 0.00 0.75
18 0.91 0.88 0.70
19 0.92 0.00 0.65
20 or more 0.54 100.00 0.60
* The rate shown for or more five years of service is an average rate developed from the current age based assumption for members in that service category.
MASTER PAGE NO. 102
-31-
It is important to note that not every service category has enough exposures and/or decrements such that
the results in that category are statistically credible. This is mainly the case at the highest service
categories since most members in those categories are eligible to retire and so have been excluded from
our review of this experience. It is also the case in the tables that follow due to the even more limited
experience regarding actual terminations.
Chart 13 compares actual to expected terminations over the past three years for both the current and
proposed assumptions for General members.
Chart 14 graphs the same information as Chart 13, but for Safety members.
Chart 15 shows the actual termination rates over the past three years compared to the current and
proposed assumptions for General members.
Chart 16 shows the same information as Chart 15, but for Safety members.
Based upon the recent experience, the termination rates for General members have been increased for
those with 5 to 8 years of service and decreased for all other years of service categories. For Safety, we
have decreased the termination rates at most years of service categories. Overall, for both General and
Safety members, the proposed termination rates are lower than those under the current assumptions.
It is our understanding that General Tier 2 COLA members can elect a refund of all or a portion of their
Tier 2 COLA member contributions and forgo the Tier 2 COLA upon retirement. Based on the data,
about 97% of General Tier 2 COLA retirees during the three-experience period are receiving a COLA on
their Tier 2 benefits. We will continue to assume that all members retiring with the Tier 2 COLA will
elect to have the COLA applied to their benefit.
We will also continue to assume that termination rates are zero at any age where members are assumed to
retire. In other words, at those ages, members will either retire in accordance with the retirement rate
assumptions or continue working, rather than terminate and defer their benefit.
MASTER PAGE NO. 103

-32-
`
285
227
279
273
267
267
276
286
270
834
780
816
0
100
200
300
400
500
600
700
800
900
2012
2013
2014
Tota
lYe
ar e
nded
Jun
e 30
,
Cha
rt 1
3A
ctua
l Num
ber o
f Ter
min
atio
ns C
ompa
red
to E
xpec
ted
- Gen
eral
Mem
bers
Expe
cted
- C
urre
nt
Actu
alEx
pect
ed -
Prop
osed
MASTER PAGE NO. 104

-33-
3326
2830
2526
32
1828
95
6982
0102030405060708090100
2012
2013
2014
Tota
lYe
ar e
nded
Jun
e 30
,
Cha
rt 1
4A
ctua
l Num
ber o
f Ter
min
atio
ns C
ompa
red
to E
xpec
ted
- Saf
ety
mem
bers
Expe
cted
- C
urre
nt
Actu
alEx
pect
ed -
Prop
osed
MASTER PAGE NO. 105
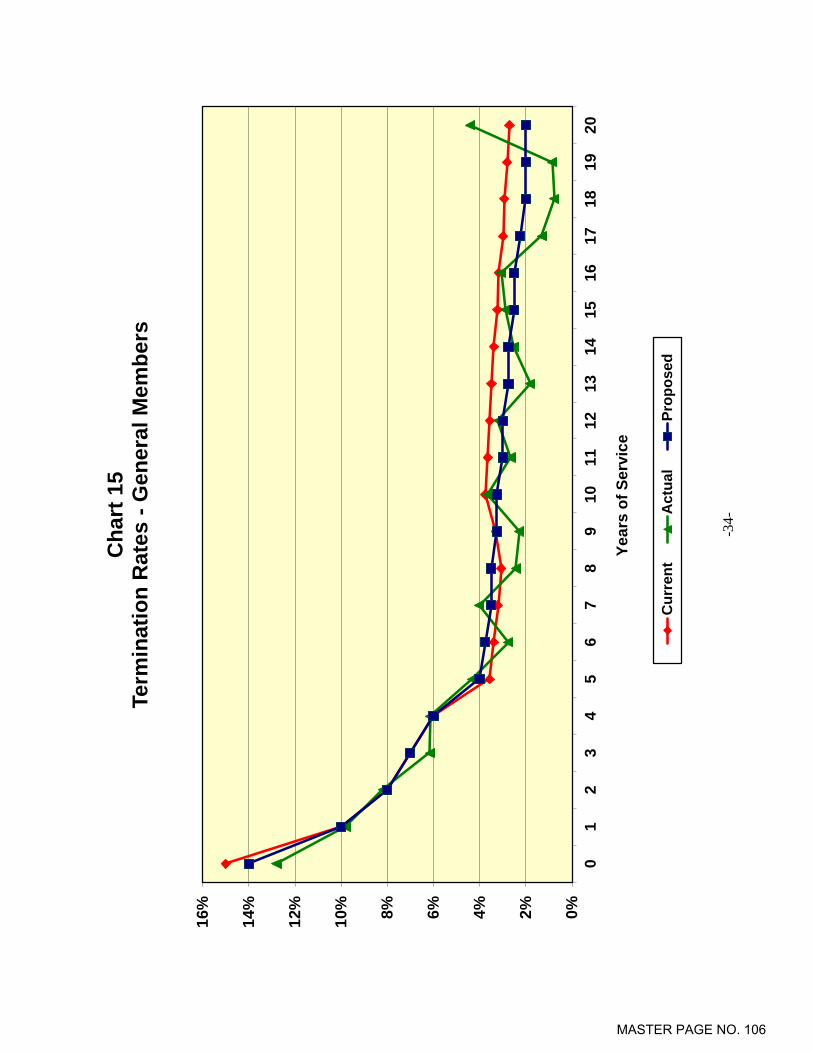
-34-
0%2%4%6%8%10%
12%
14%
16%
01
23
45
67
89
1011
1213
1415
1617
1819
20
Year
s of
Ser
vice
Cha
rt 1
5
Term
inat
ion
Rat
es -
Gen
eral
Mem
bers
Cur
rent
Act
ual
Prop
osed
MASTER PAGE NO. 106

-35-
0%2%4%6%8%10%
12%
14%
01
23
45
67
89
1011
1213
1415
1617
1819
20
Year
s of
Ser
vice
Cha
rt 1
6
Term
inat
ion
Rat
es -
Safe
ty M
embe
rs
Cur
rent
Act
ual
Prop
osed
MASTER PAGE NO. 107
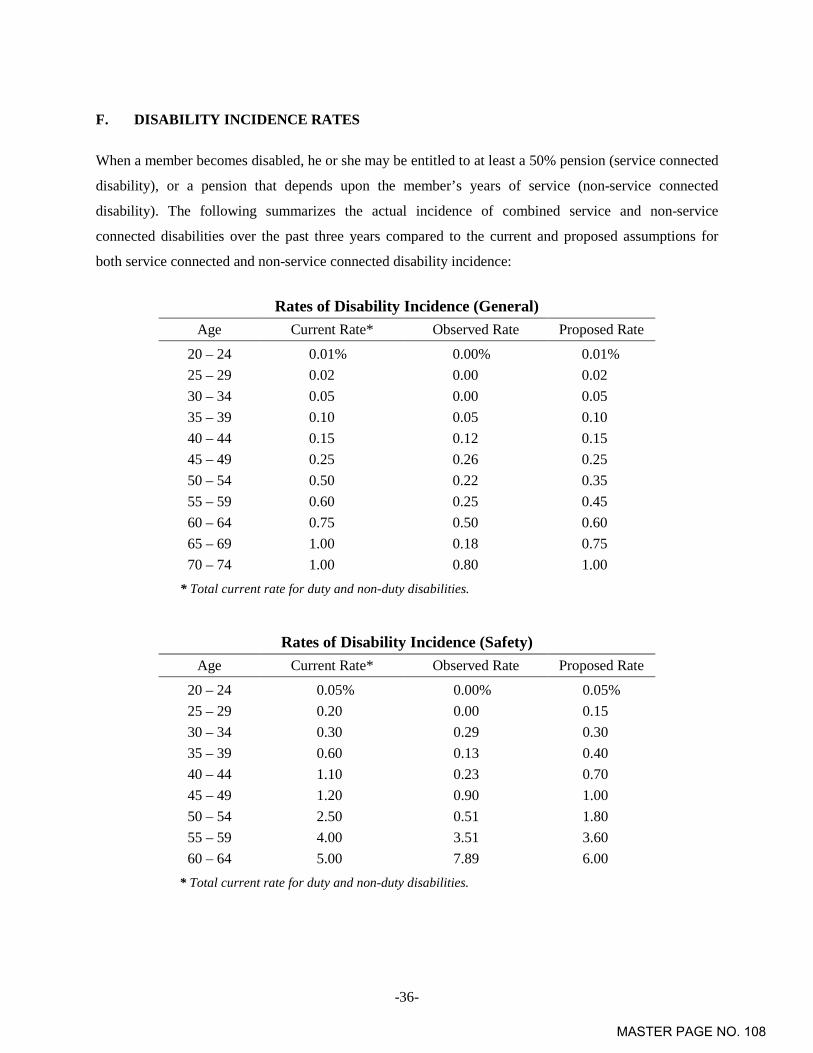
-36-
F. DISABILITY INCIDENCE RATES
When a member becomes disabled, he or she may be entitled to at least a 50% pension (service connected
disability), or a pension that depends upon the member’s years of service (non-service connected
disability). The following summarizes the actual incidence of combined service and non-service
connected disabilities over the past three years compared to the current and proposed assumptions for
both service connected and non-service connected disability incidence:
Rates of Disability Incidence (General) Age Current Rate* Observed Rate Proposed Rate
20 – 24 0.01% 0.00% 0.01% 25 – 29 0.02 0.00 0.02 30 – 34 0.05 0.00 0.05 35 – 39 0.10 0.05 0.10 40 – 44 0.15 0.12 0.15 45 – 49 0.25 0.26 0.25 50 – 54 0.50 0.22 0.35 55 – 59 0.60 0.25 0.45 60 – 64 0.75 0.50 0.60 65 – 69 1.00 0.18 0.75 70 – 74 1.00 0.80 1.00
* Total current rate for duty and non-duty disabilities.
Rates of Disability Incidence (Safety) Age Current Rate* Observed Rate Proposed Rate
20 – 24 0.05% 0.00% 0.05% 25 – 29 0.20 0.00 0.15 30 – 34 0.30 0.29 0.30 35 – 39 0.60 0.13 0.40 40 – 44 1.10 0.23 0.70 45 – 49 1.20 0.90 1.00 50 – 54 2.50 0.51 1.80 55 – 59 4.00 3.51 3.60 60 – 64 5.00 7.89 6.00
* Total current rate for duty and non-duty disabilities.
MASTER PAGE NO. 108

-37-
Chart 17 compares the actual number of duty and ordinary disabilities over the past three years to that
expected under both the current and proposed assumptions. The proposed disability rates were adjusted to
reflect the past three years experience. Overall, there are decreases in the rates proposed for both General
and Safety members.
Chart 18 shows actual disability incidence rates, compared to the assumed and proposed rates for General
members. Since 25% of disabled General members received a duty disability, we recommend reducing
the current assumption from 40% to 35% of disabilities being entitled to a duty disability retirement. The
remaining 65% of disabled General members are assumed to receive an ordinary disability retirement.
Chart 19 graphs the same information as Charts 18, but for Safety members. Since 97% of disabled Safety
members received a duty disability, we recommend maintaining the current assumption that 90% of
disabilities will receive a duty disability retirement. This recommendation is based partially on the fact
that 79% of Safety members received a duty disability in the prior experience study period. The
remaining 10% of disabled Safety members are assumed to receive an ordinary disability retirement.
MASTER PAGE NO. 109
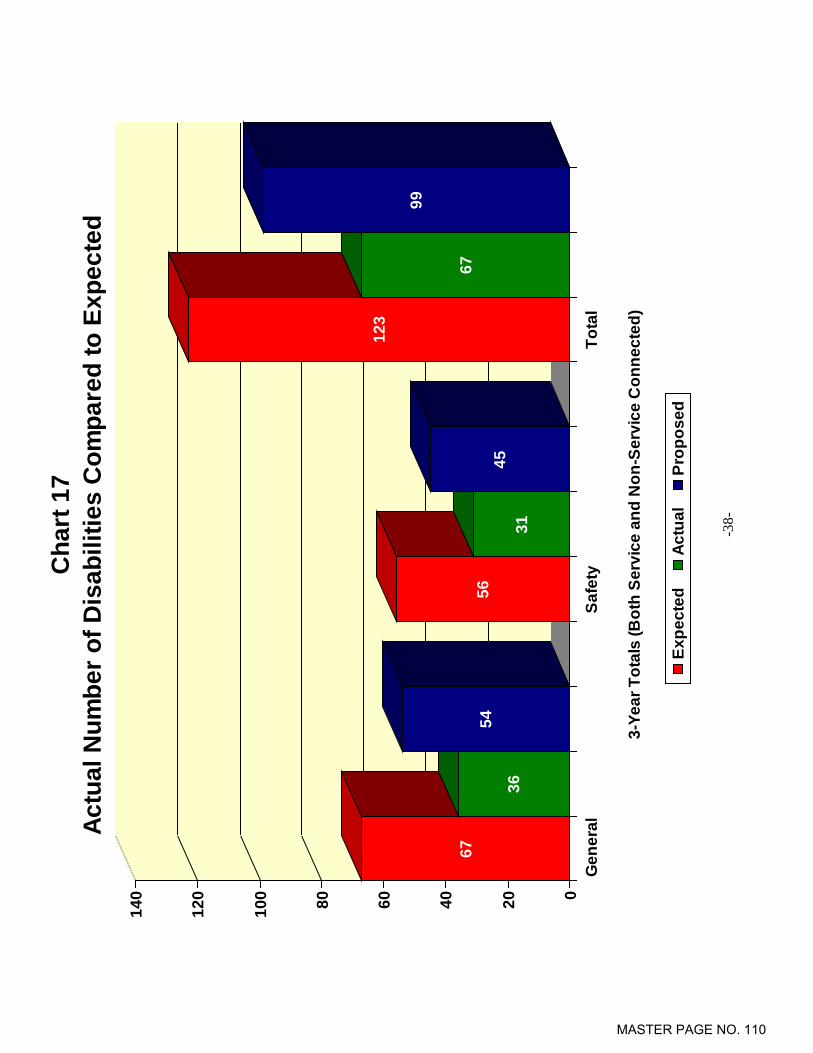
-38-
67
36
5456
3145
123
67
99
020406080100
120
140
Gen
eral
Safe
tyTo
tal
3-Ye
ar T
otal
s (B
oth
Serv
ice
and
Non
-Ser
vice
Con
nect
ed)
Cha
rt 1
7Ac
tual
Num
ber o
f Dis
abili
ties
Com
pare
d to
Exp
ecte
d
Expe
cted
Actu
alPr
opos
ed
MASTER PAGE NO. 110
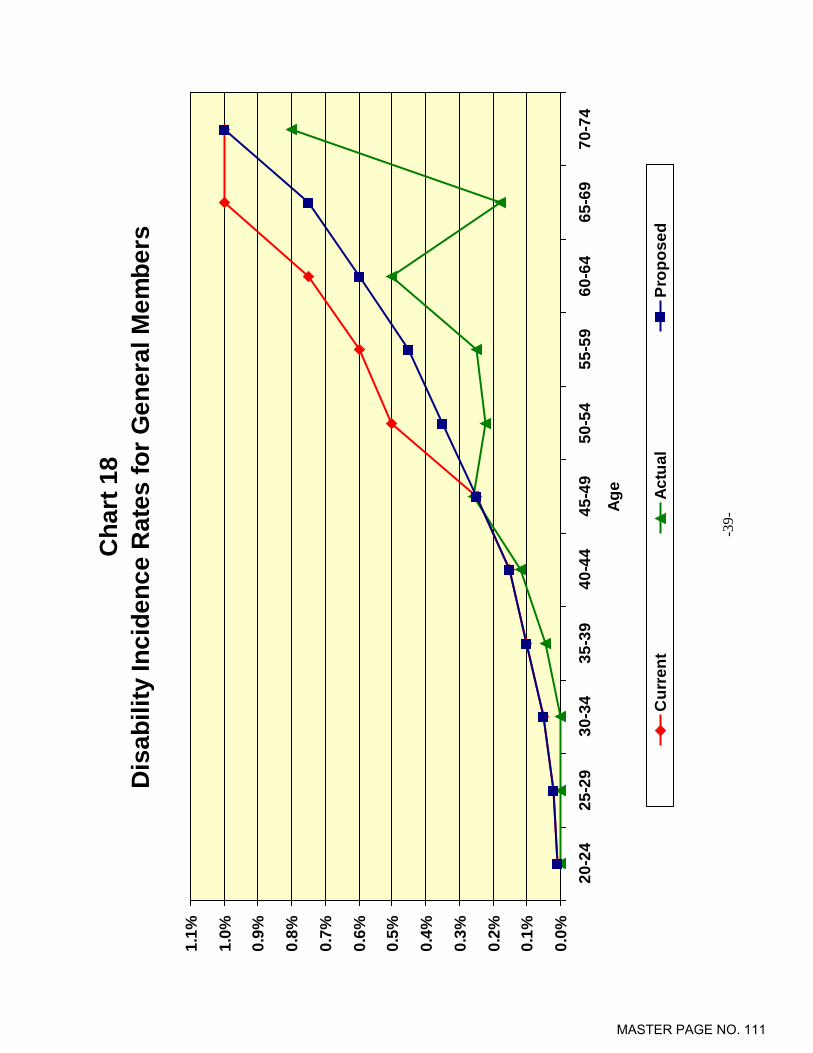
-39-
Cha
rt 1
8
D
isab
ility
Inci
denc
e R
ates
for G
ener
al M
embe
rs
0.0%
0.1%
0.2%
0.3%
0.4%
0.5%
0.6%
0.7%
0.8%
0.9%
1.0%
1.1%
20-2
425
-29
30-3
435
-39
40-4
445
-49
50-5
455
-59
60-6
465
-69
70-7
4
Age
Cur
rent
Actu
alPr
opos
ed
MASTER PAGE NO. 111

-40-
Cha
rt 1
9
D
isab
ility
Inci
denc
e R
ates
for S
afet
y M
embe
rs
0.0%
1.0%
2.0%
3.0%
4.0%
5.0%
6.0%
7.0%
8.0%
9.0%
20-2
425
-29
30-3
435
-39
40-4
445
-49
50-5
455
-59
60-6
4
Age
Cur
rent
Actu
alPr
opos
ed
MASTER PAGE NO. 112

-41-
G. PROMOTIONAL AND MERIT SALARY INCREASES
The Association’s retirement benefits are determined in large part by a member’s compensation just prior
to retirement. For that reason, it is important to anticipate salary increases that employees will receive
over their careers. These salary increases are made up of three components:
Inflationary increases;
Real “across the board” increases; and
Promotional and merit increases.
The inflationary increases are assumed to follow the general annual price inflation assumption discussed
in our separate economic assumptions report where we recommended a decrease in the inflation
assumption from 3.25% to 3.00%. We also discussed in that report decreasing the annual “across the
board” pay increase assumptions from 0.75% to 0.50%. Therefore, the total assumed inflation and real
“across the board” pay increase (i.e., wage inflation) decreases from 4.00% to 3.50%. This is the annual
rate of payroll growth at which payments to amortize the Unfunded Actuarial Accrued Liability (UAAL)
are assumed to increase.
The annual promotional and merit increases are determined by measuring the actual increases received by
members over the experience period, net of the inflationary and real “across the board” pay increases.
Increases are measured separately for General and Safety members. This is accomplished by:
Measuring each continuing member’s actual salary increase over each year of the experience period;
Excluding any members with increases of more than 50% or decreases of more than 10% during any
particular year;
Categorizing these increases according to member demographics;
Removing the wage inflation component from these increases (assumed to be equal to the increase in
the members’ average salary during the year);
Averaging these annual increases over the three-year experience period; and
Modifying current assumptions to reflect some portion of these measured increases reflective of their
“credibility.”
Note that, to be consistent with other economic assumptions, these merit and promotional assumptions
should be used in combination with the proposed 3.50% inflation and real “across the board” increases
shown in our economic assumptions report.
MASTER PAGE NO. 113
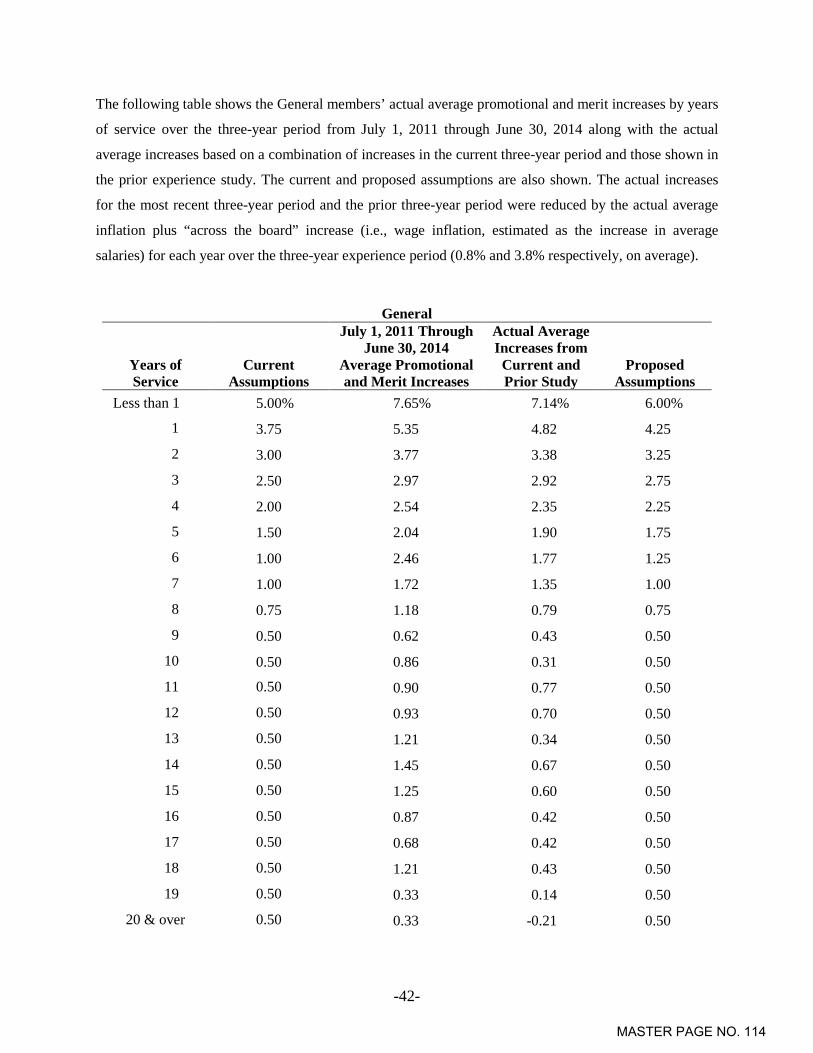
-42-
The following table shows the General members’ actual average promotional and merit increases by years
of service over the three-year period from July 1, 2011 through June 30, 2014 along with the actual
average increases based on a combination of increases in the current three-year period and those shown in
the prior experience study. The current and proposed assumptions are also shown. The actual increases
for the most recent three-year period and the prior three-year period were reduced by the actual average
inflation plus “across the board” increase (i.e., wage inflation, estimated as the increase in average
salaries) for each year over the three-year experience period (0.8% and 3.8% respectively, on average).
General
Years of Service
Current Assumptions
July 1, 2011 Through June 30, 2014
Average Promotional and Merit Increases
Actual Average Increases from Current and Prior Study
Proposed Assumptions
Less than 1 5.00% 7.65% 7.14% 6.00%
1 3.75 5.35 4.82 4.25
2 3.00 3.77 3.38 3.25
3 2.50 2.97 2.92 2.75
4 2.00 2.54 2.35 2.25
5 1.50 2.04 1.90 1.75
6 1.00 2.46 1.77 1.25
7 1.00 1.72 1.35 1.00
8 0.75 1.18 0.79 0.75
9 0.50 0.62 0.43 0.50
10 0.50 0.86 0.31 0.50
11 0.50 0.90 0.77 0.50
12 0.50 0.93 0.70 0.50
13 0.50 1.21 0.34 0.50
14 0.50 1.45 0.67 0.50
15 0.50 1.25 0.60 0.50
16 0.50 0.87 0.42 0.50
17 0.50 0.68 0.42 0.50
18 0.50 1.21 0.43 0.50
19 0.50 0.33 0.14 0.50
20 & over 0.50 0.33 -0.21 0.50
MASTER PAGE NO. 114
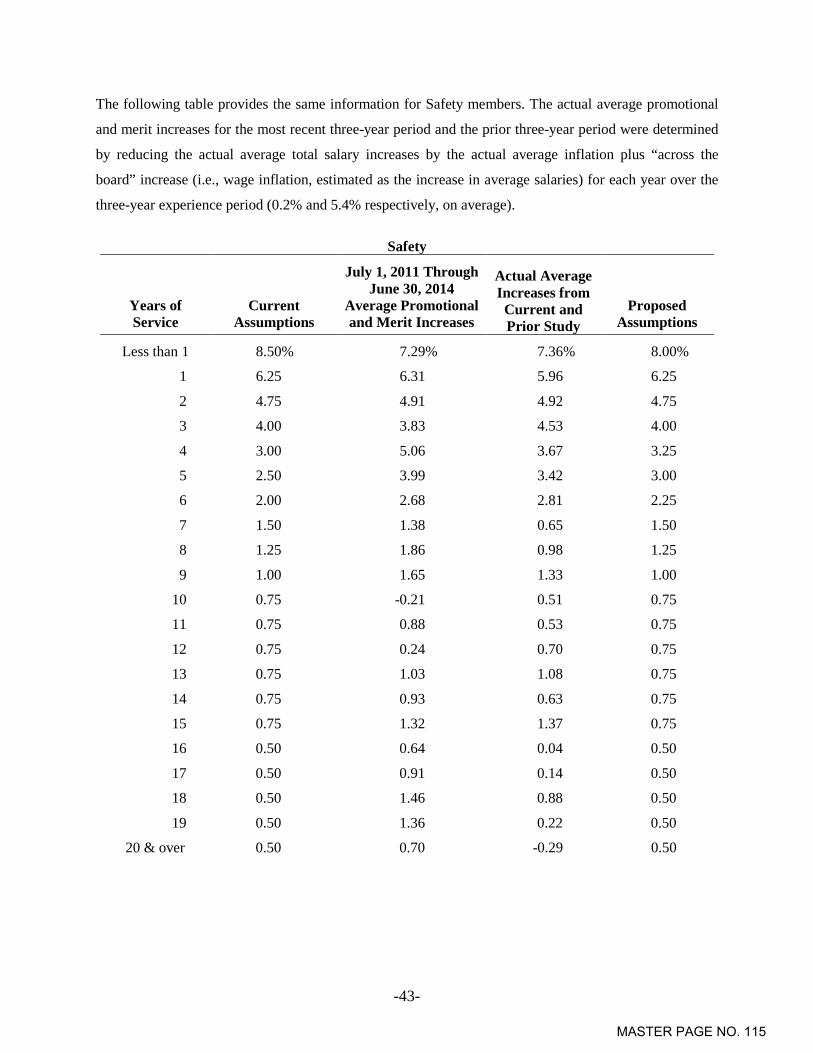
-43-
The following table provides the same information for Safety members. The actual average promotional
and merit increases for the most recent three-year period and the prior three-year period were determined
by reducing the actual average total salary increases by the actual average inflation plus “across the
board” increase (i.e., wage inflation, estimated as the increase in average salaries) for each year over the
three-year experience period (0.2% and 5.4% respectively, on average).
Safety
Years of Service
Current Assumptions
July 1, 2011 Through June 30, 2014
Average Promotional and Merit Increases
Actual Average Increases from Current and Prior Study
Proposed Assumptions
Less than 1 8.50% 7.29% 7.36% 8.00%
1 6.25 6.31 5.96 6.25
2 4.75 4.91 4.92 4.75
3 4.00 3.83 4.53 4.00
4 3.00 5.06 3.67 3.25
5 2.50 3.99 3.42 3.00
6 2.00 2.68 2.81 2.25
7 1.50 1.38 0.65 1.50
8 1.25 1.86 0.98 1.25
9 1.00 1.65 1.33 1.00
10 0.75 -0.21 0.51 0.75
11 0.75 0.88 0.53 0.75
12 0.75 0.24 0.70 0.75
13 0.75 1.03 1.08 0.75
14 0.75 0.93 0.63 0.75
15 0.75 1.32 1.37 0.75
16 0.50 0.64 0.04 0.50
17 0.50 0.91 0.14 0.50
18 0.50 1.46 0.88 0.50
19 0.50 1.36 0.22 0.50
20 & over 0.50 0.70 -0.29 0.50
MASTER PAGE NO. 115

-44-
Charts 20 and 21 provide a graphical comparison of the actual promotional and merit increases, compared
to the proposed and current assumptions. The charts also show the actual promotional and merit increases
based on an average of both the current and previous experience periods. This is discussed below. Chart
20 shows this information for General members and Chart 21 for Safety members.
We realize that the most recent three-year experience period may not be typically indicative of future
long-term promotional and merit salary increases. This appears to be the case for both General and Safety
members as they received virtually no “across the board” salary increases (based on the very low increase
in average wages). Note that, in this situation, our model may lead to higher estimated promotional and
merit increases. Therefore, we also examined the promotional and merit salary experience used in the
prior experience study (which actually consisted of two years of experience). We believe that when the
experience from the last two studies are combined into an average result it provides a more reasonable
representation of potential future promotional and merit salary increases over the long term. Nevertheless,
in our proposed changes to the promotional and merit increases, we have still given relatively less weight
to the actual average increases experience during the last two studies.
Based on this experience, we are proposing slight increases in the promotional and merit salary increases
for both General and Safety members. Overall, salary increases are lower for General and Safety
members due to the lower price inflation and real “across the board” pay increase assumptions.
MASTER PAGE NO. 116

-45-
Cha
rt 2
0
Pr
omot
iona
l and
Mer
it Sa
lary
Incr
ease
Rat
es -
Gen
eral
Mem
bers
-1.0
%
0.0%
1.0%
2.0%
3.0%
4.0%
5.0%
6.0%
7.0%
8.0%
01
23
45
67
89
1011
1213
1415
1617
1819
20+
Year
s of
Ser
vice
Cur
rent
Actu
alPr
opos
edAc
tual
Ave
rage
of L
ast T
wo
Stud
ies
MASTER PAGE NO. 117

-46-
Cha
rt 2
1
Pr
omot
iona
l and
Mer
it Sa
lary
Incr
ease
Rat
es -
Safe
ty M
embe
rs
-1.0
%
0.0%
1.0%
2.0%
3.0%
4.0%
5.0%
6.0%
7.0%
8.0%
9.0%
01
23
45
67
89
1011
1213
1415
1617
1819
20+
Year
s of
Ser
vice
Cur
rent
Actu
alPr
opos
edAc
tual
Ave
rage
of L
ast T
wo
Stud
ies
MASTER PAGE NO. 118
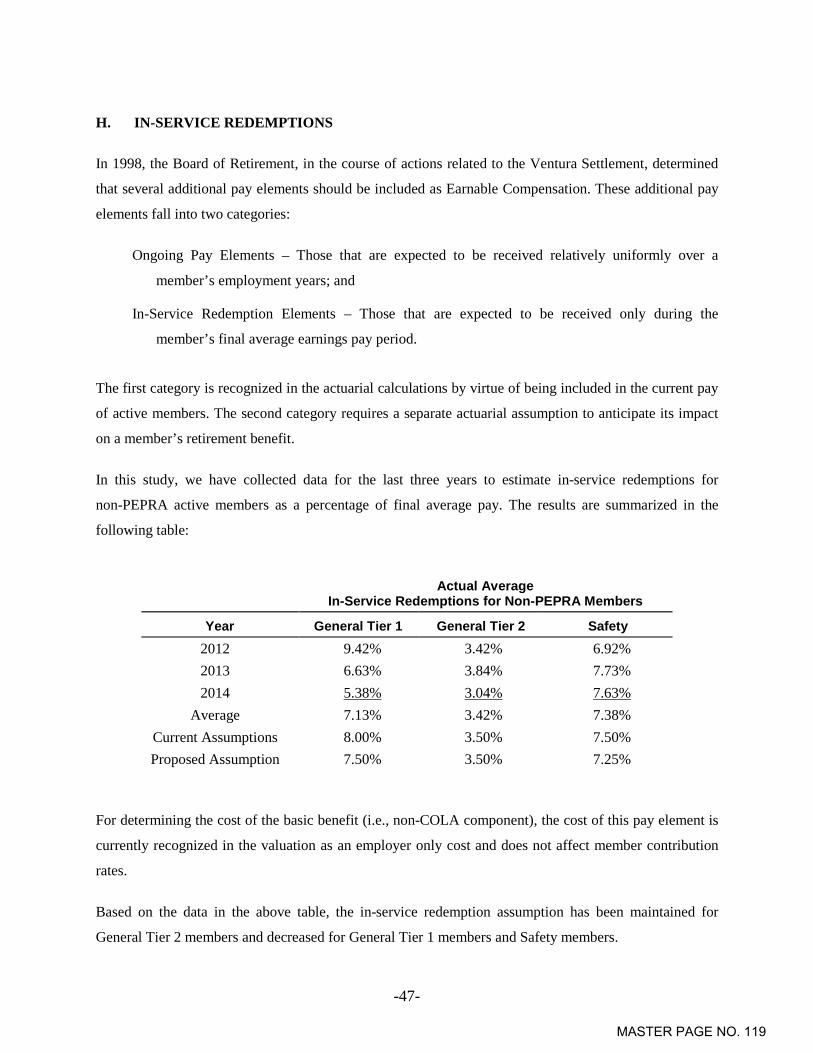
-47-
H. IN-SERVICE REDEMPTIONS
In 1998, the Board of Retirement, in the course of actions related to the Ventura Settlement, determined
that several additional pay elements should be included as Earnable Compensation. These additional pay
elements fall into two categories:
Ongoing Pay Elements – Those that are expected to be received relatively uniformly over a
member’s employment years; and
In-Service Redemption Elements – Those that are expected to be received only during the
member’s final average earnings pay period.
The first category is recognized in the actuarial calculations by virtue of being included in the current pay
of active members. The second category requires a separate actuarial assumption to anticipate its impact
on a member’s retirement benefit.
In this study, we have collected data for the last three years to estimate in-service redemptions for
non-PEPRA active members as a percentage of final average pay. The results are summarized in the
following table:
Actual Average
In-Service Redemptions for Non-PEPRA Members
Year General Tier 1 General Tier 2 Safety 2012 9.42% 3.42% 6.92% 2013 6.63% 3.84% 7.73% 2014 5.38% 3.04% 7.63%
Average 7.13% 3.42% 7.38% Current Assumptions 8.00% 3.50% 7.50% Proposed Assumption 7.50% 3.50% 7.25%
For determining the cost of the basic benefit (i.e., non-COLA component), the cost of this pay element is
currently recognized in the valuation as an employer only cost and does not affect member contribution
rates.
Based on the data in the above table, the in-service redemption assumption has been maintained for
General Tier 2 members and decreased for General Tier 1 members and Safety members.
MASTER PAGE NO. 119

-48-
I. AVERAGE ENTRY AGE (FOR MEMBER CONTRIBUTIONS)
The assumption for average entry age of active members is used in determining the rate at which
members who were hired after November 1974 contribute. The current assumption is age 36 for General
members and age 27 for Safety members. The actual average entry ages for all active members as of
June 30, 2014 is age 35.2 for General members and age 27.1 for Safety members.
Based on this experience we recommend that the average entry age for General members used for
determining member contribution rates be decreased from age 36 to age 35. For Safety members we
recommend that the average entry age used for determining member contribution rates be maintained at
age 27.
MASTER PAGE NO. 120
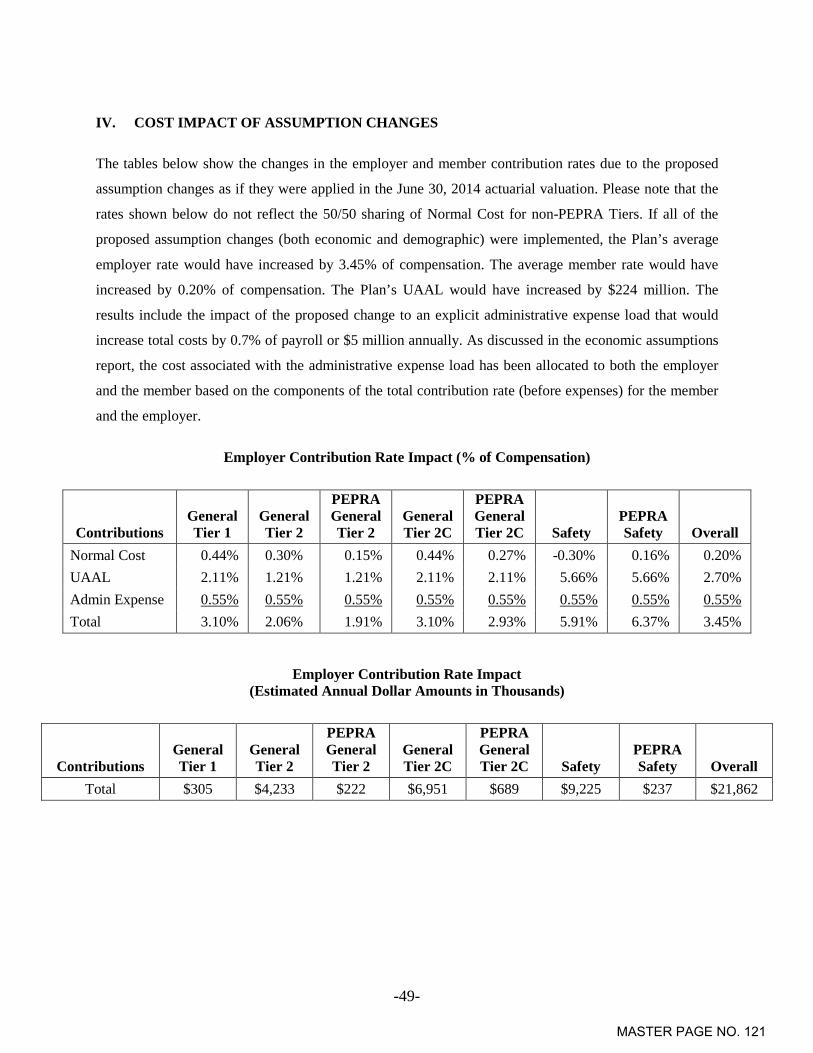
-49-
IV. COST IMPACT OF ASSUMPTION CHANGES
The tables below show the changes in the employer and member contribution rates due to the proposed
assumption changes as if they were applied in the June 30, 2014 actuarial valuation. Please note that the
rates shown below do not reflect the 50/50 sharing of Normal Cost for non-PEPRA Tiers. If all of the
proposed assumption changes (both economic and demographic) were implemented, the Plan’s average
employer rate would have increased by 3.45% of compensation. The average member rate would have
increased by 0.20% of compensation. The Plan’s UAAL would have increased by $224 million. The
results include the impact of the proposed change to an explicit administrative expense load that would
increase total costs by 0.7% of payroll or $5 million annually. As discussed in the economic assumptions
report, the cost associated with the administrative expense load has been allocated to both the employer
and the member based on the components of the total contribution rate (before expenses) for the member
and the employer.
Employer Contribution Rate Impact (% of Compensation)
Contributions General Tier 1
General Tier 2
PEPRA General Tier 2
General Tier 2C
PEPRA General Tier 2C Safety
PEPRA Safety Overall
Normal Cost 0.44% 0.30% 0.15% 0.44% 0.27% -0.30% 0.16% 0.20% UAAL 2.11% 1.21% 1.21% 2.11% 2.11% 5.66% 5.66% 2.70% Admin Expense 0.55% 0.55% 0.55% 0.55% 0.55% 0.55% 0.55% 0.55% Total 3.10% 2.06% 1.91% 3.10% 2.93% 5.91% 6.37% 3.45%
Employer Contribution Rate Impact (Estimated Annual Dollar Amounts in Thousands)
Contributions General Tier 1
General Tier 2
PEPRA General Tier 2
General Tier 2C
PEPRA General Tier 2C Safety
PEPRA Safety Overall
Total $305 $4,233 $222 $6,951 $689 $9,225 $237 $21,862
MASTER PAGE NO. 121

-50-
Member Contribution Rate Impact (% of Compensation)
Contributions General Tier 1
General Tier 2
PEPRA General Tier 2
General Tier 2C
PEPRA General Tier 2C Safety
PEPRA Safety Overall
Total 0.16% 0.10% 0.30% 0.10% 0.30% 0.45% 0.31% 0.20%
Member Contribution Rate Impact (Estimated Annual Dollar Amounts in Thousands)
Contributions General Tier 1
General Tier 2
PEPRA General Tier 2
General Tier 2C
PEPRA General Tier 2C Safety
PEPRA Safety Overall
Total $16 $209 $36 $228 $72 $719 $12 $1,292
If all of the proposed demographic assumption changes were implemented, the average employer rate
would have increased by 1.57% of compensation. The average member rate would have increased by
0.05% of compensation. Of the various demographic assumption changes, the most significant cost
impact is from the mortality assumption change.
If all of the proposed economic assumptions (recommended in a separate report) were implemented
(including the proposed change to an explicit administrative expense load), the average employer rate
would have increased by 1.88% of compensation and the average member rate would have been increased
by 0.15%. Of the various economic assumption changes, the most significant cost impact is from the
investment return assumption change from 7.75% net of administrative expenses to 7.50% gross of
administrative expenses.
Therefore, the estimated cost impact of all proposed assumption changes (both demographic and
economic) is 3.45% of compensation for the average employer rate, where the Normal Cost rate increased
by 0.20%, the UAAL amortization rate increased by 2.70% and the explicit administrative expense load is
0.55%. The average member rate would have increased by 0.20% of compensation, including the explicit
administrative load of 0.15%. The allocation of the explicit administrative expense load between
employers and members is discussed in the economic assumptions report.
As noted earlier, the above results do not include 50/50 sharing of Normal Cost for non-PEPRA Tiers. If
we include that provision, then the total increase in the Normal Cost of 0.25% would be shared 50/50
between the employers and the members (with the cost of the cessation of member contributions after 30
years of service allocated to the employer) and the allocation of the administrative expense load would be
slightly different. This would shift about 0.07% of the average cost increase from the employers to the
members.
MASTER PAGE NO. 122

-51-
APPENDIX A
CURRENT ACTUARIAL ASSUMPTIONS
Mortality Rates
Healthy: For General Members: RP-2000 Combined Healthy Mortality Table projected with Scale AA to 2025 set back one year.
For Safety Members: RP-2000 Combined Healthy Mortality Table projected with Scale AA to 2025 set back one year.
Disabled: For General Members: RP-2000 Combined Healthy Mortality Table projected with Scale AA to 2025 set forward five years for males and seven years for females.
For Safety Members: RP-2000 Combined Healthy Mortality Table projected with Scale AA to 2025 set back one year.
Beneficiaries: Beneficiaries are assumed to have the same mortality as a General Member of the opposite sex who has taken a service (non-disability) retirement.
Member Contribution Rates: For General Members: RP-2000 Combined Healthy Mortality Table projected with Scale AA to 2025 set back one year weighted 35% male and 65% female.
For Safety Members: RP-2000 Combined Healthy Mortality Table projected with Scale AA to 2025 set back one year weighted 80% male and 20% female.
Termination Rates Before Retirement:
Rate (%) Mortality
General Safety Age Male Female Male Female 25 0.03 0.01 0.03 0.01 30 0.04 0.02 0.04 0.02 35 0.06 0.03 0.06 0.03 40 0.09 0.04 0.09 0.04 45 0.10 0.07 0.10 0.07 50 0.13 0.10 0.13 0.10 55 0.19 0.19 0.19 0.19 60 0.40 0.39 0.40 0.39 65 0.79 0.76 0.79 0.76
All pre-retirement deaths are assumed to be non-duty related.
MASTER PAGE NO. 123

-52-
Termination Rates Before Retirement (continued):
Rate (%)
Disability Age General(1) Safety(2)
25 0.02 0.14 30 0.04 0.26 35 0.08 0.48 40 0.13 0.90 45 0.21 1.16 50 0.40 1.98 55 0.56 3.40 60 0.69 4.60 65 0.90 0.00 70 1.00 0.00
(1) 40% of General disabilities are assumed to be duty disabilities and the other 60% are assumed to be ordinary disabilities.
(2) 90% of Safety disabilities are assumed to be duty disabilities and the other 10% are assumed to be ordinary disabilities.
MASTER PAGE NO. 124

-53-
Termination Rates Before Retirement (continued):
Rate (%)
Withdrawal (< 5 Years of Service) *
Years of Service General Safety 0 15.00 12.00 1 10.00 6.00 2 8.00 5.50 3 7.00 5.00 4 6.00 4.00
Withdrawal (5+ Years of Service) *
Age General Safety 20 6.00 4.00 25 6.00 4.00 30 5.70 3.40 35 4.90 2.40 40 3.90 1.40 45 2.90 0.70 50 2.20 0.20 55 1.70 0.00 60 1.20 0.00 65 1.00 0.00 70 0.00 0.00
* The greater of a refund of member contributions and a deferred annuity is valued when a member withdraws.
No withdrawal is assumed after a member is first assumed to retire.
MASTER PAGE NO. 125
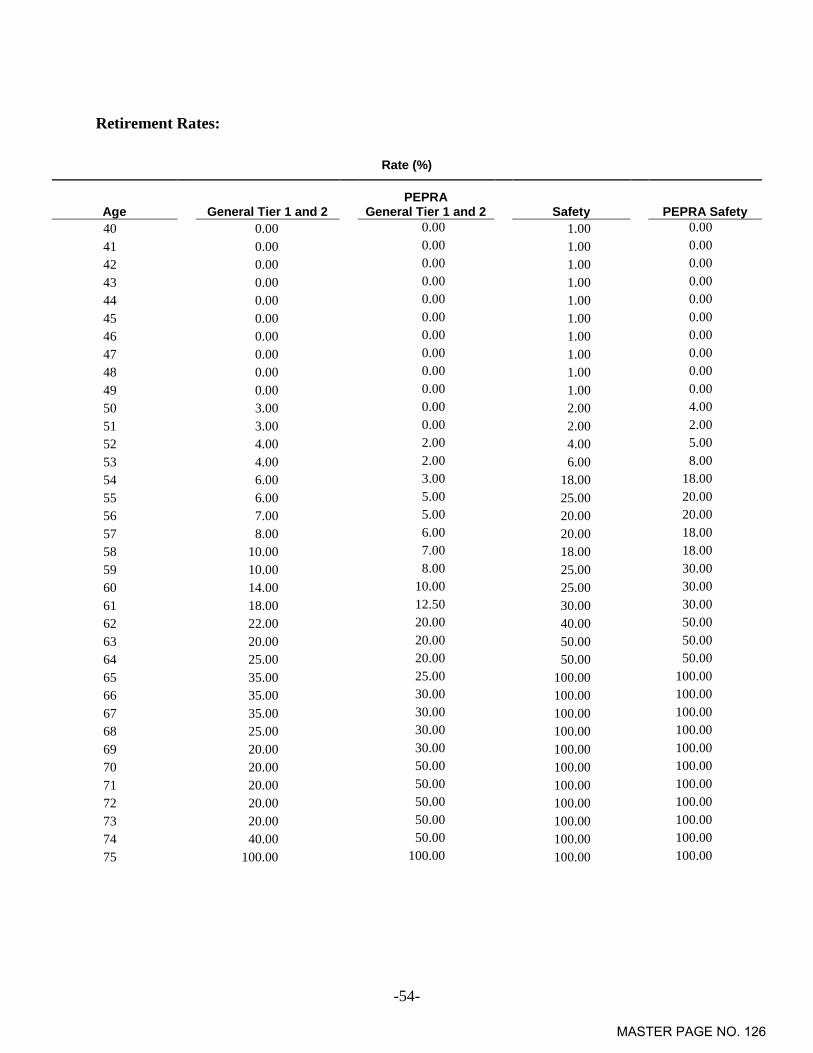
-54-
Retirement Rates:
Rate (%)
Age
General Tier 1 and 2
PEPRA
General Tier 1 and 2
Safety
PEPRA Safety 40 0.00 0.00 1.00 0.00 41 0.00 0.00 1.00 0.00 42 0.00 0.00 1.00 0.00 43 0.00 0.00 1.00 0.00 44 0.00 0.00 1.00 0.00 45 0.00 0.00 1.00 0.00 46 0.00 0.00 1.00 0.00 47 0.00 0.00 1.00 0.00 48 0.00 0.00 1.00 0.00 49 0.00 0.00 1.00 0.00 50 3.00 0.00 2.00 4.00 51 3.00 0.00 2.00 2.00 52 4.00 2.00 4.00 5.00 53 4.00 2.00 6.00 8.00 54 6.00 3.00 18.00 18.00 55 6.00 5.00 25.00 20.00 56 7.00 5.00 20.00 20.00 57 8.00 6.00 20.00 18.00 58 10.00 7.00 18.00 18.00 59 10.00 8.00 25.00 30.00 60 14.00 10.00 25.00 30.00 61 18.00 12.50 30.00 30.00 62 22.00 20.00 40.00 50.00 63 20.00 20.00 50.00 50.00 64 25.00 20.00 50.00 50.00 65 35.00 25.00 100.00 100.00 66 35.00 30.00 100.00 100.00 67 35.00 30.00 100.00 100.00 68 25.00 30.00 100.00 100.00 69 20.00 30.00 100.00 100.00 70 20.00 50.00 100.00 100.00 71 20.00 50.00 100.00 100.00 72 20.00 50.00 100.00 100.00 73 20.00 50.00 100.00 100.00 74 40.00 50.00 100.00 100.00 75 100.00 100.00 100.00 100.00
MASTER PAGE NO. 126
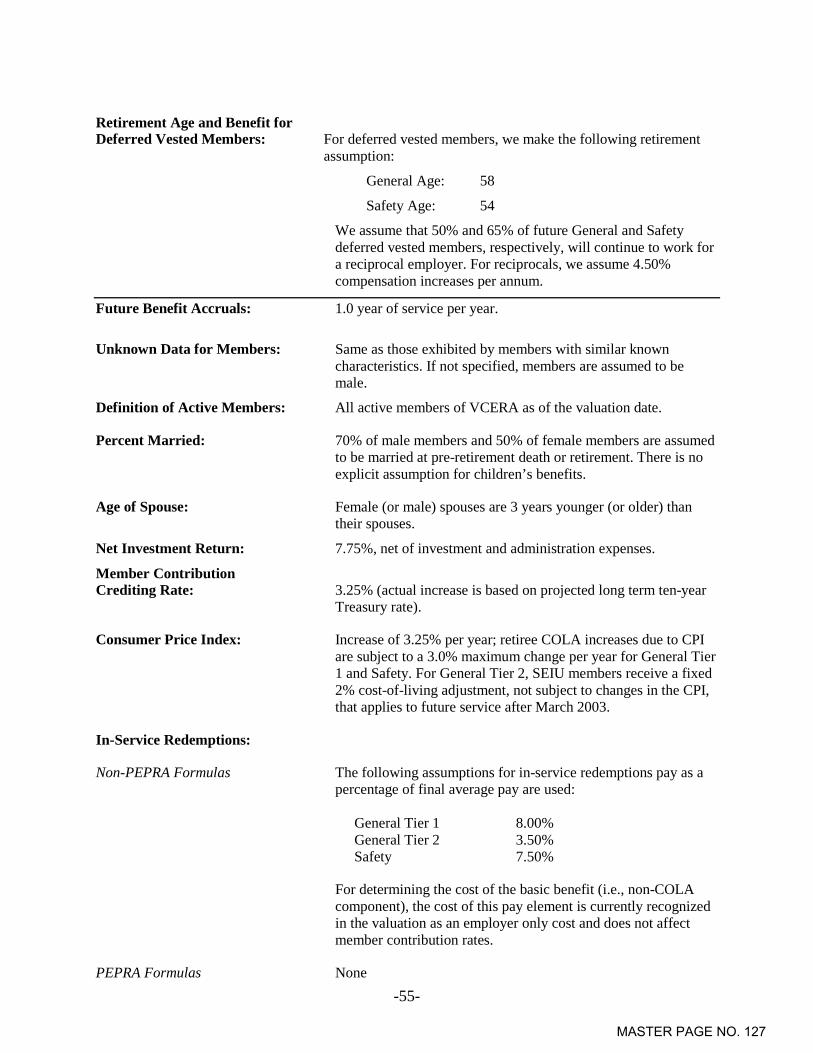
-55-
Retirement Age and Benefit for Deferred Vested Members: For deferred vested members, we make the following retirement
assumption:
General Age: 58
Safety Age: 54
We assume that 50% and 65% of future General and Safety deferred vested members, respectively, will continue to work for a reciprocal employer. For reciprocals, we assume 4.50% compensation increases per annum.
Future Benefit Accruals: 1.0 year of service per year.
Unknown Data for Members: Same as those exhibited by members with similar known characteristics. If not specified, members are assumed to be male.
Definition of Active Members: All active members of VCERA as of the valuation date.
Percent Married: 70% of male members and 50% of female members are assumed to be married at pre-retirement death or retirement. There is no explicit assumption for children’s benefits.
Age of Spouse: Female (or male) spouses are 3 years younger (or older) than their spouses.
Net Investment Return: 7.75%, net of investment and administration expenses.
Member Contribution Crediting Rate: 3.25% (actual increase is based on projected long term ten-year
Treasury rate).
Consumer Price Index: Increase of 3.25% per year; retiree COLA increases due to CPI are subject to a 3.0% maximum change per year for General Tier 1 and Safety. For General Tier 2, SEIU members receive a fixed 2% cost-of-living adjustment, not subject to changes in the CPI, that applies to future service after March 2003.
In-Service Redemptions:
Non-PEPRA Formulas The following assumptions for in-service redemptions pay as a percentage of final average pay are used:
General Tier 1 8.00% General Tier 2 3.50% Safety 7.50%
For determining the cost of the basic benefit (i.e., non-COLA component), the cost of this pay element is currently recognized in the valuation as an employer only cost and does not affect member contribution rates.
PEPRA Formulas None
MASTER PAGE NO. 127

-56-
Salary Increases: Annual Rate of Compensation Increase
Inflation: 3.25% per year; plus “across the board” salary increases of 0.75% per year; plus the following promotional and merit increases: Years of Service General Safety
Less than 1 5.00% 8.50% 1 3.75 6.25 2 3.00 4.75 3 2.50 4.00 4 2.00 3.00 5 1.50 2.50 6 1.00 2.00 7 1.00 1.50 8 0.75 1.25 9 0.50 1.00
10 0.50 0.75 11 0.50 0.75 12 0.50 0.75 13 0.50 0.75 14 0.50 0.75 15 0.50 0.75 16 0.50 0.50 17 0.50 0.50 18 0.50 0.50 19 0.50 0.50
20 and Over 0.50 0.50
Increase in the Internal Revenue
Code Section 401(a)(17) Compensation Limit: Increase of 3.25% per year from the valuation date.
Increase in Section 7522.10 Compensation Limit: Increase of 3.25% per year from the valuation date.
Average Entry Age for Member Contribution Rates: For non-PEPRA members hired after November 1974, they will
pay a contribution corresponding to a General and Safety member hired at entry age 36 and 27, respectively.
MASTER PAGE NO. 128
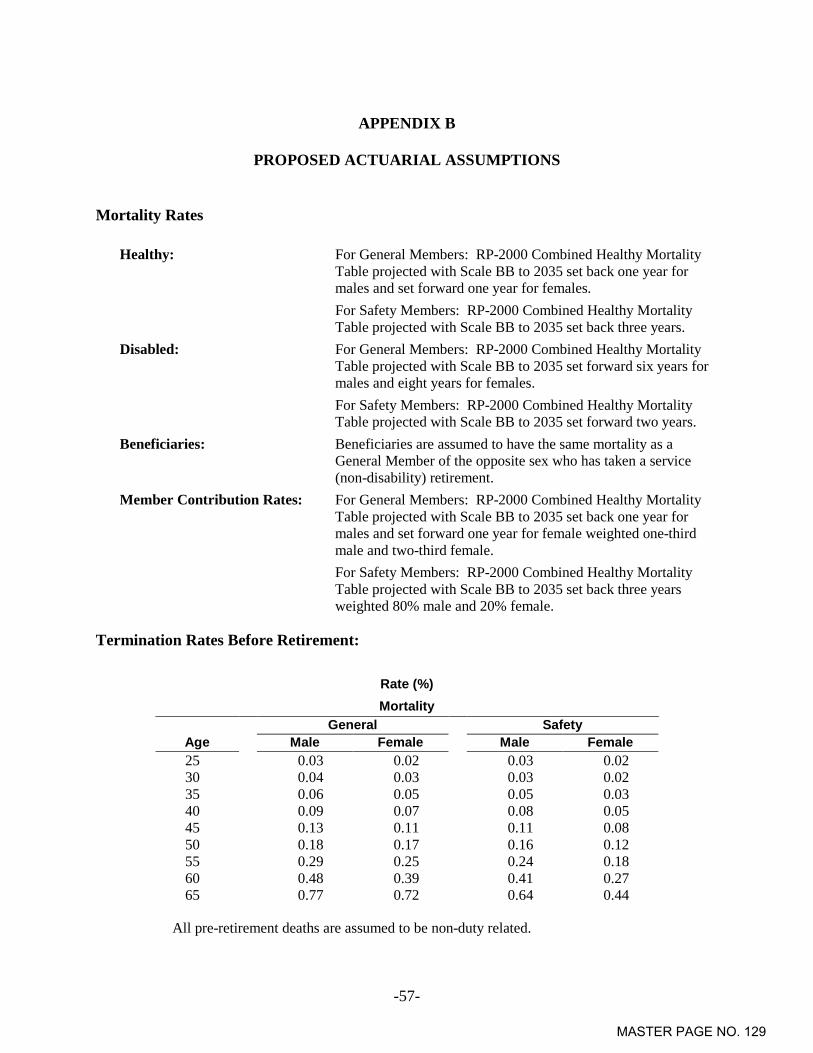
-57-
APPENDIX B
PROPOSED ACTUARIAL ASSUMPTIONS
Mortality Rates
Healthy: For General Members: RP-2000 Combined Healthy Mortality Table projected with Scale BB to 2035 set back one year for males and set forward one year for females.
For Safety Members: RP-2000 Combined Healthy Mortality Table projected with Scale BB to 2035 set back three years.
Disabled: For General Members: RP-2000 Combined Healthy Mortality Table projected with Scale BB to 2035 set forward six years for males and eight years for females.
For Safety Members: RP-2000 Combined Healthy Mortality Table projected with Scale BB to 2035 set forward two years.
Beneficiaries: Beneficiaries are assumed to have the same mortality as a General Member of the opposite sex who has taken a service (non-disability) retirement.
Member Contribution Rates: For General Members: RP-2000 Combined Healthy Mortality Table projected with Scale BB to 2035 set back one year for males and set forward one year for female weighted one-third male and two-third female.
For Safety Members: RP-2000 Combined Healthy Mortality Table projected with Scale BB to 2035 set back three years weighted 80% male and 20% female.
Termination Rates Before Retirement:
Rate (%) Mortality
General Safety Age Male Female Male Female 25 0.03 0.02 0.03 0.02 30 0.04 0.03 0.03 0.02 35 0.06 0.05 0.05 0.03 40 0.09 0.07 0.08 0.05 45 0.13 0.11 0.11 0.08 50 0.18 0.17 0.16 0.12 55 0.29 0.25 0.24 0.18 60 0.48 0.39 0.41 0.27 65 0.77 0.72 0.64 0.44
All pre-retirement deaths are assumed to be non-duty related.
MASTER PAGE NO. 129
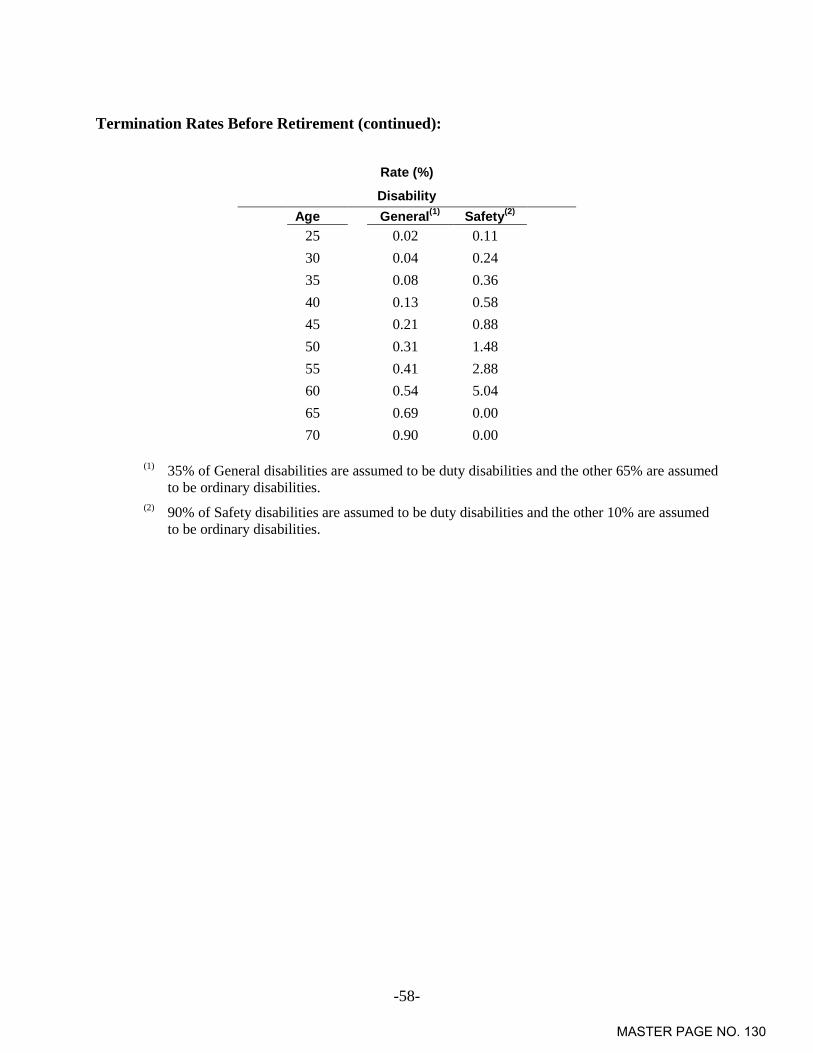
-58-
Termination Rates Before Retirement (continued):
Rate (%)
Disability Age General(1) Safety(2)
25 0.02 0.11 30 0.04 0.24 35 0.08 0.36 40 0.13 0.58 45 0.21 0.88 50 0.31 1.48 55 0.41 2.88 60 0.54 5.04 65 0.69 0.00 70 0.90 0.00
(1) 35% of General disabilities are assumed to be duty disabilities and the other 65% are assumed to be ordinary disabilities.
(2) 90% of Safety disabilities are assumed to be duty disabilities and the other 10% are assumed to be ordinary disabilities.
MASTER PAGE NO. 130

-59-
Termination Rates Before Retirement (continued):
Rate (%)
Withdrawal *
Years of Service General Safety
Less than 1 14.00 10.00
1 10.00 6.00
2 8.00 5.50
3 7.00 5.00
4 6.00 4.00
5 4.00 2.75
6 3.75 2.50
7 3.50 2.00
8 3.50 1.80
9 3.25 1.60
10 3.25 1.40
11 3.00 1.20
12 3.00 1.00
13 2.75 0.95
14 2.75 0.90
15 2.50 0.85
16 2.50 0.80
17 2.25 0.75
18 2.00 0.70
19 2.00 0.65
20 or more 2.00 0.60
* The greater of a refund of member contributions and a deferred annuity is valued when a member withdraws.
No withdrawal is assumed after a member is first assumed to retire.
MASTER PAGE NO. 131

-60-
Retirement Rates:
Rate (%)
Age
General Tier 1 and 2
PEPRA
General Tier 1 and 2
Safety
PEPRA Safety 40 0.00 0.00 1.00 0.00 41 0.00 0.00 1.00 0.00 42 0.00 0.00 1.00 0.00 43 0.00 0.00 1.00 0.00 44 0.00 0.00 1.00 0.00 45 0.00 0.00 1.00 0.00 46 0.00 0.00 1.00 0.00 47 0.00 0.00 1.00 0.00 48 0.00 0.00 1.00 0.00 49 0.00 0.00 1.50 0.00 50 2.50 0.00 2.50 5.00 51 2.50 0.00 2.00 2.00 52 3.00 2.00 3.00 4.00 53 3.50 2.00 4.00 6.00 54 4.00 2.50 17.00 16.00 55 4.50 4.00 22.00 20.00 56 5.00 4.50 22.00 20.00 57 6.00 5.00 20.00 18.00 58 8.00 6.00 19.00 18.00 59 8.00 7.00 22.00 25.00 60 12.00 9.00 22.00 25.00 61 15.00 11.00 25.00 25.00 62 22.00 20.00 35.00 40.00 63 20.00 20.00 40.00 40.00 64 22.00 18.00 40.00 40.00 65 30.00 20.00 100.00 100.00 66 35.00 30.00 100.00 100.00 67 35.00 30.00 100.00 100.00 68 35.00 30.00 100.00 100.00 69 20.00 30.00 100.00 100.00 70 20.00 50.00 100.00 100.00 71 20.00 50.00 100.00 100.00 72 20.00 50.00 100.00 100.00 73 20.00 50.00 100.00 100.00 74 30.00 50.00 100.00 100.00 75 100.00 100.00 100.00 100.00
MASTER PAGE NO. 132

-61-
Retirement Age and Benefit for Deferred Vested Members: For deferred vested members, we make the following retirement
assumption:
General Age: 59
Safety Age: 54
We assume that 50% and 60% of future General and Safety deferred vested members, respectively, will continue to work for a reciprocal employer. For reciprocals, we assume 4.00% compensation increases per annum.
Future Benefit Accruals: 1.0 year of service per year.
Unknown Data for Members: Same as those exhibited by members with similar known characteristics. If not specified, members are assumed to be male.
Definition of Active Members: All active members of VCERA as of the valuation date.
Percent Married: 70% of male members and 55% of female members are assumed to be married at pre-retirement death or retirement. There is no explicit assumption for children’s benefits.
Age of Spouse: Female (or male) spouses are 3 years younger (or older) than their spouses.
Net Investment Return: 7.50%, net of investment expenses.
Administrative Expenses: 0.70% of payroll allocated to both employer and member based on the components of the total contribution rate (before expenses) for the employer and member.
Member Contribution Crediting Rate: 3.00% (actual increase is based on projected long term ten-year
Treasury rate).
Consumer Price Index: Increase of 3.00% per year; retiree COLA increases due to CPI are subject to a 3.0% maximum change per year for General Tier 1 and Safety. For General Tier 2, SEIU members receive a fixed 2% cost-of-living adjustment, not subject to changes in the CPI, that applies to future service after March 2003.
In-Service Redemptions:
Non-PEPRA Formulas The following assumptions for in-service redemptions pay as a percentage of final average pay are used:
General Tier 1 7.50% General Tier 2 3.50% Safety 7.25%
For determining the cost of the basic benefit (i.e., non-COLA component), the cost of this pay element is currently recognized
MASTER PAGE NO. 133

-62-
in the valuation as an employer only cost and does not affect member contribution rates.
PEPRA Formulas None Salary Increases:
Annual Rate of Compensation Increase Inflation: 3.00% per year; plus “across the board” salary increases of 0.50% per year; plus the following promotional and merit increases: Years of Service General Safety
Less than 1 6.00% 8.00% 1 4.25 6.25 2 3.25 4.75 3 2.75 4.00 4 2.25 3.25 5 1.75 3.00 6 1.25 2.25 7 1.00 1.50 8 0.75 1.25 9 0.50 1.00
10 0.50 0.75 11 0.50 0.75 12 0.50 0.75 13 0.50 0.75 14 0.50 0.75 15 0.50 0.75 16 0.50 0.50 17 0.50 0.50 18 0.50 0.50 19 0.50 0.50
20 and Over 0.50 0.50
Increase in the Internal Revenue
Code Section 401(a)(17) Compensation Limit: Increase of 3.00% per year from the valuation date.
Increase in Section 7522.10 Compensation Limit: Increase of 3.00% per year from the valuation date.
Average Entry Age for Member Contribution Rates: For non-PEPRA members hired after November 1974, they will
pay a contribution corresponding to a General and Safety member hired at entry age 35 and 27, respectively.
5353614v3/05325.002
MASTER PAGE NO. 134

100 Montgomery Street Suite 500 San Francisco, CA 94104-4308 T 415.263.8200 www.segalco.com
VENTURA COUNTY EMPLOYEES’ RETIREMENT ASSOCIATION Review of Economic Actuarial Assumptions for the June 30, 2015 Actuarial Valuation
COPYRIGHT © 2015 ALL RIGHTS RESERVED MARCH 2015
MASTER PAGE NO. 135

100 Montgomery Street Suite 500 San Francisco, CA 94104-4308 T 415.263.8200 www.segalco.com
Benefits, Compensation and HR Consulting. Member of The Segal Group. Offices throughout the United States and Canada
April 14, 2015
Board of Retirement Ventura County Employees’ Retirement Association 1190 South Victoria Avenue, Suite 200 Ventura, CA 93003-6572
Re: Review of Economic Actuarial Assumptions For the June 30, 2015 Actuarial Valuation
Dear Members of the Board:
We are pleased to submit this report of our review of the June 30, 2015 economic actuarial assumptions for the Ventura County Employees’ Retirement Association. This report includes our recommendations and the analysis supporting their development.
Please note that we have also reviewed the non-economic actuarial experience for the three-year period from July 1, 2011 to June 30, 2014. The non-economic actuarial assumption recommendations are provided in a separate report.
We are members of the American Academy of Actuaries and we meet the Qualification Standards of the American Academy of Actuaries to render the actuarial opinion herein.
We look forward to reviewing this report with you and answering any questions you may have.
Sincerely,
Paul Angelo, FSA, EA, MAAA, FCA Senior Vice President and Actuary
John Monroe, ASA, EA, MAAA Vice President and Actuary
AW/hy
5354675v4/05325.110
MASTER PAGE NO. 136

TABLE OF CONTENTS
Page
I. INTRODUCTION, SUMMARY, AND RECOMMENDATIONS ....................................1
II. BACKGROUND AND METHODOLOGY........................................................................4
III. ECONOMIC ASSUMPTIONS ...........................................................................................5
A. INFLATION .................................................................................................................5
B. INVESTMENT RETURN .............................................................................................7
C. SALARY INCREASE .................................................................................................22
MASTER PAGE NO. 137
-1-
I. INTRODUCTION, SUMMARY, AND RECOMMENDATIONS
To project the cost and liabilities of the pension fund, assumptions are made about all future events that
could affect the amount and timing of the benefits to be paid and the assets to be accumulated. Each year
actual experience is compared against the projected experience, and to the extent there are differences, the
future contribution requirement is adjusted.
If assumptions are changed, contribution requirements are adjusted to take into account a change in the
projected experience in all future years. There is a great difference in both philosophy and cost impact
between recognizing the actuarial deviations as they occur annually and changing the actuarial
assumptions. Taking into account one year’s gains or losses without making a change in the assumptions
in effect assumes that the experience is treated as temporary and that, over the long run, experience is
expected to return to what was originally assumed. Changing assumptions reflects a basic change in
thinking about the future, and it has a much greater effect on the current contribution requirements than
the gain or loss for a single year.
The use of realistic actuarial assumptions is important to maintain adequate funding, while fulfilling
benefit commitments to participants already retired and to those near retirement. The actuarial
assumptions do not determine the “actual cost” of the plan. The actual cost is determined solely by the
benefits and administrative expenses paid out, offset by investment income received. However, it is
desirable to estimate as closely as possible what the actual cost will be so as to permit an orderly method
for setting aside contributions today to provide benefits in the future, and to maintain equity among
generations of participants and taxpayers.
This study was undertaken in order to review the economic actuarial assumptions. The study was
performed in accordance with Actuarial Standard of Practice (ASOP) No. 27,1 “Selection of Economic
Assumptions for Measuring Pension Obligations.” This Standard of Practice puts forth guidelines for the
selection of the economic actuarial assumptions utilized in a pension plan actuarial valuation.
1 ASOP No. 27 was revised in September 2013 effective for measurement dates on or after September 30, 2014.
Since the recommendations developed herein are intended for use starting with the June 30, 2015 valuation, this study was performed in accordance with ASOP 27 as constituted after the 2013 revisions to the ASOP.
MASTER PAGE NO. 138

-2-
We are recommending changes in the investment return, inflation and “across the board” salary increase
assumptions. Our recommendations for the economic actuarial assumptions for the June 30, 2015
Actuarial Valuation are as follows:
Inflation – Future increases in the Consumer Price Index (CPI) which drives investment returns
and active member salary increases, as well as cost-of-living adjustments (COLAs) for retirees.
Recommendation: Reduce the assumed rate of price inflation from 3.25% to 3.00% per
annum.
Investment Return – The estimated average future net rate of return on current and future assets
of the Association as of the valuation date. This rate is used to discount liabilities.
Recommendation: Reduce the current investment return assumption from 7.75% per annum to
7.50% per annum. The 7.50% recommendation would be consistent with the Board’s past
practice of having a margin for adverse deviation under the risk adjusted model used by Segal.
We further recommend changing to an explicit treatment of administrative expenses in the
selection of an investment return assumption for use both in funding and in financial
reporting required by the Governmental Accounting Standards Board (GASB).
Individual Salary Increases – Increases in the salary of a member between the date of the
valuation to the date of separation from active service. This assumption has three components:
Inflationary salary increases,
Real “across the board” salary increases, and
Promotional and merit increases.
Recommendation: Reduce the current inflationary salary increase assumption from 3.25% to
3.00% and reduce the current real “across the board” salary increase assumption from 0.75%
to 0.50%. This means that the combined inflationary and real “across the board” salary
increases will decrease from 4.00% to 3.50%. Please note that the promotional and merit
increase assumption currently ranges from 0.50% to 8.00% and is a function of a member’s
years of service. The proposed promotional and merit increase assumptions are provided as
part of our triennial experience study of non-economic assumptions, along with the other
recommended non-economic assumptions for the June 30, 2015 valuation.
MASTER PAGE NO. 139

-3-
Section II provides some background on basic principles and the methodology used for the review of the
economic actuarial assumptions. A detailed discussion of each of the economic assumptions and reasons
behind the recommendations is found in Section III. The cost impact of these proposed changes is
included in our separate analysis of the “non-economic” assumptions for the June 30, 2015 valuation.
MASTER PAGE NO. 140
-4-
II. BACKGROUND AND METHODOLOGY
For this study, we analyzed “economic” assumptions only. Our analysis of the “non-economic”
assumptions for the June 30, 2015 valuation is provided in a separate report. The primary economic
assumptions are inflation, investment return and salary increases.
Economic Assumptions
Economic assumptions consist of:
Inflation – Increases in the price of goods and services. The inflation assumption reflects the basic return
that investors expect from securities markets. It also reflects the expected basic salary increase for active
employees and drives increases in the allowances of retired members.
Investment Return – Expected long term rate of return on the Association’s investments after expenses.
This assumption has a significant impact on contribution rates.
Salary Increases – In addition to inflationary increases, it is assumed that salaries will also grow by
“across the board” real pay increases in excess of price inflation. It is also assumed that employees will
receive raises above these average increases as they advance in their careers. These are commonly
referred to as promotional and merit increases. Payments to amortize any Unfunded Actuarial Accrued
Liability (UAAL) are assumed to increase each year by the price inflation rate plus any “across the board”
real pay increases that are assumed.
The setting of these assumptions is described in Section III.
MASTER PAGE NO. 141
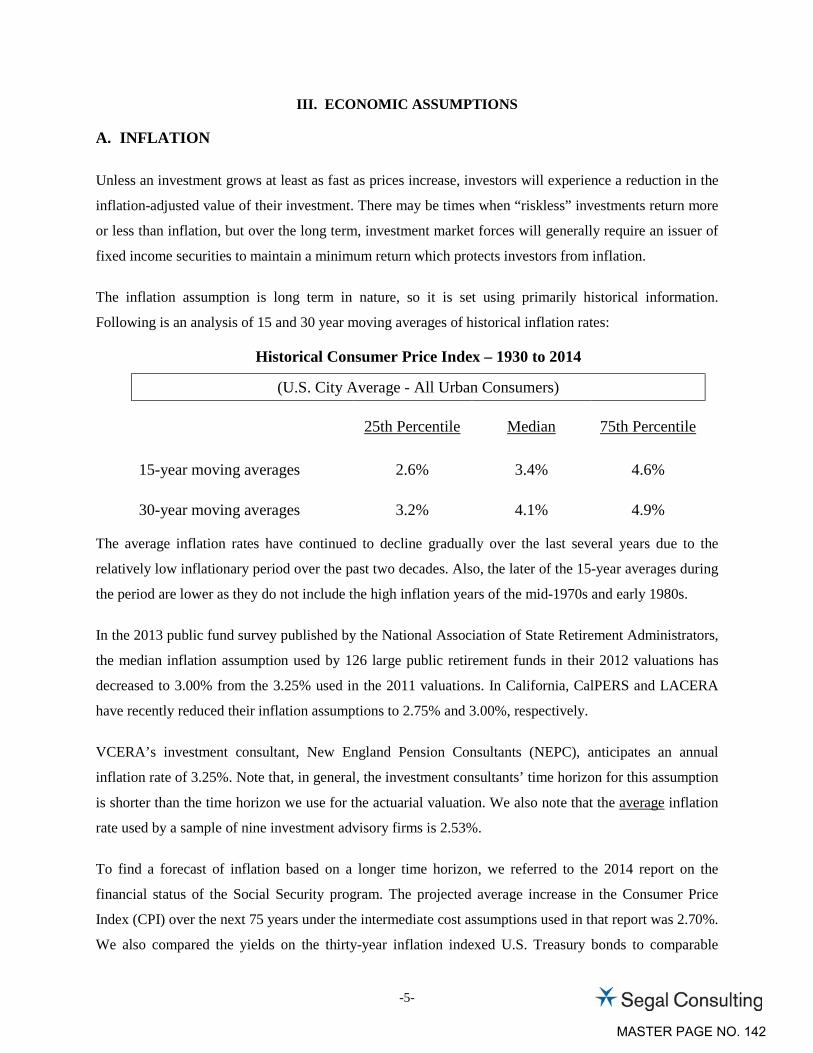
-5-
III. ECONOMIC ASSUMPTIONS
A. INFLATION
Unless an investment grows at least as fast as prices increase, investors will experience a reduction in the
inflation-adjusted value of their investment. There may be times when “riskless” investments return more
or less than inflation, but over the long term, investment market forces will generally require an issuer of
fixed income securities to maintain a minimum return which protects investors from inflation.
The inflation assumption is long term in nature, so it is set using primarily historical information.
Following is an analysis of 15 and 30 year moving averages of historical inflation rates:
Historical Consumer Price Index – 1930 to 2014
(U.S. City Average - All Urban Consumers)
25th Percentile Median 75th Percentile
15-year moving averages 2.6% 3.4% 4.6%
30-year moving averages 3.2% 4.1% 4.9%
The average inflation rates have continued to decline gradually over the last several years due to the
relatively low inflationary period over the past two decades. Also, the later of the 15-year averages during
the period are lower as they do not include the high inflation years of the mid-1970s and early 1980s.
In the 2013 public fund survey published by the National Association of State Retirement Administrators,
the median inflation assumption used by 126 large public retirement funds in their 2012 valuations has
decreased to 3.00% from the 3.25% used in the 2011 valuations. In California, CalPERS and LACERA
have recently reduced their inflation assumptions to 2.75% and 3.00%, respectively.
VCERA’s investment consultant, New England Pension Consultants (NEPC), anticipates an annual
inflation rate of 3.25%. Note that, in general, the investment consultants’ time horizon for this assumption
is shorter than the time horizon we use for the actuarial valuation. We also note that the average inflation
rate used by a sample of nine investment advisory firms is 2.53%.
To find a forecast of inflation based on a longer time horizon, we referred to the 2014 report on the
financial status of the Social Security program. The projected average increase in the Consumer Price
Index (CPI) over the next 75 years under the intermediate cost assumptions used in that report was 2.70%.
We also compared the yields on the thirty-year inflation indexed U.S. Treasury bonds to comparable
MASTER PAGE NO. 142
-6-
traditional U.S. Treasury bonds. As of January 2015, the difference in yields is 1.92%, which provides a
measure of market expectations of inflation.
Based on all of the above information, we recommend that the current 3.25% annual inflation
assumption be reduced to 3.00% for the June 30, 2015 actuarial valuation.
Retiree Cost-of-Living Increases
We also recommend maintaining the current assumptions to value the post-retirement COLA benefit at
3.00% per year for all General Tier 1 and Safety members. Note that General Tier 2 members with COLA
provision are entitled to receive a fixed 2% COLA, not limited to actual changes in the CPI, that applies
to future service after March 2003. The current and proposed COLA assumptions are shown below:
Maximum COLA for all General
Tier 1 and Safety Members
Current Assumption
Proposed Assumption
3.00% 3.00% 3.00%
Note that in developing the COLA assumption, we also considered the results of a stochastic approach
that would attempt to account for the possible impact of low inflation that could occur before COLA
banks are able to be established for the member. Although the results of this type of analysis might justify
the use of a lower COLA assumption, we are not recommending that at this time. The reasons for this
conclusion include the following:
The results of the stochastic modeling are significantly dependent on assuming that lower levels of
inflation will persist in the early years of the projections. If this is not assumed, then the stochastic
modeling will produce results similar to our proposed COLA assumptions.
Using a lower long-term COLA assumption based on a stochastic analysis would mean that an
actuarial loss would occur even when the inflation assumption of 3.00% is met in a year. We
question the reasonableness of this result.
We do not see the stochastic possibility of COLAs averaging less than those predicted by the assumed
rate of inflation as a reliable source of cost savings that should be anticipated in our COLA assumptions.
Therefore, we continue to recommend setting the COLA assumptions based on the long-term annual
inflation assumption, as we have in prior years.
MASTER PAGE NO. 143

-7-
B. INVESTMENT RETURN
The investment return assumption is comprised of two primary components, inflation and real rate of
investment return, with adjustments for expenses and risk.
Real Rate of Investment Return
This component represents the portfolio’s incremental investment market returns over inflation. Theory
has it that, as an investor takes a greater investment risk, the return on the investment is expected to also
be greater, at least in the long run. This additional return is expected to vary by asset class and empirical
data supports that expectation. For that reason, the real rate of return assumptions are developed by asset
class. Therefore, the real rate of return assumption for a retirement system’s portfolio will vary with the
Board’s asset allocation among asset classes.
The following is the Association’s current target asset allocation and the assumed real rate of return
assumptions by asset class. The first column of real rate of return assumptions are determined by reducing
NEPC’s total return assumptions by their assumed 3.25% for inflation. The second column of returns
(except for Private Debt/Credit Strategies, Absolute Return, Real Assets and Private Equity) represents
the average of a sample of real rate of return assumptions. The sample includes the expected annual real
rate of returns provided to us by NEPC and by eight other investment advisory firms retained by Segal’s
California public sector clients. We believe these assumptions reasonably reflect a consensus forecast of
long term future real market returns.2
2 Note that, just as for the inflation assumption, in general the time horizon used by the investment consultants in
determining the real rate of return assumption is shorter than the time horizon encompassed by the actuarial valuation.
MASTER PAGE NO. 144

-8-
VCERA’s Target Asset Allocation and Assumed Arithmetic Real Rate of Return Assumptions by Asset Class and for the Portfolio
Asset Class Percentage of
Portfolio
NEPC’s Assumed Real
Rate of Return(1)
Average Real Rate of Return from a Sample of Consultants to Segal’s California Public
Sector Clients(2) Large Cap U.S. Equity 27.74% 5.58% 5.90%
Small Cap U.S. Equity 3.41% 6.39% 6.60%
Developed International Equity 14.73% 6.60% 6.95%
Emerging Market Equity 3.12% 8.80% 8.44%
U.S. Core Fixed Income 14.00% 0.97% 0.71%
Real Estate 7.00% 4.25% 4.65%
Private Debt/Credit Strategies 5.00% 6.01% 6.01%(3)
Absolute Return (Risk Parity)(4) 16.00% 4.13% 4.13%(3)
Real Assets (Master Limited Partnerships)(4) 4.00% 6.51% 6.51%(3)
Private Equity 5.00% 9.25% 9.25%(3)
Total Portfolio 100.00% 5.13% 5.26%
(1) Derived by reducing NEPC’s nominal rate of return assumptions by their assumed 3.25% inflation rate.
(2) These are based on the projected arithmetic real returns provided by the investment advisory firms serving the county retirement systems of Ventura, Alameda, Contra Costa, Sonoma, Mendocino, Kern, the LA City Employees’ Retirement System, LA Department of Water and Power and the LA Fire & Police Pensions. These return assumptions are gross of any applicable investment expenses.
(3) For these asset classes, NEPC’s assumption is applied in lieu of the average because there is a larger disparity in returns for these asset classes among the firms surveyed and using NEPC’s assumption should more closely reflect the underlying investments made specifically for VCERA.
(4) These are categorized as “Liquid Alternatives” when reported to VCERA by NEPC.
Please note that the above are representative of “indexed” returns and do not include any additional
returns (“alpha”) from active management. This is consistent with the revised Actuarial Standard of
Practice No. 27, Section 3.8.3.d, which states:
“Investment Manager Performance – Anticipating superior (or inferior) investment manager
performance may be unduly optimistic (or pessimistic). The actuary should not assume that
superior or inferior returns will be achieved, net of investment expenses, from an active investment
management strategy compared to a passive investment management strategy unless the actuary
MASTER PAGE NO. 145
-9-
believes, based on relevant supporting data, that such superior or inferior returns represent a
reasonable expectation over the measurement period.”
The following are some observations about the returns provided above:
1. The investment consultants to our California public sector clients have each provided us with
their expected real rates of return for each asset class, over various future periods of time.
However, in general, the returns available from investment consultants are projected over time
periods shorter than the durations of a retirement plan’s liabilities.
2. Using a sample average of expected real rate of returns allows the Association’s investment
return assumption to reflect a broader range of capital market information and should help
reduce year to year volatility in the investment return assumption.
3. Therefore, we recommend that the 5.26% portfolio real rate of return be used to determine the
Association’s investment return assumption. This is 0.05% lower than the return we used in
2012 to prepare the recommended investment return assumption. This difference is due to
changes in the Association’s target asset allocation (+0.33%) and changes in the real rate of
return assumptions provided to us by the investment advisory firms (-0.38%).
Association Expenses
For funding purposes, the real rate of return assumption for the portfolio needs to be adjusted for
investment expenses expected to be paid from investment income. As further discussed later in this
report, current practice for VCERA also adjusts for expected administrative expenses. The following table
provides these expenses in relation to the actuarial value of assets for the five years ending June 30, 2014.
MASTER PAGE NO. 146
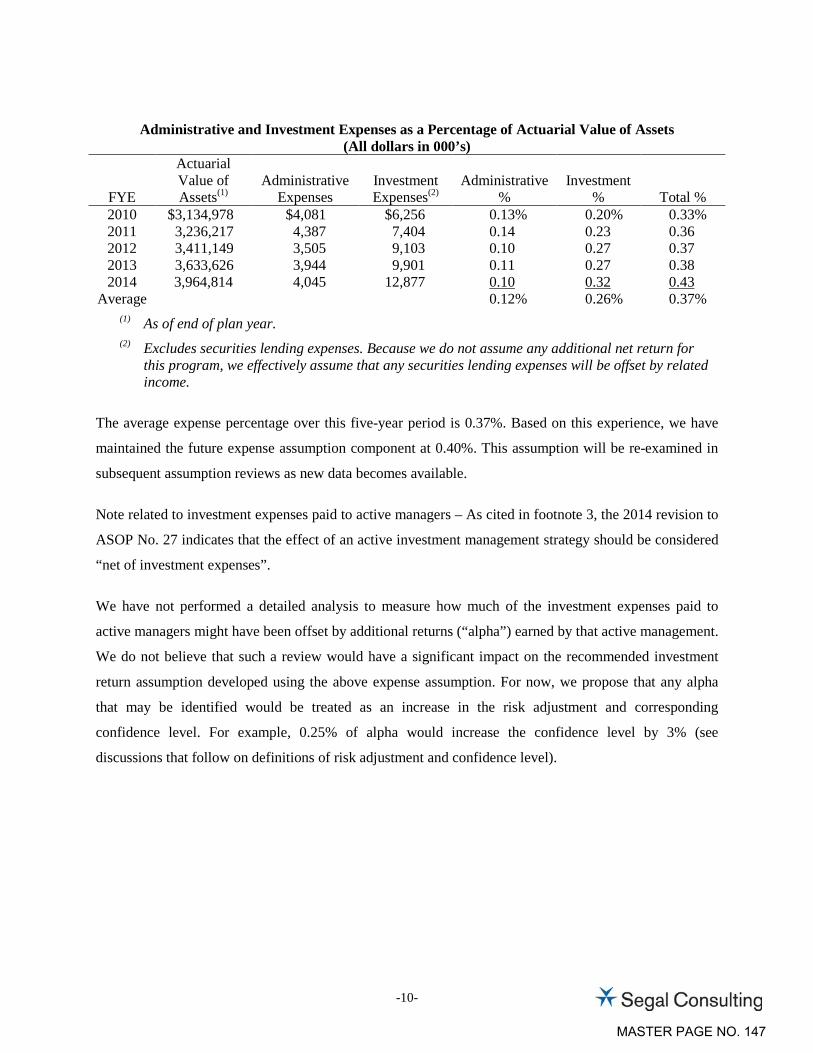
-10-
Administrative and Investment Expenses as a Percentage of Actuarial Value of Assets (All dollars in 000’s)
FYE
Actuarial Value of Assets(1)
Administrative
Expenses
Investment Expenses(2)
Administrative
%
Investment
%
Total % 2010 $3,134,978 $4,081 $6,256 0.13% 0.20% 0.33% 2011 3,236,217 4,387 7,404 0.14 0.23 0.36 2012 3,411,149 3,505 9,103 0.10 0.27 0.37 2013 3,633,626 3,944 9,901 0.11 0.27 0.38 2014 3,964,814 4,045 12,877 0.10 0.32 0.43
Average 0.12% 0.26% 0.37% (1) As of end of plan year. (2) Excludes securities lending expenses. Because we do not assume any additional net return for
this program, we effectively assume that any securities lending expenses will be offset by related income.
The average expense percentage over this five-year period is 0.37%. Based on this experience, we have
maintained the future expense assumption component at 0.40%. This assumption will be re-examined in
subsequent assumption reviews as new data becomes available.
Note related to investment expenses paid to active managers – As cited in footnote 3, the 2014 revision to
ASOP No. 27 indicates that the effect of an active investment management strategy should be considered
“net of investment expenses”.
We have not performed a detailed analysis to measure how much of the investment expenses paid to
active managers might have been offset by additional returns (“alpha”) earned by that active management.
We do not believe that such a review would have a significant impact on the recommended investment
return assumption developed using the above expense assumption. For now, we propose that any alpha
that may be identified would be treated as an increase in the risk adjustment and corresponding
confidence level. For example, 0.25% of alpha would increase the confidence level by 3% (see
discussions that follow on definitions of risk adjustment and confidence level).
MASTER PAGE NO. 147

-11-
Adjustment to Exclude Administrative Expenses in Developing Investment Return Assumption for use
in GASB Financial Reporting
In 2012, GASB adopted Statements 67 and 68 that replace Statements 25 and 27 for financial reporting
purposes. GASB Statements 67 and 68 are effective for plan year 2013/2014 for the Retirement
Association and fiscal year 2014/2015 for the employer.3
According to GASB, the investment return assumption for use in financial reporting purposes should be
based on the long-term expected rate of return on a retirement system’s investments and should be net of
investment expenses but not of administrative expenses (i.e., without reduction for administrative
expenses). As can be observed from the above development of the expense assumption, if the Board
wishes to develop a single investment return assumption for both funding and financial reporting
purposes, then it would be necessary to exclude the roughly 0.12% administrative expense from the above
development and to develop a separate treatment of administrative expenses.
The issues associated with eliminating the consideration of administrative expenses when developing the
investment return assumption used for funding, and the alternatives that are available to the Board in
developing the investment return assumption for use in GASB financial reporting purposes are provided
at the end of this Section. While we do recommend that the Board adopt an investment return for funding
that is gross of administrative expenses (as discussed in the end of this Section), the preliminary
discussion that follows has first been completed on a net of administrative expenses basis, to allow an
“apples to apples” comparison with the current assumption.
Risk Adjustment
The real rate of return assumption for the portfolio generally is adjusted to reflect the potential risk of
shortfalls in the return assumptions. The Association’s asset allocation also determines this portfolio risk,
since risk levels are driven by the variability of returns for the various asset classes and the correlation of
returns among those asset classes. This portfolio risk is incorporated into the real rate of return
assumption through a risk adjustment.
3 The new Statements (67 and 68) will require more rapid recognition for investment gains or losses and much
shorter amortization for actuarial gains or losses. Because of the more rapid recognition of those changes, retirement systems that have generally utilized the previous Statements (25 and 27) as a guideline to establish the employer’s contribution amounts for both funding and financial reporting purposes would now have to prepare two sets of cost results, one for contributions and one for financial reporting under the new Statements.
MASTER PAGE NO. 148
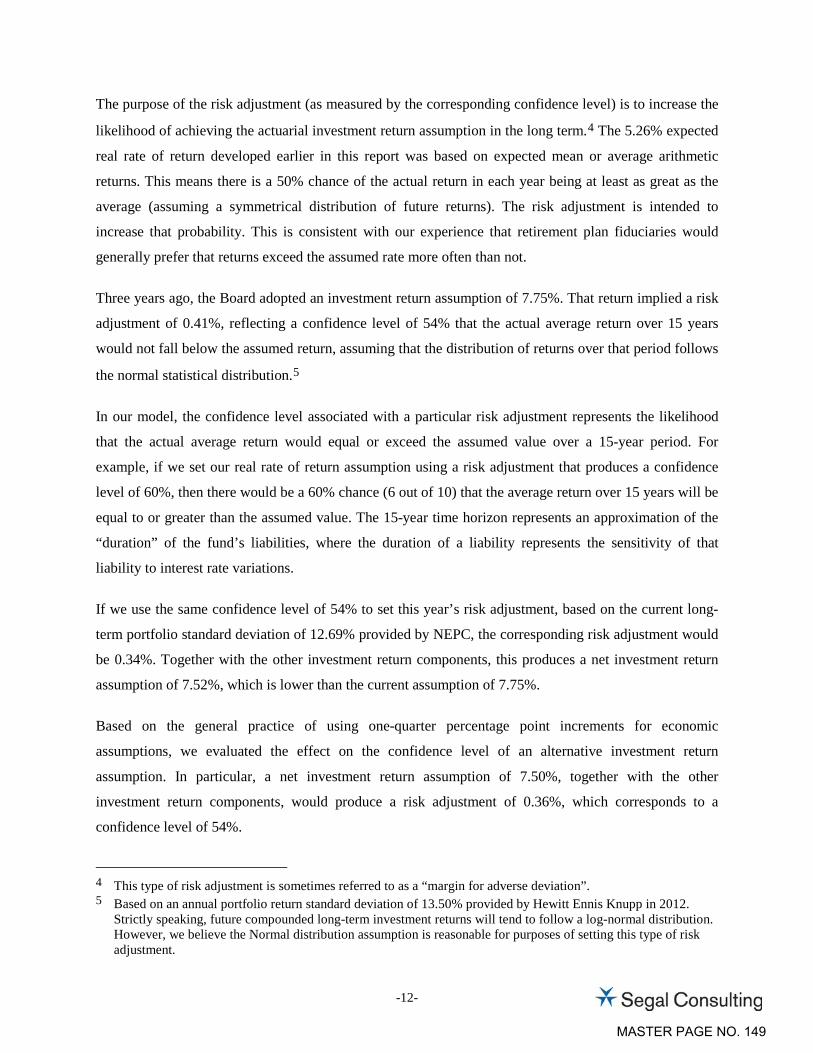
-12-
The purpose of the risk adjustment (as measured by the corresponding confidence level) is to increase the
likelihood of achieving the actuarial investment return assumption in the long term.4 The 5.26% expected
real rate of return developed earlier in this report was based on expected mean or average arithmetic
returns. This means there is a 50% chance of the actual return in each year being at least as great as the
average (assuming a symmetrical distribution of future returns). The risk adjustment is intended to
increase that probability. This is consistent with our experience that retirement plan fiduciaries would
generally prefer that returns exceed the assumed rate more often than not.
Three years ago, the Board adopted an investment return assumption of 7.75%. That return implied a risk
adjustment of 0.41%, reflecting a confidence level of 54% that the actual average return over 15 years
would not fall below the assumed return, assuming that the distribution of returns over that period follows
the normal statistical distribution.5
In our model, the confidence level associated with a particular risk adjustment represents the likelihood
that the actual average return would equal or exceed the assumed value over a 15-year period. For
example, if we set our real rate of return assumption using a risk adjustment that produces a confidence
level of 60%, then there would be a 60% chance (6 out of 10) that the average return over 15 years will be
equal to or greater than the assumed value. The 15-year time horizon represents an approximation of the
“duration” of the fund’s liabilities, where the duration of a liability represents the sensitivity of that
liability to interest rate variations.
If we use the same confidence level of 54% to set this year’s risk adjustment, based on the current long-
term portfolio standard deviation of 12.69% provided by NEPC, the corresponding risk adjustment would
be 0.34%. Together with the other investment return components, this produces a net investment return
assumption of 7.52%, which is lower than the current assumption of 7.75%.
Based on the general practice of using one-quarter percentage point increments for economic
assumptions, we evaluated the effect on the confidence level of an alternative investment return
assumption. In particular, a net investment return assumption of 7.50%, together with the other
investment return components, would produce a risk adjustment of 0.36%, which corresponds to a
confidence level of 54%.
4 This type of risk adjustment is sometimes referred to as a “margin for adverse deviation”. 5 Based on an annual portfolio return standard deviation of 13.50% provided by Hewitt Ennis Knupp in 2012.
Strictly speaking, future compounded long-term investment returns will tend to follow a log-normal distribution. However, we believe the Normal distribution assumption is reasonable for purposes of setting this type of risk adjustment.
MASTER PAGE NO. 149

-13-
As we have discussed in prior years, the risk adjustment model and associated confidence level is most
useful as a means for comparing how the Association has positioned itself relative to risk over periods of
time.6 The use of a 54% confidence level should be considered in context with other factors, including:
As noted above, the confidence level is more of a relative measure than an absolute measure,
and so can be reevaluated and reset for future comparisons.
The confidence level is based on the standard deviation of the portfolio that is determined and
provided to us by NEPC. The standard deviation is a statistical measure of the future volatility
of the portfolio and so is itself based on assumptions about future portfolio volatility and can be
considered somewhat of a “soft” number.
A lower assumed level of inflation should reduce the overall risk of failing to meet the
investment return assumption. Maintaining or even lowering the confidence level to some
extent could be justified as consistent with the change in the inflation assumption.
As with any model, the results of the risk adjustment model should be evaluated for
reasonableness and consistency. This is discussed in the later section on “Comparison with
Other Public Retirement Systems”.
Taking into account the factors above, our preliminary recommendation is to reduce the net investment
return assumption from 7.75% to 7.50%. As noted above, this return implies a 0.36% risk adjustment,
reflecting a confidence level of 54% that the actual average return over 15 years would not fall below the
assumed return.
6 In particular, it would not be appropriate to use this type of risk adjustment as a measure of determining an
investment return rate that is “risk-free.”
MASTER PAGE NO. 150
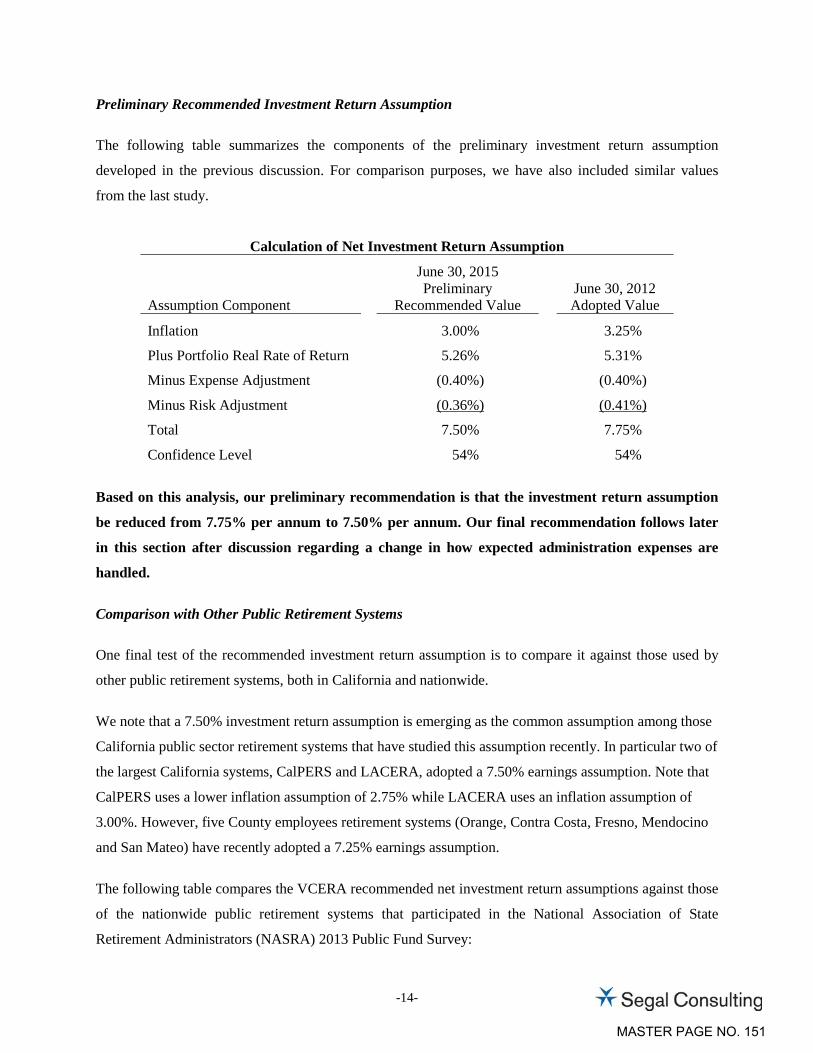
-14-
Preliminary Recommended Investment Return Assumption
The following table summarizes the components of the preliminary investment return assumption
developed in the previous discussion. For comparison purposes, we have also included similar values
from the last study.
Calculation of Net Investment Return Assumption
Assumption Component
June 30, 2015 Preliminary
Recommended Value
June 30, 2012 Adopted Value
Inflation 3.00% 3.25%
Plus Portfolio Real Rate of Return 5.26% 5.31%
Minus Expense Adjustment (0.40%) (0.40%)
Minus Risk Adjustment (0.36%) (0.41%)
Total 7.50% 7.75%
Confidence Level 54% 54%
Based on this analysis, our preliminary recommendation is that the investment return assumption
be reduced from 7.75% per annum to 7.50% per annum. Our final recommendation follows later
in this section after discussion regarding a change in how expected administration expenses are
handled.
Comparison with Other Public Retirement Systems
One final test of the recommended investment return assumption is to compare it against those used by
other public retirement systems, both in California and nationwide.
We note that a 7.50% investment return assumption is emerging as the common assumption among those
California public sector retirement systems that have studied this assumption recently. In particular two of
the largest California systems, CalPERS and LACERA, adopted a 7.50% earnings assumption. Note that
CalPERS uses a lower inflation assumption of 2.75% while LACERA uses an inflation assumption of
3.00%. However, five County employees retirement systems (Orange, Contra Costa, Fresno, Mendocino
and San Mateo) have recently adopted a 7.25% earnings assumption.
The following table compares the VCERA recommended net investment return assumptions against those
of the nationwide public retirement systems that participated in the National Association of State
Retirement Administrators (NASRA) 2013 Public Fund Survey:
MASTER PAGE NO. 151

-15-
Assumption VCERA NASRA 2013 Public Fund Survey
Low Median High
Net Investment Return 7.50% 6.50% 7.90% 8.50%
The detailed survey results show that of the systems that have an investment return assumption in the
range of 7.50% to 7.90%, almost half of those systems have used an assumption of 7.50%. The survey
also notes that several plans have reduced their investment return assumption during the last year, and
others are considering doing so. State systems outside of California tend to change their economic
assumptions slowly and so may lag behind emerging practices in this area.
In summary, we believe that both the risk adjustment model and other considerations indicate a lower
earnings assumption. The recommended assumption of 7.50% continues to provide for some risk margin
within the risk adjustment model as compared to three years ago and is consistent with the Association’s
current practice relative to other public systems.
MASTER PAGE NO. 152

-16-
Developing an Investment Return Assumption for use in Accounting and Financial Reporting under
GASB Statement 67 and 68
The Governmental Accounting Standards Board (GASB) has adopted Statements 67 and 68 that replace
Statements 25 and 27 for financial reporting purposes. We now discuss the issues and policy alternatives
available to VCERA in developing its investment return assumptions in a manner that will allow the Plan
to maintain consistency in its liability measurements for funding and financial reporting purposes.
Background
GASB Statement 67 governs the Plan’s financial reporting and is effective for plan year 2013/2014, while
GASB Statement 68 governs the employers’ financial reporting and is effective for fiscal year 2014/2015.
The new Statements specify requirements for measuring both the pension liability and the annual pension
expense incurred by the employers. The new GASB requirements are only for financial reporting and do
not affect how the Plan determines funding requirements for its employer. Nonetheless, it is important to
understand how the new financial reporting results will compare with the funding requirement results.
The comparison between funding and GASB financial reporting results will differ dramatically depending
on whether one is considering measures of the accumulated pension liability or measures of the current
year annual pension contribution/expense:
• When measuring pension liability GASB will use the same actuarial cost method (Entry Age method)
and the same type of discount rate (expected return on assets) as VCERA uses for funding. This
means that the GASB “Total Pension Liability” measure for financial reporting will be determined on
generally the same basis as VCERA’s “Actuarial Accrued Liability” measure for funding. This is a
generally favorable feature of the new GASB rules that should largely preclude the need to explain
why VCERA has two different measures of pension liability. We note that the same is generally true
for the “Normal Cost” component of the annual plan cost for both funding and financial reporting.
• When measuring annual pension expense, GASB will require more rapid recognition of investment
gains or losses and much shorter amortization of changes in the pension liability (whether due to
actuarial gains or losses, actuarial assumption changes or plan amendments). Because of GASB’s
more rapid recognition of those changes, retirement systems that have generally used the same
“annual required contribution” amount for both funding (contributions) and financial reporting
(pension expense) will now have to prepare and disclose two different annual cost results, one for
contributions and one for financial reporting under the new GASB Statements.
MASTER PAGE NO. 153
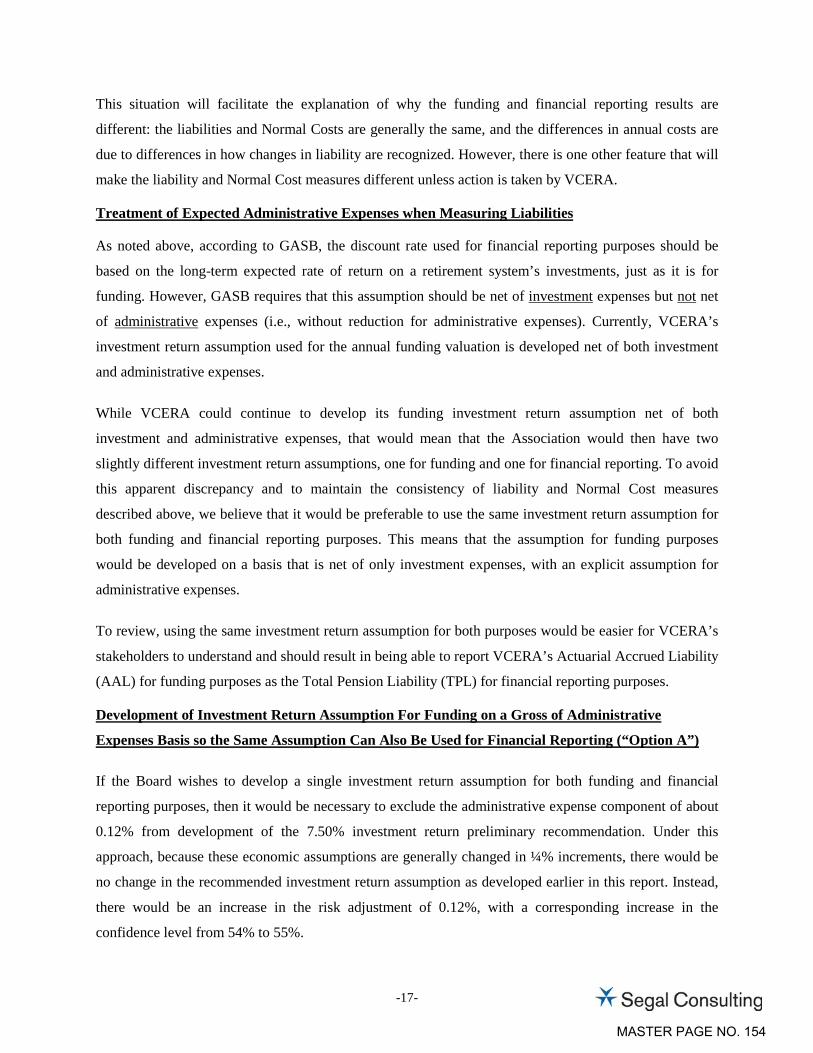
-17-
This situation will facilitate the explanation of why the funding and financial reporting results are
different: the liabilities and Normal Costs are generally the same, and the differences in annual costs are
due to differences in how changes in liability are recognized. However, there is one other feature that will
make the liability and Normal Cost measures different unless action is taken by VCERA.
Treatment of Expected Administrative Expenses when Measuring Liabilities
As noted above, according to GASB, the discount rate used for financial reporting purposes should be
based on the long-term expected rate of return on a retirement system’s investments, just as it is for
funding. However, GASB requires that this assumption should be net of investment expenses but not net
of administrative expenses (i.e., without reduction for administrative expenses). Currently, VCERA’s
investment return assumption used for the annual funding valuation is developed net of both investment
and administrative expenses.
While VCERA could continue to develop its funding investment return assumption net of both
investment and administrative expenses, that would mean that the Association would then have two
slightly different investment return assumptions, one for funding and one for financial reporting. To avoid
this apparent discrepancy and to maintain the consistency of liability and Normal Cost measures
described above, we believe that it would be preferable to use the same investment return assumption for
both funding and financial reporting purposes. This means that the assumption for funding purposes
would be developed on a basis that is net of only investment expenses, with an explicit assumption for
administrative expenses.
To review, using the same investment return assumption for both purposes would be easier for VCERA’s
stakeholders to understand and should result in being able to report VCERA’s Actuarial Accrued Liability
(AAL) for funding purposes as the Total Pension Liability (TPL) for financial reporting purposes.
Development of Investment Return Assumption For Funding on a Gross of Administrative
Expenses Basis so the Same Assumption Can Also Be Used for Financial Reporting (“Option A”)
If the Board wishes to develop a single investment return assumption for both funding and financial
reporting purposes, then it would be necessary to exclude the administrative expense component of about
0.12% from development of the 7.50% investment return preliminary recommendation. Under this
approach, because these economic assumptions are generally changed in ¼% increments, there would be
no change in the recommended investment return assumption as developed earlier in this report. Instead,
there would be an increase in the risk adjustment of 0.12%, with a corresponding increase in the
confidence level from 54% to 55%.
MASTER PAGE NO. 154
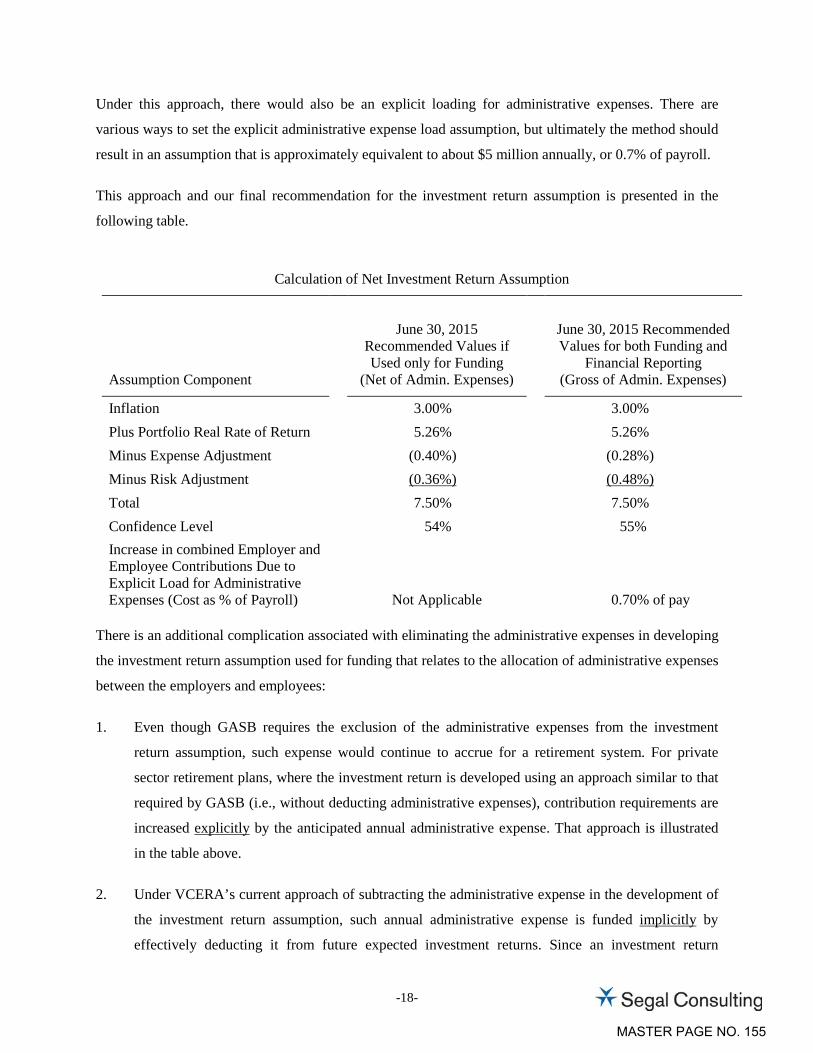
-18-
Under this approach, there would also be an explicit loading for administrative expenses. There are
various ways to set the explicit administrative expense load assumption, but ultimately the method should
result in an assumption that is approximately equivalent to about $5 million annually, or 0.7% of payroll.
This approach and our final recommendation for the investment return assumption is presented in the
following table.
Calculation of Net Investment Return Assumption
Assumption Component
June 30, 2015
Recommended Values if Used only for Funding
(Net of Admin. Expenses)
June 30, 2015 Recommended Values for both Funding and
Financial Reporting (Gross of Admin. Expenses)
Inflation 3.00% 3.00% Plus Portfolio Real Rate of Return 5.26% 5.26% Minus Expense Adjustment (0.40%) (0.28%) Minus Risk Adjustment (0.36%) (0.48%) Total 7.50% 7.50% Confidence Level 54% 55% Increase in combined Employer and Employee Contributions Due to Explicit Load for Administrative Expenses (Cost as % of Payroll)
Not Applicable
0.70% of pay
There is an additional complication associated with eliminating the administrative expenses in developing
the investment return assumption used for funding that relates to the allocation of administrative expenses
between the employers and employees:
1. Even though GASB requires the exclusion of the administrative expenses from the investment
return assumption, such expense would continue to accrue for a retirement system. For private
sector retirement plans, where the investment return is developed using an approach similar to that
required by GASB (i.e., without deducting administrative expenses), contribution requirements are
increased explicitly by the anticipated annual administrative expense. That approach is illustrated
in the table above.
2. Under VCERA’s current approach of subtracting the administrative expense in the development of
the investment return assumption, such annual administrative expense is funded implicitly by
effectively deducting it from future expected investment returns. Since an investment return
MASTER PAGE NO. 155

-19-
assumption net of investment and administrative expenses has been used historically to establish
both the employer’s and the employee’s contribution requirements, these administrative expenses
have been funded implicitly by both the employer and the employees.
3. A switch from the method described in (2) to the method described in (1) may require a new
discussion on how to allocate administrative expenses between employers and employees,
including possibly establishing a new method to allocate the anticipated annual administrative
expense between them. Under current practice, part of the implicit funding of administrative
expenses is in the Normal Cost and so is shared between the employer and the employees.
However, the rest of the implicit expense funding is in the (Unfunded) Actuarial Accrued Liability,
which is funded solely by the employers.
4. It is not straightforward to quantify precisely the current implicit sharing of administrative
expenses between employers and employees. This means that an exact reproduction of that
allocation on an explicit basis will be difficult to develop. This in turn means that VCERA would
need to develop a new basis for sharing the cost of administrative expenses, one that if desired,
approximately reproduces the current allocation. Alternatively, VCERA could decide to treat
administrative expenses as a loading applied only to the employer contribution rates, which is the
practice followed by private plans, both single employer and multi-employer.
5. As the Board is aware, legislative changes under AB 340 imposed major modifications to both the
level of benefits and the cost-sharing of the funding of those benefits for county employees’
retirement systems. Included in such modifications is the requirement (for future hires) to fund the
Normal Cost on a 50:50 basis between the employer and the employee. As noted in (3) above,
under current practice, part of the implicit funding of administrative expenses is in the Normal Cost
and so would be shared between the employer and the employees. This would not necessarily
continue when the administrative expense loading is developed separate from the Normal Cost.
If, as we recommend, the Board wishes to continue to develop a single investment return
assumption for both funding and financial reporting purposes, it is our recommendation that the
Board adopt a change in the funding of administrative expenses from the method described in (2)
above with an implicit allocation of administrative expenses to the method described in (1) above
with an explicit allocation of administrative expenses.
In addition, we recommend that the total explicit administrative expense load assumption be set at
0.70% of payroll, which is approximately equivalent to about 0.12% of assets or $5 million
MASTER PAGE NO. 156
-20-
annually. This assumption would be reviewed with each triennial experience study, along with the
other economic assumptions.
The more significant issues mentioned in (3), (4) and (5) above concern whether or not the costs
associated with the administrative expenses should continue to be allocated to both the employers and the
employees. Unless the Board wishes to charge administrative expenses only to the employers, we propose
a method whereby the costs associated with the explicit assumption for administrative expenses continue
to be allocated to both employers and employees. We recommend a straightforward way to do that in a
manner generally consistent with current practice, which is to allocate expenses based on the components
of the total contribution rate (before expenses) for employers and employees. These components would be
employee Normal Cost contributions, employer Normal Cost contributions and employer UAAL
contributions. Under this recommended approach, of the total administrative expenses of about $5
million or 0.70% of payroll, about $1.1 million or 0.15% of payroll would be allocated to the
employees and $3.9 million or 0.55% of payroll would be allocated to the employers in the
aggregate. This allocation would be based on the actual components in each valuation and could
change slightly each year.
Development of Investment Return Assumption for Funding on a Net of Administrative Expenses
Basis but use that Same Assumption for Financial Disclosure Development (“Option B”)
If the Board decides to leave the recommended investment return assumption of 7.50% on a net of
administrative expense basis for funding purposes, we believe there still is a way to use that same 7.50%
for financial reporting purposes under GASB. Under this approach, what appears to be the same 7.50%
assumption would actually be used as two slightly different assumptions: 7.50% net of administrative
expenses for funding, and 7.50% gross of administrative expenses for financial reporting. This would
indirectly result in an increase in the margin for adverse deviation or “confidence level” associated with
the use of the recommended 7.50% assumption from 54% as used for funding purposes to 55% only as
used for financial reporting purposes.
The Board had previously adopted this Option B on an interim basis last year for use in performing the
June 30, 2014 actuarial valuation and the June 30, 2014 GASB 67 report.
The following table summarizes the components of the investment return assumption under this approach,
using the recommended 7.50% assumption for both funding (net of administration expenses) and financial
reporting (gross of administration expenses), but with differing treatment of administrative expenses:
MASTER PAGE NO. 157

-21-
Calculation of Net Investment Return Assumption
Assumption Component
June 30, 2015 Recommended Values if Used only for Funding
(Net of Admin. Expenses)
June 30, 2015 Alternative Values for Financial Reporting
(Gross of Admin. Expenses)
Inflation 3.00% 3.00%
Plus Portfolio Real Rate of Return
5.26%
5.26%
Minus Expense Adjustment (0.40%) (0.28%)
Minus Risk Adjustment (0.36%) (0.48%)
Total 7.50% 7.50%
Confidence Level 54% 55%
Note that under both Option A and Option B the confidence level for financial reporting increases from
54% to 55% (because the risk adjustment increases from 0.36% to 0.48%). The difference is that under
Option A the same confidence level increase would apply for funding purposes, along with the addition of
an explicit loading on the contribution rates for administrative expenses.
MASTER PAGE NO. 158

-22-
C. SALARY INCREASE
Salary increases impact plan costs in two ways: (i) by increasing members’ benefits (since benefits are a
function of the members’ highest average pay) and future normal cost collections; and (ii) by increasing
total active member payroll which in turn generates lower UAAL contribution rates. These two impacts
are discussed separately below.
As an employee progresses through his or her career, increases in pay are expected to come from three
sources:
1. Inflation – Unless pay grows at least as fast as consumer prices grow, employees will experience a
reduction in their standard of living. There may be times when pay increases lag or exceed inflation,
but over the long term, labor market forces may require an employer to maintain its employees’
standards of living.
As discussed earlier in this report, we are recommending that the assumed rate of inflation be
reduced from 3.25% to 3.00%. This inflation component is used as part of the salary increase
assumption.
2. Real “Across the Board” Pay Increases – These increases are typically termed productivity increases
since they are considered to be derived from the ability of an organization or an economy to produce
goods and services in a more efficient manner. As that occurs, at least some portion of the value of
these improvements can provide a source for pay increases. These increases are typically assumed to
extend to all employees “across the board.” The State and Local Government Workers Employment
Cost Index produced by the Department of Labor provides evidence that real “across the board” pay
increases have averaged about 0.5% - 0.7% annually during the last ten to twenty years.
We also referred to the annual report on the financial status of the Social Security program published
in July 2014. In that report, real “across the board” pay increases are forecast to be 1.1% per year
under the intermediate assumptions.
The real pay increase assumption is generally considered a more “macroeconomic” assumption, that
is not necessarily based on individual plan experience. However, recent salary experience with public
systems in California as well as anecdotal discussions with plans and plan sponsors indicate lower
future real wage growth expectations for public sector employees.
MASTER PAGE NO. 159
-23-
Considering these factors, we recommend reducing the real “across the board” salary increase
assumption from 0.75% to 0.50%. This means that the combined inflation and “across the
board” salary increase assumption will decrease from 4.00% to 3.50%.
3. Promotional and Merit Increases – As the name implies, these increases come from an employee’s
career advances. This form of pay increase differs from the previous two, since it is specific to the
individual. For VCERA, there are service-specific merit and promotional increases. These
assumptions have been reviewed as part of our triennial experience study as of June 30, 2015.
Recommended promotional and merit assumptions are provided as part of our triennial
experience analysis.
All three of these forces will be incorporated into a salary increase assumption which is applied in the
actuarial valuation to project future benefits and future normal cost contribution collections.
Active Member Payroll
Projected active member payrolls are used to develop the UAAL contribution rate. Future values are
determined as a product of the number of employees in the workforce and the average pay for all
employees. The average pay for all employees increases only by inflation and real “across the board” pay
increases. The promotional and merit increases are not an influence, because this average pay is not
specific to an individual.
We recommend that the active member payroll increase assumption be decreased from 4.00% to
3.50% annually, consistent with the combined inflation plus real “across the board” salary increase
assumptions.
5354675v4/05325.110
MASTER PAGE NO. 160

VENTURA COUNTY EMPLOYEES’ RETIREMENT ASSOCIATION
1190 South Victoria Avenue, Suite 200 Ventura, CA 93003-6572
(805) 339-4250 Fax: (805) 339-4269 http://www.ventura.org/vcera
April 20, 2015 Board of Retirement Ventura County Employee Retirement Association 1190 South Victoria Avenue Ventura, CA 93003 SUBJECT: REVIEW AND RECOMMENDATIONS REGARDING INTEREST CREDITING
POLICY Dear Board Members, VCERA’s current Interest Crediting Policy provides for the semiannual crediting of interest to designated reserves. While interest crediting occurs semiannually, the Board may recall that in early 2008, outside counsel recommended determining the existence of Excess Earnings on an annual basis at the end of each fiscal year. Shortly thereafter on March 17, 2008, the Board approved amendments to its interest crediting policy. At the end of FY 2013-2014, VCERA had Excess Earnings and the Board elected to leave those funds in the Undistributed Earnings Reserve. Staff has reviewed the existing policy and recommends the amendments provided in the draft document, to be in place for the end of the fiscal year. The proposed changes have been developed through collaboration with both Legal Counsel and VCERA’s actuary. Primarily, the changes address the topic of excess earnings, and set forth a priority of discretionary use of excess earnings. Below is a summary of the issues addressed in the proposed changes. Policy Name We recommend changing the name of the policy to reflect the excess earnings component, by calling it, “Interest Crediting and Excess Earnings Policy.” This change is recommended because the policy governs both the semiannual crediting of interest, and the fiscal year-end determination of excess earnings and potential uses of those earnings. Terminology Update The existing policy lists the STAR COLA reserve, which no longer exists due to the Board’s termination of that benefit when there were no longer sufficient excess earnings to continue funding it. Prioritizing the Contra Reserve Per the policy, interest is credited regularly regardless of the applicable year’s earnings. If the year’s earnings are less than the required amount to be credited, Steps 2 through 4 of the current policy specify that the Contra Reserve be charged with the shortfall. The Contra Reserve serves as an offset to the County Advance Reserves. For this reason, Staff recommends when excess earnings are available at the end of a fiscal year, replenishing the Contra Reserve to a zero balance should be the first priority before funding supplemental discretionary benefits. Counsel agrees this is a sound fiduciary practice, and the
MASTER PAGE NO. 161

REVIEW AND RECOMMENDATIONS REGARDING INTEREST CREDITING POLICY April 20, 2015 Page 2 of 2 actuary agrees it serves as a best practice. The draft policy provided therefore inserts reducing the balance of the Contra Reserve as Step 5, and leaves the remaining steps in the same order as they were previously. The remaining changes to the document generally clarify the timing of determining excess earnings (per outside counsel’s 2008 recommendation) or are in support of the items mentioned above. I would be pleased to respond to any questions you may have on this matter at the April 20, 2014 business meeting. Sincerely,
Linda Webb Retirement Administrator Attachments
MASTER PAGE NO. 162

VENTURA COUNTY EMPLOYEES' RETIREMENT ASSOCIATION
INTEREST CREDITING AND EXCESS EARNINGS POLICY PURPOSE OF POLICY: The purpose of this policy is to establish the process to be used by the Ventura County Employees' Retirement Association ("VCERA") to credit semi-annual interest to reserves and to determine the use of excess earnings. This policy shall include, but may not be limited to, the following: (1) defining the reserves maintained by VCERA, (2) determining the rates of interest at which reserves are to be credited, (3) determining the priorities and sequence by which interest will be credited to
the reserves, and
(3)(4) determining the use of excess earnings. CURRENT RESERVES: VCERA maintains the following reserves: Valuation Reserves: Member Deposit Reserves - The reserves to which member contributions are credited, including those contributions made by the employer on behalf of the member pursuant to Government Code section 31581.2. Contributions may be refunded to the member upon separation from service or left on deposit by the member upon separation from service (deferred retirement). Upon the retirement of a member a transfer is made to Retiree Member Reserves (Annuity). County Advance Reserves - The reserves to which employer contributions are credited, including those contributions made by the employer on behalf of the member pursuant to Government Code section 31581.1. Contributions are not refunded to the member at the time of separation. Upon the retirement of a member a transfer is made to the Retiree Member Reserves (Pension). Retiree Member Reserves (Annuity & Pension) - The reserves to which transfers are made from Member Deposit Reserves and County Advance Reserves at the time of a member’s retirement. The total of these reserves should equal the present value of the total benefit due to all retirees and eligible beneficiaries.
MASTER PAGE NO. 163
Vested Fixed Supplemental Benefit ($108.44 Supplement) Reserve - The reserve for the payment of the vested fixed $108.44 monthly supplemental benefit provided pursuant to Government Code section 31682. Supplemental Death Benefit ($5000 Death) Reserve - This reserve is used for the payment of the $5,000 lump sum death benefit. Contra Reserve - For accounting and valuation purposes the Contra Reserve shall be maintained as an offset to the County Advance Reserves. Undistributed Earnings Reserve - The amount of earnings from current and prior years not previously credited to other Valuation, Non-valuation, and Supplemental Benefit Reserves, in excess of the Statutory 1.0% Contingency Reserve and Additional Contingency Reserve, if any. Non-valuation Reserves: Statutory Contingency Reserve - Thise reserve is an amount up to 1.0% of the total market value of assets to provide for future deficiencies in interest earnings, losses on investments, and other contingencies. Additional Contingency Reserve – Any additional reserve maintained at the discretion of the Board to further provide for future deficiencies in interest earnings, losses on investments and other contingencies. Current Board policy is not to maintain an Additional Contingency Reserve Supplemental Benefit Reserves: Supplemental Targeted Adjustment for Retirees Cost-of-Living Benefit (STAR COLA) Reserve - This reserve is used for the payment of a supplemental cost-of-living benefit pursuant to the provisions of Government Code section 31874.3(b) to those retirees whose cost-of-living accumulations (banks) equal or exceed 20.0%. The reserve was funded for a five-year period in September 1999 by a transfer from Undistributed Earnings. Benefit funding is reviewed annually, with an additional transfer, if authorized in accordance with Step #7 below, from Undistributed Earnings in order to maintain sufficient funding to provide STAR COLA benefits for up to five years, or any other time period as determined by the Board. Fixed Supplemental Benefit ($27.50 Supplement) Reserve - This reserve was established in March 2003 for the payment of the fixed monthly $27.50 monthly payment to those retirees and surviving beneficiaries eligible to receive the vested $108.44 monthly benefit. This reserve was funded by an initial discretionary transfer of $25 million from Undistributed Earnings, which would have been sufficient to continue to pay the benefit in perpetuity only if sufficient
MASTER PAGE NO. 164
Excess Earnings in future years were to exist at a level that would permit future Boards to credit the Reserve with interest at the then-assumed 8.25% per year rate, and even then, only if future Boards decide to continue to make such discretionary interest credits at such assumed rates. Financial Statement Reserves: Market Stabilization Reserve - The difference between the current market value of assets and the actuarial value of assets used to establish the above reserves. RATES OF INTEREST AT WHICH RESERVES ARE CREDITED: Regular Interest Rate – This is the target rate to be credited to all Valuation Reserves except the Member Deposit Reserves and the Undistributed Earnings Reserve. By statute, this rate means interest at 2 1/2 percent a year until otherwise determined by the Board compounded semiannually on June 30th and December 31st (Government Code section 31472). Regular interest shall be credited semiannually on June 30th and December 31st to all contributions in the retirement fund which have been on deposit for six months immediately prior to that date (Government Code section 31591). With respect to the rates of interest to be credited to members and to the County or District, the Board may, in its sound discretion, recommend a rate that is higher or lower than the actuarial interest assumption rate adopted by the Board. Board policy is to set the semiannual regular interest rate equal to one half of the current actuarial interest assumption rate adopted by the Board. Member Crediting Rate - Member accounts shall be credited each June 30 and December 31 in an amount equal to one-half the rate of return on the United States ten (10) year Treasury note as quoted in the Wall Street Journal. Interest shall be credited to those contributions on deposit six months prior using the rate of the ten year U.S Treasury note on that June 30 or December 31 interest crediting date (or the last business day of the month if earlier). In no event shall the semiannual rate of interest credited exceed one-half of the prevailing actuarial interest assumption rate adopted by the Board. Timing of Rate Determination - The actuarial interest rate used for crediting interest to non-member reserves on December 31 and June 30 shall be the rate that corresponds to the actuarial interest rate used to calculate the current employer and employee contribution rates. CREDITING OF INTEREST: Designated Reserves shall be credited semiannually as follows:
MASTER PAGE NO. 165

Step 1 - Determine “Available Earnings” for accounting period as the sum of:
a. Earnings of the retirement fund based on the actuarial value of assets,
expressed in dollars. This could be a negative amount. b. Balance in the Statutory Contingency Reserve c. Balance in any Additional Contingency Reserve d. Balance in Undistributed Earnings Reserve
Step 2 - Credit interest to Member Deposit Reserve (MDR) at the Member Crediting Rate Deduct this MDR Interest amount from Available Earnings. If this amount of MDR Interest is more than Available Earnings, charge the shortfall to the Contra Reserve.
Step 3 - Credit interest on Non-Member Valuation Reserves at Regular Interest Rate
This includes interest on any Contra Reserve balances. If Available Earnings are not sufficient, charge the shortfall to the Contra Reserve.
Step 4 - Additional Credit for Valuation Reserve This Additional Credit is the difference between the amount of interest credited at Step 2 and the amount that would have been credited using the Regular Interest Rate. Transfer this Additional Credit, if any, from Available Earnings to the County Advance Reserve. If Available Earnings are not sufficient, charge the shortfall to the Contra Reserve. USE OF EXCESS EARNINGS
These steps only apply to Available Earnings remaining at the end of each measuring year, after the second semi-annual interest crediting.
MASTER PAGE NO. 166
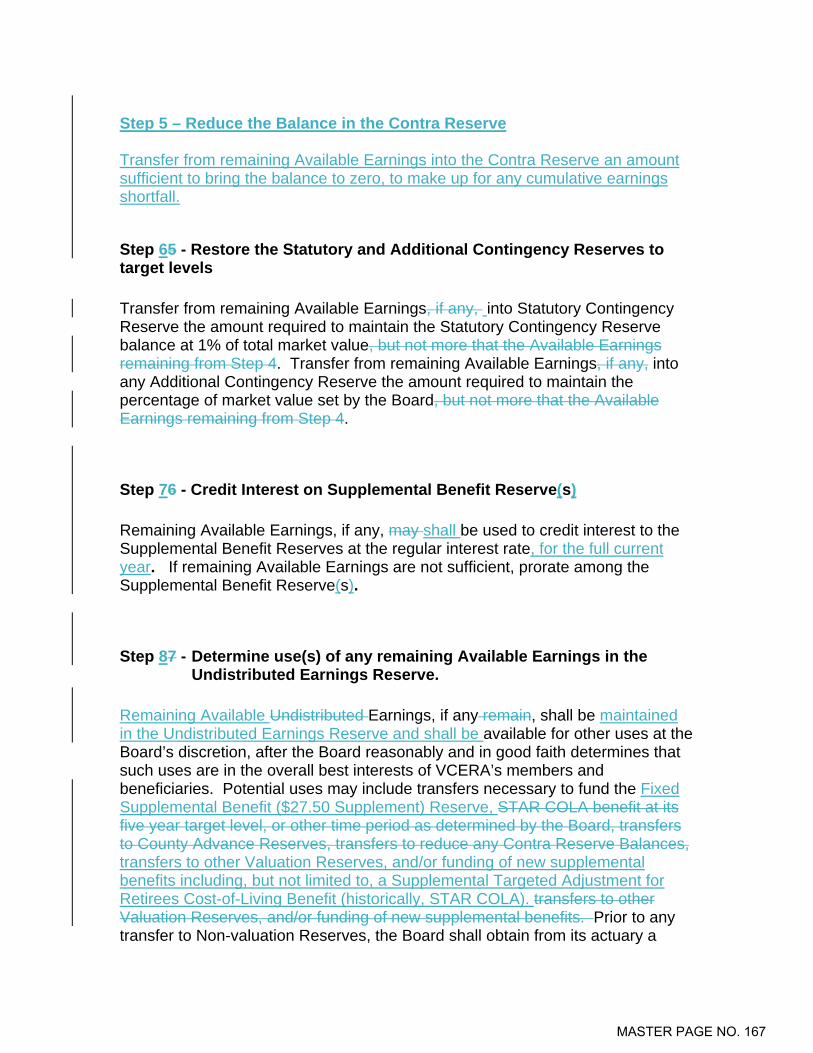
Step 5 – Reduce the Balance in the Contra Reserve Transfer from remaining Available Earnings into the Contra Reserve an amount sufficient to bring the balance to zero, to make up for any cumulative earnings shortfall.
Step 65 - Restore the Statutory and Additional Contingency Reserves to target levels Transfer from remaining Available Earnings, if any, into Statutory Contingency Reserve the amount required to maintain the Statutory Contingency Reserve balance at 1% of total market value, but not more that the Available Earnings remaining from Step 4. Transfer from remaining Available Earnings, if any, into any Additional Contingency Reserve the amount required to maintain the percentage of market value set by the Board, but not more that the Available Earnings remaining from Step 4.
Step 76 - Credit Interest on Supplemental Benefit Reserve(s) Remaining Available Earnings, if any, may shall be used to credit interest to the Supplemental Benefit Reserves at the regular interest rate, for the full current year. If remaining Available Earnings are not sufficient, prorate among the Supplemental Benefit Reserve(s).
Step 87 - Determine use(s) of any remaining Available Earnings in the Undistributed Earnings Reserve.
Remaining Available Undistributed Earnings, if any remain, shall be maintained in the Undistributed Earnings Reserve and shall be available for other uses at the Board’s discretion, after the Board reasonably and in good faith determines that such uses are in the overall best interests of VCERA’s members and beneficiaries. Potential uses may include transfers necessary to fund the Fixed Supplemental Benefit ($27.50 Supplement) Reserve, STAR COLA benefit at its five year target level, or other time period as determined by the Board, transfers to County Advance Reserves, transfers to reduce any Contra Reserve Balances, transfers to other Valuation Reserves, and/or funding of new supplemental benefits including, but not limited to, a Supplemental Targeted Adjustment for Retirees Cost-of-Living Benefit (historically, STAR COLA). transfers to other Valuation Reserves, and/or funding of new supplemental benefits. Prior to any transfer to Non-valuation Reserves, the Board shall obtain from its actuary a
MASTER PAGE NO. 167
statement of the impact of the transfer on current and future employer and employee contributions determined in accordance with the Board’s current funding policy. The actuary shall also advise the Board of any changes to its current funding policy that should be considered as a result of the proposed transfer. This policy approved, as amended, by the Board of Retirement on March 17, 2008. April 20, 2015. _______________________________ Tracy Towner, Chairman
MASTER PAGE NO. 168
Brad Haughey Craig Merrigan Mark Shevitz
Private & Confidential
Ventura County Employees' Retirement Association April 20, 2015
MASTER PAGE NO. 169

Executive Summary
Firm Update
Assets under management as of December 31, 2014 were $22.7 billion. Firm-wide we have 113 clients. There were no clients gained and three were lost in the fourth quarter of 2014.
For the full year, one client was gained and eight were lost. The International and Global segregated mandates are closed to new investors. The U.S. Global Pooled Fund and
U.S. Equity mandates remain open. Sabu Mehta was appointed to the Business Management Committee. Sprucegrove will assume responsibility for marketing and client servicing in the U.S. over the course of 2015.
Fair Haven Partners will continue to provide its excellent services through the transition period. Our total number of employees is 34.
Investment Results1
For the fourth quarter of 2014, the Sprucegrove U.S. International Pooled Fund, in which Ventura County Employees’ Retirement Association participates, had an investment return of -2.7% vs. MSCI EAFE -3.6%.
For the one-year ending December 31, 2014, the Fund’s investment return was -2.9% vs. MSCI EAFE -4.9%.
Since your inception on April 1, 2002, through March 31, 2015, the Fund’s annualized return was +8.5% vs. MSCI EAFE +6.5%.
Investment Strategy
As a bottom-up value investor, stock selection drives sector and country weightings. The largest sector exposures are Industrials and Financials. The largest country exposures are the U.K., Japan and Switzerland. During the fourth quarter, there was one new holding added to the Fund, Spectris (U.K./Information Technology),
and there were no eliminations.
2
1 Returns are gross of fees in U.S. dollars
It should not be assumed that investments made in the future will be profitable or will equal any results shown here. Refer to Performance Footnotes in the appendix for additional details. MASTER PAGE NO. 170
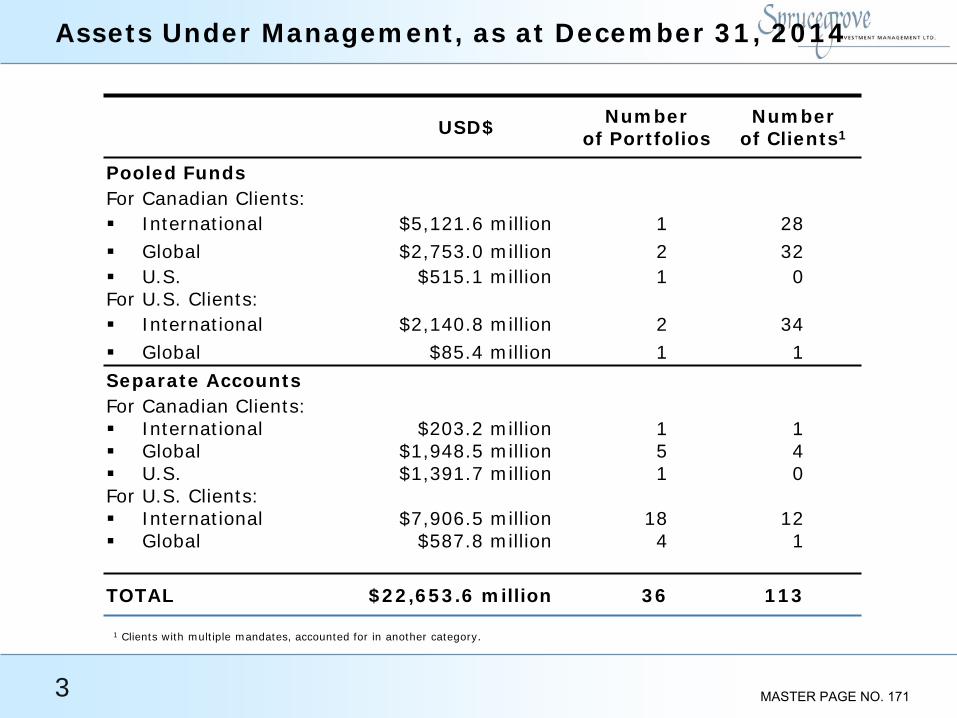
Assets Under Management, as at December 31, 2014
3
1 Clients with multiple mandates, accounted for in another category.
USD$ Number of Portfolios
Number of Clients1
Pooled Funds For Canadian Clients: International $5,121.6 million 1 28 Global $2,753.0 million 2 32 U.S. $515.1 million 1 0 For U.S. Clients: International $2,140.8 million 2 34 Global $85.4 million 1 1 Separate Accounts For Canadian Clients: International $203.2 million 1 1 Global $1,948.5 million 5 4 U.S. $1,391.7 million 1 0 For U.S. Clients: International $7,906.5 million 18 12 Global $587.8 million 4 1
TOTAL $22,653.6 million 36 113
MASTER PAGE NO. 171

Cash Flow History
Sprucegrove U.S. International Pooled Fund
4 It should not be assumed that investments made in the future will be profitable or will equal any results shown here. Investment performance will be reduced by investment management fees. Refer to Performance Footnotes in the appendix for additional details.
1 Participation in the Sprucegrove U.S. International Pooled Fund. Market values shown are as at December 31, unless otherwise noted. 2 Ventura County Employees‘ Retirement Association Inception date: April 1, 2002 3 Period ending March 31, 2015
Cash Flow History by Year – Ventura County Employees’ Retirement Association1
Year Net Deposits / (Withdrawals) Market Value1
(partial year) 20022 $110,000,000 $101,303,979
2003 $1,000,000 $140,978,965
2004 $(12,000,000) $162,248,685
2005 $(37,000,000) $144,262,606
2006 $(25,000,000) $157,829,518
2007 $(14,000,000) $153,658,751
2008 $(13,000,000) $76,198,869
2009 - $104,342,897
2010 - $124,558,513
2011 - $111,672,929
2012 $23,725,000 $157,961,770
2013 - $185,640,498
2014 - $180,309,142
YTD 20153 - $184,158,7653
MASTER PAGE NO. 172
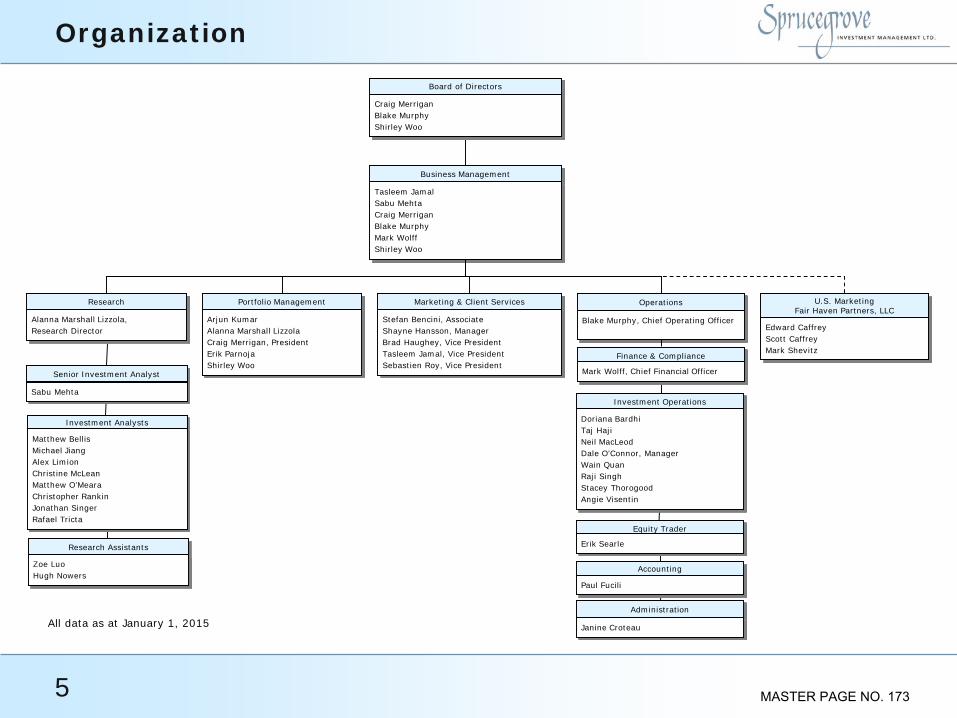
Organization
5
All data as at January 1, 2015
Research Assistants
Portfolio Management
Senior Investment Analyst
Investment Analysts
Marketing & Client Services
Finance & Compliance
U.S. MarketingFair Haven Partners, LLC
Operations
Investment Operations
Equity Trader
Board of Directors
Business Management
Craig MerriganBlake MurphyShirley Woo
Arjun KumarAlanna Marshall LizzolaCraig Merrigan, PresidentErik ParnojaShirley Woo
Sabu Mehta
Matthew BellisMichael JiangAlex LimionChristine McLeanMatthew O’MearaChristopher RankinJonathan SingerRafael Tricta
Stefan Bencini, AssociateShayne Hansson, ManagerBrad Haughey, Vice PresidentTasleem Jamal, Vice PresidentSebastien Roy, Vice President
Edward CaffreyScott CaffreyMark Shevitz
Blake Murphy, Chief Operating Officer
Doriana BardhiTaj HajiNeil MacLeodDale O’Connor, ManagerWain QuanRaji SinghStacey ThorogoodAngie Visentin
Erik Searle
Tasleem JamalSabu MehtaCraig MerriganBlake MurphyMark WolffShirley Woo
Research
Alanna Marshall Lizzola, Research Director
Accounting
Paul Fucili
Administration
Janine Croteau
Zoe LuoHugh Nowers
Mark Wolff, Chief Financial Officer
MASTER PAGE NO. 173

Investment Professionals and Client Services
6
Name Title Education
Years Investment Experience
Years with Sprucegrove/
Confed Craig Merrigan President, Portfolio Manager B.B.A., M.B.A., CFA 27 27
Shirley Woo Portfolio Manager B.A., CFA 27 27
Sabu Mehta Senior Investment Analyst B.Comm. 27 23
Erik Parnoja Portfolio Manager B.A., M.B.A., CFA 19 19
Alanna Marshall Lizzola Portfolio Manager & Research Director B.A., M.I.M., CFA 18 18
Alex Limion Investment Analyst B.A., M.B.A., CFA 13 13
Arjun Kumar Portfolio Manager B.A., M.B.A., CFA 12 12
Chris Rankin Investment Analyst B.A., B.Sc., CFA 9 11
Christine McLean Investment Analyst B.S.B.A. 10 10
Michael Jiang Investment Analyst B.Sc., M.M.I.B., M.B.A. 8 8
Matthew Bellis Investment Analyst B.Comm., CFA 7 7
Jonathan Singer Investment Analyst B.A., CFA 6 6
Rafael Tricta Investment Analyst B.Comm., M.B.A., CFA 2 2
Matthew O’Meara Investment Analyst B.A., M.B.A. 2 <1
Tasleem Jamal Vice President, Marketing & Client Servicing B.Comm., M.B.A., CFA 16 4
Sebastien Roy Vice President, Marketing & Client Servicing B.A., CFA 17 1
Brad Haughey Vice President, Marketing & Client Servicing B.A., B.Comm., CFA 15 <1
Total 235 188
Average 13.8 11.1
All data as at January 1, 2015
MASTER PAGE NO. 174
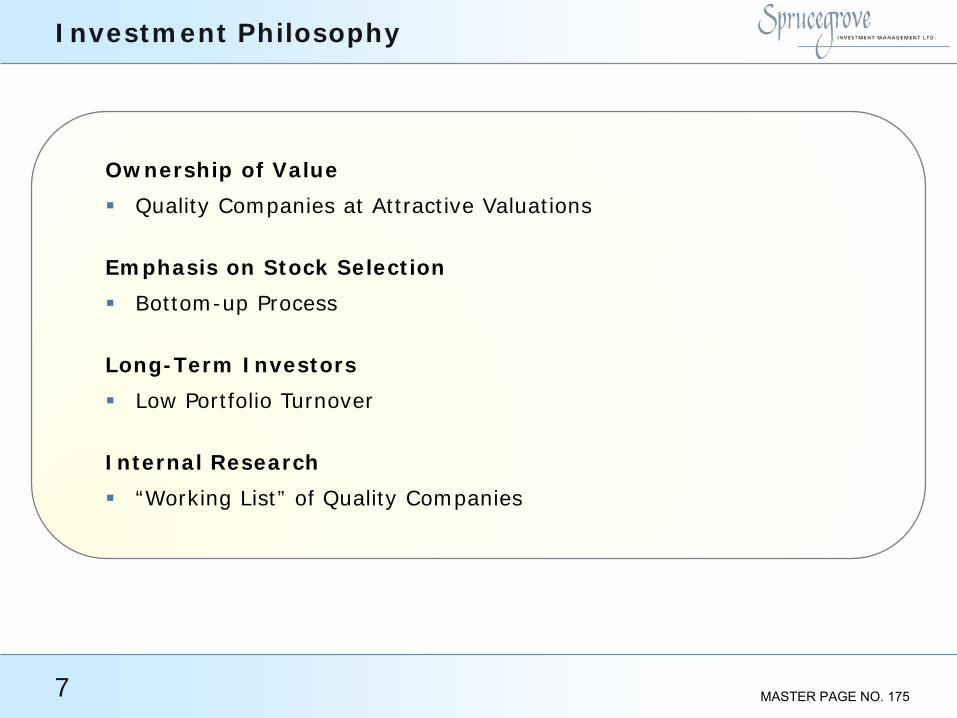
Investment Philosophy
Ownership of Value Quality Companies at Attractive Valuations
Emphasis on Stock Selection Bottom-up Process
Long-Term Investors Low Portfolio Turnover Internal Research “Working List” of Quality Companies
7 MASTER PAGE NO. 175

Investment Process
8
MSCI EAFE “plus” Universe
Research Candidates
“Working List”/Investable Companies
Quality Companies, Attractively Priced
Portfolio Selections
Bottom-up
MASTER PAGE NO. 176
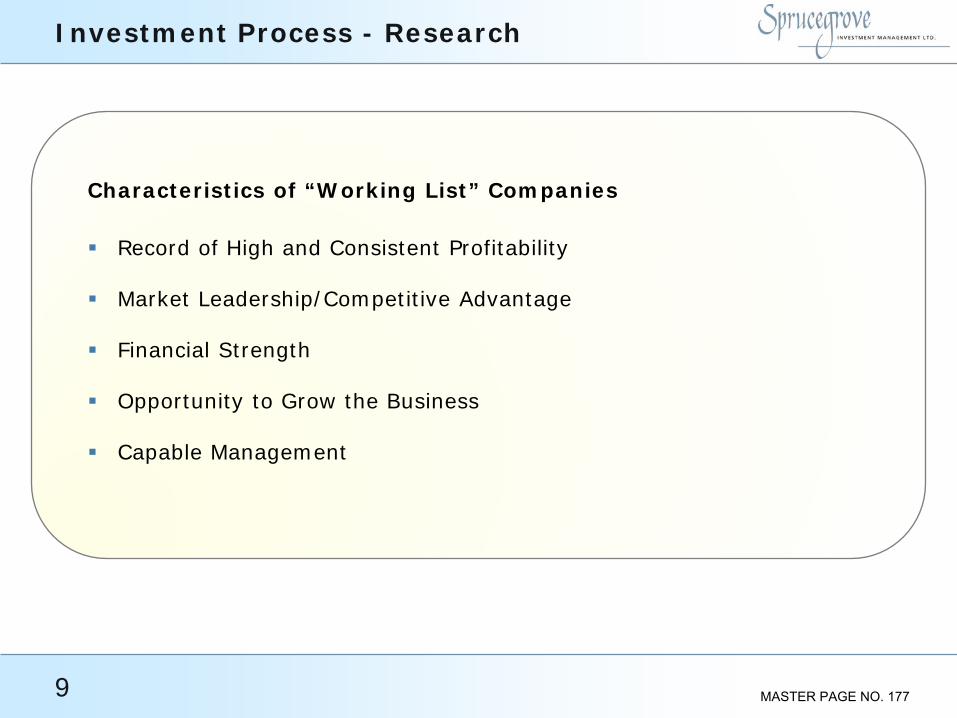
Investment Process - Research
Characteristics of “Working List” Companies
Record of High and Consistent Profitability
Market Leadership/Competitive Advantage
Financial Strength
Opportunity to Grow the Business
Capable Management
9 MASTER PAGE NO. 177
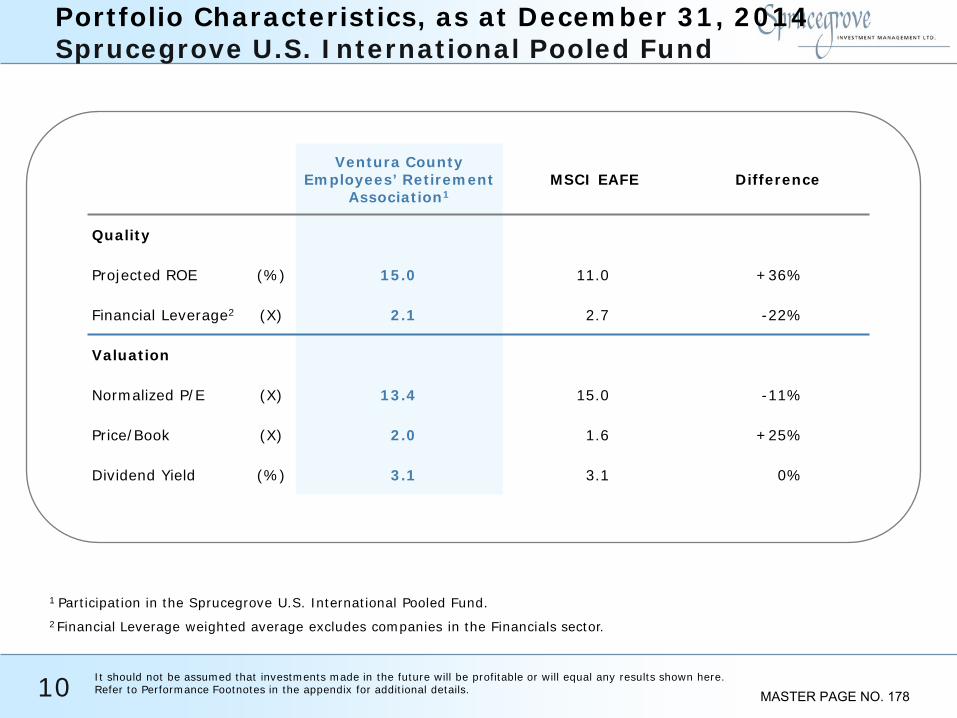
Portfolio Characteristics, as at December 31, 2014 Sprucegrove U.S. International Pooled Fund
10
1 Participation in the Sprucegrove U.S. International Pooled Fund. 2 Financial Leverage weighted average excludes companies in the Financials sector.
Ventura County
Employees’ Retirement Association1
MSCI EAFE Difference
Quality
Projected ROE (%) 15.0 11.0 +36%
Financial Leverage2 (X) 2.1 2.7 -22%
Valuation
Normalized P/E (X) 13.4 15.0 -11%
Price/Book (X) 2.0 1.6 +25%
Dividend Yield (%) 3.1 3.1 0%
It should not be assumed that investments made in the future will be profitable or will equal any results shown here. Refer to Performance Footnotes in the appendix for additional details. MASTER PAGE NO. 178
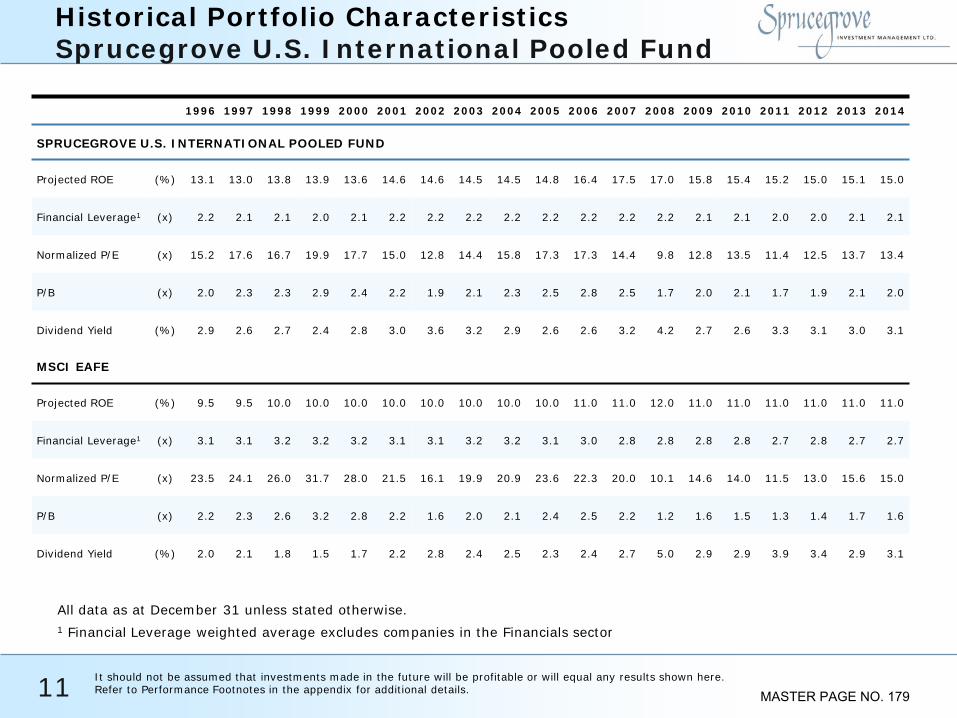
Historical Portfolio Characteristics Sprucegrove U.S. International Pooled Fund
11
All data as at December 31 unless stated otherwise.
1 Financial Leverage weighted average excludes companies in the Financials sector
1996 1997 1998 1999 2000 2001 2002 2003 2004 2005 2006 2007 2008 2009 2010 2011 2012 2013 2014
SPRUCEGROVE U.S. INTERNATIONAL POOLED FUND
Projected ROE (%) 13.1 13.0 13.8 13.9 13.6 14.6 14.6 14.5 14.5 14.8 16.4 17.5 17.0 15.8 15.4 15.2 15.0 15.1 15.0
Financial Leverage1 (x) 2.2 2.1 2.1 2.0 2.1 2.2 2.2 2.2 2.2 2.2 2.2 2.2 2.2 2.1 2.1 2.0 2.0 2.1 2.1
Normalized P/E (x) 15.2 17.6 16.7 19.9 17.7 15.0 12.8 14.4 15.8 17.3 17.3 14.4 9.8 12.8 13.5 11.4 12.5 13.7 13.4
P/B (x) 2.0 2.3 2.3 2.9 2.4 2.2 1.9 2.1 2.3 2.5 2.8 2.5 1.7 2.0 2.1 1.7 1.9 2.1 2.0
Dividend Yield (%) 2.9 2.6 2.7 2.4 2.8 3.0 3.6 3.2 2.9 2.6 2.6 3.2 4.2 2.7 2.6 3.3 3.1 3.0 3.1
MSCI EAFE
Projected ROE (%) 9.5 9.5 10.0 10.0 10.0 10.0 10.0 10.0 10.0 10.0 11.0 11.0 12.0 11.0 11.0 11.0 11.0 11.0 11.0
Financial Leverage1 (x) 3.1 3.1 3.2 3.2 3.2 3.1 3.1 3.2 3.2 3.1 3.0 2.8 2.8 2.8 2.8 2.7 2.8 2.7 2.7
Normalized P/E (x) 23.5 24.1 26.0 31.7 28.0 21.5 16.1 19.9 20.9 23.6 22.3 20.0 10.1 14.6 14.0 11.5 13.0 15.6 15.0
P/B (x) 2.2 2.3 2.6 3.2 2.8 2.2 1.6 2.0 2.1 2.4 2.5 2.2 1.2 1.6 1.5 1.3 1.4 1.7 1.6
Dividend Yield (%) 2.0 2.1 1.8 1.5 1.7 2.2 2.8 2.4 2.5 2.3 2.4 2.7 5.0 2.9 2.9 3.9 3.4 2.9 3.1
It should not be assumed that investments made in the future will be profitable or will equal any results shown here. Refer to Performance Footnotes in the appendix for additional details. MASTER PAGE NO. 179

Annual Performance Results, ending December 31
Sprucegrove U.S. International Pooled Fund
12 It should not be assumed that investments made in the future will be profitable or will equal any results shown here. Investment performance will be reduced by investment management fees. Refer to Performance Footnotes in the appendix for additional details.
1 Participation in the Sprucegrove U.S. International Pooled Fund. 2 Bold blue numbers indicate down markets (negative Index return). Returns shorter than a 1-year period are arithmetic returns and have not been annualized. Returns greater than a 1-year period have been annualized. Returns are gross of fees in U.S. dollars. 3 Ventura County Employees‘ Retirement Association Inception date: April 1, 2002 4 Period ending March 31, 2015 5 Difference between Fund net return and MSCI EAFE net return
Market Value as of March 31, 2015: $184,158,765.35
Year
Ventura County Employees‘ Retirement Association1,2
MSCI EAFE2 (%)
Difference5
(%) Gross (%) Net (%)
(partial year) 20023 -7.7 -8.0 -16.4 +8.4
2003 34.5 33.9 38.6 -4.7
2004 25.2 24.7 20.3 +4.4
2005 14.7 14.2 13.5 +0.7
2006 30.4 29.8 26.3 +3.5
2007 6.2 5.8 11.2 -5.4
2008 -42.2 -42.4 -43.4 +1.0
2009 36.9 36.2 31.8 +4.4
2010 19.4 18.8 7.8 +11.0
2011 -10.3 -10.7 -12.1 +1.4
2012 17.7 17.2 17.3 -0.1
2013 17.5 17.1 22.8 -5.7
2014 -2.9 -3.2 -4.9 +1.7
YTD 20154 2.1 2.0 4.9 -2.9
Since inception3, 4 8.5 8.0 6.5 +1.5
MASTER PAGE NO. 180

Annualized Performance Results, ending June 30, 2014 Sprucegrove U.S. International Pooled Fund
13 It should not be assumed that investments made in the future will be profitable or will equal any results shown here. Investment performance will be reduced by investment management fees. Refer to Performance Footnotes in the appendix for additional details.
Fiscal YTD to
March 31, 20153
1 Year
2 Years
3 Years
5 Years
7 Years
10 Years
Since Inception2
(%) (%) (%) (%) (%) (%) (%) (%)
Ventura County Employees‘ Retirement Association - Gross Return1
-6.6 22.6 18.4 8.4 14.3 2.9 8.7 9.6
Ventura County Employees‘ Retirement Association – Net Return1
-6.8 22.1 17.9 8.0 13.8 2.4 8.2 9.1
MSCI EAFE -4.8 23.6 21.1 8.1 11.8 1.0 6.9 7.3
Returns shorter than a 1-year period are arithmetic returns and have not been annualized. Returns greater than a 1-year period have been annualized. Returns are in U.S. dollars.
1 Participation in the Sprucegrove U.S. International Pooled Fund. 2 Ventura County Employees' Retirement Association Inception date: March 31, 2002. 3 Ventura County Employees' Retirement Association fiscal year-end is June 30th. Fiscal YTD performance is from July 01, 2014 through March 31, 2015.
MASTER PAGE NO. 181

Annualized Performance Results, ending March 31, 2015 Sprucegrove U.S. International Pooled Fund
14 It should not be assumed that investments made in the future will be profitable or will equal any results shown here. Investment performance will be reduced by investment management fees. Refer to Performance Footnotes in the appendix for additional details.
Fiscal YTD3
1 Year
2 Years
3 Years
5 Years
7 Years
10 Years
Since Inception2
(%) (%) (%) (%) (%) (%) (%) (%)
Ventura County Employees‘ Retirement Association - Gross Return1
-6.6 -2.8 5.7 7.4 6.9 3.1 6.2 8.5
Ventura County Employees‘ Retirement Association - Net Return1
-6.8 -3.2 5.3 7.0 6.5 2.7 5.8 8.0
MSCI EAFE -4.8 -0.9 7.9 9.0 6.2 1.6 4.9 6.5
Returns shorter than a 1-year period are arithmetic returns and have not been annualized. Returns greater than a 1-year period have been annualized. Returns are in U.S. dollars.
1 Participation in the Sprucegrove U.S. International Pooled Fund. 2 Ventura County Employees' Retirement Association Inception date: March 31, 2002. 3 Ventura County Employees' Retirement Association fiscal year-end is June 30th. Fiscal YTD performance is from July 01, 2014 through March 31, 2015.
MASTER PAGE NO. 182

15
Up and Down Market Cycle Performance Sprucegrove EAFE – U.S. Clients Composite
Creation date for the Sprucegrove – EAFE U.S. Clients Composite: October 1, 1985
A down market is defined as any group of returns that start and end with negative performing quarters, does not have more than 4 consecutive (1 year) positive quarters and the total combined cumulative return is less than -20%.
It should not be assumed that investments made in the future will be profitable or will equal any results shown here. Refer to Performance Footnotes in the appendix for additional details. MASTER PAGE NO. 183

Sector Weightings/Returns – Q4 2014 Sprucegrove U.S. International Pooled Fund
16 It should not be assumed that investments made in the future will be profitable or will equal any results shown here. Investment performance will be reduced by investment management fees. Refer to Performance Footnotes in the appendix for additional details.
1 Bold blue numbers indicate primary contributors to relative performance vs. the Index. 2 Period ending December 31, 2014. 3 Returns are gross of fees in U.S. dollars. 4 Participation in the Sprucegrove U.S. International Pooled Fund.
Performance Q4 20141,2
(%)
Weighting, as at December 31, 20141
(%)
Sector
Ventura County Employees‘ Retirement
Association3,4
MSCI EAFE
Ventura County Employees‘ Retirement Association4
MSCI EAFE
Energy -19.9 -19.1 10.0 5.7
Materials -6.8 -5.3 11.7 7.6
Industrials 1.8 -3.4 19.0 12.6
Consumer Discretionary 0.2 3.0 12.4 12.4
Consumer Staples 2.7 -1.6 4.6 11.1
Health Care -1.8 -5.3 6.1 11.0
Financials -2.3 -3.1 15.4 25.9
Information Technology 2.3 -0.5 11.4 4.8
Telecomm. Services 0.8 -0.5 3.0 5.0
Utilities -1.6 -4.0 3.2 3.9
MASTER PAGE NO. 184

Impact Stocks – Q4 2014 Sprucegrove U.S. International Pooled Fund
17
* Average weighting is calculated as the average daily weight of the equity in the portfolio. Contribution to Fund Return is calculated using the geometric daily linking of the return multiplied by the beginning of day weight. A list of all holdings’ contributions is available upon request.
Top 5 Contributors Country Sector Average
Weighting (%)*
Estimated Contribution
(bps)
Carnival United Kingdom Consumer Discretionary 1.9 +27
State Bank of India India Financials 1.0 +20
Yue Yuen Hong Kong Consumer Discretionary 1.1 +18
Misumi Japan Industrials 1.6 +16
Tiger Brands South Africa Consumer Staples 1.1 +16
Bottom 5 Contributors
Petrobras Brazil Energy 0.8 -51
Total France Energy 2.2 -49
Sasol South Africa Energy 1.0 -34
Banco Santander Spain Financials 2.7 -30
Royal Dutch Shell United Kingdom Energy 2.5 -27
It should not be assumed that investments made in the future will be profitable or will equal any results shown here. Refer to Performance Footnotes in the appendix for additional details. MASTER PAGE NO. 185

Sector Weightings/Returns – 2014 Sprucegrove U.S. International Pooled Fund
18 It should not be assumed that investments made in the future will be profitable or will equal any results shown here. Investment performance will be reduced by investment management fees. Refer to Performance Footnotes in the appendix for additional details.
1 Bold blue numbers indicate primary contributors to relative performance vs. the Index. 2 Period ending December 31, 2014. 3 Returns are gross of fees in U.S. dollars. 4 Participation in the Sprucegrove U.S. International Pooled Fund.
Performance
20141,2 (%)
Weighting, as at December 31, 20141
(%)
Sector
Ventura County Employees‘ Retirement
Association3,4
MSCI EAFE
Ventura County Employees‘ Retirement Association4
MSCI EAFE
Energy -22.5 -18.7 10.0 5.7
Materials -4.9 -10.7 11.7 7.6
Industrials 1.3 -7.7 19.0 12.6
Consumer Discretionary -12.0 -4.6 12.4 12.4
Consumer Staples -12.5 -2.4 4.6 11.1
Health Care 11.7 6.0 6.1 11.0
Financials 4.9 -5.7 15.4 25.9
Information Technology 2.3 -0.7 11.4 4.8
Telecomm. Services 14.5 -4.3 3.0 5.0
Utilities 10.0 3.8 3.2 3.9
MASTER PAGE NO. 186
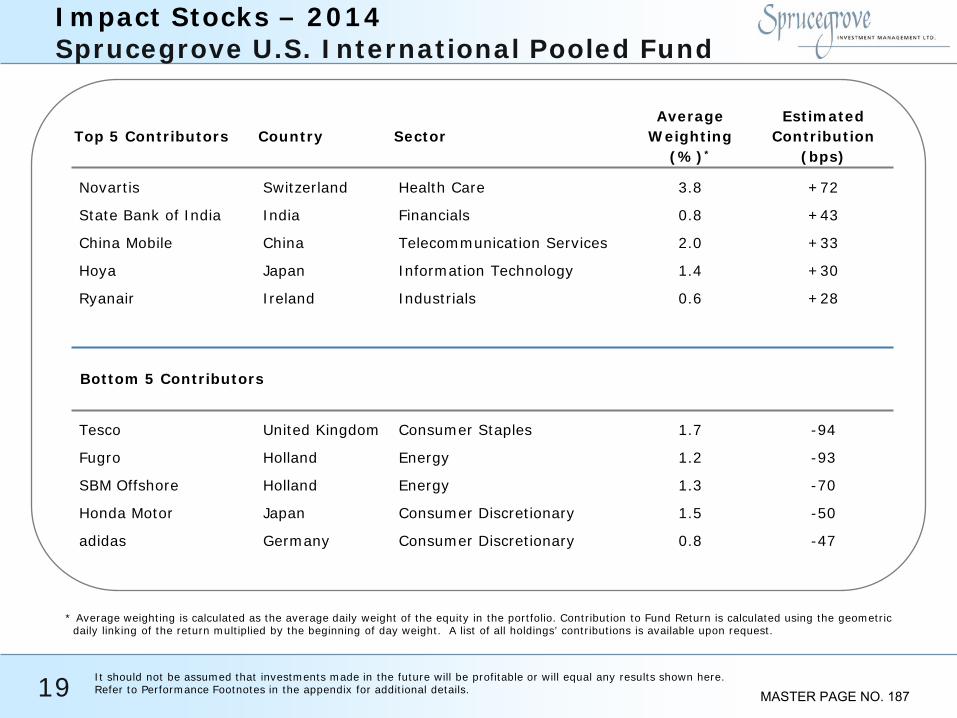
Impact Stocks – 2014 Sprucegrove U.S. International Pooled Fund
19
* Average weighting is calculated as the average daily weight of the equity in the portfolio. Contribution to Fund Return is calculated using the geometric daily linking of the return multiplied by the beginning of day weight. A list of all holdings’ contributions is available upon request.
Top 5 Contributors Country Sector Average
Weighting (%)*
Estimated Contribution
(bps)
Novartis Switzerland Health Care 3.8 +72
State Bank of India India Financials 0.8 +43
China Mobile China Telecommunication Services 2.0 +33
Hoya Japan Information Technology 1.4 +30
Ryanair Ireland Industrials 0.6 +28
Bottom 5 Contributors
Tesco United Kingdom Consumer Staples 1.7 -94
Fugro Holland Energy 1.2 -93
SBM Offshore Holland Energy 1.3 -70
Honda Motor Japan Consumer Discretionary 1.5 -50
adidas Germany Consumer Discretionary 0.8 -47
It should not be assumed that investments made in the future will be profitable or will equal any results shown here. Refer to Performance Footnotes in the appendix for additional details. MASTER PAGE NO. 187

Transaction Summary – Q4 2014 Sprucegrove U.S. International Pooled Fund
20 It should not be assumed that investments made in the future will be profitable or will equal any results shown here. The information presented as an example of investment technique and should not be construed as representative of investment performance. A list of all securities purchased and sold within the past year together with dates and prices is available upon request. Refer to Performance Footnotes in the appendix for additional details.
Note: Valuation characteristics are at the time of the transaction.
Eliminations/Reductions New Holdings/Additions
Normalized P/E (x)
Projected ROE (%) Normalized P/E
(x) Projected ROE
(%) Materials Energy
Sika 19.9 17.0 Fugro 6.7 12.0 Sasol 7.6 20.0
Industrials SBM Offshore 7.3 18.0 Ryanair 20.0 16.0 TGS 9.9 20.0 Vopak 19.4 16.0
Materials Consumer Staples BHP 7.6 25.0
Tiger Brands 17.9 25.0 Yara International 11.0 14.0
Health Care Industrials Novartis 19.4 16.0 Boskalis Westminster 11.4 16.0 Straumann 30.9 19.0
Consumer Discretionary Information Technology Honda Motor 9.7 11.0
Hoya 17.7 15.0 Nokian Tyres 12.5 18.0 Keyence 34.3 11.0 Omron 22.5 10.0 Consumer Staples
Tesco 7.9 14.0
Financials Lloyds Banking Group 10.9 12.0
Information Technology SAP 14.9 24.0
Spectris 14.9 17.0
Average 22.4 16.1 10.2 17.0 MSCI EAFE 15.0 11.0 15.0 11.0
MASTER PAGE NO. 188

Exceptional Values, as at December 31, 2014 Sprucegrove U.S. International Pooled Fund
21 It should not be assumed that investments made in the future will be profitable or will equal any results shown here. The information presented as an example of investment technique and should not be construed as representative of investment performance. A list of all securities purchased and sold within the past year together with dates and prices is available upon request. Refer to Performance Footnotes in the appendix for additional details.
Low Price/Book (Less Than 1.0x)
Low Normalized P/E (Less Than 10.0x)
High Dividend Yield (More Than 5%)
MSCI EAFE Index 1.6 MSCI EAFE Index 15.0 MSCI EAFE Index 3.1 Energy Energy Energy
Fugro 0.8 Fugro 6.9 Fugro 8.7 Petrobras 0.3 Petrobras 2.1 Petrobras 6.0
Royal Dutch Shell 7.4 Royal Dutch Shell 5.2 Materials Sasol 7.7 TGS 5.6
Anglo American 0.9 SBM Offshore 7.2 Total 5.6 Hindalco 0.8 TGS 9.7 Impala Platinum 0.9 Total 7.2 Materials POSCO 0.5 BHP 5.1
Materials Industrials Anglo American 6.3 Consumer Discretionary
Jardine Strategic 0.9 BHP 6.4 Nokian 7.1 Ushio 0.8 Hindalco 8.1 TVB 5.7
Impala Platinum 5.4 Financials POSCO 4.3 Consumer Staples
Hongkong Land 0.6 Tesco 6.0 Industrials
Information Technology Jardine Matheson 6.6 Financials Ricoh 0.9 Jardine Strategic 5.7 ANZ Bank 5.5
Sembcorp Industries 9.2 Banco Santander 8.6 HSBC 5.1
Consumer Discretionary National Australia Bank 5.9 Honda Motor 9.2 Komeri 9.8 Information Technology Singapore Press 8.4 Electrocomponents 5.5 Yue Yuen 9.0 Venture Corp. 6.3
Consumer Staples Utilities Tesco 8.1 Snam 6.1
Financials Banco Santander 7.7 Hongkong Land 4.9 HSBC 7.6
Information Technology Ricoh 9.7 Samsung Electronics 7.7
Utilities GAIL 8.7
MASTER PAGE NO. 189

New Holding – Q4 2014 SPECTRIS – U.K.
22 It should not be assumed that investments made in the future will be profitable or will equal any results shown here. The information presented as an example of investment technique and should not be construed as representative of investment performance. A list of all securities purchased and sold within the past year together with dates and prices is available upon request. Refer to Performance Footnotes in the appendix for additional details.
VALUATION (12/31/14) Spectris MSCI U.K. MSCI EAFE Market Cap. $3.9 B. U.S.
Quality Projected Return on Equity (%) 17.0 14.0 11.0 Financial Leverage (X) 1.5 2.4 2.7 Valuation Normalized P/E (X) 17.7 12.9 15.0 Price/Book Value (X) 3.0 1.8 1.6 Dividend Yield (%) 2.1 3.8 3.1
LEADERSHIP POSITION
A leading supplier of high-tech measurement & control instruments (e.g. particle analysis, x-ray analysis, noise monitoring, high-tech thermometers)
RECORD OF HIGH AND CONSISTENT PROFITABILITY
Operating margin has averaged 13% over 10 years ROE has averaged 19% over 10 years
FINANCIAL POSITION Net debt to equity of 12% Interest coverage of 14x GROWTH OPPORTUNITY
New product launches Bolt-on acquisitions Growth in emerging markets
MANAGEMENT
Focused, conservative and dedicated to research and development
MASTER PAGE NO. 190
Sell Discipline
A Security is Sold When:
The Company No Longer Meets Our Quality Criteria
Price Appreciates Above What We Believe Is Reasonable Value
23 MASTER PAGE NO. 191

Recent Reduction – Q4 2014 HOYA – Japan
24 It should not be assumed that investments made in the future will be profitable or will equal any results shown here. The information presented as an example of investment technique and should not be construed as representative of investment performance. A list of all securities purchased and sold within the past year together with dates and prices is available upon request. Refer to Performance Footnotes in the appendix for additional details.
VALUATION (12/31/14) Hoya MSCI Japan MSCI EAFE Market Cap. $14.6 B. U.S.
Quality Projected Return on Equity (%) 15.0 7.0 11.0 Financial Leverage (X) 1.3 2.5 2.7 Valuation Normalized P/E (X) 21.4 20.5 15.0 Price/Book Value (X) 3.2 1.4 1.6 Dividend Yield (%) 1.8 1.7 3.1
LEADERSHIP POSITION
Global leader with a 65% market share of mask blanks which are used in the production of semiconductors A leading supplier of intra-ocular lenses, eye glass lenses and endoscopes Leading eyeglass retailer in Japan
RECORD OF HIGH AND CONSISTENT PROFITABILITY
Operating margin has averaged 21% over 10 years ROE has averaged 17% over 10 years
FINANCIAL POSITION
Net cash equal to 38% of total assets
GROWTH OPPORTUNITY
Growth in more advanced semiconductors, and in health and vision care products
MANAGEMENT
Forward-looking management team with a record of securing a dominant position in niche markets
MASTER PAGE NO. 192

Top 10 Holdings, as at December 31, 2014 Sprucegrove U.S. International Pooled Fund
25 It should not be assumed that investments made in the future will be profitable or will equal any results shown here. The information presented as an example of investment technique and should not be construed as representative of investment performance. Refer to Performance Footnotes in the appendix for additional details.
1 Financial Leverage weighted average excludes companies in the Financials sector.
Stock Country Sector %
of Fund
Normalized P/E
P/B Projected
ROE Financial Leverage1
(x) (x) (%) (x)
Novartis Switzerland Health Care 3.5 20.5 3.3 16.0 1.7
HSBC U.K. Financials 2.7 7.6 1.0 13.0 14.3
Banco Santander Spain Financials 2.6 7.7 1.1 14.0 15.8
Royal Dutch Shell U.K. Energy 2.5 7.4 1.3 18.0 2.0
CRH Ireland Materials 2.5 12.2 1.6 13.0 2.1
United Overseas Bank Singapore Financials 2.4 10.6 1.4 13.0 10.2
China Mobile China Telecom. Services 2.3 10.0 1.8 18.0 1.5
Nestlé Switzerland Consumer Staples 2.2 22.1 4.0 18.0 1.9
Carnival U.K. Consumer Discretionary 2.1 13.6 1.5 11.0 1.6
BMW Germany Consumer Discretionary 2.1 12.4 1.6 13.0 4.1
24.9
Weighted Average 12.6 1.9 14.8 2.1
MSCI EAFE 15.0 1.6 11.0 2.7
MASTER PAGE NO. 193
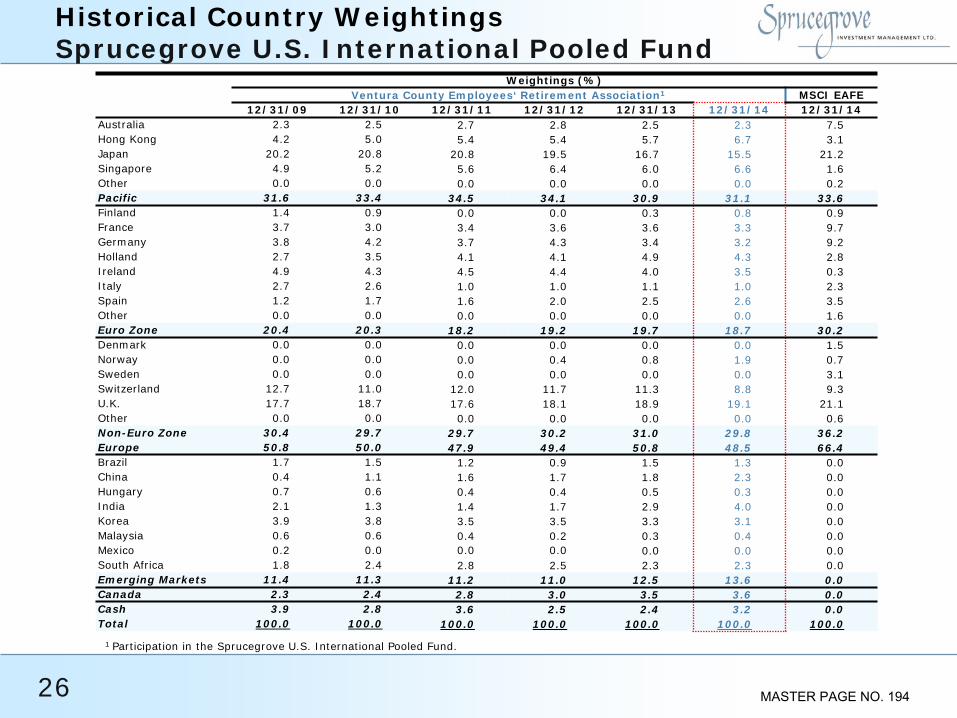
Historical Country Weightings Sprucegrove U.S. International Pooled Fund
26
1 Participation in the Sprucegrove U.S. International Pooled Fund.
Weightings (%) Ventura County Employees‘ Retirement Association1 MSCI EAFE 12/31/09 12/31/10 12/31/11 12/31/12 12/31/13 12/31/14 12/31/14
Australia 2.3 2.5 2.7 2.8 2.5 2.3 7.5 Hong Kong 4.2 5.0 5.4 5.4 5.7 6.7 3.1 Japan 20.2 20.8 20.8 19.5 16.7 15.5 21.2 Singapore 4.9 5.2 5.6 6.4 6.0 6.6 1.6 Other 0.0 0.0 0.0 0.0 0.0 0.0 0.2 Pacific 31.6 33.4 34.5 34.1 30.9 31.1 33.6 Finland 1.4 0.9 0.0 0.0 0.3 0.8 0.9 France 3.7 3.0 3.4 3.6 3.6 3.3 9.7 Germany 3.8 4.2 3.7 4.3 3.4 3.2 9.2 Holland 2.7 3.5 4.1 4.1 4.9 4.3 2.8 Ireland 4.9 4.3 4.5 4.4 4.0 3.5 0.3 Italy 2.7 2.6 1.0 1.0 1.1 1.0 2.3 Spain 1.2 1.7 1.6 2.0 2.5 2.6 3.5 Other 0.0 0.0 0.0 0.0 0.0 0.0 1.6 Euro Zone 20.4 20.3 18.2 19.2 19.7 18.7 30.2 Denmark 0.0 0.0 0.0 0.0 0.0 0.0 1.5 Norway 0.0 0.0 0.0 0.4 0.8 1.9 0.7 Sweden 0.0 0.0 0.0 0.0 0.0 0.0 3.1 Switzerland 12.7 11.0 12.0 11.7 11.3 8.8 9.3 U.K. 17.7 18.7 17.6 18.1 18.9 19.1 21.1 Other 0.0 0.0 0.0 0.0 0.0 0.0 0.6 Non-Euro Zone 30.4 29.7 29.7 30.2 31.0 29.8 36.2 Europe 50.8 50.0 47.9 49.4 50.8 48.5 66.4 Brazil 1.7 1.5 1.2 0.9 1.5 1.3 0.0 China 0.4 1.1 1.6 1.7 1.8 2.3 0.0 Hungary 0.7 0.6 0.4 0.4 0.5 0.3 0.0 India 2.1 1.3 1.4 1.7 2.9 4.0 0.0 Korea 3.9 3.8 3.5 3.5 3.3 3.1 0.0 Malaysia 0.6 0.6 0.4 0.2 0.3 0.4 0.0 Mexico 0.2 0.0 0.0 0.0 0.0 0.0 0.0 South Africa 1.8 2.4 2.8 2.5 2.3 2.3 0.0 Emerging Markets 11.4 11.3 11.2 11.0 12.5 13.6 0.0 Canada 2.3 2.4 2.8 3.0 3.5 3.6 0.0 Cash 3.9 2.8 3.6 2.5 2.4 3.2 0.0 Total 100.0 100.0 100.0 100.0 100.0 100.0 100.0
MASTER PAGE NO. 194

Summary
Sprucegrove’s approach remains bottom-up, with a focus on quality and value.
The Fund is different than the benchmark with respect to its exposures and weightings of securities, sectors and countries.
Sprucegrove remains consistent in terms of our people, philosophy and process.
27 MASTER PAGE NO. 195

Appendices
28 MASTER PAGE NO. 196
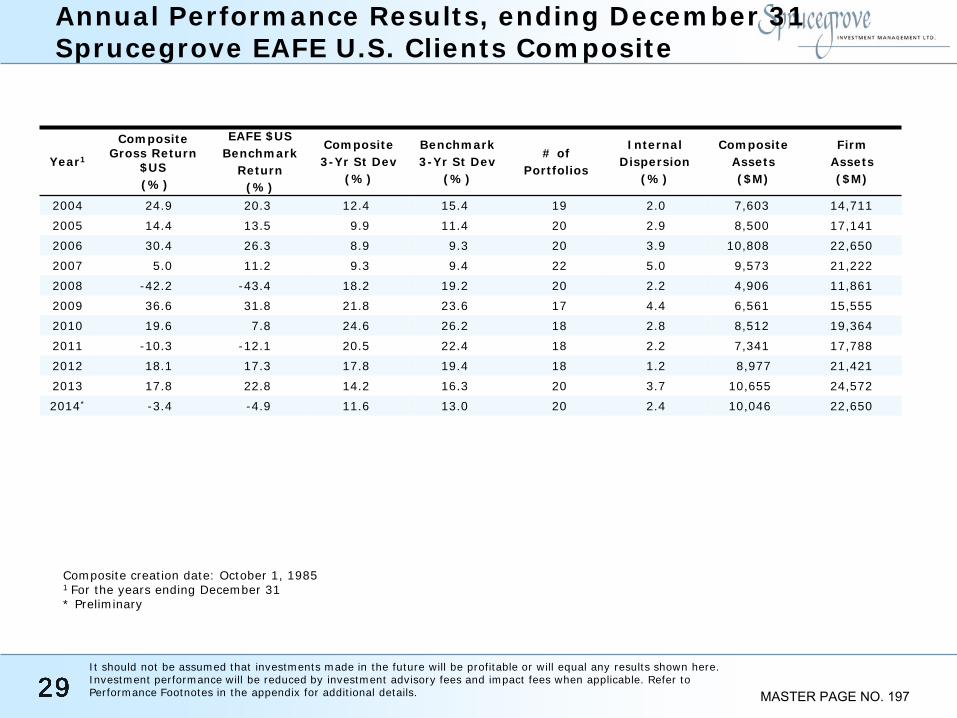
29
29
29
29
29
29
29
29
Annual Performance Results, ending December 31 Sprucegrove EAFE U.S. Clients Composite
Composite creation date: October 1, 1985 1 For the years ending December 31 * Preliminary
29 It should not be assumed that investments made in the future will be profitable or will equal any results shown here. Investment performance will be reduced by investment advisory fees and impact fees when applicable. Refer to Performance Footnotes in the appendix for additional details.
Year1
Composite Gross Return
$US (%)
EAFE $US Benchmark
Return (%)
Composite 3-Yr St Dev
(%)
Benchmark 3-Yr St Dev
(%)
# of Portfolios
Internal Dispersion
(%)
Composite Assets ($M)
Firm Assets ($M)
2004 24.9 20.3 12.4 15.4 19 2.0 7,603 14,711 2005 14.4 13.5 9.9 11.4 20 2.9 8,500 17,141 2006 30.4 26.3 8.9 9.3 20 3.9 10,808 22,650 2007 5.0 11.2 9.3 9.4 22 5.0 9,573 21,222 2008 -42.2 -43.4 18.2 19.2 20 2.2 4,906 11,861 2009 36.6 31.8 21.8 23.6 17 4.4 6,561 15,555 2010 19.6 7.8 24.6 26.2 18 2.8 8,512 19,364 2011 -10.3 -12.1 20.5 22.4 18 2.2 7,341 17,788 2012 18.1 17.3 17.8 19.4 18 1.2 8,977 21,421 2013 17.8 22.8 14.2 16.3 20 3.7 10,655 24,572 2014* -3.4 -4.9 11.6 13.0 20 2.4 10,046 22,650
MASTER PAGE NO. 197
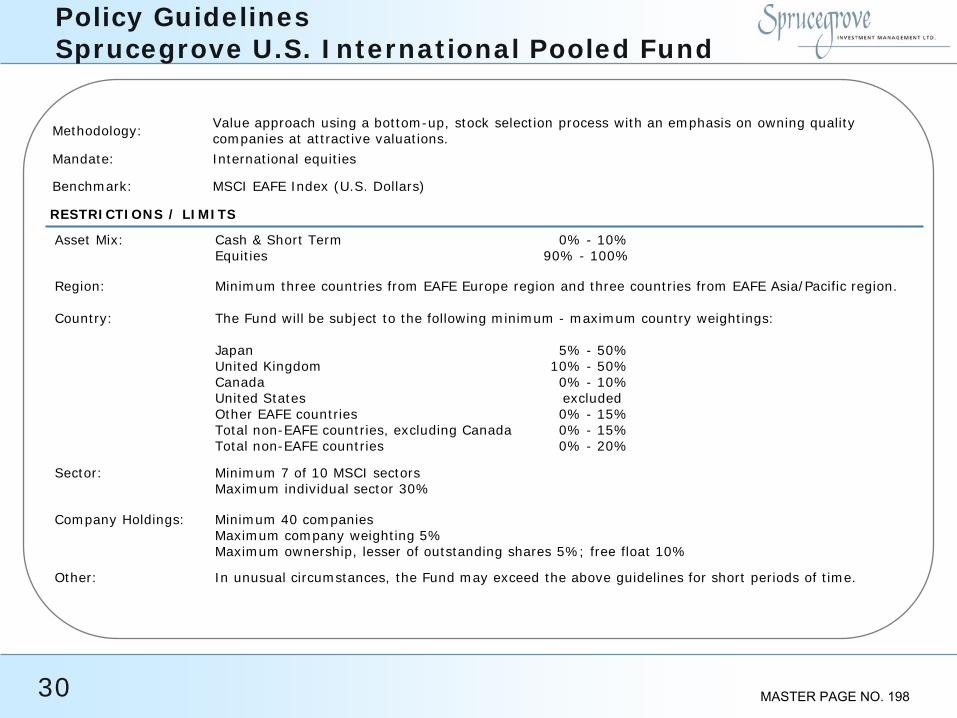
Policy Guidelines Sprucegrove U.S. International Pooled Fund
Methodology: Value approach using a bottom-up, stock selection process with an emphasis on owning quality companies at attractive valuations.
Mandate: International equities
Benchmark: MSCI EAFE Index (U.S. Dollars)
RESTRICTIONS / LIMITS
Asset Mix: Cash & Short Term 0% - 10% Equities 90% - 100%
Region: Minimum three countries from EAFE Europe region and three countries from EAFE Asia/Pacific region.
Country: The Fund will be subject to the following minimum - maximum country weightings: Japan 5% - 50% United Kingdom 10% - 50% Canada 0% - 10% United States excluded Other EAFE countries 0% - 15% Total non-EAFE countries, excluding Canada 0% - 15% Total non-EAFE countries 0% - 20%
Sector: Minimum 7 of 10 MSCI sectors Maximum individual sector 30%
Company Holdings: Minimum 40 companies Maximum company weighting 5% Maximum ownership, lesser of outstanding shares 5%; free float 10%
Other: In unusual circumstances, the Fund may exceed the above guidelines for short periods of time.
30 MASTER PAGE NO. 198
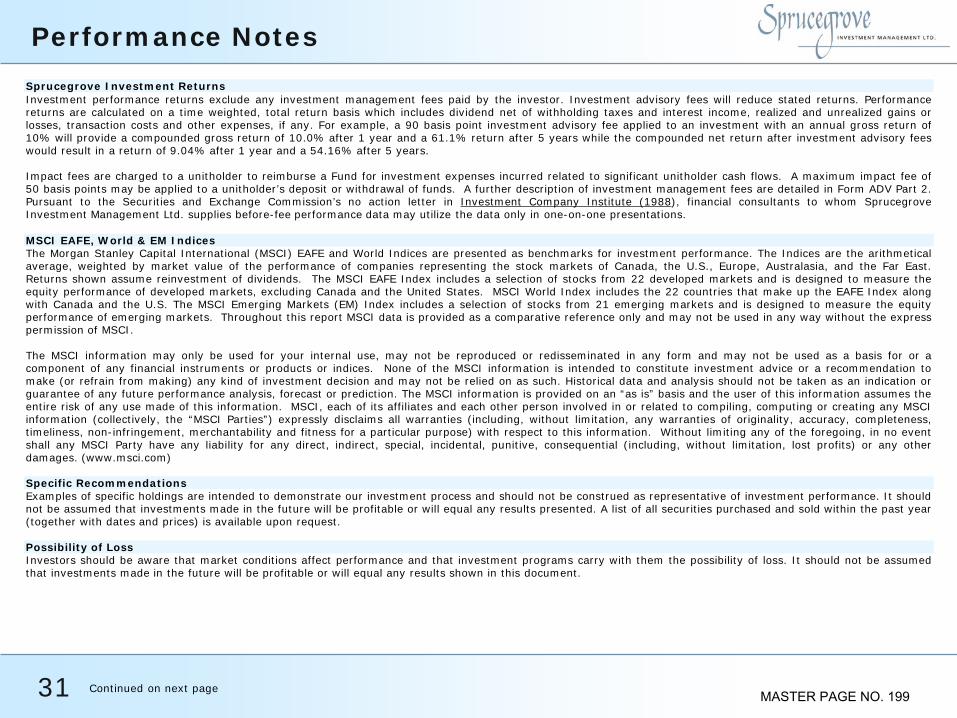
Performance Notes
31 Continued on next page
Sprucegrove Investment Returns Investment performance returns exclude any investment management fees paid by the investor. Investment advisory fees will reduce stated returns. Performance returns are calculated on a time weighted, total return basis which includes dividend net of withholding taxes and interest income, realized and unrealized gains or losses, transaction costs and other expenses, if any. For example, a 90 basis point investment advisory fee applied to an investment with an annual gross return of 10% will provide a compounded gross return of 10.0% after 1 year and a 61.1% return after 5 years while the compounded net return after investment advisory fees would result in a return of 9.04% after 1 year and a 54.16% after 5 years. Impact fees are charged to a unitholder to reimburse a Fund for investment expenses incurred related to significant unitholder cash flows. A maximum impact fee of 50 basis points may be applied to a unitholder’s deposit or withdrawal of funds. A further description of investment management fees are detailed in Form ADV Part 2. Pursuant to the Securities and Exchange Commission’s no action letter in Investment Company Institute (1988), financial consultants to whom Sprucegrove Investment Management Ltd. supplies before-fee performance data may utilize the data only in one-on-one presentations. MSCI EAFE, World & EM Indices The Morgan Stanley Capital International (MSCI) EAFE and World Indices are presented as benchmarks for investment performance. The Indices are the arithmetical average, weighted by market value of the performance of companies representing the stock markets of Canada, the U.S., Europe, Australasia, and the Far East. Returns shown assume reinvestment of dividends. The MSCI EAFE Index includes a selection of stocks from 22 developed markets and is designed to measure the equity performance of developed markets, excluding Canada and the United States. MSCI World Index includes the 22 countries that make up the EAFE Index along with Canada and the U.S. The MSCI Emerging Markets (EM) Index includes a selection of stocks from 21 emerging markets and is designed to measure the equity performance of emerging markets. Throughout this report MSCI data is provided as a comparative reference only and may not be used in any way without the express permission of MSCI. The MSCI information may only be used for your internal use, may not be reproduced or redisseminated in any form and may not be used as a basis for or a component of any financial instruments or products or indices. None of the MSCI information is intended to constitute investment advice or a recommendation to make (or refrain from making) any kind of investment decision and may not be relied on as such. Historical data and analysis should not be taken as an indication or guarantee of any future performance analysis, forecast or prediction. The MSCI information is provided on an “as is” basis and the user of this information assumes the entire risk of any use made of this information. MSCI, each of its affiliates and each other person involved in or related to compiling, computing or creating any MSCI information (collectively, the “MSCI Parties”) expressly disclaims all warranties (including, without limitation, any warranties of originality, accuracy, completeness, timeliness, non-infringement, merchantability and fitness for a particular purpose) with respect to this information. Without limiting any of the foregoing, in no event shall any MSCI Party have any liability for any direct, indirect, special, incidental, punitive, consequential (including, without limitation, lost profits) or any other damages. (www.msci.com) Specific Recommendations Examples of specific holdings are intended to demonstrate our investment process and should not be construed as representative of investment performance. It should not be assumed that investments made in the future will be profitable or will equal any results presented. A list of all securities purchased and sold within the past year (together with dates and prices) is available upon request. Possibility of Loss Investors should be aware that market conditions affect performance and that investment programs carry with them the possibility of loss. It should not be assumed that investments made in the future will be profitable or will equal any results shown in this document.
MASTER PAGE NO. 199

32
GIPS Compliance Notes Sprucegrove Investment Management Ltd. (Sprucegrove) claims compliance with the Global Investment Performance Standards (GIPS®). Sprucegrove has been independently verified for the periods May 1, 1985 to December 31, 2013. The composites have been examined for the periods May 1, 1985 to December 31, 2013.
Definition of the Firm Sprucegrove is registered in most provinces in Canada as Investment Fund Manager and Portfolio Manager and with the SEC as an Investment Advisor. It manages fully discretionary accounts for fee paying clients. All portfolios with a market value greater than $15 million are included in a composite.
Composite and Benchmark Definition Composites and their corresponding benchmarks are determined by equity mandate (EAFE, Global or U.S.) and by the country in which the respective account is domiciled (Canada or the United States). The following is a list of the composites and their benchmarks:
Composite Inception Date of Composite Benchmark EAFE - Canadian Clients Composite May 1985 MSCI EAFE Net Index - CAD Global - Canadian Clients Composite July 1992 MSCI World Net Index - CAD U.S. Equities - Canadian Clients Composite November 2001 S&P 500 Net Index - CAD EAFE - U.S. Clients Composite October 1985 MSCI EAFE Net Index – USD Global - U.S. Clients Composite October 2010 MSCI World Net Index – USD
Fee Schedules The following are the standard fee schedules based on the market value of assets managed.
Pooled Fund Accounts Separate Fund Accounts Assets Managed Rate Assets Managed Rate
First 5,000,000.00 0.90% First 25,000,000.00 0.70% Next 10,000,000.00 0.65% Next 25,000,000.00 0.60% Next 25,000,000.00 0.55% Next 25,000,000.00 0.50% Next 35,000,000.00 0.50% Next 225,000,000.00 0.25% Next 225,000,000.00 0.25% Balance 0.20% Balance 0.20%
Composite Dispersion Composite dispersion is calculated as the difference in percentage in performance between the highest and lowest performing portfolios in the composite.
Policies Sprucegrove’s policies for valuing portfolios, calculating performance and preparing compliant presentations are available upon request.
Withholding Taxes Composite and benchmark returns are stated net of withholding taxes on dividends.
Past Performance Prior to Sprucegrove commencing operations in 1993, the Sprucegrove team managed two EAFE portfolios at Confederation Life Insurance, from their inception in 1985, until the portfolios were acquired by Sprucegrove in 1994. Accordingly the performance of these portfolios are linked to their continuation at Sprucegrove as follows: The EAFE Canadian Clients composite includes the performance of the Confederation Life International Pooled Fund from 1985 to 1994; The EAFE U.S. Clients composite includes the performance of the Confederation Life American International Pooled Fund from 1985 to 1994. Prior to December 31, 2011, the name of each composite included the term “Pooled and Separate Accounts Combined.” This term was removed from the composite names as of December 31, 2011.
Further Information To obtain a presentation that complies with GIPS requirements, and/or a list of composite description, please contact your client service representative.
Performance Notes continued
MASTER PAGE NO. 200

For more information please contact: Mark Shevitz, Fair Haven Partners, L.L.C. [email protected] 805.687.7970
Ed Caffrey, Fair Haven Partners, L.L.C. [email protected] 203.622.4820
Scott Caffrey, Fair Haven Partners, L.L.C. [email protected] 203.542.0802
Tasleem Jamal, Vice President, Marketing & Client Services [email protected] 416.363.5854 ext.487
Brad Haughey, Vice President, Marketing & Client Services [email protected] 416.363.5854 ext.226
Sebastien Roy, Vice President, Marketing & Client Services [email protected] 416.363.5854 ext.225
33 MASTER PAGE NO. 201

VENTURA COUNTY EMPLOYEES' RETIREMENT ASSOCIATIONCurrency Hedging Program
This material has bee prepared for the exclusive use of Ventura County Employees’ Retirement Association in a one-on-one presentation only. MASTER PAGE NO. 202

2
This material has bee prepared for the exclusive use of Ventura County Employees’ Retirement Association in a one-on-one presentation only.
VCERA – Currency Hedging Program
Currency Hedging Mechanics 3
Risks 13
Appendices 15
TABLE OF CONTENTS
MASTER PAGE NO. 203

3
This material has bee prepared for the exclusive use of Ventura County Employees’ Retirement Association in a one-on-one presentation only.
CURRENCY HEDGING MECHANICS
MASTER PAGE NO. 204

4
This material has bee prepared for the exclusive use of Ventura County Employees’ Retirement Association in a one-on-one presentation only.
VCERA – Currency Hedging Program
POTENTIAL CURRENCY OVERLAY APPLICATIONS
1 “Global Currency Hedging: What Role Should Foreign Currency Play in a Diversified Investment Portfolio,” Campbell and Olshan, 2010
Overlay Applications
• Excess/lack of foreign currency exposure
• “Reserve Currency” hedge position1
• Defensive action (e.g. European debt problems)
• Cross currency preference (e.g. emerging vs. developed)
Managing Currency via Overlay
• Purchase/sale of futures or forwards contracts to add or remove foreign currency exposure
• Capital Efficient: Transaction may require no/minimal initial funding
• Profit/losses are accrued over the term of the contract and settled at expiration (forwards) or cash settled via mark-to-market process each day (futures)
MASTER PAGE NO. 205

5
This material has bee prepared for the exclusive use of Ventura County Employees’ Retirement Association in a one-on-one presentation only.
VCERA – Currency Hedging Program
PROCESS: CONSTRUCTION
The following items are considered when building currency portfolios:
• Investment Selection: the process of evaluating the appropriate instruments to minimize tracking error while controlling trading costs.
• Maturity Selection: customized maturity selection based on client needs, constraints, and market liquidity.
• Evaluation: ongoing evaluation of instruments and exposures as appropriate.
• Exchange-traded Currency Futures: are available for most developed market currencies (i.e. MSCI EAFE Constituents).
• Currency Forwards: are needed to manage less-liquid developed market and nearly all emerging market currency exposure.
Instrument selection, maturity selection, and exposure management can contribute to low cost and tight tracking error versus a benchmark
MASTER PAGE NO. 206

6
This material has bee prepared for the exclusive use of Ventura County Employees’ Retirement Association in a one-on-one presentation only.
VCERA – Currency Hedging Program
STEPS TO ESTABLISH CURRENCY HEDGING PROGRAM
VCERA is establishing a currency hedging program which seeks to hedge 50% of the developed foreign currency exposure embedded in the International Equity and Global Equity asset classes.
• The current cash overlay program managed by Parametric Minneapolis allows the efficient and quick implementation of a futures based currency hedging program.
Items to be completed to initiate a currency hedging program:
1. Parametric will create the updated overlay guidelines.
2. VCERA will need to sign the updated guidelines.
3. VCERA will need to open a new custodial account if separate performance measurement is required.
4. Parametric will need to open new futures account if separate performance measurement is required.
5. Cash to support the currency hedge program will need to be deposited in the newly established custodial account.
MASTER PAGE NO. 207
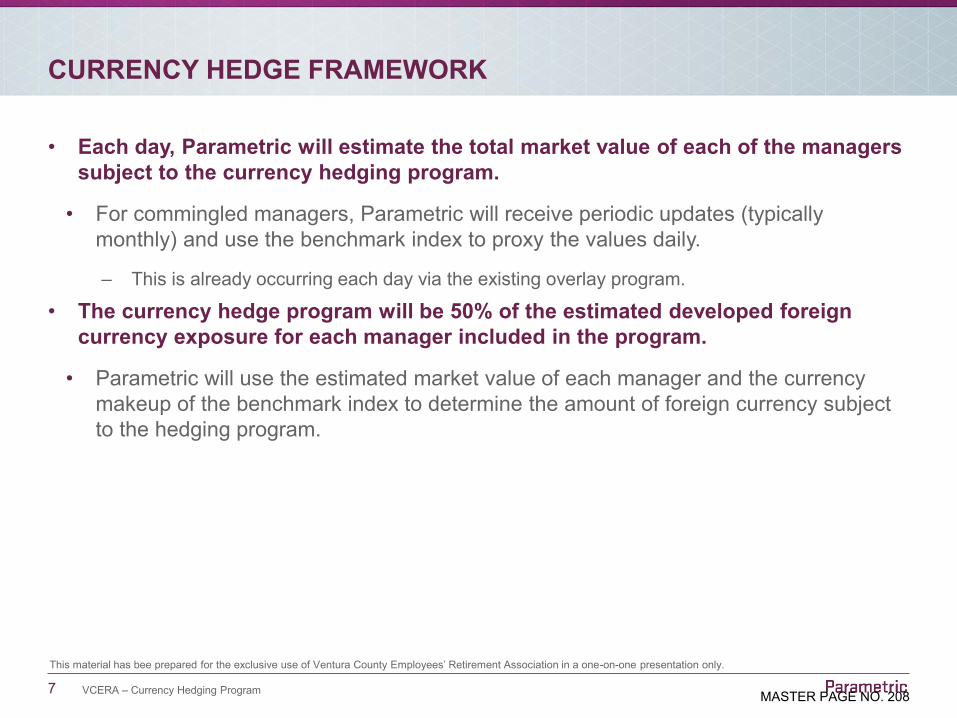
7
This material has bee prepared for the exclusive use of Ventura County Employees’ Retirement Association in a one-on-one presentation only.
VCERA – Currency Hedging Program
CURRENCY HEDGE FRAMEWORK
• Each day, Parametric will estimate the total market value of each of the managers subject to the currency hedging program.
• For commingled managers, Parametric will receive periodic updates (typically monthly) and use the benchmark index to proxy the values daily.
‒ This is already occurring each day via the existing overlay program.
• The currency hedge program will be 50% of the estimated developed foreign currency exposure for each manager included in the program.
• Parametric will use the estimated market value of each manager and the currency makeup of the benchmark index to determine the amount of foreign currency subject to the hedging program.
MASTER PAGE NO. 208

8
This material has bee prepared for the exclusive use of Ventura County Employees’ Retirement Association in a one-on-one presentation only.
VCERA – Currency Hedging Program
CURRENCY HEDGE FRAMEWORK
Managers included in the currency hedging program:
*Hexavest is excluded from the currency hedging program.
International Equity*
Manager Benchmark Total Estimated Equity Market Value (as of 3/20/15)
Total Estimated DevelopedForeign Currency Exposure
(as of 3/20/2015)
BlackRock ACWI ex U.S. MSCI ACWI ex U.S. $261.1mm $205.5mm
Sprucegrove MSCI ACWI ex U.S. $183.9mm $144.7mm
Walter Scott MSCI ACWI ex U.S. $95.6mm $75.2mm
Parametric Overlay MSCI ACWI ex U.S. $18.0mm $14.2mm
Global Equity
Manager Benchmark Total Estimated Equity Market Value (as of 3/20/15)
Total Estimated DevelopedForeign Currency Exposure
(as of 3/20/2015)
BlackRock ACWI MSCI ACWI $231.1mm $88.1mm
GMO Global MSCI ACWI $216.1mm $82.3mm
Parametric Overlay MSCI ACWI $5.8mm $2.2mm
Total Estimated Developed Foreign Currency Exposure $612.2mm
50% Currency Hedge Target $306.2mm
MASTER PAGE NO. 209
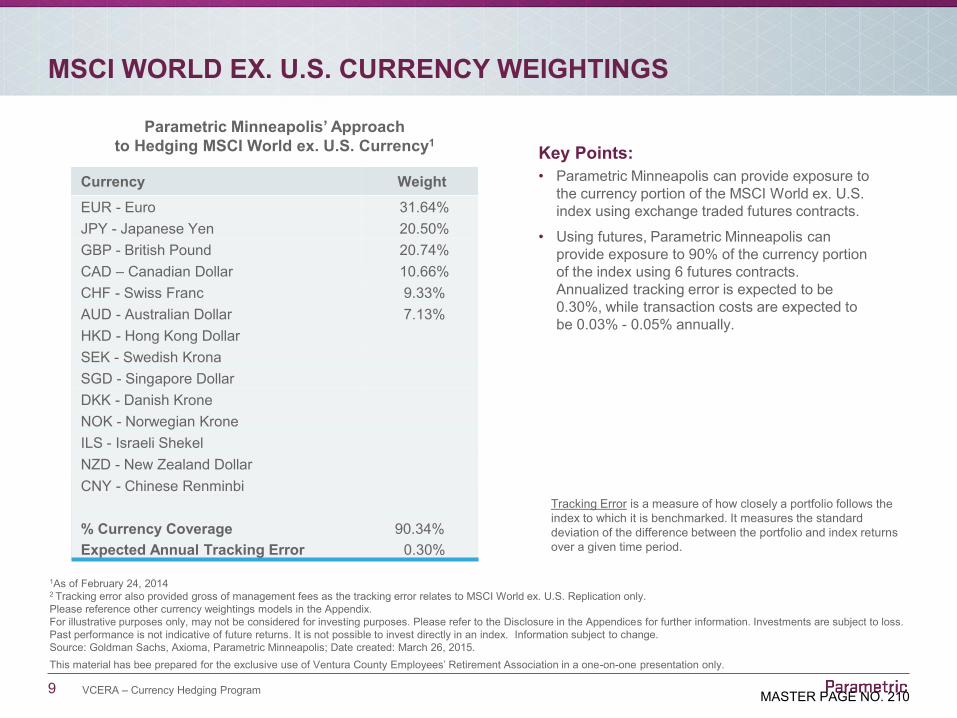
9
This material has bee prepared for the exclusive use of Ventura County Employees’ Retirement Association in a one-on-one presentation only.
VCERA – Currency Hedging Program
MSCI WORLD EX. U.S. CURRENCY WEIGHTINGS
1As of February 24, 20142 Tracking error also provided gross of management fees as the tracking error relates to MSCI World ex. U.S. Replication only. Please reference other currency weightings models in the Appendix.For illustrative purposes only, may not be considered for investing purposes. Please refer to the Disclosure in the Appendices for further information. Investments are subject to loss. Past performance is not indicative of future returns. It is not possible to invest directly in an index. Information subject to change. Source: Goldman Sachs, Axioma, Parametric Minneapolis; Date created: March 26, 2015.
Parametric Minneapolis’ Approach to Hedging MSCI World ex. U.S. Currency1
Currency Weight
EUR - Euro 31.64%JPY - Japanese Yen 20.50%GBP - British Pound 20.74%CAD – Canadian Dollar 10.66%CHF - Swiss Franc 9.33%AUD - Australian Dollar 7.13%HKD - Hong Kong DollarSEK - Swedish KronaSGD - Singapore DollarDKK - Danish KroneNOK - Norwegian KroneILS - Israeli ShekelNZD - New Zealand DollarCNY - Chinese Renminbi
% Currency Coverage 90.34%Expected Annual Tracking Error 0.30%
Key Points:• Parametric Minneapolis can provide exposure to
the currency portion of the MSCI World ex. U.S. index using exchange traded futures contracts.
• Using futures, Parametric Minneapolis can provide exposure to 90% of the currency portion of the index using 6 futures contracts. Annualized tracking error is expected to be 0.30%, while transaction costs are expected to be 0.03% - 0.05% annually.
Tracking Error is a measure of how closely a portfolio follows the index to which it is benchmarked. It measures the standard deviation of the difference between the portfolio and index returns over a given time period.
MASTER PAGE NO. 210
10
This material has bee prepared for the exclusive use of Ventura County Employees’ Retirement Association in a one-on-one presentation only.
VCERA – Currency Hedging Program
CURRENCY HEDGE – MARGIN REQUIREMENTS
Margin Requirements
• In order to support the currency futures positions, cash will be needed in the newly established custodial account.
‒ Based on a currency hedge target of $306.2 mm, approximately $31mm of cash will be needed.
• It may be possible to use a portion of the cash in the existing overlay account to satisfy the currency hedge margin needs.
• All cash, including the gain/loss in the currency hedge account, will be deployed to the capital markets via the existing overlay program. Therefore, no cash drag is introduced as a result of the implementing the currency hedging program.
MASTER PAGE NO. 211
11
This material has bee prepared for the exclusive use of Ventura County Employees’ Retirement Association in a one-on-one presentation only.
VCERA – Currency Hedging Program
CURRENCY HEDGE – COSTS AND FEES
Costs and Fees
• Estimated annual transaction costs for a developed currency hedge are expected to be 0.03% - 0.05%.
• The currency hedging program assets will be grouped with the existing overlay assets. This total value will be applied to the current fee schedule in place:
‒ First $25mm at 0.15%‒ Next $75mm at 0.10%‒ Above $100mm at 0.04%
• The average overlay balance in 2014 totaled approximately $120mm.
‒ Therefore, assuming the existing overlay totals at least $100mm, the currency hedge will be billed at 0.04%.
‒ Based on a hedge target of $306.2mm, the estimated incremental fee totals approximately $122k.
MASTER PAGE NO. 212
12
This material has bee prepared for the exclusive use of Ventura County Employees’ Retirement Association in a one-on-one presentation only.
VCERA – Currency Hedging Program
WHY PARAMETRIC MINNEAPOLIS?
EXPERTISE FLEXIBILITY PEOPLE PROCESSWith nearly 29 years of exposure management experience, Parametric Minneapolis has developed the investment management, back office, and accounting expertise that we believe exceeds client expectations.
Unique risk management capabilities, utilizing a universe of both physical and derivative instruments with daily transparency.
Parametric Minneapolis’ people are smart, dedicated, focused and hard-working. They truly want to do the right thing for Parametric Minneapolis clients.
Parametric Minneapolis has developed proprietary methodology which provides an efficient and controlled means for managing clients’ unique needs in a transparent manner. Detailed exposure positions, up to and including fund-wide reporting are compiled and delivered daily.
Parametric Minneapolis strives to provide custom strategies and is uniquely qualified as an Investment Risk Manager.
MASTER PAGE NO. 213

13
This material has bee prepared for the exclusive use of Ventura County Employees’ Retirement Association in a one-on-one presentation only.
RISKS
MASTER PAGE NO. 214
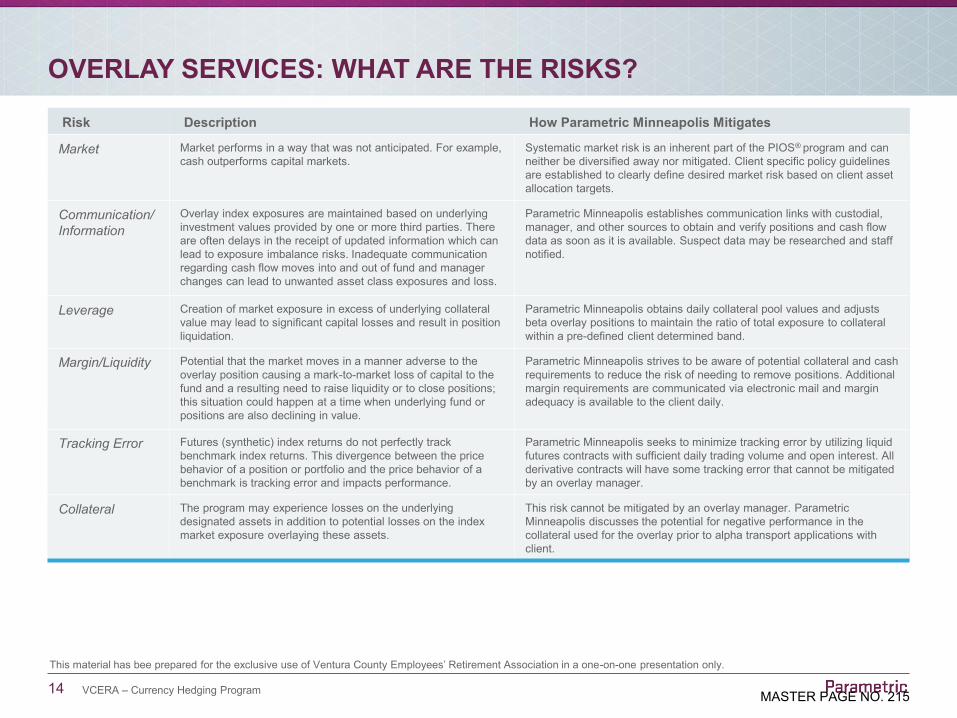
14
This material has bee prepared for the exclusive use of Ventura County Employees’ Retirement Association in a one-on-one presentation only.
VCERA – Currency Hedging Program
OVERLAY SERVICES: WHAT ARE THE RISKS?
Risk Description How Parametric Minneapolis Mitigates
Market Market performs in a way that was not anticipated. For example, cash outperforms capital markets.
Systematic market risk is an inherent part of the PIOS® program and can neither be diversified away nor mitigated. Client specific policy guidelines are established to clearly define desired market risk based on client asset allocation targets.
Communication/Information
Overlay index exposures are maintained based on underlying investment values provided by one or more third parties. There are often delays in the receipt of updated information which can lead to exposure imbalance risks. Inadequate communication regarding cash flow moves into and out of fund and manager changes can lead to unwanted asset class exposures and loss.
Parametric Minneapolis establishes communication links with custodial, manager, and other sources to obtain and verify positions and cash flow data as soon as it is available. Suspect data may be researched and staff notified.
Leverage Creation of market exposure in excess of underlying collateral value may lead to significant capital losses and result in position liquidation.
Parametric Minneapolis obtains daily collateral pool values and adjusts beta overlay positions to maintain the ratio of total exposure to collateral within a pre-defined client determined band.
Margin/Liquidity Potential that the market moves in a manner adverse to the overlay position causing a mark-to-market loss of capital to the fund and a resulting need to raise liquidity or to close positions; this situation could happen at a time when underlying fund or positions are also declining in value.
Parametric Minneapolis strives to be aware of potential collateral and cash requirements to reduce the risk of needing to remove positions. Additional margin requirements are communicated via electronic mail and margin adequacy is available to the client daily.
Tracking Error Futures (synthetic) index returns do not perfectly track benchmark index returns. This divergence between the price behavior of a position or portfolio and the price behavior of a benchmark is tracking error and impacts performance.
Parametric Minneapolis seeks to minimize tracking error by utilizing liquid futures contracts with sufficient daily trading volume and open interest. All derivative contracts will have some tracking error that cannot be mitigated by an overlay manager.
Collateral The program may experience losses on the underlying designated assets in addition to potential losses on the index market exposure overlaying these assets.
This risk cannot be mitigated by an overlay manager. Parametric Minneapolis discusses the potential for negative performance in the collateral used for the overlay prior to alpha transport applications with client.
MASTER PAGE NO. 215

15
This material has bee prepared for the exclusive use of Ventura County Employees’ Retirement Association in a one-on-one presentation only.
APPENDICES
MASTER PAGE NO. 216

16
This material has bee prepared for the exclusive use of Ventura County Employees’ Retirement Association in a one-on-one presentation only.
VCERA – Currency Hedging Program
OUR CURRENCY EXPERIENCE
Note: For overlay services programs, the absolute value of futures and swap based synthetic index exposure is included as assets under management. For Enhancement/Risk Control programs, the notional hedge target value of the options positions held for clients is included in assets under management. Currency exposure reflected in USD. Foreign Currency converted back to USD on date referenced above. For illustrative purposes. Information subject to change. Investors cannot invest directly in an index. Source: Parametric Minneapolis Date created: February 2, 2015.
Currency Exposure Strategy Assets Under Management – 12/31/14
In addition to the above, Parametric Minneapolis runs additional currency exposure linked to international equity/fixed income benchmarks.
Client Currency Exposure Strategy/Index Objective Corporation 191,507,180$ Custom HedgingCorporation 133,540,551$ Custom HedgingEndowment 529,180,939$ Custom Tactical TiltingEndowment 18,765,850$ Single Currency HedgingEndowment 108,906,015$ MSCI EAFE HedgingEndowment 120,837,367$ Custom HedgingEndowment 429,725,933$ Custom Tactical Tilting/HedgingGovernment (Public) 206,676,375$ EAFE/ACWI ex US HedgingGovernment (Public) 32,665,463$ Single Currency HedgingGovernment (Public) 218,985,363$ Single Currency HedgingSub-Advised (Other Managers) 327,979$ Custom HedgingSub-Advised (Other Managers) 18,614,513$ Single Currency HedgingUnion (Taft-Hartley) 26,784,620$ MSCI EAFE Hedging
Total: 2,036,518,146$
MASTER PAGE NO. 217

17
This material has bee prepared for the exclusive use of Ventura County Employees’ Retirement Association in a one-on-one presentation only.
VCERA – Currency Hedging Program
LIQUID CURRENCY FUTURES1
1 As of December 31, 20142 Other contracts exist but are not deemed to be viable/cost effective at this time.For illustrative purposes only. Information may change without notice. Source: Bloomberg; Date created: January 15, 2015.
The Universe above is utilized by Parametric Minneapolis and is available through the exchange-traded market.
Liquid Futures Universe2
(Billions $)
Total Open Interest: $130.2 Billion
Euro Currency,
$60.1
British Pound, $15.2
Japanese Yen, $24
Swiss Franc, $7.9
Australian Dollar, $9.8
Canadian Dollar, $8.7
Mexican Peso, $4.4
MASTER PAGE NO. 218

18
This material has bee prepared for the exclusive use of Ventura County Employees’ Retirement Association in a one-on-one presentation only.
VCERA – Currency Hedging Program
BIOGRAPHIES: PARAMETRIC MINNEAPOLIS INVESTMENT CENTER
Orison “Kip” Chaffee, CFA Managing PrincipalMr. Chaffee joined Parametric in 2008* as Managing Principal. His responsibilities include formulating strategic direction and day-to-day management of the Minneapolis Investment Center. Kip has held a number of executive positions within the financial services industry including VP of Corporate Strategy and Development for Ameriprise Financial Services and President and COO of Hantz Financial Services. Kip earned his BS in Economics from Harvard University and an MBA with a finance concentration from The Wharton School of Business. He is a CFA charterholder and a member of the CFA Society of Minnesota.
Jack Hansen, CFAChief Investment Officer Mr. Hansen joined Parametric in 1985*. As Chief Investment Officer, his responsibilities include the management of investment operations and portfolio management. Jack has managed futures, swaps, options, and other derivative based programs since 1986. Jack earned a BS degree in finance and economics from Marquette University and a MS in finance from the University of Wisconsin, Madison. He is a CFA charterholder and member of the CFA Society of Minnesota. Jack writes and lectures on the use of derivatives in portfolio management.
Thomas Lee, CFAManaging Director - Investment Strategy and ResearchMr. Lee joined Parametric in 1994*. Tom is currently responsible for managing a team that oversees all of the Parametric Minneapolis Investment Center’s investment strategies. In his current position, he chairs the Investment Committee that has oversight responsibility of all the Parametric Minneapolis Investment Center's investment strategies and leads the research efforts that support all existing and new strategies. He was instrumental in the creation and development of the firm’s implementation service. Tom took the lead developing customized solutions for many of the firm’s clients. The solutions ranged from custom liability driven mandates to creation of fund wide risk balanced allocations. Tom has co-authored articles on topics ranging from liability driven investments to risk parity. Prior to joining Parametric, he spent two years working for the Federal Reserve in Washington, D.C. In this position, he gained experience in modeling and forecasting interest rates and related monetary variables. Tom earned a BS in economics and an MBA in finance from the University of Minnesota. He is a CFA charterholder and a member of the CFA Society of Minnesota.
Justin Henne, CFAManaging Director – Customized Exposure ManagementMr. Henne joined Parametric in 2004*. Justin leads the investment team responsible for the implementation and enhancement of Parametric’s Customized Exposure Management product. Justin has extensive experience trading a wide variety of derivative instruments in order to meet each client’s unique exposure and risk management objectives. He continues to have responsibility to design, trade, and manage overlay programs. Justin holds a BA in Financial Management from the University of St. Thomas. He is a CFA charterholder and a member of the CFA Society of Minnesota.
*Reflects the year employee was hired by The Clifton Group, which was acquired by Parametric Portfolio Associates LLC on December 31, 2012.
MASTER PAGE NO. 219
19
This material has bee prepared for the exclusive use of Ventura County Employees’ Retirement Association in a one-on-one presentation only.
VCERA – Currency Hedging Program
BIOGRAPHIES: PARAMETRIC MINNEAPOLIS INVESTMENT CENTER
Jay Strohmaier, CFASenior Portfolio ManagerMr. Strohmaier returned to Parametric in 2009*. Jay has extensive experience with futures and options-based strategies and has been active in the investment industry since 1984. As a Sr. Portfolio Manager, Jay leads a team of investment professionals responsible for designing, trading and managing overlay portfolios with an emphasis on Defensive Equity, hedging, and other asymmetric strategies. Prior to rejoining Parametric, Jay worked for Cargill, Peregrine Capital Management, and Advantus Capital Management where his responsibilities included research, portfolio management, trading, marketing, and client service. He holds a BS degree in Agricultural Economics from Washington State University and MS in Applied Economics from the University of Minnesota. He is a CFA charterholder and a member of the CFA Society of Minnesota.
Daniel Wamre, CFASenior Portfolio ManagerMr. Wamre joined Parametric in 1995* working part-time in the company’s internship program and started full-time in 1998. As Senior Portfolio Manager, he is responsible for leading a team of investment professionals responsible for designing, trading, and managing overlay portfolios. Dan has extensive experience helping clients and consultants manage portfolio exposures and risk through futures and options-based strategies. Dan earned a BS from North Dakota State University and an MBA in finance from the University of Minnesota. Prior to joining Parametric, Dan spent four years as a Platoon Commander/Executive Officer in the United States Marine Corps. Upon completion of graduate school, Dan spent ten months working as a commercial banking credit analyst for U.S. Bank in Minneapolis. He is a CFA charterholder and a member of the CFA Society of Minnesota.
Amanda Barhite Carter, CFAPortfolio ManagerMs. Barhite Carter joined Parametric in 2004* as the Project Manager. In that role, she coordinated over-the-counter documentation, served as the Dodd-Frank implementation manager, and led the Risk Management Committee. In 2013, she was promoted to Portfolio Manager where she works primarily on overlay programs used to meet client risk management needs. Prior to joining Parametric, Amanda was a Senior Consultant with Global Markets Consultants Ltd. training investment banking clients in the areas of derivatives and capital markets. Previously, Amanda worked at JP Morgan as a Vice President in Global Derivatives Sales and Trading where she executed over-the-counter transactions for institutional clients. Amanda has a BA in Economics from Yale and an MBA with a concentration in Finance from Wharton. She is a CFA charterholder and a member of the CFA Society of Minnesota.
Richard Fong, CFA Portfolio Manager Mr. Fong joined Parametric in 2010* as an Investment Analyst, and in 2014 he was promoted to Portfolio Manager. His current responsibilities include designing, trading, and managing overlay portfolios. He also has experience with LDI and options-based risk management solutions. Mr. Fong holds a BA in Financial Economics from Gustavus Adolphus College. He is a CFA charterholder and a member of the CFA Society of Minnesota.
*Reflects the year employee was hired by The Clifton Group, which was acquired by Parametric Portfolio Associates LLC on December 31, 2012.
MASTER PAGE NO. 220

20
This material has bee prepared for the exclusive use of Ventura County Employees’ Retirement Association in a one-on-one presentation only.
VCERA – Currency Hedging Program
BIOGRAPHIES: PARAMETRIC MINNEAPOLIS INVESTMENT CENTER
Alex Gomelsky, CFAPortfolio ManagerMr. Gomelsky joined Parametric in 2009* as an Investment & Corporate Finance Analyst, and in 2013 he was promoted to Portfolio Manager. His current responsibilities include designing, trading and managing overlay portfolios as well as serving as an IT leader for the investment area. Mr. Gomelsky holds a BS degree in Finance and History from Boston College. Prior to joining Parametric, Alex worked for Johnson Controls as a Business Analyst within Global Operations and FP&A departments. He is a CFA charterholder and a member of the CFA Society of Minnesota.
Chris Haskamp, CFAPortfolio ManagerMr. Haskamp joined Parametric in 2006*. Chris is dedicated to portfolio management and leading research projects in the area of risk management. Chris managesportfolios for the risk parity program as well as for the enhanced index programs. Chris functions as part of the team that developed and launched Parametric's risk parity strategy, Global Balanced Risk, and continues to manage and enhance the strategy. Prior to joining Parametric, he spent three years as a scientist at the medical device firm Beckman Coulter Inc. Chris earned a BS in Biochemistry from the University of Minnesota and a MS in chemistry from the University of California, San Diego. Chris earned an MBA in finance from the University of Minnesota, Carlson School of Management in May of 2007 and started full time at Parametric in June of 2007. He is a CFA charterholder and a member of the CFA Society of Minnesota.
Gregory Liebl, CFAPortfolio ManagerMr. Liebl joined Parametric in 2010*. Greg is currently the Portfolio Manager for all Parametric proprietary and non-discretionary commodity strategies. Previously, Greg had been dedicated to providing Portfolio Management in the areas of risk and exposure management and customized implementation solutions. In this capacity, he was responsible for managing and trading overlay and physical portfolios designed to meet specific client risk management needs. Greg functions as part of the team that developed and launched Parametric’s initial commodity programs, including index strategies, custom solutions, and Parametric’s proprietary offerings. Greg holds a B.S. in Business Administration with a Finance concentration from North Dakota State University. He is a CFA charterholder and a member of the CFA Society of Minnesota.
Matthew Liebl, CFAPortfolio ManagerMr. Liebl joined Parametric in May 2007* as an Investment Analyst. In 2012, he was promoted to Portfolio Manager working primarily in PIOS® (Policy Implementation Overlay Service). His current responsibilities include designing, trading and managing overlay portfolios with an emphasis on international index strategies. He also assists in the currency and commodities areas as necessary. Mr. Liebl holds a BA in Finance from the University of Minnesota Duluth. He is a CFA charterholder and a member of the CFA Society of Minnesota.
*Reflects the year employee was hired by The Clifton Group, which was acquired by Parametric Portfolio Associates LLC on December 31, 2012.
MASTER PAGE NO. 221

21
This material has bee prepared for the exclusive use of Ventura County Employees’ Retirement Association in a one-on-one presentation only.
VCERA – Currency Hedging Program
BIOGRAPHIES: PARAMETRIC MINNEAPOLIS INVESTMENT CENTER
Clint Talmo, CFAPortfolio ManagerMr. Talmo joined Parametric in 2014 as an Assistant Portfolio Manager and shortly after was promoted to Portfolio Manager. His current responsibilities include designing, trading, and managing overlay portfolios with an emphasis on options and OTC swaps. Prior to joining Parametric, Clint was a Partner at Aerwulf Asset Management. Previously, he worked for Interlachen Capital Group and EBF & Associates where his responsibilities included research, trading, and portfolio management. Mr. Talmo holds a BS in Finance from the University of Colorado. He is a CFA charterholder and a member of the CFA Society of Minnesota.
Alex Zweber, CFAPortfolio ManagerMr. Zweber joined Parametric in 2006*. As a Portfolio Manager, Alex is responsible for the design and implementation of several of Parametric’s options-based risk management solutions, including the Defensive Equity strategy. Additionally, he conducts research in the areas of option modeling, scenario analysis, stress testing and portfolio construction in support of existing investment strategies, as well as potential new product offerings. Alex has considerable experience with both futures and options-based solutions, and works closely with institutional clients and consultants to address investment and overlay servicing needs. Alex holds a BA in Economics from Macalester College. He is a CFA charterholder and a member of the CFA Society of Minnesota.
Wei Ge, Ph.D., CFASenior Researcher Mr. Ge joined Parametric in 2014 as a senior researcher. He is responsible for leading all quantitative modeling and analysis to support the company’s investment products and new product development. He oversees and plans the long-term research agenda of the firm, works closely with portfolio managers conducting research to improve product design and management, and serves as a liaison between the Minneapolis office and Parametric’s research team in Seatt le. Prior to joining Parametric, Wei was a quantitative research analyst at UBS Global Asset Management, where he worked on quantitative modeling and analysis, multi-asset portfolio construction and management, analytics systems development, and manager research, focusing on equity, quantitative, and alternative asset managers. Before entering the investment industry, Wei served as a senior researcher in the biotechnology industry working on quantitative modeling to address biomedical problems. Wei holds an MBA in Analytic Finance and Economics from the University of Chicago Booth School of Business and a Ph.D. in Computational Molecular Biology from Rutgers University. He is a CFA charter holder and a member of the CFA Society of Minnesota.
*Reflects the year employee was hired by The Clifton Group, which was acquired by Parametric Portfolio Associates LLC on December 31, 2012.
MASTER PAGE NO. 222
22
This material has bee prepared for the exclusive use of Ventura County Employees’ Retirement Association in a one-on-one presentation only.
VCERA – Currency Hedging Program
BIOGRAPHIES: PARAMETRICINSTITUTIONAL INVESTMENT SOLUTIONS
Gregory Baranivsky, CFADirector, Institutional Relationships – Central North AmericaMr. Baranivsky joined the firm in 2010*. He is responsible for developing, coordinating, and executing the sales and marketing strategies for Parametric’s unique family of products in the Central sales territory. Prior to joining Parametric, Greg spent 12 years at First American Funds/FAF Advisors (now Nuveen Asset Management) in various sales, national accounts, and product management leadership roles. Before joining First American Funds in 1998, he spent over three years at Van Kampen Investments (today INVESCO) finishing in the product management department. Greg holds a B.A. from Benedictine University and an M.B.A. from the Illinois Institute of Technology. Greg is a CFA charterholder, is a member of the CFA Institute and the CFA Society of Minnesota where he previously served as a member of its board of directors.
Benjamin Lazarus, CFADirector, Institutional Relationships – Western North AmericaMr. Lazarus joined the firm in 2004*. He is responsible for developing, coordinating, and executing the business development and client services plan for Parametric’sunique family of products with emphasis on the Western region of the United States and Canada. In addition, Ben works on developing new strategies for Parametric and has presented on the use of derivatives at different industry events. Prior to joining Parametric, he was the Director of Sales Strategy at Deluxe Corporation in St. Paul, Minnesota. Ben holds a B.A. in Psychology from the University of California, San Diego and an M.B.A. in Marketing and Strategic Management from the University of Minnesota. He is a CFA charterholder and a member of the CFA Society of Minnesota.
Doug MillerDirector, Institutional Relationships – Southeast North AmericaMr. Miller is responsible for institutional business development and relationships in the U.S. Southeast region. Prior to joining Parametric in 2014, Doug was a regional director for Russell Investments’ Americas institutional business. Before that, he was a Regional Director of U.S. Sales for several different business units within Bank of New York Mellon Corporation. Doug holds a B.A. in Political Science from the University of Washington.
Christopher Uhas, CFADirector, Institutional Relationships – Eastern North AmericaMr. Uhas joined the firm in 2007*. He is responsible for developing, coordinating, and executing the sales and marketing strategies for Parametric’s unique family of products with special emphasis on business development in the Eastern region of the United States and Canada. Prior to joining Parametric, Chris was involved in public and private equity portfolio management with a boutique asset management firm. Before entering the investment management field Chris served as the Director of New Product Launch for Seagate Technology, based in Singapore. Additionally, he spent five years as a nuclear-trained submarine officer in the United States Navy. Chris holds a B.S. in Electrical Engineering from the University of Notre Dame, and an M.B.A. from the University of Chicago Booth School of Business. He is a CFA charterholder and a member of the CFA Society of Minnesota.
*Reflects the year employee was hired by The Clifton Group, which was acquired by Parametric Portfolio Associates LLC on December 31, 2012.
MASTER PAGE NO. 223
23
This material has bee prepared for the exclusive use of Ventura County Employees’ Retirement Association in a one-on-one presentation only.
VCERA – Currency Hedging Program
BIOGRAPHIES: PARAMETRICINSTITUTIONAL INVESTMENT SOLUTIONS
Michi McDonough, CFADirector – Consultant RelationsMs. McDonough is a Director on the Consultant Relations team. In this capacity, Michi is responsible for developing and maintaining relationships within the institutional investment consultant community. She serves as a key contact for consultant inquiries and coordinates new business opportunit ies, working in conjunction with the Sales and Portfolio Management teams. Prior to joining Parametric, Michi was previously Vice President and Consultant Relations Manager at Wellington Management and began her professional career at MFS Investment Management. She holds a B.A. in Economics from Emory University and an M.B.A., magna cum laude, from Babson College. She is a CFA charterholder and a member of the CFA Society of Boston.
Christopher Wisdom, CFADirector – Consultant RelationsMr. Wisdom is a Director on the Consultant Relations team. In this capacity, he is responsible for developing and maintaining relationships within the institutional investment consultant community. He serves as a key contact for consultant inquiries and coordinates new business opportunities, working in conjunction with the Sales and Portfolio Management teams. Prior to joining Parametric, Chris held various roles at Dimensional Fund Advisors, MSCI, and Towers Watson. Chris holds a B.A. in Mathematics and Statistics from the University of Windsor. He is a CFA charterholder and a member of the CFA Society of Seattle.
Jason ChalmersDirector – Client Relationship ManagementMr. Chalmers is a Director on the institutional Client Relationship Management team. Jason is based in Boston and is responsible for managing client relationships throughout the Eastern United States. He joined Parametric after 15 years at Acadian Asset Management LLC. Jason earned a B.S., Economics, Northeastern University, and a M.S., Finance, Boston College Carroll School of Management.
Daniel RyanDirector – Client Relationship ManagementMr. Ryan is a Director on the Client Relationship Management team. In this capacity, Dan is responsible for managing client relationships throughout the western U.S. Prior to joining Parametric, Dan was Vice President and Senior Relationship Manager at State Street Global Advisors. He holds a B.A. in History from the University of Michigan.
MASTER PAGE NO. 224
24
This material has bee prepared for the exclusive use of Ventura County Employees’ Retirement Association in a one-on-one presentation only.
VCERA – Currency Hedging Program
DISCLOSURE
Parametric, headquartered in Seattle, WA, is a leading global asset management firm, providing investment strategies and customized exposure management to institutions and individual investors around the world. Parametric offers a variety of rules-based, risk-controlled investment strategies, including alpha-seeking equity, alternative and options strategies, as well as implementation services, including customized equity, traditional overlay and centralized portfolio management. Parametric is a majority-owned subsidiary of Eaton Vance Corp. and offers these capabilities through investment centers in Seattle, WA, Minneapolis, MN and Westport, CT (home to Parametric subsidiary Parametric Risk Advi-sors LLC, an SEC-registered investment adviser).
Parametric is divided into two segments: Parametric Investment & Overlay Strategies and Parametric Custom Tax-Managed & Centralized Portfolio Management. For compliance with the Global Investment Performance Standards (GIPS®), the Firm is defined and held out to the public as Parametric Investment & Overlay Strategies. Parametric Investment & Overlay Strategies provides rules-based investment management services to institutional investors, individual clients and registered investment vehicles, including Engineered Alpha Strategies, Specialty Index, and PIOS® Policy Implementation Overlay Service (PIOS). The Firm has complied with the GIPS standards retroactive to January 1, 2000.”
This information is intended solely to report on investment strategies and opportunities identified by Parametric. Opinions and estimates offered constitute our judgment and are subject to change without notice, as are statements of financial market trends, which are based on current market conditions. We believe the information provided here is reliable, but do not warrant its accuracy or completeness. This material is not intended as an offer or solicitation for the purchase or sale of any financial instrument. Past performance is not indicative of future results. The views and strategies described may not be suitable for all investors. Investing entails risks and there can be no assurance that Parametric will achieve profits or avoid incurring losses. Parametric does not provide legal, tax and/or accounting advice or services. Clients should consult with their own tax or legal advisor prior to entering into any transaction or strategy described herein.
Charts, graphs and other visual presentations and text information were derived from internal, proprietary, and/or service vendor technology sources and/or may have been extracted from other firm data bases. As a result, the tabulation of certain reports may not precisely match other published data. Data may have originated from various sources including, but not limited to, Bloomberg, MSCI/Barra, FactSet, and/or other systems and programs. Parametric makes no representation or endorsement concerning the accuracy or propriety of information received from any other third party.
Benchmark/index information provided is for illustrative purposes only. Indexes are unmanaged and cannot be invested in directly. Deviations from the benchmarks provided herein may include, but are not limited to, factors such as: the purchase of higher risk securities, over/under-weighting specific sectors and countries, limitations in market capitalization, company revenue sources, and/or client restrictions. Parametric’s proprietary investment process considers factors such as additional guidelines, restrictions, weightings, allocations, market conditions and other investment characteristics. Thus returns may at times materially differ from the stated benchmark and/or other disciplines provided for comparison.
The MSCI World Index is a free float-adjusted market capitalization weighted index that is designed to measure the equity market performance of global developed markets.
The MSCI Emerging Markets Index is broad-based and is a free float-adjusted market capitalization index calculated total return and net of foreign withholding taxes that is designed to measure equity market performance in the global emerging markets.
The MSCI EAFE Index (Europe, Australasia, Far East) is a free float-adjusted market capitalization index that is designed to measure the equity market performance of developed markets, excluding the U.S. & Canada.
MASTER PAGE NO. 225

25
This material has bee prepared for the exclusive use of Ventura County Employees’ Retirement Association in a one-on-one presentation only.
VCERA – Currency Hedging Program
DISCLOSURE (CONTINUED)
References to specific securities and their issuers are for illustrative purposes only and are not intended to be, and should not be interpreted as, recommendations to purchase or sell such securities. Any specific securities mentioned are not representative of all securities purchased, sold or recommended for advisory clients. Actual portfolio holdings vary for each client and there is no guarantee that a particular client’s account will hold any, or all, of the securities identified. It should not be assumed that any of the securities or recommendations made in the future will be profitable or will equal the performance of the listed securities.
All contents copyright 2014-2015 Parametric Portfolio Associates LLC. All rights reserved. Parametric Portfolio Associates, PIOS, and Parametric with the iris flower logo are all trademarks registered in the US Patent and Trademark Office.
Parametric is headquartered at 1918 8th Avenue, Suite 3100, Seattle, WA 98101. Parametric’s Minneapolis investment center is located at 3600 Minnesota Drive, Suite 325, Minneapolis, MN 55435. For more information regarding Parametric and its investment strategies, or to request a copy of Parametric’s Form ADV, please contact us at 206.694.5575 (Seattle) or 612.870.8800 (Minneapolis), or visit our website, www.parametricportfolio.com.
MASTER PAGE NO. 226

Ventura County Employees’ Retirement AssociationPrivate Equity Program Review& 2015 Strategic Investment Plan
April 20, 2015
Allan Martin, PartnerDan LeBeau, ConsultantChris Hill, CFA, CAIA, Research Consultant
MASTER PAGE NO. 227

VCERA Private Equity Plan
MASTER PAGE NO. 228

• NEPC recommends VCERA give consideration to committing approximately $50 million to private equity in the coming year.
– Target a diversified private equity fund-of-funds
• VCERA should maintain an active, annual commitment pace, being mindful of the Plan’s liquidity needs.
– Annual commitments need to be assessed carefully so as to not over-allocate to illiquid investments.
– Strategies that provide a combination of capital appreciation as well as near-term income or distributions can provide a balanced approach for maintaining PE exposure while also providing some liquidity.
NEPC Recommendation
.
33
MASTER PAGE NO. 229

• Current Investment Status– As of December 31, 2014, VCERA had made $292.5 million in commitments to three
FoF managers• Adams Street Partners (“ASP”) –
– $42.5 million commitment in 2010 to ASP U.S. Fund 2010– $25.5 million commitment in 2010 to ASP Non-U.S. Developed Fund 2010– $8.5 million commitment in 2010 to ASP Emerging Markets Fund 2010– $8.5 million commitment in 2010 to ASP Direct Fund 2010– $75 million commitment in 2013 to ASP Global Fund 2013
• Harbourvest –– $67.5 million commitment in 2013 to Dover Street VIII (Secondaries Fund)
• Pantheon –– $15.0 million in 2010 to Pantheon Global Secondary Fund IV– $50.0 million in 2014 to Pantheon Global Secondary Fund V
– Private Equity NAV of $106 million represents approximately 2.4% of the total VCERA portfolio
– The portfolio is well diversified, with commitments to both U.S. and non-U.S. funds that includes a mix of primary, secondary and direct funds
• Private Equity Target Allocation– Policy target of 5% of the total portfolio– Current exposure of $300 million (current private equity NAV + uncalled
commitments) represents approximately 6.9% of the total VCERA portfolio• We typically recommend clients overcommit to private equity at 1.5x the target weight,
which suggests exposure of approximately 7.5%
Current Investment Program
4
MASTER PAGE NO. 230

Current Investment Program & Allocation
5
Private Equity NAVs and ExposuresCurrent Capital Total % of
Valuation to be Current TotalInvestment Strategy (NAV) Funded Exposure ExposureFund of Funds $54.6 $100.8 $155.4 52%Secondaries $41.5 $92.9 $134.4 45%Venture $9.5 $1.0 $10.5 3%Total / Wtd. Avg. $105.5 $194.7 $300.2 100%
Private Equity Investments by Vintage Year
Vintage Year CommitmentPaid In Capital
Capital to be Funded
Cumulative Distributed
Current Valuation (NAV) Total Value Net Benefit Call Ratio DPI Ratio TVPI Ratio
2010 $100 $55 $45 $12 $61 $72 $17 55% 0.21x 1.31x2012 $68 $30 $38 $7 $31 $39 $9 44% 0.24x 1.30x2013 $75 $13 $62 $0 $14 $14 $0 17% 0.00x 1.04x2014 $50 $0 $50 $0 $0 $0 $0 0% NA NA
Total $293 $98 $195 $19 $106 $124 $26 33% 0.19x 1.27x
52%45%
3%
Private Equity Portfolio Exposure
Fund of Funds
Secondaries
Venture
MASTER PAGE NO. 231

Plan Overview and Assumptions
6
MASTER PAGE NO. 232
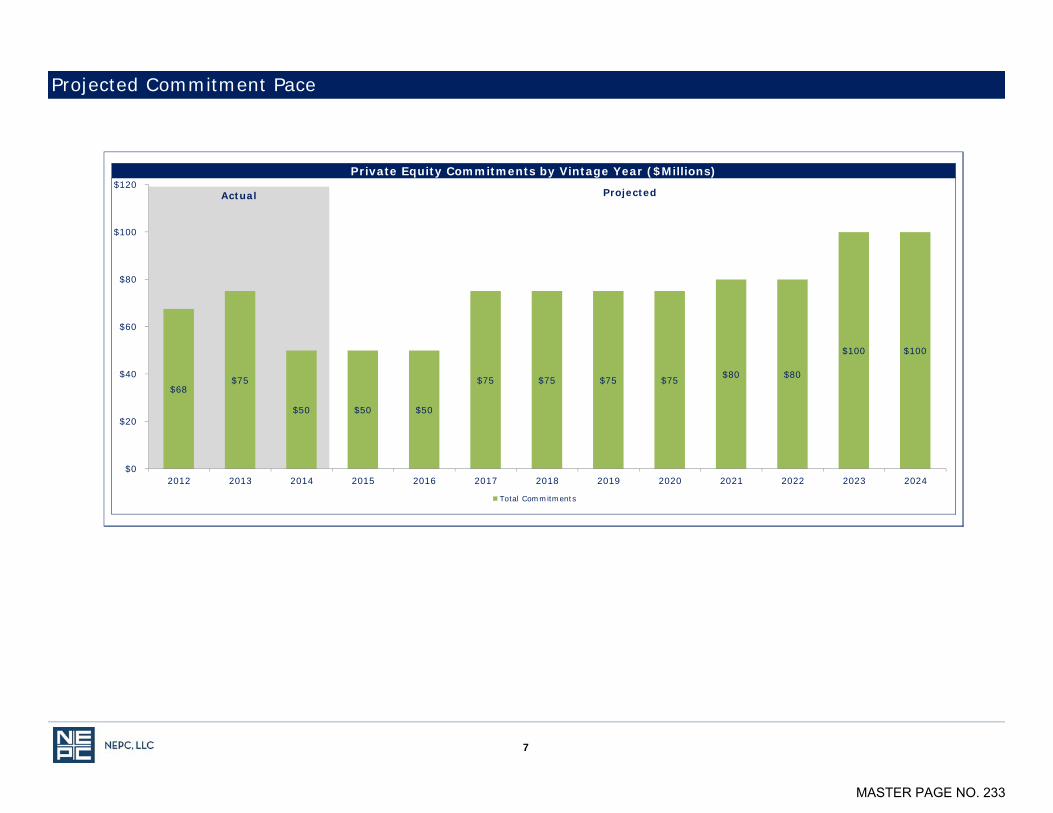
Projected Commitment Pace
7
Private Equity Commitments by Vintage Year ($Millions)
Actual
$68 $75
$50 $50 $50
$75 $75 $75 $75 $80 $80
$100 $100
$0
$20
$40
$60
$80
$100
$120
2012 2013 2014 2015 2016 2017 2018 2019 2020 2021 2022 2023 2024
Total Commitments
Projected
MASTER PAGE NO. 233
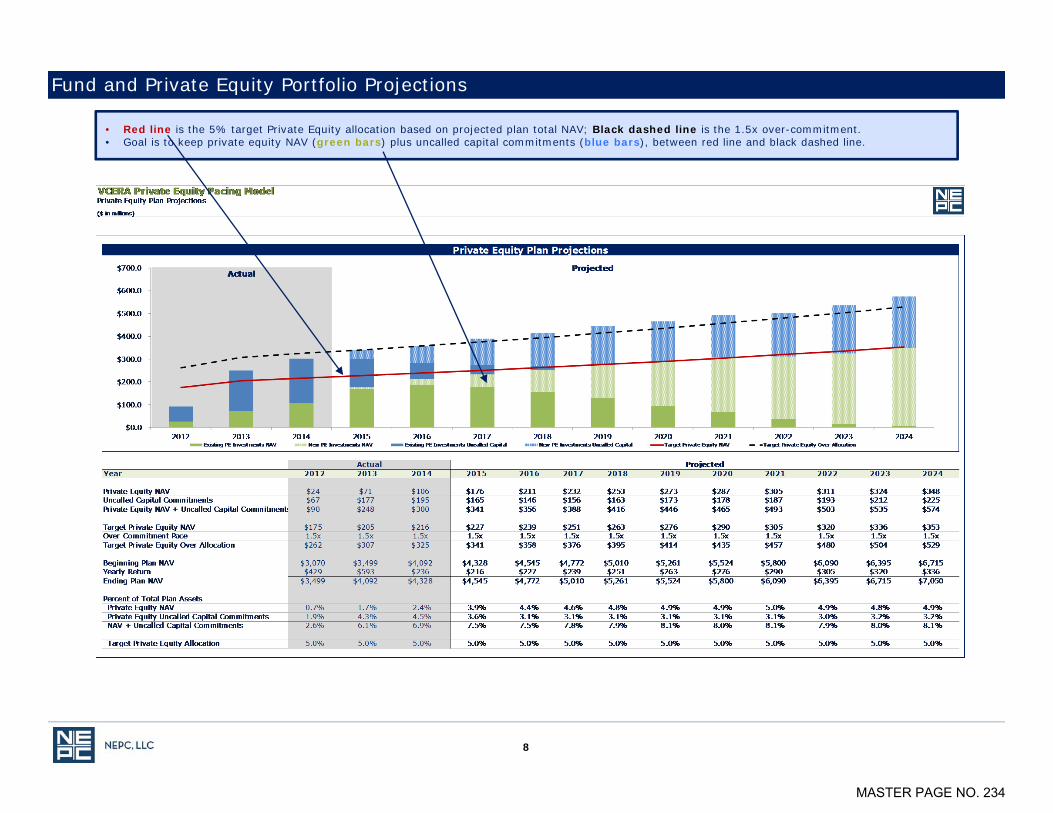
Fund and Private Equity Portfolio Projections
8
• Red line is the 5% target Private Equity allocation based on projected plan total NAV; Black dashed line is the 1.5x over-commitment.• Goal is to keep private equity NAV (green bars) plus uncalled capital commitments (blue bars), between red line and black dashed line.
MASTER PAGE NO. 234
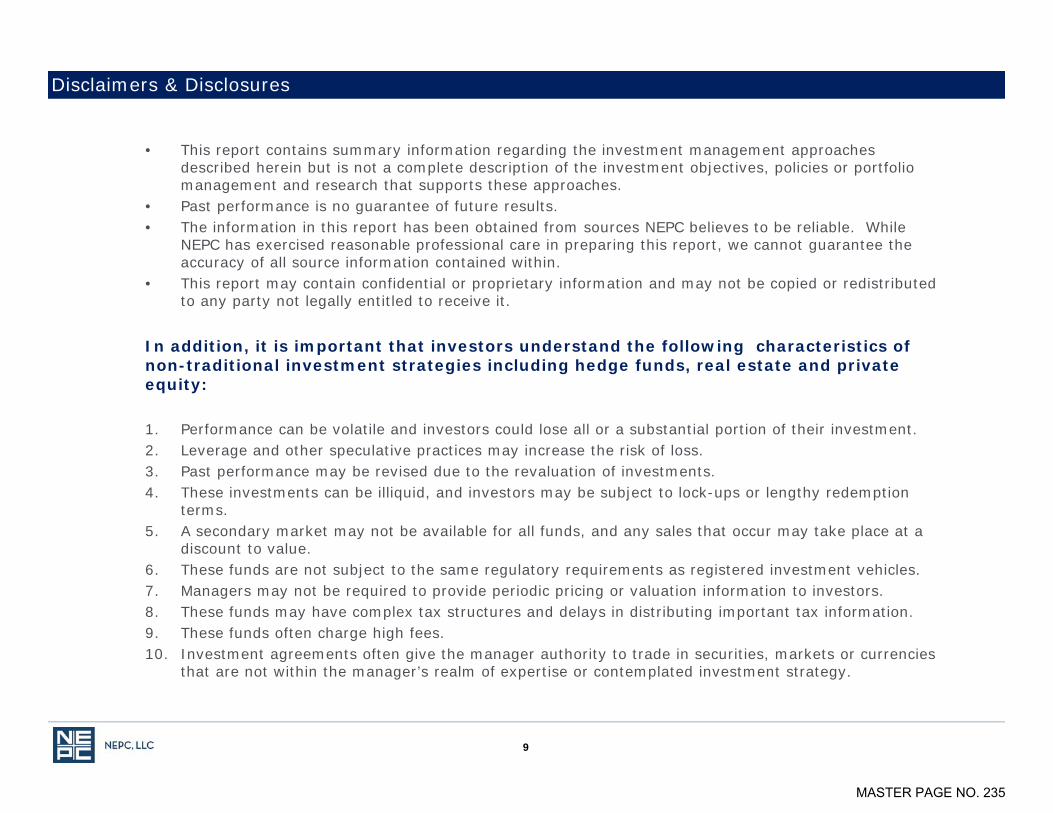
• This report contains summary information regarding the investment management approaches described herein but is not a complete description of the investment objectives, policies or portfolio management and research that supports these approaches.
• Past performance is no guarantee of future results.• The information in this report has been obtained from sources NEPC believes to be reliable. While
NEPC has exercised reasonable professional care in preparing this report, we cannot guarantee the accuracy of all source information contained within.
• This report may contain confidential or proprietary information and may not be copied or redistributed to any party not legally entitled to receive it.
In addition, it is important that investors understand the following characteristics of non-traditional investment strategies including hedge funds, real estate and private equity:
1. Performance can be volatile and investors could lose all or a substantial portion of their investment.2. Leverage and other speculative practices may increase the risk of loss.3. Past performance may be revised due to the revaluation of investments. 4. These investments can be illiquid, and investors may be subject to lock-ups or lengthy redemption
terms.5. A secondary market may not be available for all funds, and any sales that occur may take place at a
discount to value.6. These funds are not subject to the same regulatory requirements as registered investment vehicles.7. Managers may not be required to provide periodic pricing or valuation information to investors.8. These funds may have complex tax structures and delays in distributing important tax information.9. These funds often charge high fees.10. Investment agreements often give the manager authority to trade in securities, markets or currencies
that are not within the manager’s realm of expertise or contemplated investment strategy.
Disclaimers & Disclosures
9
MASTER PAGE NO. 235

Private Equity Manager Information
MASTER PAGE NO. 236

Adams Street Partners
General Firm Information
General Partner Adams Street Partners, LLC (“ASP” or “Adams Street” or “the Firm”)
Main Address One North Wacker Drive, Suite 2200 Chicago, IL 60606
Firm Overview
Investment Style Diversified fund of funds (buyout, venture, mezzanine, distressed, special situations, co-investments), secondary funds, energy fund of funds, and direct funds
Target Asset Types Primary and Secondary Private Equity LP Interests, Equity Securities
Target Geographies Global (US, non-US Developed Markets, Emerging Markets)
Investment Strategy
• Each year Adams Street Partners raises an annual fund-of-funds program. For 2015, the Global Fund program consists of a Direct Venture/Growth Fund, a U.S. Partnership Fund, and a Non-U.S. Partnership Fund. The 2015 Global Fund provides administrative convenience by investing in pre-determined percentages in the underlying 2015 U.S. Fund (55%), 2015 Non-U.S. Fund (35%), and the Direct Venture/Growth Fund (10%).
• In addition to the core fund-of-funds programs, ASP manages separate secondary funds, energy & natural resources funds, co-investment funds and also builds and manages customized separate accounts.
Firm Experience
• Adams Street’s predecessor firm was founded in 1972 as the growth equity and co-investment group within First National Bank of Chicago. Through a series of corporate events, ASP operated as part of UBS Asset Management until 2001.
• Following the initiation of a management buyout in 2001, employees of the Firm bought out the remaining stake in 2008. ASP has been 100% employee owned since that date, with 83 individuals holding an equity stake in the Firm.
• Since its inception, Adams Street Partners has grown to over 130 employees with six global offices in Chicago, London, Menlo Park, Singapore, Beijing and Tokyo.
• Adams Street has been investing directly into operating companies since 1972 and has been investing in private equity partnerships since 1979.
Fund Team
• Adams Street experienced the departure of Chief Investment Officer Hanneke Smits in 2014. Ms. Smits joined the Firm in 1997 and was responsible for formulating global investment strategy and managing relationships with several of Adams Street's managers.
• Ms. Smits duties on the Primary Investment Team were assumed by Kelly Meldrum. Ms. Meldrum worked closely with Ms. Smits to ensure a smooth transition of the Primary Investment Team responsibilities during the latter half of 2014. Jeff Diehl, a partner on the Direct Venture Capital and Growth Equity Team, joined the Executive Committee to backfill Ms. Smits’ seat. Mr. Diehl is a partner in the firm who joined in 2000.
• There are over 50 investment professionals dedicated to the investment activities across the firm.• An Executive Committee and an Operations Committee were formed in 2008 to facilitate the management governance of the
growing organization. The Board and the Executive Committee will discuss and recommend the future leadership and reporting structure for the Firm that will be in place upon Bon French’s anticipated retirement in 2017.
Sourcing Capabilities
• ASP’s tenure in the industry and the global networks its professionals have built provide the Firm with a large set of investment opportunities.
• ASP’s deal flow typically generates 400-600 partnership opportunities and over 1,000 direct investment opportunities annually. • ASP’s involvement in all aspects of the private equity industry globally (primaries, secondaries, co-investment and direct investing)
enable the team to leverage firm-wide relationships developed around the world.
MASTER PAGE NO. 237
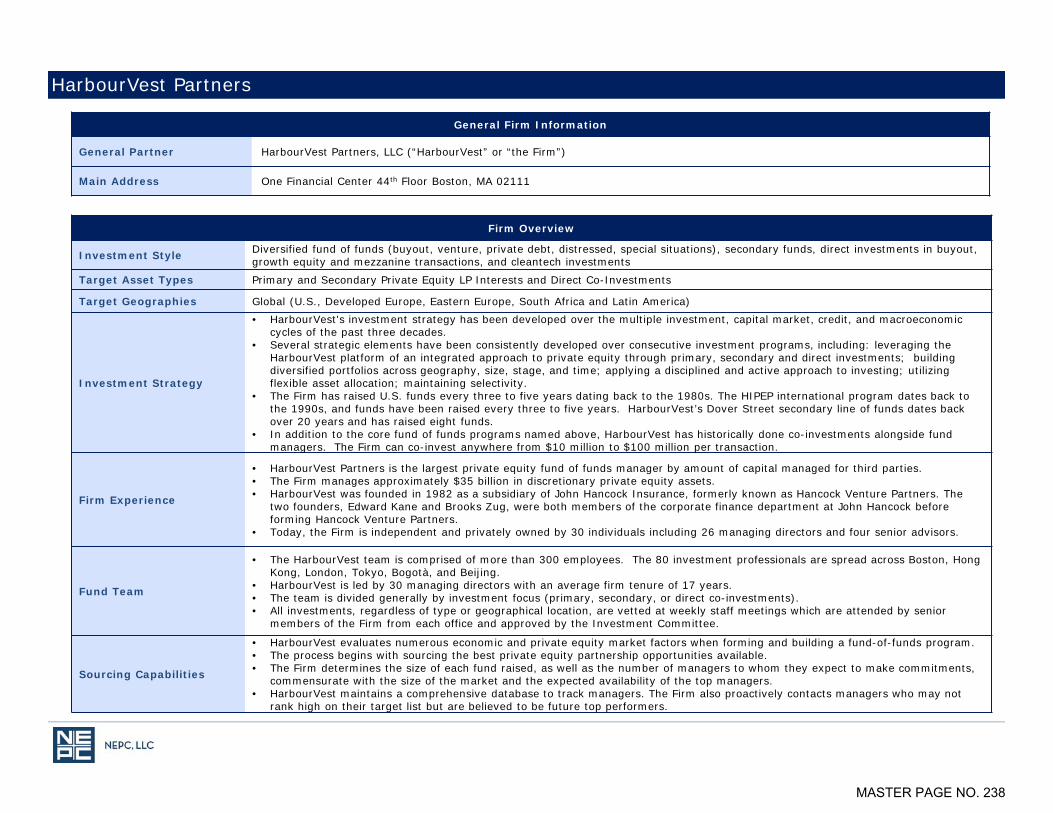
HarbourVest Partners
General Firm Information
General Partner HarbourVest Partners, LLC (“HarbourVest” or “the Firm”)
Main Address One Financial Center 44th Floor Boston, MA 02111
Firm Overview
Investment Style Diversified fund of funds (buyout, venture, private debt, distressed, special situations), secondary funds, direct investments in buyout, growth equity and mezzanine transactions, and cleantech investments
Target Asset Types Primary and Secondary Private Equity LP Interests and Direct Co-Investments
Target Geographies Global (U.S., Developed Europe, Eastern Europe, South Africa and Latin America)
Investment Strategy
• HarbourVest's investment strategy has been developed over the multiple investment, capital market, credit, and macroeconomic cycles of the past three decades.
• Several strategic elements have been consistently developed over consecutive investment programs, including: leveraging the HarbourVest platform of an integrated approach to private equity through primary, secondary and direct investments; building diversified portfolios across geography, size, stage, and time; applying a disciplined and active approach to investing; utilizing flexible asset allocation; maintaining selectivity.
• The Firm has raised U.S. funds every three to five years dating back to the 1980s. The HIPEP international program dates back to the 1990s, and funds have been raised every three to five years. HarbourVest’s Dover Street secondary line of funds dates back over 20 years and has raised eight funds.
• In addition to the core fund of funds programs named above, HarbourVest has historically done co-investments alongside fund managers. The Firm can co-invest anywhere from $10 million to $100 million per transaction.
Firm Experience
• HarbourVest Partners is the largest private equity fund of funds manager by amount of capital managed for third parties.• The Firm manages approximately $35 billion in discretionary private equity assets.• HarbourVest was founded in 1982 as a subsidiary of John Hancock Insurance, formerly known as Hancock Venture Partners. The
two founders, Edward Kane and Brooks Zug, were both members of the corporate finance department at John Hancock before forming Hancock Venture Partners.
• Today, the Firm is independent and privately owned by 30 individuals including 26 managing directors and four senior advisors.
Fund Team
• The HarbourVest team is comprised of more than 300 employees. The 80 investment professionals are spread across Boston, Hong Kong, London, Tokyo, Bogotà, and Beijing.
• HarbourVest is led by 30 managing directors with an average firm tenure of 17 years.• The team is divided generally by investment focus (primary, secondary, or direct co-investments).• All investments, regardless of type or geographical location, are vetted at weekly staff meetings which are attended by senior
members of the Firm from each office and approved by the Investment Committee.
Sourcing Capabilities
• HarbourVest evaluates numerous economic and private equity market factors when forming and building a fund-of-funds program.• The process begins with sourcing the best private equity partnership opportunities available.• The Firm determines the size of each fund raised, as well as the number of managers to whom they expect to make commitments,
commensurate with the size of the market and the expected availability of the top managers.• HarbourVest maintains a comprehensive database to track managers. The Firm also proactively contacts managers who may not
rank high on their target list but are believed to be future top performers.
MASTER PAGE NO. 238
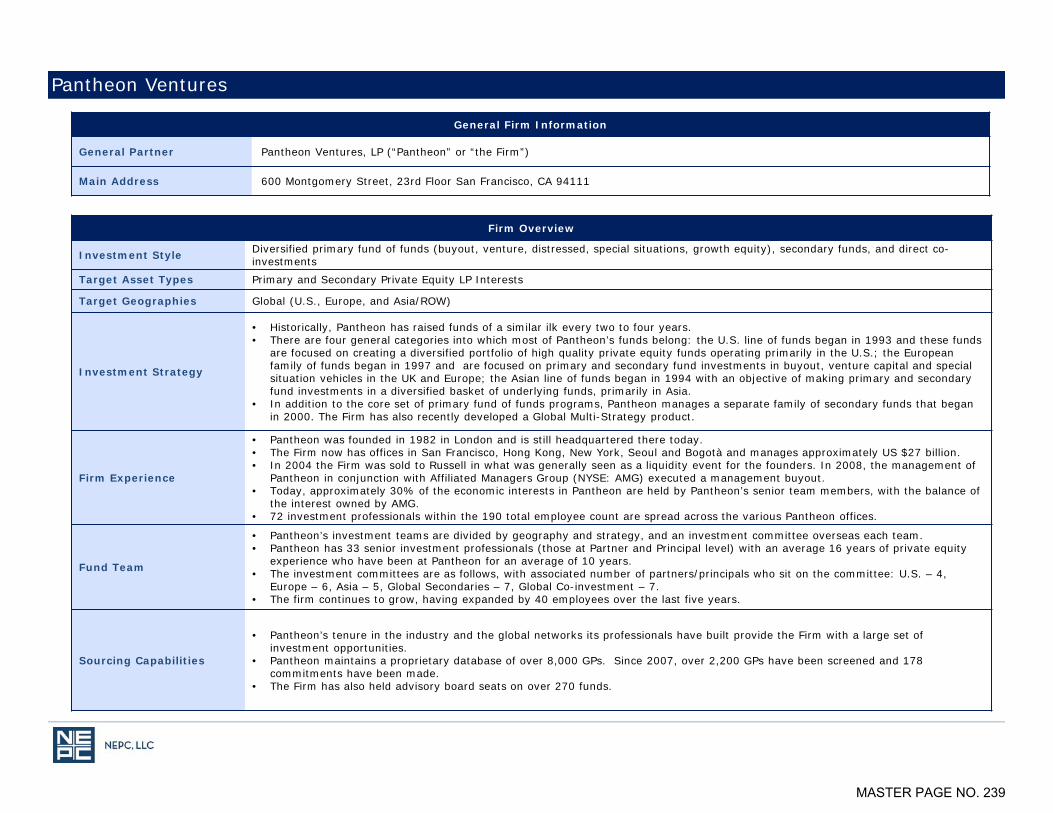
Pantheon Ventures
General Firm Information
General Partner Pantheon Ventures, LP (“Pantheon” or “the Firm”)
Main Address 600 Montgomery Street, 23rd Floor San Francisco, CA 94111
Firm Overview
Investment Style Diversified primary fund of funds (buyout, venture, distressed, special situations, growth equity), secondary funds, and direct co-investments
Target Asset Types Primary and Secondary Private Equity LP Interests
Target Geographies Global (U.S., Europe, and Asia/ROW)
Investment Strategy
• Historically, Pantheon has raised funds of a similar ilk every two to four years.• There are four general categories into which most of Pantheon’s funds belong: the U.S. line of funds began in 1993 and these funds
are focused on creating a diversified portfolio of high quality private equity funds operating primarily in the U.S.; the European family of funds began in 1997 and are focused on primary and secondary fund investments in buyout, venture capital and special situation vehicles in the UK and Europe; the Asian line of funds began in 1994 with an objective of making primary and secondaryfund investments in a diversified basket of underlying funds, primarily in Asia.
• In addition to the core set of primary fund of funds programs, Pantheon manages a separate family of secondary funds that began in 2000. The Firm has also recently developed a Global Multi-Strategy product.
Firm Experience
• Pantheon was founded in 1982 in London and is still headquartered there today.• The Firm now has offices in San Francisco, Hong Kong, New York, Seoul and Bogotà and manages approximately US $27 billion.• In 2004 the Firm was sold to Russell in what was generally seen as a liquidity event for the founders. In 2008, the management of
Pantheon in conjunction with Affiliated Managers Group (NYSE: AMG) executed a management buyout.• Today, approximately 30% of the economic interests in Pantheon are held by Pantheon’s senior team members, with the balance of
the interest owned by AMG.• 72 investment professionals within the 190 total employee count are spread across the various Pantheon offices.
Fund Team
• Pantheon’s investment teams are divided by geography and strategy, and an investment committee overseas each team.• Pantheon has 33 senior investment professionals (those at Partner and Principal level) with an average 16 years of private equity
experience who have been at Pantheon for an average of 10 years.• The investment committees are as follows, with associated number of partners/principals who sit on the committee: U.S. – 4,
Europe – 6, Asia – 5, Global Secondaries – 7, Global Co-investment – 7.• The firm continues to grow, having expanded by 40 employees over the last five years.
Sourcing Capabilities
• Pantheon’s tenure in the industry and the global networks its professionals have built provide the Firm with a large set of investment opportunities.
• Pantheon maintains a proprietary database of over 8,000 GPs. Since 2007, over 2,200 GPs have been screened and 178 commitments have been made.
• The Firm has also held advisory board seats on over 270 funds.
MASTER PAGE NO. 239

NEPC Private Equity Themes for 2015
MASTER PAGE NO. 240

• Fundraising pace for high demand managers continues to be quick
– Investors need to make early and quick decisions when capital demand exceeds fundraising targets for select managers
• Look for buyout and growth equity exposure with value orientation to protect down-side risk
– Seek managers with operational expertise, sector focus and which have demonstrated the ability to drive top and bottom line growth through improved operations
– US = price discipline; EUR = currency & economic rebound; Asia & EM = attractive growth
• Dramatic drop in oil prices provides opportunity to invest in energy PE at more attractive valuations and benefit from long-term price rebound
– Potential for near term financial distress from highly levered businesses or underperforming assets should create new investment opportunities at attractive terms or valuations
• Distressed turnarounds or multi-strategy distressed funds can capitalize on the choppiness of the economic recovery and market volatility
– Turnaround equity strategies can capitalize on businesses that have struggled; Multi-strategy funds can dynamically capitalize on pockets of opportunity as they arise
• Secondary transaction showing signs of frothiness – seek deal complexity or small transactions for better pricing
• Access constraints and soaring valuations adds to risk of venture capital investing
Private Equity - 2015 Investment Themes
15
MASTER PAGE NO. 241
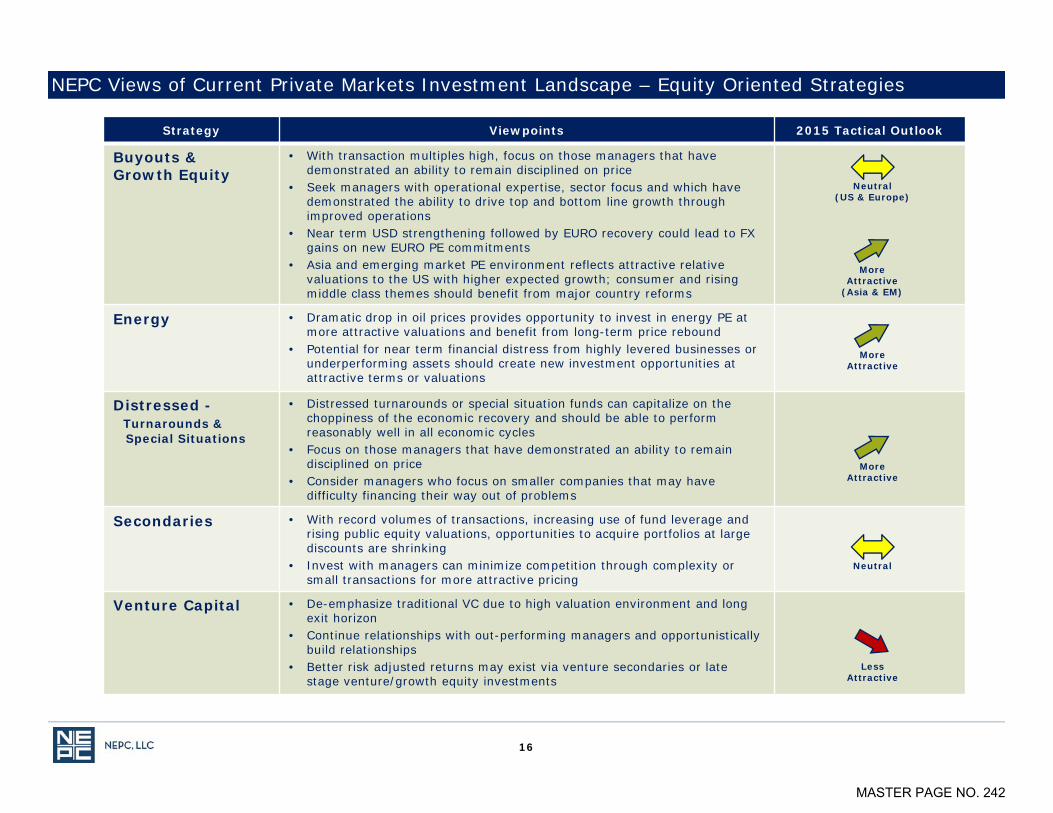
NEPC Views of Current Private Markets Investment Landscape – Equity Oriented Strategies
Strategy Viewpoints 2015 Tactical Outlook
Buyouts & Growth Equity
• With transaction multiples high, focus on those managers that have demonstrated an ability to remain disciplined on price
• Seek managers with operational expertise, sector focus and which have demonstrated the ability to drive top and bottom line growth through improved operations
• Near term USD strengthening followed by EURO recovery could lead to FX gains on new EURO PE commitments
• Asia and emerging market PE environment reflects attractive relative valuations to the US with higher expected growth; consumer and rising middle class themes should benefit from major country reforms
Energy • Dramatic drop in oil prices provides opportunity to invest in energy PE at more attractive valuations and benefit from long-term price rebound
• Potential for near term financial distress from highly levered businesses or underperforming assets should create new investment opportunities at attractive terms or valuations
Distressed -Turnarounds &Special Situations
• Distressed turnarounds or special situation funds can capitalize on the choppiness of the economic recovery and should be able to perform reasonably well in all economic cycles
• Focus on those managers that have demonstrated an ability to remain disciplined on price
• Consider managers who focus on smaller companies that may have difficulty financing their way out of problems
Secondaries • With record volumes of transactions, increasing use of fund leverage and rising public equity valuations, opportunities to acquire portfolios at large discounts are shrinking
• Invest with managers can minimize competition through complexity or small transactions for more attractive pricing
Venture Capital • De-emphasize traditional VC due to high valuation environment and long exit horizon
• Continue relationships with out-performing managers and opportunistically build relationships
• Better risk adjusted returns may exist via venture secondaries or late stage venture/growth equity investments
16
Neutral(US & Europe)
Less Attractive
Neutral
More Attractive
More Attractive
More Attractive
(Asia & EM)
MASTER PAGE NO. 242

NEPC Views of Current Private Markets Investment Landscape – Credit Oriented Strategies
Strategy Viewpoints 2015 Tactical Outlook
Distressed -Control &Non-Control
• With leveraged loans continuing to trade close to par coupled with a distressed ratio of ~1% (% of loans trading below 80% of par) , continue to de-emphasize trading-focused strategies
• Focus on multi-strategy managers to capitalize on choppy economic recovery or control oriented managers who can flex to buyout strategies should economic growth improve
• Continued low oil prices and/or rising interest rates may lead to financial distress in over levered energy businesses and related service companies
Mezzanine • Sourcing is a key differentiator as deal flow for many mezz funds are challenged by active high yield and senior debt/unitranche lenders
• Prioritize experienced managers that have transaction flexibility across the capital structure and low historic loss rates
• Focus on managers who have rationalized fund economics to reflect competitive subordinated lending environment and lower return expectations
Direct Lending • Yields remain relatively attractive to traditional fixed income, but credit underwriting standards are loosening as more capital is raised for lending funds
• Relative pricing inefficiencies with the US market make European middle market more attractive. Seek managers that have strong credit skills, deep relationship networks for sourcing and multi-jurisdictional transaction experience
• For US exposure, focus on managers that are originating unsponsored transactions or sourcing sponsored transactions from less efficient channels
OpportunisticCredit
• Emphasize managers with flexible and opportunistic strategies allowing for investments in an assortment of securities, assets, and situations, and allowing them to dynamically react to changing market conditions
• Managers who have a global footprint and can root out credit opportunities in complex situations should be able to generate attractive returns in the current low yield environment
17
Neutral
More Attractive
More Attractive
Less Attractive
MASTER PAGE NO. 243
Appendix: Private Equity Market Information
MASTER PAGE NO. 244

• A robust market for private equity realizations– High portfolio company valuations & readily available debt – PE firms and strategic acquirers paying up for high quality companies
• Bifurcation in fundraising– Rapid, oversubscribed fundraises for top managers– Continued prolonged fundraises for many
• Venture capital valuations rise on social media and robust IPO market– Venture-backed IPO activity near 10 year highs– Led by biotech and social media – Rapid rise in valuations and quality of IPOs have raised questions about a new venture bubble
• Secondary deal flow hits record level– Discounts compressed as public equity valuations rose & funds bid up prices using leverage– Banks methodically selling PE due to tighter regulatory requirements
• Distressed debt activity in real estate deals but less so in corporate debt– Leveraged loans trading near par for most of the year– Turnaround equity funds were in high demand
• Search for yield led to increased investment in private debt– Senior and unitranche lending was an attractive alternative to traditional fixed income– Mezzanine debt faced deal competition from unitranche and high equity contributions
2014 Private Equity Year in Review (Overall)
19
Looking Back at 2014
MASTER PAGE NO. 245
• Fundraising pace for high demand managers continues to be quick
– Investors need to make early and quick decisions when capital demand exceeds fundraising targets for select managers
• Look for buyout and growth equity exposure with value orientation to protect down-side risk
– Seek managers with operational expertise, sector focus and which have demonstrated the ability to drive top and bottom line growth through improved operations
– US = price discipline; EUR = currency & economic rebound; Asia & EM = attractive growth
• Dramatic drop in oil prices provides opportunity to invest in energy PE at more attractive valuations and benefit from long-term price rebound
– Potential for near term financial distress from highly levered businesses or underperforming assets should create new investment opportunities at attractive terms or valuations
• Distressed turnarounds or multi-strategy distressed funds can capitalize on the choppiness of the economic recovery and market volatility
– Turnaround equity strategies can capitalize on businesses that have struggled; Multi-strategy funds can dynamically capitalize on pockets of opportunity as they arise
• Secondary transaction showing signs of frothiness – seek deal complexity or small transactions for better pricing
• Access constraints and soaring valuations adds to risk of venture capital investing
Private Equity - 2015 Investment Themes
20
MASTER PAGE NO. 246
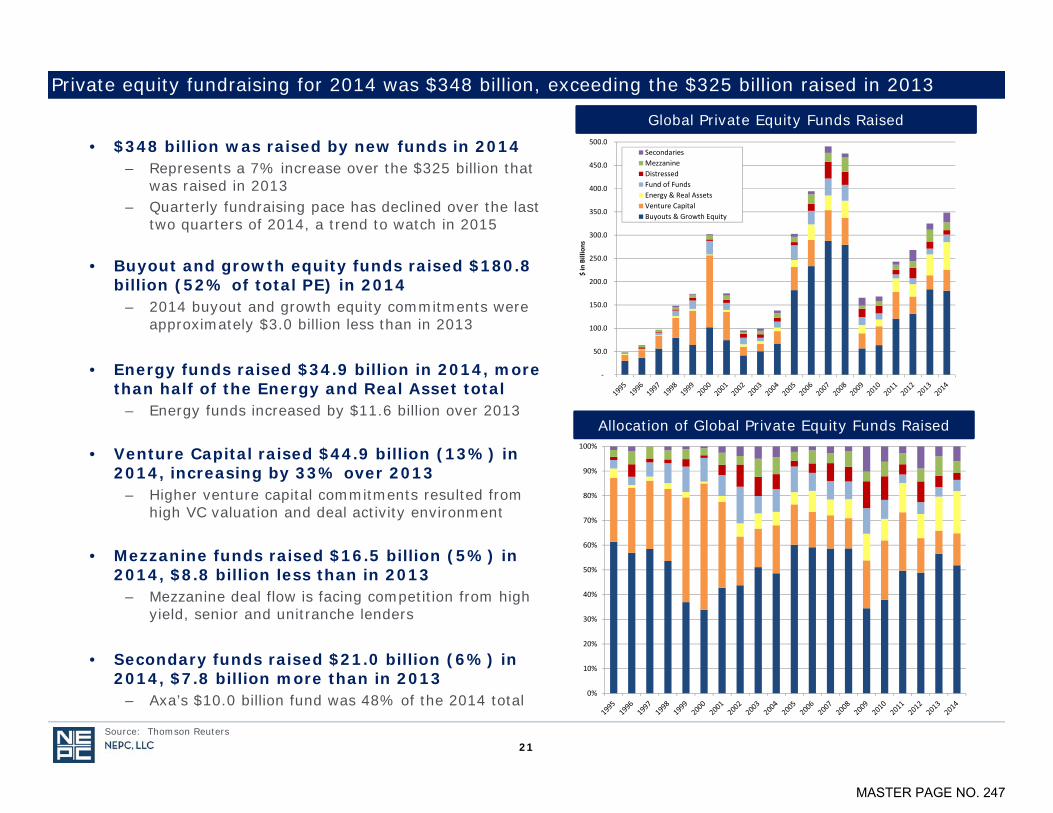
• $348 billion was raised by new funds in 2014– Represents a 7% increase over the $325 billion that
was raised in 2013– Quarterly fundraising pace has declined over the last
two quarters of 2014, a trend to watch in 2015
• Buyout and growth equity funds raised $180.8 billion (52% of total PE) in 2014
– 2014 buyout and growth equity commitments were approximately $3.0 billion less than in 2013
• Energy funds raised $34.9 billion in 2014, more than half of the Energy and Real Asset total
– Energy funds increased by $11.6 billion over 2013
• Venture Capital raised $44.9 billion (13%) in 2014, increasing by 33% over 2013
– Higher venture capital commitments resulted from high VC valuation and deal activity environment
• Mezzanine funds raised $16.5 billion (5%) in 2014, $8.8 billion less than in 2013
– Mezzanine deal flow is facing competition from high yield, senior and unitranche lenders
• Secondary funds raised $21.0 billion (6%) in 2014, $7.8 billion more than in 2013
– Axa’s $10.0 billion fund was 48% of the 2014 total
Private equity fundraising for 2014 was $348 billion, exceeding the $325 billion raised in 2013
21Source: Thomson Reuters
Global Private Equity Funds Raised
Allocation of Global Private Equity Funds Raised
‐
50.0
100.0
150.0
200.0
250.0
300.0
350.0
400.0
450.0
500.0
$ in Billions
SecondariesMezzanineDistressedFund of FundsEnergy & Real AssetsVenture CapitalBuyouts & Growth Equity
0%
10%
20%
30%
40%
50%
60%
70%
80%
90%
100%
MASTER PAGE NO. 247

0%
10%
20%
30%
40%
50%
60%
70%
80%
90%
100%
$0.0
$50.0
$100.0
$150.0
$200.0
$250.0
$300.0
$350.0
$400.0
$450.0
$500.0
in $ Billions
Rest of World
North America
Europe
Asia
• $228.5 billion of new commitments were to US funds 2014
– Exceeded 2013 US PE fundraising totals by $9.4 billion, or 4%
– Consistent with 2013, US PE funds represented approximately two-thirds of all new PE funds raised in 2014
• $74.9 billion of European commitments comprised 22% of all new PE commitments in 2014
– Approximately 58% of European commitments were made to buyout/growth equity funds
– 4 funds account for 32% of 2014 total (Axa, Bain, Permira and Pamplona)
• Asian private equity commitments accelerated in 2014 to $38.1 billion
– Represents 11% of 2014 total across all geographies and has surpassed the $27.5 billion of Asian funds raised in 2013
– Approximately 70% of Asia PE raised in 2014 was by China-based firms
– Buyouts & Growth Equity (61%) and VC (26%) were the majority of new Asia funds in 2014
• Nearly 90% of the $6.8 billion of rest of world commitments were to Latin American based funds
US & Europe fund raising increases slightly while Asia & EM surge
Source: Thomson Reuters
22
Global Private Equity Funds Raised
Allocation of Global Private Equity Funds Raised
MASTER PAGE NO. 248

All Private Equity
Q32014 1 Year 3 Year 5 Year 7 Year 10 Year
Global 0.1% 16.2% 15.0% 14.9% 7.8% 14.1%
United States 1.7% 18.4% 16.7% 16.3% 9.1% 13.8%
Europe -6.8% 7.8% 10.7% 11.6% 3.3% 14.5%
Asia 2.9% 22.8% 13.1% 15.1% 9.3% 14.6%
Global by StrategyQ3
2014 1 Year 3 Year 5 Year 7 Year 10 Year
Buyouts -0.9% 14.5% 15.2% 15.4% 7.1% 15.0%
Small (<$500M) -0.3% 11.5% 11.9% 13.2% 8.4% 16.4%
Medium ($500M-$3.5B) -1.5% 12.8% 13.0% 13.8% 6.8% 15.2%
Large & Mega (>$3.5B) -0.5% 16.1% 17.3% 17.0% 6.7% 14.4%
Growth Equity 1.7% 19.9% 15.0% 15.2% 9.2% 14.5%
Venture Capital 2.1% 23.7% 15.4% 15.0% 8.1% 9.8%
Mezzanine 3.2% 12.8% 13.2% 11.9% 9.2% 10.7%
Distressed 0.4% 12.8% 15.6% 13.7% 8.5% 12.5%
Energy -0.1% 14.6% 11.5% 12.9% 9.4% 19.8%
Secondaries1 4.1% 17.3% 10.3% 14.7% 7.9% 13.8%
Primary FOFs1 3.7% 21.3% 10.5% 13.7% 7.0% 11.1%
Public IndicesQ3
2014 1 Year 3 Year 5 Year 7 Year 10 Year
Russell 3000 0.0% 17.8% 23.1% 15.8% 6.2% 8.4%
MSCI EAFE -5.8% 4.7% 14.2% 7.0% 0.3% 6.8%
MSCI EM -3.4% 4.7% 7.6% 4.8% 0.1% 11.0%
Barclays High Yield -1.9% 7.2% 11.1% 10.6% 8.7% 8.3%
For the past year, private equity funds outperformed public equity markets in each region
• Global PE generated a 16.2% return for the year
– Asia and US led the way with European PE lagging
– All GEOs outperformed public market equities
• Buyout returns were 14.5% for the past year
– Larger size = higher correlation to public markets
– Smaller funds have outperformed over long term
• Venture capital returns were 23.7% for the past year
– Highest of any strategy– Long-term return
approaching 10%
• 10-year return for global PE is 14.1%
– Outperforming public equity indices over the long term across all geographies
23Source: Pooled average and quartile IRRs from Cambridge Associates as of September 30, 2014, preliminary data as of 01/07/15; Bloomberg for public indices
1 As of Q2 2014 – latest data available due to reporting lags for secondary & primary FOFs
MASTER PAGE NO. 249

Global Private Equity IRRs by Vintage year as of Q3 2014 (preliminary)
24Source: Pooled average and quartile IRRs from Cambridge Associates as of September30, 2014, preliminary data as of 1/5/2015
IRR Quartile Analysis
Vintage Year: 1997 1998 1999 2000 2001 2002 2003 2004 2005 2006 2007 2008 2009 2010 2011 2012 2013
95th Percentile 199.2% 63.2% 26.6% 32.4% 48.7% 51.2% 41.0% 57.4% 36.5% 20.9% 29.1% 36.9% 37.8% 53.2% 52.4% 36.2% 33.9%
Upper Quartile 27.0% 18.7% 11.6% 15.3% 24.8% 23.2% 20.4% 17.6% 13.2% 12.3% 15.9% 18.7% 23.5% 20.5% 19.7% 21.7% 6.9%
M edian 12.2% 8.4% -0.7% 4.3% 10.6% 11.0% 11.9% 8.8% 7.5% 7.8% 10.3% 11.6% 15.2% 12.2% 10.3% 8.7% -13.2%
Lower Quartile 1.4% -4.5% -8.5% -4.9% 1.5% 1.8% 2.5% 1.4% 1.5% 2.1% 3.5% 6.9% 6.2% 7.9% -0.7% -0.6% -26.1%
5th Percentile -14.5% -15.0% -22.5% -19.6% -11.4% -12.1% -9.6% -10.5% -9.1% -9.7% -10.1% -6.2% -1.7% -0.9% -17.8% -22.1% -50.3%
Number o f Funds 139 153 165 222 121 68 76 120 176 197 207 166 81 88 121 111 87
Pooled Average 19.4% 11.3% 5.0% 11.7% 20.1% 17.0% 17.7% 14.4% 10.0% 7.6% 11.0% 13.0% 16.6% 14.7% 14.3% 17.9% 3.9%
-50.0%
-40.0%
-30.0%
-20.0%
-10.0%
0.0%
10.0%
20.0%
30.0%
40.0%
50.0%
60.0%
1997 1998 1999 2000 2001 2002 2003 2004 2005 2006 2007 2008 2009 2010 2011 2012 2013
1st Quartile
2nd Quartile
3rd Quartile
4th Quartile
Pooled Avg
199% 63%
MASTER PAGE NO. 250

• Multiples of EV/EBITDA in the U.S. have returned to levels reminiscent of pre-2008, making it difficult to find quality companies at attractive prices
• Add-on activity continued to climb relative to platform acquisitions– Emphasis is being placed on consolidating fragmented industries and expanding companies into new
geographies
• Transactions in the $100 million to $1 billion range accounted for 85% of all capital invested through 3Q 2014 as deals over $1 billion were deemphasized
• The exit environment remained robust as 2014 has already seen more capital exited through Q3 than all of 2013
Buyouts/Growth
25
2014 Recap
2015 NEPCAssessment Neutral
Median EV/EBITDA Multiples
Source: William Blair & Co., Pitchbook
0.0x
2.0x
4.0x
6.0x
8.0x
10.0x
12.0x
Middle Market Overall Market
Exit Activity
0
50
100
150
200
250
$ B
n
Corporate Acquisition IPO Secondary Buyout
MASTER PAGE NO. 251
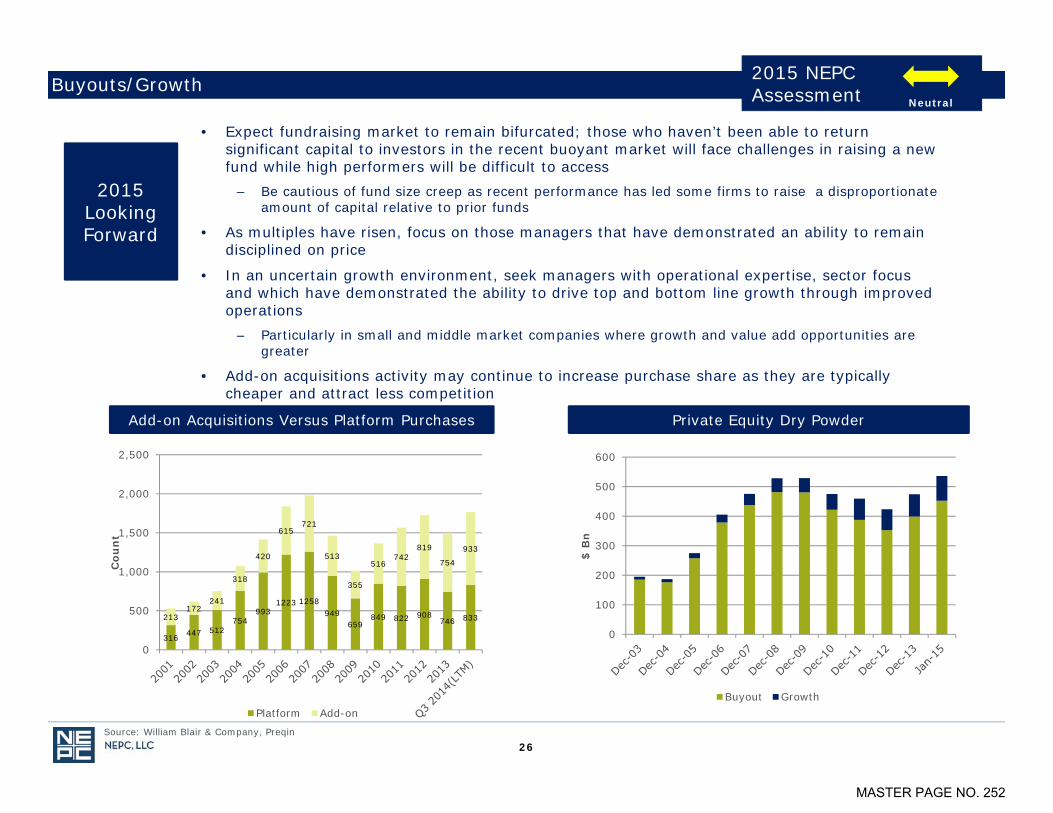
Buyouts/Growth
26
2015 Looking Forward
• Expect fundraising market to remain bifurcated; those who haven’t been able to return significant capital to investors in the recent buoyant market will face challenges in raising a new fund while high performers will be difficult to access
– Be cautious of fund size creep as recent performance has led some firms to raise a disproportionate amount of capital relative to prior funds
• As multiples have risen, focus on those managers that have demonstrated an ability to remain disciplined on price
• In an uncertain growth environment, seek managers with operational expertise, sector focus and which have demonstrated the ability to drive top and bottom line growth through improved operations
– Particularly in small and middle market companies where growth and value add opportunities are greater
• Add-on acquisitions activity may continue to increase purchase share as they are typically cheaper and attract less competition
•
2015 NEPCAssessment Neutral
Add-on Acquisitions Versus Platform Purchases Private Equity Dry Powder
Source: William Blair & Company, Preqin
0
100
200
300
400
500
600
$ B
n
Buyout Growth
316 447 512754
9931223 1258
949659
849 822 908746 833213
172241
318
420
615721
513
355
516742
819
754
933
0
500
1,000
1,500
2,000
2,500
Cou
nt
Platform Add-on
MASTER PAGE NO. 252
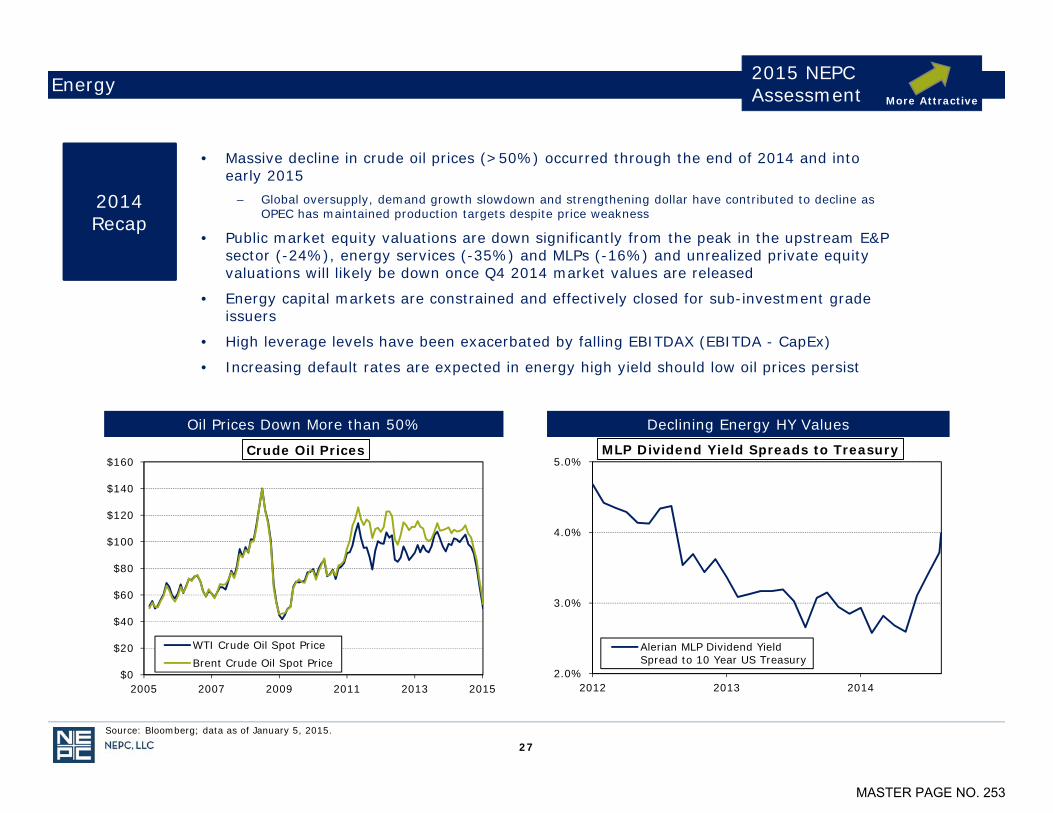
• Massive decline in crude oil prices (>50%) occurred through the end of 2014 and into early 2015
– Global oversupply, demand growth slowdown and strengthening dollar have contributed to decline as OPEC has maintained production targets despite price weakness
• Public market equity valuations are down significantly from the peak in the upstream E&P sector (-24%), energy services (-35%) and MLPs (-16%) and unrealized private equity valuations will likely be down once Q4 2014 market values are released
• Energy capital markets are constrained and effectively closed for sub-investment grade issuers
• High leverage levels have been exacerbated by falling EBITDAX (EBITDA - CapEx)
• Increasing default rates are expected in energy high yield should low oil prices persist
Energy
27
2015 NEPCAssessment
Oil Prices Down More than 50%
Source: Bloomberg; data as of January 5, 2015.
More Attractive
2014 Recap
$0
$20
$40
$60
$80
$100
$120
$140
$160
2005 2007 2009 2011 2013 2015
Crude Oil Prices
WTI Crude Oil Spot PriceBrent Crude Oil Spot Price
2.0%
3.0%
4.0%
5.0%
2012 2013 2014
MLP Dividend Yield Spreads to Treasury
Alerian MLP Dividend YieldSpread to 10 Year US Treasury
Declining Energy HY Values
MASTER PAGE NO. 253
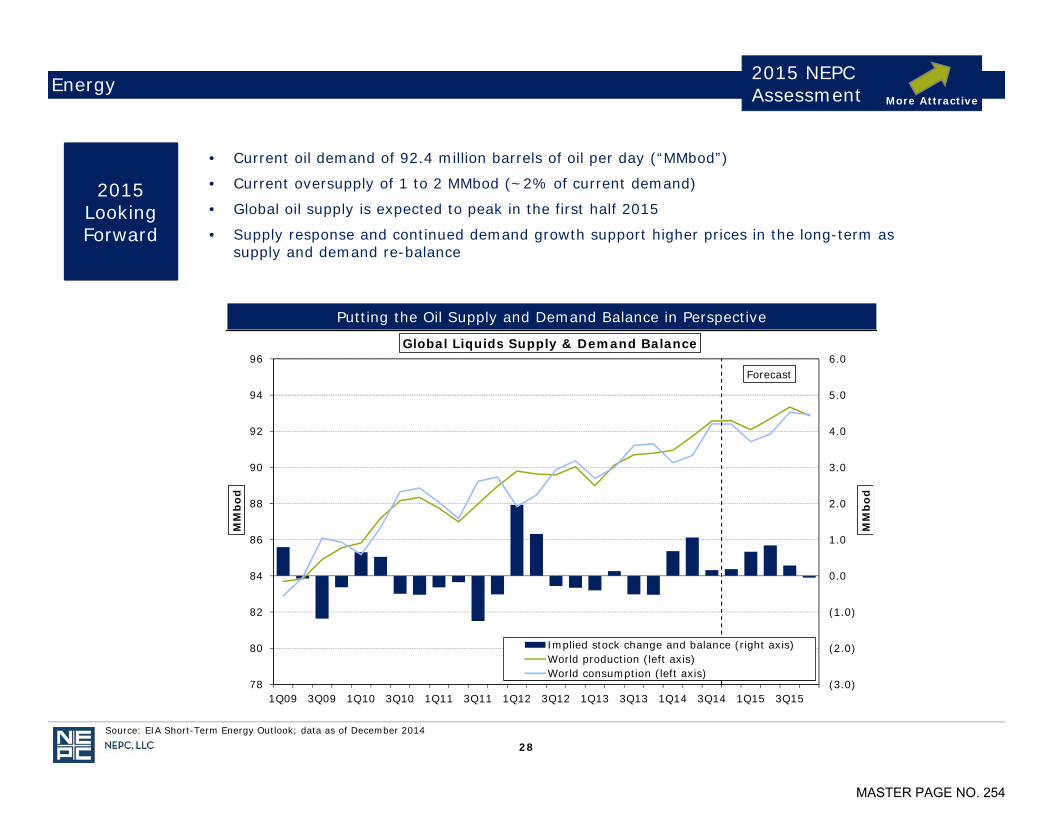
• Current oil demand of 92.4 million barrels of oil per day (“MMbod”)
• Current oversupply of 1 to 2 MMbod (~2% of current demand)
• Global oil supply is expected to peak in the first half 2015
• Supply response and continued demand growth support higher prices in the long-term as supply and demand re-balance
Energy
28
Forecast
(3.0)
(2.0)
(1.0)
0.0
1.0
2.0
3.0
4.0
5.0
6.0
78
80
82
84
86
88
90
92
94
96
1Q09 3Q09 1Q10 3Q10 1Q11 3Q11 1Q12 3Q12 1Q13 3Q13 1Q14 3Q14 1Q15 3Q15
MM
bo
d
MM
bo
d
Global Liquids Supply & Demand Balance
Implied stock change and balance (right axis)World production (left axis)World consumption (left axis)
Source: EIA Short-Term Energy Outlook; data as of December 2014
2015 NEPCAssessment More Attractive
Putting the Oil Supply and Demand Balance in Perspective
2015 Looking Forward
MASTER PAGE NO. 254

$0
$25
$50
$75
$100
2015 2016 2017 2018
Bank Forecasts
December 2014 FuturesCS Projected WTIJP Morgan Projected WTIMacquarie Projected WTICiti Projected WTIBOAML Projected WTI
0
200
400
600
800
1,000
1,200
1,400
1,600
1,800
2008 2010 2012 2014
US Crude Oil Rig Count
Baker Hughes US CrudeOil Rotary Rig Count
Energy
29
• Massive energy sector dislocation that has occurred as a result of falling oil prices is likely to create attractive private capital opportunities at lower valuations
– Existing and currently raising fund managers with dry powder should M&A activity accelerate once prices settle over the course of the year
• Distressed debt opportunities are also attractive as balance sheets deteriorate– Debt investments in public companies with highly levered balance sheets through unique deal structures at
attractive valuations that should benefit from a price rebound in the long-term
• Natural gas-weighted asset sales may accelerate as oil & gas companies seek to raise cash to offset drop in oil prices
– Provides an opportunity to acquire productive gas assets, generating near-term cash flow from production with upside related to potential natural gas price appreciation that may occur later this decade
2015 NEPCAssessment
Source: Bloomberg, Baker Hughes; data as of January 9, 2015 (Left ). Source: Bloomberg, Credit Suisse, JP Morgan, Macquarie, Citi, BOAML; data as of December 2014 (Right).
More Attractive
2015 Looking Forward
Rig counts down 10.7%
Crude Oil Futures Below Long-Term ExpectationsSupply Response Already Occurring
MASTER PAGE NO. 255

Distressed
Average Bid of Leveraged Loans
Source: PwC, S&P Capital IQ LCD and S&P/LSTA Leveraged Loan Index
Lagging 12-Month Default Rate in US
2015 NEPCAssessment Neutral
• With leveraged loans continuing to trade close to par coupled with a distressed ratio (% of loans trading below 80 cents) of ~1%, there has been a dearth of interesting opportunities in illiquid corporate credit.
• TXU’s bankruptcy on April 29 resulted in a spiking of the US default rate to nearly 4% with the par value of leveraged loans in default or bankruptcy at ~$24B at the end of 2014. In Europe, the default rate reached 5.4% primarily driven off of the bankruptcy of French-retailer Vivarte.
• In Europe, there was a pickup of non-performing and non-core asset sales stemming from regulatory requirements (Basel III), the Asset Quality Review and an improving banking sector. Asset sales exceeded €87 billion, a 36% increase over 2013.
30
60
65
70
75
80
85
90
95
100
105
Sep
-99
Mar
-00
Sep
-00
1-M
ar1-
Sep
2-M
ar2-
Sep
3-M
ar3-
Sep
4-M
ar4-
Sep
5-M
ar5-
Sep
6-M
ar6-
Sep
7-M
ar7-
Sep
8-M
ar8-
Sep
3/31
/200
99/
30/2
009
3/31
/201
09/
30/2
010
3/31
/201
19/
30/2
011
3/31
/201
29/
30/2
012
3/31
/201
39/
30/2
013
3/31
/201
49/
30/2
014
Middle Market Large Corporates
0%
2%
4%
6%
8%
10%
12%
2014 Recap
MASTER PAGE NO. 256

Distressed
31
Source: PwC, Cushman & Wakefield
European Asset Sales
2015 NEPCAssessment Neutral
• Continued low oil prices and/or rising interest rates may lead to opportunities for energy-related companies and those with precarious capital structures
• Financial institutions in Southern and Eastern European are expected to become more active sellers of non-performing and non-core assets in order to comply with regulatory requirements
• Managers who have a global footprint and can root out credit opportunities in complex situations should be able to generate decent returns in the current low yield environment
• Seek managers employing a value-oriented investment approach with an emphasis on turnaround situations whose strategies can perform in both bull and bear markets
R/E NPL Live Transactions by Geography
2015 Looking Forward
€ 36
€ 46
€ 63
€ 87
2011 2012 2013 Q1 2014
Performing Non-performing
MASTER PAGE NO. 257

• 2014 secondary transaction volume is estimated to have been between $30-$35 billion, marking the largest year of activity.
• With continued implementation of post-GFC regulatory reforms, financial institutions (e.g., banks and insurance companies) were the largest sellers of private equity assets during the year.
• Secondary sales by asset managers, particularly GP led fund restructurings, were a large portion of secondary volume in 2014, as managers of older funds seek alternative methods to alleviate timing pressures and expedite the return of capital.
• Fund managers are using deferred payments and fund leverage as ways to enhance return expectations as deal prices have been rising.
Secondaries
32
2015 NEPCAssessment
Source: Cogent Partners
Secondary Market Sellers by Transaction ValueSecondary Deal Activity & Fundraising
0%
10%
20%
30%
40%
50%
60%
70%
80%
90%
100%
Endowment/Foundation
Pension
Other
Fund of Funds
Financial Institution
Family Office
Asset Manager
$0
$5
$10
$15
$20
$25
$30
$35
Secondary Funds Raised Secondary Transactions
Neutral
2014 Recap
MASTER PAGE NO. 258
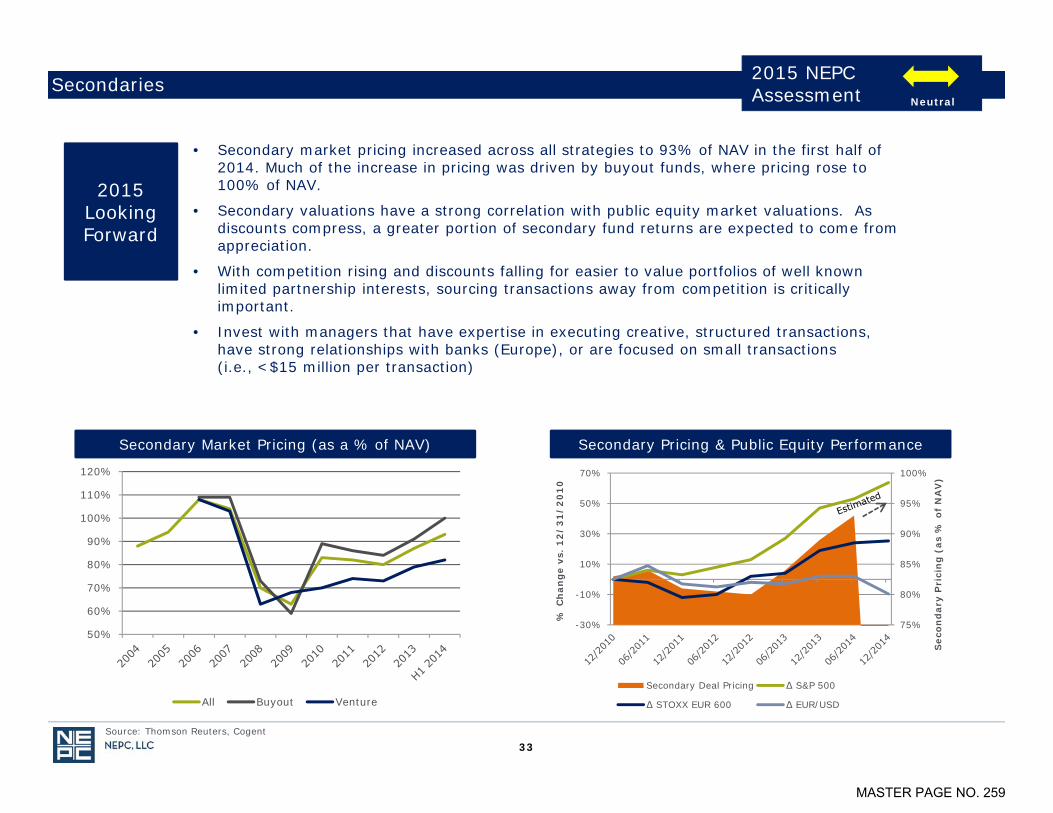
• Secondary market pricing increased across all strategies to 93% of NAV in the first half of 2014. Much of the increase in pricing was driven by buyout funds, where pricing rose to 100% of NAV.
• Secondary valuations have a strong correlation with public equity market valuations. As discounts compress, a greater portion of secondary fund returns are expected to come from appreciation.
• With competition rising and discounts falling for easier to value portfolios of well known limited partnership interests, sourcing transactions away from competition is critically important.
• Invest with managers that have expertise in executing creative, structured transactions, have strong relationships with banks (Europe), or are focused on small transactions (i.e., <$15 million per transaction)
33
Secondaries 2015 NEPCAssessment
Secondary Market Pricing (as a % of NAV)
Source: Thomson Reuters, Cogent
Secondary Pricing & Public Equity Performance
75%
80%
85%
90%
95%
100%
-30%
-10%
10%
30%
50%
70%
Sec
ond
ary
Pri
cin
g (
as %
of
NA
V)
% C
han
ge
vs.
12
/3
1/
20
10
Secondary Deal Pricing ∆ S&P 500
∆ STOXX EUR 600 ∆ EUR/USD
50%
60%
70%
80%
90%
100%
110%
120%
All Buyout Venture
Neutral
2015 Looking Forward
MASTER PAGE NO. 259

$0
$5
$10
$15
$20
$25
$30
$35
$40
Series Seed Series A Series B
• VC space has become crowded and frothy– “The tourists have arrived.” – Jim Goetz, Sequoia Capital
• Dollars invested and the number of deals steadily increasing – According to PricewaterhouseCoopers and the National Venture Capital Association, 3Q14 is the
sixth consecutive quarter with more than 1,000 companies receiving VC money in a single quarter
– $33 billion invested through 3Q14 eclipses all dollars invested in 2013, which eclipsed 2012
• Heavy valuation increases in both early and late stage
• The “no revenue, high valuation” phenomenon has returned with higher frequency
• The fraction of IPOs with negative earnings has increased to over 70% in 2014 from a low of 29% in 2009 (1999 = 76%, 2000 = 80%)
• The percentage of financing “up” rounds has increased from below 40% in 2009 to 65% in 2014
Venture Capital
US Late Stage Valuations ($MM)
2015 NEPCAssessment Less Attractive
US Early Stage Valuations ($MM)
34
$0
$20
$40
$60
$80
$100
$120
$140
$160
$180
$200
Series C Series D or Later
Source: National Venture Capital Association, PWC Moneytree, Thomson Reuters , University of Florida, Jay Ritter, Pitchbook
2014 Recap
MASTER PAGE NO. 260
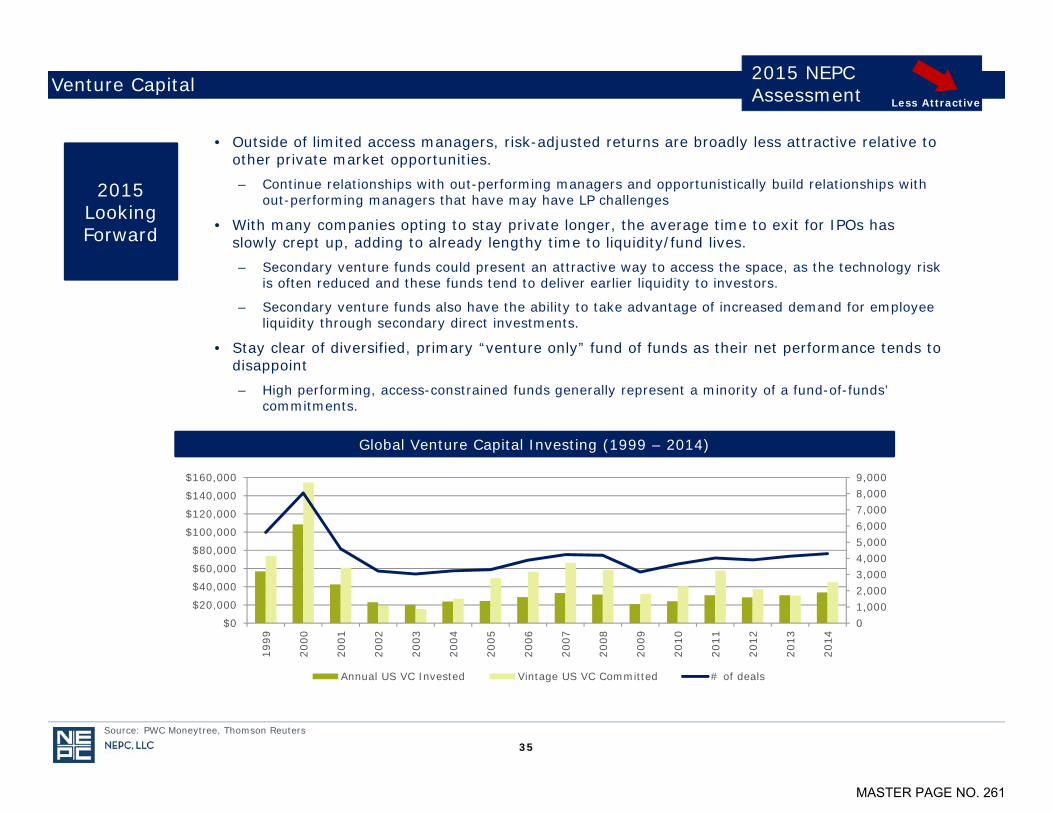
Venture Capital
Global Venture Capital Investing (1999 – 2014)
• Outside of limited access managers, risk-adjusted returns are broadly less attractive relative to other private market opportunities.– Continue relationships with out-performing managers and opportunistically build relationships with
out-performing managers that have may have LP challenges
• With many companies opting to stay private longer, the average time to exit for IPOs has slowly crept up, adding to already lengthy time to liquidity/fund lives. – Secondary venture funds could present an attractive way to access the space, as the technology risk
is often reduced and these funds tend to deliver earlier liquidity to investors.
– Secondary venture funds also have the ability to take advantage of increased demand for employee liquidity through secondary direct investments.
• Stay clear of diversified, primary “venture only” fund of funds as their net performance tends to disappoint– High performing, access-constrained funds generally represent a minority of a fund-of-funds’
commitments.
2015 NEPCAssessment
Source: PWC Moneytree, Thomson Reuters
35
01,0002,0003,0004,0005,0006,0007,0008,0009,000
$0
$20,000
$40,000
$60,000
$80,000
$100,000
$120,000
$140,000
$160,000
1999
2000
2001
2002
2003
2004
2005
2006
2007
2008
2009
2010
2011
2012
2013
2014
Annual US VC Invested Vintage US VC Committed # of deals
Less Attractive
2015 Looking Forward
MASTER PAGE NO. 261

• Mezzanine managers continued to get squeezed as a result of high equity contributions and the increased use of unitranche debt structures
• Equity contributions to deals has remained elevated as pressure mounts for sponsors to deploy capital in a low-volume market
• Alternative capital sources continue to encroach mezzanine finance, primarily from unitranche lending where senior and junior debt is provided in a single product
• Fund of Funds have increased their participation in mezzanine financing, offering products with lower fees and carry resulting in cheaper cost of capital to sponsors
Mezzanine
36
Average Sponsor Equity >$50M EBITDA Average Sponsor Equity <$50M EBITDA
2015 NEPCAssessment
Source: S&P Capital IQ LCD and S&P/LSTA Leveraged Loan Commentary
0%
10%
20%
30%
40%
50%
60%
0%
10%
20%
30%
40%
50%
60%
2014 Recap
Less Attractive
MASTER PAGE NO. 262
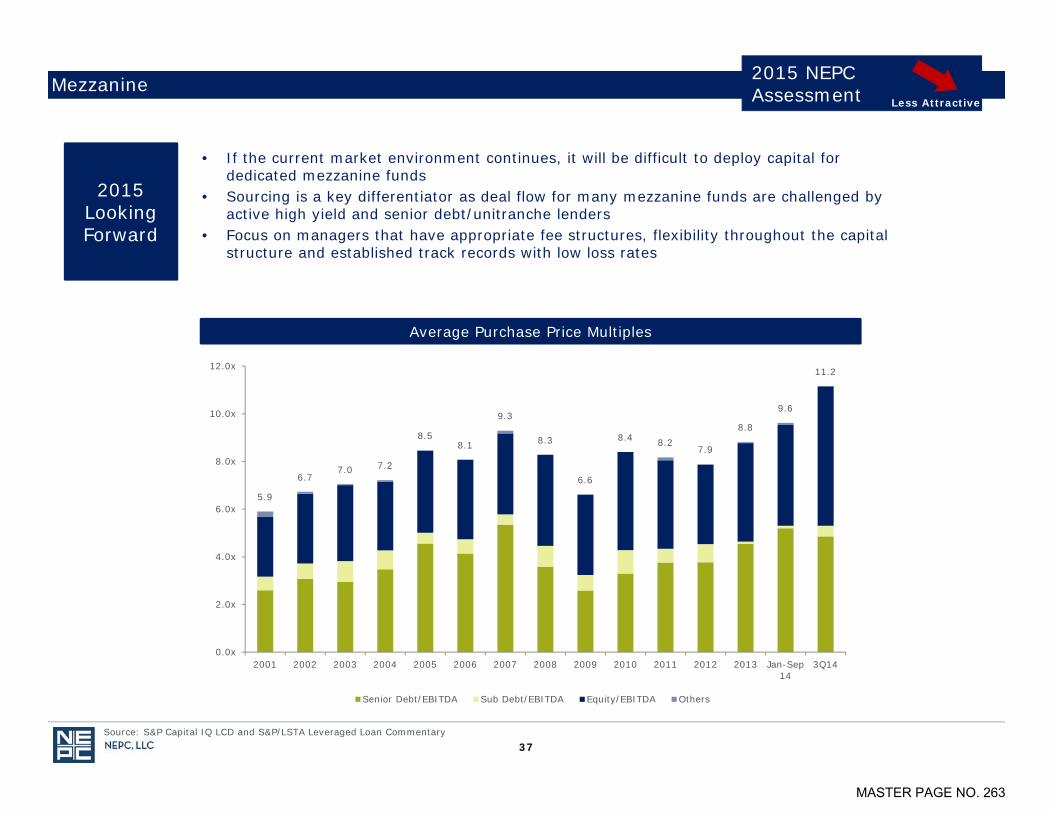
• If the current market environment continues, it will be difficult to deploy capital for dedicated mezzanine funds
• Sourcing is a key differentiator as deal flow for many mezzanine funds are challenged by active high yield and senior debt/unitranche lenders
• Focus on managers that have appropriate fee structures, flexibility throughout the capital structure and established track records with low loss rates
Mezzanine
37
2015 NEPCAssessment
Source: S&P Capital IQ LCD and S&P/LSTA Leveraged Loan Commentary
Average Purchase Price Multiples
5.9
6.77.0 7.2
8.58.1
9.3
8.3
6.6
8.4 8.27.9
8.8
9.6
11.2
0.0x
2.0x
4.0x
6.0x
8.0x
10.0x
12.0x
2001 2002 2003 2004 2005 2006 2007 2008 2009 2010 2011 2012 2013 Jan-Sep14
3Q14
Senior Debt/EBITDA Sub Debt/EBITDA Equity/EBITDA Others
2015 Looking Forward
Less Attractive
MASTER PAGE NO. 263
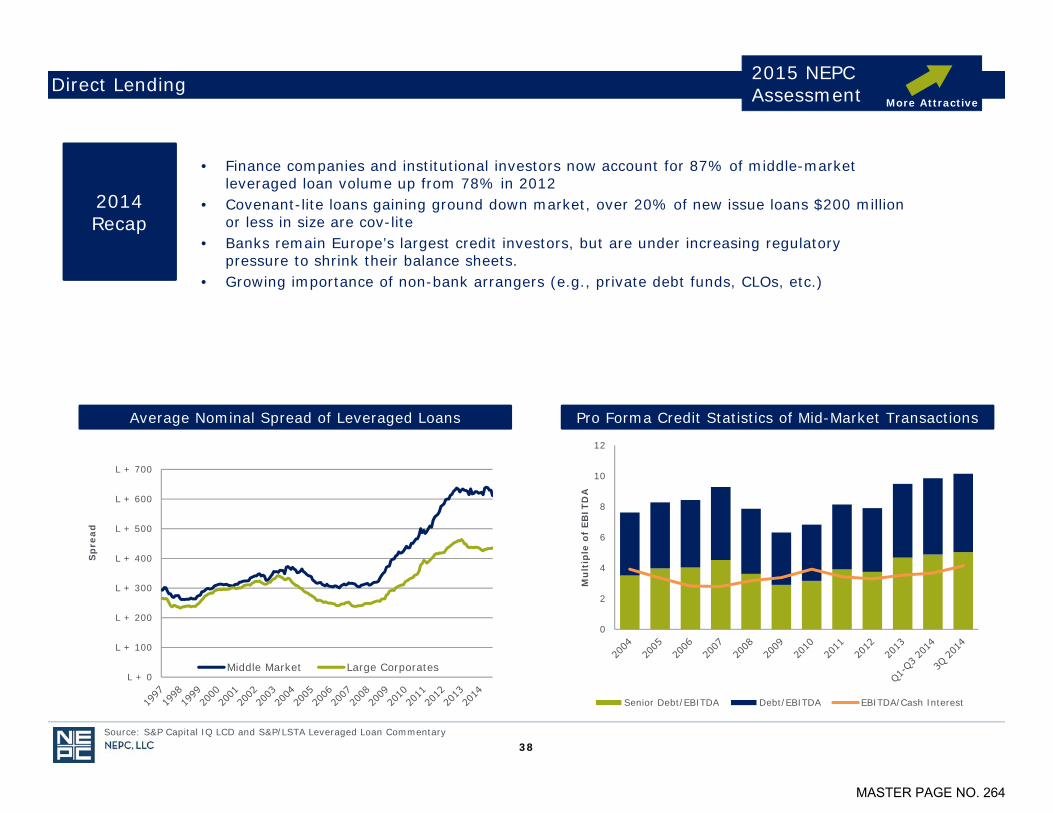
Direct Lending
38
Average Nominal Spread of Leveraged Loans
Source: S&P Capital IQ LCD and S&P/LSTA Leveraged Loan Commentary
Pro Forma Credit Statistics of Mid-Market Transactions
2015 NEPCAssessment
• Finance companies and institutional investors now account for 87% of middle-market leveraged loan volume up from 78% in 2012
• Covenant-lite loans gaining ground down market, over 20% of new issue loans $200 million or less in size are cov-lite
• Banks remain Europe’s largest credit investors, but are under increasing regulatory pressure to shrink their balance sheets.
• Growing importance of non-bank arrangers (e.g., private debt funds, CLOs, etc.)
More Attractive
L + 0
L + 100
L + 200
L + 300
L + 400
L + 500
L + 600
L + 700
Sp
read
Middle Market Large Corporates
0
2
4
6
8
10
12
Mu
ltip
le o
f EB
ITD
A
Senior Debt/EBITDA Debt/EBITDA EBITDA/Cash Interest
2014 Recap
MASTER PAGE NO. 264
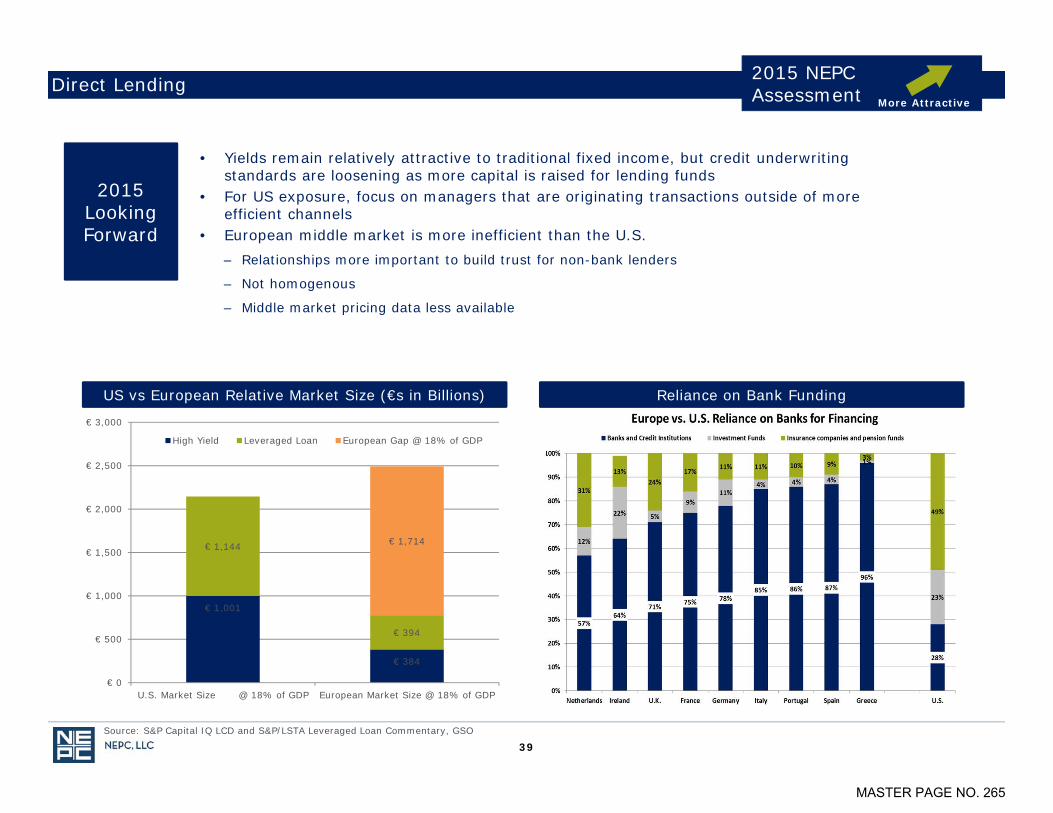
Direct Lending
39
US vs European Relative Market Size (€s in Billions)
Source: S&P Capital IQ LCD and S&P/LSTA Leveraged Loan Commentary, GSO
2015 NEPCAssessment
• Yields remain relatively attractive to traditional fixed income, but credit underwriting standards are loosening as more capital is raised for lending funds
• For US exposure, focus on managers that are originating transactions outside of more efficient channels
• European middle market is more inefficient than the U.S.– Relationships more important to build trust for non-bank lenders
– Not homogenous
– Middle market pricing data less available
Reliance on Bank Funding
€ 1,001
€ 384
€ 1,144
€ 394
€ 1,714
€ 0
€ 500
€ 1,000
€ 1,500
€ 2,000
€ 2,500
€ 3,000
U.S. Market Size @ 18% of GDP European Market Size @ 18% of GDP
High Yield Leveraged Loan European Gap @ 18% of GDP
More Attractive
2015 Looking Forward
MASTER PAGE NO. 265

• NEPC’s private markets pacing analysis projects a potential level of future assets and cash flows for a single scenario based on a series of assumptions. This analysis is intended to help estimate future exposure levels. It is not a guarantee of future cash flows, appreciation or returns.
• The timing and amounts of projected future cash flows and market values of investments could vary significantly from the amounts projected in this pacing analysis due to manager-specific and industry-wide macroeconomic factors.
• Estimates of projected cash flows and market values for existing private markets commitments were made at the Fund level and do not incorporate any underlying portfolio company projections or analysis.
• The opinions presented herein represent the good faith views of NEPC as of the date of this report and are subject to change at any time.
• Data used to prepare this report was obtained directly from the investment managers and other third parties. While NEPC has exercised reasonable professional care in preparing this report, we cannot guarantee the accuracy of all source information contained within.
• This report may contain confidential or proprietary information and is intended only for the designated recipient(s). If you are not a designated recipient, you may not copy or distribute this document.
Pacing Plan Disclaimers
MASTER PAGE NO. 266
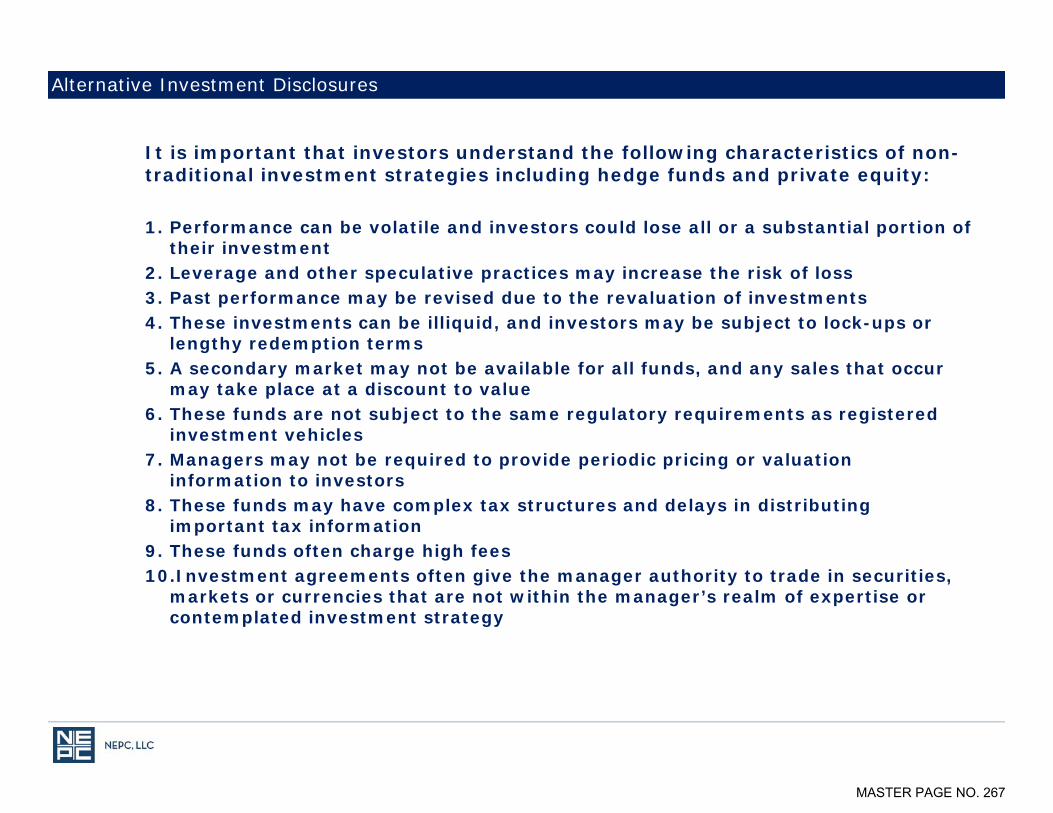
It is important that investors understand the following characteristics of non-traditional investment strategies including hedge funds and private equity:
1. Performance can be volatile and investors could lose all or a substantial portion of their investment
2. Leverage and other speculative practices may increase the risk of loss3. Past performance may be revised due to the revaluation of investments 4. These investments can be illiquid, and investors may be subject to lock-ups or
lengthy redemption terms5. A secondary market may not be available for all funds, and any sales that occur
may take place at a discount to value6. These funds are not subject to the same regulatory requirements as registered
investment vehicles7. Managers may not be required to provide periodic pricing or valuation
information to investors8. These funds may have complex tax structures and delays in distributing
important tax information9. These funds often charge high fees10.Investment agreements often give the manager authority to trade in securities,
markets or currencies that are not within the manager’s realm of expertise or contemplated investment strategy
Alternative Investment Disclosures
MASTER PAGE NO. 267

Ventura County Employees'Retirement AssociationPreliminary Performance ReportMonth Ending March 31, 2015
Daniel LeBeau, ConsultantAllan Martin, Partner,Anthony Ferrara, CAIA, Senior Analyst
MASTER PAGE NO. 268
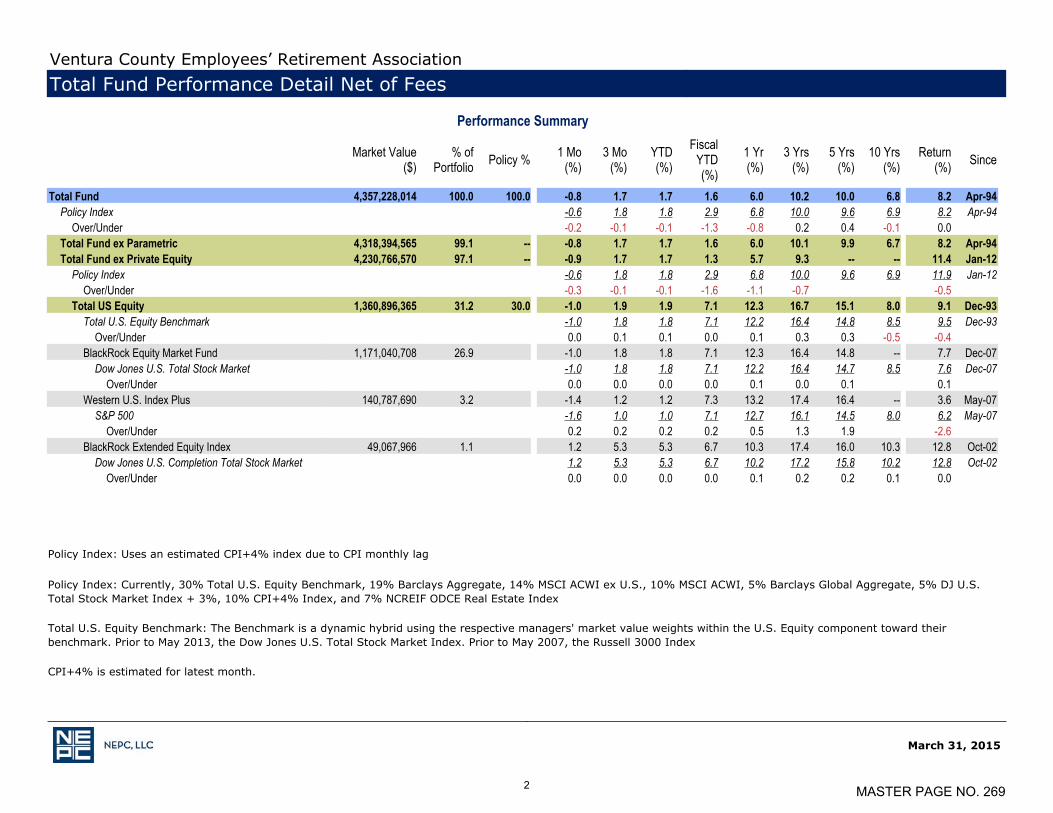
March 31, 2015
Policy Index: Uses an estimated CPI+4% index due to CPI monthly lag
Policy Index: Currently, 30% Total U.S. Equity Benchmark, 19% Barclays Aggregate, 14% MSCI ACWI ex U.S., 10% MSCI ACWI, 5% Barclays Global Aggregate, 5% DJ U.S.Total Stock Market Index + 3%, 10% CPI+4% Index, and 7% NCREIF ODCE Real Estate Index
Total U.S. Equity Benchmark: The Benchmark is a dynamic hybrid using the respective managers' market value weights within the U.S. Equity component toward theirbenchmark. Prior to May 2013, the Dow Jones U.S. Total Stock Market Index. Prior to May 2007, the Russell 3000 Index
CPI+4% is estimated for latest month.
Ventura County Employees’ Retirement AssociationTotal Fund Performance Detail Net of Fees
Performance Summary
Market Value($)
% ofPortfolio Policy % 1 Mo
(%)3 Mo
(%)YTD(%)
FiscalYTD(%)
1 Yr(%)
3 Yrs(%)
5 Yrs(%)
10 Yrs(%)
Return(%) Since
_
Total Fund 4,357,228,014 100.0 100.0 -0.8 1.7 1.7 1.6 6.0 10.2 10.0 6.8 8.2 Apr-94Policy Index -0.6 1.8 1.8 2.9 6.8 10.0 9.6 6.9 8.2 Apr-94
Over/Under -0.2 -0.1 -0.1 -1.3 -0.8 0.2 0.4 -0.1 0.0 Total Fund ex Parametric 4,318,394,565 99.1 -- -0.8 1.7 1.7 1.6 6.0 10.1 9.9 6.7 8.2 Apr-94Total Fund ex Private Equity 4,230,766,570 97.1 -- -0.9 1.7 1.7 1.3 5.7 9.3 -- -- 11.4 Jan-12
Policy Index -0.6 1.8 1.8 2.9 6.8 10.0 9.6 6.9 11.9 Jan-12Over/Under -0.3 -0.1 -0.1 -1.6 -1.1 -0.7 -0.5
Total US Equity 1,360,896,365 31.2 30.0 -1.0 1.9 1.9 7.1 12.3 16.7 15.1 8.0 9.1 Dec-93Total U.S. Equity Benchmark -1.0 1.8 1.8 7.1 12.2 16.4 14.8 8.5 9.5 Dec-93
Over/Under 0.0 0.1 0.1 0.0 0.1 0.3 0.3 -0.5 -0.4 BlackRock Equity Market Fund 1,171,040,708 26.9 -1.0 1.8 1.8 7.1 12.3 16.4 14.8 -- 7.7 Dec-07
Dow Jones U.S. Total Stock Market -1.0 1.8 1.8 7.1 12.2 16.4 14.7 8.5 7.6 Dec-07Over/Under 0.0 0.0 0.0 0.0 0.1 0.0 0.1 0.1
Western U.S. Index Plus 140,787,690 3.2 -1.4 1.2 1.2 7.3 13.2 17.4 16.4 -- 3.6 May-07S&P 500 -1.6 1.0 1.0 7.1 12.7 16.1 14.5 8.0 6.2 May-07
Over/Under 0.2 0.2 0.2 0.2 0.5 1.3 1.9 -2.6 BlackRock Extended Equity Index 49,067,966 1.1 1.2 5.3 5.3 6.7 10.3 17.4 16.0 10.3 12.8 Oct-02
Dow Jones U.S. Completion Total Stock Market 1.2 5.3 5.3 6.7 10.2 17.2 15.8 10.2 12.8 Oct-02Over/Under 0.0 0.0 0.0 0.0 0.1 0.2 0.2 0.1 0.0
2 MASTER PAGE NO. 269

March 31, 2015
Total Non-U.S. Equity Benchmark: MSCI ACWI ex US Free, prior to May 2002, the MSCI EAFE
Ventura County Employees’ Retirement AssociationTotal Fund Performance Detail Net of Fees
Market Value($)
% ofPortfolio Policy % 1 Mo
(%)3 Mo
(%)YTD(%)
FiscalYTD(%)
1 Yr(%)
3 Yrs(%)
5 Yrs(%)
10 Yrs(%)
Return(%) Since
_
Total Non-US Equity 617,229,438 14.2 14.0 -1.8 3.1 3.1 -5.5 -1.1 6.9 5.5 5.5 6.6 Mar-94Total Non-US Equity Benchmark -1.6 3.5 3.5 -5.8 -1.0 6.4 4.8 5.5 5.4 Mar-94
Over/Under -0.2 -0.4 -0.4 0.3 -0.1 0.5 0.7 0.0 1.2 BlackRock ACWI ex-U.S. Index 258,178,876 5.9 -1.5 3.6 3.6 -5.8 -1.2 6.7 5.2 -- 1.8 Mar-07
MSCI ACWI ex USA -1.6 3.5 3.5 -5.8 -1.0 6.4 4.8 5.5 1.4 Mar-07Over/Under 0.1 0.1 0.1 0.0 -0.2 0.3 0.4 0.4
Sprucegrove 184,158,765 4.2 -2.6 2.0 2.0 -6.8 -3.2 7.0 6.5 5.8 8.0 Mar-02MSCI EAFE -1.5 4.9 4.9 -4.8 -0.9 9.0 6.2 4.9 6.5 Mar-02
Over/Under -1.1 -2.9 -2.9 -2.0 -2.3 -2.0 0.3 0.9 1.5 MSCI ACWI ex USA -1.6 3.5 3.5 -5.8 -1.0 6.4 4.8 5.5 7.1 Mar-02
Hexavest 80,358,439 1.8 -1.8 3.7 3.7 -4.3 0.0 7.6 -- -- 4.9 Dec-10MSCI EAFE -1.5 4.9 4.9 -4.8 -0.9 9.0 6.2 4.9 5.6 Dec-10
Over/Under -0.3 -1.2 -1.2 0.5 0.9 -1.4 -0.7 Walter Scott 94,533,357 2.2 -0.9 3.4 3.4 -2.6 2.5 6.2 -- -- 4.8 Dec-10
MSCI ACWI ex USA -1.6 3.5 3.5 -5.8 -1.0 6.4 4.8 5.5 3.5 Dec-10Over/Under 0.7 -0.1 -0.1 3.2 3.5 -0.2 1.3
Total Global Equity 440,946,810 10.1 10.0 -2.0 2.5 2.5 -2.2 2.7 9.7 8.8 -- 5.7 May-05MSCI ACWI -1.5 2.3 2.3 0.4 5.4 10.7 9.0 6.4 6.7 May-05
Over/Under -0.5 0.2 0.2 -2.6 -2.7 -1.0 -0.2 -1.0 BlackRock MSCI ACWI Equity Index 227,794,793 5.2 -1.5 2.4 2.4 0.6 5.8 -- -- -- -- May-12
MSCI ACWI -1.5 2.3 2.3 0.4 5.4 10.7 9.0 6.4 15.6 May-12Over/Under 0.0 0.1 0.1 0.2 0.4
GMO Global Equity 213,152,017 4.9 -2.5 2.5 2.5 -5.0 -0.4 8.8 8.4 -- 6.7 Apr-05MSCI ACWI -1.5 2.3 2.3 0.4 5.4 10.7 9.0 6.4 6.7 Apr-05
Over/Under -1.0 0.2 0.2 -5.4 -5.8 -1.9 -0.6 0.0
3 MASTER PAGE NO. 270
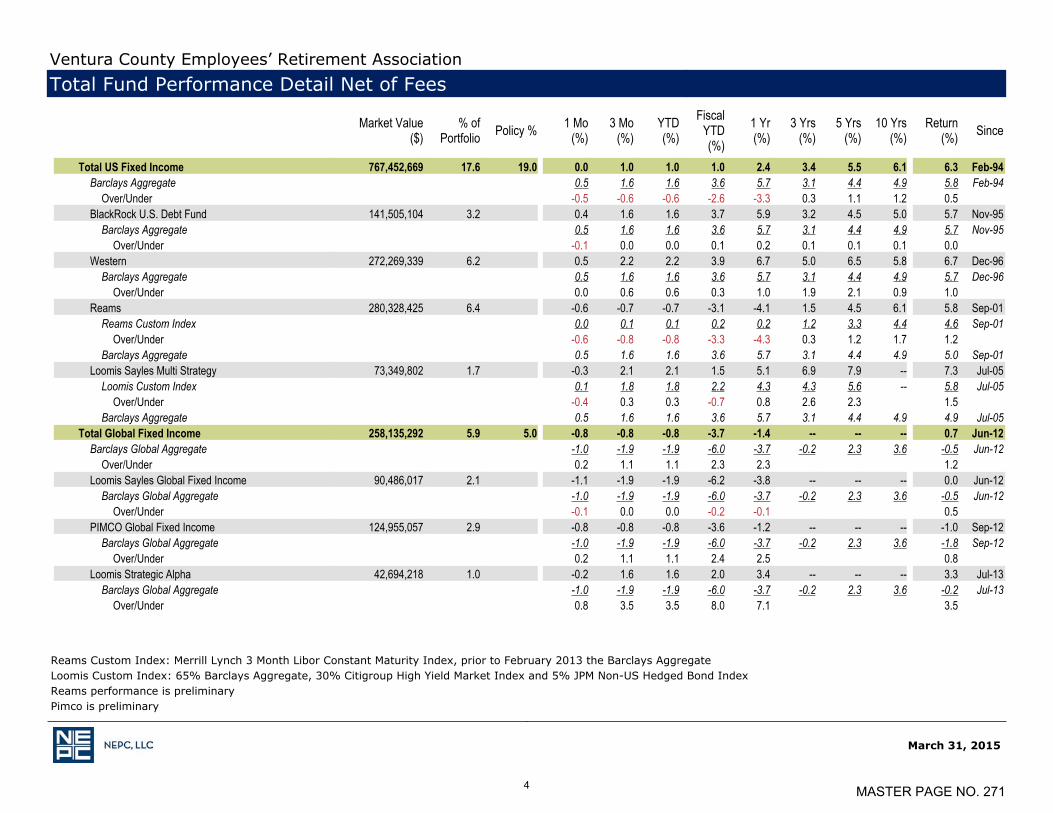
Reams Custom Index: Merrill Lynch 3 Month Libor Constant Maturity Index, prior to February 2013 the Barclays AggregateLoomis Custom Index: 65% Barclays Aggregate, 30% Citigroup High Yield Market Index and 5% JPM Non-US Hedged Bond IndexReams performance is preliminaryPimco is preliminary
Market Value($)
% ofPortfolio Policy % 1 Mo
(%)3 Mo
(%)YTD(%)
FiscalYTD(%)
1 Yr(%)
3 Yrs(%)
5 Yrs(%)
10 Yrs(%)
Return(%) Since
_
Total US Fixed Income 767,452,669 17.6 19.0 0.0 1.0 1.0 1.0 2.4 3.4 5.5 6.1 6.3 Feb-94Barclays Aggregate 0.5 1.6 1.6 3.6 5.7 3.1 4.4 4.9 5.8 Feb-94
Over/Under -0.5 -0.6 -0.6 -2.6 -3.3 0.3 1.1 1.2 0.5 BlackRock U.S. Debt Fund 141,505,104 3.2 0.4 1.6 1.6 3.7 5.9 3.2 4.5 5.0 5.7 Nov-95
Barclays Aggregate 0.5 1.6 1.6 3.6 5.7 3.1 4.4 4.9 5.7 Nov-95Over/Under -0.1 0.0 0.0 0.1 0.2 0.1 0.1 0.1 0.0
Western 272,269,339 6.2 0.5 2.2 2.2 3.9 6.7 5.0 6.5 5.8 6.7 Dec-96Barclays Aggregate 0.5 1.6 1.6 3.6 5.7 3.1 4.4 4.9 5.7 Dec-96
Over/Under 0.0 0.6 0.6 0.3 1.0 1.9 2.1 0.9 1.0 Reams 280,328,425 6.4 -0.6 -0.7 -0.7 -3.1 -4.1 1.5 4.5 6.1 5.8 Sep-01
Reams Custom Index 0.0 0.1 0.1 0.2 0.2 1.2 3.3 4.4 4.6 Sep-01Over/Under -0.6 -0.8 -0.8 -3.3 -4.3 0.3 1.2 1.7 1.2
Barclays Aggregate 0.5 1.6 1.6 3.6 5.7 3.1 4.4 4.9 5.0 Sep-01Loomis Sayles Multi Strategy 73,349,802 1.7 -0.3 2.1 2.1 1.5 5.1 6.9 7.9 -- 7.3 Jul-05
Loomis Custom Index 0.1 1.8 1.8 2.2 4.3 4.3 5.6 -- 5.8 Jul-05Over/Under -0.4 0.3 0.3 -0.7 0.8 2.6 2.3 1.5
Barclays Aggregate 0.5 1.6 1.6 3.6 5.7 3.1 4.4 4.9 4.9 Jul-05Total Global Fixed Income 258,135,292 5.9 5.0 -0.8 -0.8 -0.8 -3.7 -1.4 -- -- -- 0.7 Jun-12
Barclays Global Aggregate -1.0 -1.9 -1.9 -6.0 -3.7 -0.2 2.3 3.6 -0.5 Jun-12Over/Under 0.2 1.1 1.1 2.3 2.3 1.2
Loomis Sayles Global Fixed Income 90,486,017 2.1 -1.1 -1.9 -1.9 -6.2 -3.8 -- -- -- 0.0 Jun-12Barclays Global Aggregate -1.0 -1.9 -1.9 -6.0 -3.7 -0.2 2.3 3.6 -0.5 Jun-12
Over/Under -0.1 0.0 0.0 -0.2 -0.1 0.5 PIMCO Global Fixed Income 124,955,057 2.9 -0.8 -0.8 -0.8 -3.6 -1.2 -- -- -- -1.0 Sep-12
Barclays Global Aggregate -1.0 -1.9 -1.9 -6.0 -3.7 -0.2 2.3 3.6 -1.8 Sep-12Over/Under 0.2 1.1 1.1 2.4 2.5 0.8
Loomis Strategic Alpha 42,694,218 1.0 -0.2 1.6 1.6 2.0 3.4 -- -- -- 3.3 Jul-13Barclays Global Aggregate -1.0 -1.9 -1.9 -6.0 -3.7 -0.2 2.3 3.6 -0.2 Jul-13
Over/Under 0.8 3.5 3.5 8.0 7.1 3.5
March 31, 2015
Ventura County Employees’ Retirement AssociationTotal Fund Performance Detail Net of Fees
4 MASTER PAGE NO. 271

Market Value($)
% ofPortfolio Policy % 1 Mo
(%)3 Mo
(%)YTD(%)
FiscalYTD(%)
1 Yr(%)
3 Yrs(%)
5 Yrs(%)
10 Yrs(%)
Return(%) Since
_
Total Real Estate 322,351,195 7.4 7.0 0.0 0.0 0.0 6.2 9.1 9.4 12.1 4.7 7.7 Mar-94Total Real Estate Benchmark 0.0 0.0 0.0 6.6 9.7 11.4 13.8 6.6 8.7 Mar-94
Over/Under 0.0 0.0 0.0 -0.4 -0.6 -2.0 -1.7 -1.9 -1.0 Prudential Real Estate 107,886,266 2.5 0.0 0.0 0.0 6.9 10.2 10.6 14.2 5.6 5.1 Jun-04UBS Real Estate 208,224,343 4.8 0.0 0.0 0.0 5.8 8.1 8.7 11.0 6.1 7.2 Mar-03RREEF 6,240,585 0.1 0.0 0.0 0.0 7.3 21.3 20.0 26.2 -- -6.3 Sep-07
Total Liquid Alternatives 424,921,353 9.8 10.0 -1.3 1.7 1.7 -2.5 6.5 -- -- -- 12.1 Apr-13CPI + 4% (Unadjusted) 0.8 1.4 1.4 1.9 3.8 4.9 5.7 6.1 4.7 Apr-13
Over/Under -2.1 0.3 0.3 -4.4 2.7 7.4 Bridgewater All Weather Fund 284,498,548 6.5 -0.4 3.7 3.7 1.9 7.6 -- -- -- 9.5 Aug-13
CPI + 5% (Unadjusted) 0.8 1.6 1.6 2.6 4.8 -- -- -- 5.5 Aug-13Over/Under -1.2 2.1 2.1 -0.7 2.8 4.0
Tortoise Energy Infrastructure 140,422,805 3.2 -3.1 -2.2 -2.2 -10.5 4.3 -- -- -- 13.4 Apr-13Wells Fargo MLP Index -3.6 -3.7 -3.7 -13.3 -0.7 10.5 -- -- 4.3 Apr-13
Over/Under 0.5 1.5 1.5 2.8 5.0 9.1
March 31, 2015
Total Real Estate Benchmark: NCREIF ODCE; prior to January 2006, the NCREIF Property IndexReal Estate managers and NCREIF ODCE are valued on a quarterly basis. Performance is not applicable in mid-quarter months, therefore 0% return is shown.Total Liquid Alternatives index, the CPI+4% is estimated by carrying the last available month forwardCPI+5% and CPI+4% are estimated by carrying the last available month forwardReal Estate Valuation is as of 12/31/2014
Ventura County Employees’ Retirement AssociationTotal Fund Performance Detail Net of Fees
5 MASTER PAGE NO. 272

March 31, 2015
Please Note:Private Equity performance is shown on a time-weighted return basis. Values are cash adjusted with current month cash flows.
Ventura County Employees’ Retirement AssociationTotal Fund Performance Detail Net of Fees
Market Value($)
% ofPortfolio Policy % 1 Mo
(%)3 Mo
(%)YTD(%)
FiscalYTD(%)
1 Yr(%)
3 Yrs(%)
5 Yrs(%)
10 Yrs(%)
Return(%) Since
_
Overlay 38,833,449 0.9 0.0 Parametric 38,833,449 0.9
Total Private Equity 126,461,444 2.9 5.0 2.2 4.5 4.5 12.3 18.5 16.0 -- -- -- Jul-10DJ U.S. Total Stock Market Index + 3% -0.8 2.6 2.6 9.4 15.6 19.8 18.2 -- 20.6 Jul-10
Over/Under 3.0 1.9 1.9 2.9 2.9 -3.8 Adams Street Partners 77,594,905 1.8 3.2 3.2 3.2 10.5 16.5 14.8 -- -- -- Jul-10
DJ U.S. Total Stock Market Index + 3% -0.8 2.6 2.6 9.4 15.6 19.8 18.2 -- 20.6 Jul-10Over/Under 4.0 0.6 0.6 1.1 0.9 -5.0
Panteon Ventures 14,663,333 0.3 2.1 2.2 2.2 5.5 12.7 12.1 -- -- -- Aug-10DJ U.S. Total Stock Market Index + 3% -0.8 2.6 2.6 9.4 15.6 19.8 18.2 -- 22.2 Aug-10
Over/Under 2.9 -0.4 -0.4 -3.9 -2.9 -7.7 Harbourvest 34,203,207 0.8 0.0 7.9 7.9 19.1 25.9 -- -- -- -- May-13
DJ U.S. Total Stock Market Index + 3% -0.8 2.6 2.6 9.4 15.6 19.8 18.2 -- 19.9 May-13Over/Under 0.8 5.3 5.3 9.7 10.3
XXXXX
6 MASTER PAGE NO. 273
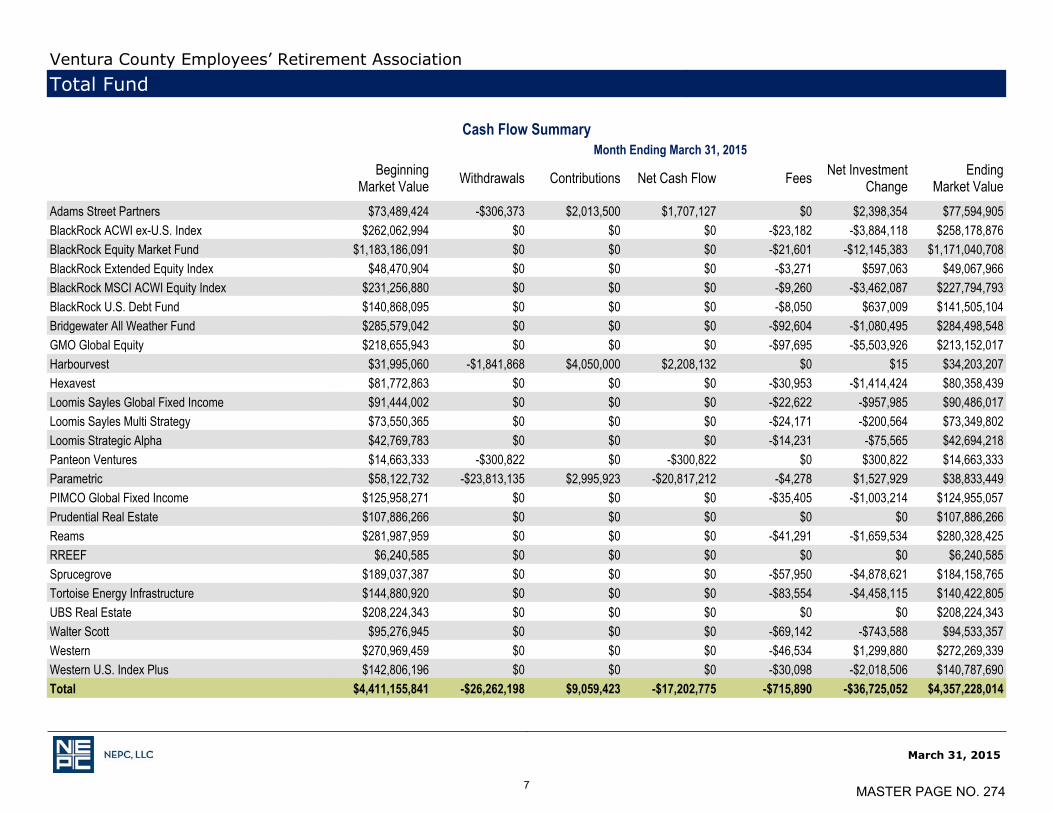
March 31, 2015
Ventura County Employees’ Retirement AssociationTotal Fund
Cash Flow Summary Month Ending March 31, 2015
BeginningMarket Value Withdrawals Contributions Net Cash Flow Fees Net Investment
ChangeEnding
Market Value_
Adams Street Partners $73,489,424 -$306,373 $2,013,500 $1,707,127 $0 $2,398,354 $77,594,905BlackRock ACWI ex-U.S. Index $262,062,994 $0 $0 $0 -$23,182 -$3,884,118 $258,178,876BlackRock Equity Market Fund $1,183,186,091 $0 $0 $0 -$21,601 -$12,145,383 $1,171,040,708BlackRock Extended Equity Index $48,470,904 $0 $0 $0 -$3,271 $597,063 $49,067,966BlackRock MSCI ACWI Equity Index $231,256,880 $0 $0 $0 -$9,260 -$3,462,087 $227,794,793BlackRock U.S. Debt Fund $140,868,095 $0 $0 $0 -$8,050 $637,009 $141,505,104Bridgewater All Weather Fund $285,579,042 $0 $0 $0 -$92,604 -$1,080,495 $284,498,548GMO Global Equity $218,655,943 $0 $0 $0 -$97,695 -$5,503,926 $213,152,017Harbourvest $31,995,060 -$1,841,868 $4,050,000 $2,208,132 $0 $15 $34,203,207Hexavest $81,772,863 $0 $0 $0 -$30,953 -$1,414,424 $80,358,439Loomis Sayles Global Fixed Income $91,444,002 $0 $0 $0 -$22,622 -$957,985 $90,486,017Loomis Sayles Multi Strategy $73,550,365 $0 $0 $0 -$24,171 -$200,564 $73,349,802Loomis Strategic Alpha $42,769,783 $0 $0 $0 -$14,231 -$75,565 $42,694,218Panteon Ventures $14,663,333 -$300,822 $0 -$300,822 $0 $300,822 $14,663,333Parametric $58,122,732 -$23,813,135 $2,995,923 -$20,817,212 -$4,278 $1,527,929 $38,833,449PIMCO Global Fixed Income $125,958,271 $0 $0 $0 -$35,405 -$1,003,214 $124,955,057Prudential Real Estate $107,886,266 $0 $0 $0 $0 $0 $107,886,266Reams $281,987,959 $0 $0 $0 -$41,291 -$1,659,534 $280,328,425RREEF $6,240,585 $0 $0 $0 $0 $0 $6,240,585Sprucegrove $189,037,387 $0 $0 $0 -$57,950 -$4,878,621 $184,158,765Tortoise Energy Infrastructure $144,880,920 $0 $0 $0 -$83,554 -$4,458,115 $140,422,805UBS Real Estate $208,224,343 $0 $0 $0 $0 $0 $208,224,343Walter Scott $95,276,945 $0 $0 $0 -$69,142 -$743,588 $94,533,357Western $270,969,459 $0 $0 $0 -$46,534 $1,299,880 $272,269,339Western U.S. Index Plus $142,806,196 $0 $0 $0 -$30,098 -$2,018,506 $140,787,690Total $4,411,155,841 -$26,262,198 $9,059,423 -$17,202,775 -$715,890 -$36,725,052 $4,357,228,014
XXXXX
7 MASTER PAGE NO. 274

April 20, 2015
Board of Retirement Ventura County Employee Retirement Association 1190 South Victoria Avenue Ventura, CA 93003
SUBJECT: CONSIDERATION OF QUIET PERIOD PER TRUSTEE COMMUNICATIONS POLICY
Dear Board Members,
VCERA’s current Trustee Communication Policy provides that the Board may institute a “quiet period” when the Board initiates a search process that may result in the appointment of a new service provider or in the expansion of its relationship with an existing service provider.
The Board is scheduled to hear presentations from 3 GTAA managers at the May 18th business meeting. These managers are GMO, PIMCO and Standard Life. The meeting will take place shortly after several trustees will be attending the SACRS conference which will also be attended by a good number of investment managers.
To ensure compliance with the Trustee Communication Policy, staff recommends consideration of a quiet period for these 3 managers. If the Board chooses to initiate such a quiet period, it must take action to do so. The quiet period will cease when a service provider has been appointed by the Board or the search process is otherwise ended, or if the Board ends the quiet period by later action.
VCERA staff will be pleased to respond to any questions you may have on this matter at April 20, 2015 business meeting.
Sincerely,
Linda Webb Retirement Administrator
MASTER PAGE NO. 275
VENTURA COUNTY EMPLOYEES’ RETIREMENT ASSOCIATION
TRUSTEE COMMUNICATIONS POLICY
I. Background and Objectives
1) The Board recognizes that effective communication is an integral part of theBoard’s role. To carry out its role effectively, the Board must establish effectiveprocesses and mechanisms for communicating with senior management, the plansponsor, plan members and external parties, and among Board membersthemselves.
2) The primary objectives of this policy are to:
a) Provide the Board, individual Board members, and senior management withguidelines for executing the communications function of the Board.
b) Encourage and facilitate open, accurate, timely, and effective communicationswith all interested parties.
II. Principles and Assumptions
3) Poorly executed or controlled communications by Board members may exposeVCERA to significant legal or operational risks involving member services, staffand Board relations, and general public or media relations.
4) A communications policy should mitigate communications risk, while stillenabling trustees to communicate freely and efficiently, subject to applicable laws.
III. Policy Guidelines
Communications Among Trustees
5) The Board shall carry out its activities in accordance with the spirit of opengovernance, including the provisions of the Brown Act, which include, but are notlimited to:
a) Properly noticing and posting an agenda for Board and standing committeemeetings, excluding the Personnel Committee (section 54954.2 of the BrownAct); and
b) Allowing public comment on agenda items before or during consideration bythe Board (Section 54954.3 of the Brown Act); and
c) Properly describing all items to be considered in closed session in the noticeor agenda for the meeting (Section 54954.5 of the Brown Act); and
1 | P a g e
MASTER PAGE NO. 276

VCERA Trustee Communications Policy
d) Not conducting, or participating in, a series of communications one at a time or in a group that in total constitutes a quorum of the Board or committee either directly or through intermediaries or electronic devices, for the purpose of developing a concurrence as to action to be taken (where prohibited by Section 54953 of the Brown Act); and
e) Ensuring materials are properly made available to members of the public, upon request, without delay (Section 54957.5 of the Brown Act).
6) Trustees shall disclose any information they may have that is pertinent to the affairs of VCERA to the rest of the Board in a timely manner.
7) During meetings of the Board and committees, trustees shall communicate in a straightforward, constructive manner.
Trustee Communications With Plan Members
8) Trustees will refrain from providing explicit advice or education to plan members with respect to the technicalities of the plan provisions, where there is a risk that:
a) the advice or information conveyed may be inappropriate, inaccurate, or misunderstood by the member; and
b) the member may act on the advice or information conveyed to his or her detriment, thereby creating potential liability for VCERA.
9) In the event a plan member requests that a trustee provide explicit advice or education with respect to the technicalities of the plan provisions, the trustee is encouraged to assist the plan member by either:
a) Referring the plan member to the Retirement Administrator; or
b) Providing the plan member’s contact information to the Retirement Administrator for follow-up.
Trustee Communications with VCERA Management
10) Trustees with concerns or questions concerning any aspect of VCERA operations shall direct them to the Retirement Administrator, who shall in turn direct staff as required in order to provide the trustee with a suitable response.
11) Requests for information that require significant expenditure of staff time or external resources, including those of County Counsel, shall:
a) Be consistent with the role and responsibilities of the Board;
b) Be requested at Board or committee meetings; and
c) Be directed to the Retirement Administrator.
2 | P a g e
MASTER PAGE NO. 277
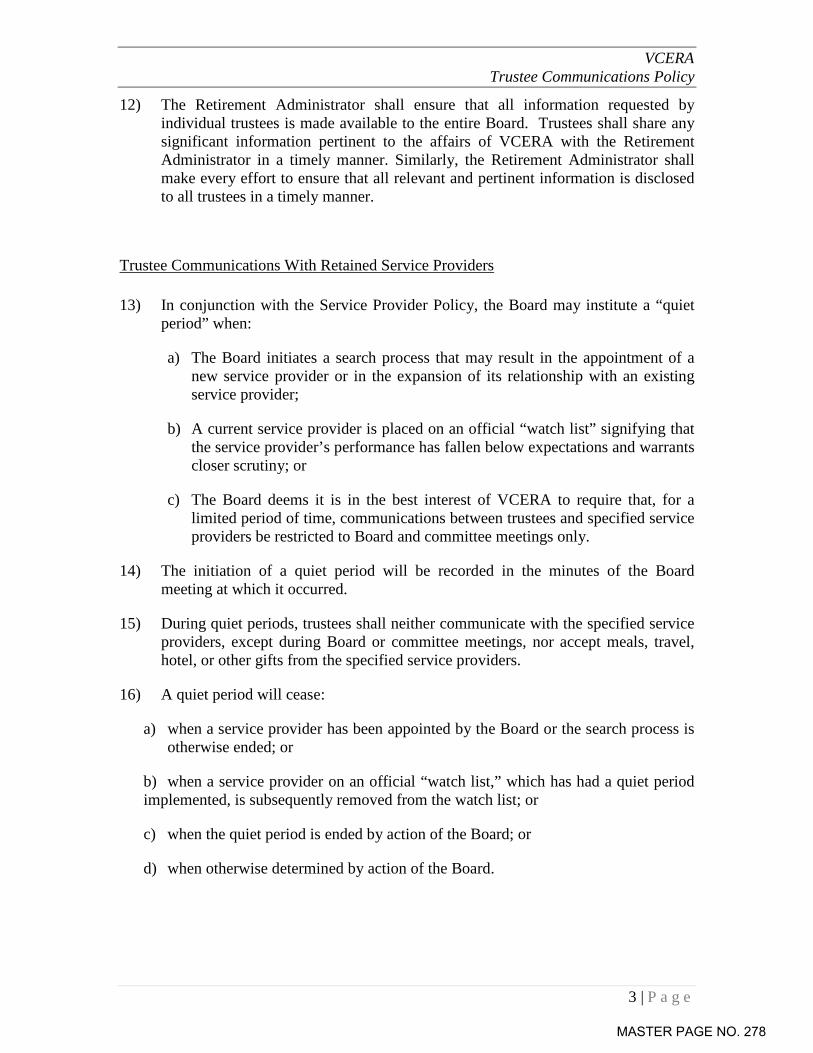
VCERA Trustee Communications Policy
12) The Retirement Administrator shall ensure that all information requested by individual trustees is made available to the entire Board. Trustees shall share any significant information pertinent to the affairs of VCERA with the Retirement Administrator in a timely manner. Similarly, the Retirement Administrator shall make every effort to ensure that all relevant and pertinent information is disclosed to all trustees in a timely manner.
Trustee Communications With Retained Service Providers
13) In conjunction with the Service Provider Policy, the Board may institute a “quiet period” when:
a) The Board initiates a search process that may result in the appointment of a new service provider or in the expansion of its relationship with an existing service provider;
b) A current service provider is placed on an official “watch list” signifying that the service provider’s performance has fallen below expectations and warrants closer scrutiny; or
c) The Board deems it is in the best interest of VCERA to require that, for a limited period of time, communications between trustees and specified service providers be restricted to Board and committee meetings only.
14) The initiation of a quiet period will be recorded in the minutes of the Board meeting at which it occurred.
15) During quiet periods, trustees shall neither communicate with the specified service providers, except during Board or committee meetings, nor accept meals, travel, hotel, or other gifts from the specified service providers.
16) A quiet period will cease:
a) when a service provider has been appointed by the Board or the search process is otherwise ended; or
b) when a service provider on an official “watch list,” which has had a quiet period implemented, is subsequently removed from the watch list; or
c) when the quiet period is ended by action of the Board; or
d) when otherwise determined by action of the Board.
3 | P a g e
MASTER PAGE NO. 278

VCERA Trustee Communications Policy
Trustee Communications With External Parties
17) In general, when communicating with external parties, the following guidelines will apply:
a) When communicating in their fiduciary capacities, trustees will ensure that all communications are consistent with their sole and exclusive fiduciary duty to represent the interests of all plan members;
b) Trustees will not communicate on behalf of the Board unless authorized by the Board to do so;
c) Trustees may voice their disagreement with decisions or policies of the Board, but shall do so in a respectful and professional manner; and
d) Trustees are expected to disclose when they are representing a personal position and clearly indicate if their position does not reflect the official position or policy of the Board.
18) The Retirement Administrator shall serve as official spokesperson for VCERA. The Retirement Administrator will, however, discuss with the Chair any public relations matters that are potentially sensitive or controversial to determine the most appropriate response and to determine whether the Retirement Administrator or the Chair should act as spokesperson on the matter.
19) If it would be inappropriate for the Retirement Administrator to serve as spokesperson on a particular matter (for example, if the issue pertains to the conduct of the Retirement Administrator), then the Chair shall serve as spokesperson.
20) Trustees are encouraged to direct all media enquiries to the Retirement Administrator for a response. Should trustees choose to respond to the enquiry themselves, they shall refrain from making unilateral commitments on behalf of the Board or VCERA and shall disclose when they are not representing an approved position of the Board or VCERA.
21) Trustees who wish to publish articles, letters or similar communication materials pertaining to VCERA and containing technical information concerning benefit provisions, will submit them in advance to the Retirement Administrator who will review them for technical accuracy. All such communications will contain a disclaimer indicating that the views expressed are those of the author and do not necessarily reflect the official position of the Board.
IV. Policy Review
22) The Board shall review this policy at least every three (3) years to ensure that it remains relevant and appropriate.
4 | P a g e
MASTER PAGE NO. 279

VCERA Trustee Communications Policy
V. Policy History
1) The Board last reviewed and approved this policy on June 17, 2013. This policy was adopted by the Board on June 2, 2003.
5 | P a g e
MASTER PAGE NO. 280
April 20, 2015
Board of Retirement Ventura County Employees’ Retirement Association 1190 South Victoria Avenue, Suite 200 Ventura, CA 93003
SUBJECT: AUTHORIZATION FOR TRUSTEE GOULET TO ATTEND THE NOSSAMAN LLP PUBLIC PENSIONS & INVESTMENTS FIDUCIARIES FORUM SEPTEMBER 24TH – 25TH, IN SAN FRANCISCO.
Dear Board Members:
Staff recommends authorization for Trustee Goulet to attend the Nossaman LLP Public Pensions & Investments Fiduciaries Forum September 24th & 25th in San Francisco. The cost to attend will be approximately $1,000, including registration, airfare, lodging and other related expenses.
VCERA staff will be pleased to respond to any questions you may have on this matter at April 20, 2015 business meeting.
Sincerely,
Linda Webb Retirement Administrator
MASTER PAGE NO. 281

Nossaman LLP’s Public Pensions and Investments Fiduciaries' Forum
September 24-25, 2015 | San Francisco, CA
You are invited to Nossaman’s First Annual Public Pensions and InvestmentsFiduciaries' Forum!
Nossaman is pleased to announce the continuation of the Public Pension Fiduciaries'Forum – a nearly decade-long tradition – hosted by Ashley Dunning and MichaelToumanoff.
Please join us in San Francisco this September (details to follow this summer) to discusscurrent and emerging public pension topics of 2015 and 2016, including:
Court cases on PEPRA and vested rightsCurrent trends in alternative investment documentation and diligenceEmployment issues in a civil service worldA bird’s eye view of real asset investingLunchtime speaker to be announced
Sept. 24, 2015 Dinner Reception, guest speaker on “What to expect from Sacramento in 2016"
Sept. 25, 2015 All-day Fiduciaries' Forum
Attendance is limited to trustees (less than a quorum), executive staff, and in-house counsel.Clients and prior participating plans have priority for registration. Conference is limited to 50attendees.
Cost: $250.00 per person (covers the cost of meals and incidentals).
For more information or to RSVP, please contact Jennifer Barry-Smith,[email protected], or 415.438.7232.
Ashley DunningPartner
Yuliya OryolPartner
Michael ToumanoffOf Counsel
John KennedyPartner
David KimportPartner
Clothilde HewlettPartner
Danielle GenschPartner
nossaman.com
The information contained herein does not constitute a legal opinion and should not be relied upon by the reader as legal advice or be regarded as a substitute for legal advice.The opinions expressed in this article are personal opinions of the authors and do not necessarily reflect opinions held by other members of the Firm or by clients of theFirm. Remove me from ALL Nossaman mailings. Copyright © 2015 Nossaman LLP. All rights reserved.
This email was sent to: [email protected] This email was sent by: Nossaman LLP, 777 South Figueroa Street, 34th Floor, Los Angeles, CA 90017
MASTER PAGE NO. 282

April 20, 2015
Board of Retirement Ventura County Employees’ Retirement Association 1190 South Victoria Avenue, Suite 200 Ventura, CA 93003
SUBJECT: AUTHORIZATION FOR MS. NEMIROFF TO ATTEND THE NATIONAL ASSOCIATION OF PUBLIC PENSION ATTORNEYS (NAPPA) LEGAL EDUCATION CONFERENCE JUNE 23RD – 25TH, IN AUSTIN, TX.
Dear Board Members:
Staff recommends authorization for Ms. Nemiroff to attend the National Association of Public Pension Attorney’s Legal Education Conference in Austin, Texas, June 23rd – 25th. The cost to attend is approximately $2300, including registration, airfare, lodging and other related expenses.
VCERA staff will be pleased to respond to any questions you may have on this matter at April 20, 2015 business meeting.
Sincerely,
Linda Webb Retirement Administrator
MASTER PAGE NO. 283

June 23-26, 2015New Attorney Session June 23rd
Austin HiltonAustin, TX
Legal EducationConference
2015
Photo Courtesy of Austin Convention & Visitors Bureau
MASTER PAGE NO. 284

www.nappa.org2
Conference At A GlanceTuesday, June 23, 2015 (1:00 p.m. - 5:00 p.m. Early Conference Registration)
1:00 p.m. - 3:00 p.m. New Member and Associate Counsel Session: The Basics
3:00 p.m. - 3:15 p.m. Break
3:15 p.m. - 4:45 p.m. New Member and Associate Counsel Session: Roundtable Discussion
5:15 p.m. - 6:30 p.m. Early Bird Reception (provided by NAPPA)
Wednesday, June 24, 2015 (7:00 a.m. - 5:00 p.m. Conference Registration)
7:00 a.m. - 8:00 a.m. Breakfast (provided by NAPPA) 7:00 a.m. - 8:00 a.m. Emeritus Board Breakfast (provided by NAPPA) 7:00 a.m. - 8:00 a.m. Administrators’ Roundtable Breakfast (provided by NAPPA)
8:00 a.m. - 8:30 a.m. Welcome and Introduction: Welcome to Austin, Texas
8:30 a.m. - 9:30 a.m. General Session: Federal Legislative Update
9:30 a.m. - 10:30 a.m. General Session: Benefit Reform Litigation
10:30 a.m. - 10:45 a.m. Break
10:45 a.m. - 12:15 p.m. General Session: Electronically Stored Information (E-Discovery)
12:15 p.m. - 1:30 p.m. Lunch (on your own)
1:30 p.m. - 2:30 p.m. Concurrent Workshops: (choose one) Session A: Doing Well by Doing Good - Emerging Manager and Directed Investment Programs Session B: Terminating Employers and Outsourcing of Employees
2:30 p.m. - 2:45 p.m. Break
2:45 p.m. - 4:15 p.m. Concurrent Workshops: (choose one) Session A: The Role of the General Counsel in Investment Transactions Session B: Tax Hot Topics
4:15 p.m. - 4:30 p.m. Break
4:30 p.m. - 5:30 p.m. Concurrent Sessions: (choose one) Health Plan Affinity Group: Catching Up on Notices, Regulations and Other Hot Topics Small/Medium Fund Affinity Group
7:00 p.m. - 9:00 p.m. NAPPA Dinner (Uncle Julio’s)
MASTER PAGE NO. 285

www.nappa.org 3
Thursday, June 25, 2015 (7:00 a.m. - 5:00 p.m. Conference Registration)
7:00 a.m. - 8:00 a.m. Breakfast (provided by NAPPA)
7:00 a.m. - 8:00 a.m. General Counsel Only Breakfast (provided by NAPPA)
8:00 a.m. - 8:30 a.m. NAPPA 2015 Annual Business Meeting
8:30 a.m. - 9:30 a.m. General Session: Ethics (Part 1)
9:30 a.m. - 10:30 a.m. General Session: Ethics (Part 2)
10:30 a.m. - 10:45 a.m. Break
10:45 a.m. - 12:15 p.m. Concurrent Workshops: (choose one) Session A: Protecting Data and Cyber Security Session B: A Lawyer, an Auditor and an Actuary Walk into a Bar (Funding Policy and GASB Implementation Tales From the Street)
12:15 p.m. - 1:30 p.m. Lunch (on your own)
1:30 p.m. - 2:30 p.m. Concurrent Workshops: (choose one) Session A: Funds, Fees and Affiliates (Oh, My!) - SEC OCIE’s Examination of the Private Fund World (What They Found and What it Means for Public Plans) Session B: “Age-Old and Newer Risks: What Every Retirement System Attorney Should Know About Insurance”
2:30 p.m. - 2:45 p.m. Break
2:45 p.m. - 4:15 p.m. Concurrent Workshops: (choose one) Session A: Securities Litigation Review: A Fiduciary’s Guide to Making the Best of a Bad Situation Session B: DB vs. Alternative Plans, Part II - A Discussion on the Pros and Cons
4:15 p.m. - 4:30 p.m. Break
4:30 p.m. - 5:30 p.m. Concurrent Sessions: (choose one) Public Safety Affinity Group: The Rise and Psychological Disability Claims in Public Safety Plans: A Psychiatrist’s View and Suggested Processes to Ensure Legitimate Awards DC Plan Affinity Group: Fiduciary Duty Hot Topics
Dinner (on your own)
Friday, June 26, 2015 (7:00 a.m. - noon Conference Registration)
7:00 a.m. - 8:00 a.m. Breakfast (provided by NAPPA)
8:00 a.m. - 9:30 a.m. General Session: Municipal Bankruptcy: Perspectives From Either Side of the Bench
9:30 a.m. - 10:30 a.m. General Session: Communications: Pondering the Potential and the Pitfalls
10:30 a.m. - 10:45 a.m. Break
10:45 a.m. - 11:45 a.m. General Session: Litigation Update
Conference At A Glance
MASTER PAGE NO. 286

www.nappa.org4
Registration and Hotel InformationRegistration InformationOnline registration begins Wednesday, April 1, 2015.
To register for the conference:
• Go to www.nappa.org• Click on Register Now for the 2015 Legal Education
Conference• Visa, MasterCard, and American Express accepted• If paying by check, please send payment to:
NAPPA2410 Hyde Park Road, Suite B
Jefferson City, MO 65109
Reminder: 2015 NAPPA dues must be paid prior to attending the June Legal Education Conference.
Conference Registration DeadlinesApril 1 - May 29, 2015 Legal Education Conference
registration openConference Fee: $895 (if registered before 5/30)
May 30 - June 10, 2015 Late registration fee appliedConference Fee: $995Includes late fee of $100
June 10, 2015 Last day to register for conference
Conference Cancellation PolicyPrior to May 29, 2015 Full Refund
May 30 - June 10, 2015 $150 Administrative Fee Charged
June 11, 2015 or after No Refund
Conference Room Block InformationThe room rate for the NAPPA block is available until the block is filled or May 25, 2015, whichever comes first.
The NAPPA block rate is $220. Please note: One night’s deposit will be charged at the time of booking. There is a 72-hour cancellation policy at the hotel.
Location of the Meeting
Hilton Austin 500 E. 4th St. Austin, TX 78701 Phone: (512) 482-8000 Fax: (512) 469-0078
www.Austin.hilton.com
Hotel and AirfareYou are responsible for your own airfare and hotel accommodations.
Reservations: (800) 236-1592If calling, please reference the Group Code of NAP
when making reservations.
https://resweb.passkey.com/go/2015NAPPA
$220 per night + tax (single or double occupancy)
• After May 25, 2015 or when the block is full, the hotel will not guarantee you a room nor the special rate.
CLE CreditsThe NAPPA Legal Education Conference qualifies for CLE credits. Applications will be made by the NAPPA office for all attendees that practice in states requiring continuing legal education.
As a Reminder• There is a “No Smoking” policy at all sessions.• Dress is business casual for the conference. Most
meeting rooms tend to be on the chilly side, so a sweater or jacket is recommended.
QuestionsIf you have questions regarding the conference or encounter problems with online registration, please call (573) 616-1895.
Karen Holterman [email protected] Faken .................... [email protected] Dorge [email protected]
Sponsors and marketing are prohibited at all NAPPA conferences.
MASTER PAGE NO. 287

www.nappa.org 5
Conference AgendaTuesday, June 23, 2015
1:00 p.m. - 5:00 p.m. Early Conference Registration
1:00 p.m. - 3:00 p.m. New Member and Associate Counsel Session: The Basics Moderator: Michael Jordan - Partner, Ice Miller LLP
Presenters: Bill Ackerman - Of Counsel, Klausner Kaufman Jensen & Levinson Brian J. Goodman - Legal Affairs & Compliance Coordinator, Virginia Retirement System Lisa Erb Harrison - Of Counsel, Ice Miller LLP David B. Parrish - Partner, Jackson Walker, LLP This New Member and Associate Counsel Session will cover basic provisions and concepts in the
“core” public pension plan legal issue areas of Fiduciary Duty, Benefits, Tax and Investments. It is designed as an introductory session for those with little or no experience advising a public pension plan. However, the session is also useful for the experienced attorney who may be called on to advise a plan in a new area or who would just like a good review of these important topics.
3:00 p.m. - 3:15 p.m. Break
3:15 p.m. - 4:45 p.m. New Member and Associate Counsel Session: Roundtable Discussion Moderator: Michael Jordan - Partner, Ice Miller LLP Presenters: Dennis Smith - General Counsel, Ohio Highway Patrol Retirement System Laura Gilson - General Counsel, Arkansas Teacher Retirement System William Neville - General Counsel, Ohio Teachers Retirement System Cynthia Collins - Co-Chair Institutional Investment Group, Robinson, Bradshaw & Hinson, P.A.
The New Member and Associate Counsel Roundtable Discussion will provide an opportunity for NAPPA members to discuss (with General Counsel at public pension plans of various sizes, as well as outside counsel who represent public pension plans), issues that might arise in a member’s practice, such as: ethics issues, board and management issues, open meetings and public records requests, plan operations, investment matters and headline risks. This is a great opportunity to bring up an issue and kick it around in an informal and relaxed setting, while hearing practical advice from experienced attorneys who navigate these issues on a daily basis.
5:15 p.m. - 6:45 p.m. Early Bird Reception (provided by NAPPA)
MASTER PAGE NO. 288

www.nappa.org6
Wednesday, June 24, 2015 7:00 a.m. - 5:00 p.m. Conference Registration
7:00 a.m. - 8:00 a.m. Breakfast (provided by NAPPA)
7:00 a.m. - 8:00 a.m. Emeritus Board Breakfast (provided by NAPPA)
Moderator: Michael Toumanoff - Of Counsel, Nossaman LLP
The NAPPA Emeritus Board is composed of active members of NAPPA who have previously served as Executive Board members. The Emeritus Breakfast is an opportunity for former Executive Board members to meet and discuss issues and to provide the current Board with historical knowledge and perspective to help preserve the original institutional vision for the organization.
7:00 a.m. - 8:00 a.m. Administrators’ Roundtable Breakfast (provided by NAPPA) Moderators: Eric Wampler - Deputy Executive Secretary, Kentucky Teachers’ Retirement System David Gavia - Executive Director, Texas Municipal Retirement System Have you transitioned from “pension attorney” to “pension administrator”? Have you considered
making the change? Please join us for a discussion over breakfast.
8:00 a.m. - 8:30 a.m. Welcome and Introduction: Welcome to Austin, Texas Kevin Lindahl - General Counsel, Colorado Fire and Police Pension Association Jake McMahon - Chief Counsel, Missouri State Employees’ Retirement System
Presenter: Harrison Eppright - Manager of Visitor Services, Austin Convention and Visitor’s Bureau
Conference Host Committee: Carolina C. de Onís’ - Texas Teacher Retirement System Christine Mullen Sweeney - Texas Municipal Retirement System Ann McGeehan - Texas County and District Retirement System
The NAPPA President and Vice President will provide an overview of the conference for attendees, and the Host Committee will provide information about Austin, Texas for the conference participants.
Conference Agenda
Welcome to Austin, TX “Live Music Capital of the World”“The Best Golf City in America”
MASTER PAGE NO. 289

www.nappa.org 7
Wednesday, June 24, 2015 continued...8:30 a.m. - 9:30 a.m. General Session:
Federal Legislative Update
Moderator:Eric Wampler - Deputy Executive Secretary, Kentucky Teachers’ Retirement System
Presenter: Leigh Snell - Director of Federal Relations, National Council on Teacher Retirement (NCTR)
The session provides an update on legislative and regulatory activities at the federal level that affect public pension plans.
9:30 a.m. - 10:30 a.m. General Session: Benefit Reform Litigation
Moderator:Adam Franklin - General Counsel, Colorado Public Employees’ Retirement Association
Presenters: Caleb Durling - Partner, Reilly Pozner, LLPRobert Klausner - Principal, Klausner, Kaufman, Jensen & Levinson
This session will focus on the benefit reform litigation around the country that resulted from various plan changes. We will review the cases and legal tests in various jurisdictions for changes in benefits.
10:30 a.m. - 10:45 a.m. Break
10:45 a.m. - 12:15 p.m. General Session: Electronically Stored Information (E-Discovery)
Moderator: Jake McMahon - Chief Counsel, Missouri State Employees’ Retirement System
Presenters: Margaret Daun - Assistant City Attorney, City of Milwaukee Office of the City AttorneyMatt Stippich - General Counsel/President of Professional Services, Digital Intelligence, Inc.Kelly Twigger - Principal, ESI Attorneys
It can be very challenging to respond to detailed discovery requests in connection with litigation or sunshine law requests that require staff at a public pension fund to locate and review large amounts of electronically stored information. This session will explore the steps that funds can take to be better prepared to produce information in an efficient and accurate manner.
12:15 p.m. - 1:30 p.m. Lunch (on your own)
Conference Agenda
MASTER PAGE NO. 290

www.nappa.org8
Wednesday, June 24, 2015 continued...1:30 p.m. - 2:30 p.m. Concurrent Workshops: (choose one) Session A: Doing Well by Doing Good - Emerging Manager and Directed
Investment Programs Moderator: Dulcie D. Brand - Partner, Pillsbury Winthrop Shaw Pittman LLP
Presenters: Robert D. Klausner - Principal, Klausner, Kaufman, Jensen & Levinson Michael J. Moy - Managing Director, Pension Consulting Alliance, Inc. Norman M. Levedahl - Senior Staff Attorney, California Public Employees’ Retirement System
Our state has a number of needs. Shouldn’t the pension system’s investments support local needs? How will we find the newest, best in class investment managers? And shouldn’t we support those upcoming new managers? What happens when performance lags? This panel will address the fiduciary, investment and other considerations in adopting and implementing certain investment programs.
Session B: Terminating Employers and Outsourcing of Employees Moderator: Adam Franklin - General Counsel, Colorado Public Employees’ Retirement Association
Presenter: Gina Ratto - Deputy General Counsel, California Public Employees’ Retirement System As GASB 68 is implemented, plans may receive requests from employers who would like to leave
the plan. This session will examine different laws around the country dealing with the process for employers who wish to leave. In addition, the session will discuss the issues faced by plans when employers outsource employment for positions that have traditionally been held by employees covered by the plan.
2:30 p.m. - 2:45 p.m. Break
2:45 p.m. - 4:15 p.m. Concurrent Workshops: (choose one) Session A: The Role of the General Counsel in Investment Transactions Moderator: Jake McMahon - Chief Counsel, Missouri State Employees’ Retirement System
Presenters: Omar Davis - Internal Investment and Compliance Counsel, Missouri State Employees’ Retirement System Sharmila Chatterjee Kassam - Deputy Chief Investment Officer, Texas Employees’ Retirement System David B. Parrish - Partner, Jackson Walker, LLP
The general counsel (or internal investment counsel) plays an important role under a pension plan’s investment program. However, that role may vary depending on whether outside legal counsel is part of the process and what the needs are of the investment staff. This session will explore the working relationships between the internal counsel, outside counsel, and investment staff, and the different roles each can play in addressing legal issues during the investment process.
Conference Agenda
MASTER PAGE NO. 291

www.nappa.org 9
Wednesday, June 24, 2015 continued...
2:45 p.m. - 4:15 p.m. Session B: Tax Hot Topics
Moderator:Paul W. Madden - Partner, Whiteford, Taylor & Preston
Presenters: John A. Nixon - Partner, Duane Morris LLPDon Wellington - Partner, Steptoe & Johnson, LLPPamela Kinard - Associate Chief Counsel, Internal Revenue Service (Invited)
The panel will address tax issues relating to funding retiree health plans and pension obligation bonds; unrelated business taxable income on governmental plan investments; recent and anticipated IRS and Treasury guidance.
4:15 p.m. - 4:30 p.m. Break
4:30 p.m. - 5:30 p.m. Concurrent Sessions: (choose one)Health Plan Affinity Group: Catching Up on Notices, Regulations and Other Hot Topics
Moderators:Julie Borisov - Staff Attorney, Colorado Public Employees’ Retirement AssociationStephen Van Camp - General Counsel, South Carolina Public Employee Benefit Authority
Presenters:Joni Andrioff - Partner, Steptoe & Johnson, LLPChristopher S. Sears - Partner, Ice Miller LLP
In this session, we will discuss the IRS Notice regarding the excise tax on high cost employer-sponsored health coverage, as well as IRC Sections 6055-6056 reporting. The session will include a discussion centering on pertinent legal considerations when implementing on-site health clinics. It will also review ongoing cases relevant to health care and the implementation of the Affordable Care Act.
Small/Medium Fund Affinity Group
Moderator:Lydia Lee - Of Counsel, Lieff, Cabraser, Heimann & Bernstein
Presenters: Joshua Mond - General Counsel, Dallas Police & Fire Pension SystemJaye Pershing Johnson - Assistant Attorney General, Vermont State Office of the Attorney GeneralAmy Moskowitz - Associate County Attorney, Montgomery County, Maryland Retirement System
The Small/Medium Fund Affinity Group focuses on a broad array of issues that a “general counsel” (whether in-house or outside) may face with regard to a small or medium sized pension fund with limited legal resources. Topics for discussion during this workshop include:
1. Advising your Board on determining the “comparable universe” for performance measures andaccessing alternative investments for a smaller fund;
2. Succession planning in the event of loss of key staff members;
Conference Agenda
MASTER PAGE NO. 292

www.nappa.org10
Conference AgendaWednesday, June 24, 2015 continued...
4:30 p.m. - 5:30 p.m. 3. Forming alliances and working successfully with stakeholders, participants, plan sponsors and other agencies of government; and 4. Advising your Board on appropriate action when the plan sponsor suggests/adopts benefit cuts.
Speakers will share personal experience with these topics and audience participation is highly encouraged.
7:00 p.m. - 9:00 p.m. NAPPA Dinner (Uncle Julio’s)
NAPPA will be hosting a dinner at Uncle Julio’s Restaurant located in downtown Austin on the corner of 3rd and San Jacinto. The restaurant is within walking distance of the Hilton. Please plan to join us for authentic, border-style Mexican food made with fresh, locally grown Texan ingredients. Uncle Julio’s is proud to stay close to its Mexican
heritage by offering high-quality fare that mirrors the original cooked up by cowboys on the plains a century ago. This unique taste is paired with unparalleled customer service and a welcoming atmosphere to create an experience that will be remembered. A reception will precede the dinner.
Thursday, June 25, 20157:00 a.m. - 5:00 p.m. Conference Registration
7:00 a.m. - 8:00 a.m. General Counsel Only Breakfast (provided by NAPPA)
Moderators: Kevin Lindahl - General Counsel, Colorado Fire and Police Pension Association Jake McMahon - Chief Counsel, Missouri State Employees’ Retirement System
This General Counsel breakfast is intended to be a time for those serving as General Counsel to a public pension fund to meet and discuss topics of interest.
7:00 a.m. - 8:00 a.m. Breakfast For All Other Attendees (provided by NAPPA)
8:00 a.m. - 8:30 a.m. NAPPA 2015 Annual Business Meeting Kevin Lindahl - General Counsel, Colorado Fire and Police Pension Association Jake McMahon - Chief Counsel, Missouri State Employees’ Retirement System The session will update NAPPA members on the status of the organization and will provide a
preview of 2016.
Uncle Julio’s301 Brazos St.
MASTER PAGE NO. 293

www.nappa.org 11
Thursday, June 25, 2015 continued...8:30 a.m. - 9:30 a.m. General Session: Ethics (Part 1) Moderator: James Salvie - General Counsel, Massachusetts Teachers’ Retirement System
Presenters: Erin Perales - General Counsel, Houston Municipal Employees Pension System John A. Nixon - Partner, Duane Morris LLP The session will review ethical standards that guide our practice from a practical and theoretical
point of view, drawing on ethical rules from other fields, and with an emphasis on preparing for the role of the SEC.
9:30 a.m. - 10:30 a.m. General Session: Ethics (Part 2) Moderator: Luke Bierman - Dean and Professor of Law, Elon University School of Law and Cohen, Milstein,
Sellers & Toll PLLC
Presenters: Peter Mixon - Partner, K&L Gates, LLP Blake Thomas - Deputy General Counsel, North Carolina Department of State Treasurer This session will offer insight into important ethics questions likely to face pension plan attorneys.
Building on Ethics (Part I), this session will expand on some of the topics covered and address some new topics while also offering attendees the opportunity to stump the panelists with questions and concerns.
10:30 a.m. - 10:45 a.m. Break
10:45 a.m. - 12:15 p.m. Concurrent Workshops: (choose one) Session A: Protecting Data and Cyber Security Moderator: Brian J. Goodman - Legal Affairs and Compliance Coordinator, Virginia Retirement System
Presenters: Jake McMahon - Chief Counsel, Missouri State Employees’ Retirement System Brian Farrar - Network Operations Manager, Texas Municipal Retirement System Nathan Sportsman - Founder & CEO, Praetorian Group, Inc.
It is a rare week when there isn’t a security breach of some sort reported by the media. When a pension fund experiences a data breach, a number of challenges are presented for legal counsel and the IT department. This session will provide an overview of a breach that occurred at a statewide system and how security risks may be proactively addressed by the internal IT department and an IT consultant.
Conference Agenda
MASTER PAGE NO. 294

www.nappa.org12
Thursday, June 25, 2015 continued...
10:45 a.m. - 12:15 p.m. Session B: A Lawyer, an Auditor and an Actuary Walk into a Bar (Funding Policy and GASB Implementation Tales From the Street)
Moderator: Michael D. Herrera - Senior Staff Counsel, Los Angeles County Employees’ Retirement Association
Presenters: Paul Angelo, FSA - Senior Vice President & Actuary, Segal Consulting Jeffrey Markert - Partner, KPMG
Since the great recession of 2008, state and local governments have undertaken various efforts to manage pension costs and reduce unfunded liabilities. Nonetheless, unfunded liabilities remain, and funding continues to be a challenge for governmental pension funds and their plan sponsors. The first part of this panel will focus on developments and challenges governmental pension plans and plan sponsors are facing with regard to system funding policies, and the strategies and efforts many are undertaking to meet them.
Further complicating these challenges, the Governmental Accounting Standards Board (GASB)
adopted sweeping changes to their financial reporting requirements. These changes take effect for fiscal years beginning after June 15, 2014 and are widely viewed as game changers. They require governments that participate in defined benefit pension plans to report their net pension liabilities on their basic financial statements (balance sheets) rather than just in note disclosures, and, for cost-sharing employers, to report for the first time their proportionate share of the collective net pension liability and pension expense. The second part of the panel will therefore focus on these new GASB requirements, and the implications, strategies, and efforts by pension plans and plan sponsors to implement and comply with them.
12:15 p.m. - 1:30 p.m. Lunch (on your own)
1:30 p.m. - 2:30 p.m. Concurrent Workshops: (choose one) Session A: Funds, Fees and Affiliates (Oh, My!) - SEC OCIE’s Examination of the
Private Fund World (What They Found and What it Means for Public Plans) Moderators: James Van Horn, Jr. - Partner, Hirschler Fleischer, PC Marc R. Lieberman - Chair, Public Pensions and Alternative Investment Group, Kutak Rock LLP
Presenters: Matthew D. Harris - Exam Manager, OCIE Private Funds Unit, Securities Exchange Commission,
Chicago Office Edward Schwartz - Principal, ORG Portfolio Management What does the SEC’s Office of Compliance Inspections and Examinations (OCIE) see in the private
fund world, what they are doing about it and how can public plans respond.
• SEC OCIE examination of private funds – what they found• Fee allocations, affiliate compensation, disclosure and transparency• Private fund managers – duties of GPs and managers under the Advisers Act• Expanding roles of Fund Administrators vs. Auditors• Independent Debt Monitors
Conference Agenda
MASTER PAGE NO. 295

www.nappa.org 13
Thursday, June 25, 2015 continued...
1:30 p.m. - 2:30 p.m. Session B: “Age-Old and Newer Risks: What Every Retirement System Attorney Should Know About Insurance”
Moderator:Ashley Dunning - Partner, Co-Chair, Public Pensions & Investments Group, Nossaman LLP
Presenters: Kelly A. Jenkins - Assistant Retirement Administrator, Sonoma County Employees’ Retirement AssociationBridget Sakach - AIG Underwriting Specialist, Speciality Professional Liability, AIGTom Long - Partner, Nossaman LLP
This panel will discuss the longstanding question of how to best insure public retirement systems. In addition to covering the basics of what should (or need not) be insured and how, and particular risks when negotiating policy terms, the panel will tackle the newer topic of cyber insurance. The panel includes experts with diverse perspectives on this topic, who will present and discuss with one another and the audience the big picture, and the many nuances, of this challenging topic.
2:30 p.m. - 2:45 p.m. Break
2:45 p.m. - 4:15 p.m. Concurrent Workshops: (choose one)Session A: Securities Litigation Review: A Fiduciary’s Guide to Making the Best of a Bad Situation
Moderator:Adam Franklin - General Counsel, Colorado Public Employees’ Retirement Association
Presenters: Michael D. Herrera - Senior Staff Counsel, Los Angeles County Employees’ Retirement AssociationBlake Thomas - Deputy General Counsel, North Carolina Department of the State TreasurerChris Supple - Deputy Executive Director and General Counsel, Massachusetts Pension Reserves
Investment Management Board
Sadly, it’s not if corporate wrongdoing will strike, but whether and how prudent investors and fiduciaries are prepared to act when it does. In the wake of well-publicized corporate wrongdoing and record recoveries by institutional investors in equally noteworthy securities cases, interest and involvement by institutional investors in these cases, including public pension funds, has steadily increased over the past decade. The panelists for this session will provide an overview of why, how and what public pension funds are (and are not) doing with regard to securities litigation. They will also discuss significant court decisions and legislative efforts that are changing the securities litigation landscape and affecting investors’ ability to recover losses stemming from corporate wrongdoing. They will discuss the rise and pitfalls of pursuing cases outside the United States in the aftermath of the U.S. Supreme Court’s decision in Morrison vs. National Australia Bank, which has left U.S. investors little to no ability to seek redress in U.S. courts for foreign investment losses, even when those losses stem from corporate fraud or wrongdoing.
Conference Agenda
MASTER PAGE NO. 296

www.nappa.org14
Thursday, June 25, 2015 continued...2:45 p.m. - 4:15 p.m. Session B: DB vs. Alternative Plans, Part II - A Discussion on the Pros and Cons Moderator: Paul Neal - Senior Research and Policy Manager, Law Enforcement Officers’ & Fire Fighters’ Plan 2 Retirement Board (LEOFF 2)
Presenters: Chuck R. Reed - Former Mayor, City of San Jose, California Hank Kim - Executive Director, National Conference on Public Employee Retirement Systems (NCPERS) William (Flick) Fornia - President, Pension Trustee Advisors Michelle Welch - Public Accountability Research & Policy Manager, Laura and John Arnold Foundation
A frank conversation between those who advocate for and against the elimination of defined benefit plans and the consequences of both paths.
4:15 p.m. - 4:30 p.m. Break
4:30 p.m. - 5:30 p.m. Concurrent Sessions: (choose one) Public Safety Affinity Group: The Rise in Psychological Disability Claims in
Public Safety Plans: A Psychiatrist’s View and Suggested Processes to Ensure Legitimate Awards
Moderator: Mary Beth Foley - General Counsel, Ohio Police and Fire Pension Fund Presenters: Dr. Joel S. Steinberg, MD - Medical Advisor, Disability Evaluating Panel, Ohio Police and Fire Pension Fund Carolyn Clifford - Partner, Ottosen Britz Kelly Cooper Gilbert & DiNolfo, Ltd. Michael Sutherland - Benefits Counsel, Colorado Fire and Police Pension Association
Dr. Joel S. Steinberg is Board certified in psychiatry, neurology, and forensic psychiatry, a fellow with the American Academy of Disability Evaluating Physicians and certified by the American Board of Independent Medical Examiners. Dr. Steinberg will present his best advice for the evaluation of psychological disabilities in police and fire personnel and discuss tools and policies, public funds can use to ensure legitimate awards.
DC Plan Affinity Group: Fiduciary Duty Hot Topics Moderator: Jennifer Schreck - Senior Staff Attorney, Colorado Public Employees’ Retirement Association
Presenters: Mary Beth Braitman - Partner, Ice Miller LLP Lisa Erb Harrison - Of Counsel, Ice Miller LLP Melanie Symons - Chief Legal Counsel, Montana Public Employee Retirement Administration
This session will explore a plan’s fiduciary duties as they relate to requiring minimum contributions, monitoring contributions in a multi-employer plan, choosing default investment options (QDIA) and offering automatic enrollment.
Dinner (on your own)
Conference Agenda
MASTER PAGE NO. 297

www.nappa.org 15
Friday, June 26, 20157:00 a.m. - 8:00 a.m. Breakfast (provided by NAPPA)
8:00 a.m. - 9:30 a.m. General Session: Municipal Bankruptcy: Perspectives From Either Side of the Bench Moderator: Kristin Bellar - Senior Deputy General Counsel - Municipal Employees’ Retirement System of
Michigan
Presenters: Honorable Thomas B. Bennett - Chief Judge, Unites States Bankruptcy Court for the Northern
District of Alabama Robert D. Gordon - Member, Clark Hill PLC Peter Mixon - Partner, K&L Gates, LLP Harvey L. Leiderman - Partner, Reed Smith LLP
A lively panel discussion with experienced practitioners, including bankruptcy counsel for the Retirement Systems of the City of Detroit, and the Honorable Thomas B. Bennett, the bankruptcy judge who presided over the Jefferson County, Alabama proceedings, which was the nation’s largest municipal bankruptcy until Detroit’s filing in 2013. Topics will include preparing for an employer bankruptcy, advocating for the trust as a creditor, constitutional issues, current trends and debates in the world of municipal bankruptcy and true-life stories.
9:30 a.m. - 10:30 a.m. General Session: Communications: Pondering the Potential and the Pitfalls Moderator: Eric Wampler - Deputy Executive Secretary, Kentucky Teachers’ Retirement System
Presenters: Greg Smith - Executive Director, Colorado Public Employees’ Retirement Association Christopher Waddell - Senior Attorney, Olson, Hagel & Fishburn, LLP
This panel will cover evolving legal issues related to a retirement plan’s communications with members, the press, political leaders, and the general public. The panel will cover communications plans, fiduciary issues associated with using trust assets for communications, and examples from the front lines of the war on pensions.
10:30 a.m. - 10:45 a.m. Break
10:45 a.m. - 11:45 a.m. General Session: Litigation Update Presenter: Laurie McKinnon - General Counsel, Kansas Public Employees Retirement System
The session will provide participants with an opportunity to hear about and understand the various issues affecting public pension plans that have been the subject of litigation, and how different courts have viewed those issues.
Conference Agenda
MASTER PAGE NO. 298

16 www.nappa.org
NAPPA Executive Board
2015 Conference Host Committee
NAPPA Staff
Mark Your Calendar
Kevin Lindahl, PresidentColorado Fire & Police Pension Association
Jake McMahon, Vice PresidentMissouri State Employees’ Retirement System
Dulcie D. BrandPillsbury Winthrop Shaw Pittman LLP
Ashley DunningNossaman LLP
Adam FranklinColorado Public Employees’ Retirement Association
Brian J. GoodmanVirginia Retirement System
Michael HerreraLos Angeles County Employees’ Retirement Association
Paul W. MaddenWhiteford, Taylor & Preston
Eric WamplerKentucky Teachers’ Retirement System
Carolina C. de Onís’, Committee Co-Chair Texas Teacher Retirement System
Christine Mullen Sweeney, Committee Co-Chair Texas Municipal Retirement System
Ann McGeehan Texas County and District Retirement System
Kevin Lindahl, Board Liaison Colorado Fire & Police Pension Association
Susie Dahl, Executive [email protected]
Karen [email protected]
Brenda [email protected]
Doris [email protected]
2016 Winter SeminarWashington, DCOmni Shoreham
February 17 - February 19, 2016
2016 Legal Education ConferenceNew Orleans, LA
Astor Crowne PlazaJune 21 - June 24, 2016
New Attorney Session on June 21st
2017 Legal Education ConferenceMonterey, CAPortola Hotel
June 27 - June 30, 2017New Attorney Session on June 27th
NAPPA2410 Hyde Park Rd., Suite B
Jefferson City, MO 65109Phone: (573) 616-1895
Fax: (573) 616-1897
Lyndon B. JohnsonPresidential Library
MASTER PAGE NO. 299

Ventura County Employees’ Retirement Information System
Project Status Report Month Ending: March 2015
Reporting to: Board of Retirement Report Date: 04/15/15 Written by: Brian Colker
1
PROJECT STATUS SUMMARY Actual Percentage Complete: 74.47%* Planned Percentage Complete: 74.47%*
**Note: The updated Sprint Schedule went into effect with the approval of the change orders presented to the Board 01/05/2015. The completion percentages have been adjusted to take into account the updates and changes per the new sprint schedule.
Scope Schedule Cost Risks Quality
Risks Plan sponsor payroll transmittal – Parallel testing began as scheduled even though scenario-based
testing was not complete. VCERA agreed to accept the first two parallel test files and then stopparallel testing until scenario-based testing is completed. The project team is analyzing the firstparallel test file and providing feedback to the Auditor-Controller. There are currently six issuesthat have been identified that must be resolved prior to completing parallel testing. Weeklymeetings are held to discuss issues and project status.
KEY ACCOMPLISHMENTS LAST MONTH Received additional test files from Auditor-Controller. Delivered additional functionality in:
o Disabilityo Active Death Processingo Retired Death Processingo DRO Processing – Alt Payeeo 1099R Processingo Annual Benefit Statementso Actuarial Extractso Year-End Processingo Member Correspondence
Wrote 173 test cases and executed 269 tests. There have been 2,906 tests executed to date andthere are currently 468 defects in an open status – 43 high priority, 337 medium priority, 88 lowpriority.
MASTER PAGE NO. 300

VENTURA COUNTY EMPLOYEES’ RETIREMENT ASSOCIATION 1190 South Victoria Avenue, Suite 200
Ventura, CA 93003-6572 (805) 339-4250 Fax: (805) 339-4269
http://www.ventura.org/vcera
April 20, 2015
The Honorable Das Williams Assembly Member, 37th District State Capitol, Room 4005 Sacramento, CA 95814
Dear Assembly Member Williams:
On behalf of the Ventura County Employees Retirement Association (VCERA), we are pleased to sponsor AB 1291, which will add our retirement system to those county systems, including Orange, San Bernardino and Contra Costa that are authorized to hire key executive personnel as employees of the retirement system, rather than employees of the county. Also, in order for such employees to become members of the retirement system, AB 1291 adds the Ventura County retirement system to the definition of “district” in the County Employees Retirement Law (CERL).
This bill will assist our retirement system in the implementation of the Public Employee Pension Reform Act of 2012 (PEPRA). Among other things, PEPRA authorizes retirement systems to monitor and enforce the anti-spiking provisions of the measure. With its own key employees, VCERA will have increased ability to follow and enforce the anti-spiking mandates. In addition, it will assist our local retirement system in attracting and retaining the kind of highly-talented human capital necessary to effectively manage a retirement system and an investment portfolio in today’s marketplace. AB 1291 will help VCERA achieve these goals.
Again, thank you for introducing AB 1291 and we look forward to working with you. Please do not hesitate to contact me should you need anything at all.
Sincerely,
Tracy Towner, Board Chairman
MASTER PAGE NO. 301

We are delighted to invite you to our second Lecture Series, bringing together the firm’s
management, members of the investment team and guest speakers.
With a long-term investment outlook, the success of Walter Scott’s approach relies upon identifying companies
capable of meaningful growth, not simply over the next quarter or two, but over many years to come. In turn,
companies must align themselves to socio-economic trends, demographic shifts as well as innovation and advancement.
These lunchtime lectures are an opportunity to consider some of these opportunities and challenges in the context of these companies that Walter Scott’s team analyse every day.
In April, Executive Chairman Rodger Nisbet will be joined by Bronwen Maddox, editor of Prospect magazine.
New York The Pierre, 2 East 61st Street at Fifth Avenue
Tuesday 21 April | 12:00 noon – 2:00pm
Chicago The Peninsula, 108 East Superior Street
Wednesday 22 April | 12:00 noon – 2:00pm
Toronto Four Seasons, 60 Yorkville Avenue
Thursday 23 April | 12:00 noon – 2:00pm
In May, Managing Director Jane Henderson will be joined by Christian Le Mière, co-author of Arctic Opening: insecurity and opportunity.
Los Angeles The Peninsula, 9882 South Santa Monica Boulevard
Tuesday 19 May | 12:00 noon – 2:00pm
San Francisco The St Regis, 125 3rd Street
Wednesday 20 May | 12:00 noon – 2:00pm
Vancouver Shangri-La, 1128 West Georgia Street
Thursday 21 May | 12:00 noon – 2:00pm
Please RSVP through the events page on the Walter Scott website at www.walterscott.com
(password: Spring2015)
Should you require more details please contact Inga Dowds or Joanna Newman Tel: +44 (0)131 225 1357 | Email: [email protected]
MASTER PAGE NO. 302

ATTACHMENT A

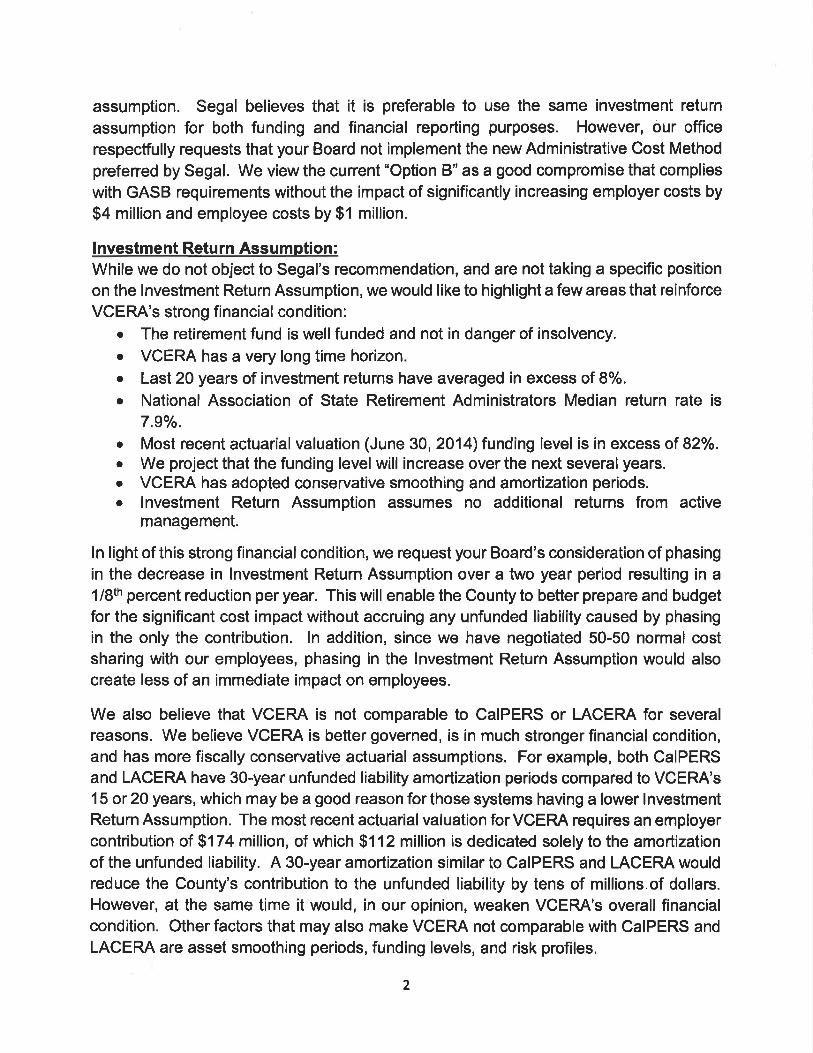


ATTACHMENT B


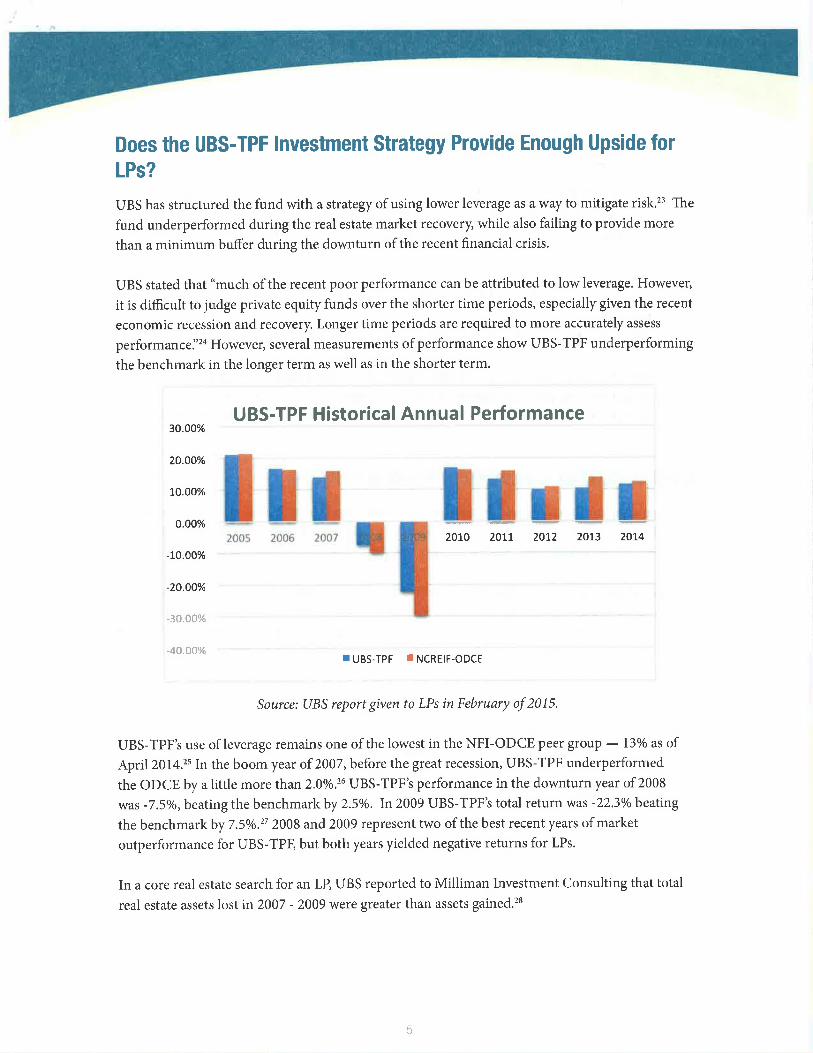

ATTACHMENT C
