velocity analysis and application of synthetic seismograms
TRANSCRIPT
99
Velocity analysis and application of synthetic seismograms in the area of the Vranovice and the Nesvačilka troughs (Bohemian Massif)Bibiana Brixová1, Andrej Mojzeš1 , Mariana Pašiaková1, Miroslava Zubalová2, Andrea Bartošová1, Miroslav Bielik1,3
Rýchlostná analýza a využitie syntetických seizmogramov v oblasti vranovickej a nesvačilskej priekopy (Český masív)
1 Comenius University in Bratislava, Faculty of Natural Sciences, Department of Applied and Environmental Geophysics, Mlynská dolina, Ilkovičova 6, SK-842 15 Bratislava, Slovak Republic; [email protected]
2 MND a. s., Úprkova 807/6, CZ-69501 Hodonín, Czech Republic 3 Earth Science Institute of the Slovak Academy of Sciences, Dúbravská cesta 9, 840 05 Bratislava, Slovak Republic
Abstract: The paper presents the results of velocity analysis performed in the Nesvačilka and Vranovice troughs. The troughs extend in the south-eastern part of the Bohemian Massif (the Moravian Block). As both belong to the most promising areas of the Bohemian Massif in the search for and production of hydrocarbons, their geological and geophysical survey is very important. Therefore, one of the key points is to determine the accurate data on the depth of the significant geological and stratigraphic units, which form the Nesvačilka and the Vranovice troughs. For this purpose the velocity analysis and the application of synthetic seismograms have been defined and applied. The results indicate that the lithostratigraphic units of the studied region are characterized by a large velocity interval. Based on the data from well log measurements (check shots) and synthetic seismograms the following velocities of seismic waves were determined in single lithostratigraphic units: 2.4–3.3 km/s in sediments of Flysch nappes, 2.7–3.6 km/s in the Palaeogene sediments, 3.3–4.3 km/s in the Jurassic sediments (3.7–5.1 km/s in carbonates and 3.5–4.8 km/s in pelites and conglomerates), 4–5.4 km/s in the Carboniferous sediments, and 4.6–6.6 km/s in the Devonian carbonates. Moreover, the synthetic seismograms and check shot results point to significant velocity interfaces. We discovered that: (a) within the sediments of Flysch nappes velocities in Menilitic Formation are higher than in the Submenilitic and the Ždánice-Hustopeče formations, (b) interface sediment of the Flysch nappes and Palaeogene deposits is characterized by a decrease of velocity, and (c) big contrast of velocity reflects the boundary between the carbonates (the Devonian and the Jurassic) and their surrounding rocks. The velocity analysis helps significantly for mapping of the Outer Carpathian Flysch nappes (the Pouzdřany Unit and especially the Ždánice Unit), the Neogene deposits, the Palaeogene deposits and the Devonian carbonates. All the knowledge we obtained has been used in detailed mapping and assessment of potential and confirmed hydrocarbon deposits in the studied area.Key words: velocity analysis, check shot, synthetic seismogram, Nesvačilka Trough, Vranovice Trough, Bohemian Massif
acta geologica slovaca, 8(1), 2016, 99–108
Manuscript received 2015-10-11Revised version accepted 2016-03-04
1. IntroductIon
The determination of accurate seismic wave velocities in a rock environment is a challenging and very important process, which significantly affects the accuracy of the interpretation of seismic measurements. For correct correlation between the depth data obtained from the wells and the time data in the seismic view it is necessary to know the distribution of velocities in the whole study area. Especially, in tectonically and structurally complex areas, the geological interpretation requires a detailed velocity analysis. The information about the velocity conditions is provided mostly by the check shot measurements or vertical seismic profiling (VSP) and sonic logging (SL). The SL data can also be used in the estimation of a synthetic seismogram. These seismograms are used to verify and improve the geological interpretation, as well as to create
new seismic models for the wells without check shot velocity survey and/or VSP. And thus it allows us to increase the data for the velocity model of the studied area. The velocities of seismic waves of such models are then used for transformation of the time maps into the structural (depth) maps.
The accurate data on the depth of geological and stratigraphic units are necessary parameters for hydrocarbon prospecting. Due to the hydrocarbon potential, the Vranovice and Nesvačilka troughs are one of the most important regions in the Bohemian Massif. From the geological point of view they belong to the eastern margin of the Bohemian Massif. Geographically, they are spread over the territory of south Moravia in the south-eastern part of the Czech Republic.
The structural complexity of the geological environment in the region of both troughs, which is reflected in the changes of seismic waves, requires the most accurate information about
100
the velocity distribution. This is mainly because these data are used by interpre-tive programs both in depth conver-sion of time maps and in viewing of the wells in seismic view. At the same time they are the source data for geological interpretation of deep seismic reflec-tion measurements. Many authors have tried to produce the most detailed geo-logical mapping and seismic measure-ments of the Vranovice and Nesvačilka troughs area since the first discovery of deposits (Adam et al., 1968; Špička, 1976; Eliáš, 1977, 1981; Špička et al., 1977; Adámek et al,. 1980; Eliáš & Wes-sely, 1990; Řehánek & Jiříček, 1993; Jiříček, 1994; Dvořák, 1995; Krejčí et al., 1999; Pícha et al., 2006). Despite the dense drilling network, the seismic data cover of the region is very uneven because check shot measurements were performed only on a small num-ber of wells. Such uneven distribution of the seismic records in combination with sharp lithological changes in the horizontal direction complicates the detailed geological interpretation of seismic measurements.
The ability to find new deposits of hy-drocarbons, however, requires increas-ingly accurate and more detailed inter-pretation of seismic records. Linked to this is also a need to improve the velocity data of seismic waves in the rock environment. Thus, the purpose of the present article is mainly to show the possibilities for the creation and use of synthetic seismograms for a new, bet-ter quality velocity analysis, which will contribute to more accurate interpretation of significant strati-graphic interfaces of the geological units in the Vranovice and Nesvačilka troughs. One of the objectives was also to summa-rize data from check shot measurements in both troughs and to obtain the velocity characteristics of major lithostratigraphic units in this area.
2. GeoloGy
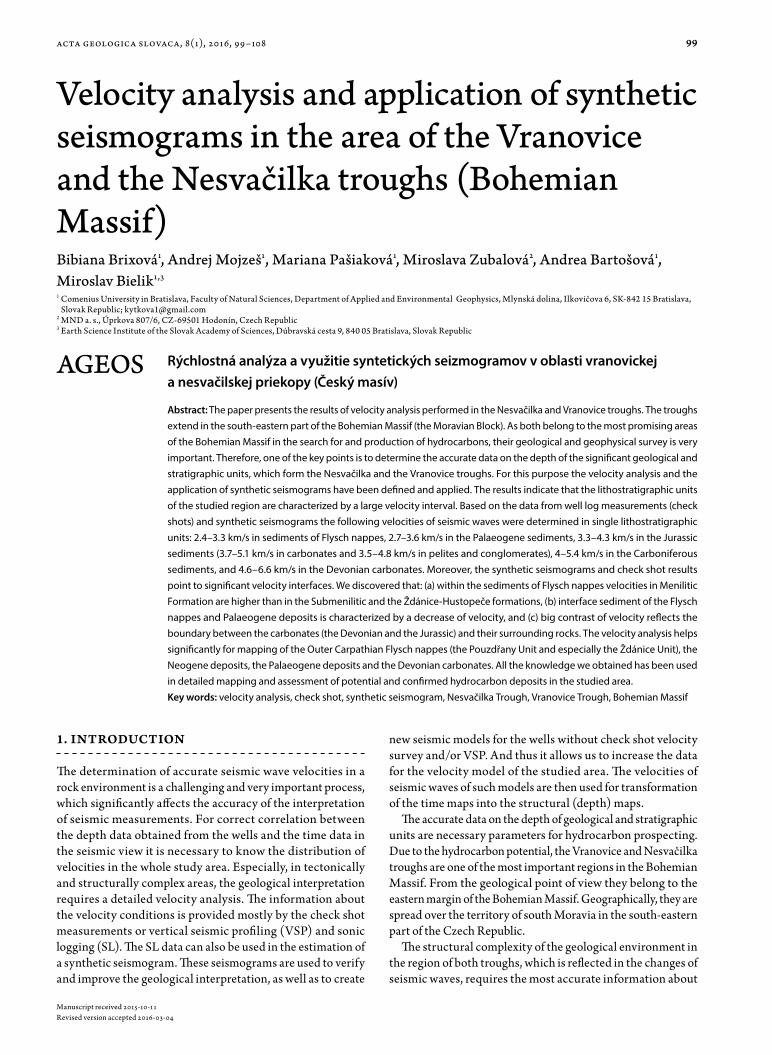
The Vranovice and Nesvačilka troughs are two morphostructural units located within the territory of the south-western part of Moravia (Fig. 1). This area is tectonically and structurally com-plicated, since it is a zone of contact of two major tectonic units: the European platform represented by the Bohemian Massif, and the accretionary prism of the Western Carpathians. The Pre-Cambrian crystalline basement of the Bohemian Massif is here covered by Palaeozoic and Mesozoic sediments. The
mentioned troughs are filled by the Palaeogene psammitic to pelitic sediments. The Carpathian Foredeep Lower Miocene transgressive sediments overlay the pre-Neogene basement of the Bohemian Massif. To the east they dip under Flysch nappes of the Pouzdřany and the Ždánice units of the accretionary prism of the Western Carpathians.
The crystalline basement is mainly built of rocks of the Brno Massif (Brunovistulikum), formed during the Cadomian Oro-genesis, and covered by the basal deposits of the Devonian age (c.f. Krejčí et al., 1999). From the lithological point of view they are predominantly siliciclastic deposits of terrestrial origin (“Old Red Sandstones“). The sedimentation continued in the marine environment by limestones of the Macocha Forma-tion of the Middle and Late Devonian age. Their stratigraphic hangingwall contains limestones of the Líšeň Formation (Fa-mennian). During the Carboniferous (Late Visean) the Líšeň Formation was overlain by the Myslejovice Formation (Kulm facies – Lower Carboniferous). The stratigraphic sequence is
Fig. 1. Geological scheme of the South Moravian Block area of the Bohemian Massif (after Krejčí et al.,
1999; Lillie et al. 1994). Legend: 1) Neogene of the Carpathian Foredeep, 2) Flysch nappes, 3) Neogene
of the Vienna Basin, 4) uncategorized Pre-Neogene units of the Bohemian Massif, 5) state border, 6)
forefront of Flysch nappes, 7) northwestern boundary of Foredeep, 8) boundary of the Vienna Basin.
acta geologica slovaca, 8(1), 2016, 99–108
101
completed by the Late Carboniferous deposits of the Ostrava Formation with the cyclic structure reflecting the changes of sedimentary environment. It is composed of a variegated sequence of sandstones and claystones with intercalations of conglomerates, volcanoclastics and coal seams. The Pal-aeozoic sediments have been confirmed only in the area of the Nesvačilka Trough and the Nikolčice-Kurdějov Horst, while they do not reach into the Vranovice Trough (Krejčí et al., 1999).
The Mesozoic sediments were transgressively deposited on the Hercynian basement, with the basal unconformity. They are formed by sandstones with coal seams (the Gresten Formation, formerly known in southern Moravia as the Di-váky Beds; Upper Bajocian-Bathonian; Adámek, 2005). The higher stratigraphic level is represented by sandy dolomites and dolomitic sandstones of the Nikolčice Beds (Callovian). Two different sedimentary sequences with the lateral relationship occur above the clastic formations: the carbonate sequence (the external part of sedimentary basin), and the pelitic-carbonate sequence (the inner part of the sedimentary basin). The first one consists of the Hrušovany Limestone (limestones and do-lomites, Oxfordian) and continues with the Novosedlec Lime-stone (Oxfordian-Kimmeridgian) and Pasohlav Limestone (Tithonian; Krejčí et al., 1999; Eliáš & Wessely, 1990). The second one consists of the Vranovice Limestone (Oxfordian) overlain by the Mikulov Marlstones (Oxfordian-Tithonian). The Kurdějov Formation (Tithonian) completes this Jurassic sequence.
The sediments of the so called autochthonous Palaeogene (Palaeocene-Oligocene) are included in one lithostratigraph-ic unit – the Dambořice Group, which is divided into the Nesvačilka Formation and the Tešany Formation. The clastic rocks (Bošovice Member) and pelites (Telnice Member) of the Tešany Formation are present only in the Nesvačilka Trough. The Nesvačilka Formation also extends into the Vranovice Trough. In the Nesvačilka Trough, two pelitic lithofacies of the Nesvačilka Formation – the Uhřice Member and Žarošice Member occur. In the Vranovice Trough, the Nesvačilka Forma-tion contains the Popice Member (black and grey claystones; Jiříček, 1994). The Neogene sedimentation in the studied area is represented by the Miocene sediments of the Carpathian Foredeep, which, on the surface flanked the margin of the Flysch nappes (Krejčí et al., 1999).
The Karpatian autochthonous sediments are overthrusted by sediments of the allochthonous complex of the Carpathian Flysch nappes. The Flysch nappes consist of Oligocene to Early Miocene sediments of the Pouzdřany Unit and sediments of the Ždánice Unit (Upper Jurassic - Early Miocene). The base of the Pouzdřany Unit consists of marls that grade into the Uhřice Formation. The lithostratigraphy continues with the Boudky Marls (Aquitanian-Egenburgian), the sandstones of the Křepice Formation (Ottnangian) and the Šankvice Marls (Eggenburgian). The base of the Ždánice Unit is formed by calcareous pelites with variable admixture of sand and with the portion of bioclastic limestones of the Klentnice Forma-tion (Oxfordian - Kimmeridgian), the Ernstbrunn Lime-stones (Tithonian) and the Klement Formation (glauconitic
sandstones with calcareous claystones; Turonian-Coniacian). It passes into the calcareous claystones and pelites of the Pálava Formation (Coniacian-Campanian). Further members of the Ždánice Unit are the Submenilitic Formation (variegated and grey claystones; Maastrichtian - Late Eocene), the Menilitic Formation (silicificated claystones, claystones with cherts; Rupelian - Chattian) and the Ždánice-Hustopeče Formation (rhythmic alternation of sandstones and siltstones with tur-bidite textures of claystones; Chattian-Aquitanian).
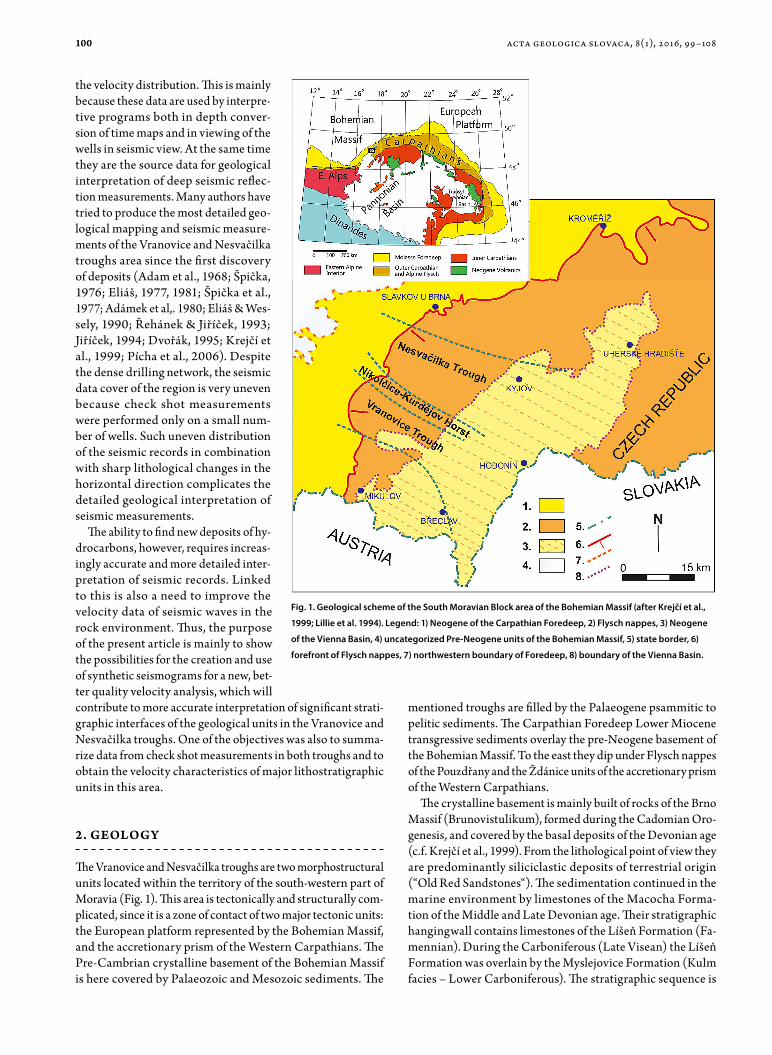
The Uppermost part of the Ždánice Unit (Krejčí et al., 1999) starts with an angular unconformity and consists of the Šakvice Marls, the Pavlovice Formation (non-calcareous claystone with gypsum) and the Laa Formation (calcareous clays with silt). These three formations were deposited during the Eggenbur-gian-Karpatian. A simplified lithostratigraphic column of the mentioned lithostratigraphic units presented in the studied area is shown on Figure 2.
3. MethodoloGy
3.1. sonic logging method and synthetic seismogram
The SL method examines the velocity of sound impulses in the walls of the borehole (rocks). The SL measures the arrival time (“travel time”) of the P waves between the transmitter and the receiver in the well logging probe, which means that it measures the interval velocity. It is used for the determination of porosity, to examine the rock mechanical properties and in combination with the neutron-neutron log (NNL) and gamma-gamma log (GGL) to provide the basic lithological profile of the borehole (Gruntorád et al., 1985; Close 2009; Alford et al., 2012). Usually the SL method together with density log (DL) is used to create a synthetic seismogram.
The synthetic seismogram represents a one-dimensional model of acoustic energy transmission through the rock envi-ronment. It is generated by convolution of reflectivity (acoustic impedance), determined from the SL and DL, with wavelet (Lines & Alam, 2013). The applied synthetic seismograms were created mainly in the programming module SeisView (Ge-oGraphix Discovery R 2007.2), with the application of SynView and some also in the module SynTool (OpenWorks2003.12 - the Landmark).
SynView in the conversion of sonic log to synthetic seismo-gram firstly creates the time and depth axis from amplitude measurement of the SL. Subsequently, it calculates the reflec-tive coefficient (RC), and if the DL is available, the acoustic impedance is used for the RC determination. The RC is finally convoluted with the selected wavelet for the creation of a syn-thetic seismogram curve. To achieve good results a number of wavelets were tested from the menu of the software, con-sidering the fact that the central frequency was set so that the result matched as accurately as possible to the actual record. The applied wavelet and central frequency are shown in the presentation of a route of a synthetic seismogram (Figs. 3a, 4a). Since the program SynView in the calculation only accepts curves with a designation of DT (sonic log interval transit
velocity analysis and application of synthetic seismogr ams in the area of the vr anovice and the nesvačilka...
102
time ⇔ Dt) and RHOB (Rho bulk density), it was necessary to overwrite the original non-standard marking SL and DL (GGL) to the accepted formats.
In addition to the synthetic curves and the section of the seismic view, through which the borehole passes, the SynView describes a curve of the SL and DL, the calculated interval velocities, and the RC (Figs. 3a, 4a). In the SynTool model view a curve of interval velocities is missing, however, the synthetic seismogram is displayed directly in the window with the real seismic view (Figs. 5, 6). The absence of interval velocities in a view of the SynTool module was one of the reasons why the SynView module was applied for the seismic analysis and then for the interpretation.
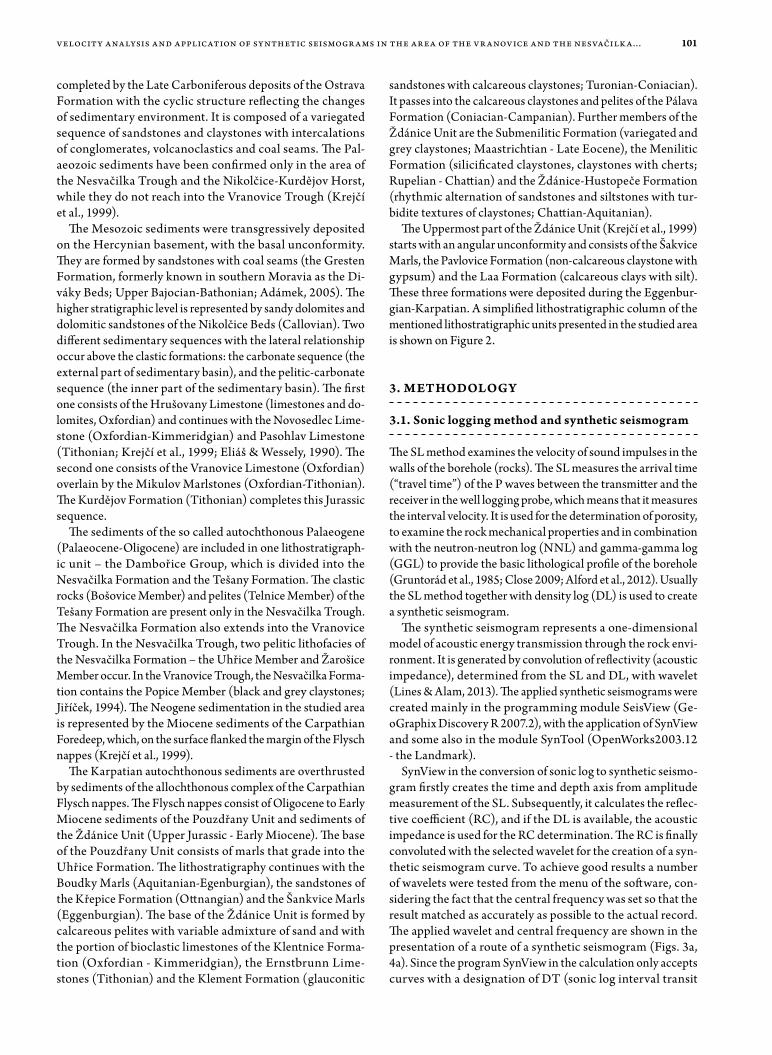
SynView allows direct correlation of synthetic curves with the seismic view at the location of the borehole. Precisely this correlation was in some cases more complicated due to the fact that SynView only works with vertical drills. In the studied area most of the wells are declined, so that the module worked with the vertical projection of the borehole and the synthetic curves needed to be subsequently adjusted. The synthetic seismogram was calibrated by combining the significant ve-locity interfaces with the corresponding significant reflexes. On the synthetic curve a significant event was chosen (e.g. the expression of Submenilitic Formation of the Pouzdřany Unit), and this was assigned to the actual reflex on the seismic cross section. Due to this fact fixed linkage without further movements was created between them (Fig. 3). Subsequently, other significant interfaces (e.g. the upper boundaries of the crystalline complex of the Bohemian Massif, the carbonates of the Upper Devonian and the Neogene sediments) were also correlated. The resultant synthetic seismogram was respon-sible for the seismic image in place of the declined well, and at the same time a new velocity model for a given borehole was obtained.
Fig. 2. a) Lithostratigraphic scheme of sediments for single geological eras. b) Geological profile through the Nesvačilka and Vranovice troughs (after Pícha,
1996). c) Distribution of autochthonous Palaeogene sediments in the Nesvačilka and Vranovice troughs (after Jiříček, 1994).
acta geologica slovaca, 8(1), 2016, 99–108
103
3.2. borehole seismic data measurements
The aim of borehole seismic data measurements is to obtain information on the elastic wave velocity in rocks in the vicinity of the well (Fejfar, 1985). Two types of measurements are well known: check shot velocity survey (check shot) and VSP. Note that the VSP is also a check shot velocity survey - but a check shot velocity survey is not a VSP. The VSP is a much more de-tailed survey than a check-shot survey because the geophones are more closely spaced. Also, the check shot measurement uses only direct path travel time, whereas the VSP uses all seismic waveforms in the well bore. The result of VSP is a vertical time cross section. Based on its correlation with wave field of the time cross section of the horizontal seismic profile (measured on the surface and passing through the well) it gives the possibility to obtain stratigraphic information on seismic reflexes. The check shot velocity survey, contrary to the VSP, allows us to obtain accurate data on the velocity change with depth. Its results are: (a) average velocities (the average value of the velocities between the Earth’s surface and the physical boundary in the depth), (b) sequence and interval velocities (the velocity in the selected depth interval or in a layer with a certain thickness), and (c) the data on the instantaneous and actual velocities of seismic waves for small depth intervals. These data then serve (together with the information from SL) in the interpretations of seismic measurements (Fejfar, 1985; Brewer, 2000; Hardage, 1992).
Based on the check shot measurements in the drill holes the average velocities to the interface and interval velocities were calculated for selected lithostratigraphic units.
4. velocIty analysIs
4.1 borehole seismic data measurement
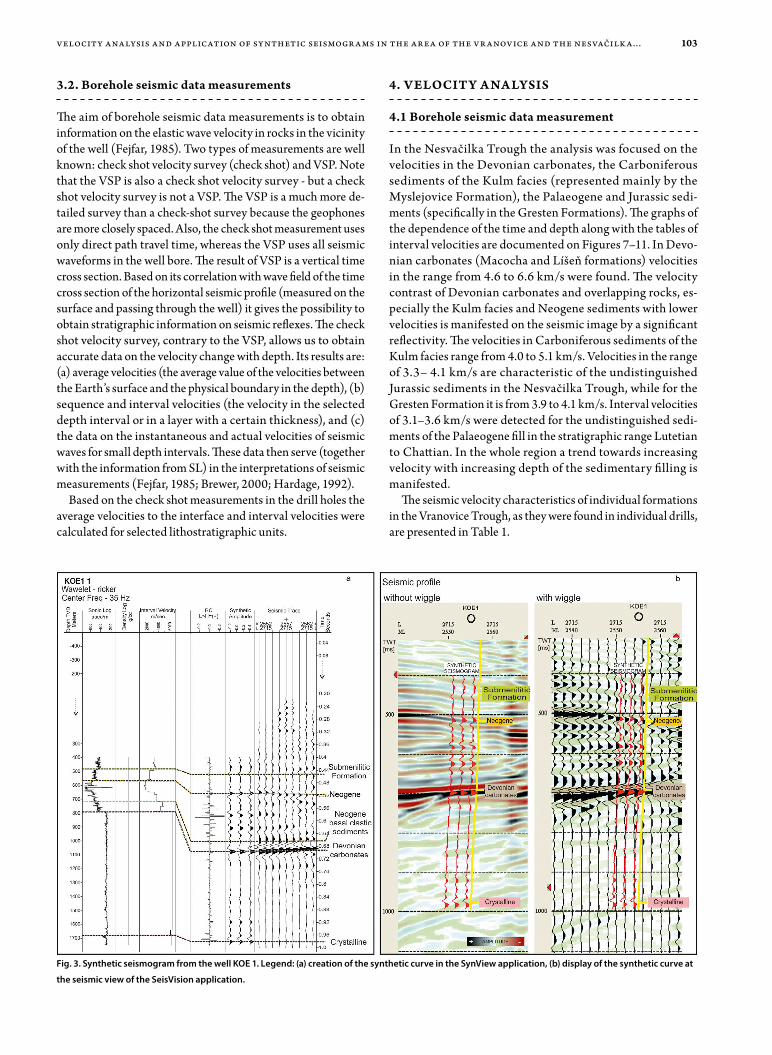
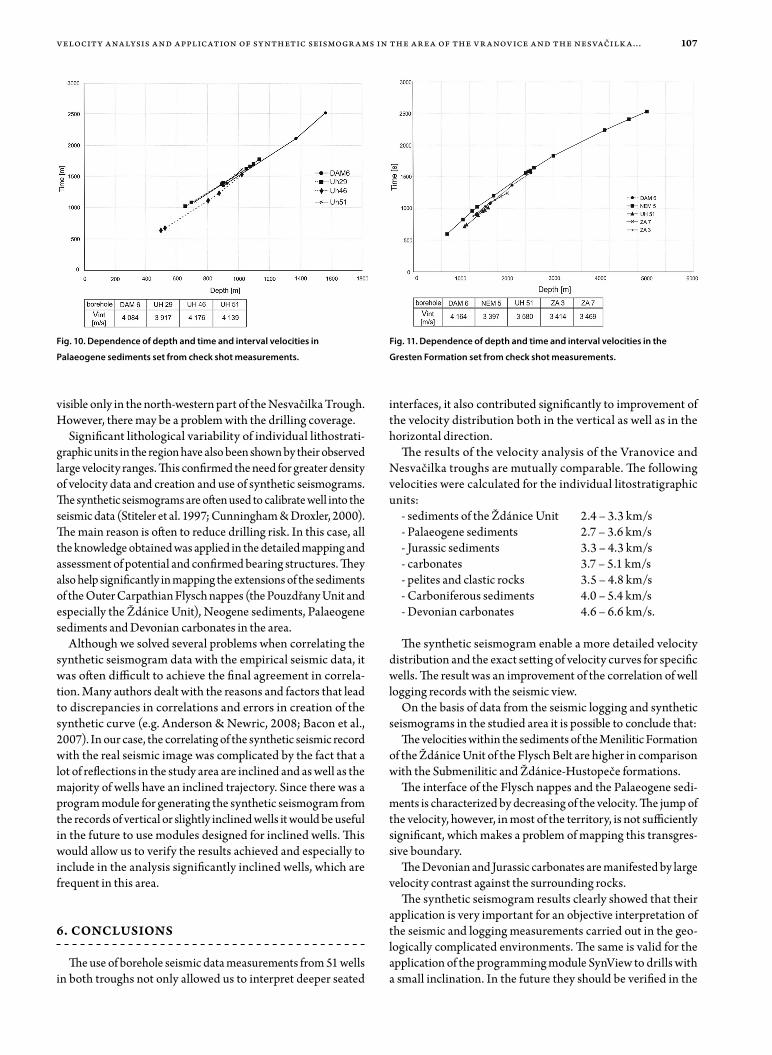
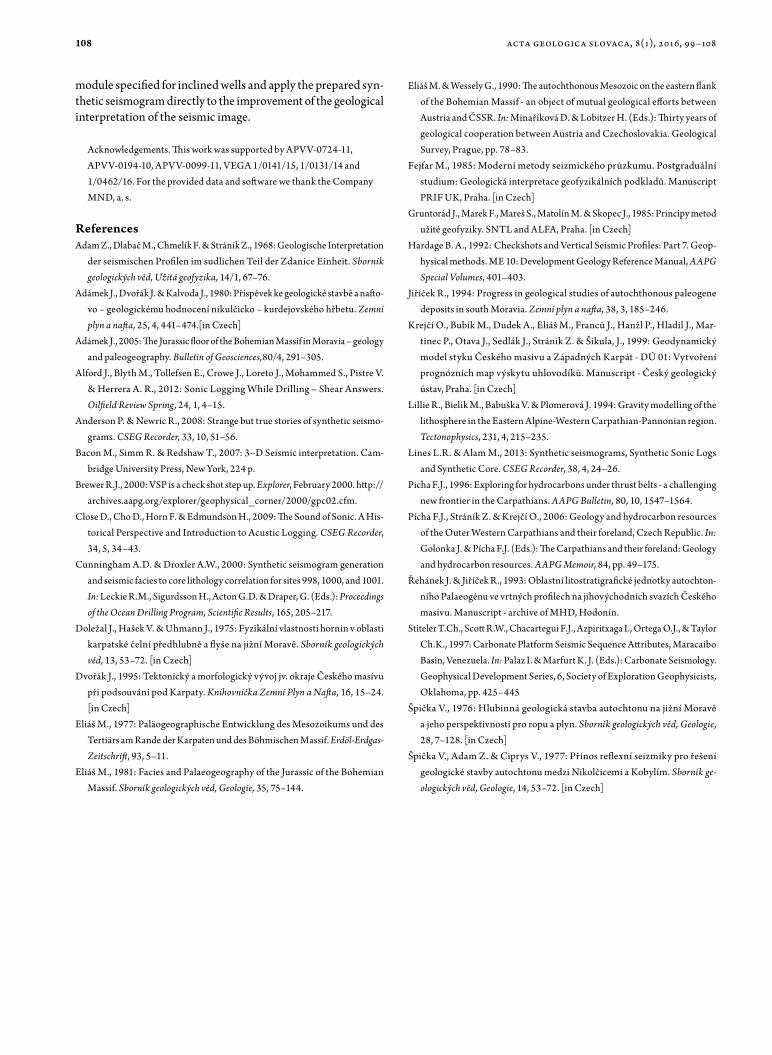
In the Nesvačilka Trough the analysis was focused on the velocities in the Devonian carbonates, the Carboniferous sediments of the Kulm facies (represented mainly by the Myslejovice Formation), the Palaeogene and Jurassic sedi-ments (specifically in the Gresten Formations). The graphs of the dependence of the time and depth along with the tables of interval velocities are documented on Figures 7–11. In Devo-nian carbonates (Macocha and Líšeň formations) velocities in the range from 4.6 to 6.6 km/s were found. The velocity contrast of Devonian carbonates and overlapping rocks, es-pecially the Kulm facies and Neogene sediments with lower velocities is manifested on the seismic image by a significant reflectivity. The velocities in Carboniferous sediments of the Kulm facies range from 4.0 to 5.1 km/s. Velocities in the range of 3.3– 4.1 km/s are characteristic of the undistinguished Jurassic sediments in the Nesvačilka Trough, while for the Gresten Formation it is from 3.9 to 4.1 km/s. Interval velocities of 3.1–3.6 km/s were detected for the undistinguished sedi-ments of the Palaeogene fill in the stratigraphic range Lutetian to Chattian. In the whole region a trend towards increasing velocity with increasing depth of the sedimentary filling is manifested.
The seismic velocity characteristics of individual formations in the Vranovice Trough, as they were found in individual drills, are presented in Table 1.
Fig. 3. Synthetic seismogram from the well KOE 1. Legend: (a) creation of the synthetic curve in the SynView application, (b) display of the synthetic curve at
the seismic view of the SeisVision application.
velocity analysis and application of synthetic seismogr ams in the area of the vr anovice and the nesvačilka...
104
4.2 synthetic seismogram
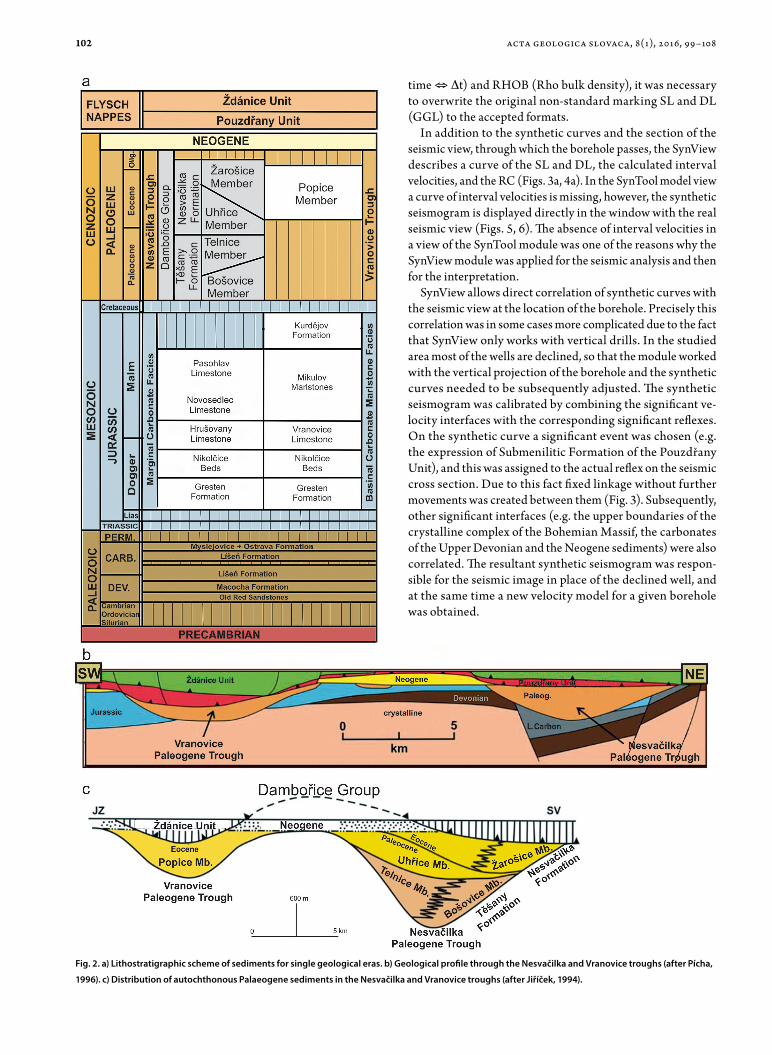
For more precise and improved velocity analysis in the exam-ined areas the synthetic seismograms from 20 wells were also used. On curves of the interval velocities from the module SynView there is a noticeable velocity decrease on the inter-face of the sediment of the Ždánice Unit and the autochtho-nous Palaeogene sediments. The velocity increase was found out at the transition from the Palaeogene sediments into the sediments of the Jurassic age, as well as on the boundary be-tween the sediments of the Jurassic and Lower Carboniferous (Kulm facies). Within the Jurassic sediments the decrease of
velocities reflects the transition of the Mikulov Marlstones to the Nikolčice Beds (sandstones and claystones) and the velocity increase characterizes the transition from clays to the sandstones of the Gresten Formation. The higher velocities of the Mikulov Marlstones are the result of a high proportion of the calcareous component, which is also proved by the curve of self-potential (SP), gamma log (GL) and a resistivity log (RAG) (Fig. 4c). All these interfaces have been observed even at the curves of the SL and DL (Fig. 4). The Devonian carbonates are mostly manifested (especially if the hangingwall consists of Neogene sediments) by a very significant velocity increase (Fig. 3). In the Neogene sediments, the velocity decreases
complex borehole
Hu
1
Vran
1
Mus
1
Pop
1
Pou
1
Sn 1
Sn 2
NM
1
NM
2
Poh
1
Poh
3
Nem
1
Nem
5
Nem
6
Nik
1
Nik
4
mea
n
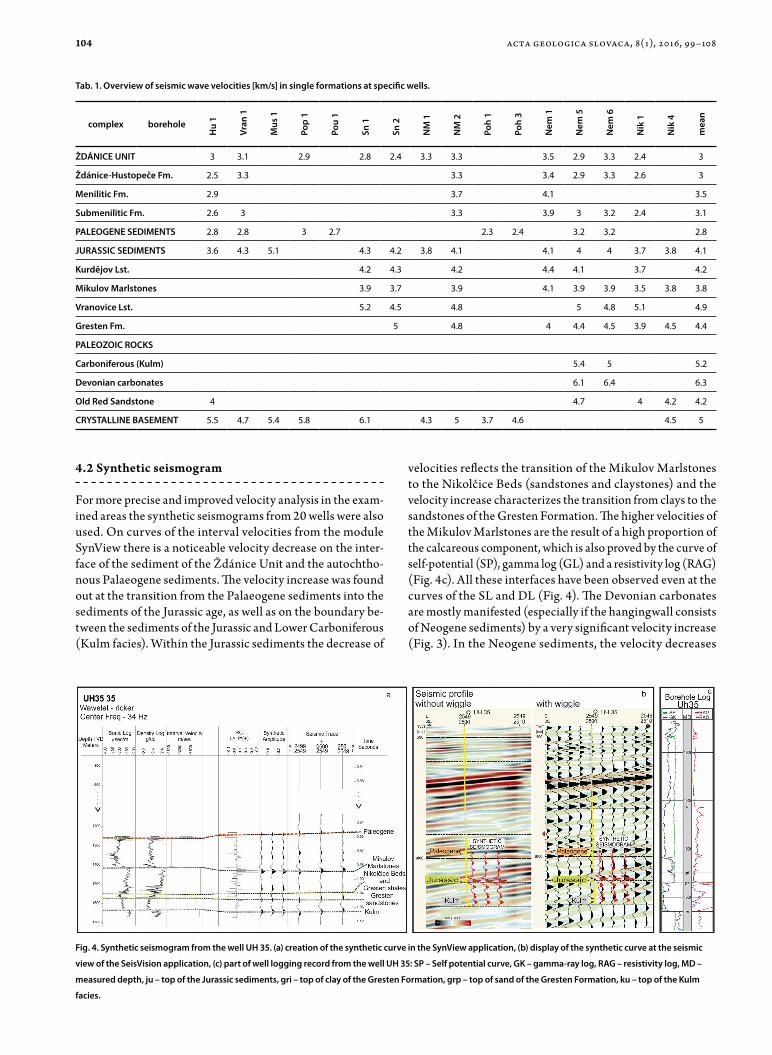
ŽDÁNICE UNIT 3 3.1 2.9 2.8 2.4 3.3 3.3 3.5 2.9 3.3 2.4 3
Ždánice-Hustopeče Fm. 2.5 3.3 3.3 3.4 2.9 3.3 2.6 3
Menilitic Fm. 2.9 3.7 4.1 3.5
Submenilitic Fm. 2.6 3 3.3 3.9 3 3.2 2.4 3.1
PALEOGENE SEDIMENTS 2.8 2.8 3 2.7 2.3 2.4 3.2 3.2 2.8
JURASSIC SEDIMENTS 3.6 4.3 5.1 4.3 4.2 3.8 4.1 4.1 4 4 3.7 3.8 4.1
Kurdějov Lst. 4.2 4.3 4.2 4.4 4.1 3.7 4.2
Mikulov Marlstones 3.9 3.7 3.9 4.1 3.9 3.9 3.5 3.8 3.8
Vranovice Lst. 5.2 4.5 4.8 5 4.8 5.1 4.9
Gresten Fm. 5 4.8 4 4.4 4.5 3.9 4.5 4.4
PALEOZOIC ROCKS
Carboniferous (Kulm) 5.4 5 5.2
Devonian carbonates 6.1 6.4 6.3
Old Red Sandstone 4 4.7 4 4.2 4.2
CRYSTALLINE BASEMENT 5.5 4.7 5.4 5.8 6.1 4.3 5 3.7 4.6 4.5 5
Tab. 1. Overview of seismic wave velocities [km/s] in single formations at specific wells.
Fig. 4. Synthetic seismogram from the well UH 35. (a) creation of the synthetic curve in the SynView application, (b) display of the synthetic curve at the seismic
view of the SeisVision application, (c) part of well logging record from the well UH 35: SP – Self potential curve, GK – gamma-ray log, RAG – resistivity log, MD –
measured depth, ju – top of the Jurassic sediments, gri – top of clay of the Gresten Formation, grp – top of sand of the Gresten Formation, ku – top of the Kulm
facies.
acta geologica slovaca, 8(1), 2016, 99–108
105
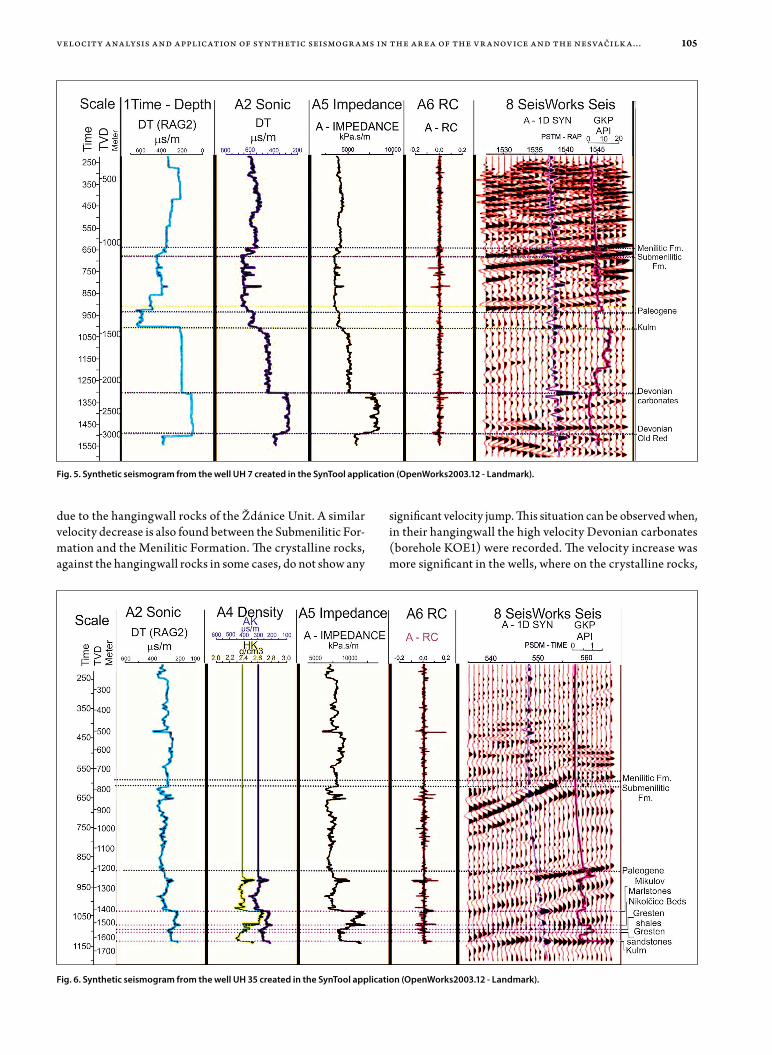
due to the hangingwall rocks of the Ždánice Unit. A similar velocity decrease is also found between the Submenilitic For-mation and the Menilitic Formation. The crystalline rocks, against the hangingwall rocks in some cases, do not show any
significant velocity jump. This situation can be observed when, in their hangingwall the high velocity Devonian carbonates (borehole KOE1) were recorded. The velocity increase was more significant in the wells, where on the crystalline rocks,
Fig. 5. Synthetic seismogram from the well UH 7 created in the SynTool application (OpenWorks2003.12 - Landmark).
Fig. 6. Synthetic seismogram from the well UH 35 created in the SynTool application (OpenWorks2003.12 - Landmark).
velocity analysis and application of synthetic seismogr ams in the area of the vr anovice and the nesvačilka...
106
the hangingwall is formed by Palaeocene, Jurassic or Neogene sediments.
5. dIscussIon
Different velocities of seismic waves in the geological and strati-graphic units forming both troughs lead of course to the creation of sharp boundaries of a stratigraphic or facies nature. These have been described already in the work of Doležal et al. (1975). These authors found that the crystalline complex, the Palaeozoic or the Mesozoic carbonates are in comparison with clastic rocks of the same age characterized by high velocities of seismic waves. A more detailed distribution was also developed later by Špička et al. (1977). They interpreted the velocity interfaces between the Menilitic Formation and the Ždánice-Hustopeče Forma-tion, as well as between the Submenilitic Formation and the Jurassic carbonates or the Mikulov Marlstones from the wells NIK 1, VRAN 1, NĚM 1 and KOB 1. The results of our velocity analysis not only confirm the knowledge of these authors but also significantly extends it. By including in the prospection all the wells drilled up to the year 2010, in which check shot measure-ments and sonic logging were done, we have managed to trace the velocity characteristics of single lithostratigraphic units not only in the more thoroughly explored Nesvačilka Trough, but also in the Vranovice Trough. The main problem was to characterize by velocity the single formations and strata of Jurassic sediments, because they were retained and confirmed only in some wells in the whole region with check shot measurements. Such detailed information was provided by the records, for example, from a deep borehole NĚM 5 in the region of the Nikolčice-Kurdějov Horst, which goes through the whole undisturbed lithologi-cal sequence of the Jurassic sediments. Doležal et al. (1975) and Špička et al. (1977) could not include this deep borehole in their analyses, because it was drilled in a later period. However, especially the wells on the slopes of the troughs do not reach the Jurassic sediments in the entire sequence. Drilling components from some wells did not provide the real distribution of Jurassic sediments. We tried to correlate spontaneous potential logs, gamma ray curves and resistivity logs to complete this informa-tion. But it was not always possible to accurately identify the single Jurassic formations. Mainly on the slopes of the troughs the Jurassic sediments are often preserved only as a residue. In such cases, the whole Jurassic block was characterized by one velocity. The Palaeogene infilling of both troughs has also not been divided in greater detail and the velocity of seismic waves in this environment has been identified as one unit. For the Palaeogene sediments apparent dependence of the seismic wave velocity on the depth of sediment deposit was observed. In the future it would be interesting to take a closer look at velocity distribution of the Paleogene filling of the troughs. Nevertheless, on the basis of seismic image we can assume that the velocity differences are not so significant that this division had to be taken into account in depth conversion. On the seismic image of the Palaeogene sedimentary filling of the troughs the reflection events are not very significant and continuous. The interface between the Palaeocene and the Eocene sediments is clearly
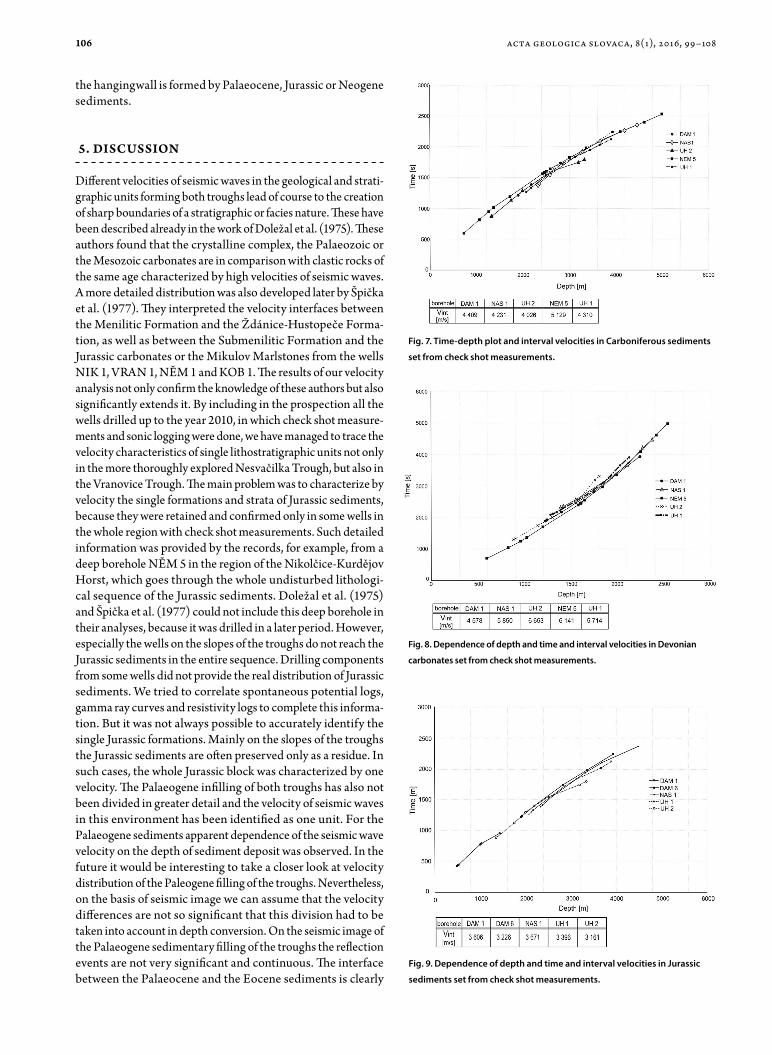
Fig. 7. Time-depth plot and interval velocities in Carboniferous sediments
set from check shot measurements.
Fig. 8. Dependence of depth and time and interval velocities in Devonian
carbonates set from check shot measurements.
Fig. 9. Dependence of depth and time and interval velocities in Jurassic
sediments set from check shot measurements.
acta geologica slovaca, 8(1), 2016, 99–108
107
visible only in the north-western part of the Nesvačilka Trough. However, there may be a problem with the drilling coverage.
Significant lithological variability of individual lithostrati-graphic units in the region have also been shown by their observed large velocity ranges. This confirmed the need for greater density of velocity data and creation and use of synthetic seismograms. The synthetic seismograms are often used to calibrate well into the seismic data (Stiteler et al. 1997; Cunningham & Droxler, 2000). The main reason is often to reduce drilling risk. In this case, all the knowledge obtained was applied in the detailed mapping and assessment of potential and confirmed bearing structures. They also help significantly in mapping the extensions of the sediments of the Outer Carpathian Flysch nappes (the Pouzdřany Unit and especially the Ždánice Unit), Neogene sediments, Palaeogene sediments and Devonian carbonates in the area.
Although we solved several problems when correlating the synthetic seismogram data with the empirical seismic data, it was often difficult to achieve the final agreement in correla-tion. Many authors dealt with the reasons and factors that lead to discrepancies in correlations and errors in creation of the synthetic curve (e.g. Anderson & Newric, 2008; Bacon et al., 2007). In our case, the correlating of the synthetic seismic record with the real seismic image was complicated by the fact that a lot of reflections in the study area are inclined and as well as the majority of wells have an inclined trajectory. Since there was a program module for generating the synthetic seismogram from the records of vertical or slightly inclined wells it would be useful in the future to use modules designed for inclined wells. This would allow us to verify the results achieved and especially to include in the analysis significantly inclined wells, which are frequent in this area.
6. conclusIons
The use of borehole seismic data measurements from 51 wells in both troughs not only allowed us to interpret deeper seated
interfaces, it also contributed significantly to improvement of the velocity distribution both in the vertical as well as in the horizontal direction.
The results of the velocity analysis of the Vranovice and Nesvačilka troughs are mutually comparable. The following velocities were calculated for the individual litostratigraphic units:
- sediments of the Ždánice Unit 2.4 – 3.3 km/s- Palaeogene sediments 2.7 – 3.6 km/s- Jurassic sediments 3.3 – 4.3 km/s- carbonates 3.7 – 5.1 km/s- pelites and clastic rocks 3.5 – 4.8 km/s- Carboniferous sediments 4.0 – 5.4 km/s- Devonian carbonates 4.6 – 6.6 km/s.
The synthetic seismogram enable a more detailed velocity distribution and the exact setting of velocity curves for specific wells. The result was an improvement of the correlation of well logging records with the seismic view.
On the basis of data from the seismic logging and synthetic seismograms in the studied area it is possible to conclude that:
The velocities within the sediments of the Menilitic Formation of the Ždánice Unit of the Flysch Belt are higher in comparison with the Submenilitic and Ždánice-Hustopeče formations.
The interface of the Flysch nappes and the Palaeogene sedi-ments is characterized by decreasing of the velocity. The jump of the velocity, however, in most of the territory, is not sufficiently significant, which makes a problem of mapping this transgres-sive boundary.
The Devonian and Jurassic carbonates are manifested by large velocity contrast against the surrounding rocks.
The synthetic seismogram results clearly showed that their application is very important for an objective interpretation of the seismic and logging measurements carried out in the geo-logically complicated environments. The same is valid for the application of the programming module SynView to drills with a small inclination. In the future they should be verified in the
velocity analysis and application of synthetic seismogr ams in the area of the vr anovice and the nesvačilka...
Fig. 10. Dependence of depth and time and interval velocities in
Palaeogene sediments set from check shot measurements.
Fig. 11. Dependence of depth and time and interval velocities in the
Gresten Formation set from check shot measurements.
108
module specified for inclined wells and apply the prepared syn-thetic seismogram directly to the improvement of the geological interpretation of the seismic image.
Acknowledgements. This work was supported by APVV-0724-11, APVV-0194-10, APVV-0099-11, VEGA 1/0141/15, 1/0131/14 and 1/0462/16. For the provided data and software we thank the Company MND, a. s.
referencesAdam Z., Dlabač M., Chmelík F. & Stráník Z., 1968: Geologische Interpretation
der seismischen Profilen im sudlichen Teil der Zdanice Einheit. Sborník geologických věd, Užitá geofyzika, 14/1, 67–76.
Adámek J., Dvořák J. & Kalvoda J., 1980: Příspěvek ke geologické stavbě a nafto-vo – geologickému hodnocení nikulčicko – kurdejovského hřbetu. Zemní plyn a nafta, 25, 4, 441–474.[in Czech]
Adámek J., 2005: The Jurassic floor of the Bohemian Massif in Moravia – geology and paleogeography. Bulletin of Geosciences,80/4, 291–305.
Alford J., Blyth M., Tollefsen E., Crowe J., Loreto J., Mohammed S., Pistre V. & Herrera A. R., 2012: Sonic Logging While Drilling – Shear Answers. Oilfield Review Spring, 24, 1, 4–15.
Anderson P. & Newric R., 2008: Strange but true stories of synthetic seismo-grams. CSEG Recorder, 33, 10, 51–56.
Bacon M., Simm R. & Redshaw T., 2007: 3–D Seismic interpretation. Cam-bridge University Press, New York, 224 p.
Brewer R.J., 2000: VSP is a check shot step up. Explorer, February 2000. http://archives.aapg.org/explorer/geophysical_corner/2000/gpc02.cfm.
Close D., Cho D., Horn F. & Edmundson H., 2009: The Sound of Sonic. A His-torical Perspective and Introduction to Acustic Logging. CSEG Recorder, 34, 5, 34–43.
Cunningham A.D. & Droxler A.W., 2000: Synthetic seismogram generation and seismic facies to core lithology correlation for sites 998, 1000, and 1001. In: Leckie R.M., Sigurdsson H., Acton G.D. & Draper, G. (Eds.): Proceedings of the Ocean Drilling Program, Scientific Results, 165, 205–217.
Doležal J., Hašek V. & Uhmann J., 1975: Fyzikální vlastnosti hornin v oblasti karpatské čelní předhlubně a flyše na jižní Moravě. Sborník geologických věd, 13, 53–72. [in Czech]
Dvořák J., 1995: Tektonický a morfologický vývoj jv. okraje Českého masívu při podsouváni pod Karpaty. Knihovnička Zemní Plyn a Nafta, 16, 15–24. [in Czech]
Eliáš M., 1977: Paläogeographische Entwicklung des Mesozoikums und des Tertiärs am Rande der Karpaten und des Böhmischen Massif. Erdöl-Erdgas-Zeitschrift, 93, 5–11.
Eliáš M., 1981: Facies and Palaeogeography of the Jurassic of the Bohemian Massif. Sborník geologických věd, Geologie, 35, 75–144.
Eliáš M. & Wessely G., 1990: The autochthonous Mesozoic on the eastern flank of the Bohemian Massif - an object of mutual geological efforts between Austria and ČSSR. In: Minaříková D. & Lobitzer H. (Eds.): Thirty years of geological cooperation between Austria and Czechoslovakia. Geological Survey, Prague, pp. 78–83.
Fejfar M., 1985: Moderní metody seizmického průzkumu. Postgraduální studium: Geologická interpretace geofyzikálních podkladů. Manuscript PRIF UK, Praha. [in Czech]
Gruntorád J., Marek F., Mareš S., Matolín M. & Skopec J., 1985: Principy metod užité geofyziky. SNTL and ALFA, Praha. [in Czech]
Hardage B. A., 1992: Checkshots and Vertical Seismic Profiles: Part 7. Geop-hysical methods. ME 10: Development Geology Reference Manual, AAPG Special Volumes, 401–403.
Jiříček R., 1994: Progress in geological studies of autochthonous paleogene deposits in south Moravia. Zemní plyn a nafta, 38, 3, 185–246.
Krejčí O., Bubík M., Dudek A., Eliáš M., Franců J., Hanžl P., Hladil J., Mar-tinec P., Otava J., Sedlák J., Stráník Z. & Šikula, J., 1999: Geodynamický model styku Českého masívu a Západných Karpát - DÚ 01: Vytvoření prognózních map výskytu uhlovodíků. Manuscript - Český geologický ústav, Praha. [in Czech]
Lillie R., Bielik M., Babuška V. & Plomerová J. 1994: Gravity modelling of the lithosphere in the Eastern Alpine-Western Carpathian-Pannonian region. Tectonophysics, 231, 4, 215–235.
Lines L.R. & Alam M., 2013: Synthetic seismograms, Synthetic Sonic Logs and Synthetic Core. CSEG Recorder, 38, 4, 24–26.
Picha F.J., 1996: Exploring for hydrocarbons under thrust belts - a challenging new frontier in the Carpathians. AAPG Bulletin, 80, 10, 1547–1564.
Pícha F.J., Stráník Z. & Krejčí O., 2006: Geology and hydrocarbon resources of the Outer Western Carpathians and their foreland, Czech Republic. In: Golonka J. & Pícha F.J. (Eds.): The Carpathians and their foreland: Geology and hydrocarbon resources. AAPG Memoir, 84, pp. 49–175.
Řehánek J. & Jiříček R., 1993: Oblastní litostratigrafické jednotky autochton-ního Palaeogénu ve vrtných profilech na jihovýchodních svazích Českého masivu. Manuscript - archive of MHD, Hodonín.
Stiteler T.Ch., Scott R.W., Chacartegui F.J., Azpiritxaga I., Ortega O.J., & Taylor Ch.K., 1997: Carbonate Platform Seismic Sequence Attributes, Maracaibo Basin, Venezuela. In: Palaz I. & Marfurt K. J. (Eds.): Carbonate Seismology. Geophysical Development Series, 6, Society of Exploration Geophysicists, Oklahoma, pp. 425–445
Špička V., 1976: Hlubinná geologická stavba autochtonu na jižní Moravě a jeho perspektivnosti pro ropu a plyn. Sborník geologických věd, Geologie, 28, 7–128. [in Czech]
Špička V., Adam Z. & Ciprys V., 1977: Přínos reflexní seizmiky pro řešení geologické stavby autochtonu medzi Nikolčicemi a Kobylím. Sborník ge-ologických věd, Geologie, 14, 53–72. [in Czech]
acta geologica slovaca, 8(1), 2016, 99–108