veeva analyst & investor day - s2.q4cdn.com · 2017 veeva analyst & investor day veeva...
TRANSCRIPT

© Copyright 2017 Veeva Systems Inc., all rights reserved2
Veeva Analyst & Investor DayOctober 11, 2017
© Copyright 2017 Veeva Systems Inc., all rights reserved3
Safe Harbor
Forward-looking Statements
This presentation contains forward-looking statements, including statements regarding Veeva's future financial outlook and financial performance, market
growth, the release dates for and benefits from the use of Veeva's solutions, our partnership plans, our strategies, and general business conditions. Any forward-
looking statements contained in this presentation are based upon Veeva's historical performance and its current plans, estimates and expectations and are not a
representation that such plans, estimates, or expectations will be achieved. These forward-looking statements represent Veeva's expectations as of the date of
this presentation. Subsequent events may cause these expectations to change, and Veeva disclaims any obligation to update the forward-looking statements in
the future. These forward-looking statements are subject to known and unknown risks and uncertainties that may cause actual results to differ materially,
including (i) historical fluctuation of our quarterly results and our limited operating history, which make it difficult to predict future results; (ii) our expectation
that the future growth rate of our revenues will decline, and that as our costs increase, we may not be able to generate sufficient revenues to sustain the level of
profitability we have achieved in the past or achieve profitability in the future; (iii) breaches in our security measures or unauthorized access to our customers’
data; (iv) system unavailability, performance problems, or loss of data due to disruptions or other problems with our data center operations or computing
infrastructure; (v) dependence on revenues from our Veeva CRM solution, and the rate of adoption of our new products; (vi) acceptance of our applications and
services by customers, including renewals of existing subscriptions and purchases of subscriptions for additional users and solutions; (vii) our ability to retain Zinc
Ahead customers and achieve the expected results from our acquisition of Zinc Ahead; (viii) loss of one or more key customers; (ix) adverse changes in general
economic or market conditions, particularly in the life sciences industry; (x) delays or reductions in information technology spending, particularly in the life
sciences industry, including as a result of mergers in the life sciences industry; (xi) the development of the market for enterprise cloud services, particularly in
the life sciences industry; (xii) competitive factors, including but not limited to pricing pressures, industry consolidation, difficulty securing rights to access, host
or integrate with complementary third party products or data used by our customers, entry of new competitors and new applications and marketing initiatives
by our competitors; (xiii) our ability to manage our growth effectively; (xiv) changes in sales that may not be immediately reflected in our results due to the
ratable recognition of our subscription revenue; and (xv) pending, threatened, or future legal proceedings and related expenses.
Additional risks and uncertainties that could affect Veeva’s financial results are included under the captions “Risk Factors” and “Management’s Discussion and
Analysis of Financial Condition and Results of Operations,” in the company’s filing on Form 10-Q for the period ended July 31, 2017, which is available on the
company’s website at www.veeva.com under the Investors section and on the SEC’s website at www.sec.gov. Further information on potential risks that could
affect actual results will be included in other filings Veeva makes with the SEC from time to time.

© Copyright 2017 Veeva Systems Inc., all rights reserved4
2017 Veeva Analyst & Investor Day
Veeva Vision Peter Gassner, Founder & CEO
Partner to the Industry Matt Wallach, Co-founder & President
Customer Success Michael Louie, Gilead
Unified Clinical Henry Levy, Chief Strategy Officer
Veeva QualityOne Peter Gassner, Founder & CEO
Financial Update Tim Cabral, CFO
Q&A All
© Copyright 2017 Veeva Systems Inc., all rights reserved5
Veeva VisionPeter Gassner, Founder & CEO
© Copyright 2017 Veeva Systems Inc., all rights reserved6
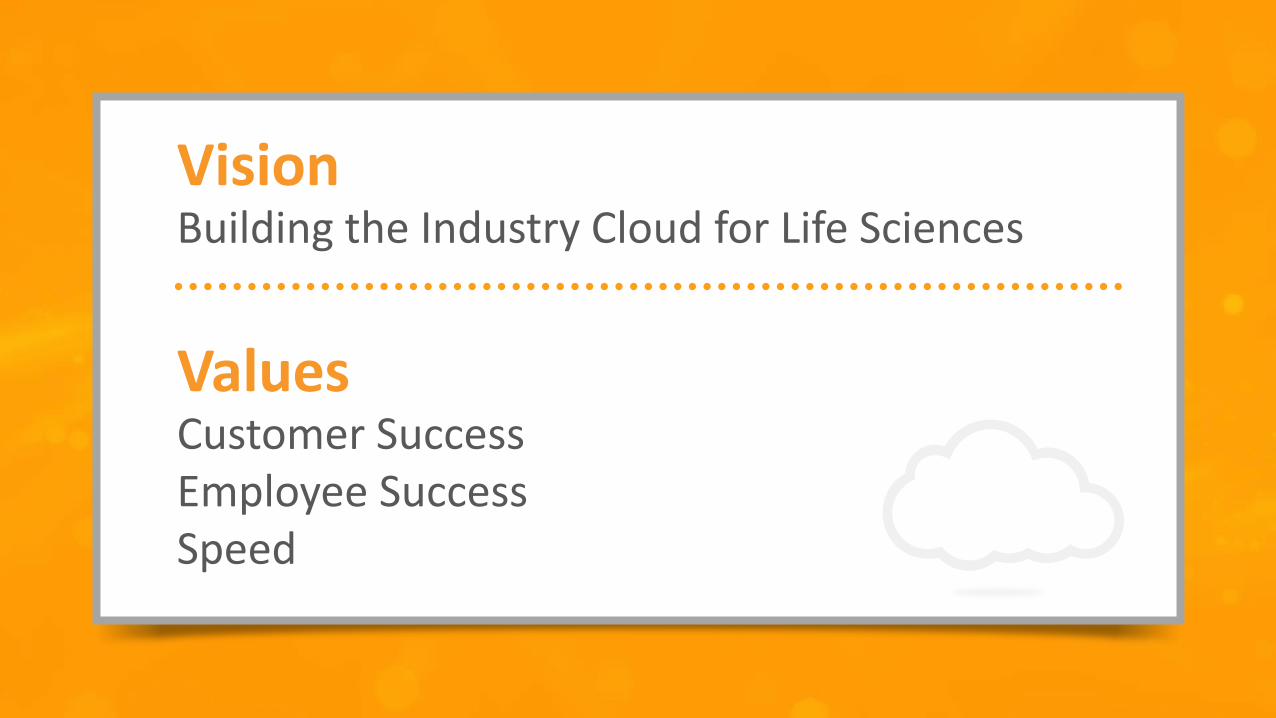
VisionBuilding the Industry Cloud for Life Sciences
ValuesCustomer SuccessEmployee SuccessSpeed
© Copyright 2017 Veeva Systems Inc., all rights reserved7
Key Highlights
• Track Record of Technology Innovation and Product Excellence
• Powerful and Unique Cloud Platform
• Long-term Leadership in Strategic Markets
• Business Model Advantage – The Veeva Way
© Copyright 2017 Veeva Systems Inc., all rights reserved8
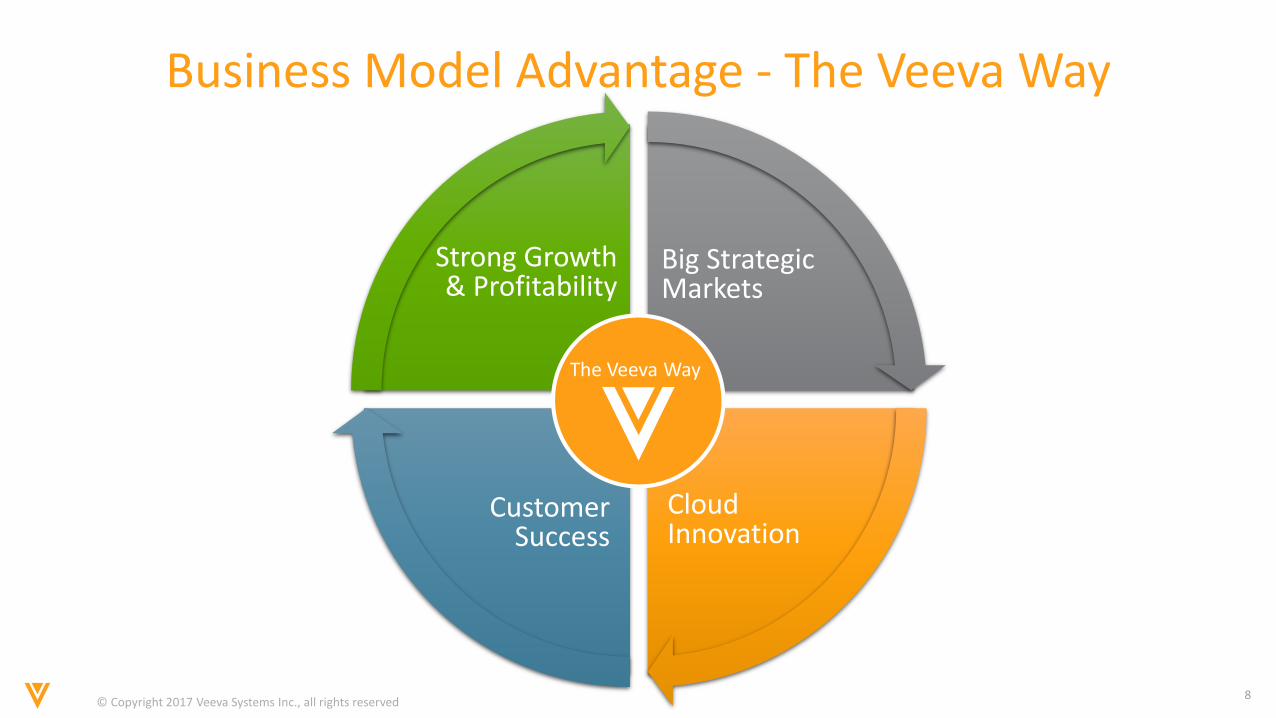
Business Model Advantage - The Veeva Way
The Veeva Way
Customer Success
Cloud Innovation
Strong Growth & Profitability
Big Strategic Markets
© Copyright 2017 Veeva Systems Inc., all rights reserved9
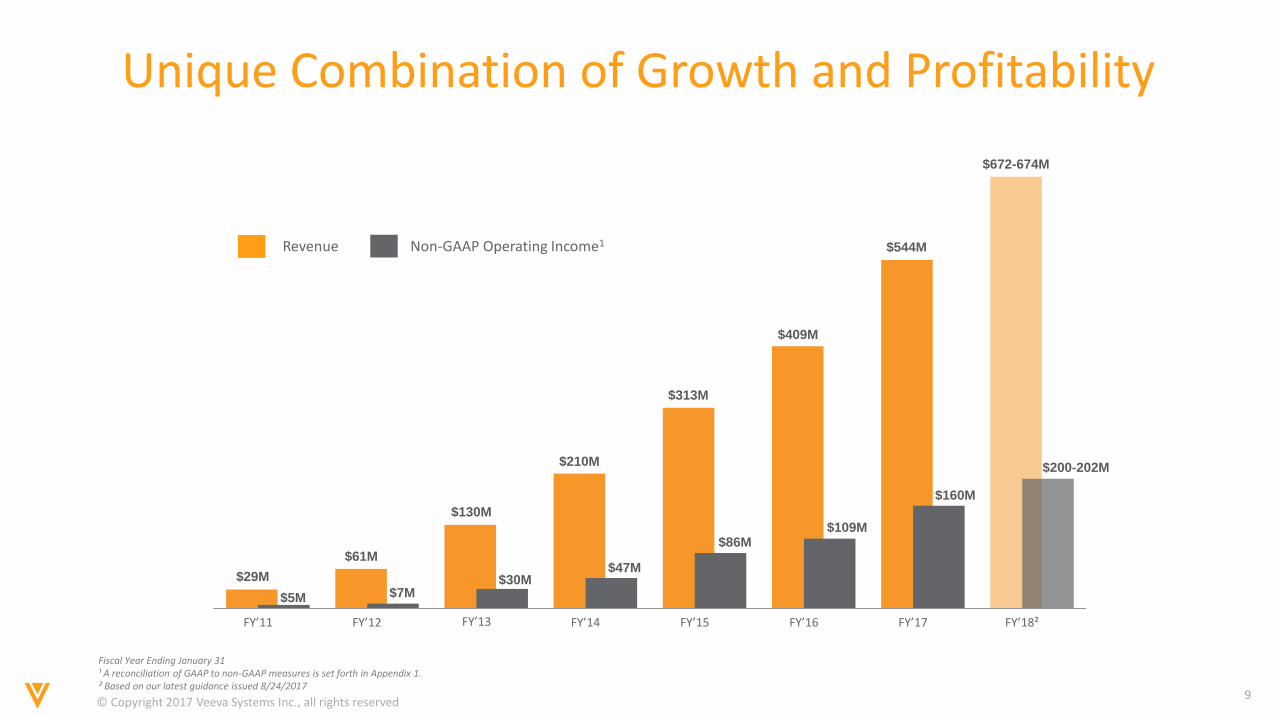
Unique Combination of Growth and Profitability
Fiscal Year Ending January 31¹ A reconciliation of GAAP to non-GAAP measures is set forth in Appendix 1.² Based on our latest guidance issued 8/24/2017
FY’12 FY’13 FY’14
Revenue Non-GAAP Operating Income1
$61M
$130M
$210M
$313M
$409M
$544M
$7M$30M
$47M
$86M$109M
$160M
FY’15 FY’16 FY’17
$29M
$5M
FY’11 FY’18²
$672-674M
$200-202M
© Copyright 2017 Veeva Systems Inc., all rights reserved10
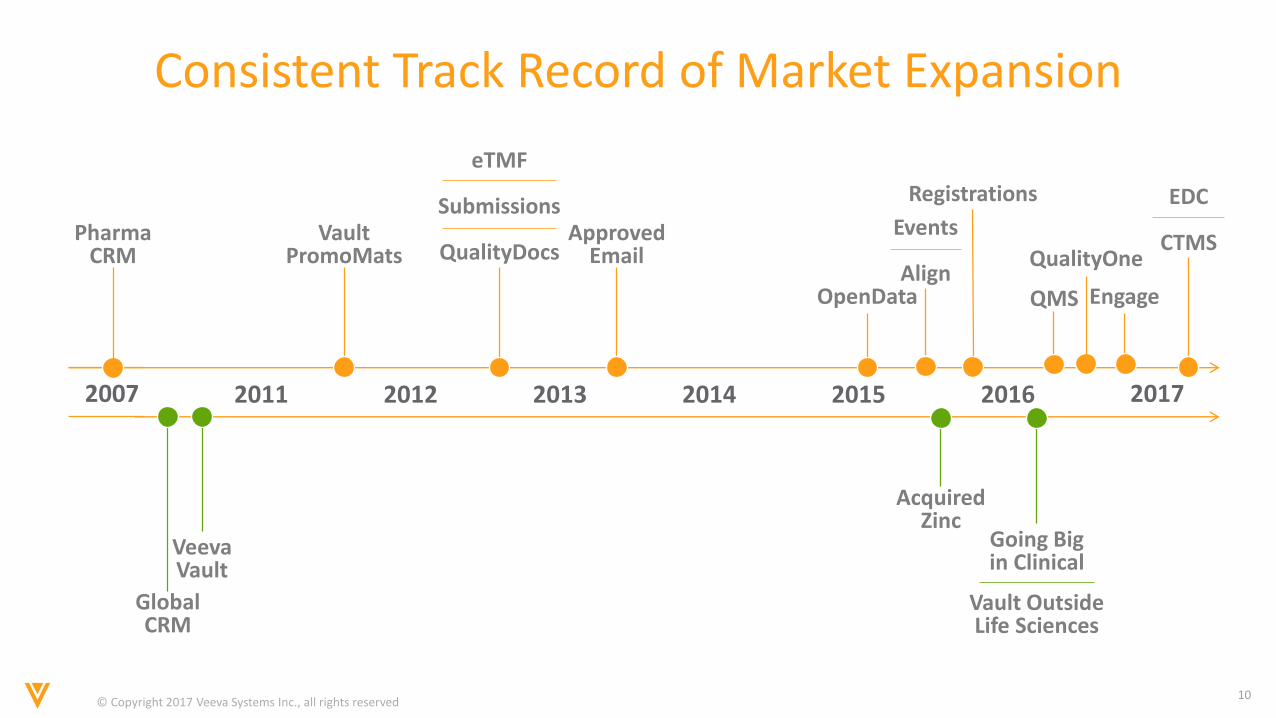
Consistent Track Record of Market Expansion
2014201320122011 2015 20162007 2017
VaultPromoMats
Approved Email
eTMF
Submissions
QualityDocs
Registrations
QMS OpenData
Global CRM
Veeva Vault
Pharma CRM
Events
AlignEngage
Going Big in Clinical
Vault Outside Life Sciences
Acquired Zinc
QualityOne
EDC
CTMS
© Copyright 2017 Veeva Systems Inc., all rights reserved11
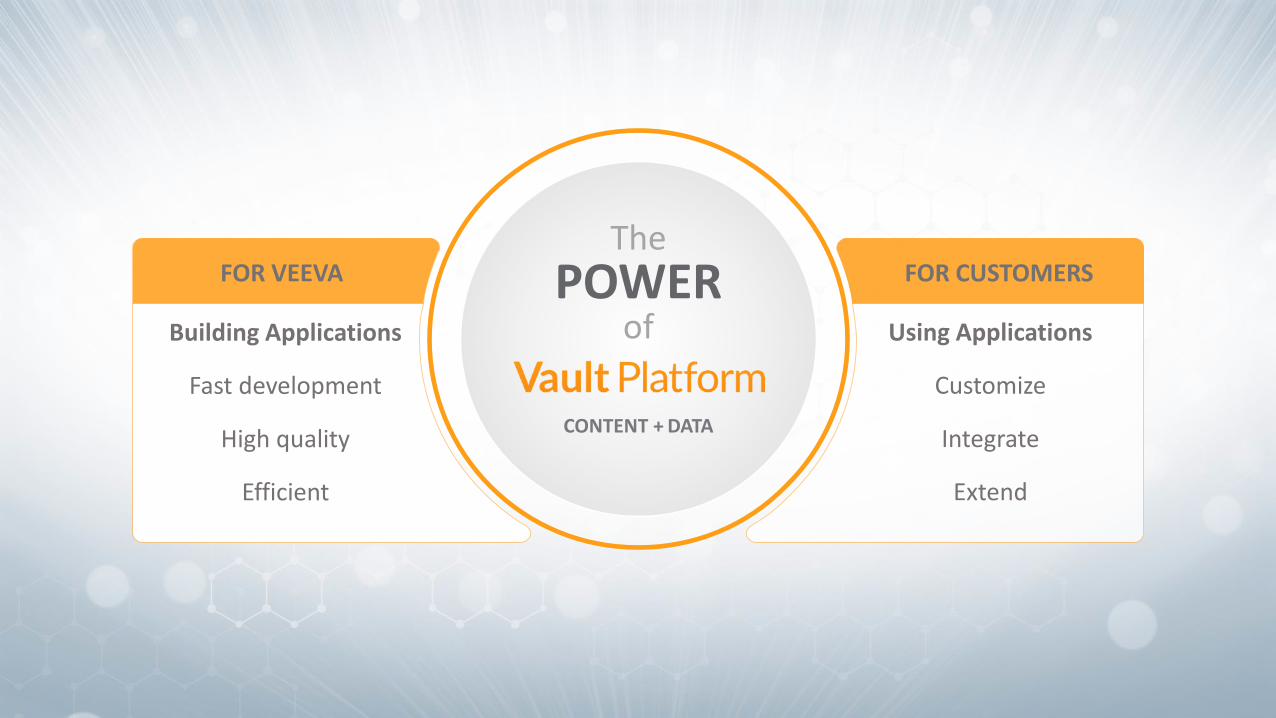
FOR VEEVA
Building Applications
Fast development
High quality
Efficient
FOR CUSTOMERSPOWERThe
of
CONTENT + DATA
Using Applications
Customize
Integrate
Extend
© Copyright 2017 Veeva Systems Inc., all rights reserved12
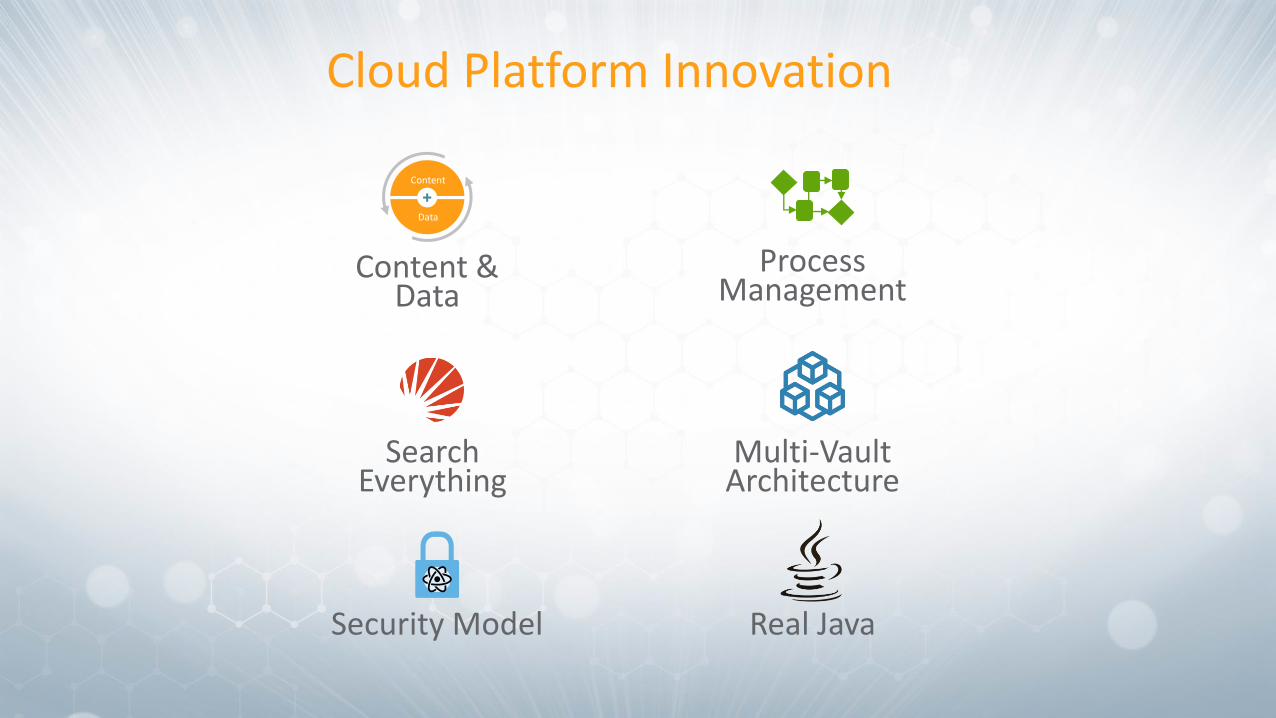
Cloud Platform Innovation
Content
Data
Content & Data
Security Model
Search Everything
Process Management
Multi-Vault Architecture
Real Java
© Copyright 2017 Veeva Systems Inc., all rights reserved13
ALL IN ON

© Copyright 2017 Veeva Systems Inc., all rights reserved14
The Industry Cloud for Life Sciences
© Copyright 2017 Veeva Systems Inc., all rights reserved15
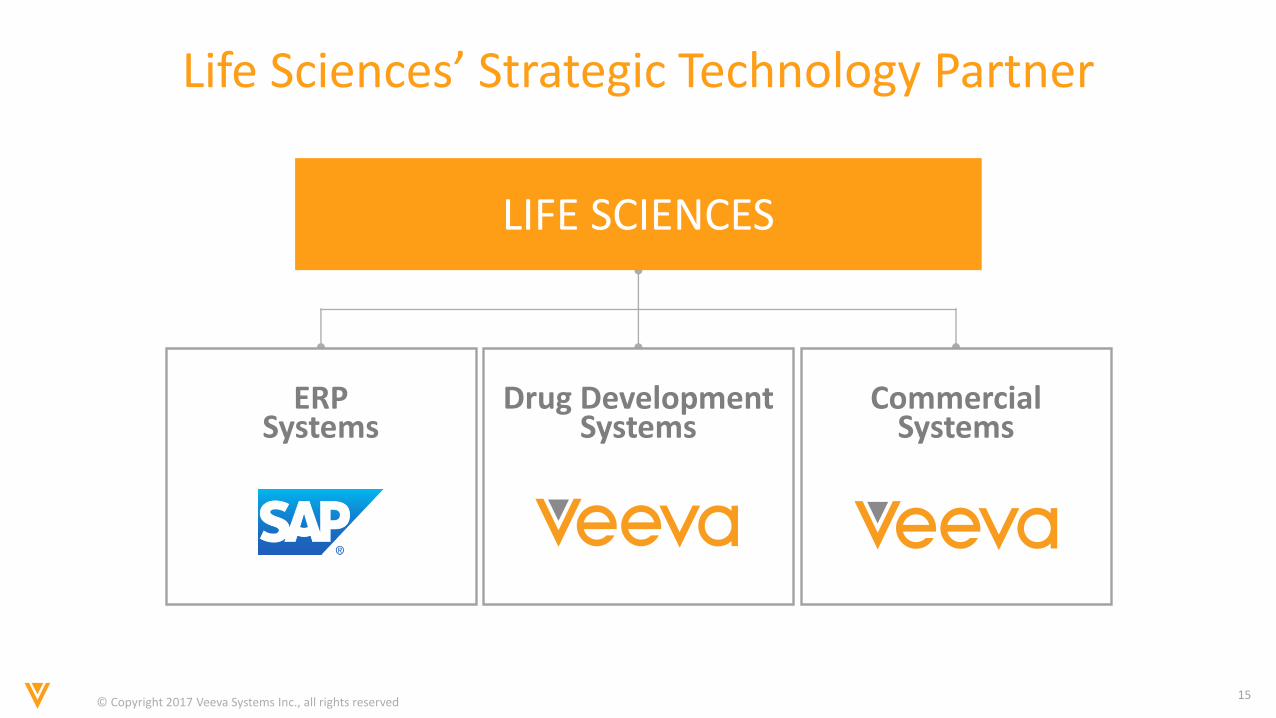
Life Sciences’ Strategic Technology Partner
LIFE SCIENCES
ERP Systems
Drug Development Systems
Commercial Systems
© Copyright 2017 Veeva Systems Inc., all rights reserved16
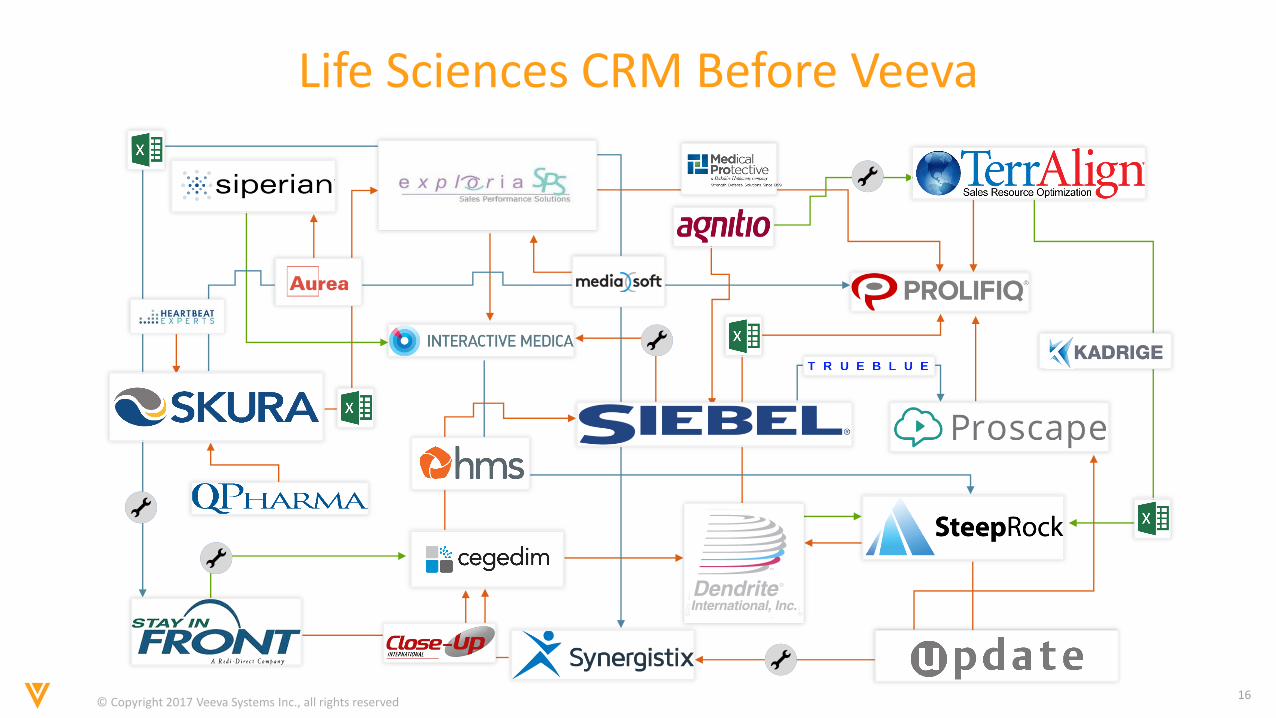
Life Sciences CRM Before Veeva
© Copyright 2017 Veeva Systems Inc., all rights reserved17
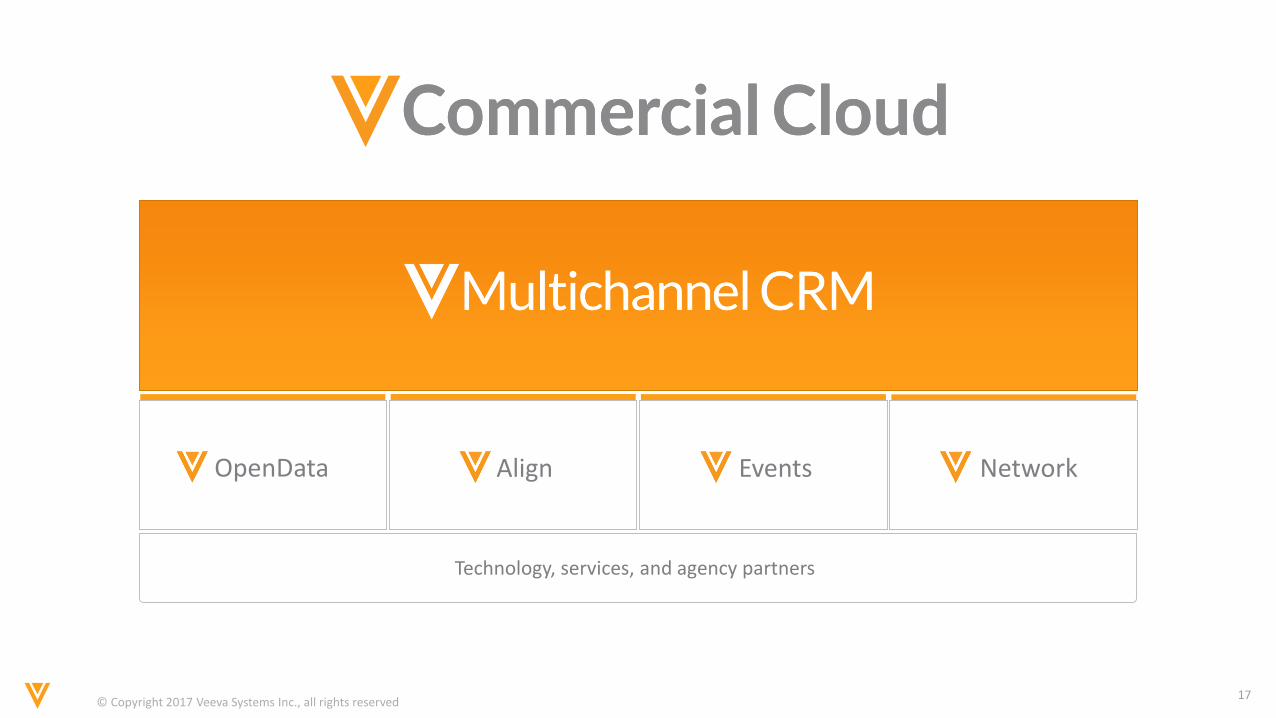
AlignOpenData Events Network
Technology, services, and agency partners
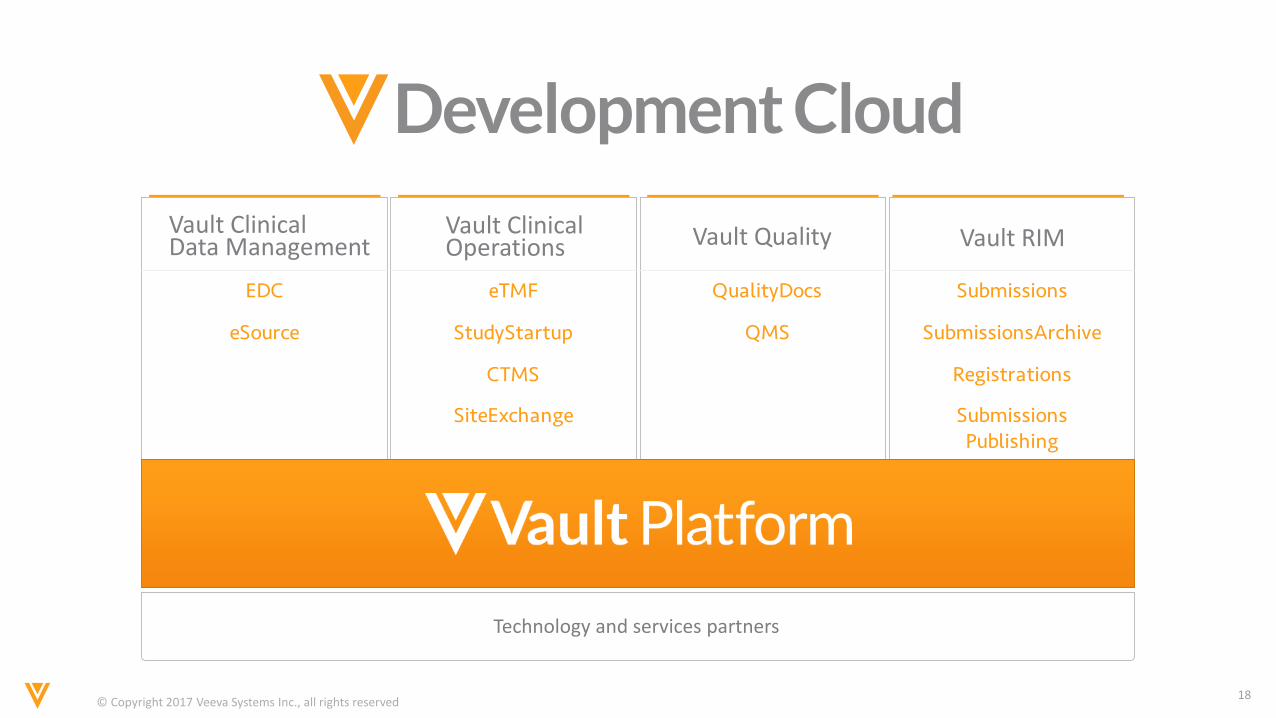
© Copyright 2017 Veeva Systems Inc., all rights reserved18
Technology and services partners
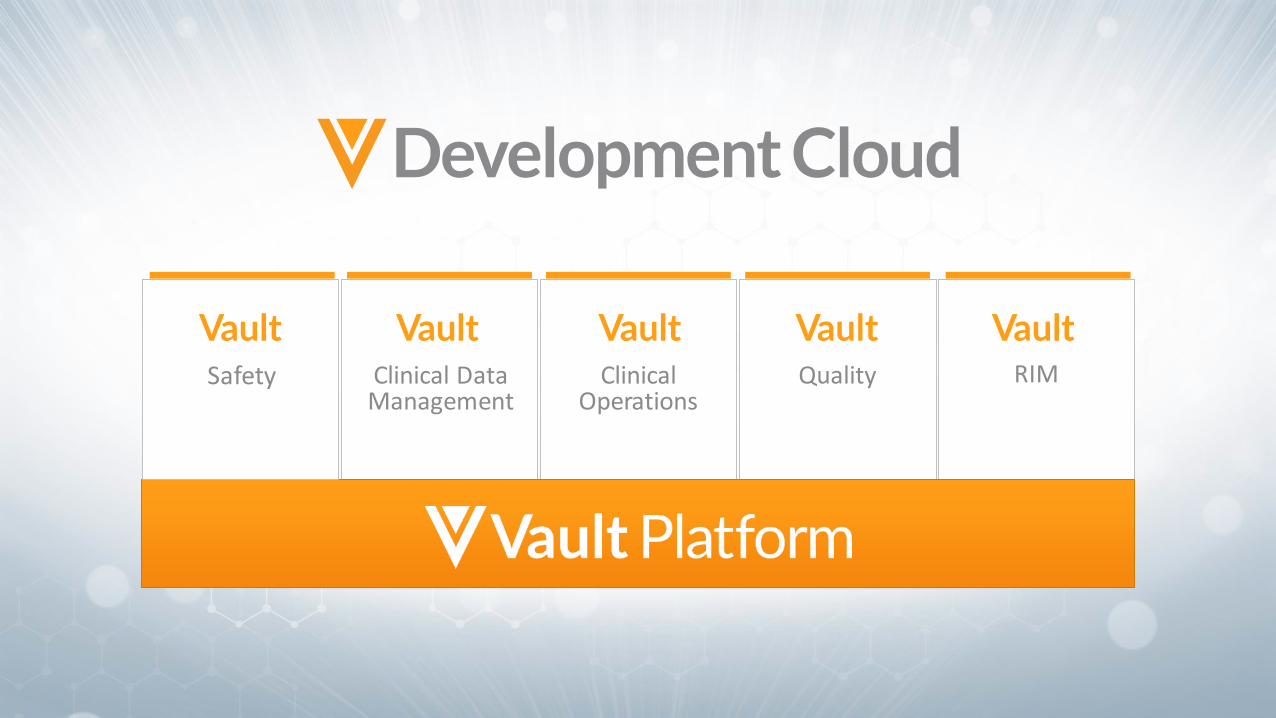
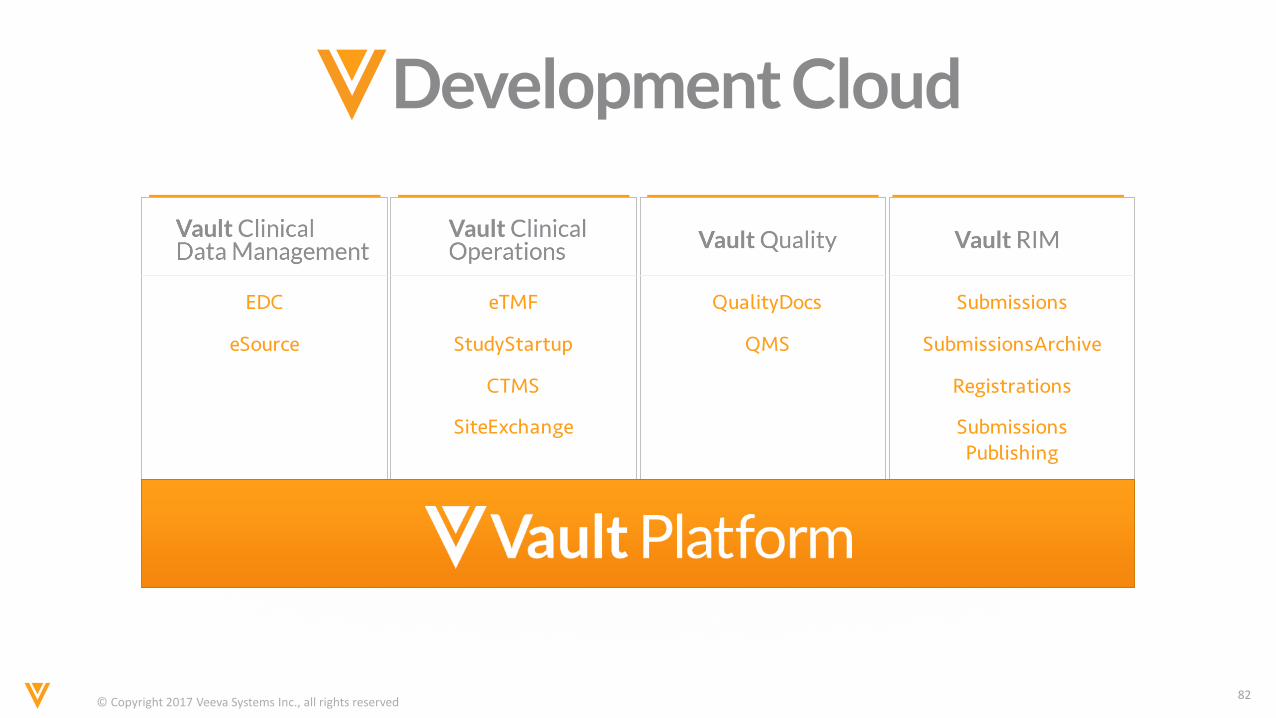
Vault Clinical Data Management
Vault Clinical Operations Vault Quality Vault RIM
© Copyright 2017 Veeva Systems Inc., all rights reserved19
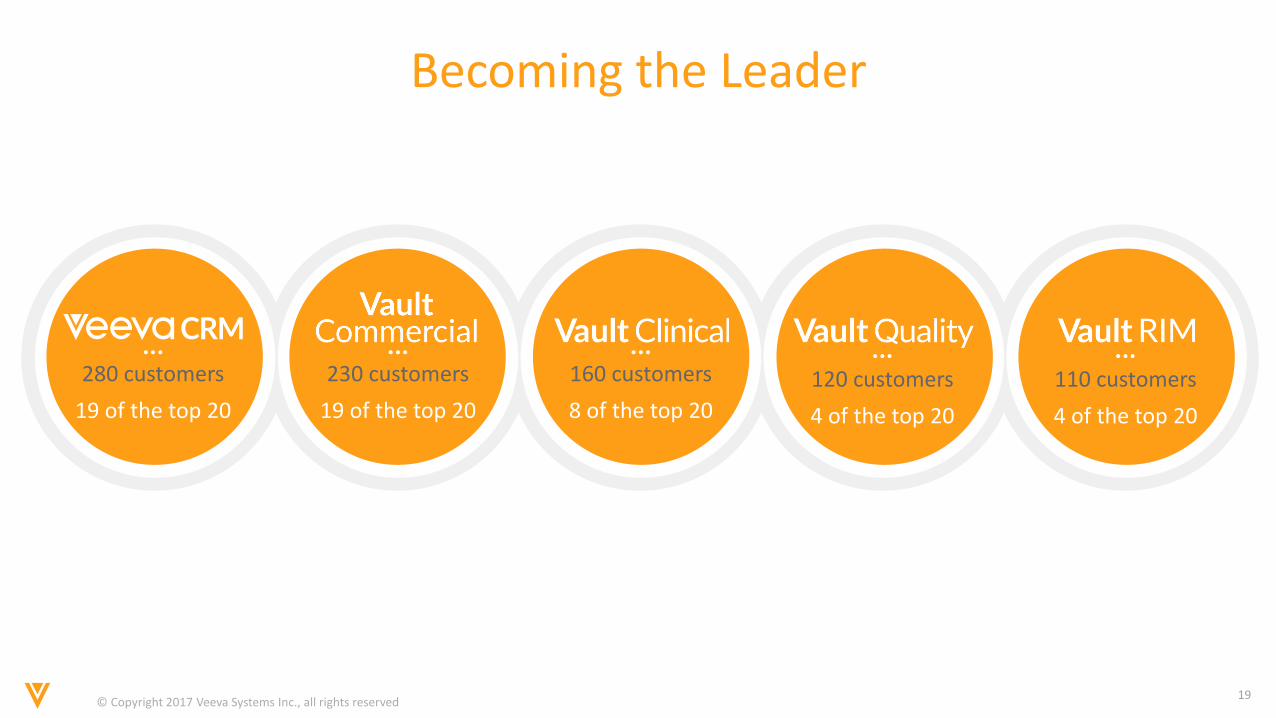
Becoming the Leader
160 customers
8 of the top 20
280 customers
19 of the top 20
110 customers
4 of the top 20
120 customers
4 of the top 20
230 customers
19 of the top 20
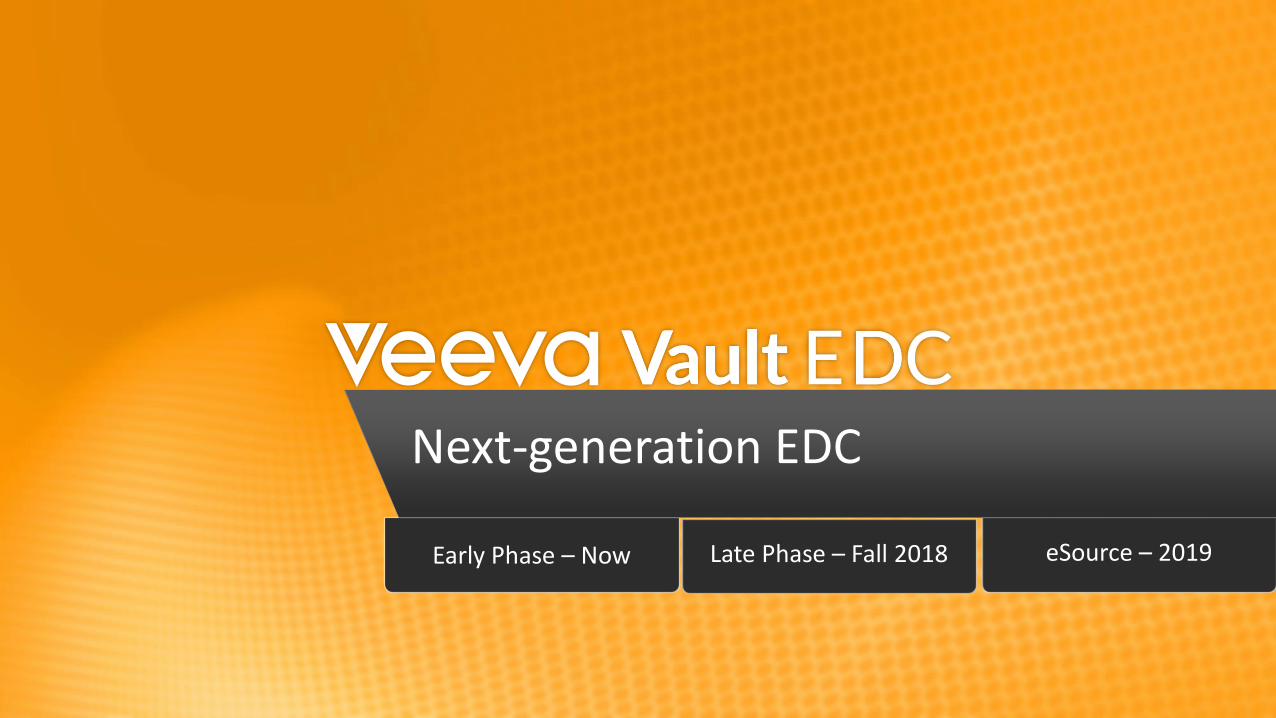
Early Phase – Now Late Phase – Fall 2018 eSource – 2019
Next-generation EDC
© Copyright 2017 Veeva Systems Inc., all rights reserved21
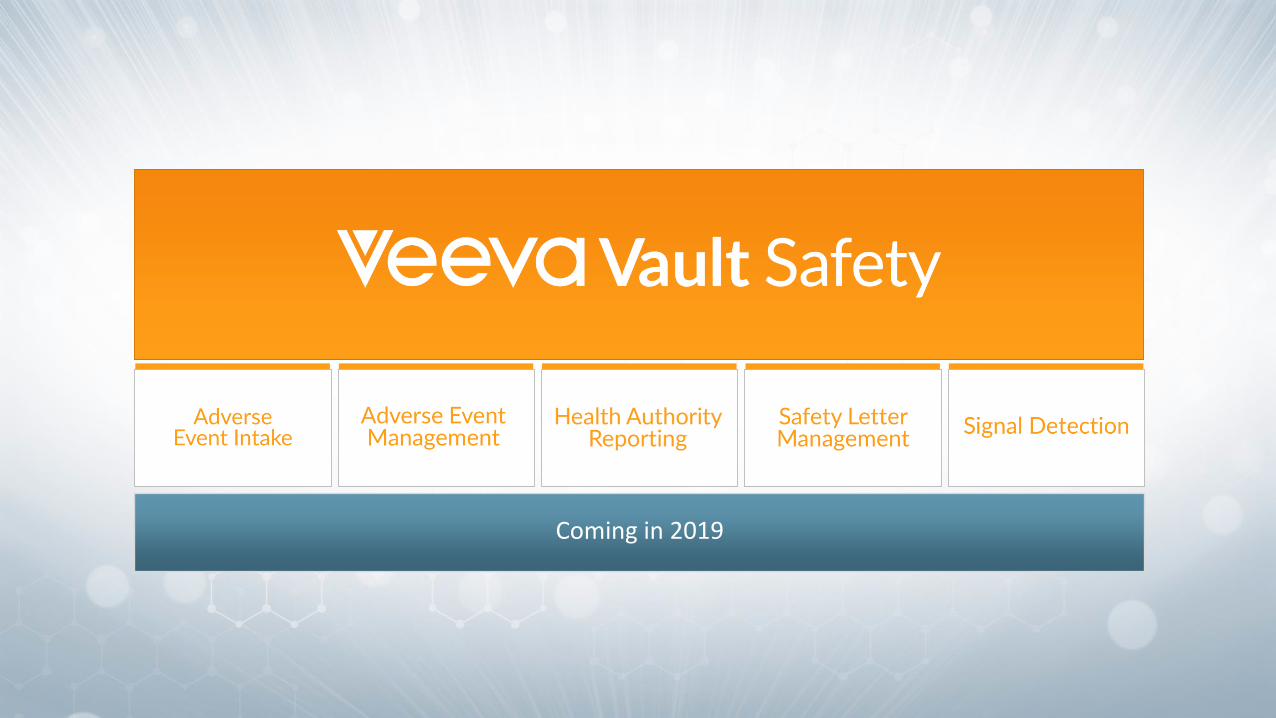
Coming in 2019
© Copyright 2017 Veeva Systems Inc., all rights reserved22
© Copyright 2017 Veeva Systems Inc., all rights reserved23
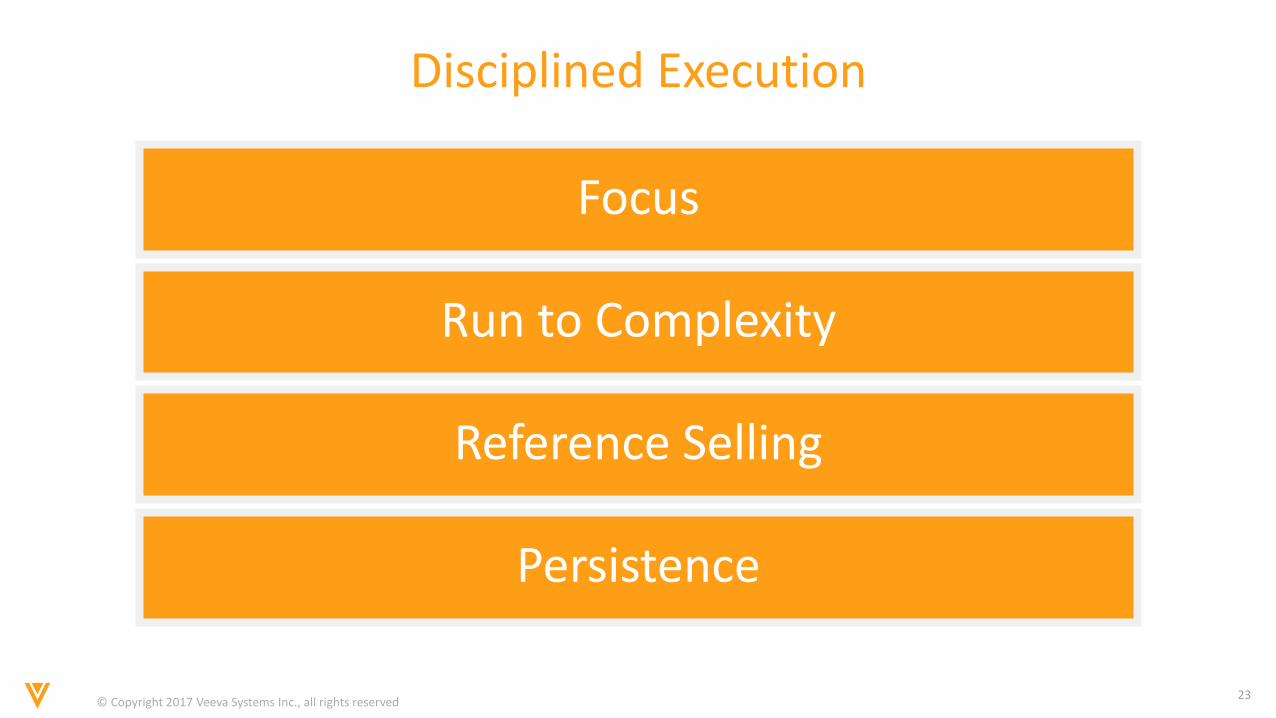
Disciplined Execution
Focus
Run to Complexity
Reference Selling
Persistence
© Copyright 2017 Veeva Systems Inc., all rights reserved24
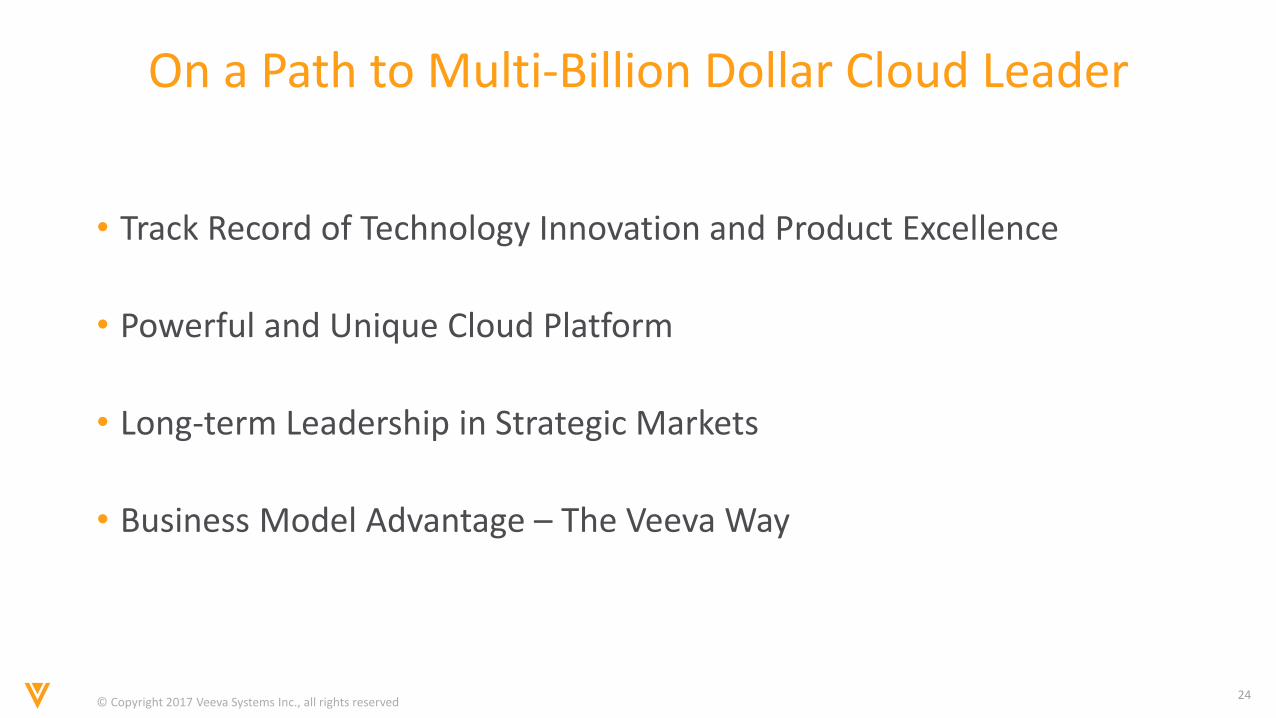
On a Path to Multi-Billion Dollar Cloud Leader
• Track Record of Technology Innovation and Product Excellence
• Powerful and Unique Cloud Platform
• Long-term Leadership in Strategic Markets
• Business Model Advantage – The Veeva Way
© Copyright 2017 Veeva Systems Inc., all rights reserved25
Partner to the IndustryMatt Wallach, President

© Copyright 2017 Veeva Systems Inc., all rights reserved26
Market Opportunity
© Copyright 2017 Veeva Systems Inc., all rights reserved27
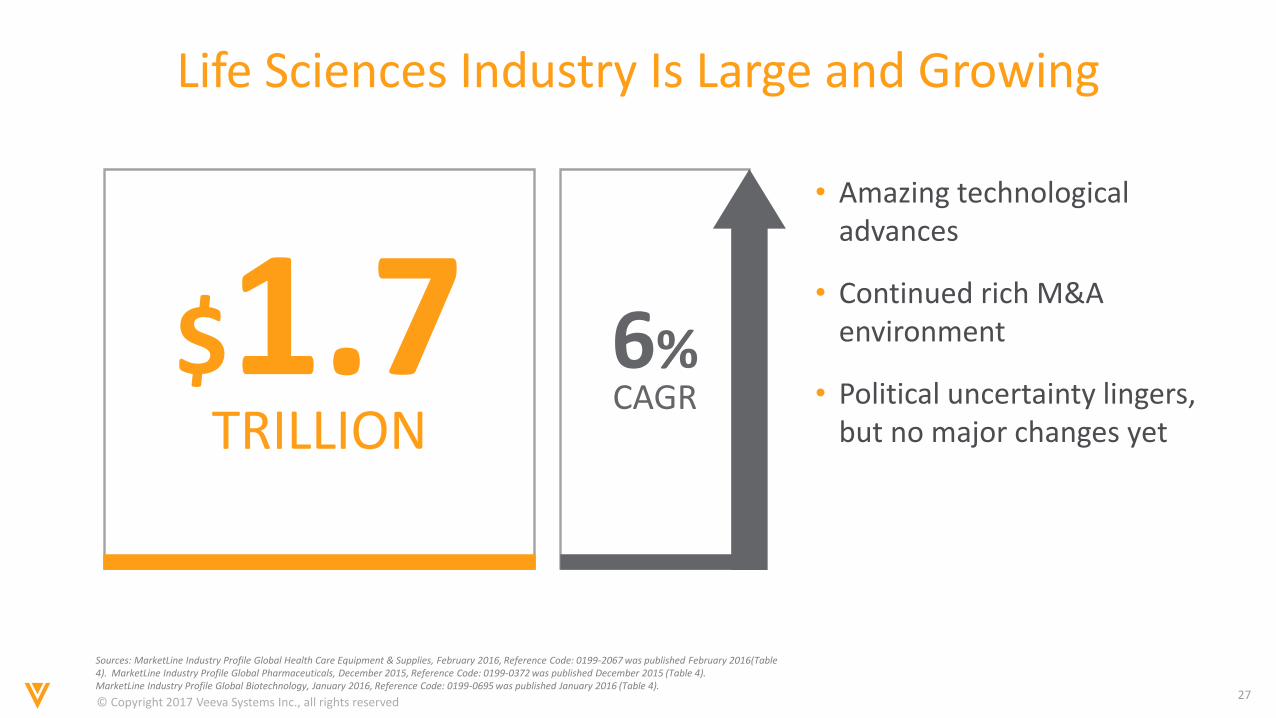
Sources: MarketLine Industry Profile Global Health Care Equipment & Supplies, February 2016, Reference Code: 0199-2067 was published February 2016(Table 4). MarketLine Industry Profile Global Pharmaceuticals, December 2015, Reference Code: 0199-0372 was published December 2015 (Table 4).MarketLine Industry Profile Global Biotechnology, January 2016, Reference Code: 0199-0695 was published January 2016 (Table 4).
Life Sciences Industry Is Large and Growing
• Amazing technological advances
• Continued rich M&A environment
• Political uncertainty lingers, but no major changes yet
6%CAGR
$1.7TRILLION
© Copyright 2017 Veeva Systems Inc., all rights reserved28
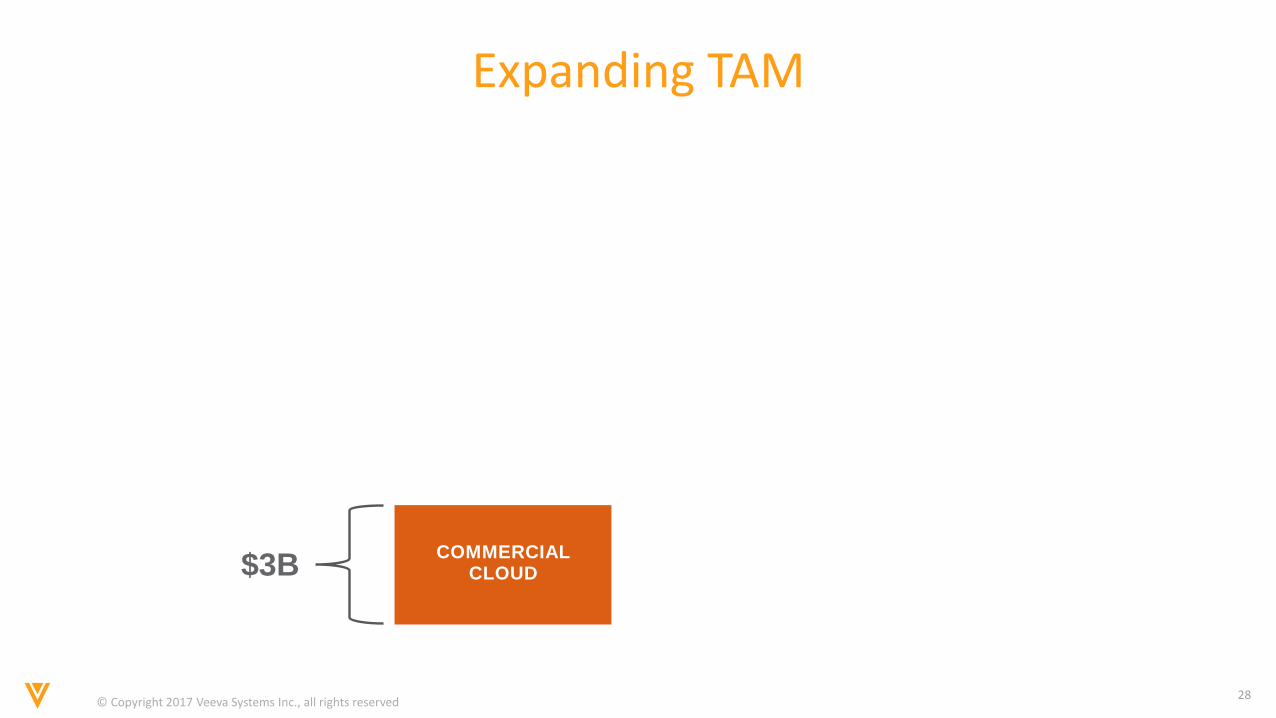
Expanding TAM
COMMERCIAL CLOUD$3B
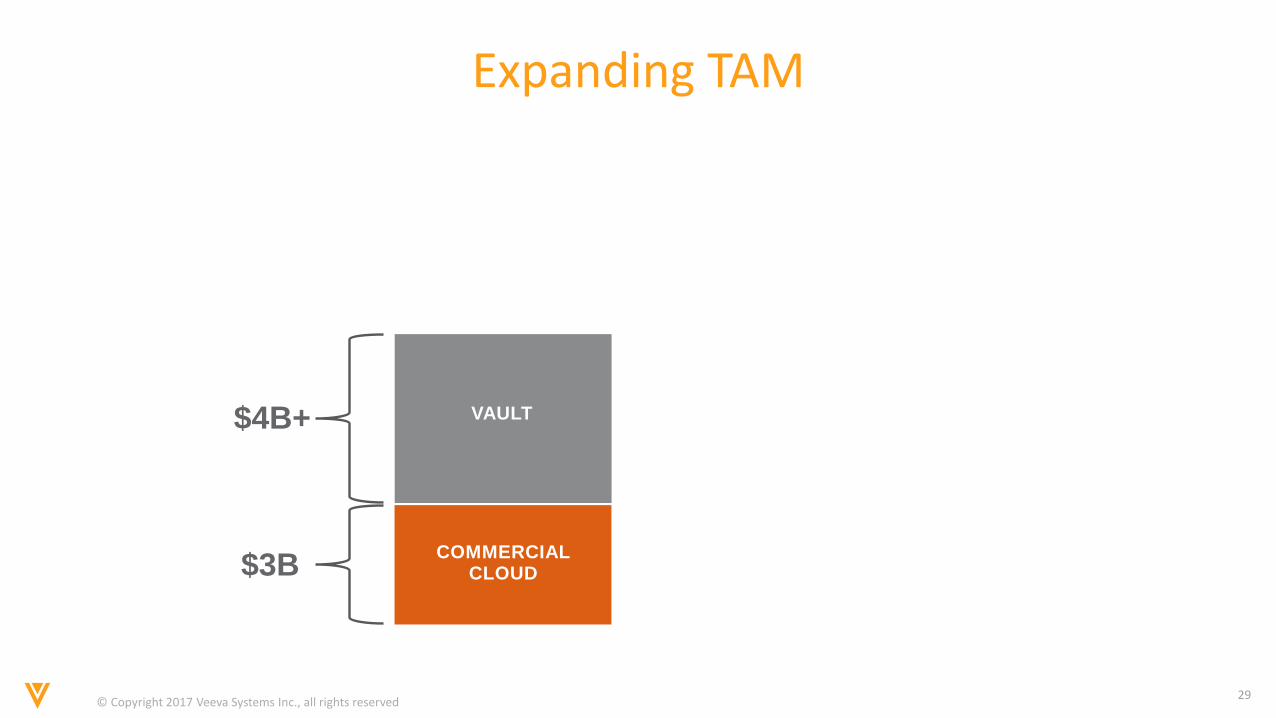
© Copyright 2017 Veeva Systems Inc., all rights reserved29
Expanding TAM
COMMERCIAL CLOUD$3B
VAULT$4B+
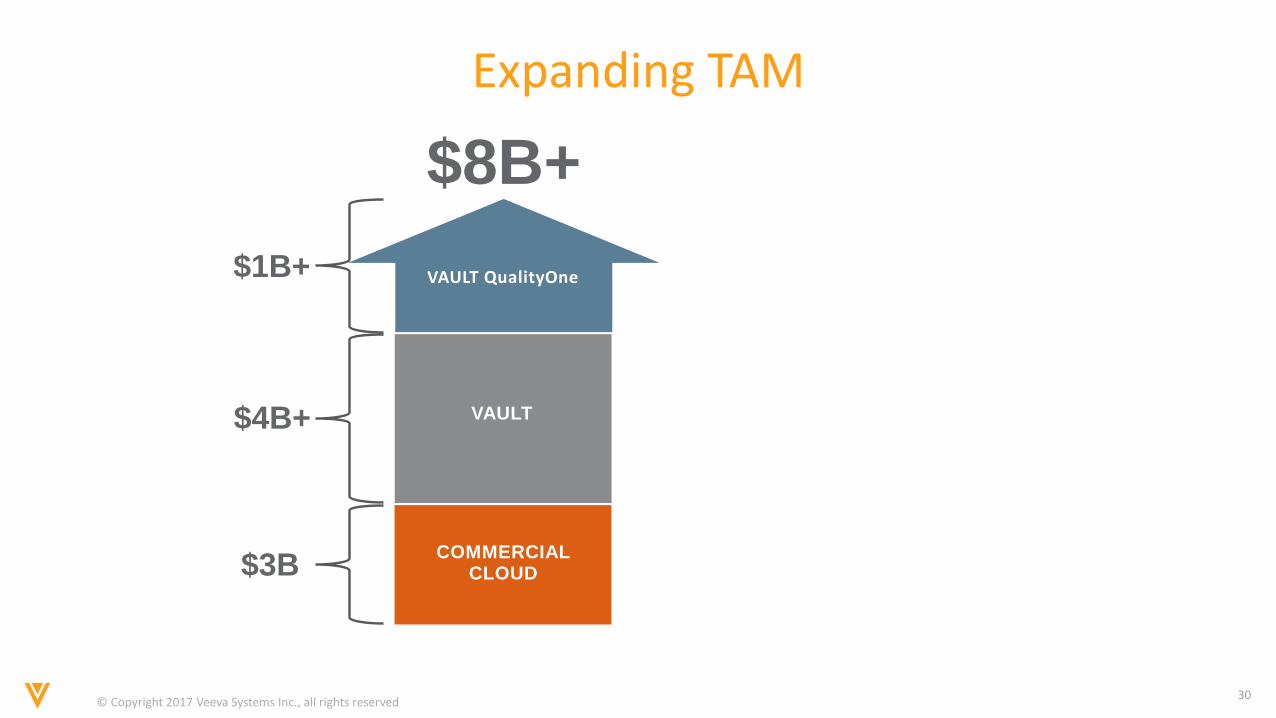
© Copyright 2017 Veeva Systems Inc., all rights reserved30
Expanding TAM
COMMERCIAL CLOUD$3B
$8B+
VAULT$4B+
$1B+ VAULT QualityOne
© Copyright 2017 Veeva Systems Inc., all rights reserved31
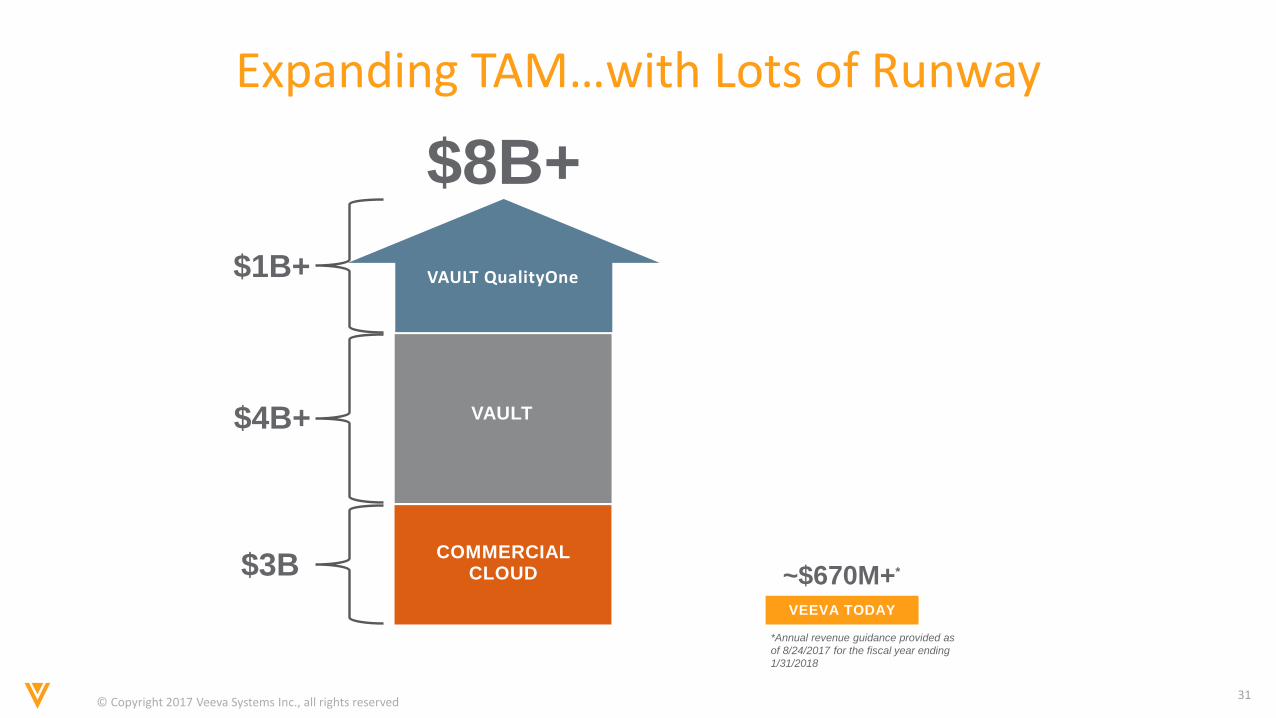
Expanding TAM…with Lots of Runway
COMMERCIAL CLOUD$3B
$8B+
VEEVA TODAY
~$670M+*
*Annual revenue guidance provided as
of 8/24/2017 for the fiscal year ending
1/31/2018
VAULT$4B+
$1B+ VAULT QualityOne
© Copyright 2017 Veeva Systems Inc., all rights reserved32
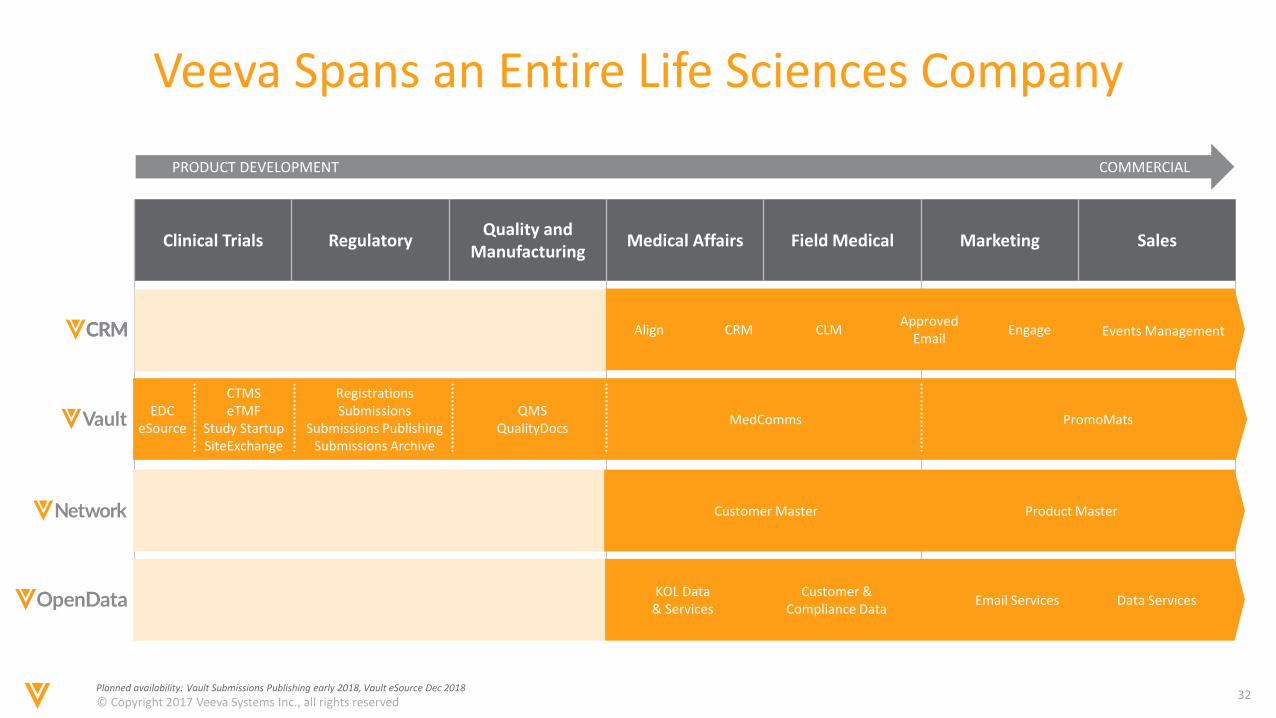
Veeva Spans an Entire Life Sciences Company
COMMERCIALPRODUCT DEVELOPMENT
Clinical Trials RegulatoryQuality and
ManufacturingMedical Affairs Field Medical Marketing Sales
Customer Master Product Master
KOL Data & Services
Data ServicesEmail ServicesCustomer &
Compliance Data
QMSQualityDocs
MedComms PromoMats
RegistrationsSubmissions
Submissions PublishingSubmissions Archive
CTMSeTMF
Study StartupSiteExchange
EDCeSource
ApprovedEmail
CLMCRM EngageAlign Events Management
Planned availability: Vault Submissions Publishing early 2018, Vault eSource Dec 2018
© Copyright 2017 Veeva Systems Inc., all rights reserved33
UNIFIED
BEST-OF-BREED&
© Copyright 2017 Veeva Systems Inc., all rights reserved34
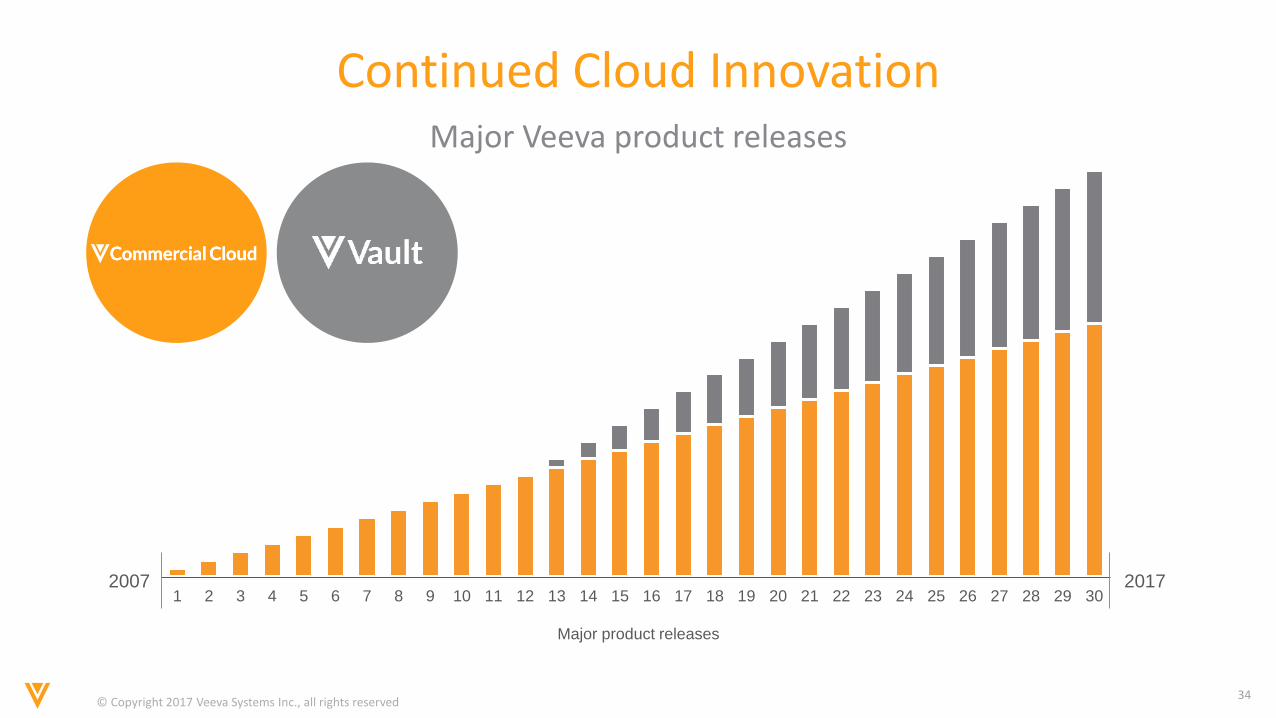
Continued Cloud InnovationMajor Veeva product releases
1 2 3 4 5 6 7 8 9 10 11 12 13 14 15 16 17 18 19 20 21 22 23 24 25 26 27 28 29 302007 2017
Major product releases
© Copyright 2017 Veeva Systems Inc., all rights reserved35
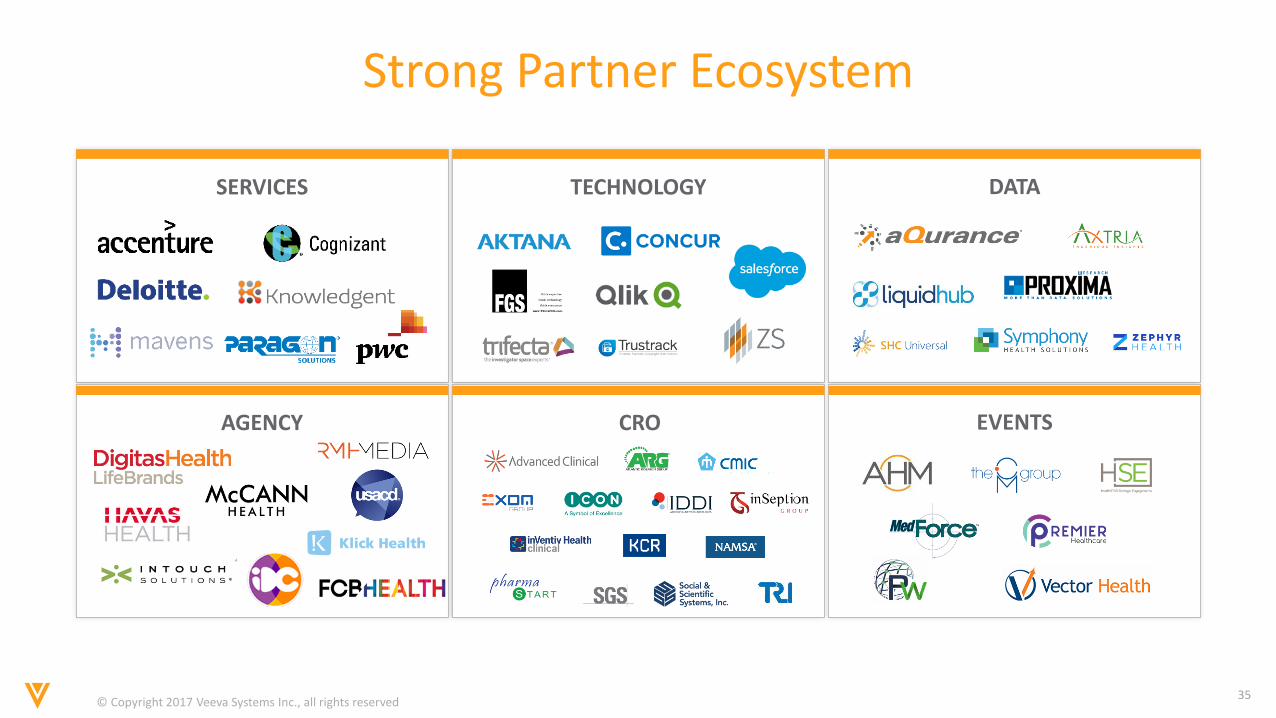
Strong Partner Ecosystem
SERVICES TECHNOLOGY DATA
AGENCY CRO EVENTS
© Copyright 2017 Veeva Systems Inc., all rights reserved36
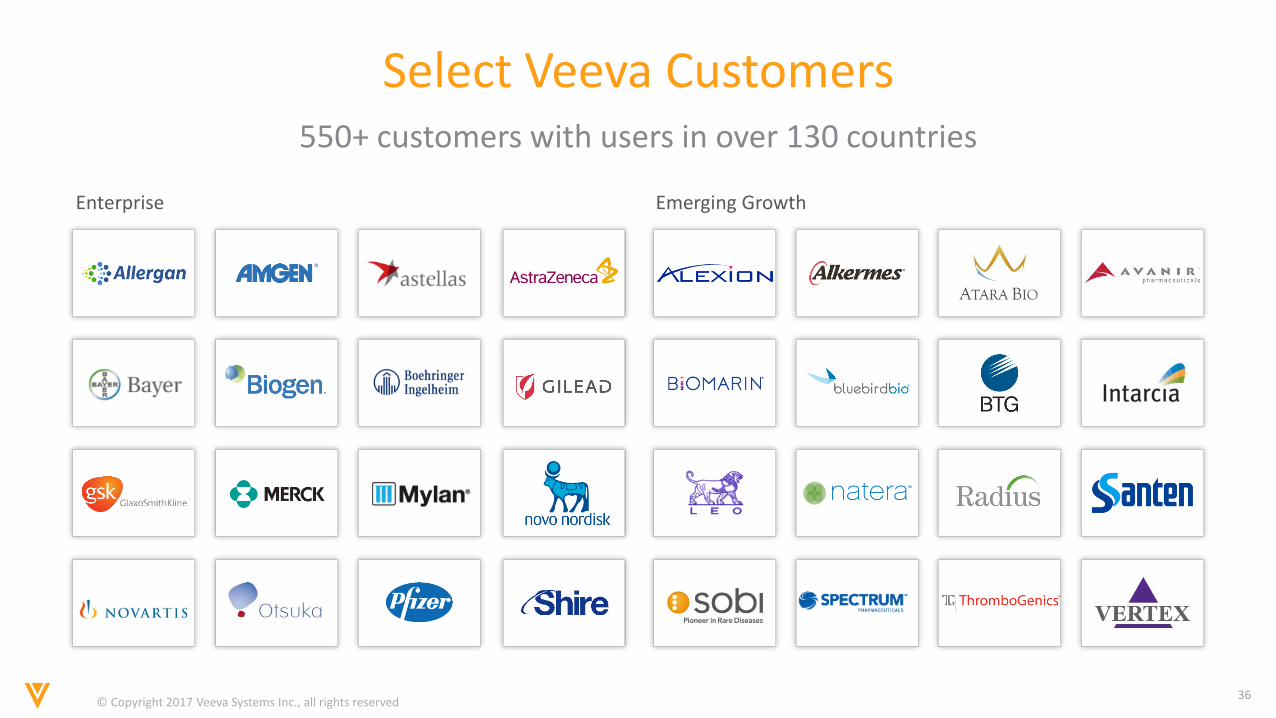
Select Veeva Customers550+ customers with users in over 130 countries
Enterprise Emerging Growth

© Copyright 2017 Veeva Systems Inc., all rights reserved37
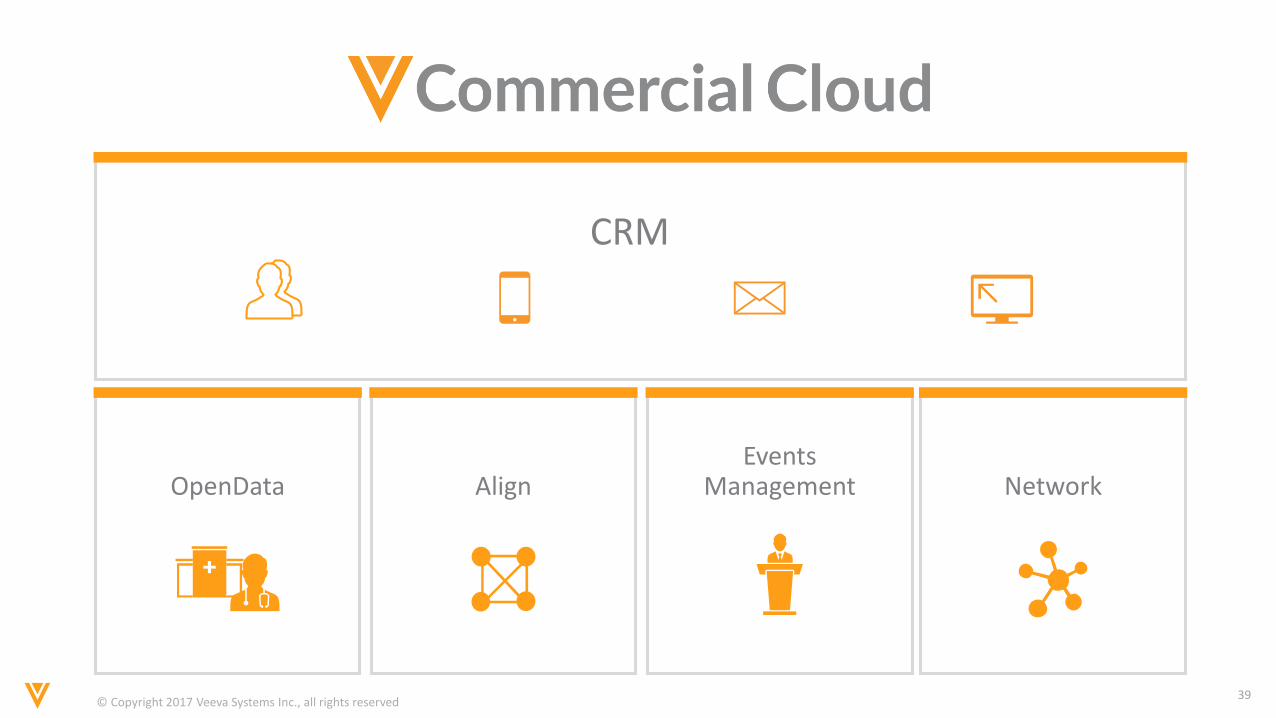
Commercial Cloud
© Copyright 2017 Veeva Systems Inc., all rights reserved38
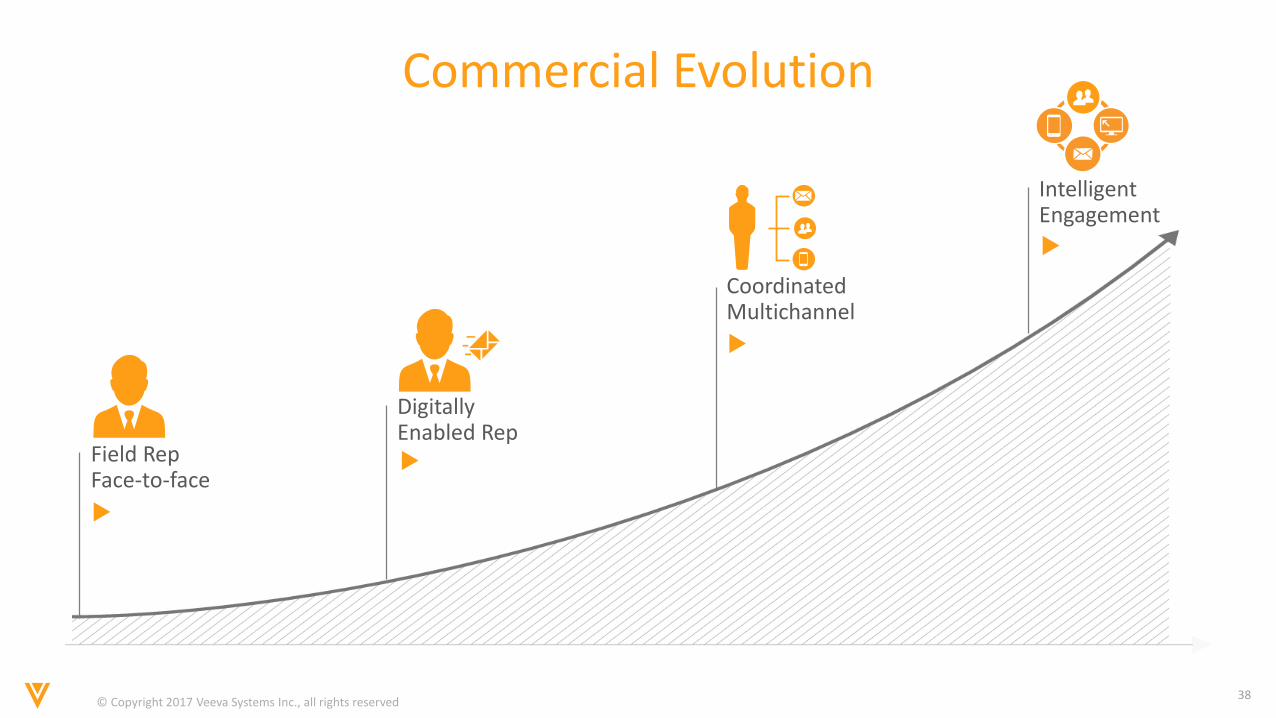
Commercial Evolution
Field RepFace-to-face
Digitally Enabled Rep
Intelligent Engagement
Coordinated Multichannel
© Copyright 2017 Veeva Systems Inc., all rights reserved39
OpenData AlignEvents
Management Network
CRM
© Copyright 2017 Veeva Systems Inc., all rights reserved40
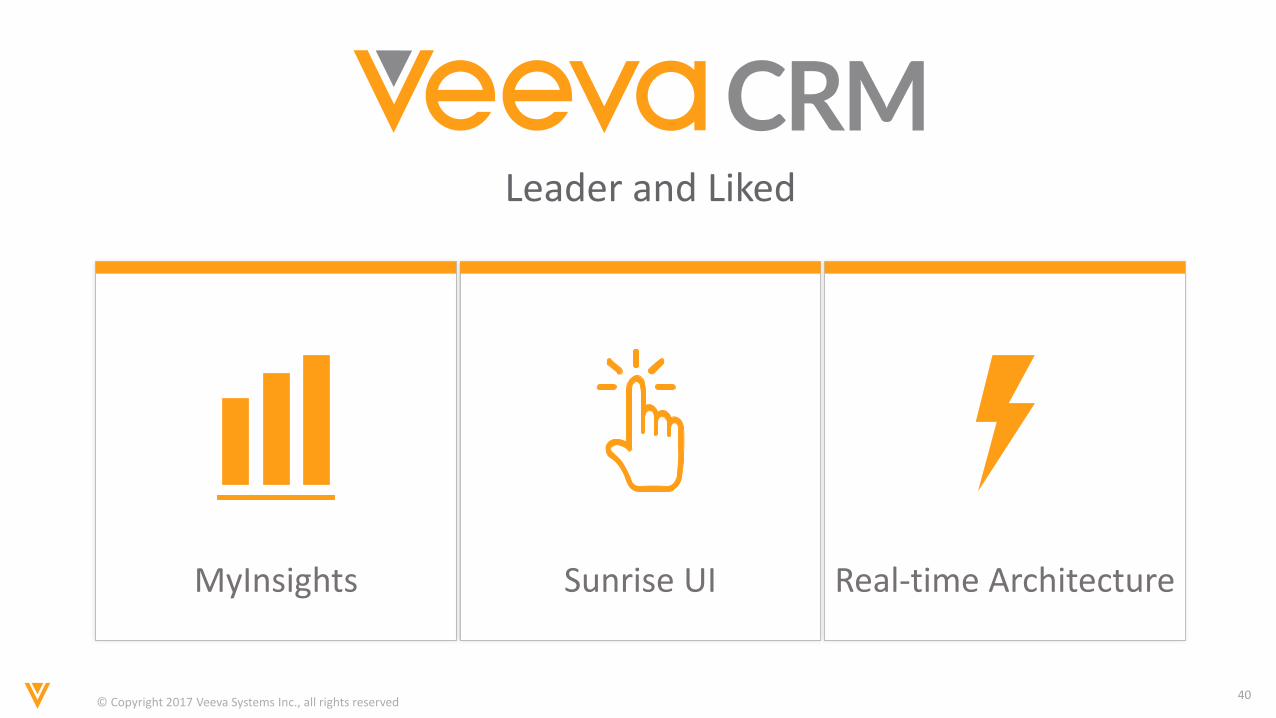
MyInsights Sunrise UI Real-time Architecture
Leader and Liked
© Copyright 2017 Veeva Systems Inc., all rights reserved41
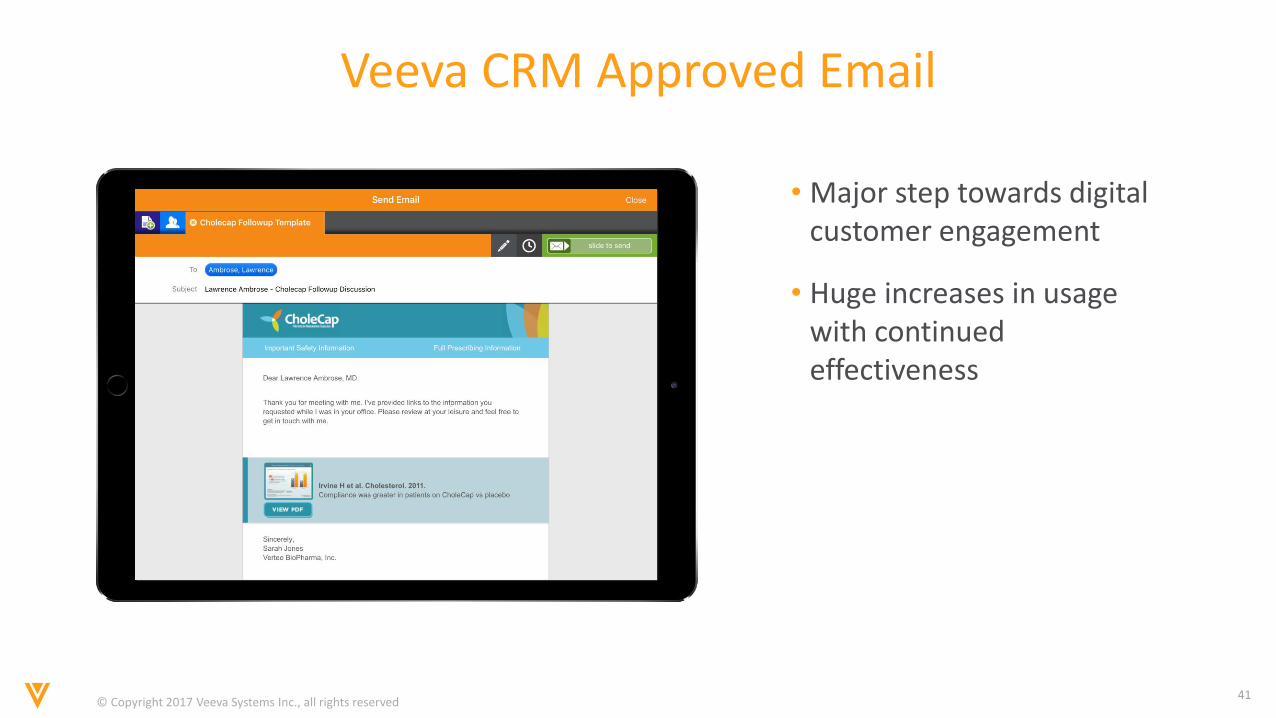
Veeva CRM Approved Email
• Major step towards digital customer engagement
• Huge increases in usage with continued effectiveness
© Copyright 2017 Veeva Systems Inc., all rights reserved42
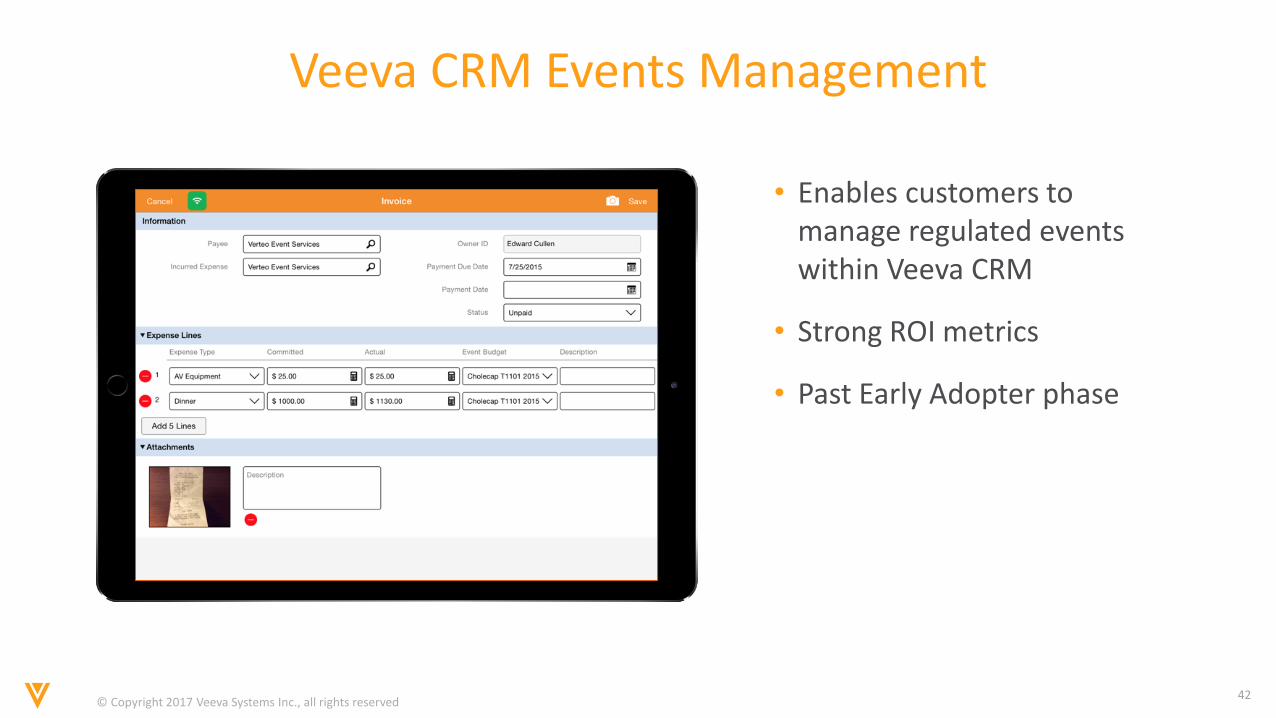
Veeva CRM Events Management
• Enables customers to manage regulated events within Veeva CRM
• Strong ROI metrics
• Past Early Adopter phase
© Copyright 2017 Veeva Systems Inc., all rights reserved43
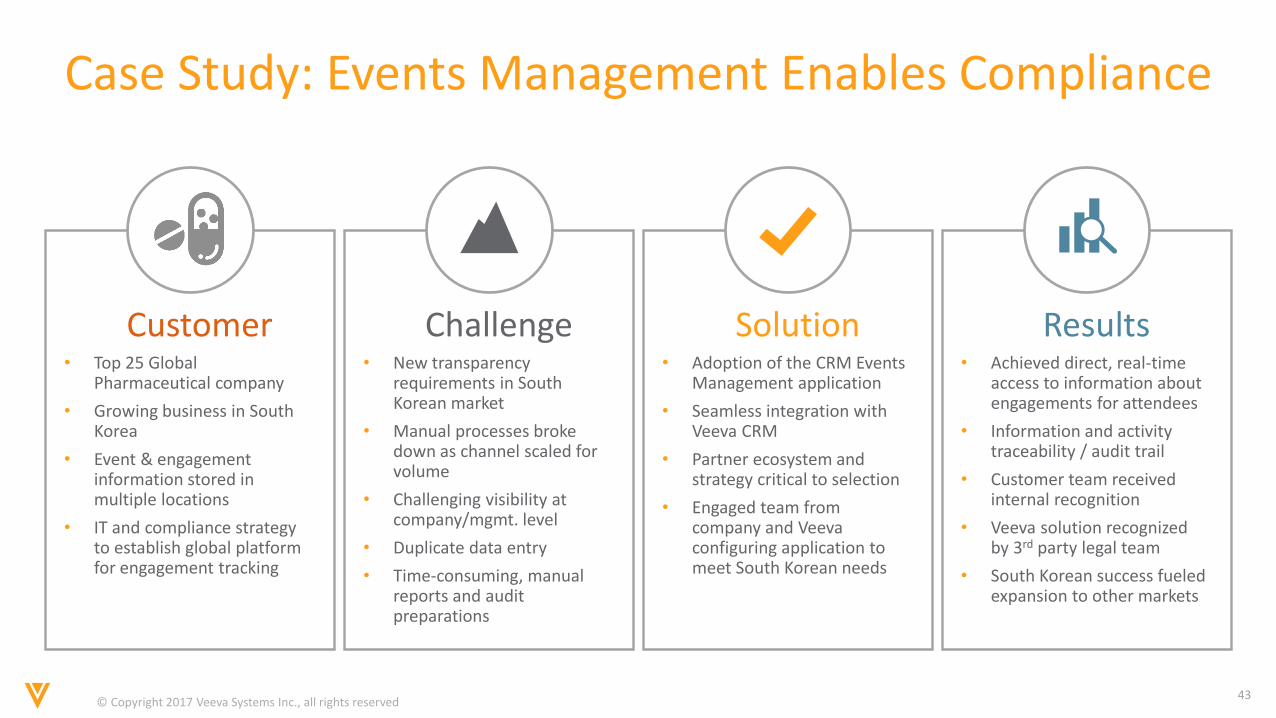
Case Study: Events Management Enables Compliance
Solution
Customer• Top 25 Global
Pharmaceutical company
• Growing business in South Korea
• Event & engagementinformation stored in multiple locations
• IT and compliance strategyto establish global platform for engagement tracking
Challenge• New transparency
requirements in South Korean market
• Manual processes broke down as channel scaled for volume
• Challenging visibility at company/mgmt. level
• Duplicate data entry
• Time-consuming, manual reports and audit preparations
Solution• Adoption of the CRM Events
Management application
• Seamless integration with Veeva CRM
• Partner ecosystem and strategy critical to selection
• Engaged team from company and Veeva configuring application to meet South Korean needs
Results• Achieved direct, real-time
access to information about engagements for attendees
• Information and activity traceability / audit trail
• Customer team received internal recognition
• Veeva solution recognized by 3rd party legal team
• South Korean success fueled expansion to other markets
© Copyright 2017 Veeva Systems Inc., all rights reserved44
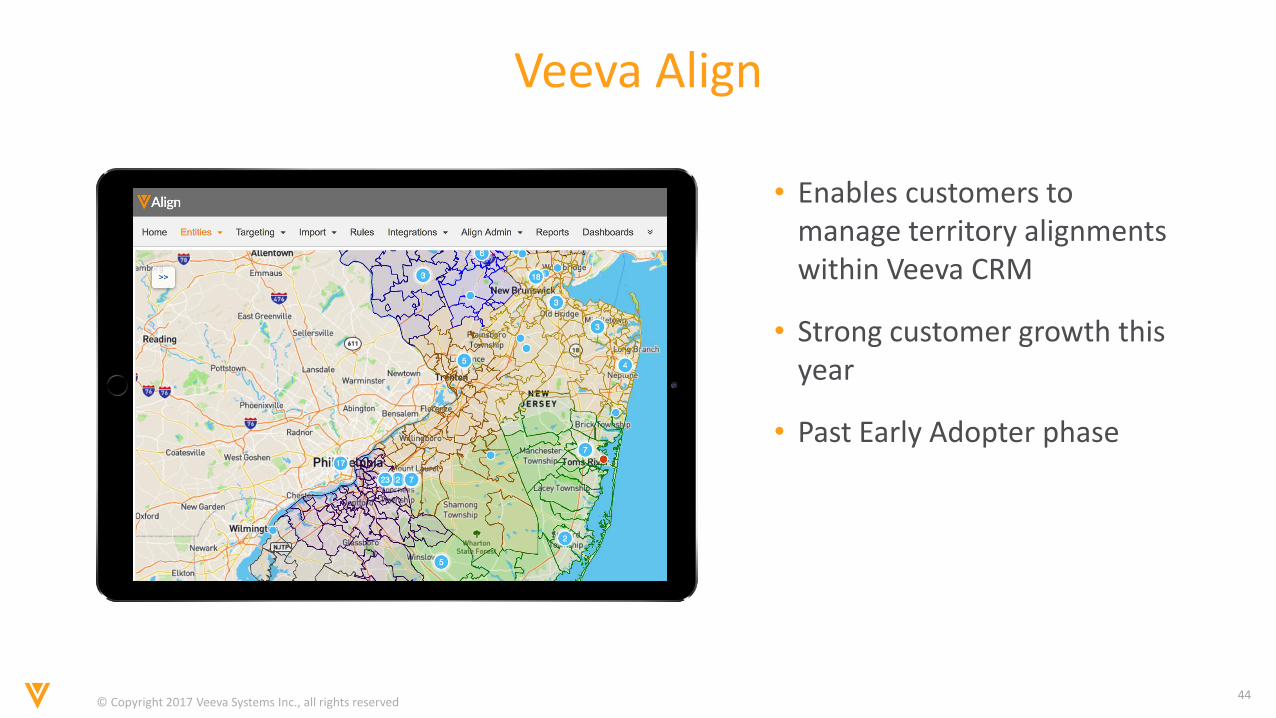
Veeva Align
• Enables customers to manage territory alignments within Veeva CRM
• Strong customer growth this year
• Past Early Adopter phase
© Copyright 2017 Veeva Systems Inc., all rights reserved45
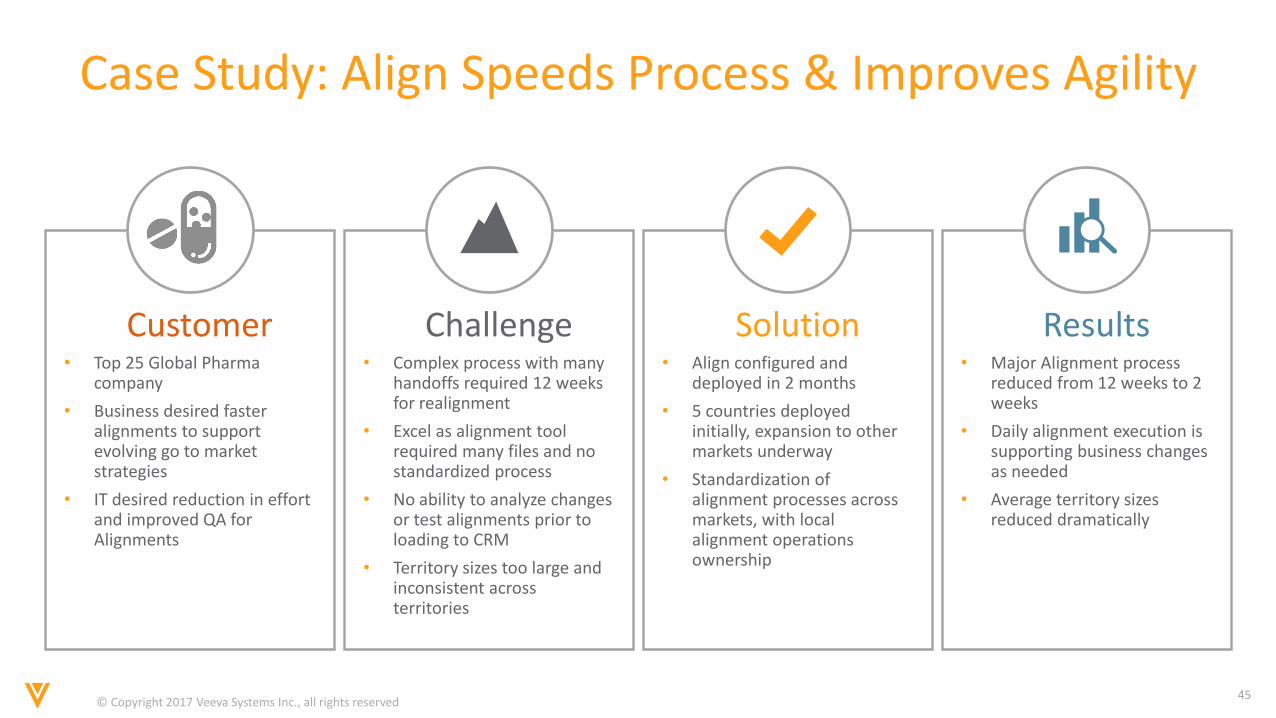
Case Study: Align Speeds Process & Improves Agility
Solution
Customer• Top 25 Global Pharma
company
• Business desired fasteralignments to support evolving go to market strategies
• IT desired reduction in effort and improved QA for Alignments
Challenge• Complex process with many
handoffs required 12 weeks for realignment
• Excel as alignment tool required many files and no standardized process
• No ability to analyze changes or test alignments prior to loading to CRM
• Territory sizes too large and inconsistent across territories
Solution• Align configured and
deployed in 2 months
• 5 countries deployed initially, expansion to other markets underway
• Standardization of alignment processes across markets, with local alignment operations ownership
Results• Major Alignment process
reduced from 12 weeks to 2 weeks
• Daily alignment execution is supporting business changes as needed
• Average territory sizes reduced dramatically
© Copyright 2017 Veeva Systems Inc., all rights reserved46
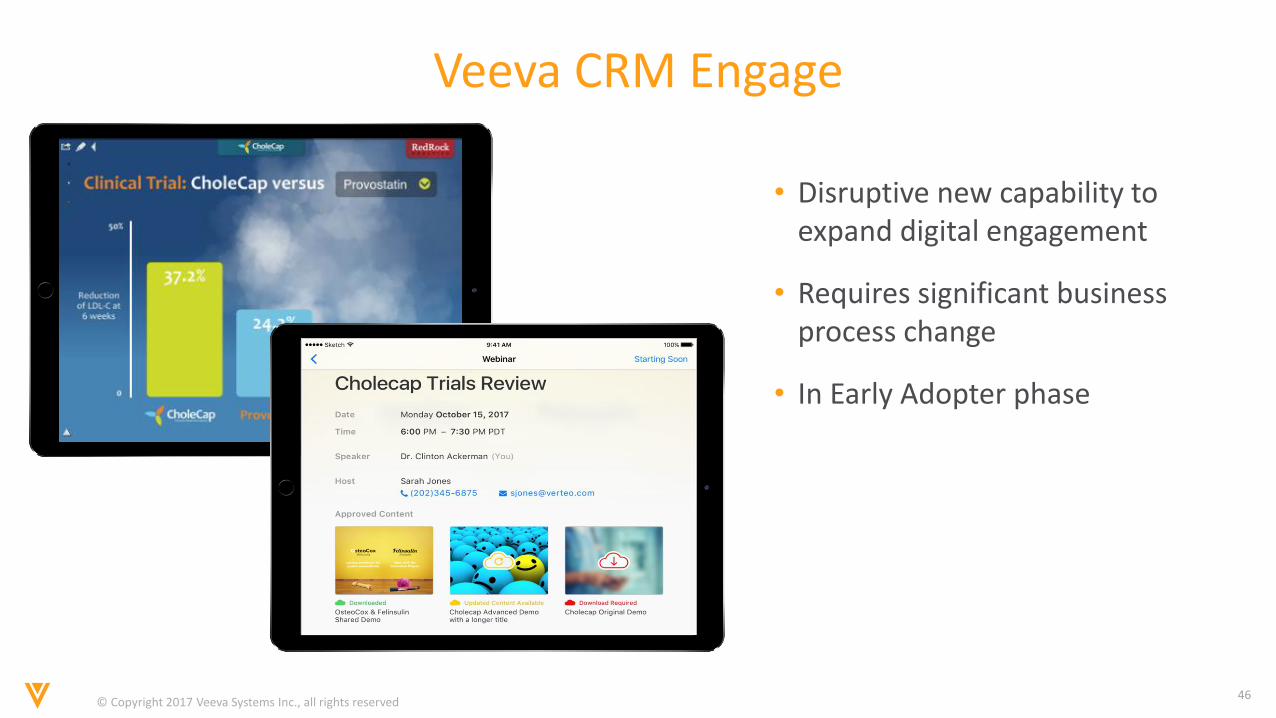
Veeva CRM Engage
• Disruptive new capability to expand digital engagement
• Requires significant business process change
• In Early Adopter phase
© Copyright 2017 Veeva Systems Inc., all rights reserved47
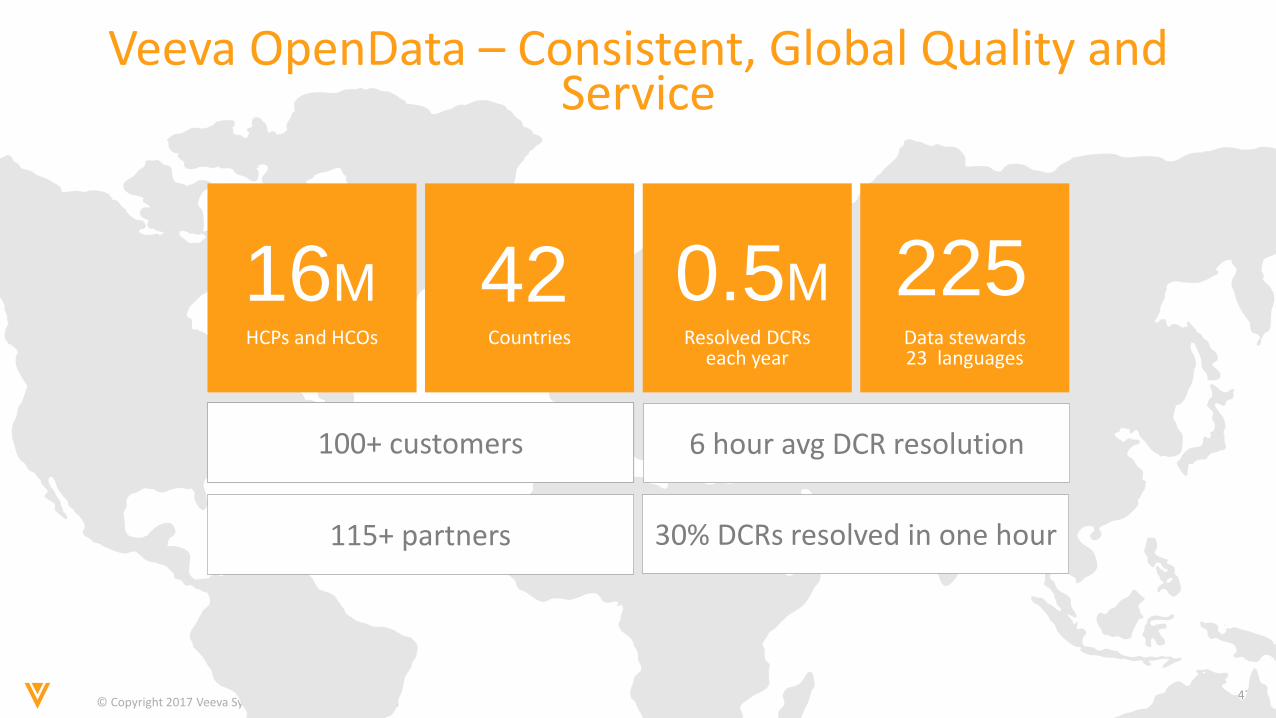
Veeva OpenData – Consistent, Global Quality and Service
HCPs and HCOs Countries Resolved DCRseach year
Data stewards23 languages
60+ US CUSTOMERS 86
30+ 50+35
100+ customers 6 hour avg DCR resolution
30% DCRs resolved in one hour115+ partners
16M 0.5M42 225
© Copyright 2017 Veeva Systems Inc., all rights reserved48
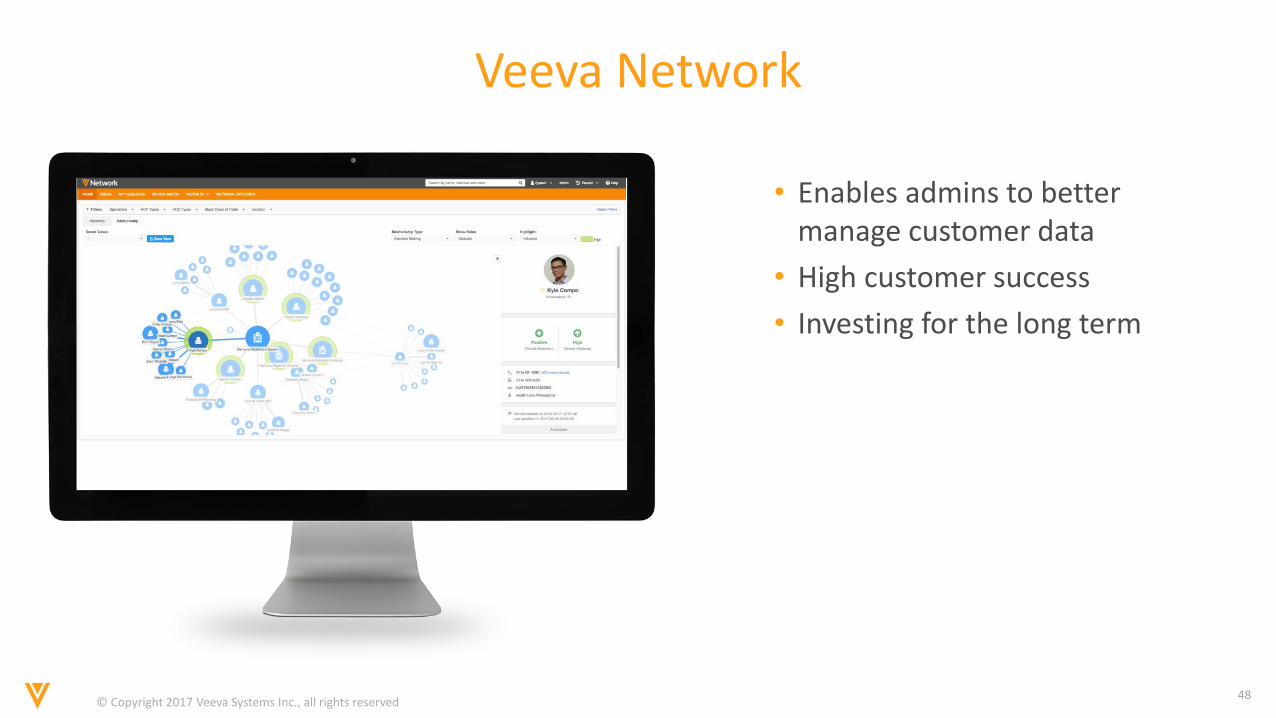
Veeva Network
• Enables admins to better manage customer data
• High customer success
• Investing for the long term
© Copyright 2017 Veeva Systems Inc., all rights reserved49
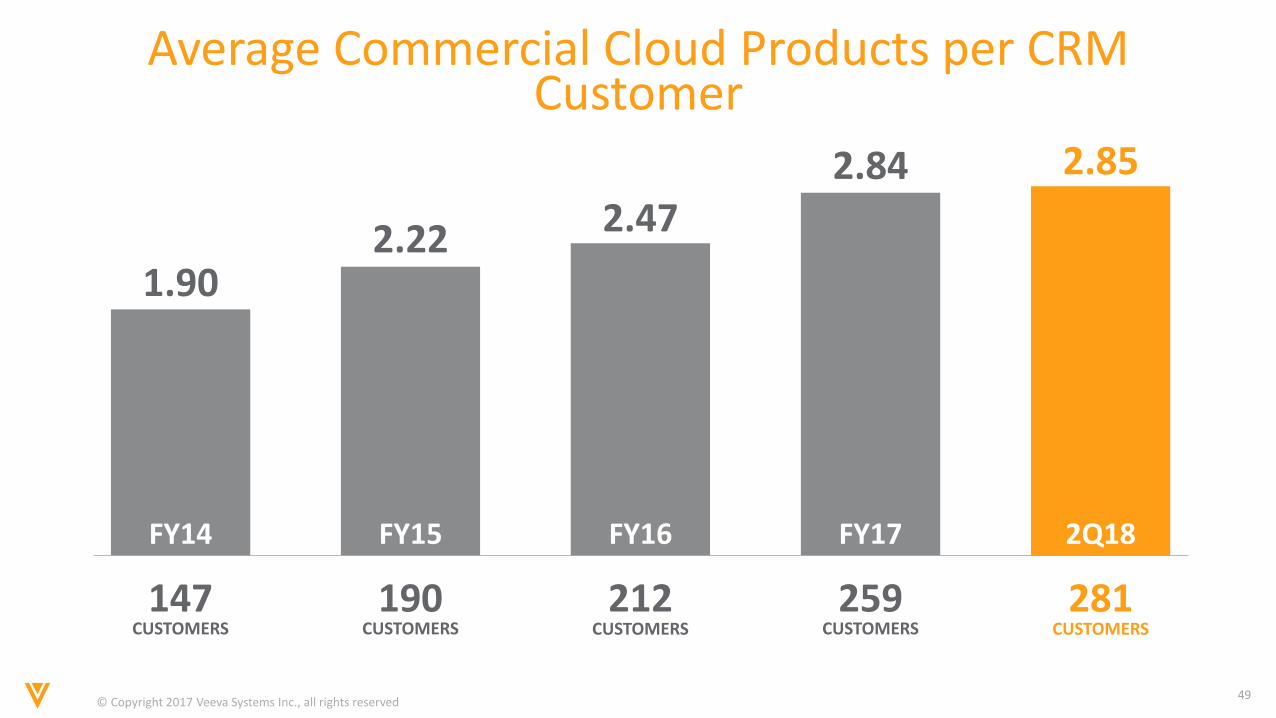
Average Commercial Cloud Products per CRM Customer
1.90
147
2.22
CUSTOMERS190 212 281
2.47
2.85
CUSTOMERS CUSTOMERS CUSTOMERS259
2.84
CUSTOMERS
FY14 FY15 FY16 2Q18FY17
© Align Biopharma 2017. All rights reserved
Align Biopharma Mission
Setting technology standards to make it easier
for the life sciences industry to work with its
customers
© Align Biopharma 2017. All rights reserved
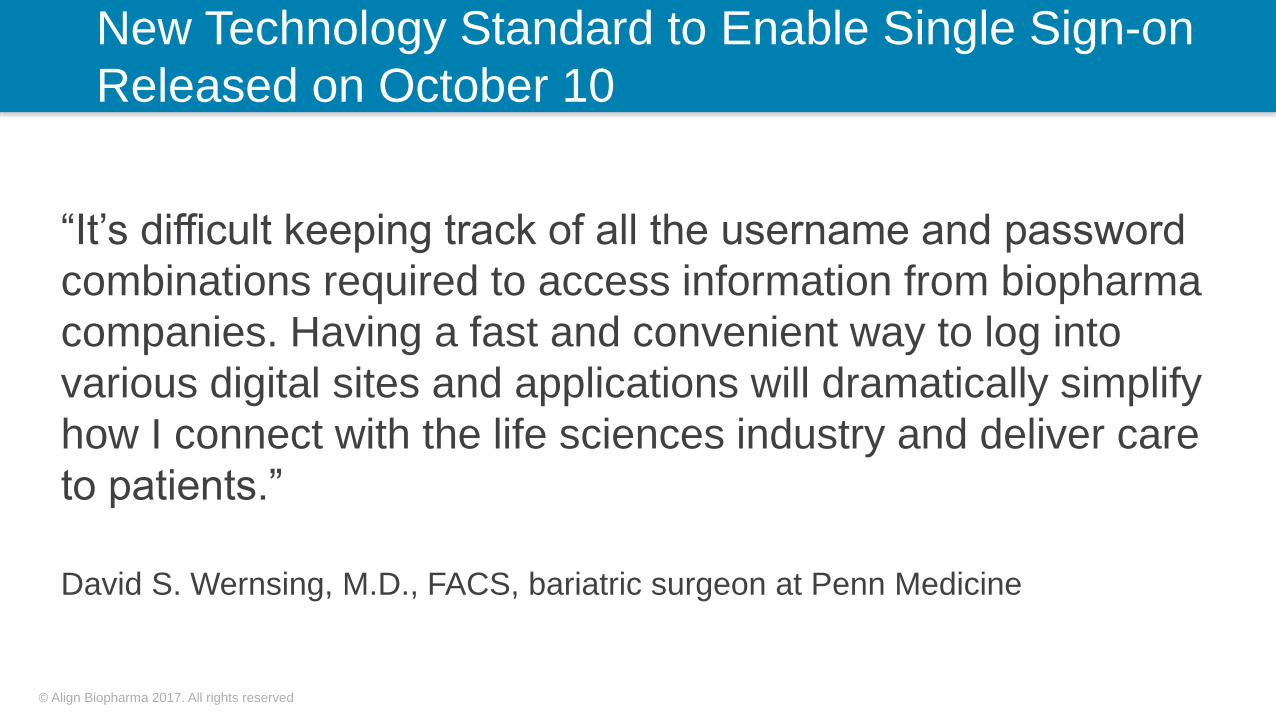
New Technology Standard to Enable Single Sign-on
Released on October 10
“It’s difficult keeping track of all the username and password
combinations required to access information from biopharma
companies. Having a fast and convenient way to log into
various digital sites and applications will dramatically simplify
how I connect with the life sciences industry and deliver care
to patients.”
David S. Wernsing, M.D., FACS, bariatric surgeon at Penn Medicine
© Align Biopharma 2017. All rights reserved

© Copyright 2017 Veeva Systems Inc., all rights reserved54
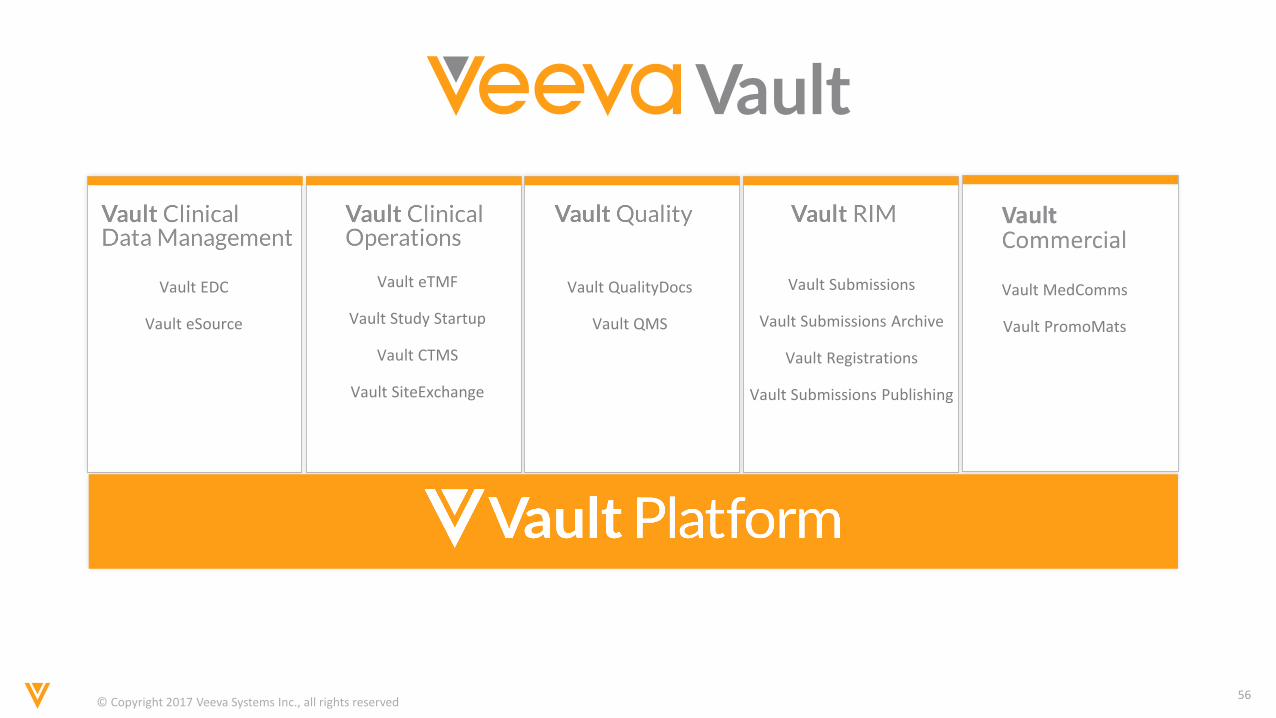
Veeva Vault
© Copyright 2017 Veeva Systems Inc., all rights reserved55
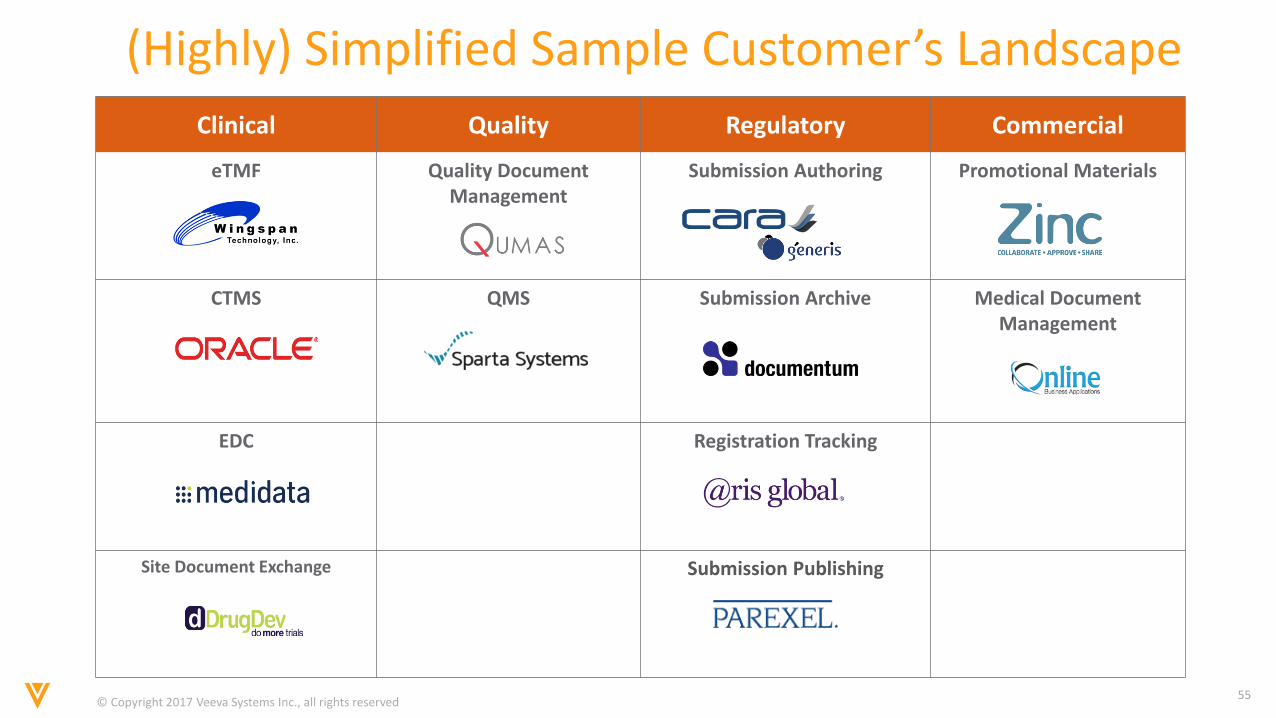
(Highly) Simplified Sample Customer’s Landscape
Clinical Quality Regulatory Commercial
eTMF Quality Document Management
Submission Authoring Promotional Materials
CTMS QMS Submission Archive Medical Document Management
EDC Registration Tracking
Site Document Exchange Submission Publishing
© Copyright 2017 Veeva Systems Inc., all rights reserved56
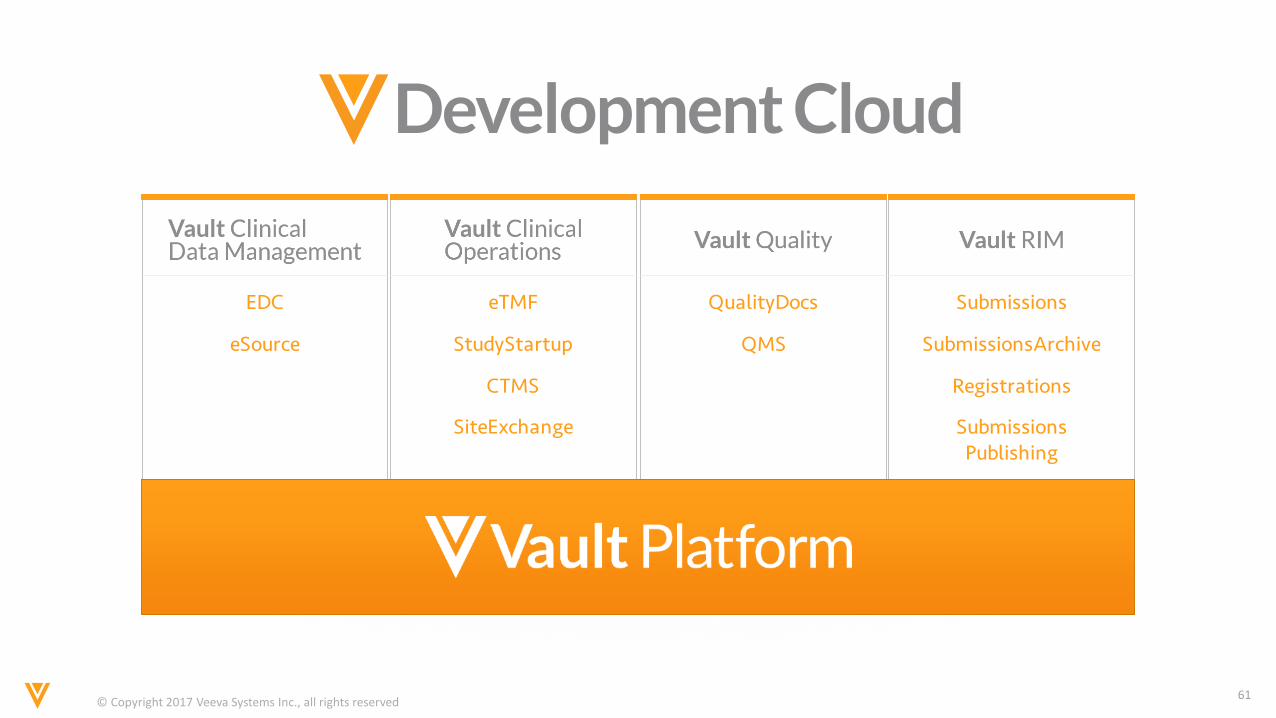
Vault EDC
Vault eSource
Vault eTMF
Vault Study Startup
Vault CTMS
Vault SiteExchange
Vault QualityDocs
Vault QMS
Vault Submissions
Vault Submissions Archive
Vault Registrations
Vault Submissions Publishing
Vault MedComms
Vault PromoMats
© Copyright 2017 Veeva Systems Inc., all rights reserved57
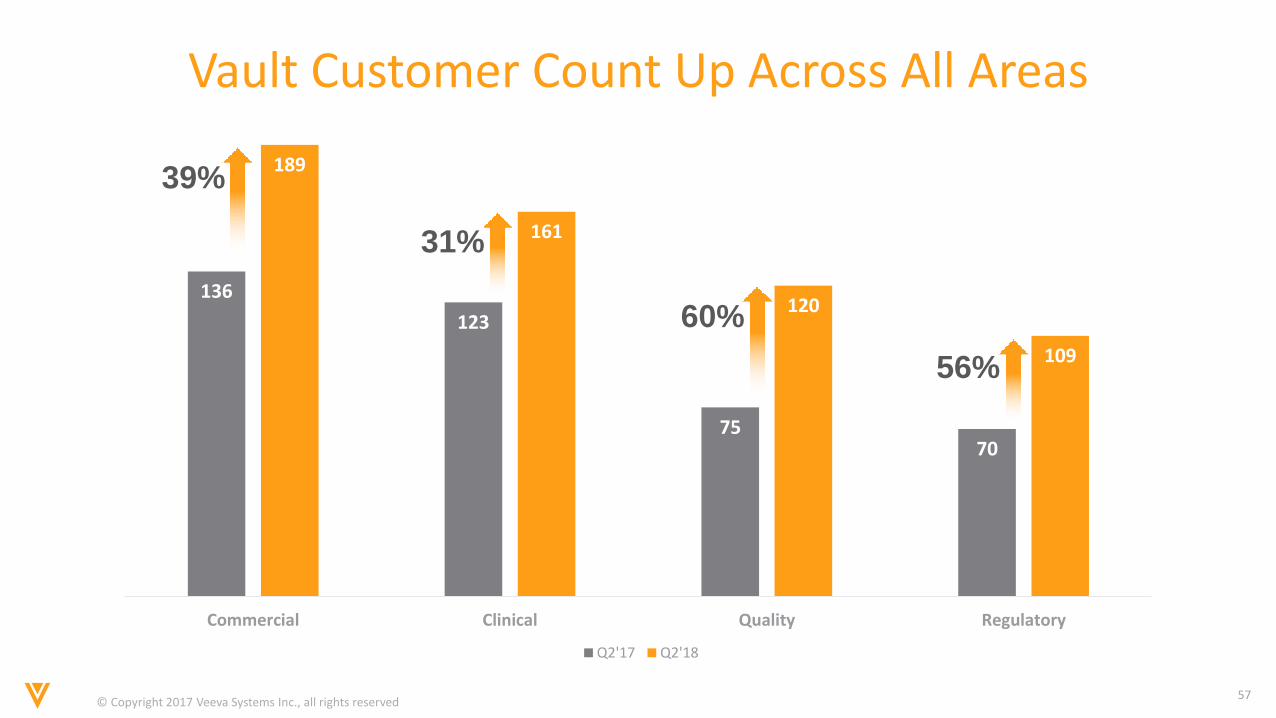
Vault Customer Count Up Across All Areas
136
123
7570
189
161
120
109
Commercial Clinical Quality Regulatory
Q2'17 Q2'18
31%
60%
39%
56%
© Copyright 2017 Veeva Systems Inc., all rights reserved58
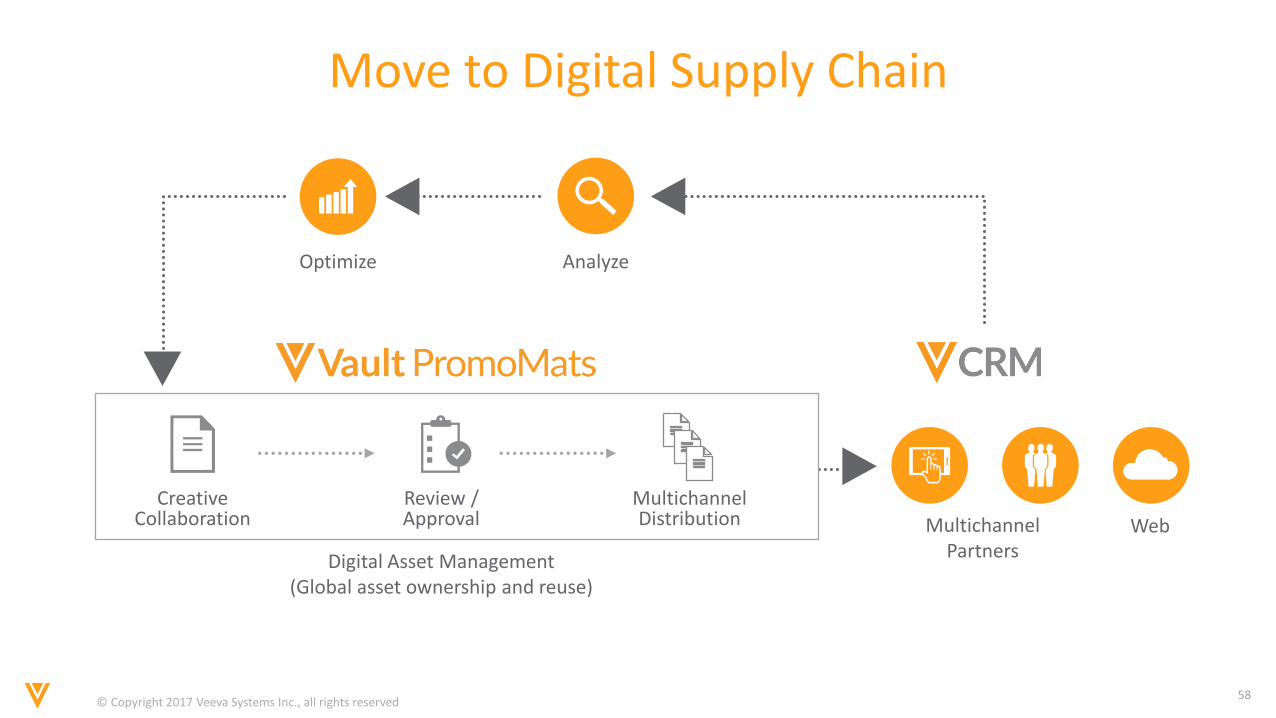
Move to Digital Supply Chain
Digital Asset Management(Global asset ownership and reuse)
Optimize Analyze
CreativeCollaboration
Review /Approval
MultichannelDistribution Multichannel
PartnersWeb
© Copyright 2017 Veeva Systems Inc., all rights reserved5959
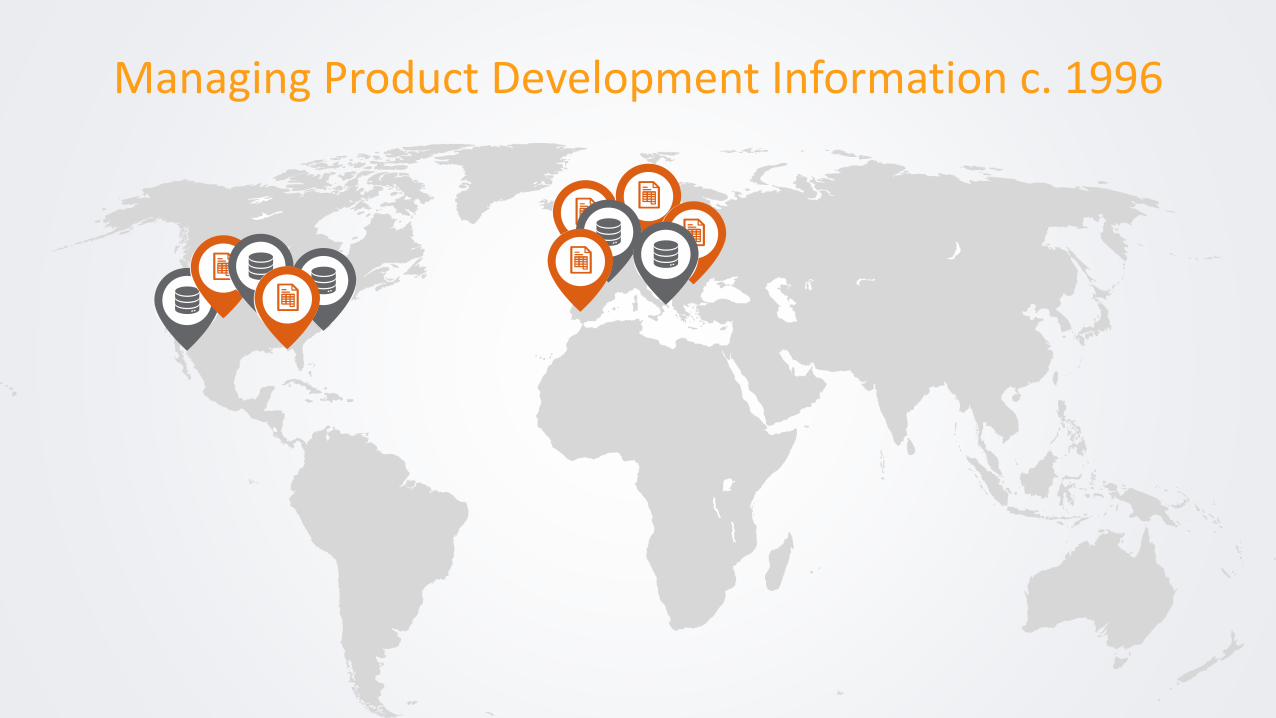
Managing Product Development Information c. 1996
© Copyright 2017 Veeva Systems Inc., all rights reserved6060
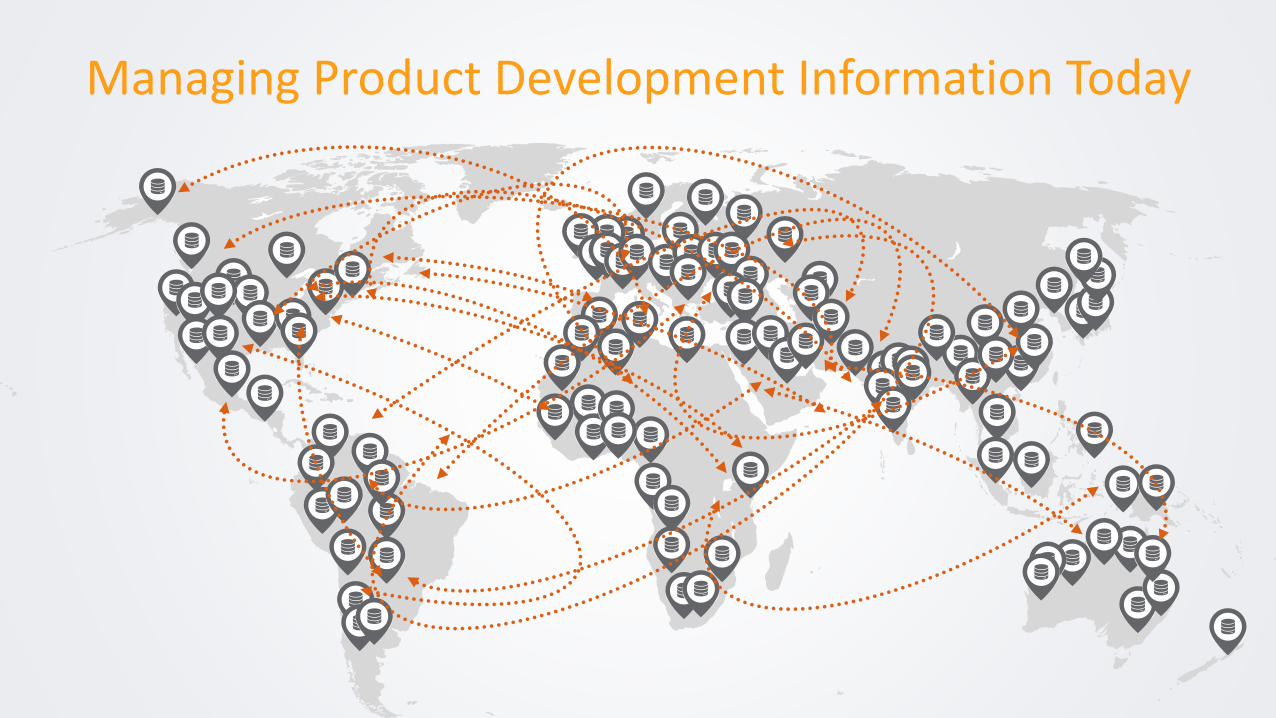
Managing Product Development Information Today
© Copyright 2017 Veeva Systems Inc., all rights reserved61
© Copyright 2017 Veeva Systems Inc., all rights reserved62
R&D Summit was Outstanding
© Copyright 2017 Veeva Systems Inc., all rights reserved63
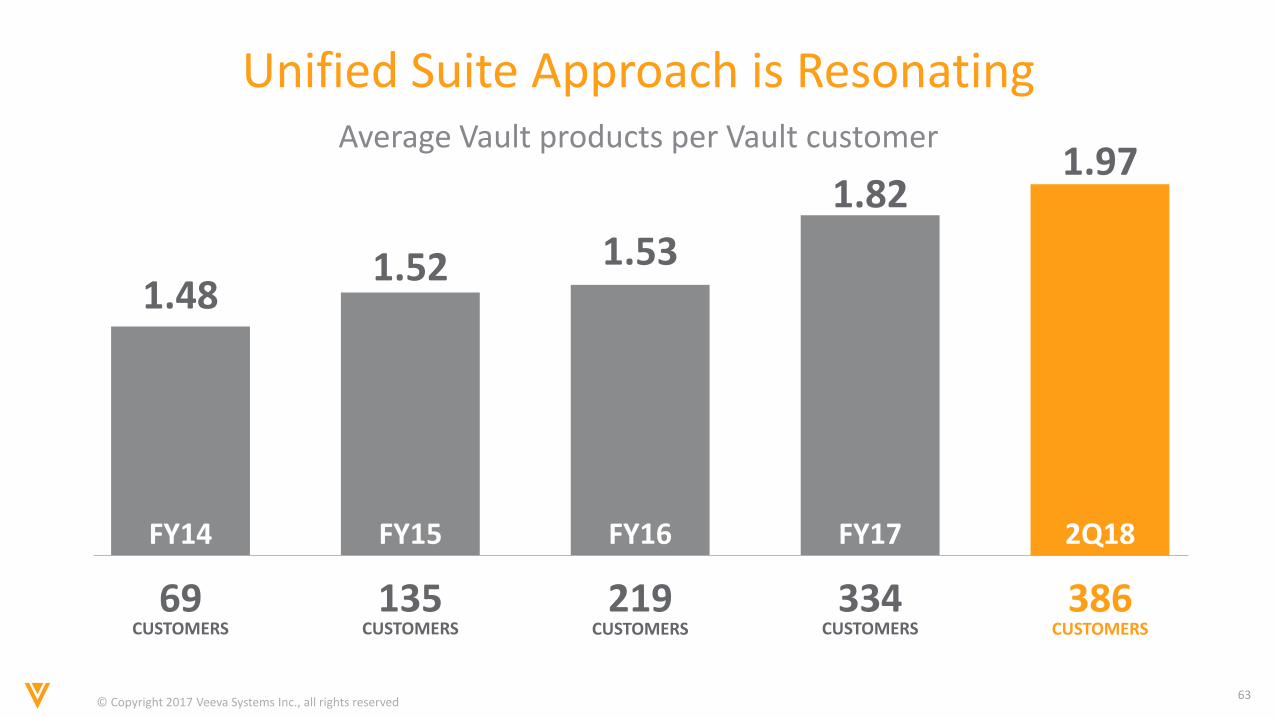
Unified Suite Approach is ResonatingAverage Vault products per Vault customer
1.481.52 1.53
1.971.82
69CUSTOMERS
135 219 386CUSTOMERS CUSTOMERS CUSTOMERS
334CUSTOMERS
FY14 FY15 FY16 2Q18FY17
© Copyright 2017 Veeva Systems Inc., all rights reserved64
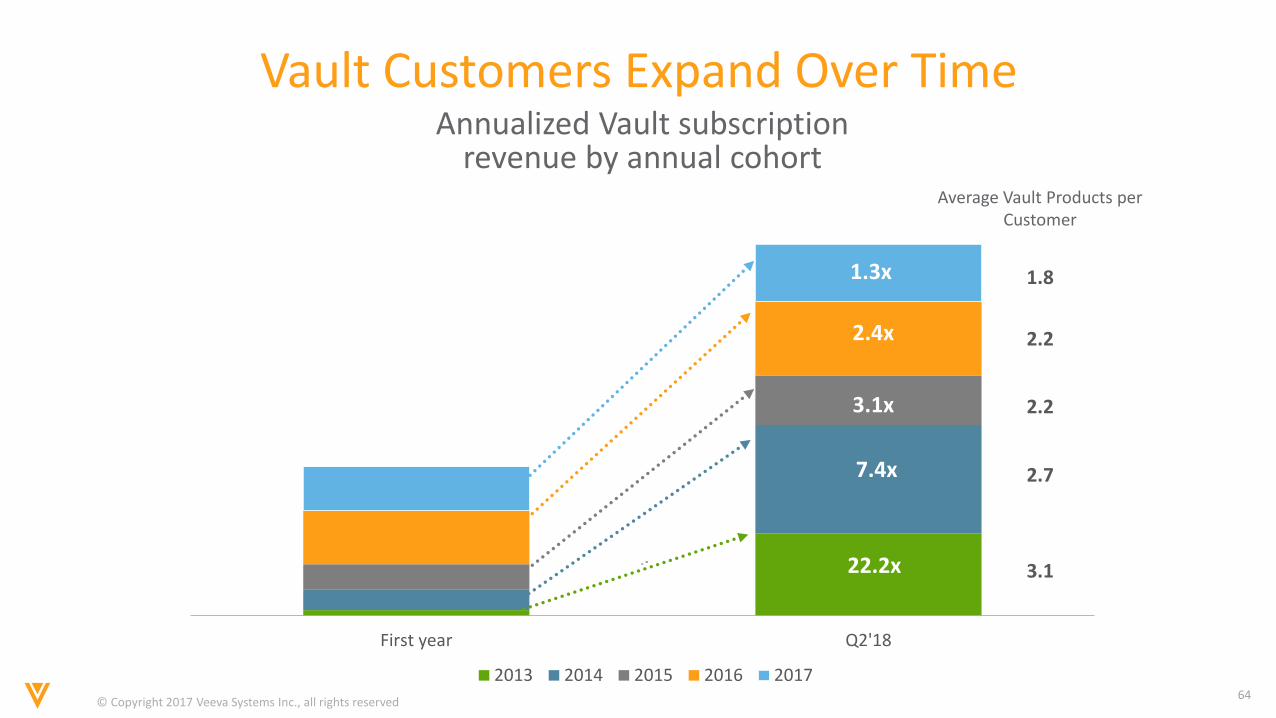
First year Q2'18
Annualized Vault subscriptionrevenue by annual cohort
2013 2014 2015 2016 2017
2.4x
7.4x
22.2x
3.1x
1.3x
Vault Customers Expand Over Time
Average Vault Products per Customer
2.2
2.7
3.1
2.2
1.81.3x

© Copyright 2017 Veeva Systems Inc., all rights reserved65
Development Cloud Demo

© Copyright 2017 Veeva Systems Inc., all rights reserved66
Customer SuccessMichael Louie, Pharmaceutical Development & Manufacturing, Gilead
© Copyright 2017 Veeva Systems Inc., all rights reserved67
Unified ClinicalHenry Levy, Chief Strategy Officer
© Copyright 2017 Veeva Systems Inc., all rights reserved68
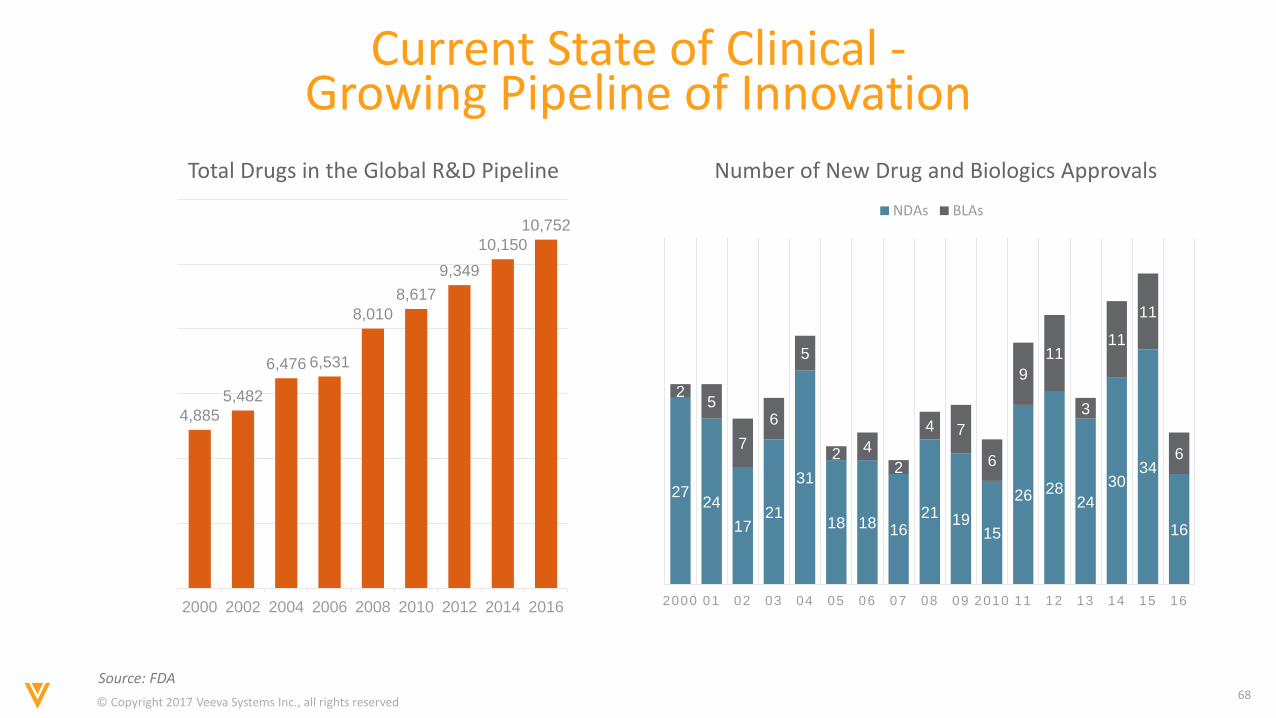
Current State of Clinical -Growing Pipeline of Innovation
4,885
5,482
6,476 6,531
8,010
8,617
9,349
10,150
10,752
2000 2002 2004 2006 2008 2010 2012 2014 2016
2724
1721
31
18 18 1621 19
15
26 2824
3034
16
25
7
6
5
2 4
2
4 7
6
9
11
3
11
11
6
2000 01 02 03 04 05 06 07 08 09 2010 11 12 13 14 15 16
NDAs BLAs
Total Drugs in the Global R&D Pipeline Number of New Drug and Biologics Approvals
Source: FDA
© Copyright 2017 Veeva Systems Inc., all rights reserved69
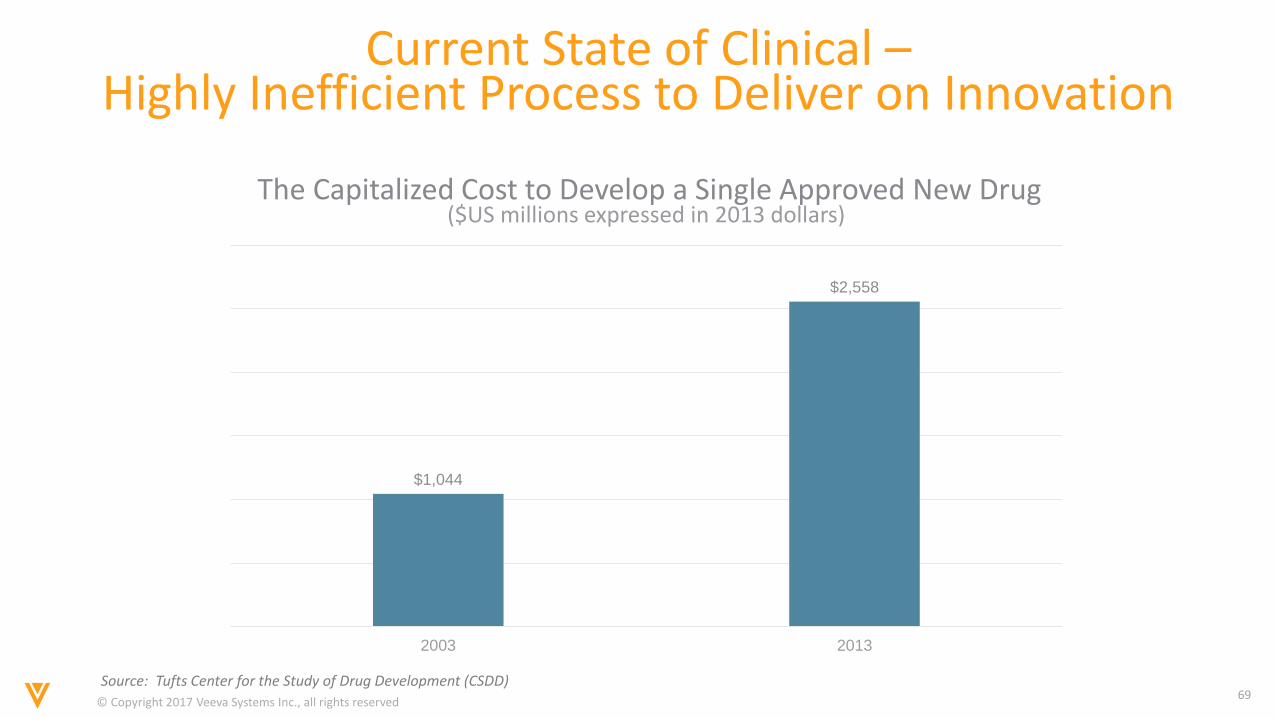
Current State of Clinical –Highly Inefficient Process to Deliver on Innovation
The Capitalized Cost to Develop a Single Approved New Drug
$1,044
$2,558
2003 2013
($US millions expressed in 2013 dollars)
Source: Tufts Center for the Study of Drug Development (CSDD)
© Copyright 2017 Veeva Systems Inc., all rights reserved70
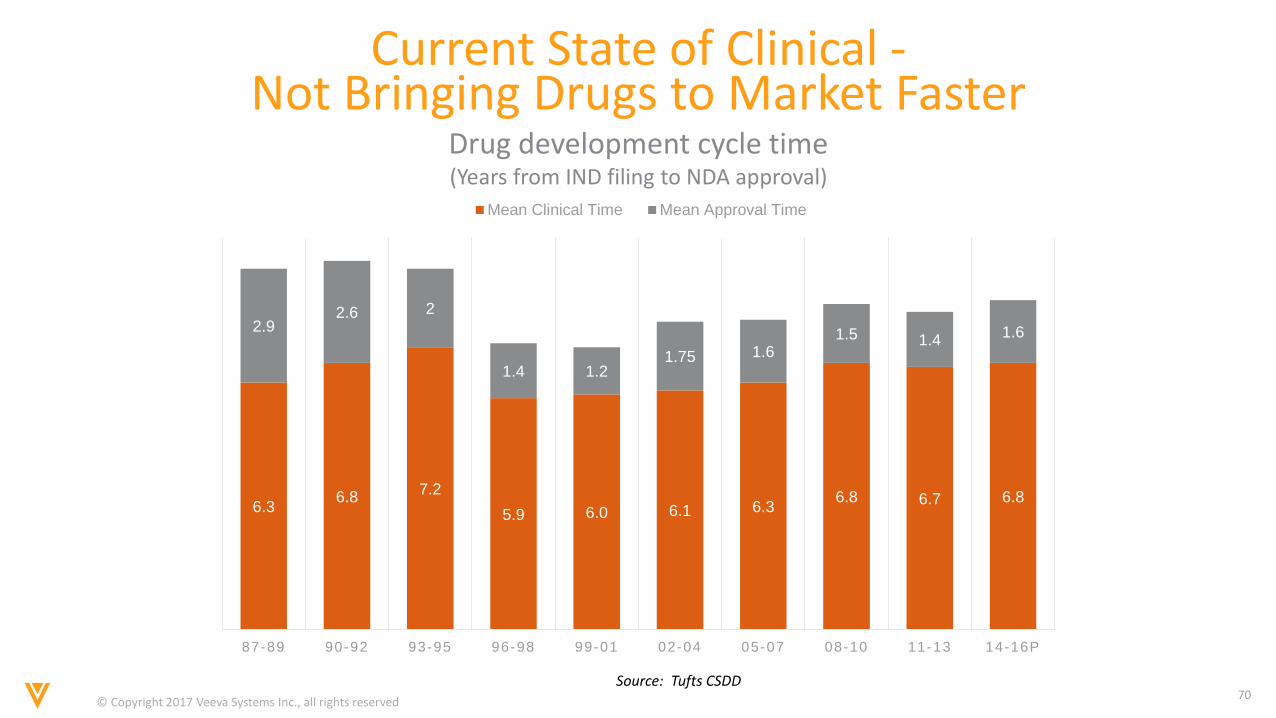
Current State of Clinical -Not Bringing Drugs to Market Faster
Drug development cycle time(Years from IND filing to NDA approval)
6.36.8
7.2
5.9 6.0 6.1 6.36.8 6.7 6.8
2.92.6 2
1.4 1.21.75 1.6
1.5 1.41.6
87-89 90-92 93-95 96-98 99-01 02-04 05-07 08-10 11-13 14-16P
Mean Clinical Time Mean Approval Time
Source: Tufts CSDD
© Copyright 2017 Veeva Systems Inc., all rights reserved71
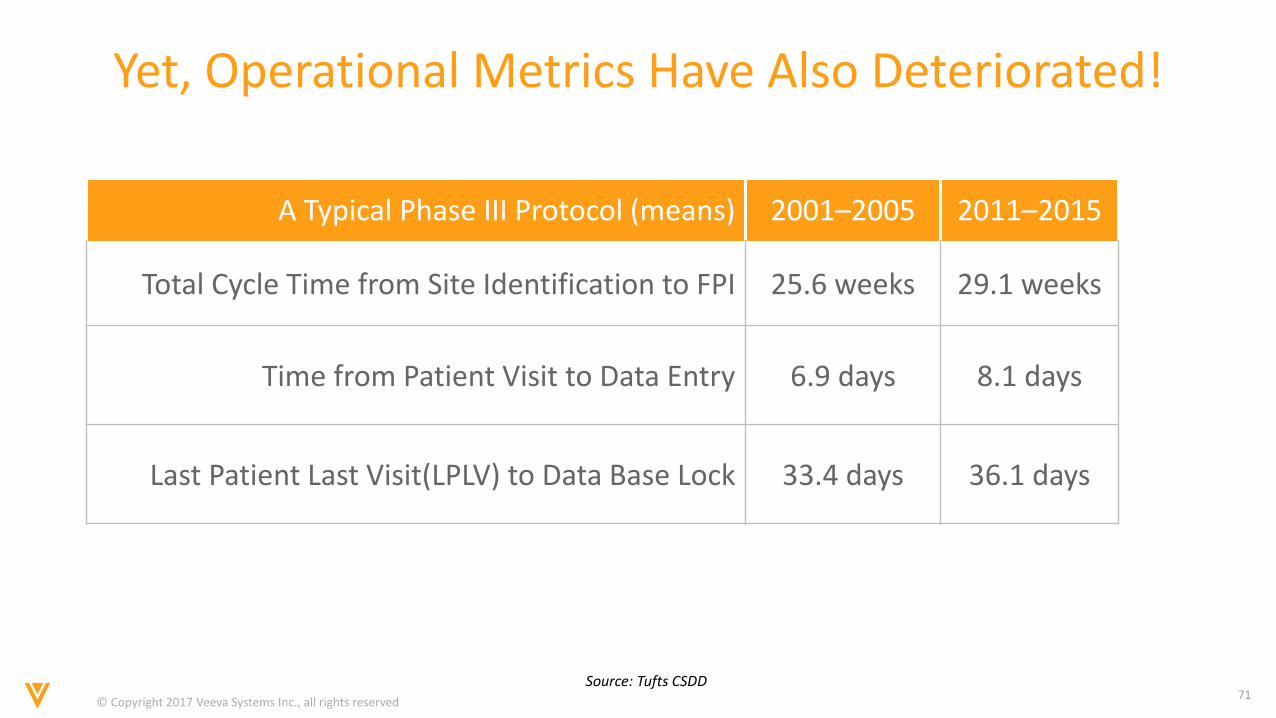
A Typical Phase III Protocol (means) 2001–2005 2011–2015
Total Cycle Time from Site Identification to FPI 25.6 weeks 29.1 weeks
Time from Patient Visit to Data Entry 6.9 days 8.1 days
Last Patient Last Visit(LPLV) to Data Base Lock 33.4 days 36.1 days
Yet, Operational Metrics Have Also Deteriorated!
Source: Tufts CSDD
© Copyright 2017 Veeva Systems Inc., all rights reserved72
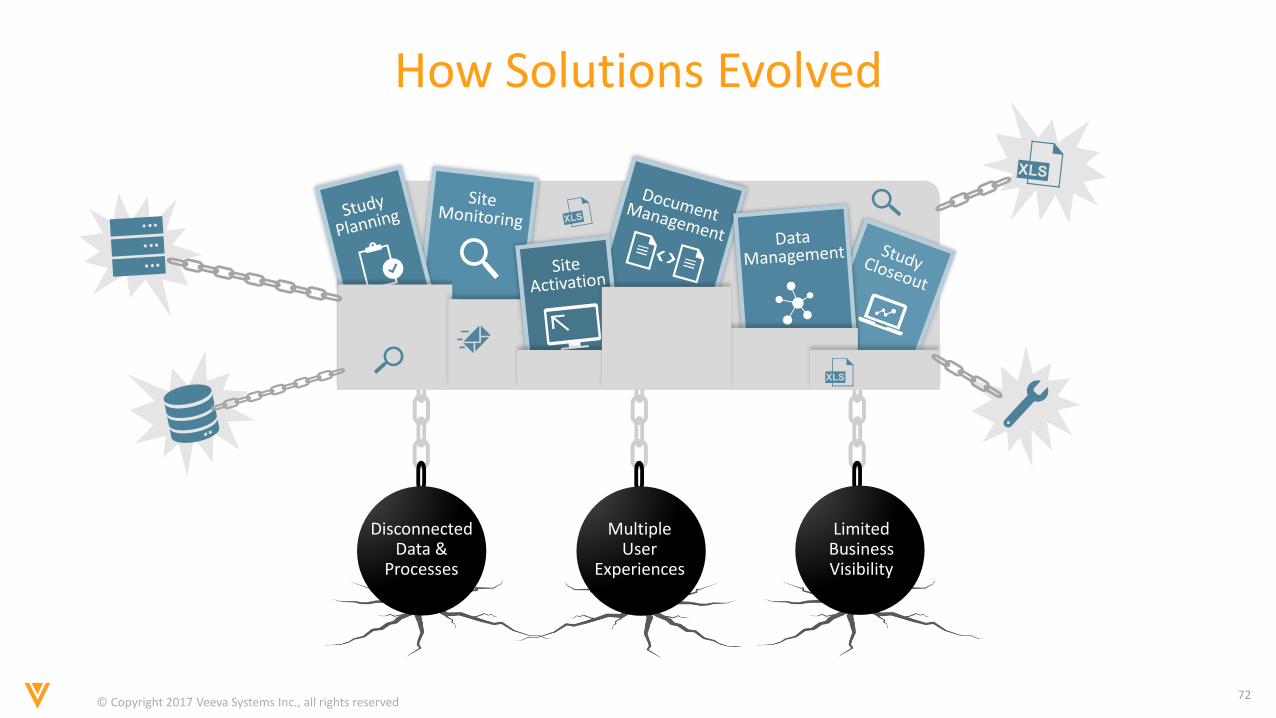
How Solutions Evolved
Disconnected Data &
Processes
Multiple User
Experiences
Limited BusinessVisibility
© Copyright 2017 Veeva Systems Inc., all rights reserved73
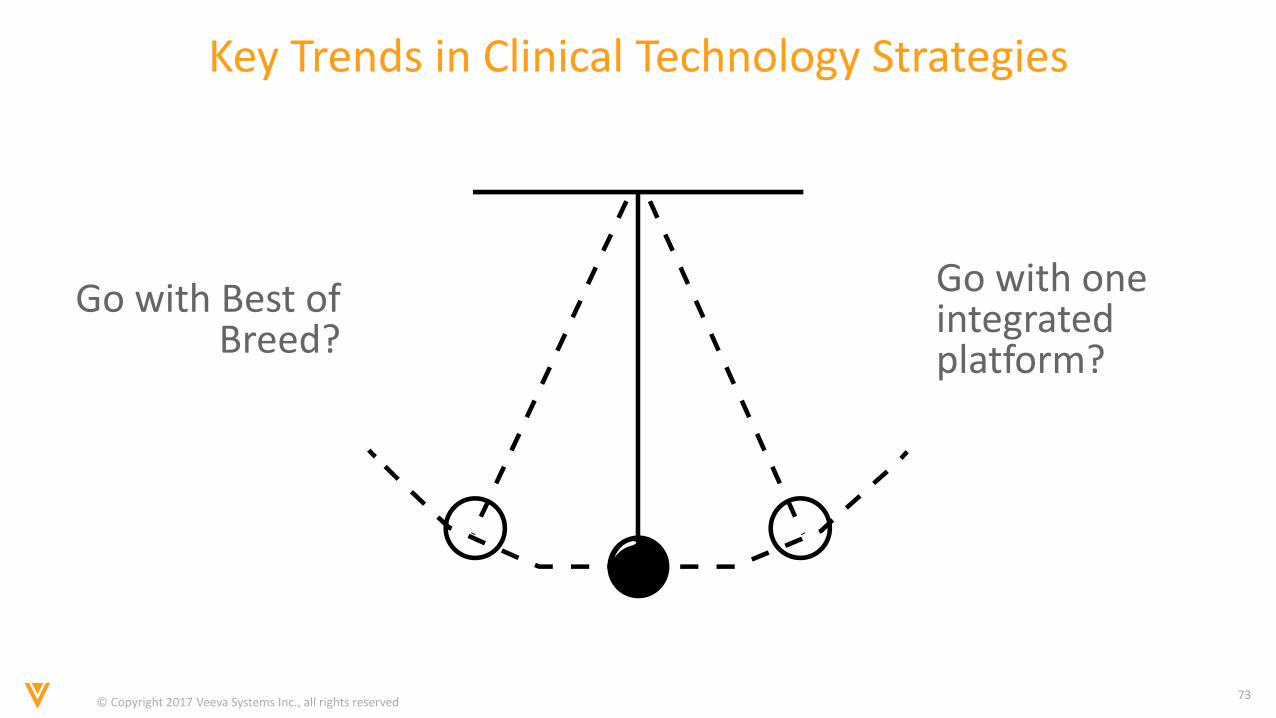
Key Trends in Clinical Technology Strategies
Go with Best of Breed?
Go with one integrated platform?
© Copyright 2017 Veeva Systems Inc., all rights reserved74
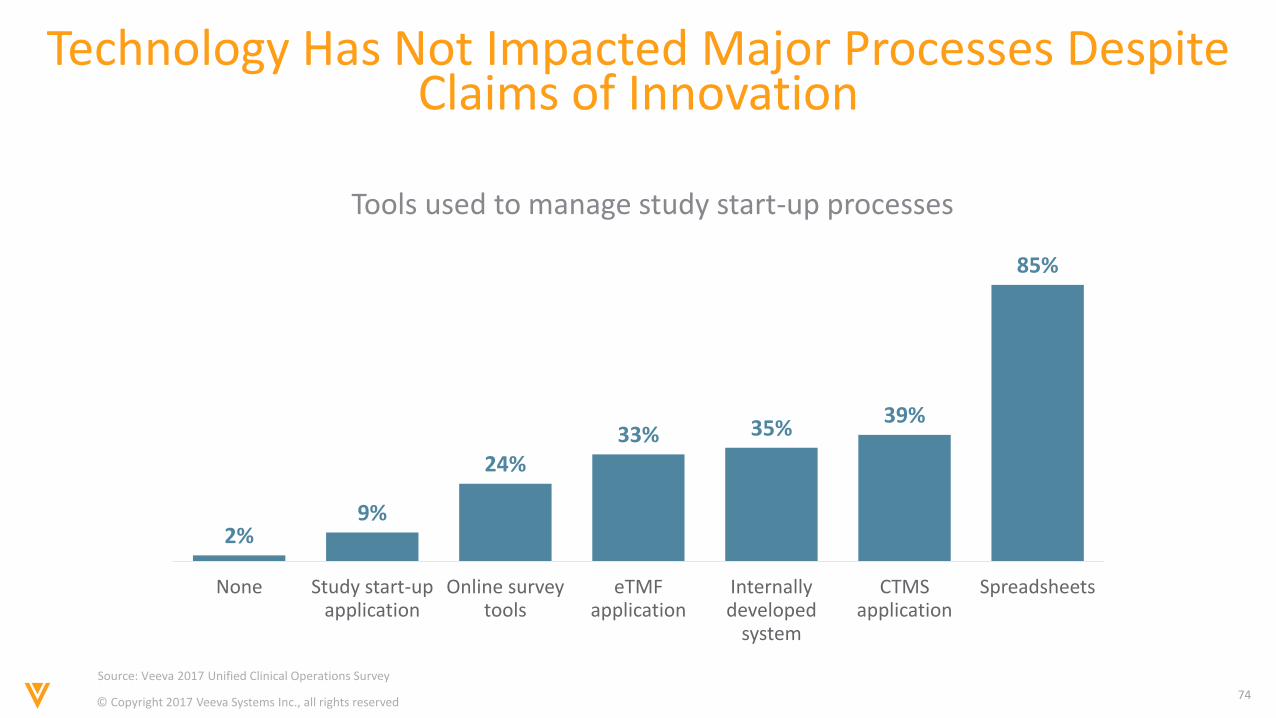
Technology Has Not Impacted Major Processes Despite Claims of Innovation
Tools used to manage study start-up processes
Source: Veeva 2017 Unified Clinical Operations Survey
2%9%
24%33% 35%
39%
85%
None Study start-up application
Online survey tools
eTMF application
Internally developed
system
CTMS application
Spreadsheets
© Copyright 2017 Veeva Systems Inc., all rights reserved75
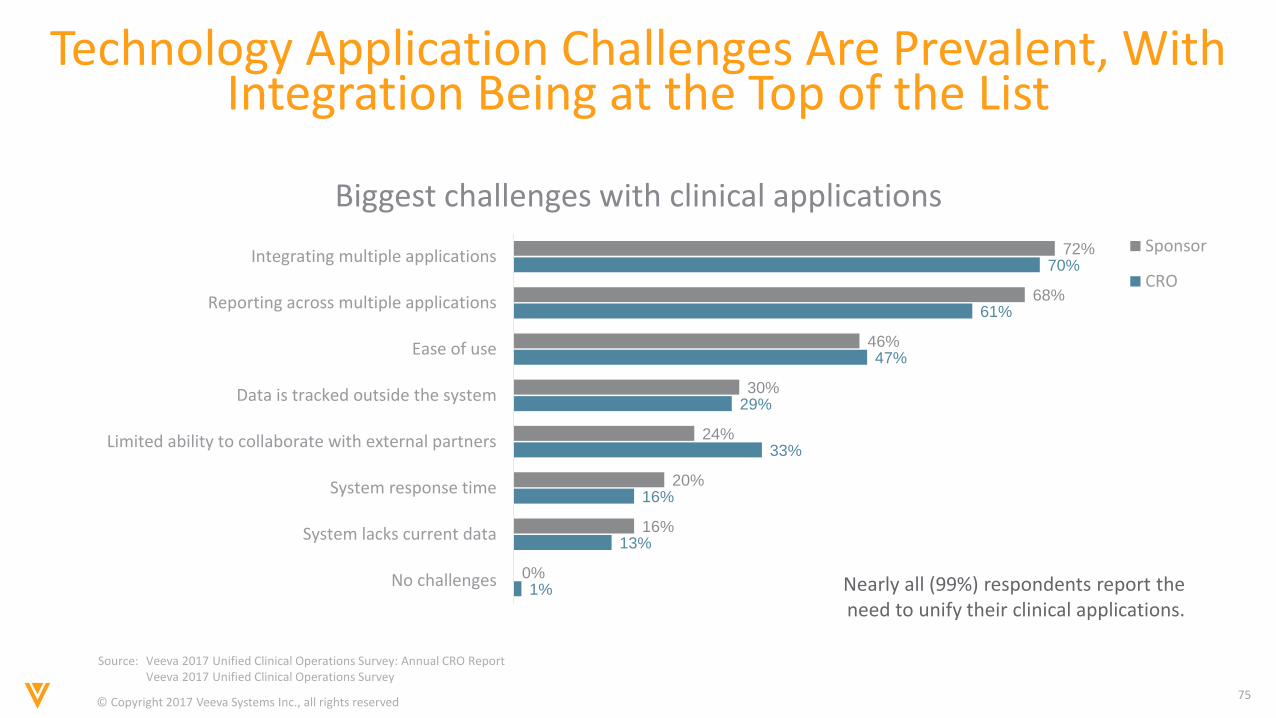
Technology Application Challenges Are Prevalent, With Integration Being at the Top of the List
Biggest challenges with clinical applications
Source: Veeva 2017 Unified Clinical Operations Survey: Annual CRO ReportVeeva 2017 Unified Clinical Operations Survey
Nearly all (99%) respondents report the need to unify their clinical applications.
1%
13%
16%
33%
29%
47%
61%
70%
0%
16%
20%
24%
30%
46%
68%
72%
No challenges
System lacks current data
System response time
Limited ability to collaborate with external partners
Data is tracked outside the system
Ease of use
Reporting across multiple applications
Integrating multiple applicationsSponsor
CRO
© Copyright 2017 Veeva Systems Inc., all rights reserved76
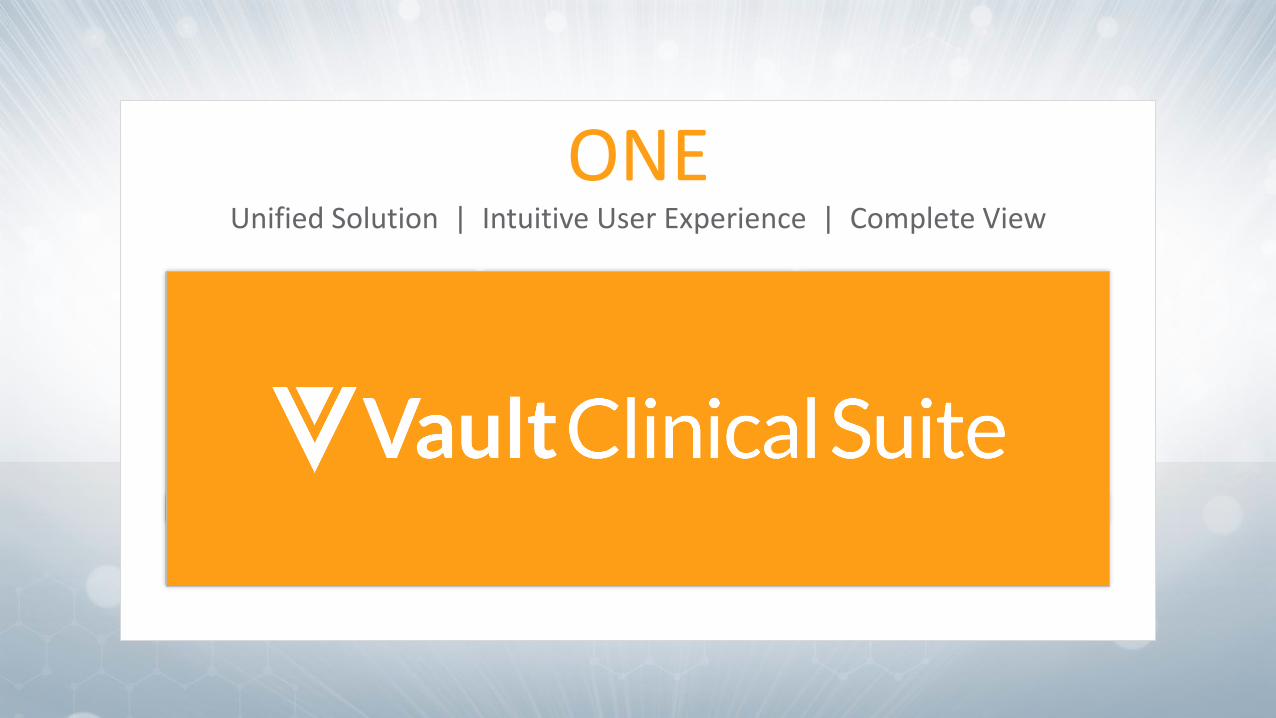
Unified Solution | Intuitive User Experience | Complete View
ONE
© Copyright 2017 Veeva Systems Inc., all rights reserved77
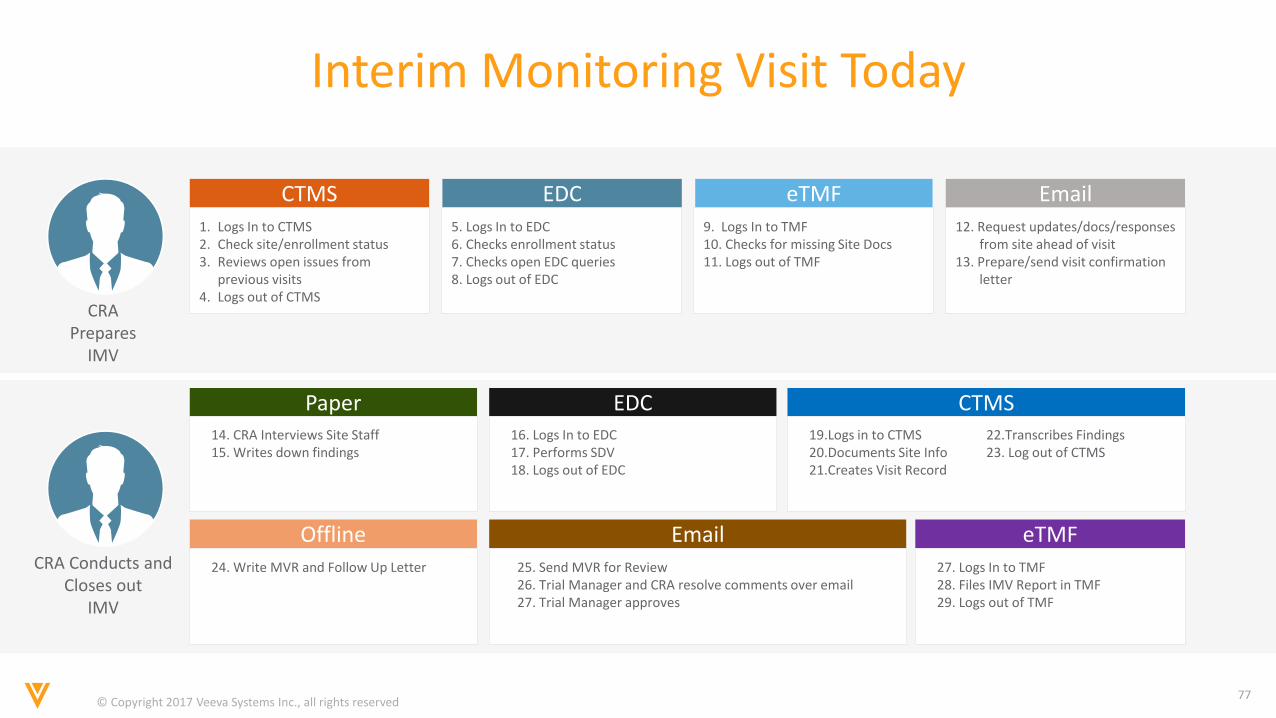
Interim Monitoring Visit Today
CTMS EDC eTMF Email
CRAPrepares
IMV
12. Request updates/docs/responses from site ahead of visit
13. Prepare/send visit confirmation letter
9. Logs In to TMF10. Checks for missing Site Docs11. Logs out of TMF
5. Logs In to EDC6. Checks enrollment status7. Checks open EDC queries8. Logs out of EDC
1. Logs In to CTMS2. Check site/enrollment status3. Reviews open issues from
previous visits4. Logs out of CTMS
CTMSEDCPaper
Offline Email eTMF
14. CRA Interviews Site Staff15. Writes down findings
19.Logs in to CTMS20.Documents Site Info21.Creates Visit Record
22.Transcribes Findings23. Log out of CTMS
24. Write MVR and Follow Up Letter 25. Send MVR for Review26. Trial Manager and CRA resolve comments over email27. Trial Manager approves
27. Logs In to TMF28. Files IMV Report in TMF29. Logs out of TMF
16. Logs In to EDC17. Performs SDV18. Logs out of EDC
CRA Conducts and Closes out
IMV
© Copyright 2017 Veeva Systems Inc., all rights reserved78
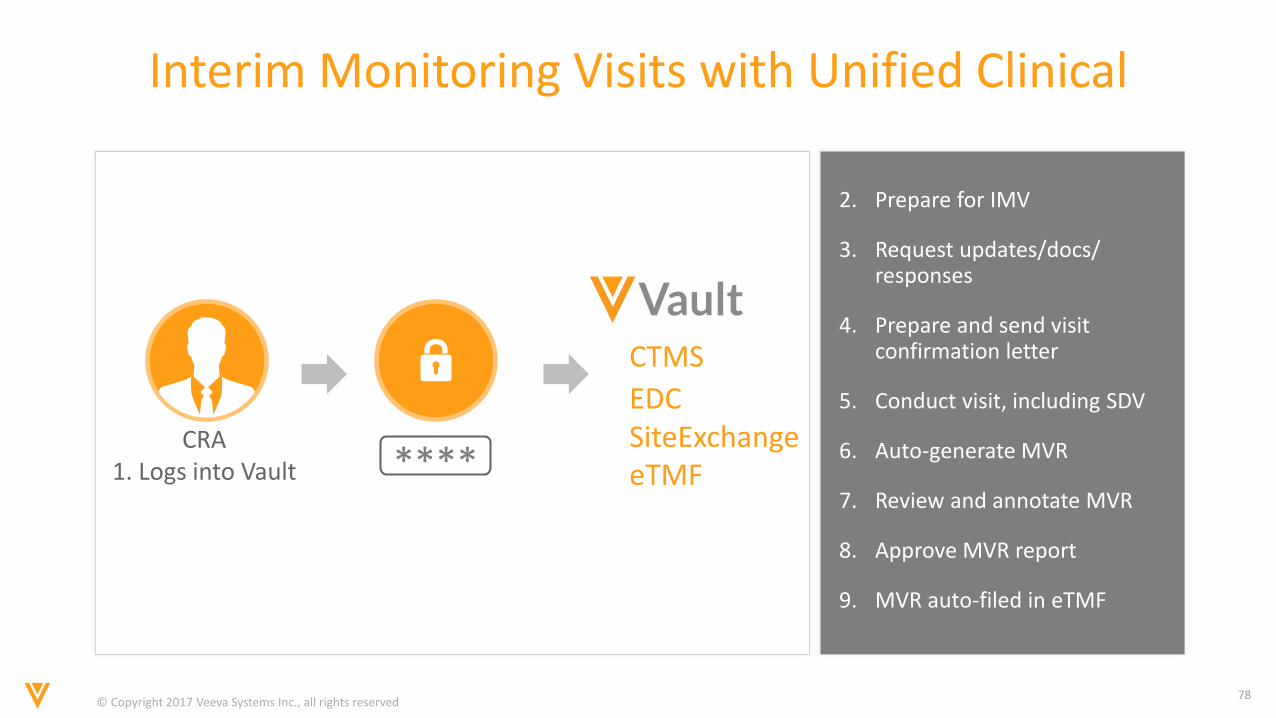
Interim Monitoring Visits with Unified Clinical
2. Prepare for IMV
3. Request updates/docs/ responses
4. Prepare and send visit confirmation letter
5. Conduct visit, including SDV
6. Auto-generate MVR
7. Review and annotate MVR
8. Approve MVR report
9. MVR auto-filed in eTMF
CRA1. Logs into Vault
CTMS
EDCSiteExchangeeTMF****
© Copyright 2017 Veeva Systems Inc., all rights reserved79
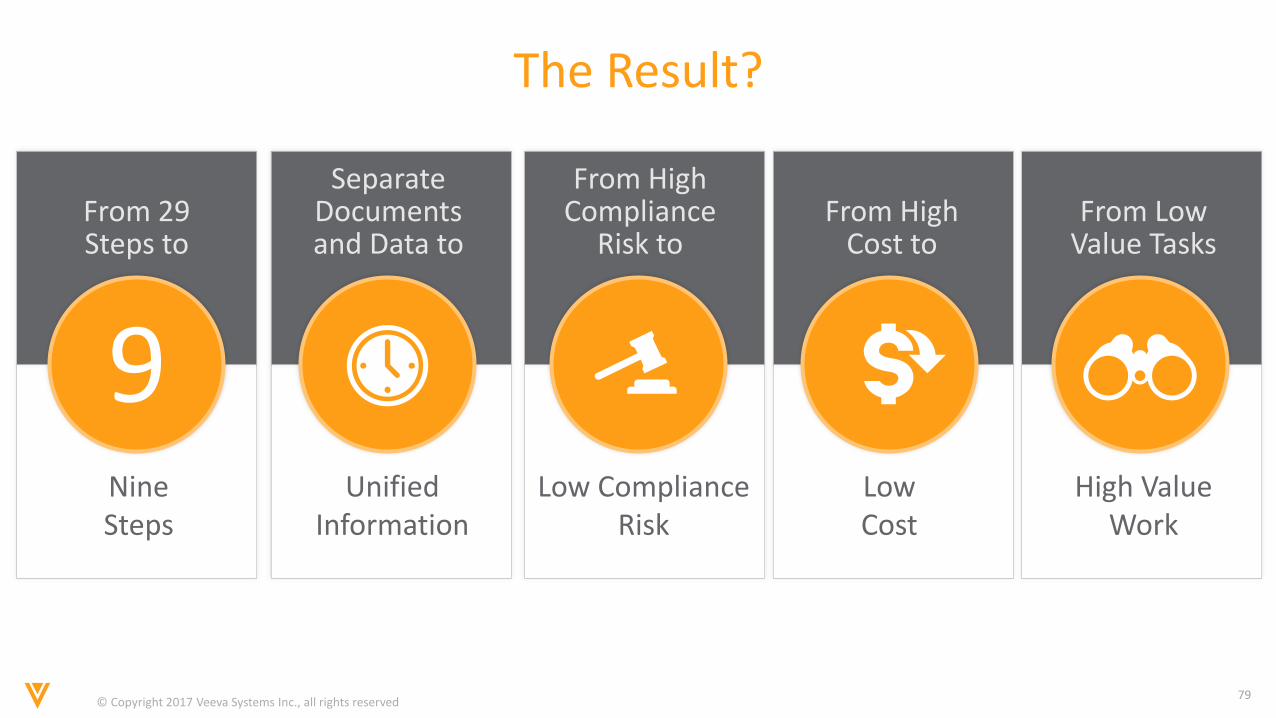
The Result?
NineSteps
Unified Information
Low Cost
Low Compliance Risk
High Value Work
From 29 Steps to
Separate Documents and Data to
From High Cost to
From High Compliance
Risk toFrom Low
Value Tasks
9
© Copyright 2017 Veeva Systems Inc., all rights reserved80
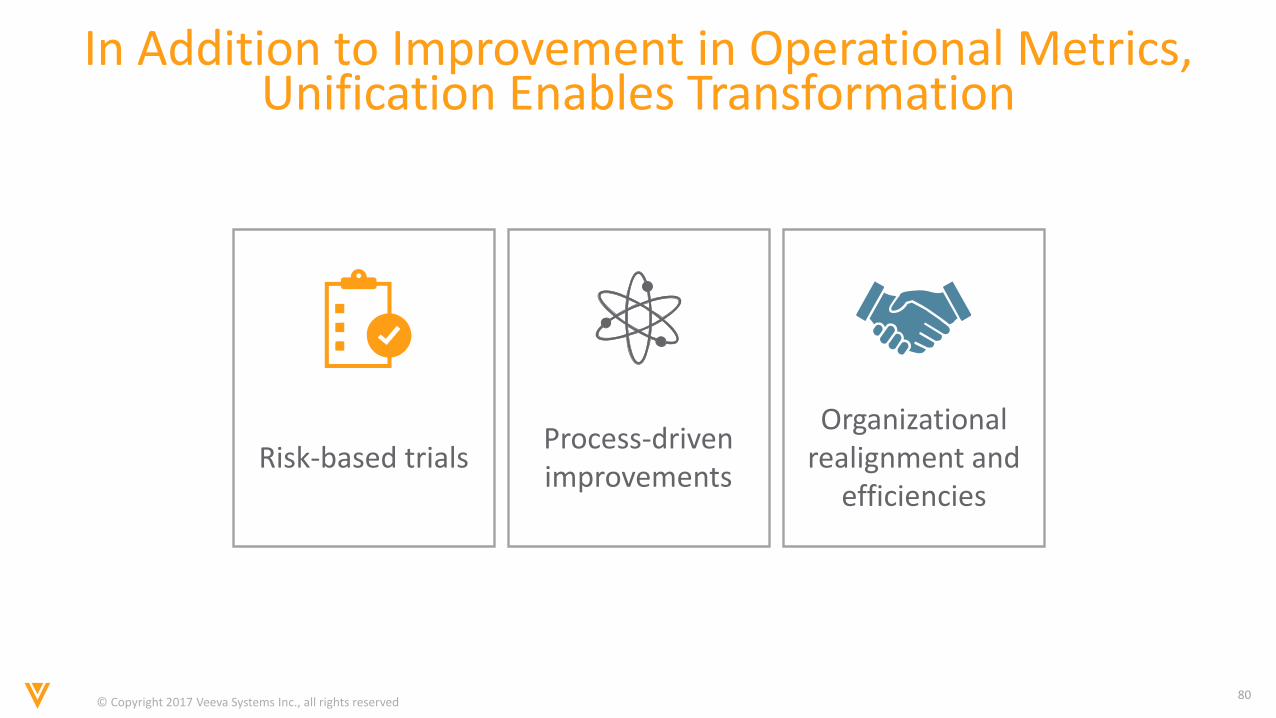
In Addition to Improvement in Operational Metrics, Unification Enables Transformation
Risk-based trialsProcess-driven improvements
Organizational realignment and
efficiencies
© Copyright 2017 Veeva Systems Inc., all rights reserved81
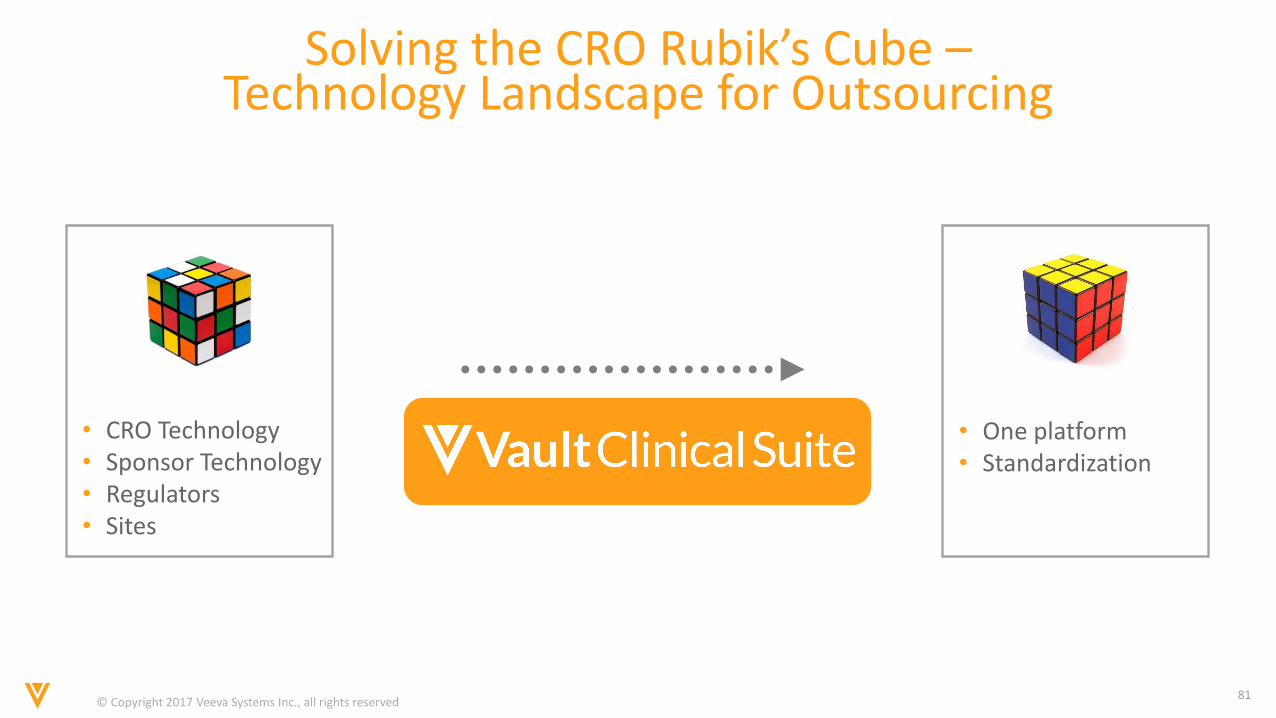
Solving the CRO Rubik’s Cube –Technology Landscape for Outsourcing
• CRO Technology• Sponsor Technology• Regulators• Sites
• One platform• Standardization
© Copyright 2017 Veeva Systems Inc., all rights reserved82
© Copyright 2017 Veeva Systems Inc., all rights reserved83
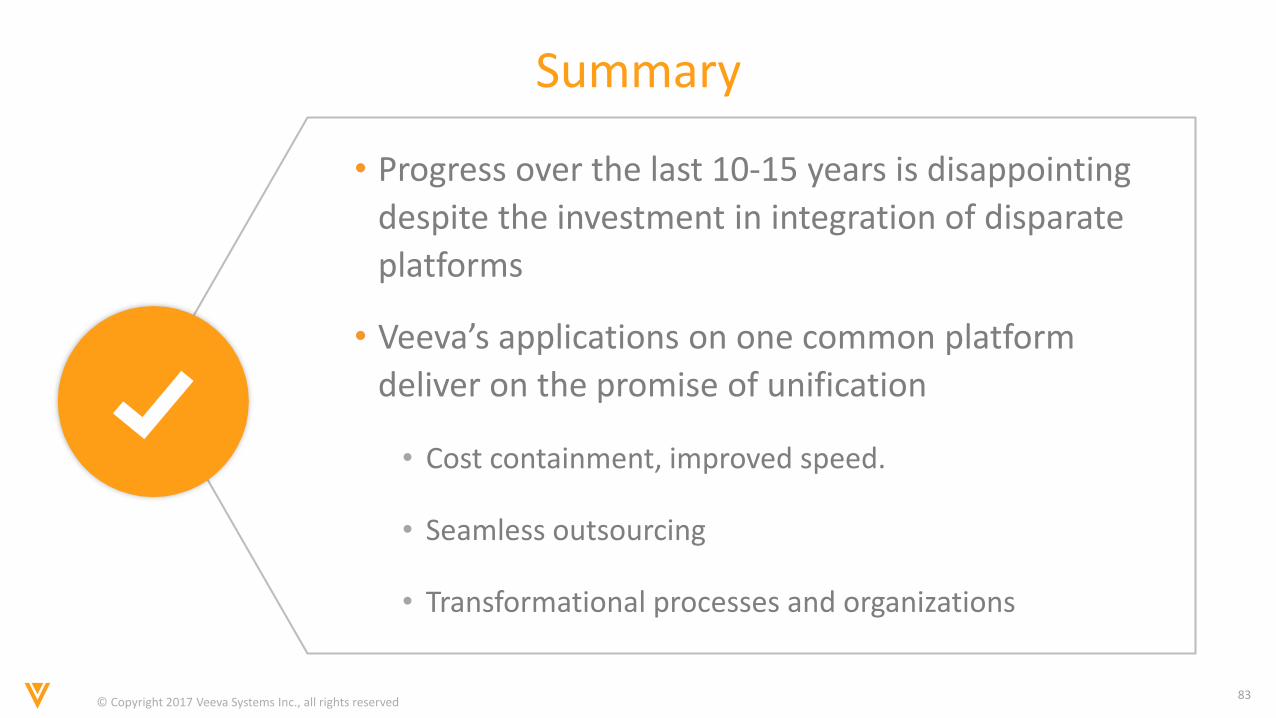
Summary
• Progress over the last 10-15 years is disappointing
despite the investment in integration of disparate
platforms
• Veeva’s applications on one common platform
deliver on the promise of unification
• Cost containment, improved speed.
• Seamless outsourcing
• Transformational processes and organizations
© Copyright 2017 Veeva Systems Inc., all rights reserved84
Veeva QualityOnePeter Gassner, Founder & CEO
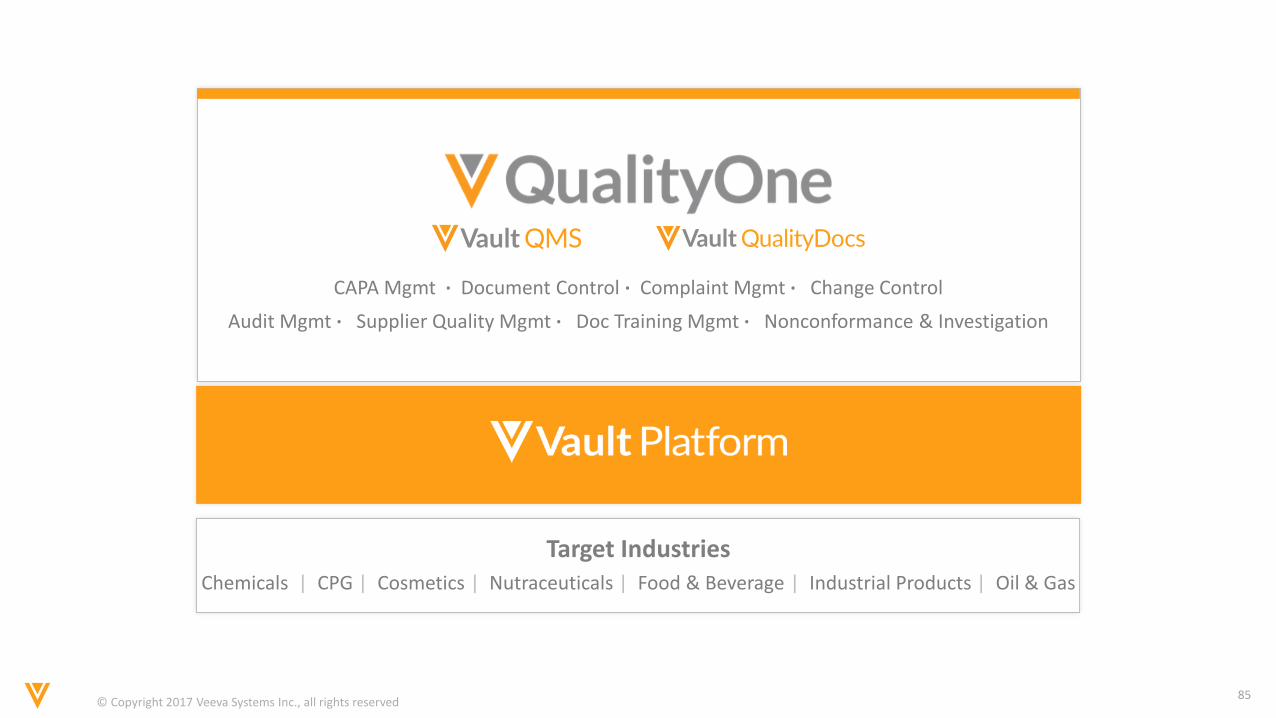
© Copyright 2017 Veeva Systems Inc., all rights reserved85
Target IndustriesChemicals | CPG | Cosmetics | Nutraceuticals | Food & Beverage | Industrial Products | Oil & Gas
CAPA Mgmt · Document Control · Complaint Mgmt · Change Control
Audit Mgmt · Supplier Quality Mgmt · Doc Training Mgmt · Nonconformance & Investigation
© Copyright 2017 Veeva Systems Inc., all rights reserved86
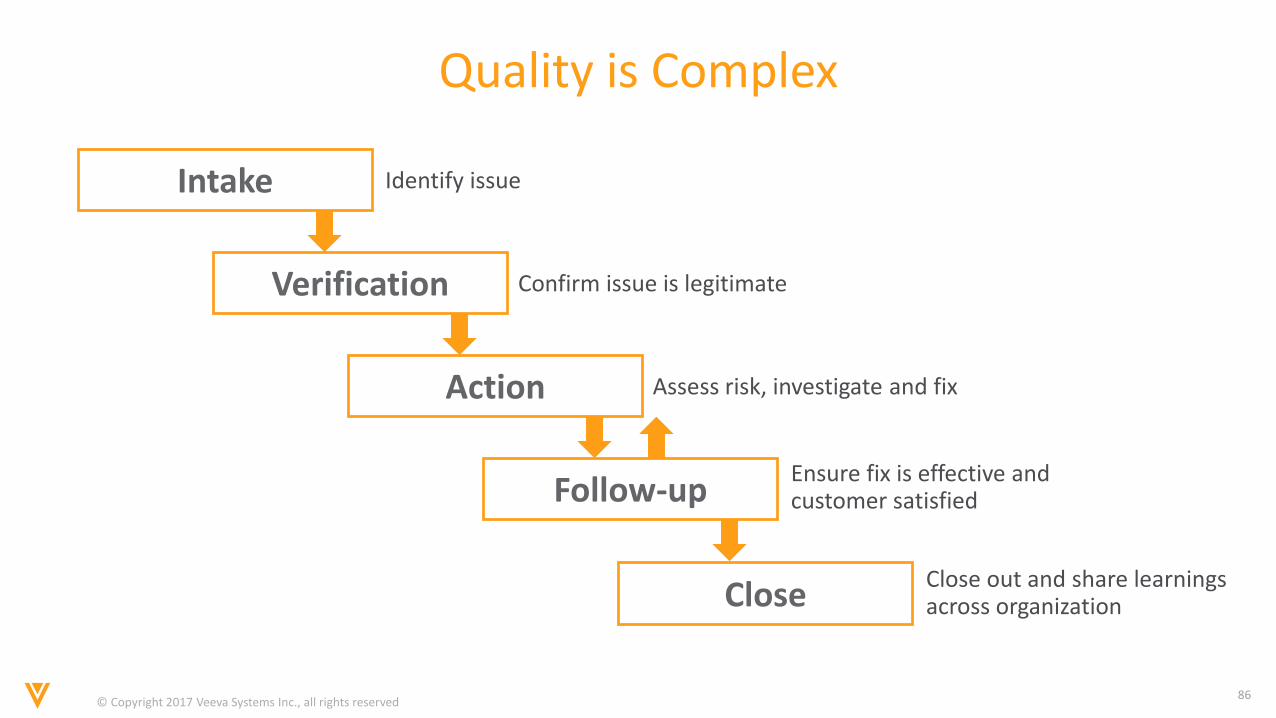
Identify issue
Confirm issue is legitimate
Assess risk, investigate and fix
Ensure fix is effective and customer satisfied
Close out and share learnings across organization
Quality is Complex
Intake
Close
Verification
Action
Follow-up
© Copyright 2017 Veeva Systems Inc., all rights reserved87
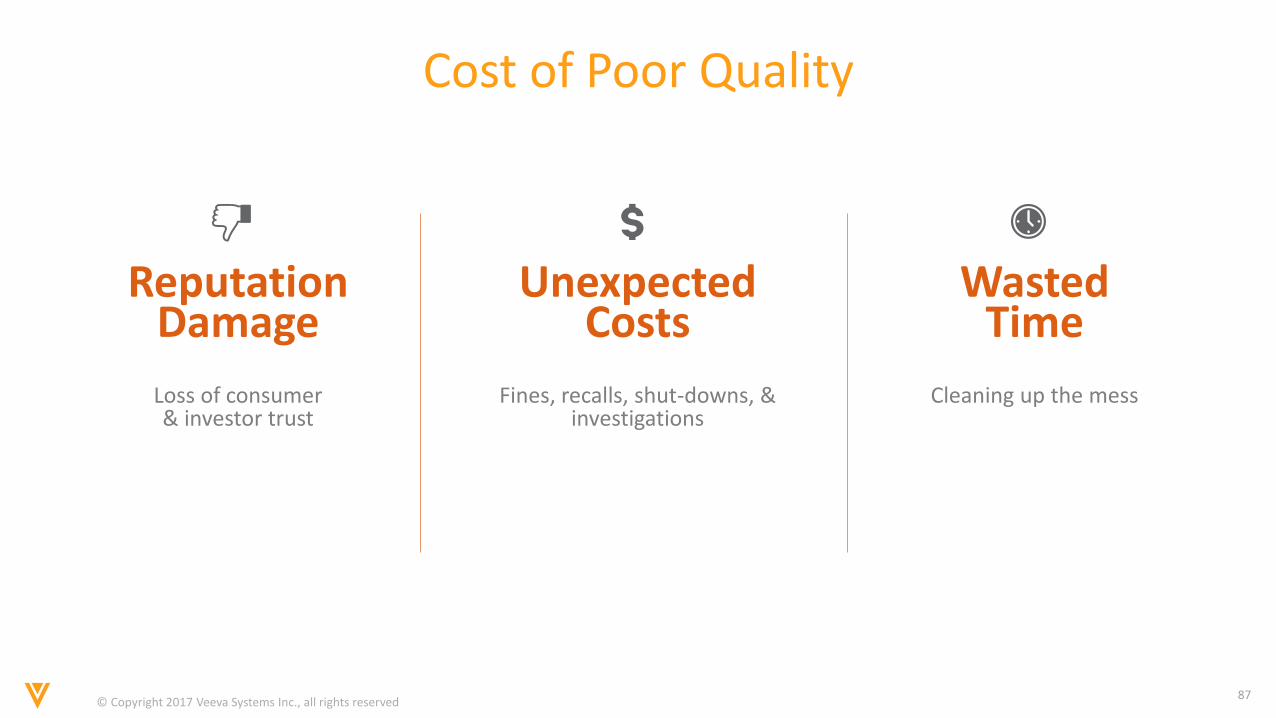
Cost of Poor Quality
Reputation Damage
Unexpected Costs
Wasted Time
Loss of consumer & investor trust
Fines, recalls, shut-downs, & investigations
Cleaning up the mess
© Copyright 2017 Veeva Systems Inc., all rights reserved88
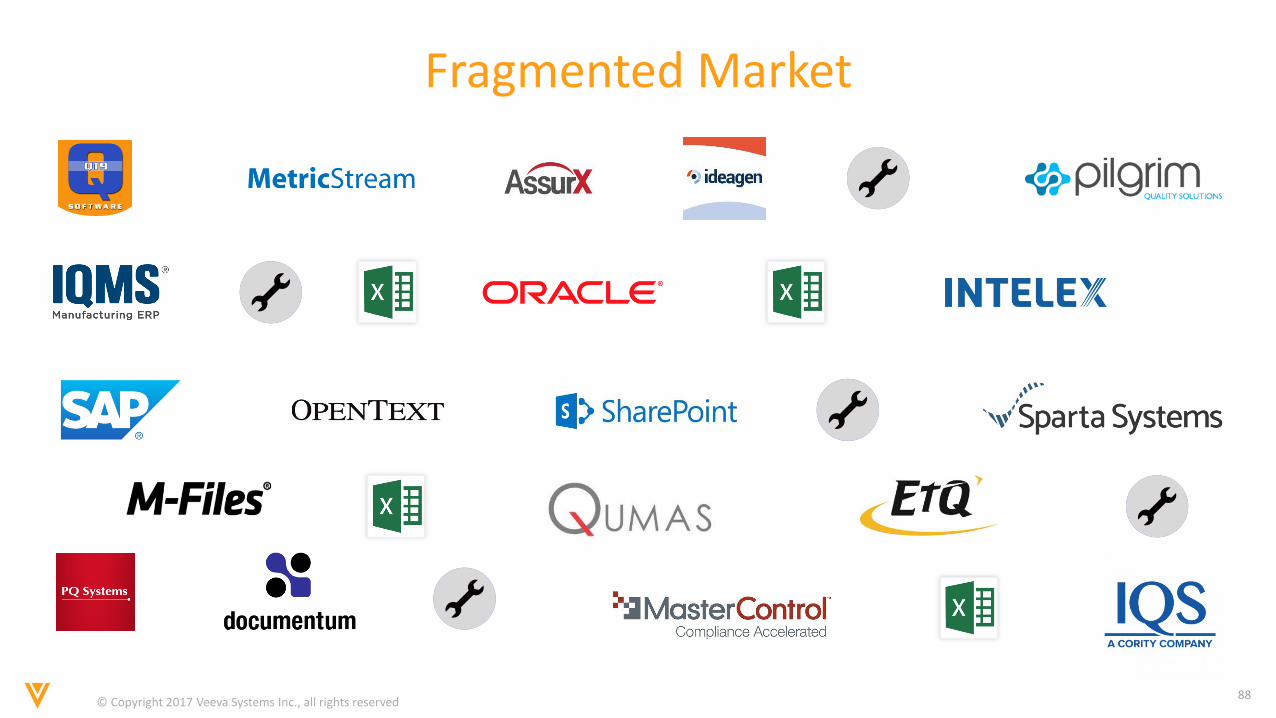
Fragmented Market
© Copyright 2017 Veeva Systems Inc., all rights reserved89
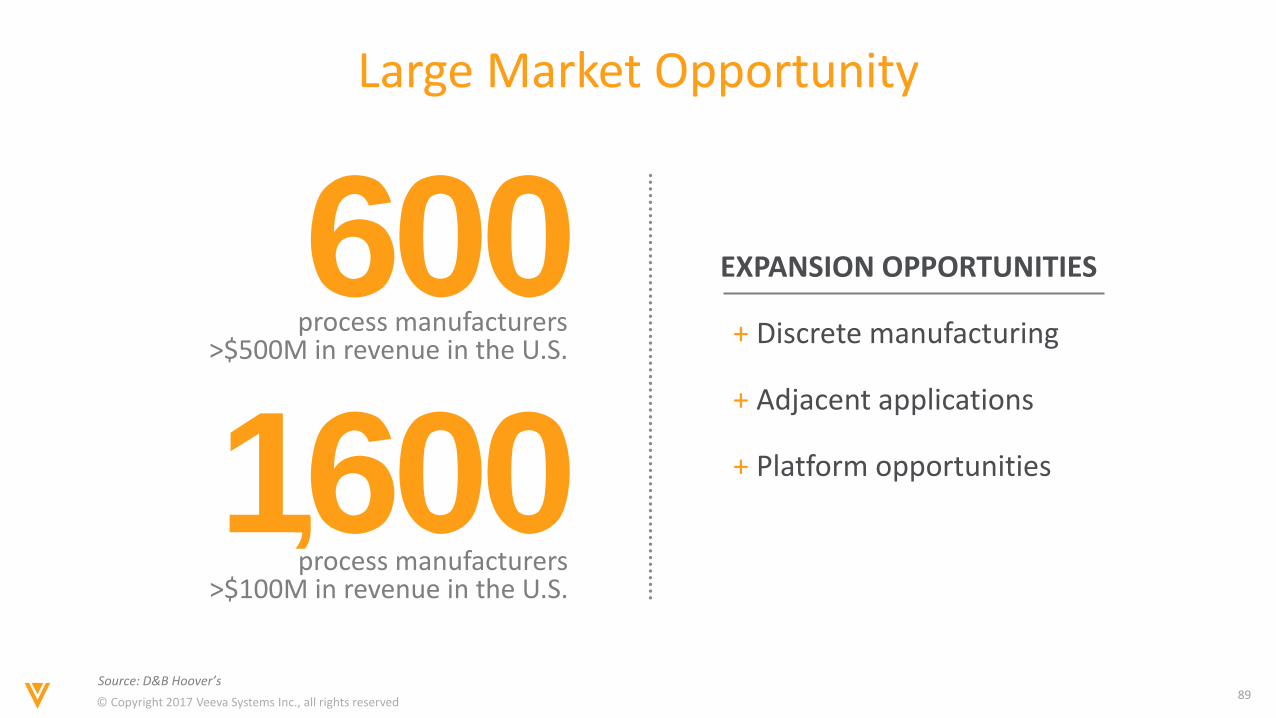
Large Market Opportunity
600process manufacturers
>$500M in revenue in the U.S.
1,600process manufacturers
>$100M in revenue in the U.S.
EXPANSION OPPORTUNITIES
+ Discrete manufacturing
+ Adjacent applications
+ Platform opportunities
Source: D&B Hoover’s
© Copyright 2017 Veeva Systems Inc., all rights reserved90
Go-to-market Strategy
• Dedicated sales, strategy, and services team
• Small development team for specific features
• Starting North America, Europe next year
• Get early adopters successful
• Why?− Customer success
− Product excellence
− Path to long-term leadership

© Copyright 2017 Veeva Systems Inc., all rights reserved91
QualityOneCustomer Success
© Copyright 2017 Veeva Systems Inc., all rights reserved92
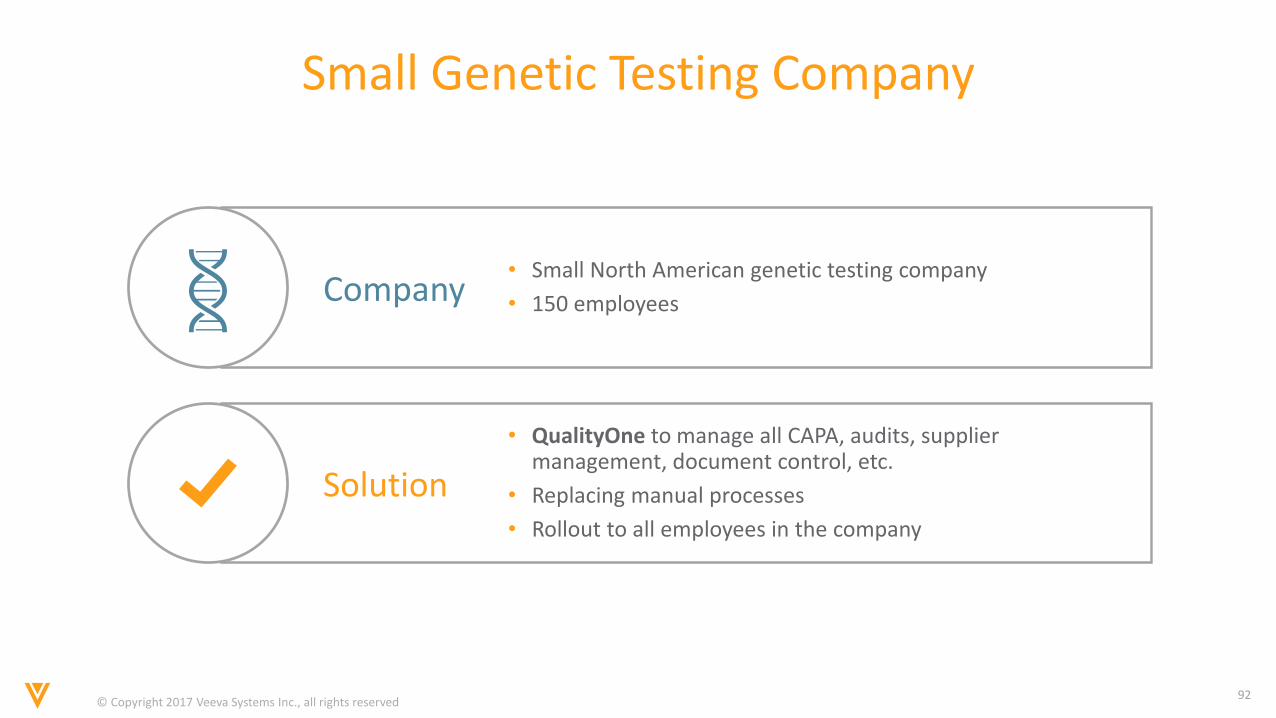
Solution
• QualityOne to manage all CAPA, audits, supplier management, document control, etc.
• Replacing manual processes
• Rollout to all employees in the company
Small Genetic Testing Company
Company• Small North American genetic testing company
• 150 employees
© Copyright 2017 Veeva Systems Inc., all rights reserved93
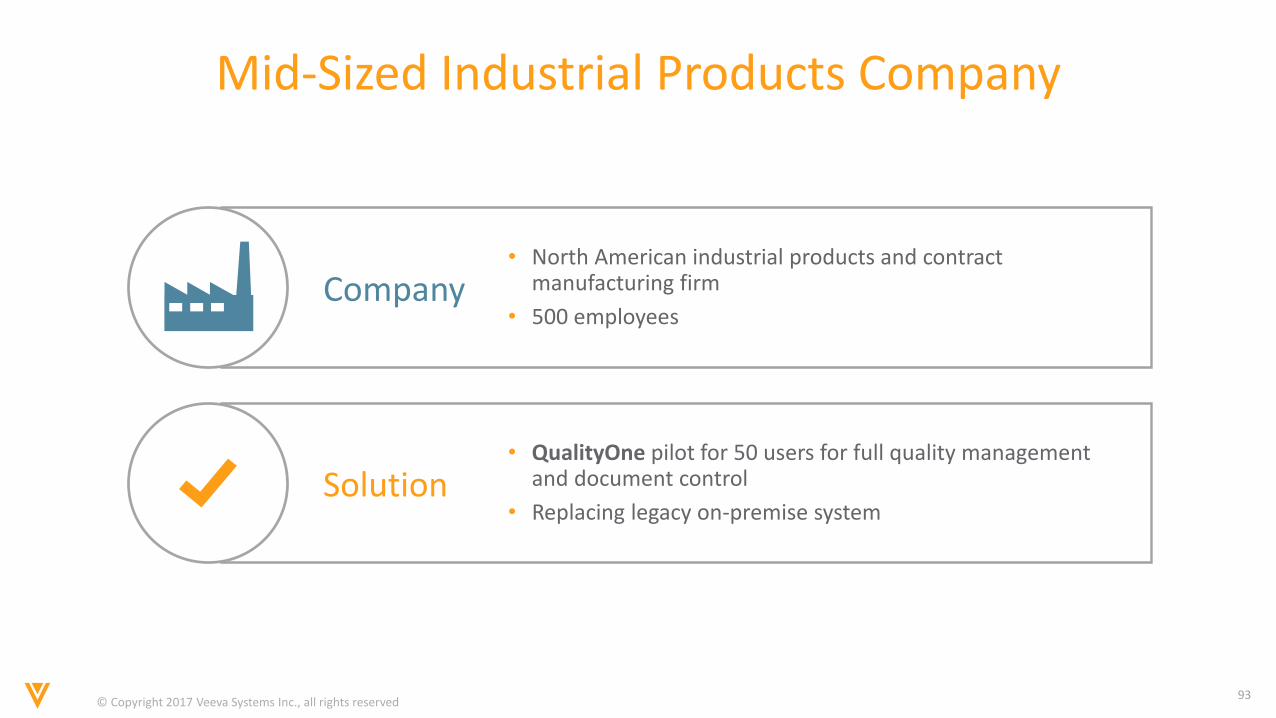
Solution• QualityOne pilot for 50 users for full quality management
and document control
• Replacing legacy on-premise system
Mid-Sized Industrial Products Company
Company• North American industrial products and contract
manufacturing firm
• 500 employees
© Copyright 2017 Veeva Systems Inc., all rights reserved94
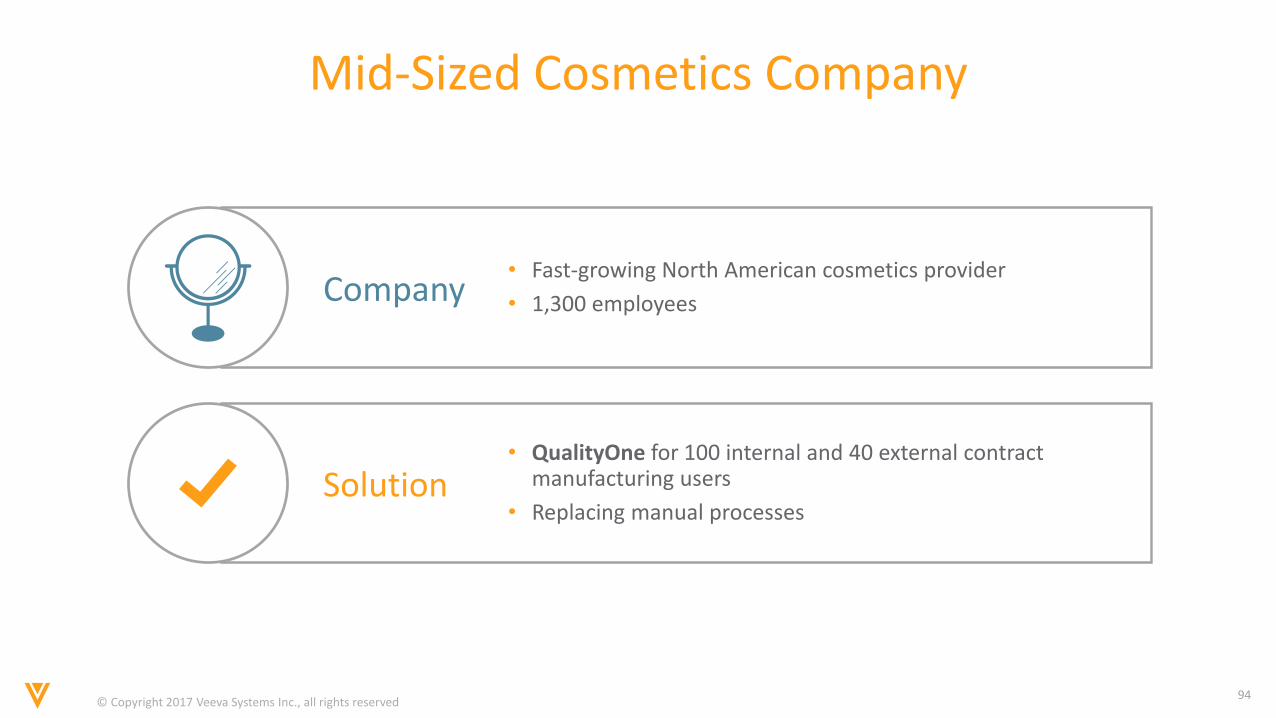
Solution• QualityOne for 100 internal and 40 external contract
manufacturing users
• Replacing manual processes
Mid-Sized Cosmetics Company
Company• Fast-growing North American cosmetics provider
• 1,300 employees
© Copyright 2017 Veeva Systems Inc., all rights reserved95
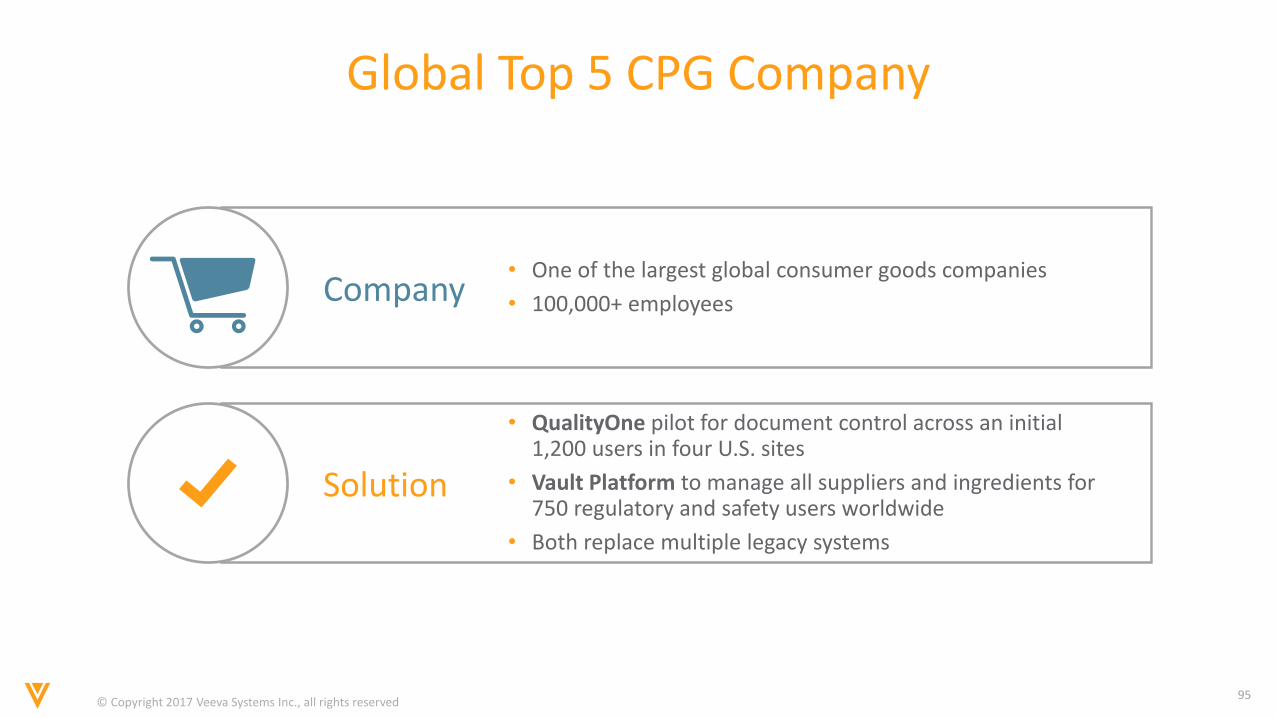
Solution
• QualityOne pilot for document control across an initial 1,200 users in four U.S. sites
• Vault Platform to manage all suppliers and ingredients for 750 regulatory and safety users worldwide
• Both replace multiple legacy systems
Global Top 5 CPG Company
Company• One of the largest global consumer goods companies
• 100,000+ employees
© Copyright 2017 Veeva Systems Inc., all rights reserved96
Looking Ahead
• In It to Win It
• Consistent Execution
• More Customers
• Expansion within Enterprise Customers
• Building Europe

© Copyright 2017 Veeva Systems Inc., all rights reserved97
Financial UpdateTim Cabral, CFO
© Copyright 2017 Veeva Systems Inc., all rights reserved98
Agenda
1. Consistent execution
2. ASC 606
3. 2020 update
© Copyright 2017 Veeva Systems Inc., all rights reserved99
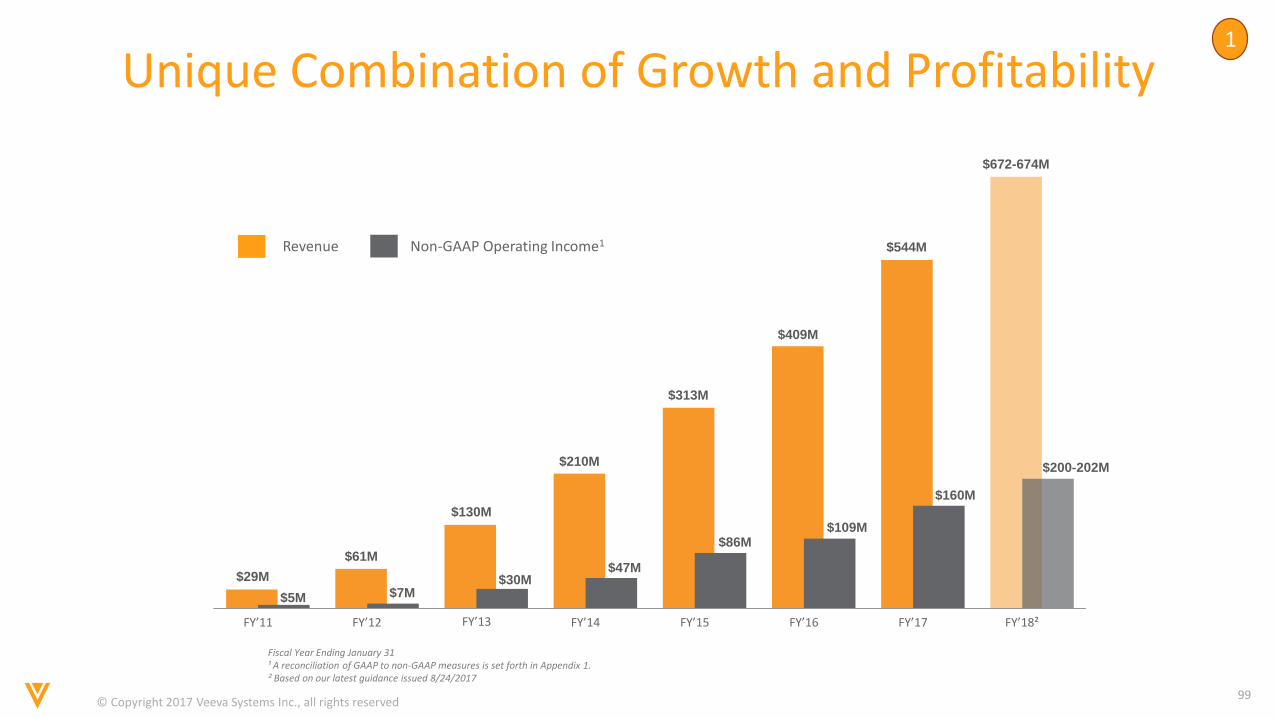
Unique Combination of Growth and Profitability
Fiscal Year Ending January 31¹ A reconciliation of GAAP to non-GAAP measures is set forth in Appendix 1.² Based on our latest guidance issued 8/24/2017
FY’12 FY’13 FY’14
Revenue Non-GAAP Operating Income1
$61M
$130M
$210M
$313M
$409M
$544M
$7M$30M
$47M
$86M$109M
$160M
FY’15 FY’16 FY’17
$29M
$5M
FY’11 FY’18²
$672-674M
$200-202M
1
© Copyright 2017 Veeva Systems Inc., all rights reserved100
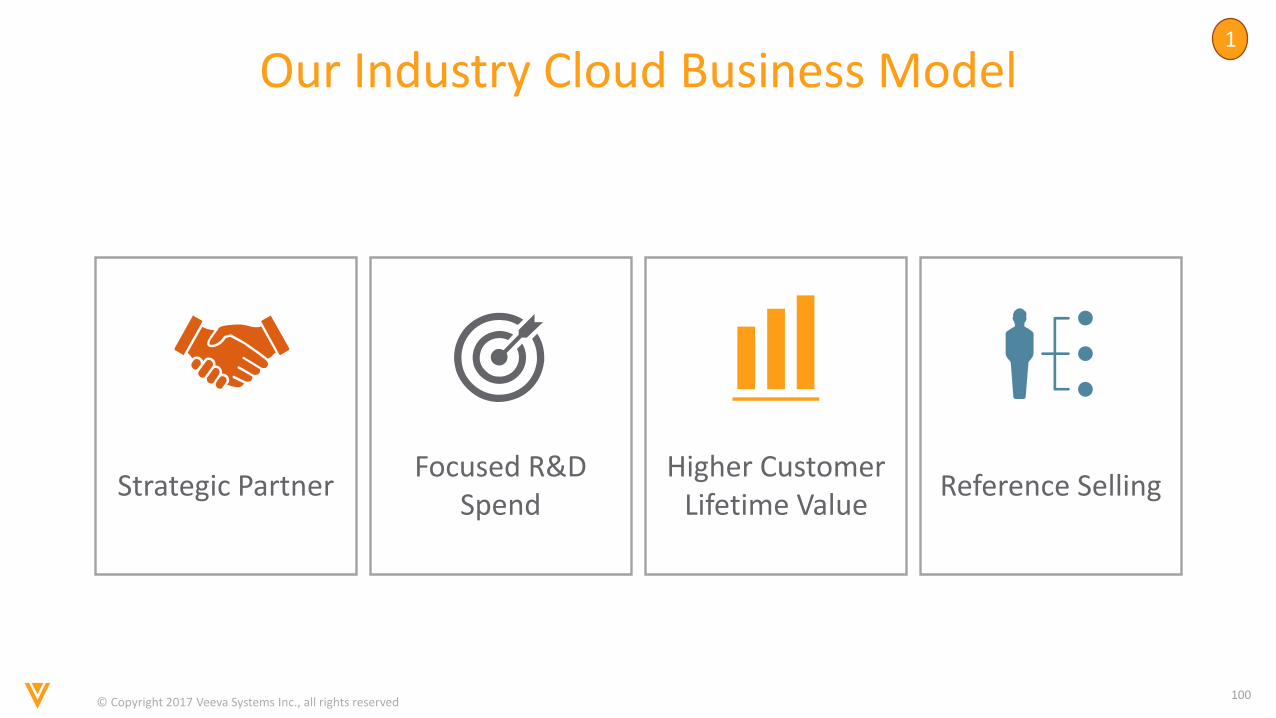
Our Industry Cloud Business Model
Strategic PartnerFocused R&D
SpendHigher Customer
Lifetime ValueReference Selling
1
© Copyright 2017 Veeva Systems Inc., all rights reserved101
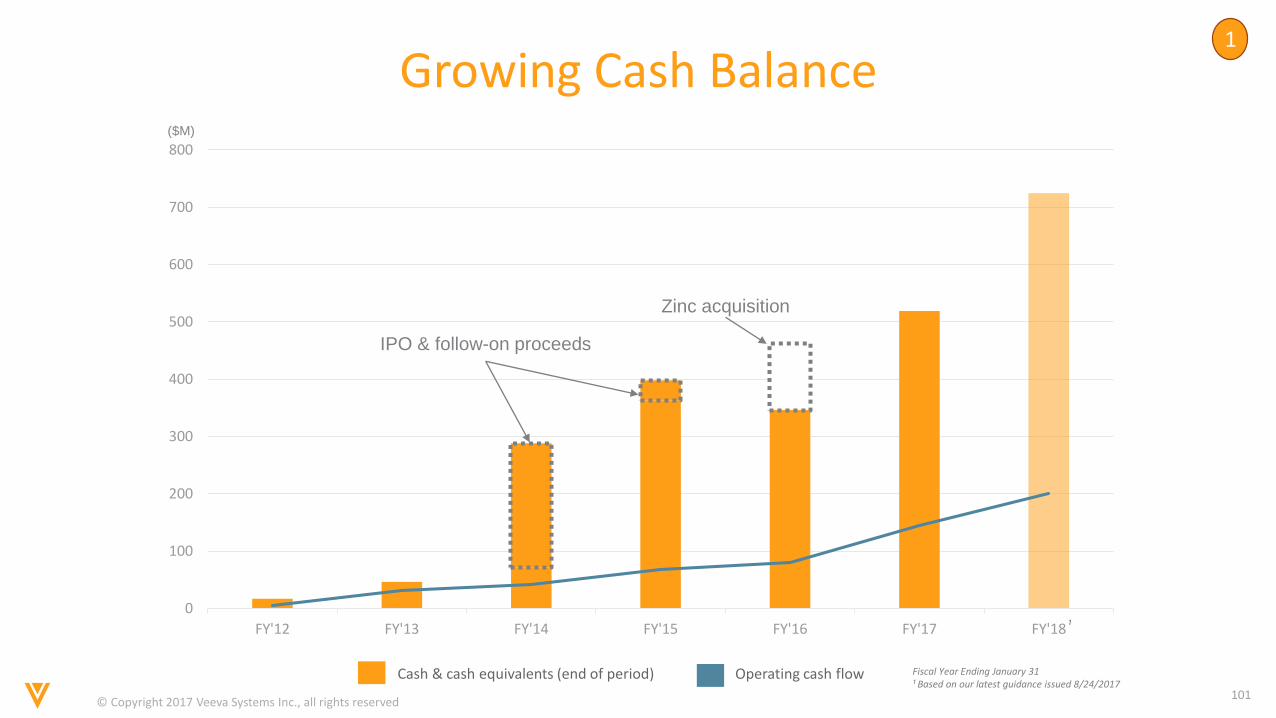
0
100
200
300
400
500
600
700
800
FY'12 FY'13 FY'14 FY'15 FY'16 FY'17 FY'18
Growing Cash Balance
Cash & cash equivalents (end of period) Operating cash flow
IPO & follow-on proceeds
Zinc acquisition
($M)
Fiscal Year Ending January 31¹ Based on our latest guidance issued 8/24/2017
¹
1
© Copyright 2017 Veeva Systems Inc., all rights reserved102
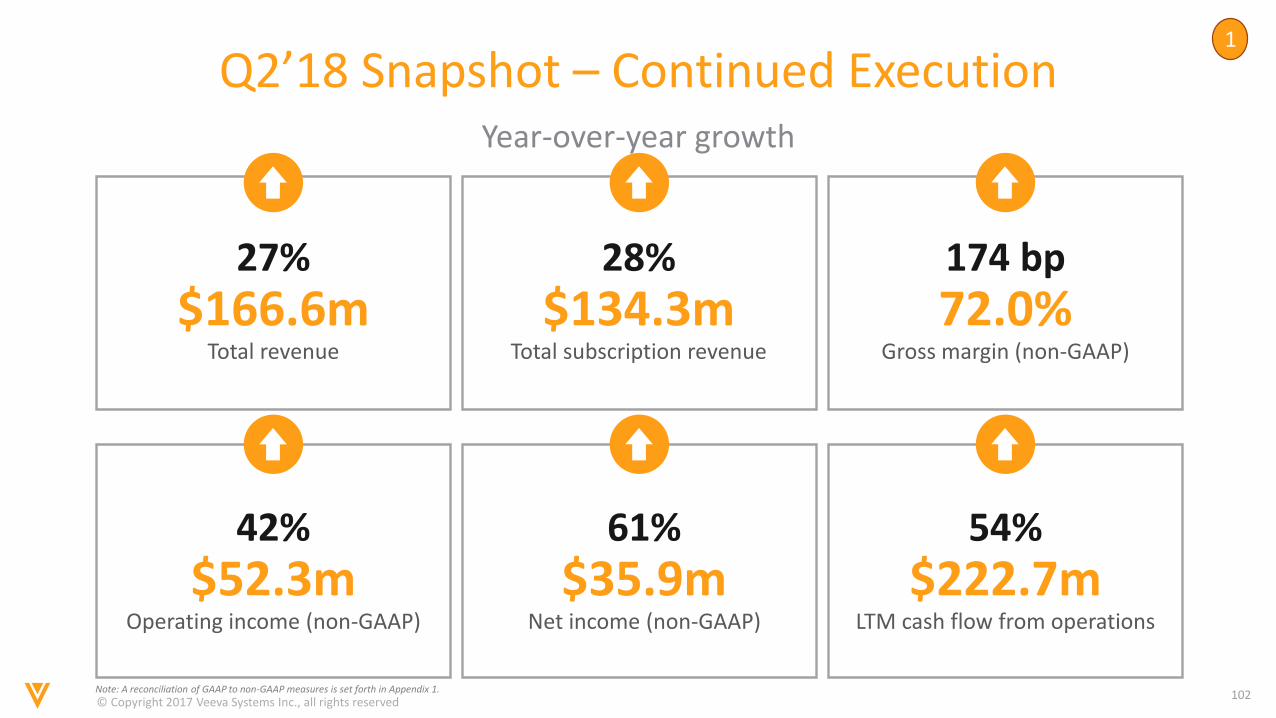
Q2’18 Snapshot – Continued ExecutionYear-over-year growth
27%
$166.6mTotal revenue
28%
$134.3mTotal subscription revenue
174 bp
72.0%Gross margin (non-GAAP)
42%
$52.3mOperating income (non-GAAP)
61%
$35.9mNet income (non-GAAP)
54%
$222.7mLTM cash flow from operations
Note: A reconciliation of GAAP to non-GAAP measures is set forth in Appendix 1.
1
© Copyright 2017 Veeva Systems Inc., all rights reserved103
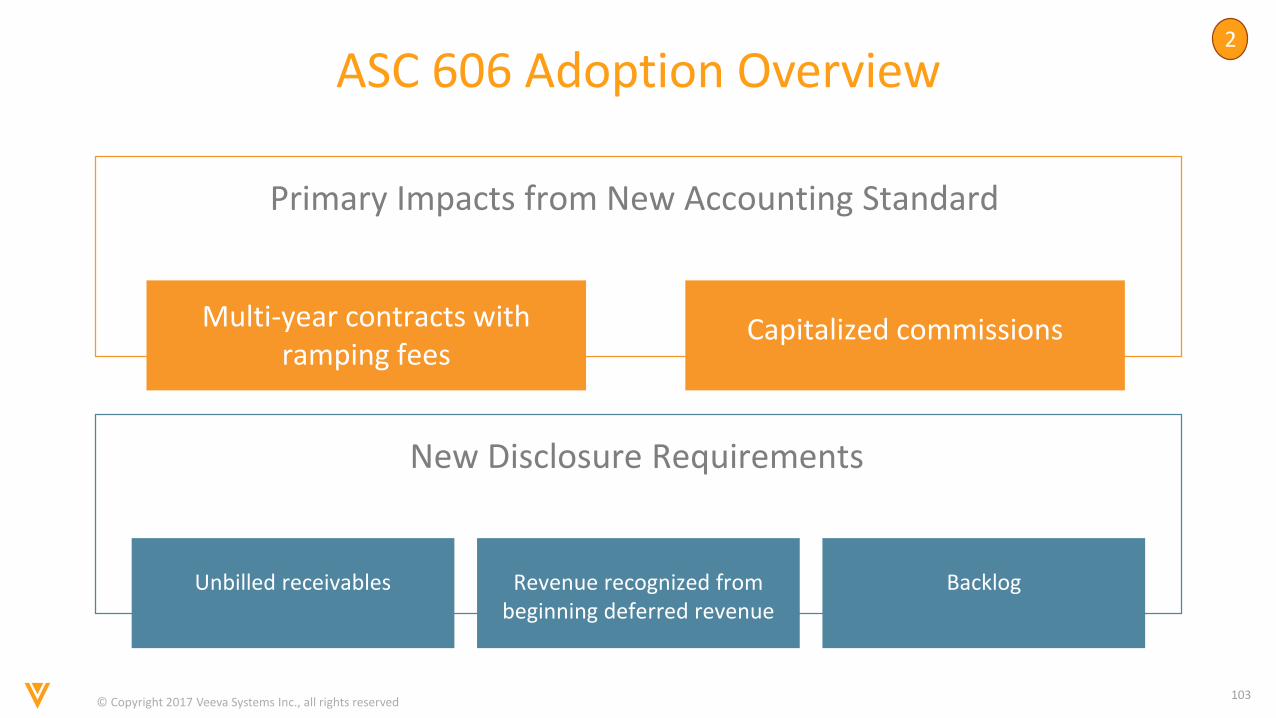
ASC 606 Adoption Overview
Primary Impacts from New Accounting Standard
Multi-year contracts with ramping fees
Capitalized commissions
New Disclosure Requirements
Unbilled receivables Revenue recognized from beginning deferred revenue
Backlog
2
© Copyright 2017 Veeva Systems Inc., all rights reserved104
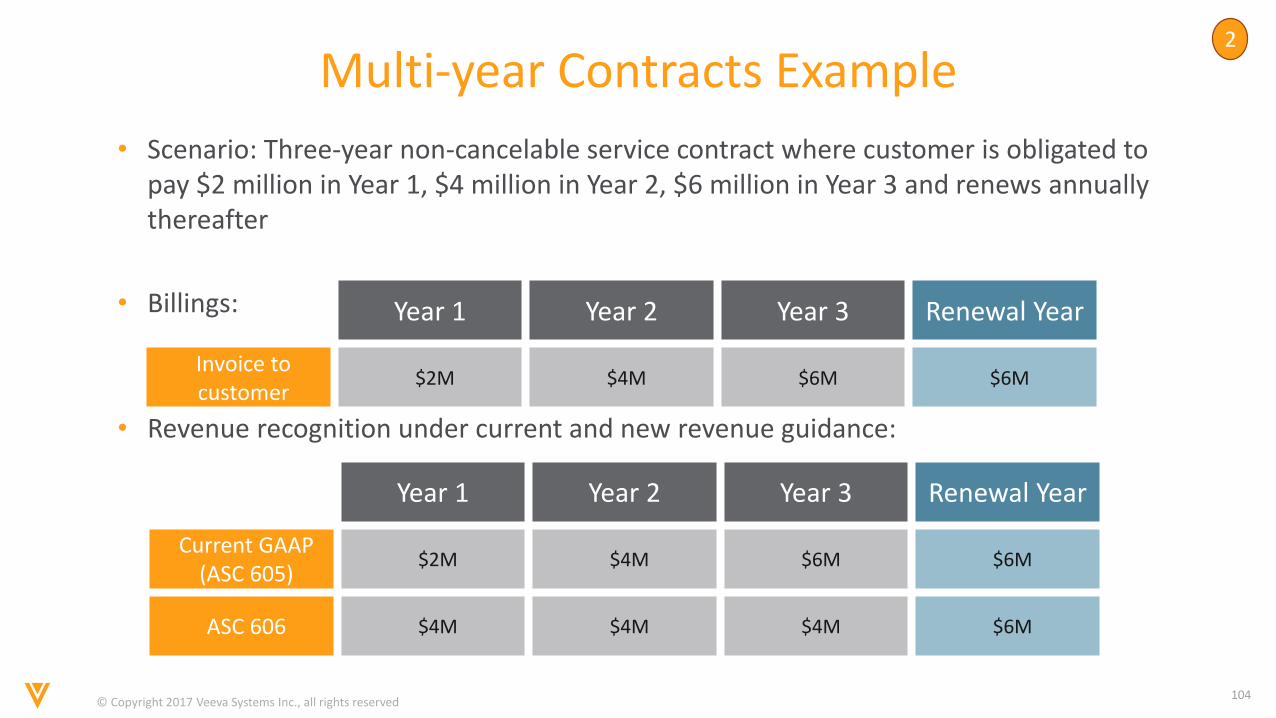
Year 1 Year 2 Year 3 Renewal Year
Current GAAP (ASC 605)
$2M $4M $6M $6M
ASC 606 $4M $4M $4M $6M
• Scenario: Three-year non-cancelable service contract where customer is obligated to pay $2 million in Year 1, $4 million in Year 2, $6 million in Year 3 and renews annually thereafter
• Billings:
• Revenue recognition under current and new revenue guidance:
Year 1 Year 2 Year 3 Renewal Year
Invoice to customer
$2M $4M $6M $6M
Multi-year Contracts Example2
© Copyright 2017 Veeva Systems Inc., all rights reserved105
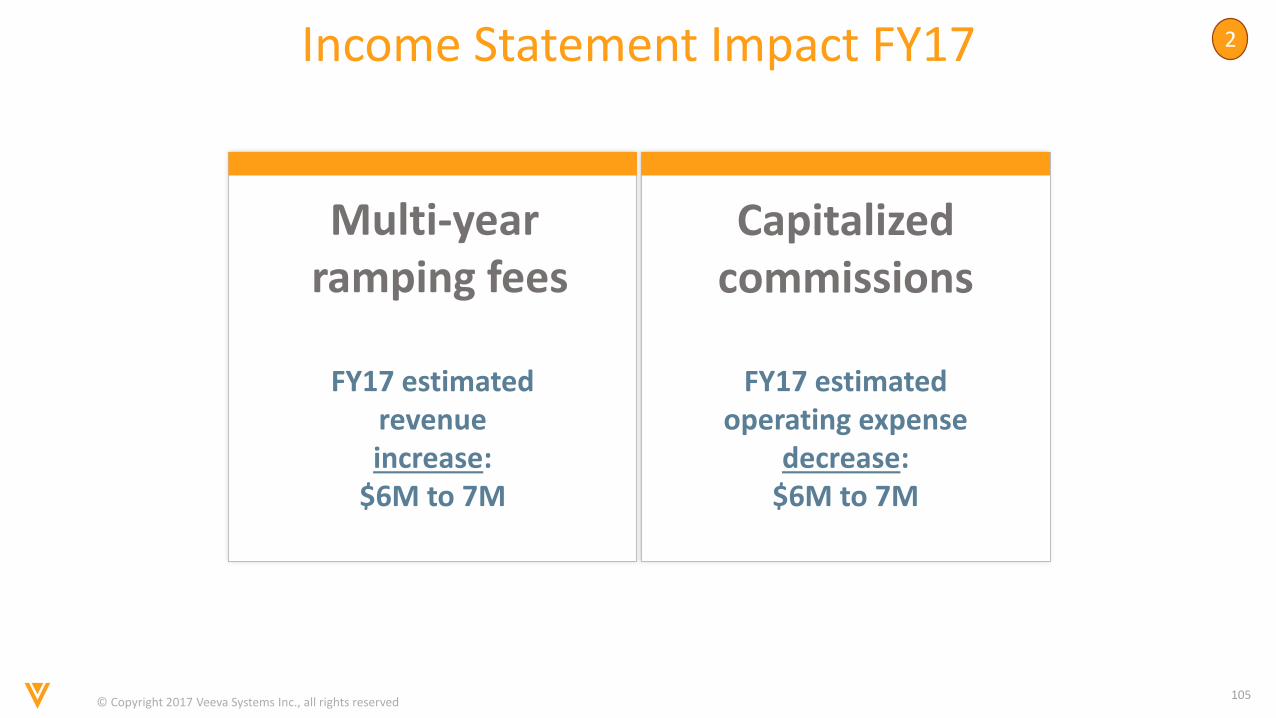
Income Statement Impact FY17
FY17 estimated revenue increase:
$6M to 7M
Multi-year ramping fees
FY17 estimated operating expense
decrease: $6M to 7M
Capitalizedcommissions
2
© Copyright 2017 Veeva Systems Inc., all rights reserved106
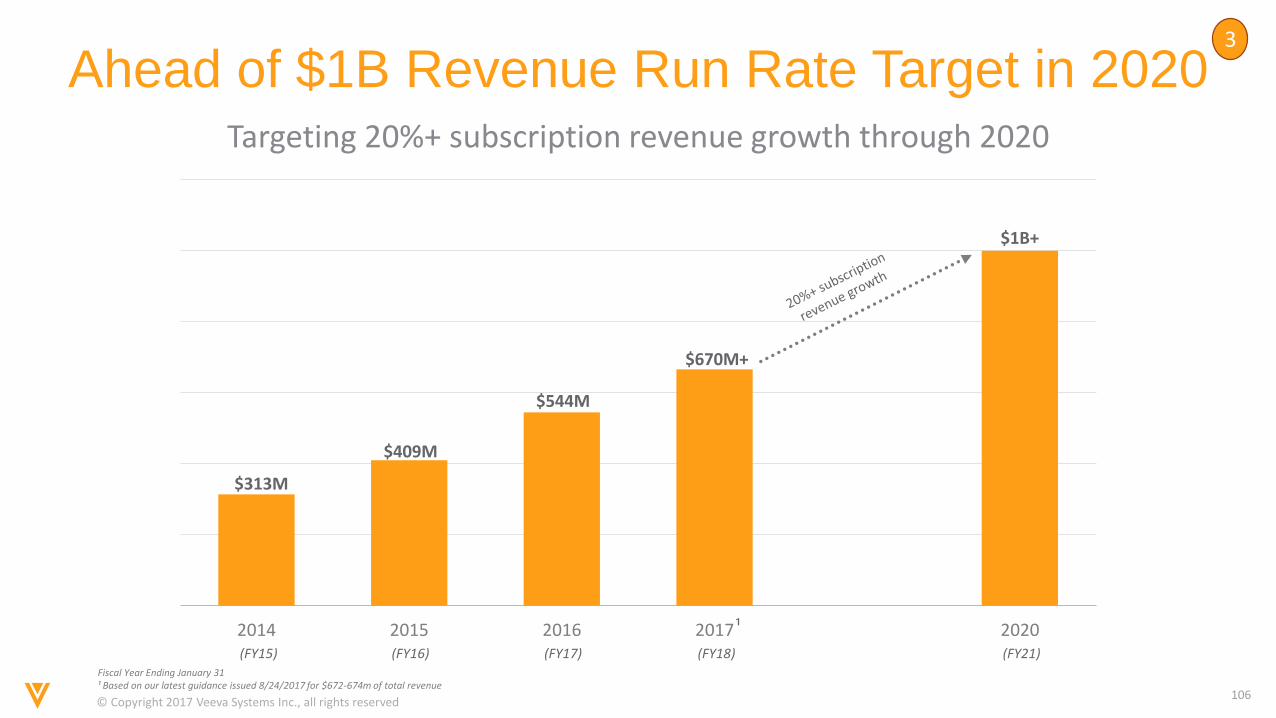
Ahead of $1B Revenue Run Rate Target in 2020Targeting 20%+ subscription revenue growth through 2020
2014 2015 2016 2017 2020
$1B+
$544M~50%
~35-40%
~10-15%
(FY17) (FY21)
$409M
$313M
(FY16)(FY15)
$670M+
(FY18)
¹
Fiscal Year Ending January 31¹ Based on our latest guidance issued 8/24/2017 for $672-674m of total revenue
3
© Copyright 2017 Veeva Systems Inc., all rights reserved107
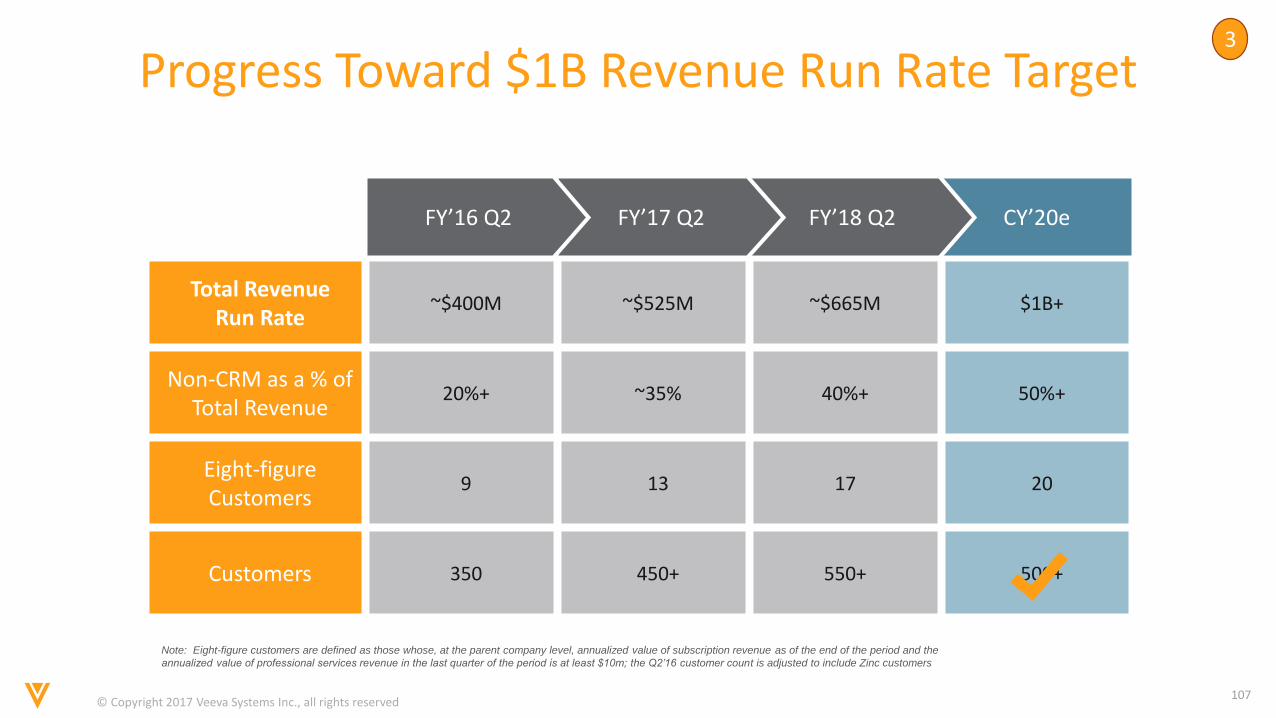
Total Revenue Run Rate
~$400M ~$525M ~$665M $1B+
Non-CRM as a % of Total Revenue
20%+ ~35% 40%+ 50%+
Eight-figure Customers
9 13 17 20
Customers 350 450+ 550+ 500+
Progress Toward $1B Revenue Run Rate Target
CY’20eFY’18 Q2FY’17 Q2FY’16 Q2
Note: Eight-figure customers are defined as those whose, at the parent company level, annualized value of subscription revenue as of the end of the period and the
annualized value of professional services revenue in the last quarter of the period is at least $10m; the Q2’16 customer count is adjusted to include Zinc customers
3
© Copyright 2017 Veeva Systems Inc., all rights reserved108
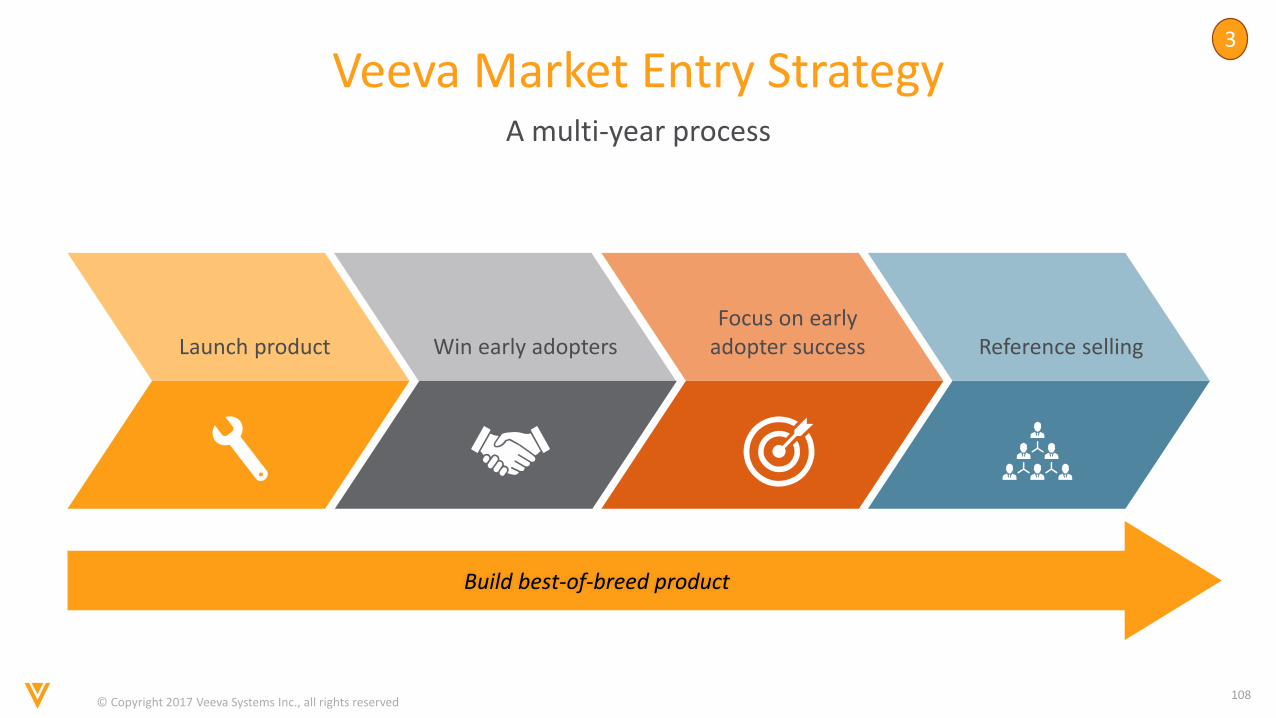
Veeva Market Entry Strategy
Launch product Win early adoptersFocus on early
adopter success Reference selling
A multi-year process
Build best-of-breed product
3
© Copyright 2017 Veeva Systems Inc., all rights reserved109
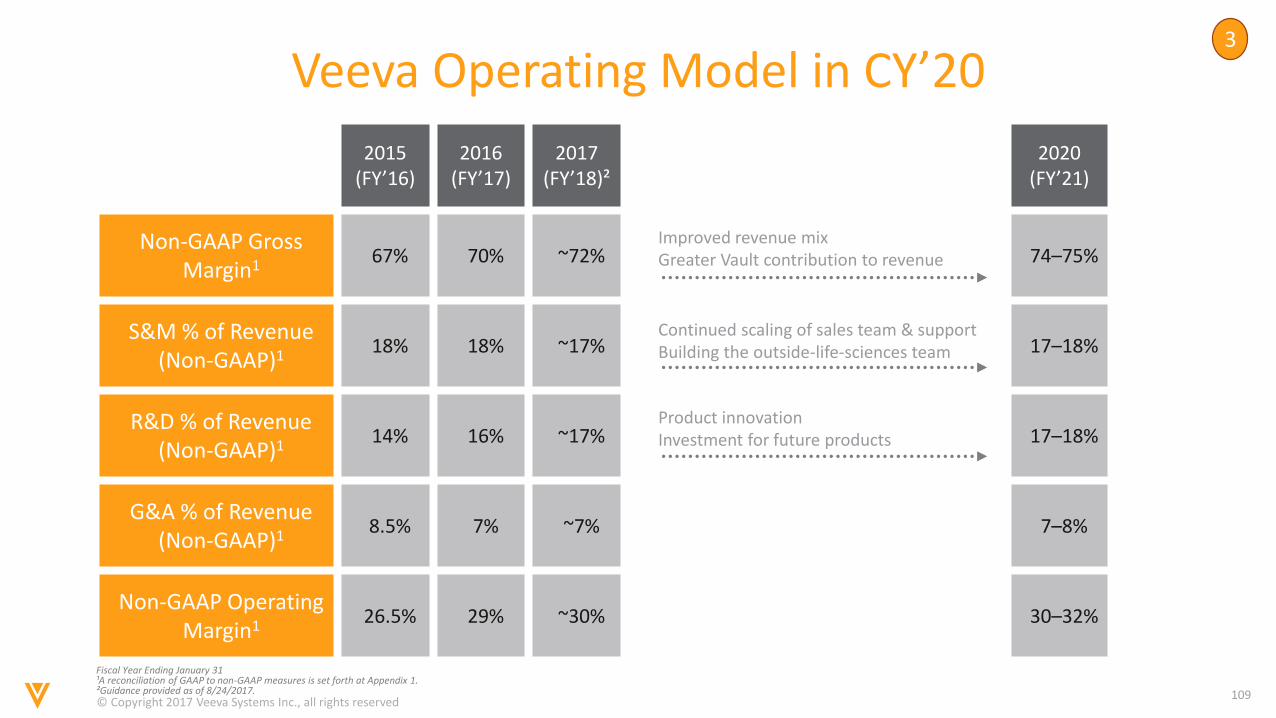
Veeva Operating Model in CY’20
Non2015
(FY’16)2016
(FY’17)2017
(FY’18)²
Non-GAAP Gross Margin1 67% 70% ~72%
S&M % of Revenue (Non-GAAP)1 18% 18% ~17%
R&D % of Revenue (Non-GAAP)1 14% 16% ~17%
G&A % of Revenue (Non-GAAP)1 8.5% 7% ~7%
Non-GAAP Operating Margin1 26.5% 29% ~30%
Continued scaling of sales team & supportBuilding the outside-life-sciences team
Improved revenue mixGreater Vault contribution to revenue
2020 (FY’21)
74–75%
17–18%
17–18%
7–8%
30–32%
Fiscal Year Ending January 31¹A reconciliation of GAAP to non-GAAP measures is set forth at Appendix 1.²Guidance provided as of 8/24/2017.
Product innovationInvestment for future products
3

© Copyright 2017 Veeva Systems Inc., all rights reserved110
On a Path to Multi-Billion Dollar Cloud Leader
• Track Record of Technology Innovation and Product Excellence
• Powerful and Unique Cloud Platform
• Long-term Leadership in Strategic Markets
• Business Model Advantage – The Veeva Way

Questions
Appendix 1
© Copyright 2017 Veeva Systems Inc., all rights reserved113
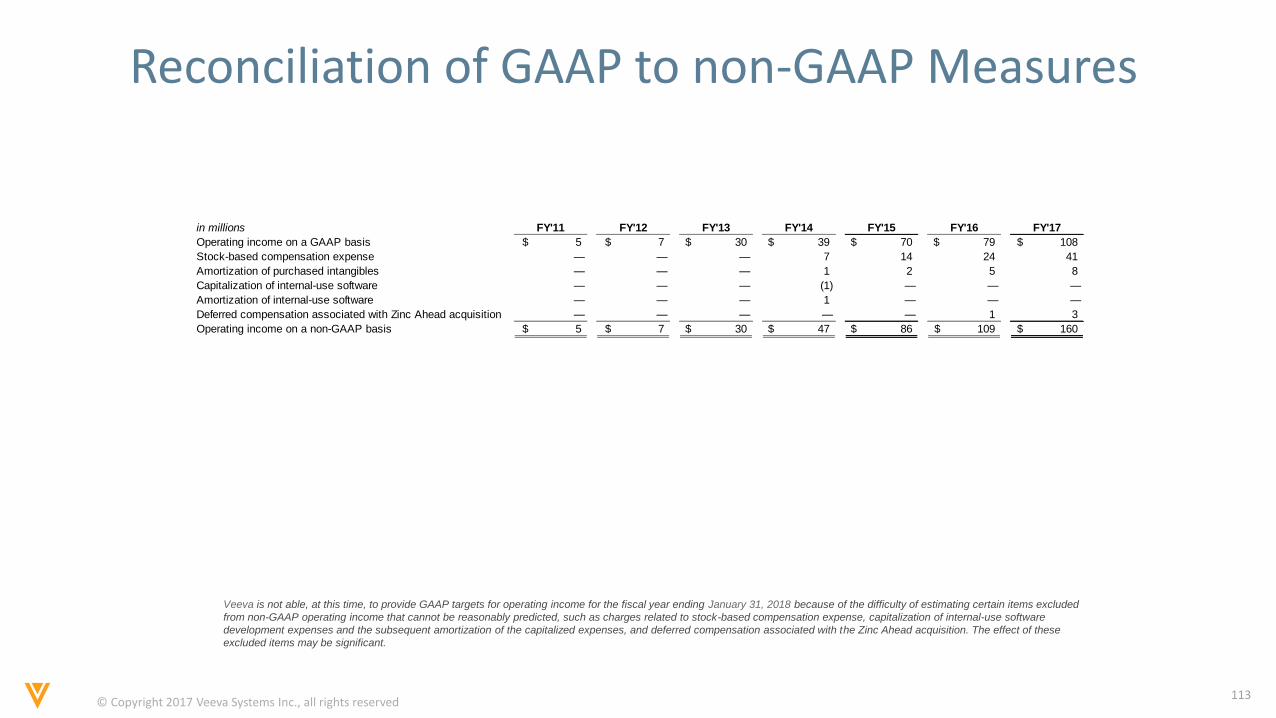
Reconciliation of GAAP to non-GAAP Measures
Veeva is not able, at this time, to provide GAAP targets for operating income for the fiscal year ending January 31, 2018 because of the difficulty of estimating certain items excluded
from non-GAAP operating income that cannot be reasonably predicted, such as charges related to stock-based compensation expense, capitalization of internal-use software
development expenses and the subsequent amortization of the capitalized expenses, and deferred compensation associated with the Zinc Ahead acquisition. The effect of these
excluded items may be significant.
in millions FY'11 FY'12 FY'13 FY'14 FY'15 FY'16 FY'17
Operating income on a GAAP basis 5$ 7$ 30$ 39$ 70$ 79$ 108$
Stock-based compensation expense — — — 7 14 24 41
Amortization of purchased intangibles — — — 1 2 5 8
Capitalization of internal-use software — — — (1) — — —
Amortization of internal-use software — — — 1 — — —
Deferred compensation associated with Zinc Ahead acquisition — — — — — 1 3
Operating income on a non-GAAP basis 5$ 7$ 30$ 47$ 86$ 109$ 160$
© Copyright 2017 Veeva Systems Inc., all rights reserved114
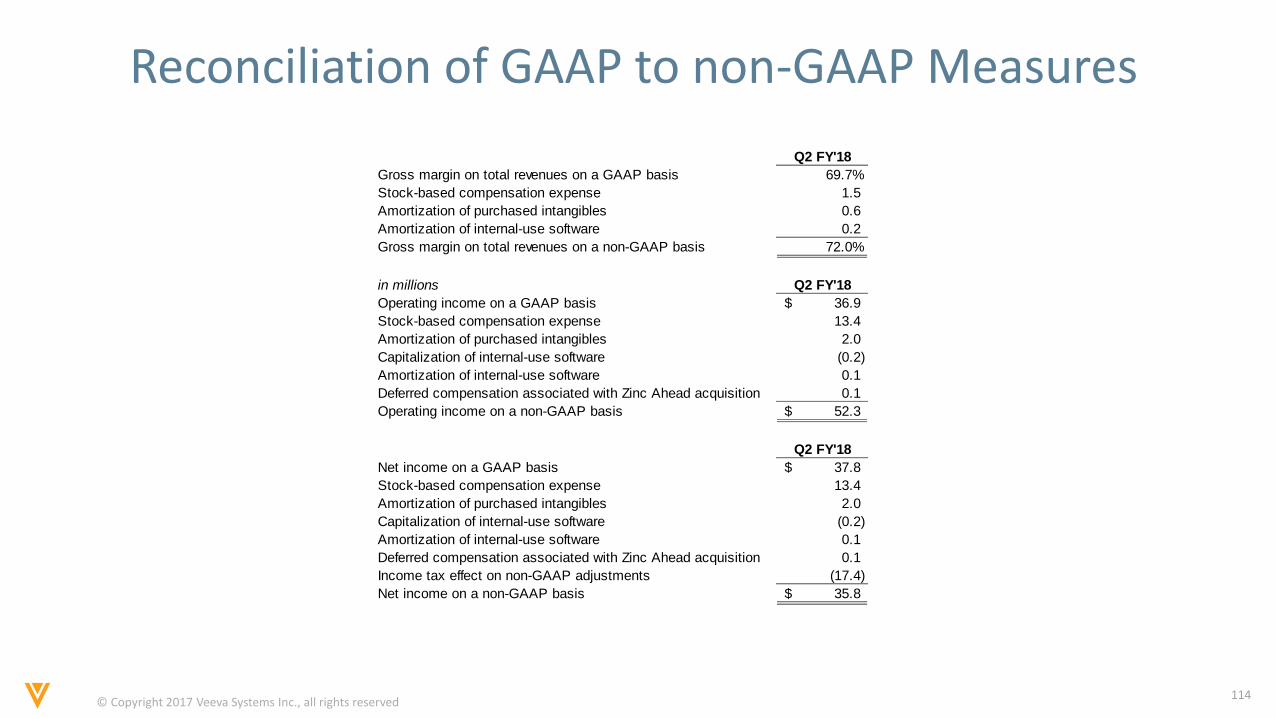
Reconciliation of GAAP to non-GAAP Measures
Q2 FY'18
Gross margin on total revenues on a GAAP basis 69.7%
Stock-based compensation expense 1.5
Amortization of purchased intangibles 0.6
Amortization of internal-use software 0.2
Gross margin on total revenues on a non-GAAP basis 72.0%
in millions Q2 FY'18
Operating income on a GAAP basis 36.9$
Stock-based compensation expense 13.4
Amortization of purchased intangibles 2.0
Capitalization of internal-use software (0.2)
Amortization of internal-use software 0.1
Deferred compensation associated with Zinc Ahead acquisition 0.1
Operating income on a non-GAAP basis 52.3$
Q2 FY'18
Net income on a GAAP basis 37.8$
Stock-based compensation expense 13.4
Amortization of purchased intangibles 2.0
Capitalization of internal-use software (0.2)
Amortization of internal-use software 0.1
Deferred compensation associated with Zinc Ahead acquisition 0.1
Income tax effect on non-GAAP adjustments (17.4)
Net income on a non-GAAP basis 35.8$
© Copyright 2017 Veeva Systems Inc., all rights reserved115
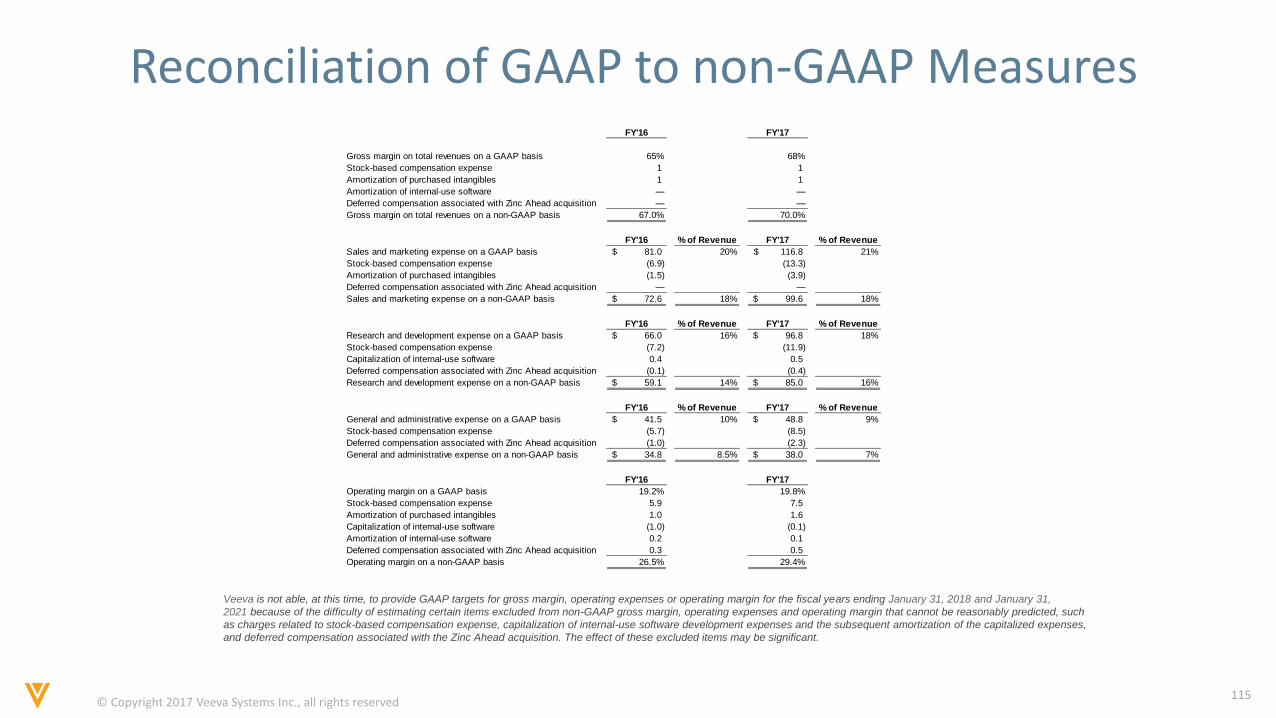
Reconciliation of GAAP to non-GAAP Measures
Veeva is not able, at this time, to provide GAAP targets for gross margin, operating expenses or operating margin for the fiscal years ending January 31, 2018 and January 31,
2021 because of the difficulty of estimating certain items excluded from non-GAAP gross margin, operating expenses and operating margin that cannot be reasonably predicted, such
as charges related to stock-based compensation expense, capitalization of internal-use software development expenses and the subsequent amortization of the capitalized expenses,
and deferred compensation associated with the Zinc Ahead acquisition. The effect of these excluded items may be significant.
FY'16 FY'17
Gross margin on total revenues on a GAAP basis 65% 68%
Stock-based compensation expense 1 1
Amortization of purchased intangibles 1 1
Amortization of internal-use software — —
Deferred compensation associated with Zinc Ahead acquisition — —
Gross margin on total revenues on a non-GAAP basis 67.0% 70.0%
FY'16 % of Revenue FY'17 % of Revenue
Sales and marketing expense on a GAAP basis 81.0$ 20% 116.8$ 21%
Stock-based compensation expense (6.9) (13.3)
Amortization of purchased intangibles (1.5) (3.9)
Deferred compensation associated with Zinc Ahead acquisition — —
Sales and marketing expense on a non-GAAP basis 72.6$ 18% 99.6$ 18%
FY'16 % of Revenue FY'17 % of Revenue
Research and development expense on a GAAP basis 66.0$ 16% 96.8$ 18%
Stock-based compensation expense (7.2) (11.9)
Capitalization of internal-use software 0.4 0.5
Deferred compensation associated with Zinc Ahead acquisition (0.1) (0.4)
Research and development expense on a non-GAAP basis 59.1$ 14% 85.0$ 16%
FY'16 % of Revenue FY'17 % of Revenue
General and administrative expense on a GAAP basis 41.5$ 10% 48.8$ 9%
Stock-based compensation expense (5.7) (8.5)
Deferred compensation associated with Zinc Ahead acquisition (1.0) (2.3)
General and administrative expense on a non-GAAP basis 34.8$ 8.5% 38.0$ 7%
FY'16 FY'17
Operating margin on a GAAP basis 19.2% 19.8%
Stock-based compensation expense 5.9 7.5
Amortization of purchased intangibles 1.0 1.6
Capitalization of internal-use software (1.0) (0.1)
Amortization of internal-use software 0.2 0.1
Deferred compensation associated with Zinc Ahead acquisition 0.3 0.5
Operating margin on a non-GAAP basis 26.5% 29.4%